Embed Size (px)
Citation preview

© Transamerica Institute, 2015TCRS 1270-0515
Retirement Throughout the Ages:
Expectations and Preparations of American Workers16th Annual Transamerica Retirement Survey of Workers
May 2015
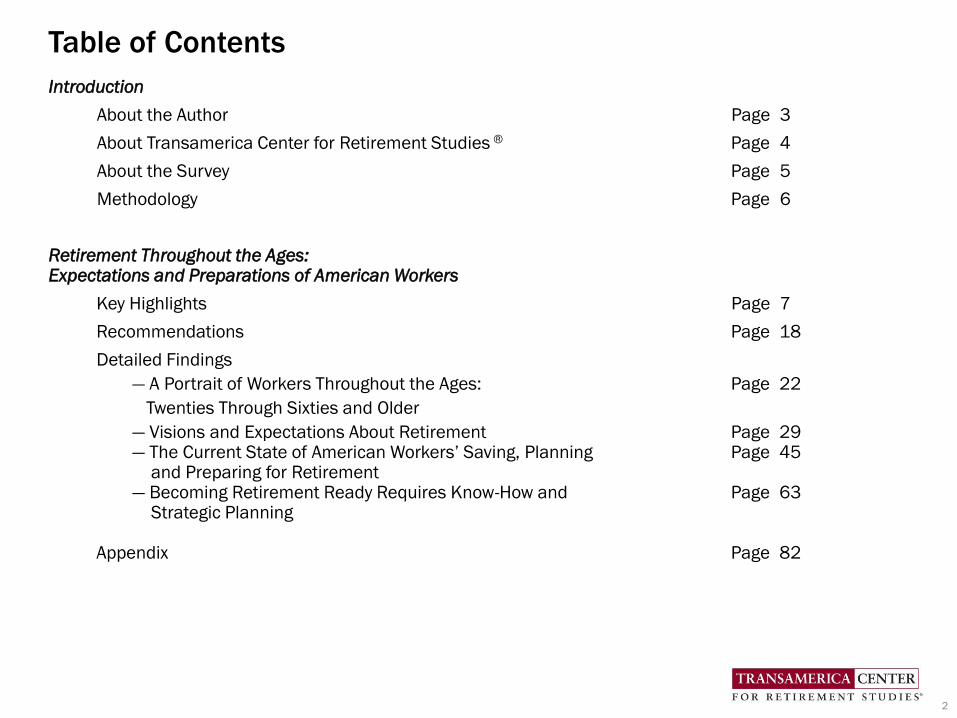
Table of Contents
Introduction
About the Author Page 3
About Transamerica Center for Retirement Studies ® Page 4
About the Survey Page 5
Methodology Page 6
Retirement Throughout the Ages:Expectations and Preparations of American Workers
Key Highlights Page 7
Recommendations Page 18
Detailed Findings
― A Portrait of Workers Throughout the Ages: Page 22
Twenties Through Sixties and Older
― Visions and Expectations About Retirement Page 29― The Current State of American Workers’ Saving, Planning Page 45
and Preparing for Retirement― Becoming Retirement Ready Requires Know-How and Page 63
Strategic Planning
Appendix Page 82
2

About the Author
Catherine Collinson serves as President of the Transamerica Institute® and Transamerica Center for
Retirement Studies®, and is a retirement and market trends expert and champion for Americans who are at
risk of not achieving a financially secure retirement. Catherine oversees all research, publications and
outreach initiatives, including the Annual Transamerica Retirement Survey.
With almost two decades of retirement services experience, Catherine has become a nationally recognized
voice on retirement trends for the industry. She has testified before Congress on matters related to
employer-sponsored retirement plans among small business, which featured the need to raise awareness of
the Saver’s Credit among those who would benefit most from the important tax credit.
Catherine is regularly cited by top media outlets on retirement-related topics. Her expert commentary has
appeared in major publications, including: USA Today, Time, Next Avenue, Forbes, U.S. News & World Report,
and CBS Moneywatch. She co-hosts the ClearPath: Your Roadmap to Health & Wealth radio show on
Baltimore’s WYPR, an NPR news station. Catherine speaks at major industry conferences each year and
also authors articles published in leading industry journals.
She is currently employed by Transamerica Retirement Solutions Corporation. Since joining the organization
in 1995, she has held a number of positions with responsibilities including in the incorporation of
Transamerica Center for Retirement Studies as a nonprofit private foundation in 2007 and its expansion
into Transamerica Institute in 2013.
3

About Transamerica Center for Retirement Studies®
• The Transamerica Center for Retirement Studies® (TCRS) is a division of Transamerica Institute® (The
Institute), a nonprofit, private foundation. TCRS is dedicated to educating the public on emerging trends
surrounding retirement security in the United States. Its research emphasizes employer-sponsored
retirement plans, including companies and their employees, unemployed and underemployed workers,
retirees and the implications of legislative and regulatory changes. For more information about TCRS,
please refer to www.transamericacenter.org.
• The Institute is funded by contributions from Transamerica Life Insurance Company and its affiliates and
may receive funds from unaffiliated third parties.
• TCRS and its representatives cannot give ERISA, tax, investment or legal advice. This material is
provided for informational purposes only and should not be construed as ERISA, tax, investment or legal
advice. Interested parties must consult and rely solely upon their own independent advisors regarding
their particular situation and the concepts presented here.
• Although care has been taken in preparing this material and presenting it accurately, TCRS disclaims
any express or implied warranty as to the accuracy of any material contained herein and any liability with
respect to it.
4

About the Survey
• Since 1998, the Transamerica Center for Retirement Studies® has conducted a national survey of U.S.
business employers and workers regarding their attitudes toward retirement. The overall goals for the
study are to illuminate emerging trends, promote awareness, and help educate the public. It has grown
to be one of the longest running and largest national surveys of its kind.
• On behalf of Transamerica Center for Retirement Studies, Harris Poll conducted the 16th Annual
Retirement Survey. The analysis contained in this report was prepared internally by the research team at
Transamerica Center for Retirement Studies.
• Over the last five decades, Harris Polls have become media staples. With comprehensive experience
and precise technique in public opinion polling, along with a proven track record of uncovering
consumers’ motivations and behaviors, The Harris Poll has gained strong brand recognition around the
world. For more information contact: [email protected].
5

Methodology: Worker Survey
• A 25-minute, online survey was conducted between February 18 – March 17, 2015 among a nationally
representative sample of 4,550 workers by Harris Poll for Transamerica Center for Retirement Studies.
Respondents met the following criteria:
• U.S. residents, age 18 or older.
• Full-time or part-time workers in a for-profit company employing 10 or more people.
• Data were weighted as follows:
• To account for differences between the population available via the Internet versus by telephone.
• To ensure that each quota group had a representative sample based on the number of
employees at companies in each employee size range.
• Percentages are rounded to the nearest whole percent. Differences in the sums of combined
categories/answers are due to rounding.
• This report focuses on full-time and part-time workers combined.
• The base includes:
• 579 workers in their Twenties
• 853 workers in their Thirties
• 895 workers in their Forties
• 1,243 workers in their Fifties
• 948 workers age Sixty and older
• 32 workers ages 18 and 19
• NOTE: This report was update in June 2016 with additional survey findings.
6

Key Highlights
The 16th Annual Transamerica Retirement Survey finds American workers are continuing to recover from the Great Recession
and its aftereffects. While the economy is recovering, the U.S. retirement landscape is also continuing to evolve, with
increases in life expectancies, the need for Social Security reform, and an even greater need for individuals and families to
plan and save for their future financial security. Most workers are rising to the challenge by saving but are they saving
enough? Are they properly planning?
Workers of all ages face opportunities and challenges for improving their retirement outlook. As we progress through our
working lives, our circumstances change over time with age. While workers in their Twenties are embarking on their careers
with decades to plan and save, retirement for workers in their Fifties and Sixties is much closer on the horizon, with many
needing to shore up the size of their nest eggs.
This survey report examines the retirement outlook of workers in their Twenties, Thirties, Forties, Fifties, and Sixties and older
to compare and contrast their retirement preparations and shed light on how they can navigate the future and improve their
retirement outlook.
A Portrait of Workers of All Ages
Who wants to be a millionaire? Workers of all ages estimate that they will need to save $1,000,000 (median) in order to feel
financially comfortable in retirement and many have based their estimate on guesswork. They share retirement dreams of
travel, time with family and friends, and pursuing hobbies – and fears of outliving their savings and investments. About half
plan to continue working, at least part-time, in retirement. One in five say that paying off credit card or consumer debt is their
greatest financial priority. While workers of all ages share much in common, the survey also found striking differences based
on age and life stage.
Twentysomethings: Committed, Concerned, and Cautious
Twentysomething workers are concerned that Social Security will not be there for them when they retire. Some are expecting
that they will need to financially support their aging parents; others are facing student debt and/or credit card debt. Although
they are embarking on their careers and juggling financial priorities, twentysomethings are committed to saving for retirement
-- 67 percent are already saving and started at age 22 (median). With such an early start, they can grow their nest eggs over
time. However, our survey also found that a concerning 37 percent know nothing about asset allocation principles and that
some may be investing too conservatively given their long time horizon in low-risk, low-return investments.
7
Key Highlights
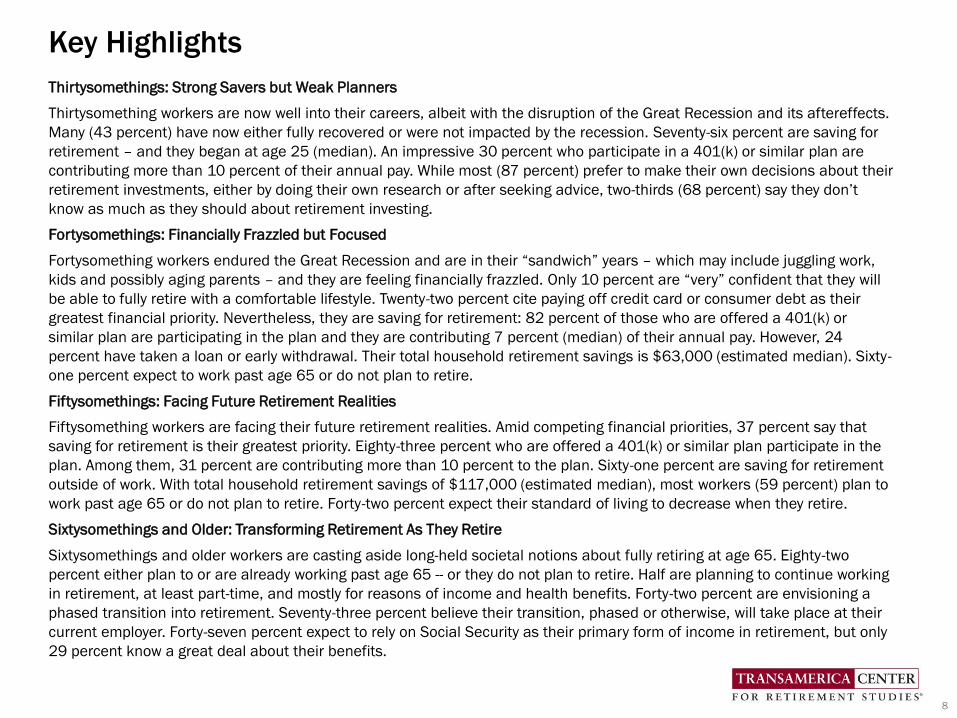
Thirtysomethings: Strong Savers but Weak Planners
Thirtysomething workers are now well into their careers, albeit with the disruption of the Great Recession and its aftereffects.
Many (43 percent) have now either fully recovered or were not impacted by the recession. Seventy-six percent are saving for
retirement – and they began at age 25 (median). An impressive 30 percent who participate in a 401(k) or similar plan are
contributing more than 10 percent of their annual pay. While most (87 percent) prefer to make their own decisions about their
retirement investments, either by doing their own research or after seeking advice, two-thirds (68 percent) say they don’t
know as much as they should about retirement investing.
Fortysomethings: Financially Frazzled but Focused
Fortysomething workers endured the Great Recession and are in their “sandwich” years – which may include juggling work,
kids and possibly aging parents – and they are feeling financially frazzled. Only 10 percent are “very” confident that they will
be able to fully retire with a comfortable lifestyle. Twenty-two percent cite paying off credit card or consumer debt as their
greatest financial priority. Nevertheless, they are saving for retirement: 82 percent of those who are offered a 401(k) or
similar plan are participating in the plan and they are contributing 7 percent (median) of their annual pay. However, 24
percent have taken a loan or early withdrawal. Their total household retirement savings is $63,000 (estimated median). Sixty-
one percent expect to work past age 65 or do not plan to retire.
Fiftysomethings: Facing Future Retirement Realities
Fiftysomething workers are facing their future retirement realities. Amid competing financial priorities, 37 percent say that
saving for retirement is their greatest priority. Eighty-three percent who are offered a 401(k) or similar plan participate in the
plan. Among them, 31 percent are contributing more than 10 percent to the plan. Sixty-one percent are saving for retirement
outside of work. With total household retirement savings of $117,000 (estimated median), most workers (59 percent) plan to
work past age 65 or do not plan to retire. Forty-two percent expect their standard of living to decrease when they retire.
Sixtysomethings and Older: Transforming Retirement As They Retire
Sixtysomethings and older workers are casting aside long-held societal notions about fully retiring at age 65. Eighty-two
percent either plan to or are already working past age 65 -- or they do not plan to retire. Half are planning to continue working
in retirement, at least part-time, and mostly for reasons of income and health benefits. Forty-two percent are envisioning a
phased transition into retirement. Seventy-three percent believe their transition, phased or otherwise, will take place at their
current employer. Forty-seven percent expect to rely on Social Security as their primary form of income in retirement, but only
29 percent know a great deal about their benefits.
8
Key Highlights
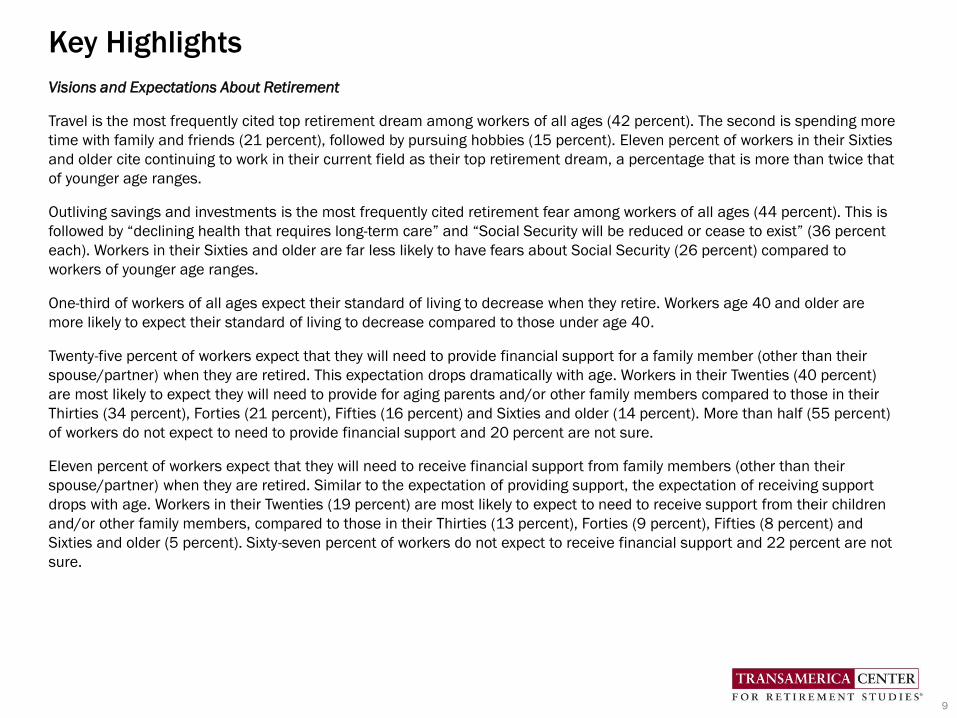
Visions and Expectations About Retirement
Travel is the most frequently cited top retirement dream among workers of all ages (42 percent). The second is spending more
time with family and friends (21 percent), followed by pursuing hobbies (15 percent). Eleven percent of workers in their Sixties
and older cite continuing to work in their current field as their top retirement dream, a percentage that is more than twice that
of younger age ranges.
Outliving savings and investments is the most frequently cited retirement fear among workers of all ages (44 percent). This is
followed by “declining health that requires long-term care” and “Social Security will be reduced or cease to exist” (36 percent
each). Workers in their Sixties and older are far less likely to have fears about Social Security (26 percent) compared to
workers of younger age ranges.
One-third of workers of all ages expect their standard of living to decrease when they retire. Workers age 40 and older are
more likely to expect their standard of living to decrease compared to those under age 40.
Twenty-five percent of workers expect that they will need to provide financial support for a family member (other than their
spouse/partner) when they are retired. This expectation drops dramatically with age. Workers in their Twenties (40 percent)
are most likely to expect they will need to provide for aging parents and/or other family members compared to those in their
Thirties (34 percent), Forties (21 percent), Fifties (16 percent) and Sixties and older (14 percent). More than half (55 percent)
of workers do not expect to need to provide financial support and 20 percent are not sure.
Eleven percent of workers expect that they will need to receive financial support from family members (other than their
spouse/partner) when they are retired. Similar to the expectation of providing support, the expectation of receiving support
drops with age. Workers in their Twenties (19 percent) are most likely to expect to need to receive support from their children
and/or other family members, compared to those in their Thirties (13 percent), Forties (9 percent), Fifties (8 percent) and
Sixties and older (5 percent). Sixty-seven percent of workers do not expect to receive financial support and 22 percent are not
sure.
9
Key Highlights
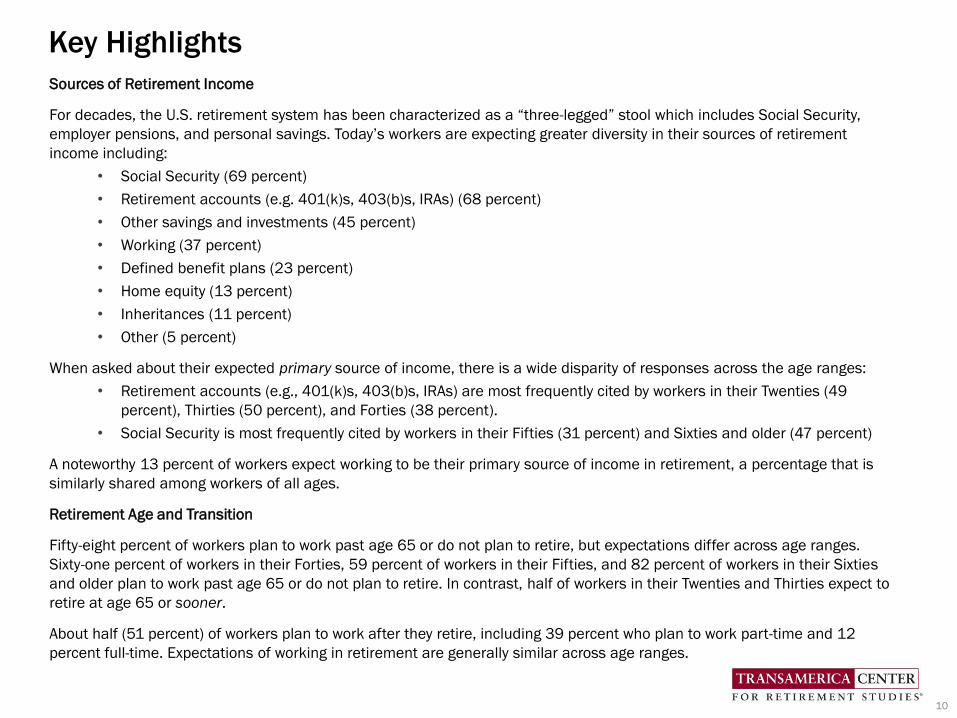
Sources of Retirement Income
For decades, the U.S. retirement system has been characterized as a “three-legged” stool which includes Social Security,
employer pensions, and personal savings. Today’s workers are expecting greater diversity in their sources of retirement
income including:
• Social Security (69 percent)
• Retirement accounts (e.g. 401(k)s, 403(b)s, IRAs) (68 percent)
• Other savings and investments (45 percent)
• Working (37 percent)
• Defined benefit plans (23 percent)
• Home equity (13 percent)
• Inheritances (11 percent)
• Other (5 percent)
When asked about their expected primary source of income, there is a wide disparity of responses across the age ranges:
• Retirement accounts (e.g., 401(k)s, 403(b)s, IRAs) are most frequently cited by workers in their Twenties (49
percent), Thirties (50 percent), and Forties (38 percent).
• Social Security is most frequently cited by workers in their Fifties (31 percent) and Sixties and older (47 percent)
A noteworthy 13 percent of workers expect working to be their primary source of income in retirement, a percentage that is
similarly shared among workers of all ages.
Retirement Age and Transition
Fifty-eight percent of workers plan to work past age 65 or do not plan to retire, but expectations differ across age ranges.
Sixty-one percent of workers in their Forties, 59 percent of workers in their Fifties, and 82 percent of workers in their Sixties
and older plan to work past age 65 or do not plan to retire. In contrast, half of workers in their Twenties and Thirties expect to
retire at age 65 or sooner.
About half (51 percent) of workers plan to work after they retire, including 39 percent who plan to work part-time and 12
percent full-time. Expectations of working in retirement are generally similar across age ranges.
10

Key Highlights
Sixty-one percent of workers who plan to work in retirement and/or past age 65 cite reasons related to income and health
benefits as their main reasons for planning to do so. Workers in their Thirties (62 percent), Forties (66 percent), and Fifties
(65 percent) are similarly likely to cite income and benefits-related reasons for working in retirement. Interestingly, workers in
their Twenties (42 percent) and Sixties and older (40 percent) more often cite enjoyment-related reasons.
The long-held view that retirement is a moment in time when a person reaches a certain age, immediately stops working, fully
retires, and begins pursuing their retirement dreams is no longer, with just 14 percent of today’s workers expecting this
scenario. One in five workers (20 percent) expects to continue working as long as possible in their current or similar position
until they cannot work any more, an expectation that is shared across the age ranges. Forty-one percent of workers envision
transitioning into retirement by reducing hours with more leisure time to enjoy life or by working in a different capacity that is
less demanding or brings greater personal satisfaction, a vision that is also shared across age ranges.
Among workers in their Forties (40 percent), Fifties (54 percent) and Sixties and older (73 percent), many think that they will
stay with their current employer while transitioning into retirement. Fewer think they will change employers as they transition
into retirement, with workers in their Forties (17 percent) and Fifties (16 percent) sharing this expectation. With regard to
starting their own business, only 11 percent of workers in their Forties expect to do so, a response that declines to 8 percent
among workers in their Fifties and to only 2 percent of workers in their Sixties and older.
Workers’ vision of transitioning into retirement may be easier said than done given current employment practices. Relatively
few workers say that their employer offers opportunities to shift from full-time to part-time or work in a different capacity that
is less demanding or more satisfying.
The Current State of American Workers’ Saving, Planning, and Preparing for Retirement
Retirement Confidence and Recovery from the Great Recession
Fifty-nine percent of workers are confident that they will be able to fully retire with a lifestyle they consider comfortable –
mirroring the pre-Great Recession level of confidence that TCRS’ survey found in 2007. In looking at retirement confidence by
age range in 2015, workers in their Twenties (64 percent) and Sixties and older (66 percent) have the highest levels of
confidence. In contrast, workers in their Forties (52 percent) have the lowest level of confidence, with just 10 percent of them
being “very” confident.
11

Key Highlights
Most workers (77 percent) say that they are financially recovering or were not affected by the Great Recession, including 16
percent who have fully recovered, 40 percent who have somewhat recovered, and 21 percent who were not impacted.
However, 15 percent say they have not yet begun to recover, and eight percent feel they may never recover. Thirtysomething
workers (82 percent) are most likely to have either fully recovered, somewhat recovered or were not impacted. Workers in
their Forties and Fifties (18 and 16 percent, respectively) are most likely to have not yet begun to recover. Workers in their
Sixties and older (14 percent) are most likely to say they will never recover.
Workers’ Retirement Planning, Saving, and Investing Behaviors
Financial priorities can vary by age range, while also sharing commonalities. Saving for retirement is the most frequently cited
top financial priority among workers in their Thirties (22 percent), Forties (26 percent), Fifties (37 percent) and Sixties and
older (36 percent) – which is relatively low for older workers given their years to retirement. Younger workers in their Twenties
(24 percent), Thirties (21 percent), and Forties (23 percent) are nearly as likely to say that “just getting by – covering basic
living expenses” is their top priority. An alarming 20 percent of workers say that paying off credit card or consumer debt is
their top priority, a response that is similar across age ranges. Not surprisingly, 13 percent of twentysomething workers say
that paying off student loans is their top financial priority right now.
Despite competing financial priorities, 76 percent of workers are saving for retirement. Sixty-seven percent of
twentysomething workers are saving – and they started saving at age 22 (median). Most workers in their Thirties (76 percent),
Forties (76 percent), Fifties (80 percent), and Sixties and older (81 percent) are saving for retirement; however, they started
saving at different ages. For example, thirtysomething workers started at 25 years old (median) compared to those in their
Forties and Fifties who started at 30 and 31 years old, respectively. Workers in their Sixties and older started the latest, at
age 35 (median).
The Role of Employer Benefits
Employers take note: Workers of all ages highly value retirement benefits. Fully 89 percent of workers value a 401(k) or
similar plan as an important benefit. Seventy-seven percent say that retirement benefits offered by a prospective employer
will be a major factor in their decision whether to accept a job offer. Half say they would be likely to switch employers for a
nearly identical job with a similar employer that offered better retirement benefits. Flight risk is greatest among the 65
percent of workers in their Twenties, 59 percent in their Thirties, and 54 percent in their Forties who share this sentiment.
Workers in their Fifties (43 percent) and Sixties and older (28 percent) are less likely to switch employers for better benefits.
12

Key Highlights
Sixty-six percent of workers have access to a 401(k) or similar employee-funded retirement plan in the workplace. Workers in
their Fifties (72 percent) are most likely to have access to a plan; those in their Sixties and older (62 percent) are least likely.
However, access varies greatly among full-time and part-time workers. Full-time workers (73 percent) are far more likely to be
offered a 401(k) or similar employee-funded plan compared to part-time workers (38 percent).
Four out of five workers (80 percent) who are offered a 401(k) or similar plan participate in that plan. Participation rates are
highest among workers in their Forties (82 percent) and Fifties (83 percent) and lowest among those in their Twenties (72
percent). Participants are contributing 8 percent (median) of their annual salaries into their plans. Contribution rates are
highest among workers in their Sixties and older at 10 percent (median) and lowest among those in their Twenties (7 percent)
and Forties (7 percent).
While most workers participating in a 401(k) or similar plan are contributing 10 percent of their salaries or less, some are
saving more than 10 percent. These “super savers” include 28 percent of plan participants in their Twenties, 30 percent in
their Thirties, 23 percent in their Forties, 31 percent in their Fifties, and 33 percent in their Sixties and older.
Seventy-three percent of workers who are offered a 401(k) or similar plan are aware of the Roth 401(k) option which enables
savers to pay income taxes now and take withdrawals at retirement age tax-free. Among those who are aware, 43 percent say
they are offered it by their employer and 25 percent are contributing to it. Twentysomethings (42 percent) and
thirtysomethings (38 percent) are more likely to contribute to a Roth 401(k) option compared to older age ranges.
Half of plan participants (51 percent) are using some form of professionally managed account in their 401(k) or similar plan.
“Professionally managed” accounts refers to managed account services, strategic allocation funds, and/or target date funds.
Plan participants in their Thirties (57 percent) are mostly likely to use a professionally managed account and the majority of
workers in their Twenties (53 percent) do so as well.
“Leakage” from retirement plans in the form of loans and withdrawals can severely inhibit the growth of participants’ long-
term retirement savings. Among participants who are currently participating in a plan, 23 percent have taken some form of
loan and/or early withdrawal from a 401(k) or similar plan or IRA.
The majority of workers (58 percent) are saving for retirement outside of work. Workers in their Sixties and older (69 percent)
are most likely to be doing so. Workers in their Twenties and Forties (53 percent for both) are least likely to be doing so.
13

Key Highlights
Estimated Needs Versus Actual Savings
Workers of all ages estimate that they will need to save $1,000,000 (median) to feel financially secure when they retire. Thirty
percent of all workers believe that they will need to save $2,000,000 or more, with workers in their Thirties (35 percent) most
likely to say this and those in their Sixties and older (25 percent) least likely.
More than half (53 percent) of workers say they “guessed” their retirement savings needs, while 20 percent estimated this
goal based on their current living expenses. Just 10 percent used a retirement calculator or completed a worksheet, which is
similar across age ranges.
The total household savings in retirement accounts is $63,000 (estimated median) among workers of all ages. Total
retirement savings steadily increases by age range: Workers in their Twenties have saved $16,000 (estimated median) while
those in their Thirties have saved $45,000, Forties have saved $63,000, Fifties have saved $117,000. Workers in their
Sixties and older have saved $172,000 (estimated median) and, notably, 39 percent of them have saved $250,000 or more.
Just 49 percent of workers agree that they are currently building a large enough retirement nest egg, including 15 percent
who “strongly” agree and 34 percent who “somewhat” agree.
Becoming Retirement Ready Requires Know-How and Strategic Planning
Knowledge Is Currently Lacking
One of the most important ways workers of all ages can begin to improve their retirement outlook is by learning more about
saving and investing for retirement. Two out of three workers (67 percent) agree that they don’t know as much as they should
about retirement investing.
Workers’ lack of knowledge is perhaps best illustrated by a general lack of understanding about asset allocation principles
which are fundamental to retirement investing. Forty-four percent have “some” understanding about asset allocation
principals, yet only eight percent have a “great deal” and 18 percent have “quite a bit.” An alarming 30 percent have no
knowledge. Response rates vary somewhat by age ranges, with twentysomethings having the least knowledge.
14

Key Highlights
Workers of all ages most frequently say their retirement savings are currently invested in a relatively equal mix of stocks and
investments such as bonds, money market funds, and cash (42 percent). Fiftysomethings (48 percent) are most likely to be
invested in this way and those in their Twenties (28 percent) are least likely. Counter to conventional wisdom and asset
allocation principles, twentysomethings (24 percent) are more likely than other age ranges to be invested mostly invested in
bonds, money market funds, cash and other stable investments. One in five workers of all ages (20 percent) say they are “not
sure” how their retirement savings is invested, with twentysomethings most likely to say this (27 percent).
Among workers who are married or in a civil union, 57 percent say their spouse or partner is saving in a retirement plan.
Among them, 66 percent are familiar with their spouse’s or partner’s savings, with 37 percent being “very” familiar. Level of
familiarity increases with age. Workers who are Sixty and older are most likely to be familiar with their spouse’s or partner’s
savings (74 percent), with 46 percent being “very” familiar.
Understanding of Government Benefits Should Be Improved
Most workers are expecting Social Security as a source of income in retirement, yet relatively few have a strong knowledge of
their benefits. Case in point: 89 percent of workers in their Sixties and older are expecting Social Security to be a source of
income in retirement, yet only 29 percent say they know a “a great deal” about Social Security and 38 percent know “quite a
bit.” It is imperative that pre-retirees gain a strong knowledge and understanding of the optimal age at which to claim Social
Security, as well as how to file for and start receiving benefits in order to maximize the value of their lifetime benefits.
Most workers will rely on Medicare for their health care insurance when they are 65 and older. Slightly more than half (52
percent) of workers in their Sixties and Older know either “a great deal” (22 percent) or “quite a bit” (30 percent) about their
benefits. The level of understanding is even lower among workers in their Forties and Fifties.
Lack of Awareness Could Lead to Missed Opportunities
The Saver’s Credit and Catch-Up Contributions are two savings incentives that workers may be missing out on. The Saver’s
Credit is tax credit for low- to moderate-income workers who save for retirement in a qualified retirement plan or IRA. Catch-Up
Contributions allow workers age 50 and older to contribute to a qualified plan an additional amount over and above the plan-
or IRA-contribution limit. Only 30 percent of all workers are aware of the Saver’s Credit. Only 65 percent of workers in their
Fifties and 68 percent in those in their Sixties and older are aware of Catch-Up Contributions.
15

Key Highlights
Financial Advisor Usage
Thirty-five percent of workers use a professional financial advisor to help manage their retirement savings and investments.
Workers in their Forties (29 percent) are least likely to use an advisor, while those in their Sixties and older (48 percent) are
most likely. Workers in their Twenties (32 percent), Thirties (34 percent), and Fifties (36 percent) are similarly likely to use an
advisor.
Among workers who use a financial advisor, they most often use them to make retirement investment recommendations (73
percent), followed by general financial planning (45 percent), and calculating a retirement savings goal (43 percent). Workers
in their Sixties and older (87 percent) are most likely to use their advisor for retirement investment recommendations, while
twentysomethings (56 percent) are least likely. Thirtysomethings are more likely to use their advisors for general financial
planning (59 percent). Twentysomethings are more likely to use their advisor for calculating a retirement savings goal (56
percent) and tax preparation (43 percent).
Everyone Needs a Retirement Strategy
Retirement planning inherently involves strategic planning, yet 42 percent of American workers do not have a retirement
strategy. It’s difficult if not impossible to reach a destination without a compass or roadmap. As workers approach retirement
age, more have a plan. Workers in their Sixties and older (73 percent) are most likely to have some form of plan compared to
those in their Forties (52 percent). However, the percentage of workers with a written plan is low (14 percent), with workers in
their Forties (9 percent) least likely to have a written plan.
Among workers who have a retirement strategy (written or unwritten), many are overlooking critical components in their
strategies. While most are considering on-going living expenses and government benefits, few are considering factors such as
investment returns, inflation, tax planning, contingency plans – and pursuing their retirement dreams.
A backup plan is an essential component of retirement planning, especially considering that many workers plan to work past
age 65 and to continue working in retirement. However, few have a backup plan if retirement happens unexpectedly due to
unforeseen circumstances such as a job loss, health issues, or family responsibilities. Only 34 percent of workers in their
Sixties and older have a backup and even fewer in their Fifties (23 percent) have one.
16

Key Highlights
Retirement Is a Family Matter
Retirement is a family matter that calls for important conversations, especially to discuss any expectations about the need to
receive or provide financial support. However, just 11 percent of workers “frequently” discuss saving, investing, and planning
for retirement with family and close friends. While 58 percent “occasionally” discuss it, 31 percent “never” discuss it. Of
concern are workers in their Forties (34 percent) and Fifties (32 percent) who never discuss it. Counter-intuitively,
twentysomethings (16 percent) are the most likely of all age ranges to “frequently” discuss it, although they are decades away
from retirement.
In Conclusion
Workers of all ages have similar challenges, dreams, fears, and expectations of retirement. Depending on their age and stage
in life, they also face unique opportunities to improve their long-term financial security. Although it may seem overwhelming
for many, taking one step at a time can lead to significant improvements over the long-term. The following three pages of
these Key Highlights outline such steps for workers, employers, and policymakers.
It’s never too soon or too late to start saving and planning for retirement.
Catherine Collinson
President, Transamerica Institute® and Transamerica Center for Retirement Studies®
17

Key Highlights
Recommendations for Workers
As the retirement landscape continues to evolve, workers of all age ranges will likely face different challenges and
opportunities as their circumstances inevitably change with age. However, the proactive tactics to help prepare for retirement
are fundamentally common to all. Here are seven tips toward achieving retirement readiness:
1. Save for retirement. Start saving as early as possible and save consistently over time. Avoid taking loans and early
withdrawals from retirement accounts.
2. Consider retirement benefits as part of total compensation. Ask an employer for a plan if they don’t offer one.
3. Participate in employer-sponsored retirement plans, if available. Take full advantage of matching employer
contributions, and defer as much as possible.
4. Calculate retirement savings needs, develop a retirement strategy, and write it down. Factor in living expenses,
healthcare needs, government benefits and long-term care. Envision future retirement and have a backup plan in case
retirement comes early due to an unforeseen circumstance. Seek assistance from a professional financial advisor, if
needed.
5. Get educated about retirement investing. Whether relying on the expertise of professional advisors or taking a more do-
it-yourself approach, gain the knowledge to ask questions and make informed decisions. Also learn about Social
Security and government benefits.
6. Take advantage of the Saver’s Credit. Make Catch-up Contributions, if available and you are eligible.
7. Enlist trusted loved ones and start a dialogue about retirement. Have frank conversations with family and close friends
about retirement dreams, fears, and financial matters to help ensure a common understanding.
18

Key Highlights
Recommendations for Employers
Employers can play a crucial role in helping Americans save for retirement. Working with their retirement plan professionals
and providers, employers can help improve their employees’ retirement outlook through these opportunities:
1. Offer a retirement plan along with other health and welfare benefits if not already in place. Take advantage of the tax
credit available for starting a plan.
2. For employers who offer a plan, extend eligibility to part-time workers. Seek expertise of retirement specialists familiar
with plan design on how to best accomplish this.
3. Proactively encourage participation in existing retirement plans. Consider adding automatic enrollment and automatic
escalation features to increase participation rates and salary deferral rates.
4. Discourage loans and withdrawals from retirement accounts. Limit the number of loans available in the plan. Ensure
participants are educated about the ramifications of taking loans and early withdrawals. Allow for an extended loan
repayment time for terminated participants.
5. Consider structuring matching contribution formulas to promote higher salary deferrals (e.g., instead of matching 100
percent of the first three percent of deferrals, change the match to 50 percent of the first six percent of deferrals or
even 25 percent of the first 12 percent of deferrals).
6. Ensure educational offerings are easy-to-understand and meet the needs of employees. Provide education on
calculating a retirement savings goal, principles of saving and investing, and, for those nearing retirement, ways to
generate retirement income and savings to last throughout their lifetimes.
7. Offer pre-retirees greater levels of assistance in planning their transition into retirement – including education about
distribution options, retirement income strategies, and the need for a backup plan if forced into retirement sooner
than expected (e.g. health issues, job loss, family obligations).
8. Create opportunities for workers to phase into retirement by allowing for a transition from full-time to part-time and/or
working in different capacities.
9. Promote incentives to save, including the Saver’s Credit and Catch-Up Contributions.
19

Key Highlights
Recommendations for Policymakers
Workplace retirement benefits play a vital role in helping workers save for retirement. The workplace retirement savings
system has succeeded in serving as the preferred method of saving for retirement for millions of workers. However, more can
and should be done to improve the current system. Recommendations for policymakers include:
1. Preserve existing incentives for workers to save for retirement including tax-deferred savings, existing contribution limits
to qualified retirement plans and IRAs, and the Saver’s Credit.
2. Expand retirement plan coverage for all workers including part-time workers by:
a. Expanding the tax credit for employers to start a plan and facilitating the opportunity for employers to participate in
existing plans by implementing reforms to multiple employer plans.
b. Additional safe harbors for 401(k) and similar plans for purposes of non-discrimination testing.
3. Increase default contribution rates in plans using automatic enrollment. The current minimum default contribution rate
in the safe harbor, which ranges from three percent to six percent, sends a misleading message to plan participants that
saving at those levels is sufficient to ensure a secure retirement. A new auto enrollment safe harbor, under which
employees are enrolled at six percent (increasing to eight percent, then 10 percent), which also provides a tax credit for
adopting it, can drive up plan sponsor adoption rates and participant savings rates.
4. Reduce leakage from retirement accounts by extending the 401(k) loan repayment period for terminated plan
participants and eliminating the six-month suspension period following hardship withdrawals.
5. Illustrate savings as retirement income on retirement plan account statements. Require retirement plan statements to
state participant account balances in terms of lifetime income as well as a lump sum to help educate about savings
needs.
6. Facilitate retirement savings to last a lifetime. Proposals that help participants both manage their investment risk and
ensure their retirement savings will last their lifetime are encouraged, including facilitating the offering of in-plan
annuities and annuities as a distribution option.
7. Expand the Saver’s Credit by making it refundable and/or raising the income eligibility requirements so that more tax
filers are eligible.
20

Retirement Throughout the Ages:
Expectations and Preparations of American Workers
Detailed Findings
21

A Portrait of Workers Throughout the Ages:
Twenties Through Sixties and Older
22

Workers Throughout the Ages: Shared Perspectives
Who wants to be a millionaire? Workers of all ages think that they will need to save $1,000,000 (median) in order
to feel financially comfortable in retirement and many have based their estimate on guesswork. They share
retirement dreams of travel, time with family and friends, and pursuing hobbies – and fears of outliving their
savings and investments. About half plan to continue working, at least part-time, in retirement. One in five say
that paying off credit card or consumer debt is their greatest financial priority. While workers of all ages share
much in common, the survey also found striking differences based on age and life stage.
23
$1 Millionis the amount (median) that workers of all ages
believe they need to save in order to feel financially
comfortable in retirement.
Fears
Nest EggRoughly half of workers
of all ages agree that they are building a large
enough retirement nest egg.
Credit Card
p. 59 p. 60 p. 30 p. 31
p. 48p. 62p. 42p. 40, 35
20 percent of workers say paying off credit card
debt is their top financial priority.
Workers of all ages share similar fears including
outliving savings, declining health that
requires long-term care, and access to health care.
TransitionsWorkers share similar views of how they will
transition into retirement.
Working
DreamsTraveling is the most
frequently cited greatest retirement dream among
workers of all ages.
Guessingis the most frequently cited basis of workers’ estimated retirement
savings needs.
DebtAbout half of workers plan to work after they
retire. Thirty-seven percent say working is an
expected source of retirement income.

Twenties: Committed, Concerned, and Cautious
Today’s workers in their Twenties, who are just embarking on their careers, are committed to saving for retirement.
Sixty-seven percent are already saving, despite competing financial priorities such as paying off student loans and
credit card debt. By having started to save early, at age 22 (median), they can grow their nest eggs over time.
However, a concerning 37 percent know nothing about asset allocation principles, and some may be investing too
conservatively in low-risk, low-return investments given their time horizon. Most are concerned that Social Security
will not be there for them. Some expect that they will need to financially support their aging parents.
24
4 in 581 percent are concerned that when they are ready to retire, Social Security
will not be there for them.
67%are already saving for retirement through an employer-sponsored
retirement plan or outside of work.
22is the median age at
which workers in their Twenties started saving
for retirement.
68%expect their primary source of income in
retirement to come from 401(k)s, 403(b)s, IRAs and
other savings and investments.
13%say that paying off
student loans is their greatest financial priority
right now. Twenty-one percent say credit card
debt.
expect that they will need to financially support their aging
parents when they retire.
> 1/337 percent say their level of understanding about
asset allocation principles is “none.”
24%who are saving for
retirement are invested mostly in bonds, money market funds, cash and
other stable investments.
28%
p. 32 p. 49 p. 49 p. 36
p. 67p. 65p. 37p. 48

Thirties: Strong Savers but Weak Planners
Workers in their Thirties are now well into their careers, albeit with the disruption of the Great Recession. Many
(43 percent) have now either fully recovered or were not impacted by the recession. Seventy-seven percent are
saving for retirement – and they began at age 25 (median). An impressive 30 percent who participate in a 401(k)
or similar plan are contributing more than 10 percent of their annual pay. While most (87 percent) prefer to make
their own decisions about their retirement investments, either by doing their own research or after seeking
advice, two-thirds (68 percent) say they don’t know as much as they should about retirement investing.
25
43%have either fully
recovered (16 percent) or were not impacted(27 percent) by the
Great Recession.
> Half52 percent agree that
they are building a large enough retirement nest
egg.
76%are saving for retirement
through an employer-sponsored plan or outside of work.
25is the median age that
workers in their Thirties started saving for
retirement.
3 in 1030 percent who are
participating in a 401(k) or similar plan are
contributing > 10 percent of their annual pay.
prefer to do their own research (45 percent) or seek advice (42 percent)
but make their own decisions about their
retirement investments.
> 2/368 percent agree that
they don’t know as much as they should about retirement investing.
57%have “guessed” how
much they will need to save in order to feel financially secure in
retirement.
87%
p. 47 p. 62 p. 49 p. 49
p. 60p. 64p. 66p. 54

Forties: Financially Frazzled but Focused
Fortysomething workers endured the Great Recession and are now in their “sandwich” years – which may include juggling
work, kids and possibly aging parents – and they are feeling financially frazzled. Only 10 percent are “very” confident that
they will be able to fully retire with a comfortable lifestyle. Twenty-two percent cite paying off credit card or consumer debt
as their greatest financial priority. Nevertheless, they are saving for retirement: 82 percent of those who are offered a
401(k) or similar plan are participating in the plan and they are contributing 7 percent (median) of their annual pay.
However, 24 percent have taken a loan or early withdrawal. Their total household retirement savings is $63,000
(estimated median). Sixty-one percent expect to work past age 65 or do not plan to retire.
26
27%have not yet begun to
recover (18 percent) or may never recover
(9 percent) from the Great Recession.
1 in 10are “very” confident that they will be able to fully retire with a comfortable
lifestyle.
22%say that paying off credit card or consumer debt is
their greatest financial priority right now.
Twenty-six percent cite saving for retirement.
3 in 561 percent expect to
work past age 65 or do not plan to retire.
4 in 582 percent who are
offered a 401(k) or similar plan participate in the
plan.
is the median percentage of annual pay that
Forty-something plan participants are saving
24%of those participating in a
401(k) or similar plan have taken a loan or early
withdrawal.
$63,000is the amount saved in all
household retirement accounts (median).
Seven
p. 47 p. 46 p. 48 p. 39
p. 61p. 57p. 53p. 53

Fifties: Facing Future Retirement Realities
Workers in their Fifties are facing their future retirement realities. Amid competing financial priorities, 37
percent say that saving for retirement is their greatest priority. Eighty-three percent who are offered a 401(k) or
similar plan participate in the plan. Among them, 31 percent are contributing more than 10 percent to the plan.
Sixty-one percent are saving for retirement outside of work. With total household retirement savings of
$117,000 (estimated median), most fiftysomething workers (59 percent) plan to work past age 65 or do not
plan to retire. Forty-two percent expect their standard of living to decrease when they retire.
27
37%say that saving for retirement is their
greatest financial priority
right now.
83%who are offered a 401(k) or similar plan participate
in the plan.
3 in 1031 percent who are
participating in a 401(k) or similar plan are
contributing more than 10 percent of their
annual pay.
6 in 1061 percent are saving for
retirement outside of work.
4 in 1042 percent expect their
standard of living to decrease when they
retire.
agree that they are building a large enough
retirement nest egg.
$117,000is the amount saved in all
household retirement accounts (estimated
median).
59%plan to work past age 65 or do not plan to retire.
Only 45%
p. 48 p. 53 p. 54 p. 58
p. 39p. 61p. 62p. 33

Sixties: Transforming Retirement As They Retire
Workers in their Sixties or older are casting aside long-held societal notions about fully retiring at age 65. Eighty-
two percent either plan to or are already working past age 65 -- or do not plan to retire. Half are planning to
continue working in retirement, at least part-time, and mostly for reasons of income and health benefits. Forty-two
percent are envisioning a phased transition into retirement. Seventy-three percent believe their transition, phased
or otherwise, will take place at their current employer. Forty-seven percent expect to rely on Social Security as
their primary form of income in retirement, but only 29 percent know a great deal about their benefits.
28
4 in 582% either plan to or are already working past age
65 -- or do not plan to retire.
> Half52 percent plan to
continue working after they retire and most for reasons of income and
health benefits.
42%are envisioning a phased transition into retirement
that involves shifting from full-time to part-time or working in a different capacity.
73%believe that their
transition into retirement will take place at their
current employer.
Only 15%have a written
retirement strategy.is the amount saved in all
household retirement accounts (median).
47%expect Social Security to be their primary source
of income when they retire.
29%know a “great deal” about Social Security retirement benefits.
$172,000
p. 39 p.40, 41 p.42 p.43
p.69p.36p.61p.75

Visions and Expectations About Retirement
29

Retirement Dreams
36
37
44
43
49
42
20
21
23
22
18
21
15
17
15
14
15
15
11
5
3
2
3
5
7
5
3
3
2
4
2
1
3
6
6
4
3
6
3
2
3
3
6
8
6
8
4
6
Sixties+
Fifties
Forties
Thirties
Twenties
All Ages
Greatest Retirement Dream (%) Traveling
Spending more time withfamily and friends
Pursuing hobbies
Continuing to work in mycurrent field
Doing volunteer work
Starting a business
Pursuing an encore career(i.e. a new role, work,activity, or career)
None of the above
30BASE: All Qualified RespondentsQ1419. Which one of the followings best describes how you dream of spending your retirement?
American workers of all ages most frequently cite travel as their greatest retirement dream (42 percent).
Almost half (49 percent) of workers in their Twenties cite travel as their greatest dream compared to 36
percent of those in their Sixties and older. The second is spending more time with family and friends (21
percent), followed by pursuing hobbies (15 percent). Eleven percent of workers in their Sixties and older cite
continuing to work in their current field as their top retirement dream, a percentage that is more than twice
that of younger age ranges.

Retirement Fears
The most frequently cited retirement fear among workers of all ages is “outliving my savings and investments”
(44 percent), with workers in their Twenties most often citing this concern (48 percent). This followed by
“declining health that requires long-term care” and “Social Security will be reduced or cease to exist” (36
percent each). Workers in their Sixties and older are far less likely to have fears about Social Security (26
percent) compared to workers of younger age ranges.
31
36 38 34 35 37 38
All Twenties Thirties Forties Fifties Sixties+
Declining health that requires long-term care (%)
36 36 40
35 38
26
All Twenties Thirties Forties Fifties Sixties+
Social Security will be reduced or cease to exist (%)
33 36 38 34 31
23
All Twenties Thirties Forties Fifties Sixties+
Not being able to meet the financial needs of my family (%)
26 26 29 24 25 25
All Twenties Thirties Forties Fifties Sixties+
Cognitive decline, dementia, Alzheimer’s Disease (%)
25 22 24 25 29
22
All Twenties Thirties Forties Fifties Sixties+
Lack of access to adequate and affordable healthcare (%)
14 19 16 13 13
5
All Twenties Thirties Forties Fifties Sixties+
Being laid off – not being able to retire on my own terms (%)
13 20
15 12 9 8
All Twenties Thirties Forties Fifties Sixties+
Feeling isolated and alone (%)
13 20
14 10 9
13
All Twenties Thirties Forties Fifties Sixties+
Finding meaningful ways to spend my time and stay involved (%)
BASE: All Qualified RespondentsQ1422. What are your greatest fears about retirement? Select all.
Note: responses not shown for the 8 percent who said “none of the above.”
44 48 46
42 44 42
All Twenties Thirties Forties Fifties Sixties+
Outliving my savings and investments (%)

12
34
40
40
38
28
42
44
47
43
36
16
12
9
14
24
8
4
4
5
Sixties+
Fifties
Forties
Thirties
Twenties
Responses by Age Range
34
42
16
8
All Ages
Many Workers Are Concerned About Future of Social Security
Younger workers are particularly concerned that Social Security will not be there for them when they retire –
more than 80 percent of workers in their Twenties, Thirties and Forties share this sentiment. While concern
drops for workers in their Fifties and Sixties and older, still 40 percent of those closest to retirement (in their
Sixties) are worried about Social Security.
32
BASE: ALL QUALIFIED RESPONDENTSQ931. How much do you agree or disagree with the following statement? I am concerned that when I am ready to retire, Social Security will not be there for me.
I am concerned that when I am ready to retire, Social Security will not be there for me. (%)
Strongly Agree Somewhat Agree Somewhat Disagree Strongly Disagree
NET – Agree = 81%
NET – Agree = 76%
NET – Agree = 87%
NET – Agree = 84%
NET – Agree = 76%
NET – Agree = 40%

Standard of Living in Retirement
One-third of workers of all ages expects their standard of living to decrease when they retire. Workers age
40 and older are more likely to expect their standard of living to decrease compared to those under age 40.
In contrast, 15 percent of workers of all ages expect their standard of living to increase in retirement, a view
most widely held by workers in their Twenties (28 percent), and which steadily declines with age to just five
percent of workers age Sixty and older expecting this.
5
9
12
20
28
51
42
43
40
38
38
42
36
27
22
6
7
9
13
12
Sixties+
Fifties
Forties
Thirties
Twenties
Responses by Age Range
15
42
33
10
All Ages
Do you expect your standard of living to increase, decrease, or stay the same when you retire? (%)
BASE: ALL QUALIFIED RESPONDENTSQ1500. Do you expect your standard of living to increase, decrease, or stay the same when you retire? 33
Increase Stay the same Decrease Not sure

The Retirement Income Pyramid: Expected Sources
For decades, the United States retirement system has been characterized as a “three-legged” stool which
includes Social Security, employer pensions, and personal savings. Today’s workers are expecting greater diversity
in their sources of retirement income including, notably, the 37 percent who cite “working.”
34
BASE: ALL QUALIFIED RESPONDENTS
Q1145. Which of the following do you expect to be sources of income to cover your living expenses after you retire?
69 68
45
37
23
13 11
5
Social Security 401(k)s, 403(b)s,IRAs
Other savingsand investments
Working Company-fundedpension plan
Home equity Inheritance Other
Expected Sources of Retirement Income Among Workers of All Ages (%)

Expected Sources of Retirement Income
Self-funded savings including retirement accounts (e.g. 401(k)s, 403(b)s, IRAs) and other savings and investments
are the most frequently cited source of retirement income expected by workers of all ages (77 percent). Sixty-nine
percent of workers expect Social Security; however, there is a wide disparity among age ranges with younger
workers less likely to expect it compared to older workers. Thirty-seven percent of workers expect “working” to be a
source of retirement income, a response rate that is shared across age the ranges. Defined benefit plans (23
percent), home equity (13 percent), and inheritances (11 percent) are less often cited expected sources of income.
35
BASE: ALL QUALIFIED RESPONDENTS
Q1145. Which of the following do you expected to be sources of income to cover your living expenses after you retire? Select all.
77 82 81 76 76 74
All Twenties Thirties Forties Fifties Sixties+
NET – Self-Funded Savings (401(k), 403(b), IRAs) and other savings and investments (%)
68 71 72 67 70 62
All Twenties Thirties Forties Fifties Sixties+
401(k), 403(b), IRAs (%)
45 52
44 43 42 49
All Twenties Thirties Forties Fifties Sixties+
Other Savings and Investments (%)
69
45
61 69
79 89
All Twenties Thirties Forties Fifties Sixties+
Social Security (%)
37 38 34 37 39 38
All Twenties Thirties Forties Fifties Sixties+
Working (%)
23 16 17 20
30 34
All Twenties Thirties Forties Fifties Sixties+
Company-Funded Defined Benefit Plan (%)
13 8 13 11 15 17
All Twenties Thirties Forties Fifties Sixties+
Home Equity (%)
11 11 13 13 10 5
All Twenties Thirties Forties Fifties Sixties+
Inheritance (%)
5 5 5 4 4 5
All Twenties Thirties Forties Fifties Sixties+
Other (%)

Primary Source of Retirement Income
20
28
38
50
49
37
11
10
11
11
19
12
47
31
27
17
11
26
9
13
15
11
14
13
11
12
4
2
2
6
3
2
2
2
2
2
1
2
1
1
2
1
2
5
2
3
Sixties+
Fifties
Forties
Thirties
Twenties
All Ages
Primary Source of Retirement Income (%)
401(k), 403(b), andIRAs
Other savings andinvestments
Social Security
Working
Company-fundedDefined Benefit Plan
Inheritance
Home equity
Other
36
BASE: ALL QUALIFIED RESPONDENTS
Q1150. Which one of the following do you expect to be your primary source of income to cover your living expenses after you retire?
When asked about their expected primary source of income, there is a wide disparity of responses across the
age ranges. Workers in their Twenties (49 percent), Thirties (50 percent), and Forties (38 percent) most
frequently cite retirement accounts such as 401(k)s, 403(b)s, and IRAs. In contrast, workers in their Fifties (31
percent) and Sixties and older (47 percent) are most likely to expect Social Security to be their primary source
of income in retirement. It should be noted that 401(k)s did not become readily available until the 1990s, a
time at which workers in their Fifties and Sixties were already well into their careers and, therefore, have not
had as much time to save in them. Thirteen percent of workers expect “working” to be their primary source of
income in retirement, a response which is similarly shared among workers of all ages.
NET – Self-Funded Savings = 49%
NET – Self-Funded Savings = 68%
NET – Self-Funded Savings = 61%
NET – Self-Funded Savings = 49%
NET – Self-Funded Savings = 38%
NET – Self-Funded Savings = 31%

Expectations of Providing Support
Twenty-five percent of workers expect that they will need to provide financial support for a family member
(other than their spouse/partner) when they are retired. This expectation drops dramatically with age.
Workers in their Twenties (40 percent) are most likely to expect they will need to provide for aging parents
and/or other family members compared to those in their Thirties (34 percent), Forties (21 percent), Fifties
(16 percent) and Sixties and older (14 percent). More than half (55 percent) of workers do not expect to
need to provide financial support and 20 percent are not sure.
BASE: All Qualified RespondentsQ1506. Do you expect that you will need to provide financial support for your family (other than your spouse/partner) while you are retired? Select all.
All Ages Twenties Thirties Forties Fifties Sixties+
NET – “Yes” ProvideFinancial Support
25% 40% 34% 21% 16% 14%
To Aging Parents 15% 28% 22% 13% 5% 3%
To Other Family Members ExcludingSpouse/Partner
14% 19% 15% 13% 12% 12%
No 55% 37% 41% 58% 68% 74%
Not sure 20% 23% 25% 21% 16% 12%
Do you expect that you will need to provide financial support for your family while you are retired? (%)
37

A Family Understanding: Expectations of Reliance
Eleven percent of workers expect that they will need to receive financial support from family members (other
than their spouse/partner) when they are retired. Similar to the expectation of providing support, the
expectation of receiving support drops with age. Workers in their Twenties (19 percent) are most likely to
expect to receive support from their children and/or other family members, compared to those in their
Thirties (13 percent), Forties (9 percent), Fifties (8 percent) and Sixties and older (5 percent). Sixty-seven
percent of workers do not expect to receive support and 22 percent are “not sure.”
BASE: All Qualified RespondentsQ3505. Do you expect that you will need to receive financial support from your family while you are retired? Select all.
Do you expect that you will need to receive financial support from your family while you are retired? (%)
38
All Ages Twenties Thirties Forties Fifties Sixties+
NET – “Yes” ReceiveFinancial Support
11% 19% 13% 9% 8% 5%
From Children 7% 14% 9% 6% 6% 3%
From Other Family Members ExcludingSpouse/Partner
5% 11% 6% 4% 2% 2%
No 67% 54% 60% 68% 75% 79%
Not sure 22% 26% 27% 23% 17% 16%
7
22
16
25
32
11
19
23
26
25
64
44
46
37
33
18
15
15
12
10
Sixties+
Fifties
Forties
Thirties
Twenties
Responses by Age Range
21
21
44
14
All Ages
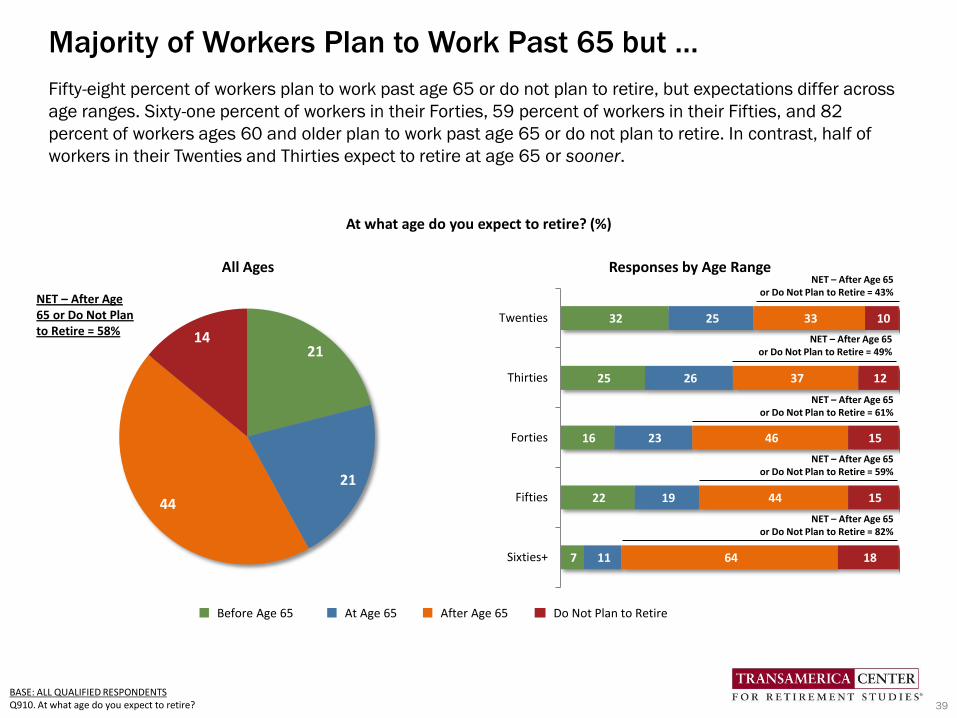
Majority of Workers Plan to Work Past 65 but …
Fifty-eight percent of workers plan to work past age 65 or do not plan to retire, but expectations differ across
age ranges. Sixty-one percent of workers in their Forties, 59 percent of workers in their Fifties, and 82
percent of workers ages 60 and older plan to work past age 65 or do not plan to retire. In contrast, half of
workers in their Twenties and Thirties expect to retire at age 65 or sooner.
39
BASE: ALL QUALIFIED RESPONDENTSQ910. At what age do you expect to retire?
At what age do you expect to retire? (%)
Before Age 65 At Age 65 After Age 65 Do Not Plan to Retire
NET – After Age 65 or Do Not Plan to Retire = 43%
NET – After Age 65 or Do Not Plan to Retire = 58%
NET – After Age 65 or Do Not Plan to Retire = 49%
NET – After Age 65 or Do Not Plan to Retire = 61%
NET – After Age 65 or Do Not Plan to Retire = 59%
NET – After Age 65 or Do Not Plan to Retire = 82%

12
39
25
24
All Ages
Many Workers Plan to Work in Retirement
About half (51 percent) of workers plan to work after they retire, including 39 percent who plan to work part-
time and 12 percent full-time. Expectations of working in retirement are generally similar across age ranges
with workers in their Twenties (49 percent) being slightly less likely and those in their Fifties (55 percent)
being somewhat more likely.
40BASE: ALL QUALIFIED RESPONDENTSQ1525. Do you plan to work after you retire?
Do you plan to work after you retire? (%)
NET – Plan to Work = 51%
Yes – Full-Time Yes – Part-Time No – Do Not Plan to Work Not Sure
8
11
13
14
12
44
44
38
32
37
31
25
23
25
24
17
20
26
29
27
Sixties+
Fifties
Forties
Thirties
Twenties
Responses by Age Range
NET – Plan to Work = 49%
NET – Plan to Work = 46%
NET – Plan to Work = 51%
NET – Plan to Work = 55%
NET – Plan to Work = 52%
Reasons for Working Range from Need to Enjoyment
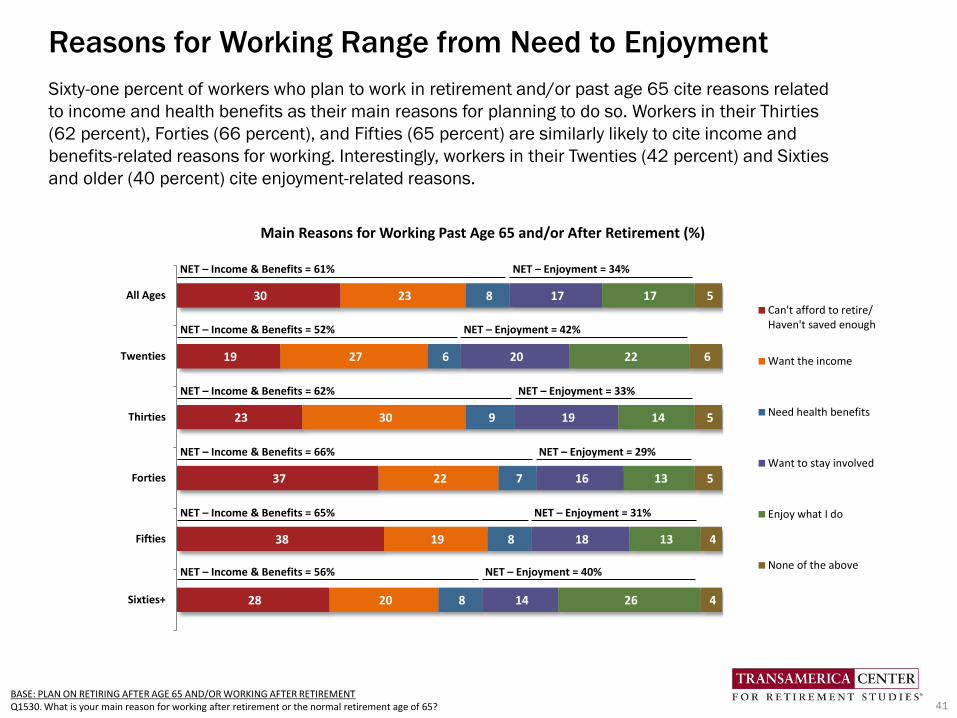
Sixty-one percent of workers who plan to work in retirement and/or past age 65 cite reasons related
to income and health benefits as their main reasons for planning to do so. Workers in their Thirties
(62 percent), Forties (66 percent), and Fifties (65 percent) are similarly likely to cite income and
benefits-related reasons for working. Interestingly, workers in their Twenties (42 percent) and Sixties
and older (40 percent) cite enjoyment-related reasons.
41BASE: PLAN ON RETIRING AFTER AGE 65 AND/OR WORKING AFTER RETIREMENTQ1530. What is your main reason for working after retirement or the normal retirement age of 65?
28
38
37
23
19
30
20
19
22
30
27
23
8
8
7
9
6
8
14
18
16
19
20
17
26
13
13
14
22
17
4
4
5
5
6
5
Sixties+
Fifties
Forties
Thirties
Twenties
All Ages
Main Reasons for Working Past Age 65 and/or After Retirement (%)
Can't afford to retire/Haven't saved enough
Want the income
Need health benefits
Want to stay involved
Enjoy what I do
None of the above
NET – Income & Benefits = 61% NET – Enjoyment = 34%
NET – Income & Benefits = 52% NET – Enjoyment = 42%
NET – Income & Benefits = 62% NET – Enjoyment = 33%
NET – Income & Benefits = 66% NET – Enjoyment = 29%
NET – Income & Benefits = 65% NET – Enjoyment = 31%
NET – Income & Benefits = 56% NET – Enjoyment = 40%

21
22
22
18
20
20
29
24
24
26
28
26
13
16
14
18
17
15
20
18
14
9
10
14
4
6
8
7
10
7
13
14
18
22
15
18
Sixties+
Fifties
Forties
Thirties
Twenties
All Ages
How do you envision transitioning into retirement? (%)
Continue working as long aspossible in current or similarposition until I cannot workany more
Transition into retirement byreducing work hours withmore leisure time to enjoy life
Transition into retirement byworking in a different capacitythat is either less demandingand/or brings greater personalsatisfactionImmediately stop workingonce I reach a specific age andbegin pursuing my retirementdreams
Immediately stop workingonce I save a specific amountof money and begin pursuingmy retirement dreams
Not sure
Many Envision a Phased Versus Immediate Retirement
The long-held view that retirement is a moment in time when a person reaches a certain age, immediately
stops working, fully retires, and begins pursuing their retirement dreams is no longer, with just 14 percent of
today’s workers expecting this scenario. One in five workers (20 percent) expects to continue working as
long as possible in their current or similar position until they cannot work any more, an expectation that is
shared across the age ranges. Forty-one percent of workers envision transitioning into retirement by
reducing hours with more leisure time to enjoy life or by working in a different capacity that is less
demanding or brings greater personal satisfaction, a vision that is also shared across age ranges.
42BASE: ALL QUALIFIED RESPONDENTSQ1545. How do you envision transitioning into retirement?
NET – Transition = 41%
NET – Transition = 45%
NET – Transition = 44%
NET – Transition = 38%
NET – Transition = 40%
NET – Transition = 42%
NET – Planned Stop = 21%
NET – Planned Stop = 20%
NET – Planned Stop = 16%
NET – Planned Stop = 22%
NET – Planned Stop = 24%
NET – Planned Stop = 24%

How Transition Will Be Accomplished
Among workers in their Forties (40 percent), Fifties (54 percent) and Sixties and older (73 percent), many
think that they will stay with their current employer while transitioning into retirement. Some think they will
change employers as they transition into retirement, with workers in their Forties (17 percent) and Fifties
(16 percent) sharing this expectation. With regards to starting their own business, only 11 percent of
workers in their Forties expect to do so, a response which declines to eight percent among workers in their
Fifties and to only two percent of workers in their Sixties and older.
When you think about working past 65 or working while you transition into retirement, which of the following is the most likely to happen? (%)
43
Stay with current
employer
Change employers Start your own business Not sure
BASE: ALL QUALIFIED RESPONDENTSQ2701. When you think about working past 65 or working while you transition into retirement, which of the following is the most likely to happen?
40
17
11
32
Forties
54
16
8
22
Fifties
73
12
2
13
Sixties+
All Ages Twenties Thirties Forties Fifties Sixties+
Accommodates flexible work schedules and arrangements
Enables employees to reduce work hours and shift from full-time to part-time
Enables employees to take positions which are less stressful or demanding
Offers financial counseling about retirement
Encourages employees to participate in succession planning, training, and mentoring
Provides seminars and education about transitioning into retirement
Offers lifestyle and transition planning resources
Provides information about encore career opportunities
Other
None of these
Not Sure
19
19
12
12
11
9
8
7
1
23
33
Employers’ Practices to Facilitate Transitioning Into Retirement
44
BASE: ALL QUALIFIED RESPONDENTS
Q1533. In which of the following ways, if any, does your current employer help its employees who are transitioning into retirement? Select all.
Which of the following ways, if any, does your current employer help its employees who are transitioning into retirement? (%)
18
13
12
12
13
8
6
5
1
25
36
20
19
15
12
13
8
13
11
1
15
40
16
18
14
12
12
10
10
12
1
21
35
20
21
11
12
9
9
6
3
2
26
31
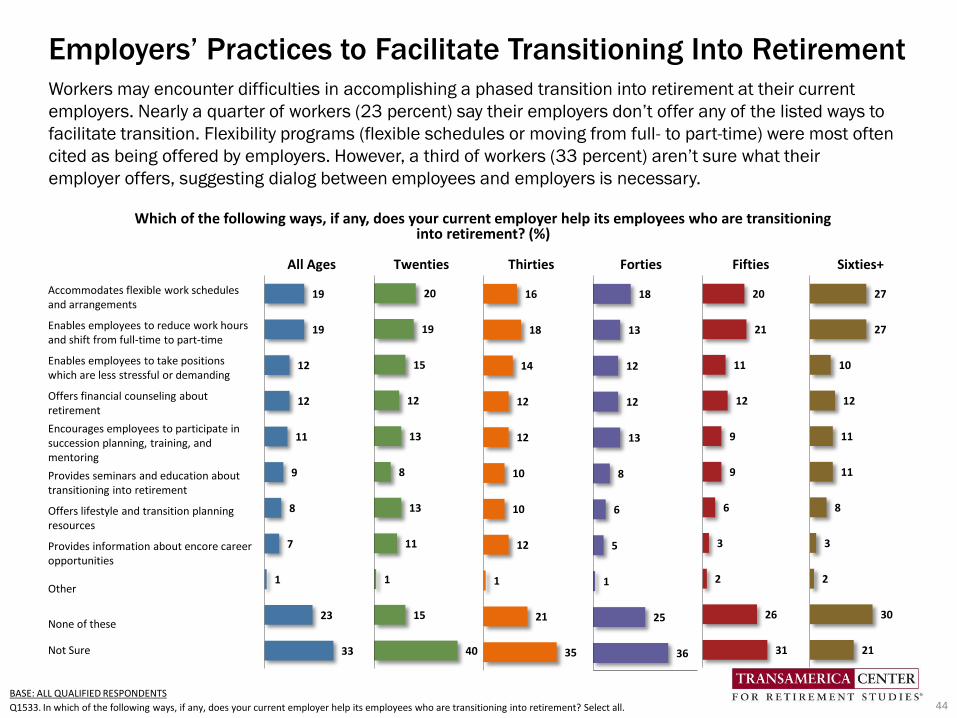
Workers may encounter difficulties in accomplishing a phased transition into retirement at their current
employers. Nearly a quarter of workers (23 percent) say their employers don’t offer any of the listed ways to
facilitate transition. Flexibility programs (flexible schedules or moving from full- to part-time) were most often
cited as being offered by employers. However, a third of workers (33 percent) aren’t sure what their
employer offers, suggesting dialog between employees and employers is necessary.
27
27
10
12
11
11
8
3
2
30
21
The Current State of American Workers’ Saving, Planning,
and Preparing for Retirement
45

Retirement Confidence Is at Pre-Recession Level
Fifty-nine percent of workers are confident that they will be able to fully retire with a lifestyle they consider
comfortable – mirroring the pre-Great Recession level that TCRS’ survey found in 2007. Retirement confidence
in 2015 is very similar to the 2007 levels; however, it has dipped from its 2014 peak of 64 percent. In looking
at retirement confidence by age range in 2015, workers in their Twenties (64 percent) and Sixties and older
(66 percent) have the highest levels of confidence. In contrast, workers in their Forties (52 percent) have the
lowest level of confidence, with just 10 percent of workers in their Forties being “very” confident.
46BASE: ALL QUALIFIED RESPONDENTSQ880. How confident are you that you will be able to fully retire with a lifestyle you consider comfortable?
How confident are you that you will be able to fully retire with a lifestyle you consider comfortable?
Retirement Confidence in 2015
Age RangeNET
ConfidentVery
ConfidentSomewhat Confident
Twenties 64% 18% 46%
Thirties 63% 15% 48%
Forties 52% 10% 42%
Fifties 57% 13% 44%
Sixties+ 66% 19% 47%
NET – Confident (%)
46 44 42 41 42 45 48 45
13 10
8 10 9 10
16 14
59
53 50 51 51
55
64
59
2007 2008/09 2009/10 2011 2012 2013 2014 2015
Somewhat confident Very confident

20
17
14
16
16
45
40
39
39
33
11
16
20
27
30
10
16
18
14
15
14
11
9
4
6
Sixties+
Fifties
Forties
Thirties
Twenties
Most Workers Are Recovering from Great Recession
Most workers (77 percent) say that they are financially recovering or were not affected by the Great
Recession, including 16 percent who have fully recovered, 40 percent who have somewhat recovered, and
21 percent who were not impacted. However, 15 percent say they have not yet begun to recover, and eight
percent feel they may never recover. Workers in their Thirties (82 percent) are most likely to have either
fully recovered, somewhat recovered or were not impacted. Workers in their Forties are and Fifties (18 and
16 percent, respectively) are most likely to have not yet begun to recover. Workers in their Sixties and older
(14 percent) are most likely to say they will never recover.
47
BASE: ALL QUALIFIED RESPONDENTSQ2655. Regardless if you think the Great Recession has ended or not, how would you describe your financial recovery from the Great Recession?
16
40 21
15
8
How would you describe your financial recovery from the Great Recession?
All Ages (%) Workers by Age Range(%)
I have fully recovered I have somewhat recovered I have not yet begun to recover I may never recoverI was not impacted
NET – Fully or Somewhat Recovered or Not Impacted = 77%
NET – Fully or Somewhat Recovered or Not Impacted = 79%
NET – Fully or Somewhat Recovered or Not Impacted = 82%
NET – Fully or Somewhat Recovered or Not Impacted = 73%
NET – Fully or Somewhat Recovered or Not Impacted = 73%
NET – Fully or Somewhat Recovered or Not Impacted = 76%
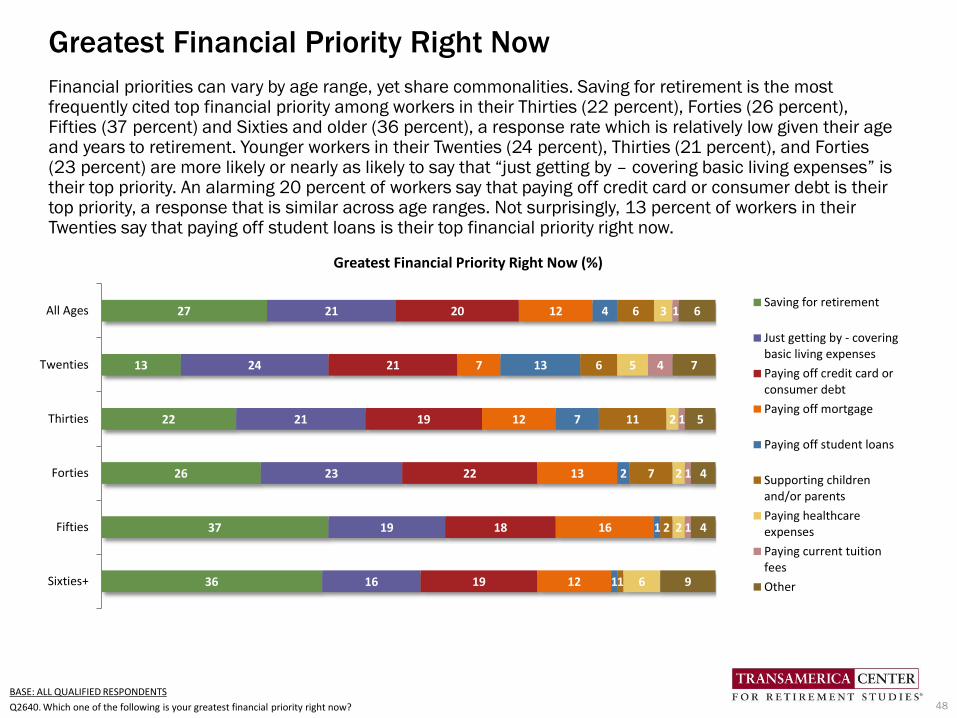
Greatest Financial Priority Right Now
48
BASE: ALL QUALIFIED RESPONDENTS
Q2640. Which one of the following is your greatest financial priority right now?
Financial priorities can vary by age range, yet share commonalities. Saving for retirement is the most frequently cited top financial priority among workers in their Thirties (22 percent), Forties (26 percent), Fifties (37 percent) and Sixties and older (36 percent), a response rate which is relatively low given their age and years to retirement. Younger workers in their Twenties (24 percent), Thirties (21 percent), and Forties (23 percent) are more likely or nearly as likely to say that “just getting by – covering basic living expenses” is their top priority. An alarming 20 percent of workers say that paying off credit card or consumer debt is their top priority, a response that is similar across age ranges. Not surprisingly, 13 percent of workers in their Twenties say that paying off student loans is their top financial priority right now.
36
37
26
22
13
27
16
19
23
21
24
21
19
18
22
19
21
20
12
16
13
12
7
12
1
1
2
7
13
4
1
2
7
11
6
6
6
2
2
2
5
3
1
1
1
4
1
9
4
4
5
7
6
Sixties+
Fifties
Forties
Thirties
Twenties
All Ages
Greatest Financial Priority Right Now (%)
Saving for retirement
Just getting by - coveringbasic living expenses
Paying off credit card orconsumer debt
Paying off mortgage
Paying off student loans
Supporting childrenand/or parents
Paying healthcareexpenses
Paying current tuitionfees
Other

Workers Are Saving for Retirement
Despite competing financial priorities, 76 percent of workers are saving for retirement. Sixty-seven percent of
workers in their Twenties are saving – and they started saving at age 22 (median). Most workers in their
Thirties (76 percent), Forties (76 percent), Fifties (80 percent), and Sixties and older (81 percent) are saving
for retirement; however, they started saving at different ages. For example, workers in their Thirties started at
25 years old (median) compared to those in their Forties and Fifties who started at 30 and 31 years old
respectively. Workers in their Sixties and older started the latest, at age 35 (median).
49
76
67
76 7680 81
All Ages Twenties Thirties Forties Fifties Sixties+
Workers Who Are Saving For Retirement Through an Employer-Sponsored Retirement Plan And/Or Outside of Work (%)
Age Started Saving (Median)
27 years 22 Years 25 Years 30 years 31 years 35 years
BASE: CURRENTLY OFFERED QUALIFIED PLANQ1190. Do you currently participate in, or have money invested in your company’s employee-funded retirement savings plan?BASE: ALL QUALIFIED RESPONDENTSQ740. Are you currently saving for retirement outside of work, such as in an IRA, mutual funds, bank account, etc.?BASE: INVESTING FOR RETIREMENTQ790. At what age did you first start saving for retirement?

Workers Highly Value Retirement Benefits
Employers take note: Workers of all
ages highly value retirement benefits.
Fully 89 percent of workers value a
401(k) or similar plan as an important
benefit.
Seventy-seven percent say that
retirement benefits offered by a
prospective employer will be a major
factor in their decision whether to
accept an offer.
Half say they would be likely to switch
employers for a nearly identical job
with a similar employer that offered
better retirement benefits. Flight risk
is greatest among the 65 percent of
of workers in their Twenties, 59
percent in their Thirties, and 54
percent in their Forties who share this
sentiment. Workers in their Fifties (43
percent) and Sixties and older (28
percent) are less likely to switch
employers for better benefits.
50
BASE: ALL QUALIFIED RESPONDENTSQ1171. Please tell us how important is this benefit to you, personally: A 401(k)/403(b)/457(b) or other employee self-funded plan.Q831. How much do you agree or disagree with the following statement? The next time I look for a job, all things being equal, the retirement savings program offered by the prospective employer will be a major factor in my final decision.Q730. How likely would you be to leave your current employer to take a nearly identical job, with a similar employer, if that employer offered you a (better) retirement plan (than offered by your current employer)?
77 76 81 78 77 70
All Ages Twenties Thirties Forties Fifties Sixties+
Retirement benefits offered by a prospective employer will be a major factor in decision to accept
NET – Strongly/Somewhat Agree (%)
5065 59 54
4328
All Ages Twenties Thirties Forties Fifties Sixties+
Likelihood of switching employers for better retirement benefits
NET – Strongly/Somewhat agree (%)
89 92 90 89 89 82
All Ages Twenties Thirties Forties Fifties Sixties+
Importance of 401(k) or similar plan as a benefitNET – Very/Somewhat Important (%)

Worker Access to Retirement Benefits
Sixty-six percent of workers have access to a 401(k) or similar employee-funded retirement plan in the workplace.
Workers in their Fifties (72 percent) are most likely to have access to a plan; those in their Twenties (59 percent)
are least likely. However, access varies greatly among full-time and part-time workers (see next page).
51
66
64
4
24
20
8
28
Retirement Benefits Offered by EmployersAll Workers (%) 59 68 68 72
62
Twenties Thirties Forties Fifties Sixties+
NET – Employee-Funded Plan (e.g., 401(k), Other) (%)
NET – Employee-Funded Plan (e.g., 401(k), Other)
An Employee-Funded 401(k) Plan
Other Employee-Funded Plan (e.g., SEP, SIMPLE, Other)
NET – Company-Funded Defined Benefit Plan
Traditional Defined Benefit Plan
Cash Balance Plan
None of These
57 65 67 69 61
Twenties Thirties Forties Fifties Sixties+
An Employee-Funded 401(k) Plan (%)
28 24 21 26 20
Twenties Thirties Forties Fifties Sixties+
NET – Company-Funded Defined Benefit Plan (e.g., Traditional DB, Cash Balance) (%)
BASE: ALL QUALIFIED RESPONDENTSQ1180. Which of the following retirement benefits does your company currently offer to you, personally? Select all.

Access to 401(k) or Similar Retirement Plan by Work Status
Full-time workers (73 percent) are far more likely to have access to a 401(k) or similar employee-funded
plan compared to part-time workers (38 percent). Among full-time workers, workers in their Fifties (78
percent) are most likely to have access to a 401(k) or similar plan and workers in their Twenties (64 percent)
are least likely. Among part-time workers, however, those in their Twenties (46 percent) are most likely to
have access to a plan compared to just 35 percent of part-time workers in their Forties and Fifties.
52BASE: ALL QUALIFIED RESPONDENTSQ1180. Which of the following retirement benefits does your company currently offer to you, personally? Select all.
7364
73 73 78 74
All Ages Twenties Thirties Forties Fifties Sixties+
NET – Employee-Funded 401(k) or Similar Plan (%)
7163
70 72 75 73
All Ages Twenties Thirties Forties Fifties Sixties+
An Employee-Funded 401(k) Plan (%)
Full-Time Workers
3846
39 35 35 39
All Ages Twenties Thirties Forties Fifties Sixties+
NET – Employee-Funded 401(k) or Similar Plan (%)
35 4134 31 33 38
All Ages Twenties Thirties Forties Fifties Sixties+
An Employee-Funded 401(k) Plan (%)
Part-Time Workers

Plan Participation and Salary Deferral Rates
Four out of five workers (80 percent) who are offered a 401(k) or similar plan participate in that plan.
Participation rates are highest among workers in their Forties (82 percent) and Fifties (83 percent) and
lowest among those in their Twenties (72 percent). Participants are contributing 8 percent (median) of their
annual salaries into their plans. Contribution rates are highest among workers in their Sixties and older at
10 percent (median) and lowest among those in their Twenties (7 percent) and Forties (7 percent).
53
BASE: CURRENTLY OFFERED QUALIFIED PLANQ1190. Do you currently participate in, or have money invested in your company’s employee-funded retirement savings plan?BASE: CURRENTLY PARTICIPATES IN QUALIFIED PLANQ601. What percentage of your salary are you saving for retirement through your company-sponsored plan this year?
8072
7782 83 80
All Ages Twenties Thirties Forties Fifties Sixites+
Participates in 401(k) or Similar PlanYes (%)
87
87
8
10
All Ages Twenties Thirties Forties Fifties Sixties+
Percentage of Annual Salary Saved in PlanMedian (%)

Contribution Rates to 401(k) or Similar Plan
While most workers participating in a 401(k) or similar plan are contributing 10 percent of their salaries or
less, some are saving more than 10 percent. These “super savers” include 28 percent of plan participants
in their Twenties, 30 percent in their Thirties, 23 percent in their Forties, 31 percent in their Fifties, and 33
percent in their Sixties and older.
54
What percentage of your salary are you contributing to your 401(k) or similar plan? (%)
BASE: CURRENTLY PARTICIPATES IN QUALIFIED PLANQ601. What percentage of your salary are you saving for retirement through your company-sponsored plan this year?
33 38
12 17
1 to 5% 6 to 10% 11 to 15% >15%
All Ages
41
31
6
22
1 to 5% 6 to 10% 11 to 15% >15%
Twenties
33 37
11 19
1 to 5% 6 to 10% 11 to 15% >15%
Thirties
37 40
15 8
1 to 5% 6 to 10% 11 to 15% >15%
Forties
30
39
13 18
1 to 5% 6 to 10% 11 to 15% >15%
Fifties
23
44
14 19
1 to 5% 6 to 10% 11 to 15% >15%
Sixties+
Save >10 Percent = 29%
Save >10 Percent = 28%
Save >10 Percent = 30%
Save >10 Percent = 23%
Save >10 Percent = 31%
Save >10 Percent = 33%

Roth 401(k) Feature
Seventy-three percent of workers who are offered a 401(k) or similar plan are aware of the Roth 401(k)
option which enables savers to pay income taxes now and take withdrawals at retirement age tax-free.
Among those who are aware, 43 percent say they are offered it by their employer and 25 percent are
contributing to it. Plan participants in their Twenties (42 percent) and Thirties (38 percent) who are offered a
Roth 401(k) feature are more likely to contribute to it compared to older age ranges.
73
64
78 73 71
81
All Ages Twenties Thirties Forties Fifties Sixties+
Are you aware of the Roth 401(k) option?Yes (%)
BASE: CURRENTLY OFFERED A QUALIFIED PLANQ605. Are you aware of the Roth 401(k)/403(b) option?
BASE: AWARE OF ROTH 401(K) OPTION
Q610. Does your employer offer a Roth 401(k) option to you, personally?
12
18
20
38
42
25
17
19
20
15
16
18
50
47
47
34
21
41
21
16
13
13
21
16
Sixties+
Fifties
Forties
Thirties
Twenties
All Ages
Does your employer offer a Roth 401(k) option to you, personally? (%)
Yes, and I do contribute Yes, but I do not contribute
No, my company does not offer it Not sure
55

All Ages Twenties Thirties Forties Fifties Sixties+
NET – PROFESSIONALLY MANAGED
I invest in an account (or service) that is managed by a professional investment advisor and I do not have to make investment or allocation decisions
I invest in a strategic allocation fund that is designed to address my specific risk tolerance profile
I invest in a target date fund that is designed to change allocation percentages as I approach my target retirement year
I set my own asset allocation percentages among the available funds
Not sure
51
23
20
19
44
16
Majority of Participants Use Professionally Managed AccountsHalf of plan participants (51 percent) are using some form of professionally managed account in their 401(k)
or similar plan. “Professionally managed” accounts refers to managed account services, strategic allocation
funds, and/or target date funds. Plan participants in their Thirties (57 percent) are mostly likely to use a
professionally managed account and the majority of workers in their Twenties (53 percent) do so as well.
Participants in their Forties and older (49 percent) use “professionally managed” accounts and are more likely
to be do-it-yourselfers, setting their own asset allocation percentages among available funds in the plan.
56
BASE: THOSE PARTICIPATING IN A QUALIFIED PLAN
Q1466. What is your current approach to investing in your employer-sponsored retirement plan? Select all.
What is your current approach to investing in your employer-sponsored retirement plan? (%)
49
19
20
18
45
19
53
24
20
30
39
19
57
24
27
23
40
16
49
22
18
15
48
13
49
27
16
11
46
13

Retirement Plan Leakage: Loans and Withdrawals
“Leakage” from retirement plans in the
form of loans and withdrawals can severely
inhibit the growth of participants’ long-term
retirement savings.
Among participants who are currently
participating in a plan, 23 percent have
taken some form of loan and/or early
withdrawal from a 401(k) or similar
plan or IRA:
• Twenty-four percent of workers in their
Forties, Fifties, and Sixties and older
have taken a loan or early withdrawal.
• Fewer workers in their Twenties (18
percent) and Thirties (21 percent) have
done so.
Among all participants, the frequency of
taking loans (13 percent) is the same as
that of taking early withdrawals (13
percent).
57BASE: CURRENTLY PARTICIPATES IN QUALIFIED PLANQ754. Have you ever taken any form of loan or early withdrawal from a qualified retirement account such as a 401(k) or similar plan or IRA?
2318 21
24 24 24
All Ages Twenties Thirties Forties Fifties Sixties+
Have Taken A Loan or Early Withdrawal From 401(k) or Similar Plan or IRA
NET - Yes (%)
13 11 11 13 14 12
All Ages Twenties Thirties Forties Fifties Sixties+
Have Taken A Loan From 401(k) or Similar Plan
Yes (%)
1310
15 13 1115
All Ages Twenties Thirties Forties Fifties Sixties+
Have Taken An Early WithdrawalFrom 401(k) or Similar Plan or IRA
Yes (%)
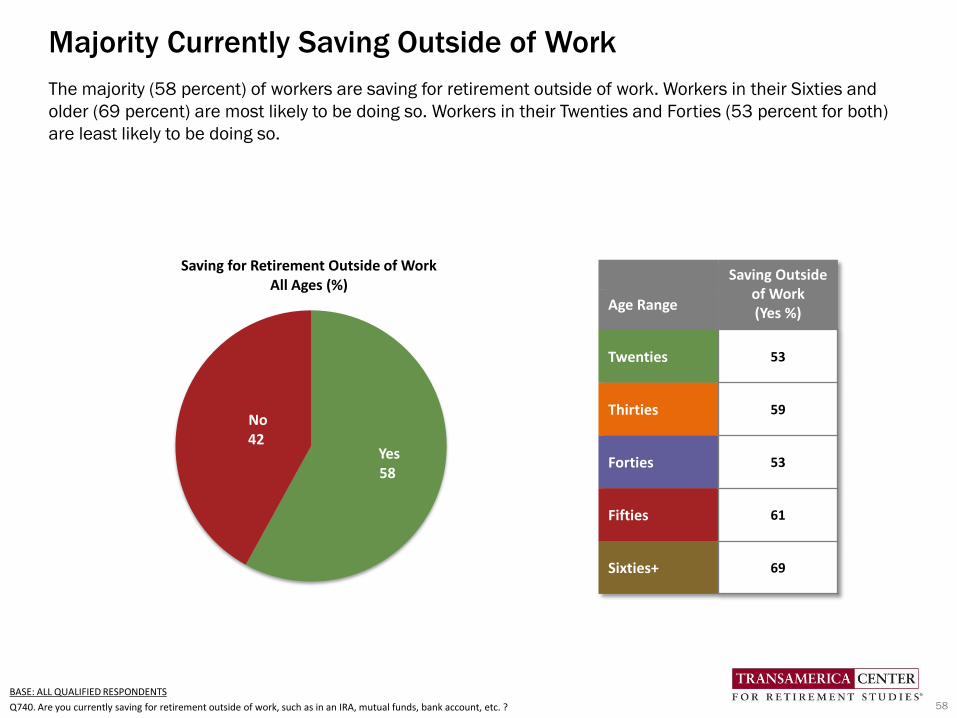
Yes58
No42
Saving for Retirement Outside of WorkAll Ages (%)
Majority Currently Saving Outside of Work
The majority (58 percent) of workers are saving for retirement outside of work. Workers in their Sixties and
older (69 percent) are most likely to be doing so. Workers in their Twenties and Forties (53 percent for both)
are least likely to be doing so.
58
BASE: ALL QUALIFIED RESPONDENTS
Q740. Are you currently saving for retirement outside of work, such as in an IRA, mutual funds, bank account, etc. ?
Saving Outsideof Work(Yes %)
Age Range
Twenties 53
Thirties 59
Forties 53
Fifties 61
Sixties+ 69

Who Wants To Be a Millionaire? Estimated Retirement Needs
Workers of all ages estimate that they will need to save $1,000,000 (median) to feel financially secure when
they retire. Thirty percent of all workers believe that they will need to save $2,000,000 or more with workers
in their Thirties (35 percent) most likely to say this and those in their Sixties and older (25 percent) least
likely.
59
BASE: ALL QUALIFIED RESPONDENTS.Q890. Thinking in terms of what money can buy today, how much money do you believe you will need to have saved by the time you retire in order to feel financially secure?
How much do you believe you will need to save by the time you retire in order to feel financially comfortable?% Responses by Age Range
EstimatedNeeds
All Ages Twenties Thirties Forties Fifties Sixties+
< $500k 26 26 26 29 24 27
$500k to $1m
19 19 16 16 22 22
$1m to $2m 25 23 23 28 26 25
$2m or More 30 32 35 27 28 25
Median $1,000,000 $1,000,000 $1,000,000 $1,000,000 $1,000,000 $1,000,000

Workers Are Guessing Their Savings Needs
More than half (53 percent) of workers say they “guessed” their retirement savings needs. Twenty percent
estimated this goal based on their current living expenses. Just 10 percent used a retirement calculator or
completed a worksheet, a response rate which is similarly shared across age ranges.
60
53
20
10
7
3
5
3
3
6
Guessed
Estimated based on current livingexpenses
NET Used a retirement calculator orcompleted a worksheet
Used a retirement calculator
Completed a worksheet
Expected earnings on investments
Amount given to me by a financialadvisor
Read/heard that is how much isneeded
Other
Basis of Estimating Retirement Savings GoalAll Workers (%) 57 57 53 52
44
Twenties Thirties Forties Fifties Sixties+
Guessed Retirement Savings Needs (%)
8 11 12 10 11
Twenties Thirties Forties Fifties Sixties+
NET – Used a Retirement Calculator or Completed Worksheet (%)
BASE: PROVIDED ESTIMATE OF MONEY NEEDED FOR RETIREMENTQ900. How did you arrive at that number?
NET – Used a calculator or completed a worksheet
17 14 20 24 26
Twenties Thirties Forties Fifties Sixties+
Estimated Based on Current Living Expenses (%)

Household Retirement Savings
The total household savings in retirement accounts is $63,000 (estimated median) among workers of all
ages. Total retirement savings steadily increases by age range: Workers in their Twenties have saved
$16,000 (estimated median) while those in their Thirties have saved $45,000, Forties have saved $63,000,
and Fifties have saved $117,000. Workers in their Sixties and older have saved $172,000 (estimated
median) – notably, 39 percent of them have saved $250,000 or more.
61BASE: ALL QUALIFIED RESPONDENTSQ1300. Approximately how much money does your household have saved in all of your retirement accounts?
12 16 13 13 9 9
48
5 43 2
7
15
7 66
3
8
10
127
76
11
9
1113
108
14
917
15
15
12
22 7 1420 33
39
All Ages Twenties Thirties Forties Fifties Sixties+
$250k or more
$100k to less than $250k
$50k to less than $100k
$25k to less than $50k
$10k to less than $25k
$5k to less than $10k
Less than $5k
Not sure 11 19 11 10 8 7Decline to answer 11 7 10 12 9 14
Estimated Median $63,000 $16,000 $45,000 $63,000 $117,000 $172,000
Note: The median is estimated based on the approximate midpoint of the range of each response category. Non-responses are excluded from the estimate.
Total Household Retirement Savings by Age Range (%)

Forty-nine percent of workers agree that they are
currently building a large enough retirement nest
egg, including 15 percent who “strongly” agree
and 34 percent who “somewhat” agree.
Responses vary somewhat by age range:
• Workers in their Sixties and older (54
percent) are most likely to agree, including
17 percent who “strongly” agree and 37
percent who “somewhat” agree.
• Workers in their Forties (46 percent) and
Fifties (45 percent) are least likely to agree –
with those in their Forties least likely to
“strongly” agree (11 percent).
Building a Large Enough Nest Egg? Many Say, “No.”
17
14
11
17
18
15
37
31
35
34
34
34
18
24
24
21
20
22
22
24
24
17
18
21
6
7
6
11
10
8
Sixties+
Fifties
Forties
Thirties
Twenties
All Ages
How much do you agree or disagree that you are currently building a large enough retirement nest egg?
(%)
Strongly Agree Somewhat Agree Somewhat Disagree
Strongly Disagree Not Sure
62
NET – Agree = 49%
NET – Agree = 52%
NET – Agree = 51%
NET – Agree = 45%
NET – Agree = 46%
NET – Agree = 54%
BASE: ALL QUALIFIED RESPONDENTSQ800. How much do you agree or disagree that you are currently building a large enough retirement nest egg?

Becoming Retirement Ready Requires
Know-How and Strategic Planning
63

It’s Time to Get Educated About Retirement Investing
BASE: ALL QUALIFIED RESPONDENTS
Q931. State level of agreement. “I do not know as much as I should about retirement investing.”
One of the most important ways workers of
all ages can begin to improve their retirement
outlook is by learning more about saving and
investing for retirement.
Two out of three workers (67 percent) agree
that they don’t know as much as they should
about retirement investing.
Agreement is highest among workers in their
Twenties (75 percent) – and it is lowest
among those in their Sixties and older (59
percent).
Workers in their Thirties (68 percent), Forties
(65 percent), and Fifties (63 percent) share
similar levels of agreement that they don’t
know as much as they should.
64
17
24
26
28
31
26
42
39
39
40
44
41
27
23
25
22
16
22
14
14
10
10
9
11
Sixties+
Fifties
Forties
Thirties
Twenties
All Ages
“I do not know as much as I should about retirement investing.” % Agree/Disagree
Strongly Agree Somewhat Agree Somewhat Disagree Strongly Disagree
NET – Agree = 67%
NET – Agree = 75%
NET – Agree = 68%
NET – Agree = 65%
NET – Agree = 63%
NET – Agree = 59%

Most Workers Want More Retirement Education and Advice
The majority of workers (61 percent) would like more education and advice from their employers on how to
reach their retirement goals. This desire is highest among workers in their Twenties and Thirties (71 and 72
percent, respectively), with strong responses from workers in their Forties (62 percent) and Fifties (54
percent).
65WORKER BASE: ALL QUALIFIED RESPONDENTSQ931. How much do you agree or disagree with each of the following statements regarding retirement investing?
61
71 72
62
54
42
All Workers Twenties Thirties Forties Fifties Sixties+
“I would like to receive more information and advice from my company on how to achieve my retirement goals.”
NET – Strongly/Somewhat Agree By Age Range (%)

All Workers Twenties Thirties Forties Fifties Sixties+
NET – Easy-to-Understand
A good starting point that is easy-to-understand
Educational materials that are easier to understand
Larger tax breaks/incentives for saving in a retirement plan
A financial advisor
A greater sense of urgency (or fear) that I should save
Other
Nothing – I am already educated enough
Nothing – I’m just not interested
49
34
34
37
29
22
5
12
10
Motivators to Inspire Learning: Make It Easier to Understand
When workers were asked what would motivate them to learn more about saving and investing for
retirement, the most frequently cited motivators across age ranges were related to making it easier to
understand. Workers in their Twenties (59 percent) and Thirties (56 percent) were most likely cite this.
Larger tax breaks/incentives for saving in a retirement plan, and a financial advisor were also frequently
cited motivators across age ranges, with larger tax breaks most frequently cited by workers in their Fifties
(41 percent).
66
WORKER BASE: ALL QUALIFIED RESPONDENTS
Q2040. What would motivate you to learn more about saving and investing for retirement? Select all that apply.
59
40
46
34
36
27
7
6
11
56
35
41
40
33
26
3
9
9
45
32
31
31
24
23
6
13
11
What would motivate you to learn more about saving and investing for retirement? By Age Range (%)
39
28
24
39
26
15
6
18
10
44
34
30
41
26
19
5
13
11
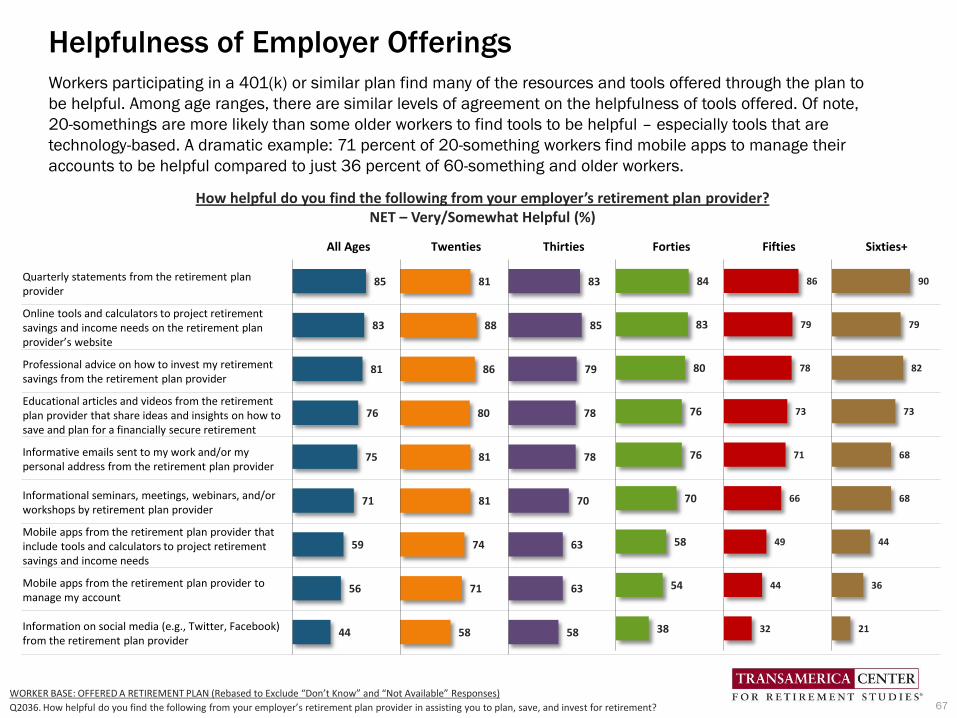
Helpfulness of Employer Offerings
Workers participating in a 401(k) or similar plan find many of the resources and tools offered through the plan to
be helpful. Among age ranges, there are similar levels of agreement on the helpfulness of tools offered. Of note,
20-somethings are more likely than some older workers to find tools to be helpful – especially tools that are
technology-based. A dramatic example: 71 percent of 20-something workers find mobile apps to manage their
accounts to be helpful compared to just 36 percent of 60-something and older workers.
WORKER BASE: OFFERED A RETIREMENT PLAN (Rebased to Exclude “Don’t Know” and “Not Available” Responses)
Q2036. How helpful do you find the following from your employer’s retirement plan provider in assisting you to plan, save, and invest for retirement?
All Ages Twenties Thirties Forties Fifties Sixties+
Quarterly statements from the retirement plan provider
Online tools and calculators to project retirement savings and income needs on the retirement plan provider’s website
Professional advice on how to invest my retirement savings from the retirement plan provider
Educational articles and videos from the retirement plan provider that share ideas and insights on how to save and plan for a financially secure retirement
Informative emails sent to my work and/or my personal address from the retirement plan provider
Informational seminars, meetings, webinars, and/or workshops by retirement plan provider
Mobile apps from the retirement plan provider that include tools and calculators to project retirement savings and income needs
Mobile apps from the retirement plan provider to manage my account
Information on social media (e.g., Twitter, Facebook) from the retirement plan provider
85
83
81
76
75
71
59
56
44
81
88
86
80
81
81
74
71
58
83
85
79
78
78
70
63
63
58
84
83
80
76
76
70
58
54
38
How helpful do you find the following from your employer’s retirement plan provider?NET – Very/Somewhat Helpful (%)
86
79
78
73
71
66
49
44
32
90
79
82
73
68
68
44
36
21
67

Retirement Knowledge About Asset Allocation Principles
Workers’ lack of knowledge about retirement investing can be illustrated by a general lack of understanding
about asset allocation principles which are fundamental to retirement investing. Forty-four percent have
“some” understanding about asset allocation principals, yet only eight percent have a “great deal” and 18
percent have “quite a bit.” An alarming 30 percent have “none.” Responses vary somewhat by age ranges,
with workers in their Twenties having the least knowledge.
BASE: ALL QUALIFIED RESPONDENTSQ760. How good of an understanding do you have regarding asset allocation principles as they relate to retirement investing?
Level of Understanding Regarding Asset Allocation Principles
A Great Deal Quite a Bit Some None
68
8
18
44
30
All Ages (%)
8
7
8
10
7
22
16
18
21
16
38
48
44
44
40
32
29
30
25
37
Sixties+
Fifties
Forties
Thirties
Twenties
Responses by Age Range (%)
NET – A Great Deal/Quite a Bit/ Some= 71%
NET – A Great Deal/ Quite a Bit/ Some = 63%
NET – A Great Deal/ Quite a Bit/ Some = 75%
NET – A Great Deal/ Quite a Bit/ Some = 70%
NET – A Great Deal/ Quite a Bit/ Some = 71%
NET – A Great Deal/ Quite a Bit/ Some = 68%

Retirement Knowledge: Decision-Making Style
Eighty-four percent of workers prefer to be involved in making decisions about saving and investing for
retirement, including 44 percent who say they do their own research and make their own decisions and 40
percent who seek advice, but make their own decisions. Just 16 percent of workers want someone to make
decisions for them on their behalf. Responses vary somewhat by age range. Workers in their Twenties (48
percent) are most likely to seek advice but make their own final decisions, while those Sixty and older (50
percent) prefer to do their own research and make their own decisions.
BASE: ALL QUALIFIED RESPONDENTS
Q705. How would you describe yourself when it comes to saving and investing for retirement?
How would you describe yourself when it comes to saving and investing for retirement?
44
40
16
All Ages (%)
NET – DIY = 84%
Do It Myself: I do my own research and make my own decisions
Educate Me: I seek advice, but make my own final decisions
Just Do It For Me: I want someone else to make the decisions on my behalf
69
50
42
48
45
35
35
41
35
42
48
15
17
17
13
17
Sixties+
Fifties
Forties
Thirties
Twenties
Responses by Age Range (%)NET – DIY = 83%
NET – DIY = 87%
NET – DIY = 83%
NET – DIY = 83%
NET – DIY = 85%
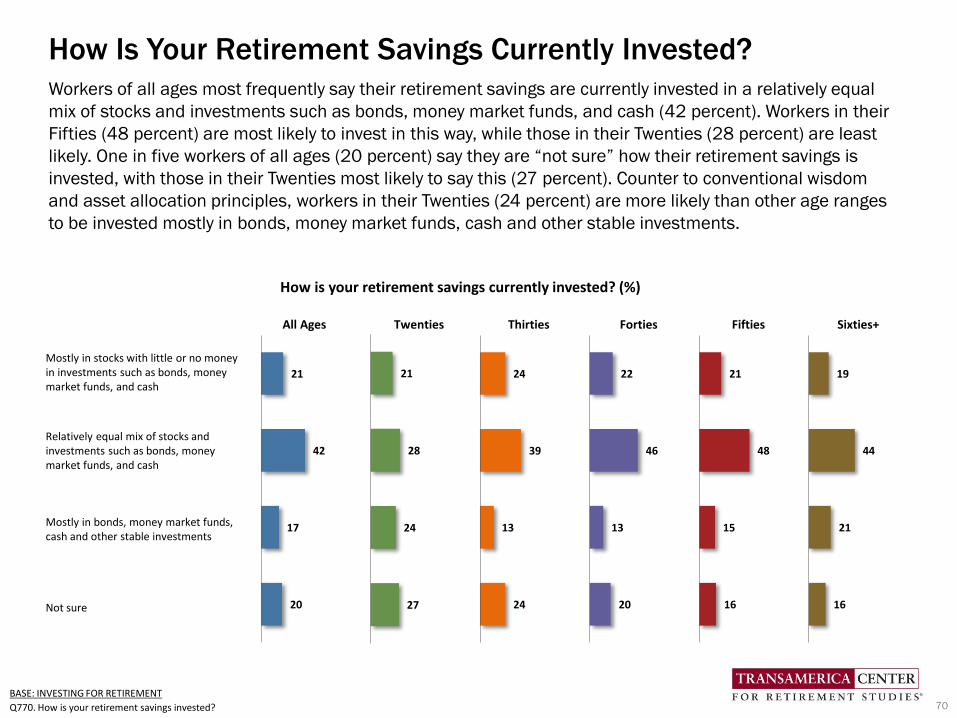
All Ages Twenties Thirties Forties Fifties Sixties+
Mostly in stocks with little or no money in investments such as bonds, money market funds, and cash
Relatively equal mix of stocks and investments such as bonds, money market funds, and cash
Mostly in bonds, money market funds, cash and other stable investments
Not sure
21
42
17
20
How Is Your Retirement Savings Currently Invested?Workers of all ages most frequently say their retirement savings are currently invested in a relatively equal
mix of stocks and investments such as bonds, money market funds, and cash (42 percent). Workers in their
Fifties (48 percent) are most likely to invest in this way, while those in their Twenties (28 percent) are least
likely. One in five workers of all ages (20 percent) say they are “not sure” how their retirement savings is
invested, with those in their Twenties most likely to say this (27 percent). Counter to conventional wisdom
and asset allocation principles, workers in their Twenties (24 percent) are more likely than other age ranges
to be invested mostly in bonds, money market funds, cash and other stable investments.
70
BASE: INVESTING FOR RETIREMENT
Q770. How is your retirement savings invested?
How is your retirement savings currently invested? (%)
22
46
13
20
21
28
24
27
24
39
13
24
21
48
15
16
19
44
21
16

Spouse / Partner Savings
Among workers who are married or in a civil union, 57 percent say their spouse or partner is saving in a
retirement plan; among them 66 percent are familiar with their spouse’s or partner’s savings, with only 37
percent being “very” familiar. Level of familiarity increases with age. Workers who are Sixty and older are
most likely to be familiar with their spouse’s or partner’s savings (74 percent), with 46 percent being “very”
familiar.
57 56 61
55 58 55
All Twenties Thirties Forties Fifties Sixties+
Is Spouse / Partner Saving in a Retirement Plan?Percentage “Yes”
BASE: MARRIED OR IN CIVIL UNION
Q850. Is your spouse or partner currently putting money into a retirement plan of his or her own?
Q1520. How familiar are you with your partner’s retirement plan and savings?
46
41
34
31
29
37
28
25
30
33
33
29
16
17
18
22
20
18
10
17
18
14
18
16
Sixties+
Fifties
Forties
Thirties
Twenties
All Ages
Level of Familiarity with Spouse's / Partner's Retirement Savings (%)
Very Familiar Somewhat Familiar
Not too Familiar Not at all Familiar
71
NET – Familiar = 66%
NET – Familiar = 62%
NET – Familiar = 64%
NET – Familiar = 64%
NET – Familiar = 66%
NET – Familiar = 74%
Unfamiliar (Net) = 34%
Unfamiliar (Net) = 38%
Unfamiliar (Net) = 36%
Unfamiliar (Net) = 36%
Unfamiliar (Net) = 34%
Unfamiliar (Net) = 26%

Knowledge of Social Security Benefits
Most American workers are expecting Social Security as a source of income in retirement, yet relatively few
have a strong knowledge of their benefits. Case in point: 89 percent of workers in their Sixties and older are
expecting Social Security benefits as a source of income in retirement, yet only 29 percent say they know a
“a great deal” about Social Security and 38 percent know “quite a bit.” It is imperative that pre-retirees gain
a strong knowledge and understanding of the optimal age to claim, as well as how to file for and start
receiving benefits, in order to maximize the value of their lifetime benefits.
BASE: ALL QUALIFIED RESPONDENTSQ1541. How good of an understanding do you have of Social Security?
Level of Understanding re: Social Security Benefits (%)
A Great Deal Quite a Bit Some None
72
12
25
52
11
Forties
NET – A Great Deal/Quite a Bit= 37% 15
25
52
8
Fifties
NET – A Great Deal/Quite a Bit= 40%
29
38
31
2
Sixties+
NET – A Great Deal/Quite a Bit= 67%

Knowledge of Medicare
Most American workers will rely on Medicare for their health care insurance when they are 65 and older.
Slightly more than half (52 percent) of workers in their Sixties and Older know either “a great deal” (22
percent) or “quite a bit” (30 percent) about their benefits. The level of understanding is even lower among
workers in their Forties and Fifties.
BASE: ALL QUALIFIED RESPONDENTSQ1541. How good of an understanding do you have of Medicare?
Level of Understanding re: Medicare (%)
A Great Deal Quite a Bit Some None
73
9
15
50
26
Forties
NET – A Great Deal/Quite a Bit= 24%
10
15
56
19
Fifties
NET – A Great Deal/Quite a Bit= 25%
22
30
38
8
Sixties+
NET – A Great Deal/Quite a Bit= 52%

Awareness of Saver’s Credit & Catch-Up Contributions
The Internal Revenue Service offers two meaningful incentives to save for retirement for which many workers
are unaware, including: the Saver’s Credit, a tax credit for low- to moderate-income workers who save for
retirement in a qualified retirement plan or IRA; and Catch-Up Contributions, which allow workers age 50 and
older to contribute to a qualified plan an additional amount over and above the plan- or IRA-contribution limit.
Only 30 percent of all workers are aware of the Saver’s Credit. Only 65 percent of workers in their Fifties and
68 percent of those in their Sixties and older are aware of Catch-Up Contributions. Raising awareness of these
incentives may prompt workers to save more.
30 30 34
28 27 32
50
34
47 42
65 68
All Ages Twenties Thirties Forties Fifties Sixties+
Awareness of Tax IncentivesYes (%)
Saver's Credit Catch-Up Contributions
BASE: ALL QUALIFIED RESPONDENTSQ1120. Are you aware of a tax credit called the ’’Saver’s Credit,’’ which is available to individuals and households, who meet certain income
requirements, for making contributions to an IRA or a company-sponsored retirement plan such as a 401(k) plan or 403(b) plan?
Q1000. Are you aware that people age 50 and older may be allowed to make catch-up contributions to their 401(k)/403(b)/457(b) plan or
IRA? 74

Sources of Information About Retirement
Workers, to a greater or lesser extent, rely on many sources of information for retirement planning and investing.
Workers in their Twenties (42 percent) most frequently cite family and friends – a response that declines with age.
Workers in their Sixties and older (42 percent) most frequently cite a financial planner / broker – a response that
increases with age. Twenty-one percent of workers say they do not rely on any sources of information.
What sources of information do you rely on for retirement planning and investing?
Workers
All Twenties Thirties Forties Fifties Sixties+
Friends/Family 30% 42% 33% 32% 22% 18%
Financial Planner / Broker 28% 20% 24% 25% 33% 42%
Financial websites (Yahoo! Finance, Morningstar, etc.) 25% 26% 27% 25% 24% 23%
Retirement Plan Provider Website 22% 19% 22% 21% 25% 24%
Employer 18% 21% 17% 19% 16% 15%
Online newspapers, magazines, and blogs 17% 23% 18% 14% 15% 17%
Retirement Calculators 16% 14% 13% 17% 18% 19%
Print newspapers and magazines 15% 10% 12% 15% 17% 20%
Financial-related television shows 13% 12% 14% 11% 13% 15%
Plan Provider printed material (i.e., brochures) 13% 10% 14% 13% 14% 12%
Accountant 9% 13% 10% 5% 8% 11%
Insurance Agent 4% 7% 4% 3% 5% 3%
Lawyer 3% 6% 5% 3% 2% 3%
Online Social Media (e.g. Facebook, Twitter, etc.) 3% 4% 3% 2% 1% 2%
Other 6% 7% 3% 7% 7% 8%
None 21% 20% 22% 25% 21% 16%
BASE: ALL QUALIFIED RESPONDENTSQ825. What sources of information do you rely on for retirement planning and investing? Select all 75

Financial Advisor Usage
Only 35 percent of workers use a professional financial advisor to help manage their retirement savings and
investments. Workers in their Forties (29 percent) are least likely to use an advisor, while those in their
Sixties and older (48 percent) are most likely. Workers in their Twenties (32 percent), Thirties (34 percent),
and Fifties (36 percent) are similarly likely to use an advisor.
35
65
Yes No
BASE: INVESTING FOR RETIREMENT
Q860. Do you use a professional financial advisor to help manage your retirement savings or investments?
Do you use a professional financial advisor to help manage your retirement savings or investments?
32 34 29
36
48
Twenties Thirties Forties Fifties Sixties+
Percentage “Yes”All Ages (%)
76

All Ages Twenties Thirties Forties Fifties Sixties+
Make retirement investment recommendations such as mutual funds, annuities, stocks, bonds, etc.
General financial planning (i.e., college funding, cash flow analysis, budgeting, etc.)
Calculate retirement savings goal
Recommend other retirement-related product needs including health, life, and long-term care insurance.
Tax preparation
Some other service
73
45
43
37
22
5
Financial Advisor UsageAmong workers who use a financial advisor, they most often use their advisors to make retirement investment
recommendations (73 percent), followed by general financial planning (45 percent), and calculating a
retirement savings goal (43 percent). Workers in their Sixties and older (87 percent) are most likely to use their
advisor for making retirement investment recommendations, while those in their Twenties (56 percent) are
least likely. Workers in their Thirties use their advisors for general financial planning (59 percent) more than
other age ranges. Workers in their Twenties are somewhat more likely than older workers to use their advisor
for calculating a retirement savings goal (56 percent) and tax preparation (43 percent). Thirty-seven percent of
workers rely on their advisors for recommending other retirement-related products and services.
77
BASE: USE A FINANCIAL ADVISOR
Q870. What types of services do you use your professional financial advisor to perform? Select all.
What types of services do you use your professional financial advisor to perform? (%)
76
51
41
40
19
4
56
49
56
39
43
4
65
59
53
41
31
5
76
42
36
35
17
6
87
29
36
31
10
7

Retirement Strategy: A Written Plan
Retirement planning inherently involves strategic planning, yet 42 percent of American workers do not have a
retirement strategy. It’s difficult, if not impossible, to reach a destination without a compass or roadmap. More
workers have a plan as they approach retirement age. Workers in their Sixties and older (73 percent) are most
likely to have some form of plan compared to those in their Forties (52 percent). However, the percentage of
workers with a written plan is low (14 percent), with workers in their Forties (9 percent) least likely to have a
written plan.
How would you describe your retirement strategy?
BASE: ALL QUALIFIED RESPONDENTS
Q1155. Which of the following best describes your retirement strategy?
I Have a Written Plan I Have a Plan but Not Written Down I Do Not Have a Plan
78
14
44
42
All Ages (%)
NET – Have a Plan= 58%
15
14
9
17
15
58
46
43
36
43
27
40
48
47
42
Sixties+
Fifties
Forties
Thirties
Twenties
Responses by Age Range (%)
NET – Have a Plan = 53%
NET – Have a Plan = 58%
NET – Have a Plan = 52%
NET – Have a Plan = 73%
NET – Have a Plan = 60%

Retirement Strategy: Components
Among workers who have a retirement strategy (written or unwritten), many are overlooking critical components
in their strategies. While most are considering on-going living expenses and government benefits, few are
considering factors such as investment returns, inflation, tax planning, contingency plans – and pursuing their
retirement dreams.
Components of StrategyAge Range (%)
All Workers Twenties Thirties Forties Fifties Sixties+
On-Going Living Expenses 57% 46% 44% 53% 66% 73%
Social Security & Medicare Benefits 57% 32% 40% 54% 67% 87%
Total Retirement Savings & Income Needs 54% 39% 49% 52% 60% 65%
A Retirement Budget That Includes Basic Living Expenses 52% 40% 45% 48% 64% 61%
Healthcare Costs 50% 36% 46% 45% 57% 63%
Investment Returns 41% 32% 36% 41% 45% 50%
Inflation 33% 23% 31% 38% 37% 34%
Pursuing Retirement Dreams 29% 35% 27% 27% 28% 27%
Tax Planning 22% 26% 25% 16% 26% 21%
Long-Term Care Insurance 22% 28% 22% 18% 22% 22%
Estate Planning 19% 14% 18% 19% 18% 24%
Contingency Plans for Retiring Sooner than Expected and/or Savings Shortfalls
15% 19% 19% 15% 12% 9%
Other 4% 5% 1% 5% 3% 5%
Not Sure 8% 12% 7% 11% 6% 3%
BASE: HAS A RETIREMENT STRATEGY (WRITTEN OR UNWRITTEN)
Q1510. Which of the following have you factored into your retirement strategy? Select all. 79
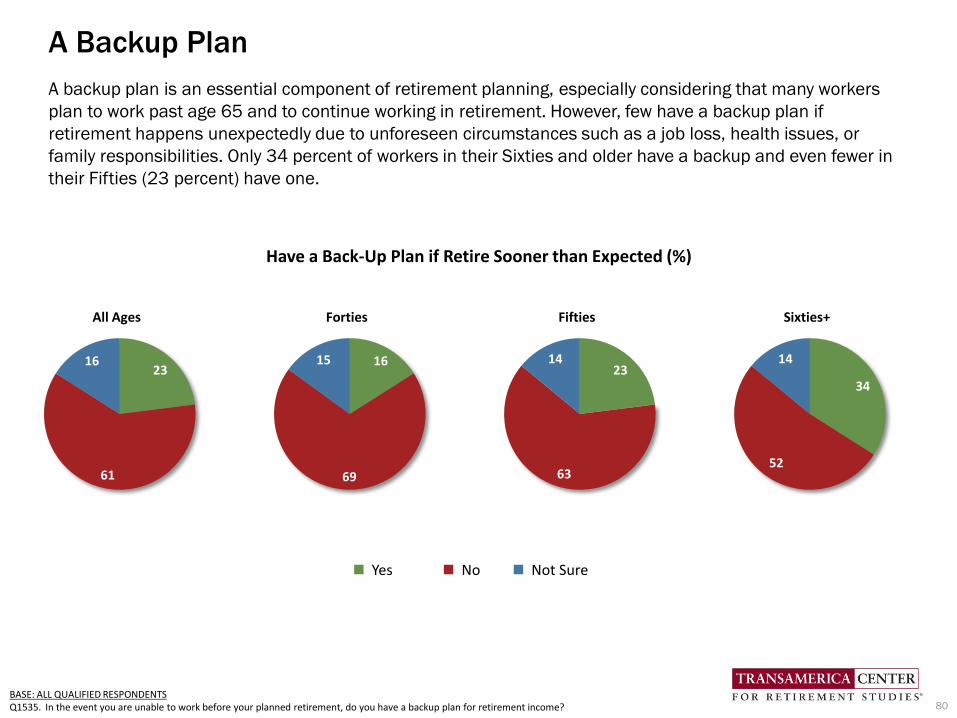
A Backup Plan
A backup plan is an essential component of retirement planning, especially considering that many workers
plan to work past age 65 and to continue working in retirement. However, few have a backup plan if
retirement happens unexpectedly due to unforeseen circumstances such as a job loss, health issues, or
family responsibilities. Only 34 percent of workers in their Sixties and older have a backup and even fewer in
their Fifties (23 percent) have one.
BASE: ALL QUALIFIED RESPONDENTSQ1535. In the event you are unable to work before your planned retirement, do you have a backup plan for retirement income?
Have a Back-Up Plan if Retire Sooner than Expected (%)
Yes No Not Sure
23
61
16
All Ages
16
69
15
Forties
23
63
14
Fifties
34
52
14
Sixties+
80

Frequency of Conversations
Retirement is a family matter that calls for important conversations. However, just 11 percent of workers
“frequently” discuss saving, investing, and planning for retirement with family and close friends. While 58
percent “occasionally” discuss it, 31 percent “never” discuss it. Of concern are workers in their Forties (34
percent) and Fifties (32 percent) who never discuss it. Counterintuitively, workers in their Twenties (16 percent)
are the most likely of all age ranges to “frequently” discuss it, although they are decades away from retirement.
BASE: ALL QUALIFIED RESPONDENTS
Q1515. How frequently do you discuss saving, investing, and planning for retirement with your family and friends?
How Frequently Do You Discuss Saving, Investing, and Planning for Retirement with Your Family and Friends?
Frequently Occasionally Never
11
58
31
All Ages (%)
81
NET – Discuss = 70%
12
8
8
14
16
59
60
58
55
56
29
32
34
31
28
Sixties+
Fifties
Forties
Thirties
Twenties
Responses by Age Range (%)
NET – Discuss = 72%
NET – Discuss = 69%
NET – Discuss = 66%
NET – Discuss = 68%
NET – Discuss = 71%

Appendix
82

83
A Portrait of Workers Ages 20 to 60+
BASE: ALL QUALIFIED RESPONDENTSQ268, Q1665, Q1600, Q2775, Q1230, Q1280, Q2770. Which of the following best describes/represents …?
Characteristics All Ages (%)n=4,550
Twenties (%)n=579
Thirties (%)n=853
Forties (%)n=895
Fifties (%)n=1,243
Sixties+ (%)n=948
Gender Male 53 47 53 55 53 57 Female 47 53 47 45 47 43
Marital Status Married or Partnership 62 39 64 68 70 70 Not married 38 61 36 32 30 30
Work Status Full-Time 80 73 84 86 85 66 Part-Time 20 27 16 14 15 34
Number of Jobs Currently Held One 90 83 88 91 94 93 Two or more 10 17 12 9 6 7
Level of Education Less Than High School
Diploma2 4 2 1 2 1
High School Diploma 27 24 23 27 31 21 Some College or Trade
School35 30 31 36 38 41
College Graduate or More 36 42 44 36 29 37Annual Household Income Less than $25,000 9 16 8 8 6 5 $25,000 to $49,999 20 24 21 20 16 20 $50,000 to $99,999 34 37 38 32 35 34 $100,000+ 31 15 29 35 39 33 Decline to Answer 6 8 4 5 4 8 Estimated Median $61,000 $44,000 $59,000 $67,000 $73,000 $66,000
General Health (Self-Described) Excellent 21 30 25 17 16 18 Good 62 55 60 61 67 66 Fair 16 13 15 20 16 15 Poor 1 2 - 2 1 1

© Transamerica Institute® 2015