Embed Size (px)
Citation preview

Available online at www.sciencedirect.com
www.elsevier.com/locate/ympev
Molecular Phylogenetics and Evolution 47 (2008) 506–522
Reticulate evolution in the natural range of the invasive wetlandtree species Melaleuca quinquenervia
Lyn G. Cook a,b,*, David C. Morris a, Robert D. Edwards a,b, Michael D. Crisp a
a School of Botany and Zoology, The Australian National University, Canberra, ACT 0200, Australiab School of Integrative Biology, The University of Queensland, Brisbane, Qld 4072, Australia
Received 5 April 2007; revised 21 January 2008; accepted 14 February 2008Available online 4 March 2008
Abstract
The Melaleuca leucadendra complex (broad-leaf paperbarks; Myrtaceae) is a dominant component of the tropical and sub-tropicalbiota of Australia, particularly in wetlands of high conservation significance. In Florida and other parts of the Americas, however,one member of the group (Melaleuca quinquenervia) is a serious ecological and economic weed. Understanding the relationships and evo-lution of the group is integral to both conservation and biocontrol efforts. Although the complex is currently considered to include up to14 species, there has been some concern over taxonomic boundaries within the complex because most species are circumscribed only bycombinations of characters, each of which also occurs in other species. Here, DNA sequence data derived from the chloroplast and twonuclear regions are used to explore the relationships of M. quinquenervia. We find little evidence for clear species boundaries within theM. leucadendra complex in general, with regional sharing of chloroplast haplotypes across morphologically defined taxa, indicatingasymmetrical introgression or retention of ancestral haplotypes (lineage sorting). Phylogenies were further confounded by the recoveryof multiple copies of both nuclear regions sequenced (ITS and rpb2) from many individuals. There was no clear evidence of polyploidy orpseudogenes, but multiple duplications of rpb2 could not be ruled out. Parsimony networks of the nuclear ITS region show some clus-tering of haplotypes by morphospecies but there is also evidence of both hybridisation and recombination. Signals of introgression werealso evident in rpb2, supporting an hypothesis of recent or ongoing gene flow between M. quinquenervia and other members of the M.
leucadendra complex. Both relaxed and fixed molecular-clock dating estimate the introgression to have occurred sometime within the pastseven million years (95% CI: 0.7–18). The New Caledonian population of M. quinquenervia appears to have been established by dispersalfrom Australia during this period. M. quinquenervia is found to have alleles closely related to multiple different morphotaxa within the M.
leucadendra complex, suggesting considerable past introgression into this taxon from some other members of the M. leucadendra com-plex, and this has implications for biocontrol efforts. The M. leucadendra complex appears to reflect early to intermediate stages of spe-ciation, possibly driven by different ecologies.� 2008 Elsevier Inc. All rights reserved.
Keywords: Long-distance dispersal; Introgression; Recombination; Melaleuca quinquenervia; Speciation; Biocontrol
1. Introduction
Species of the Melaleuca leucadendra complex (broad-leaf paperbarks, Myrtaceae) are dominant trees of the Aus-tralian tropics and subtropics, often forming dense thickets
1055-7903/$ - see front matter � 2008 Elsevier Inc. All rights reserved.
doi:10.1016/j.ympev.2008.02.012
* Corresponding author. Address: School of Integrative Biology, TheUniversity of Queensland, Brisbane, Qld 4072, Australia. Fax: +61 7 33651655.
E-mail address: [email protected] (L.G. Cook).
or forests (Barlow, 1988). Typically, they occupy sites sub-ject to flooding, unlike the eucalypt that dominate the drierparts the landscape, although some taxa of the M. leuca-
dendra complex also occur in dry woodlands. All 14 recog-nized species of the M. leucadendra complex occurnaturally in northern Australia but Melaleuca quinquener-
via extends south along the east coast to Sydney (34 degS) and also occurs in New Caledonia. Four species extendnorth to the Malesian archipelago and one of these (M.
cajuputi) also occurs on the south-east Asian mainland. It

L.G. Cook et al. / Molecular Phylogenetics and Evolution 47 (2008) 506–522 507
has been suggested that this group originated in Gondwanaand spread north and east from about 15 Myr ago, afterthe Australian craton had rafted into proximity with Asia(Barlow, 1988).
The complex is significant ecologically because it dom-inates extensive seasonal wetlands, as well as riverine gal-lery forests and the margins of rainforests (Barlow, 1988;Boland et al., 1984; Franklin et al., 2007). These wetlandsare valued highly for their ecological and economic func-tions and are recognized internationally for their conser-vation significance (Douglas et al., 2005; Whiteheadet al., 1990). Unfortunately, following introduction asan ornamental tree, M. quinquenervia has escaped tobecome a major invasive weed of wetlands in the Ameri-cas, including the USA (Florida, Hawaii, Louisiana,Texas and California) and Puerto Rico (Dray et al.,2006; Pratt et al., 2005; Serbesoff-King, 2003). The Flor-ida populations appear to have resulted from at least 10separate introductions (Serbesoff-King, 2003) and displayconsiderable genetic differentiation in allozymes (Drayet al., 2004). In addition, the populations on the GulfCoast differ from those on the Atlantic coast in essen-tial-oil chemotypes (Dray et al., 2004). The two chemo-types match those described previously (Ireland et al.,2002) for M. quinquenervia in Australia. The chemotypesdifferentially affect performance of the weevil (Oxyops viti-
osa) that is used as a biocontrol agent in Florida (Drayet al., 2004; Wheeler, 2006), but not that of the gall-induc-ing fly/nematode mutualists (Fergusonina and Fergusobia)(Giblin-Davis et al., 2005) that are also under consider-ation for biocontrol.
The flies/nematodes are putatively host-specific acrossseven species sampled from the M. leucadendra group(Davies and Giblin-Davis, 2004; Scheffer et al., 2004),though two species of Fergusonina are found on M. nerv-
osa, and two cryptic species are found within F. turneri,one each on M. quinquenervia and M. fluviatilis. BecauseF. turneri is being considered as a biocontrol agent forM. quinquenervia in Florida, it is critical that the patternof relationships within and among the flies, nematodesand their hosts be well understood (Scheffer et al., 2004).
The M. leucadendra complex has been a longstandingproblem for taxonomists, who have made a series ofattempts at classification. The group has no known diag-nostic character (morphological synapomorphy) but iscommonly called the broad-leaf paperbarks because mostmembers have these two attributes. However, this combi-nation of characters is not restricted to this group. Simi-larly, species are currently recognized on the basis ofcombinations of characters that, overall, represent a nearlycontinuous distribution across the complex. Not surpris-ingly, therefore, species concepts have varied from a singlepolymorphic species (Bentham, 1868) through to the 14taxa recognized today: M. arcana, M. argentea, M. cajup-uti, M. clarksonii, M. dealbata, M. fluviatilis, M. leucaden-
dra, M. nervosa, M. quinquenervia, M. sericea, M. saligna,
M. stenostachya, M. triumphalis and M. viridiflora (Barlow,
1988; Blake, 1968; Byrnes, 1986; Craven, 1998; Craven andBarlow, 1997). Given the lack of clear synapomorphies andthe sympatry of many of the species, a history of hybridisa-tion and/or recombination in genes might be expected,despite the paucity of reports in previous literature. Onlyone previous phylogenetic study has included multiple spe-cies from the M. leucadendra complex (Brown et al., 2001),but only one specimen of each of nine morphospecies wasrepresented in the consensus tree.
Here, DNA sequence data are used to investigate theevolution of the M. leucadendra complex with a view tobetter understanding relationships and species boundarieswithin this ecologically and economically important group.Species boundaries, particularly as they relate to M. quin-quenervia, are investigated by including multiple samples.Two regions of the chloroplast genome (ndhF and psbA-
trnH) and two from the nuclear genome (rpb2 and nrDNAITS) were sequenced to provide comparisons among mark-ers having different patterns of inheritance. The chloroplastis matrilineally inherited in all Myrtaceae studied to date(Byrne et al., 1993; McKinnon et al., 2001), and thereforecontrasting phylogeographic patterns between chloroplastand nuclear markers may help elucidate differences in seedand pollen dispersal. If there has been a history of hybrid-isation, we could expect conflicting patterns among nucleargene trees and, possibly, evidence of recombination amongdivergent alleles, such as that reported for eucalypts (Pokeet al., 2006). If directional introgression has occurred viaasymmetric flow of pollen, we might expect regional shar-ing of chloroplast haplotypes across morphospecies, asshown in eucalypts (McKinnon et al., 2001), sunflowers(Rieseberg and Soltis, 1991), Phlomis (Albaladejo et al.,2005) and oaks (Petit et al., 2004), but well-defined speciesusing nuclear markers.
The two nuclear DNA regions used (rpb2 and ITS) havedifferent patterns of evolution. The ITS regions occur aspart of the nuclear rDNA arrays and therefore occur inhighly repeated tandem arrays (Long and Dawid, 1980)that are easy to amplify using universal primers. Also, theyare thought to be rapidly homogenized by concerted evolu-tion (Dover, 1982; Liao, 1999). The ITS regions are non-coding but are transcribed, with their correct excision fromflanking rRNA dependent on the secondary structure theyeach form (Alvarez and Wendel, 2003; Lalev et al., 2000).Thus, there is selection for conservation of folding struc-ture of ITS (Schultz et al., 2005) but mutations areexpected to be neutral with respect to phenotype of theorganism (Alvarez and Wendel, 2003). The 5.8S rRNA-encoding region between ITS1 and ITS2 is highly con-served in sequence and secondary structure.
While several problems have been recognized for analy-ses using ITS sequences, such as multiple copies and loci,lineage sorting, pseudogenes and recombination amongcopies (Alvarez and Wendel, 2003; Bailey et al., 2003; Bay-ly and Ladiges, 2007; Buckler et al., 1997; Feliner and Ros-sello, 2007; Mayol and Rossello, 2001), these may not differqualitatively from other DNA regions that are not yet as

508 L.G. Cook et al. / Molecular Phylogenetics and Evolution 47 (2008) 506–522
well characterised, such as rpb2 (Oxelman et al., 2004; Pfeilet al., 2004).
In contrast to ITS, rpb2 is a low-copy protein-codinggene. Typically, it is present in angiosperms at a singlelocus but gene duplication, and secondary loss of para-logues, is not uncommon (e.g. Oxelman et al., 2004; Pfeilet al., 2004; Popp et al., 2005). Because it is protein-coding,its pattern of nucleotide substitutions is expected to be dif-ferent from that of ITS. The region sequenced here alsocontains several introns that are expected to exhibit a fasterrate of mutation and a different pattern of substitutionsfrom the exons.
2. Material and methods
2.1. DNA extraction and PCR
To test monophyly of the M. leucadendra complex, ndhF
(cpDNA) was sampled from 26 described species of Melal-
euca from across the genus. Sampling included M. acacio-
ides, which has been regarded as closely related to the M.
leucadendra group but is currently thought to be distinct(Barlow, 1987; Byrnes, 1984; Craven and Barlow, 1997).Sequences for 13 other Myrtaceae taxa were obtained fromGenBank for use as outgroups (Table 1), and Xanthoste-
mon chrysanthus was sequenced to provide a root for anal-yses based on its position in analyses of the whole ofMyrtaceae (Sytsma et al., 2004; Wilson et al., 2005).DNA for nine specimens (Table 1) that had been used inprevious studies was kindly provided by Brown and Ladi-ges (The University of Melbourne) and two ITS sequencesobtained from specimens of M. quinquenervia from Floridawere provided by John Gaskin (USDA). Additional geno-mic DNA was extracted from fresh or silica gel-preservedleaf material using a DNeasy plant mini kit (Qiagen) fol-lowing the manufacturer’s instructions.
Four DNA regions were amplified (maximum of2881 bp) for seven species sampled across the Australian-New Caledonian range of the M. leucadendra complex(Fig. 1 and Table 1) and three outgroup taxa using primersshown in Table 2. These comprised two regions from thechloroplast (psbA-trnH and partial ndhF), and two fromthe nucleus (ITS and rpb2). All PCRs were carried out ina 25 ll volume with 2 mM MgCl2 and using 0.8 U of Plat-inum Taq (Invitrogen) (non-proof reading). A standardPCR cycling protocol was followed with an annealing tem-perature of 55 �C. A nested PCR approach was used foramplification of ndhF and rpb2. For ndhF, the initial ampli-fication used primers 748F and mel-r1 (Table 2). Two sub-sequent PCRs were performed using this product as thetemplate, with primer pairs 748F + 1318r and1252f + mel-r1. For rpb2, the initial PCR used primersP7F and P10R. The resultant product was then used asthe template in a second PCR using primers ex19f andex22r.
Fragments were sequenced in both directions using ABIBig-Dye chemistry on an ABI Prism 3100 genetic analyser
(Applied Biosystems). DNA sequences were edited usingSequencher v4.5 (GeneCodes) and aligned by eye in Se-Al (Rambaut, 1996).
2.2. Isolation of multiple copies of nuclear DNA regions
After initial direct sequencing, PCR products that dis-played polymorphisms were excised from a 2% TAE-aga-rose gel and purified using a BRESAclean DNApurification kit (GeneWorks) following the manufacturer’sinstructions. Fragments were then cloned using the pGEM-T Vector System II (Promega) following the protocol sug-gested by the manufacturer. We sequenced from betweenfive and 12 clones for each PCR product.
We took a conservative approach so that we erredtowards underestimating the level of variation within indi-viduals rather than overestimation. To identify possibleTaq errors, each sequence obtained through cloning wascompared with the sequence obtained directly from the ori-ginal PCR product (the ‘parental’ sequence). Taq error(Saiki et al., 1988) during PCR has the potential to leadto overestimates of genetic diversity, particularly at thepopulation level where there are typically few nucleotidesubstitutions among and within individuals. Because weperceived the variation found among cloned sequences tobe very high, we performed a set of experiments to deter-mine whether some of the variation could be explainedby Taq error, rather than variation within the individualspecimen. As a control, we used the PCR product ofpsbA-trnH (a cpDNA region) from one of the specimensunder study (GB leu). As expected of a haploid organelle,there was no polymorphism detected upon direct sequenc-ing of the original PCR product. We then cloned the PCRproduct using the same protocol used for the nuclear-encoded regions, and re-amplified and sequenced the frag-ment from six separate colonies.
In subsequent analyses of the nuclear-encoded regions,substitutions in a clone that were not detectable in the‘parental’ sequence were treated as sequencing errors intro-duced through Taq amplification. We then determined theminimum number of clones needed to explain the polymor-phism in the ‘parental’ sequence and included only thosesequences in subsequent analyses. This is a conservativeapproach because some real alleles may not be detected iftheir copy number is too low to be seen in the ‘parental’sequence.
To confirm the observed sequence variation within sometaxa, a second sample of DNA was extracted from the vou-cher specimen, amplified and sequenced (taxa indicated inTable 2). In addition, two separate amplifications andsequencing were performed for 15 PCRs (Table 1) to assessthe unexpected phylogenetic placement of severalsequences, or their conflict with other DNA regions fromthe same specimen. This also allowed us to assess whetherTaq error could explain some of the polymorphism in‘parental’ sequences. If the same polymorphisms appeared
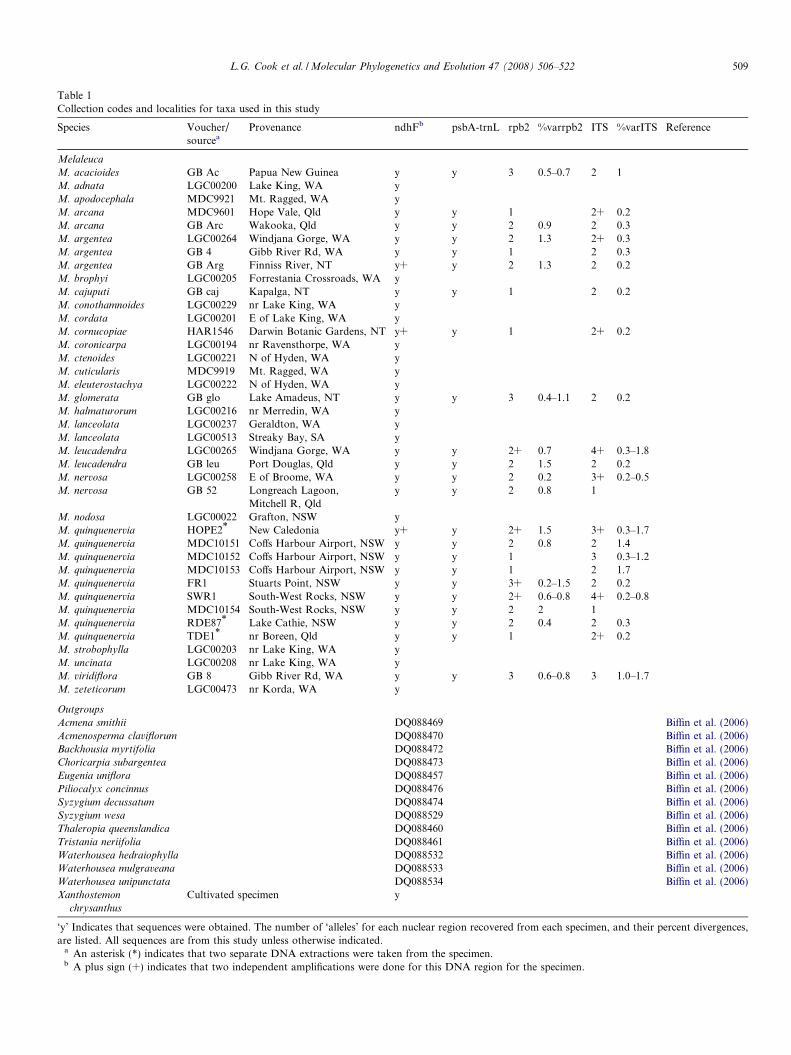
Table 1Collection codes and localities for taxa used in this study
Species Voucher/sourcea
Provenance ndhFb psbA-trnL rpb2 %varrpb2 ITS %varITS Reference
Melaleuca
M. acacioides GB Ac Papua New Guinea y y 3 0.5–0.7 2 1M. adnata LGC00200 Lake King, WA yM. apodocephala MDC9921 Mt. Ragged, WA yM. arcana MDC9601 Hope Vale, Qld y y 1 2+ 0.2M. arcana GB Arc Wakooka, Qld y y 2 0.9 2 0.3M. argentea LGC00264 Windjana Gorge, WA y y 2 1.3 2+ 0.3M. argentea GB 4 Gibb River Rd, WA y y 1 2 0.3M. argentea GB Arg Finniss River, NT y+ y 2 1.3 2 0.2M. brophyi LGC00205 Forrestania Crossroads, WA yM. cajuputi GB caj Kapalga, NT y y 1 2 0.2M. conothamnoides LGC00229 nr Lake King, WA yM. cordata LGC00201 E of Lake King, WA yM. cornucopiae HAR1546 Darwin Botanic Gardens, NT y+ y 1 2+ 0.2M. coronicarpa LGC00194 nr Ravensthorpe, WA yM. ctenoides LGC00221 N of Hyden, WA yM. cuticularis MDC9919 Mt. Ragged, WA yM. eleuterostachya LGC00222 N of Hyden, WA yM. glomerata GB glo Lake Amadeus, NT y y 3 0.4–1.1 2 0.2M. halmaturorum LGC00216 nr Merredin, WA yM. lanceolata LGC00237 Geraldton, WA yM. lanceolata LGC00513 Streaky Bay, SA yM. leucadendra LGC00265 Windjana Gorge, WA y y 2+ 0.7 4+ 0.3–1.8M. leucadendra GB leu Port Douglas, Qld y y 2 1.5 2 0.2M. nervosa LGC00258 E of Broome, WA y y 2 0.2 3+ 0.2–0.5M. nervosa GB 52 Longreach Lagoon,
Mitchell R, Qldy y 2 0.8 1
M. nodosa LGC00022 Grafton, NSW yM. quinquenervia HOPE2* New Caledonia y+ y 2+ 1.5 3+ 0.3–1.7M. quinquenervia MDC10151 Coffs Harbour Airport, NSW y y 2 0.8 2 1.4M. quinquenervia MDC10152 Coffs Harbour Airport, NSW y y 1 3 0.3–1.2M. quinquenervia MDC10153 Coffs Harbour Airport, NSW y y 1 2 1.7M. quinquenervia FR1 Stuarts Point, NSW y y 3+ 0.2–1.5 2 0.2M. quinquenervia SWR1 South-West Rocks, NSW y y 2+ 0.6–0.8 4+ 0.2–0.8M. quinquenervia MDC10154 South-West Rocks, NSW y y 2 2 1M. quinquenervia RDE87* Lake Cathie, NSW y y 2 0.4 2 0.3M. quinquenervia TDE1* nr Boreen, Qld y y 1 2+ 0.2M. strobophylla LGC00203 nr Lake King, WA yM. uncinata LGC00208 nr Lake King, WA yM. viridiflora GB 8 Gibb River Rd, WA y y 3 0.6–0.8 3 1.0–1.7M. zeteticorum LGC00473 nr Korda, WA y
Outgroups
Acmena smithii DQ088469 Biffin et al. (2006)Acmenosperma claviflorum DQ088470 Biffin et al. (2006)Backhousia myrtifolia DQ088472 Biffin et al. (2006)Choricarpia subargentea DQ088473 Biffin et al. (2006)Eugenia uniflora DQ088457 Biffin et al. (2006)Piliocalyx concinnus DQ088476 Biffin et al. (2006)Syzygium decussatum DQ088474 Biffin et al. (2006)Syzygium wesa DQ088529 Biffin et al. (2006)Thaleropia queenslandica DQ088460 Biffin et al. (2006)Tristania neriifolia DQ088461 Biffin et al. (2006)Waterhousea hedraiophylla DQ088532 Biffin et al. (2006)Waterhousea mulgraveana DQ088533 Biffin et al. (2006)Waterhousea unipunctata DQ088534 Biffin et al. (2006)Xanthostemon
chrysanthus
Cultivated specimen y
‘y’ Indicates that sequences were obtained. The number of ‘alleles’ for each nuclear region recovered from each specimen, and their percent divergences,are listed. All sequences are from this study unless otherwise indicated.
a An asterisk (*) indicates that two separate DNA extractions were taken from the specimen.b A plus sign (+) indicates that two independent amplifications were done for this DNA region for the specimen.
L.G. Cook et al. / Molecular Phylogenetics and Evolution 47 (2008) 506–522 509
500 km
Mq_HOPE2
Mq_TDE1
Mq_MDC10151Mq_MDC10152Mq_MDC10153
Mq_MDC10154Mq_SWR1
Mq_FR1
Marg_GBargMc_GBcaj
Marg_LGC00264Ml_LGC00265
Mn_LGC00258
Mn_GB52 Ml_GBleuMv_GB8Marg_GB4
Marc_MDC9601Marc_GBarc
Mq_RDE87
WA
NTQld
NSW
New Caledonia
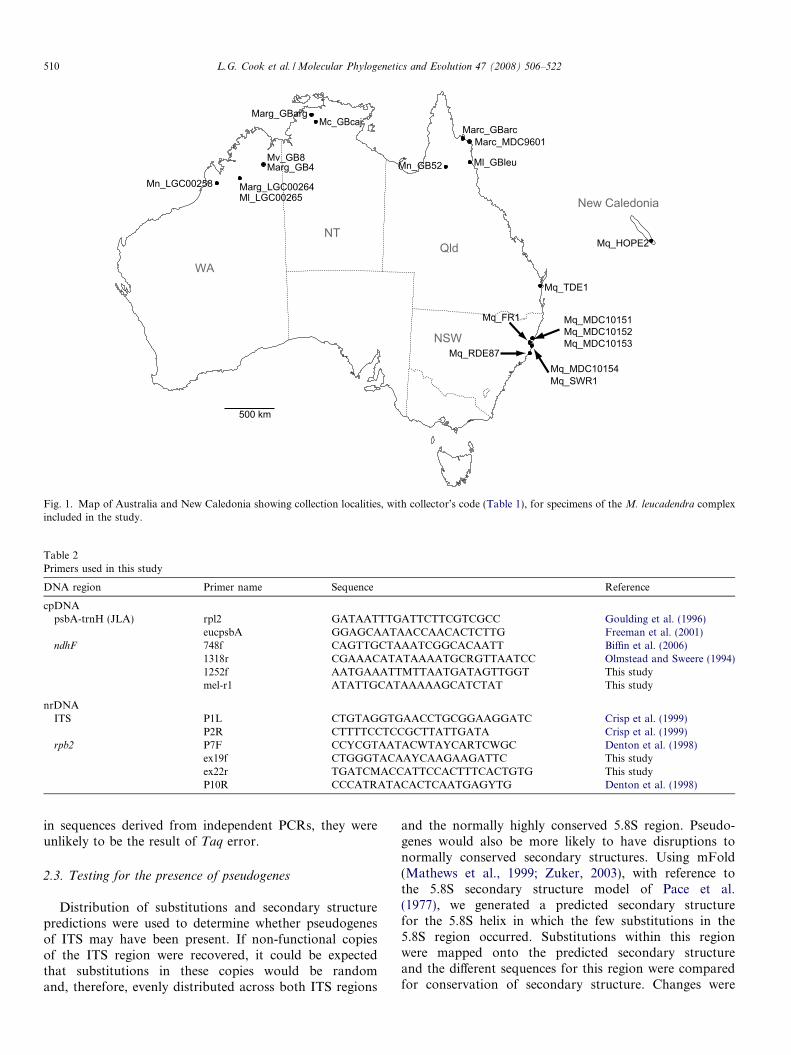
Fig. 1. Map of Australia and New Caledonia showing collection localities, with collector’s code (Table 1), for specimens of the M. leucadendra complexincluded in the study.
Table 2Primers used in this study
DNA region Primer name Sequence Reference
cpDNApsbA-trnH (JLA) rpl2 GATAATTTGATTCTTCGTCGCC Goulding et al. (1996)
eucpsbA GGAGCAATAACCAACACTCTTG Freeman et al. (2001)ndhF 748f CAGTTGCTAAATCGGCACAATT Biffin et al. (2006)
1318r CGAAACATATAAAATGCRGTTAATCC Olmstead and Sweere (1994)1252f AATGAAATTMTTAATGATAGTTGGT This studymel-r1 ATATTGCATAAAAAGCATCTAT This study
nrDNAITS P1L CTGTAGGTGAACCTGCGGAAGGATC Crisp et al. (1999)
P2R CTTTTCCTCCGCTTATTGATA Crisp et al. (1999)rpb2 P7F CCYCGTAATACWTAYCARTCWGC Denton et al. (1998)
ex19f CTGGGTACAAYCAAGAAGATTC This studyex22r TGATCMACCATTCCACTTTCACTGTG This studyP10R CCCATRATACACTCAATGAGYTG Denton et al. (1998)
510 L.G. Cook et al. / Molecular Phylogenetics and Evolution 47 (2008) 506–522
in sequences derived from independent PCRs, they wereunlikely to be the result of Taq error.
2.3. Testing for the presence of pseudogenes
Distribution of substitutions and secondary structurepredictions were used to determine whether pseudogenesof ITS may have been present. If non-functional copiesof the ITS region were recovered, it could be expectedthat substitutions in these copies would be randomand, therefore, evenly distributed across both ITS regions
and the normally highly conserved 5.8S region. Pseudo-genes would also be more likely to have disruptions tonormally conserved secondary structures. Using mFold(Mathews et al., 1999; Zuker, 2003), with reference tothe 5.8S secondary structure model of Pace et al.(1977), we generated a predicted secondary structurefor the 5.8S helix in which the few substitutions in the5.8S region occurred. Substitutions within this regionwere mapped onto the predicted secondary structureand the different sequences for this region were comparedfor conservation of secondary structure. Changes were

L.G. Cook et al. / Molecular Phylogenetics and Evolution 47 (2008) 506–522 511
interpreted to be neutral, and therefore not indicative ofpseudogenes, if the predicted secondary structure of 5.8Swas unchanged. In addition, conservation in sequenceand secondary structure of the conserved angiospermmotifs of ITS and 5.8S (summarised in Feliner and Ros-sello, 2007), such as the ITS1 motif GGCRY-(4–7 N)-GYGYCAAGGAA (Liu and Schardl, 1994), werechecked.
The intron/exon boundaries of rpb2 were identified andthe exons were translated to amino acid sequence to assessthe level of substitutions and to check for the presence ofstop codons or high levels of non-synonymous substitu-tions. The ndhF sequences were also translated to checkfor stop codons or anomalous rates of non-synonymoussubstitutions.
2.4. Phylogenetic placement of the broad-leaf paperbarks
and timing of the crown group radiation
Bayesian analysis was conducted using MrBayes v3.1.2(Ronquist and Huelsenbeck, 2003) for the whole of theMelaleuca (plus outgroups) ndhF dataset allowing aGTR + I + G model of substitutions for each codon posi-tion. Chains were run for two million generations andchecked for convergence. Trees obtained during the burn-in period (determined to be 400,000 generations) were dis-carded, leaving 6402 post-burn-in trees. The consensus treewas rooted using X. chrysanthus.
Relaxed molecular-clock dating (Rutschmann, 2006)was used to estimate the timing of the radiation ofthe crown group of the M. leucadendra complex. Themajority rule consensus phylogeny from the MrBayesanalysis of the full ndhF data set was rate-smoothedto produce a chronogram in which branch lengths areproportional to time. This was done using Bayesianinference in Multidivtime (Thorne and Kishino, 2002)and penalized likelihood (PL) in r8s (Sanderson, 2003).In the absence of any well-dated fossil that could beplaced within the ingroup, the relaxed clock was cali-brated by setting the divergence between Melaleuca
and Tristania at 75 ± 5 Ma, as estimated by Sytsmaet al. (2004).
2.5. Relationships within the broad-leaf paperbarks
Alignments of rpb2 introns, psbA-trnH and ITS eachrequired inferences of indels. These were scored as binaryunordered characters for inclusion in analyses using maxi-mum parsimony (MP) (PAUP*, Swofford, 2002). Boot-strap analyses were carried out using 1000pseudoreplicates and with the same parameters as the ori-ginal MP search. We also conducted statistical parsimonyanalysis using TCS v1.21 (Clement et al., 2000), again withindels coded, to construct parsimony networks.
Analysis of molecular variance (AMOVA, Excoffieret al., 1992) was performed using GenAlEx (Peakall andSmouse, 2006) to assess the partitioning of variance
within and between geographic regions. The sequenceswere treated as haplotypes and coded alternatively withtwo different genetic distance metrics for input toAMOVA. The first metric is a multi-locus distance thattakes into account the degree of difference between hapl-otypes. Each variable site in the sequence was treatedanalogously to a restriction-site locus (Excoffier et al.,1992) and Euclidean distances calculated from the differ-ences between haplotypes across all sites. The second dis-tance metric simply treats each distinct haplotype as adifferent ‘allele’ at a single locus; that is, the haplotypesare treated only as ‘different’ and the degree of differencebetween haplotypes is not taken into account (Peakall andSmouse, 2006).
For comparison with the relaxed molecular-clock datesobtained using the large ndhF dataset, we applied the strictmolecular clock for plant nuclear protein-encoding genes(Gaut, 1998) to the rpb2 exons-only dataset. The formulais T = K/2r, where K = pair-wise divergence and r is therate for nuclear genes (2.6 � 10�9 substitutions/site/Myrfor long generation times and 1.5 � 10�8 for fast genera-tion times). We used the maximum pair-wise divergencewithin the M. leucadendra complex, and the rate for plantswith slow generation times because the broad-leaf paper-barks are long-lived trees. A similar calculation was madefrom the ITS data using the median molecular-clock ratefor ITS of 2 � 10�9 for woody perennials of Kay et al.(2006).
2.6. Conflicting phylogenetic signals?
We conducted tests of congruence before combiningdata from different loci, and to assess conflict betweendifferent partitions of the one DNA region. We usedthe partition homogeneity test (PHT or ILD) as imple-mented in PAUP* for the two cpDNA loci, with parsi-mony-uninformative sites excluded (see Lee, 2001). 100replicates were performed using five random additionstarting sequences and saving no more than five treesat each step. We tested several partitions of rpb2: exonsversus introns, between introns, and positions up to theend of exon 20 versus from exon 21 onwards. BecauseITS1 and ITS2 form independent secondary structures,we had an a priori reason to treat them as potentiallyindependent regions. We therefore performed an ILDtest on the ITS1 and ITS2 partitions, with the 5.8Sregion and parsimony-uninformative positions excluded.Maximum likelihood trees were generated for each datapartition (ITS1 and ITS2) using a TrNef + G model ofnucleotide substitution, with parameters estimated inModeltest (Posada and Crandall, 1998). The two treeswere then tested against each data partition using theShimodaira–Hasegawa (SH) test (Shimodaira and Hase-gawa, 1999) as implemented in PAUP* with the RELLoptimization option and 5000 bootstrap replicates. Wealso visually compared the ITS1 and ITS2 parsimonynetworks derived from TCS and MP analysis.

512 L.G. Cook et al. / Molecular Phylogenetics and Evolution 47 (2008) 506–522
2.7. Has there been recombination in nrDNA?
We explored the data to determine whether conflictingphylogenetic signals within DNA regions were the resultof recombination. First, we used SISCAN (Gibbs et al.,2000, with modifications by Mathieu Fourment,unpubl.), which uses a sliding window approach (withrooting) to identify sequence groupings that displaypotential phylogenetic conflict along their lengths. Weused a window width of 200 bp for ITS and a slide of50 bp. Analyses of rpb2 also used a 50 bp slide but a100 bp window. We also used a novel method to com-pare pairs of sequences. The absolute pair-wise differ-ences for both ITS1 and ITS2 for a pair of sequenceswere output to file, one subtracted from the other andthe sign made positive. The pairs of taxa were thenordered by their difference. Sequences that are similarin both ITS1 and ITS2 would finish with a low score(e.g. 2 � 1 = 1), as would those that are very differentin both regions (e.g. 20 � 19 = 1). Pairs that were similarin one region (e.g. ITS1) but different in the other region(i.e. ITS2) would score highly (e.g. 19 � 1 = 18). The lat-ter could indicate that a recombination event hadoccurred between the two regions. All sequences thatscored highly in either method were visually comparedand their respective placements in haplotype networksfor each partition were checked.
3. Results
All new sequences have been deposited in GenBank(Accession Nos. EU410083–EU4100242).
3.1. PCR and amplification errors
Polymorphisms in directly sequenced products were notattributable to differences between PCRs. IndependentDNA extractions from the one individual each resulted inthe same sequence, including any polymorphisms, andsequences derived from a second independent PCR fromthe same genomic DNA also resulted in sequences identicalto those from the original PCR. These results indicate thatthe use of the ‘parental’ sequence was a sound basis forassessment of actual polymorphisms.
However, there were many polymorphisms found incloned sequences that were not observed in the directlysequenced products for both ITS and rpb2. The cloning testof the control cpDNA sequence, which should not havepolymorphisms because it is derived from a haploid gen-ome, supported an inference of error introduced duringPCR (Taq error). Of the six clones sequenced for 440 bpof psbA-trnH, four had the same sequence as the original‘parental’ product, one differed by a single nucleotide dele-tion and the other had that same deletion plus an addi-tional two substitutions. These mutations were notdetectable, even at low frequency, in the ‘parental’sequence.
3.2. Phylogenetic placement of the broad-leaf paperbarks
and molecular dating
In the Bayesian analysis of the ndhF data, the M. leuca-
dendra complex was strongly supported as monophyletic(PP = 1.0) and sister to M. acacioides with strong support(PP = 1.0). This tropical group was nested within a well-supported clade (PP = 1.0) comprising taxa from south-western Australia (e.g. M. brophyi and the broombushcomplex: M. uncinata and M. zeteticorum), eastern Austra-lia (M. nodosa), central Australia (M. glomerata) and trop-ical Australia (M. cornucopiae) (Fig. 2). This large clade isone of three well-supported sister taxa forming a basalpolytomy in Melaleuca sens. lat.
3.3. Evolution within the broad-leaf paperbarks
3.3.1. cpDNA
There was no supported conflict between ndhF andpsbA-trnH (ILD test; p = 0.87), as expected for parts ofthe one linkage group. Accordingly, the two regions werecombined in all further analyses. There were 18 variablepositions in the cpDNA dataset for the M. leucadendracomplex (15 parsimony-informative), with the majority inthe psbA-trnH partition (Table 2). The 20 specimens, repre-senting seven described species from across more than4000 km (Fig. 1), exhibited only nine cpDNA haplotypes.In phylogenetic analyses, haplotypes from currently recog-nized morphospecies did not cluster together to the exclu-sion of individuals of other species. Instead, the MPphylogram (Fig. S1 in supplementary data) and parsimonynetwork (Fig. 3) showed a strong clustering of haplotypesby geographic region. All specimens originating fromnorth-west Western Australia clustered together. Most ofthe north-eastern specimens clustered together, with theindividual of M. quinquenervia from New Caledonia shar-ing a haplotype with M. quinquenervia and M. leucadendra
from Queensland, and with M. argentea from the NorthernTerritory. All south-eastern (NSW) specimens of M. quin-quenervia shared the same haplotype. The primary excep-tion to the geographic clustering was the Queenslandspecimen of M. nervosa, which clustered with the WesternAustralian collections. This cluster included the only otherspecimen of M. nervosa sampled.
The regional clustering was confirmed by AMOVA,where geographic region explained a significant proportionof the variance (p 6 0.01), regardless of the method usedfor coding haplotypes. There was sharing of haplotypesacross morphospecies, with M. quinquenervia and M. leuca-
dendra from Queensland sharing a haplotype with M.
argentea from the Northern Territory, and M. argentea
and M. leucadendra from Western Australia sharing ahaplotype.
Using a relaxed molecular clock with the ndhF data, theage of the crown group of the M. leucadendra complex(with 95% CI) was estimated to be: 5.0 (4.6–5.7) Myr(PL, optimal squared error smoothing parameter = 3);

1.0
1.0
0.820.91
1.0
1.0
1.00.98
1.0
0.99
1.0
0.68
0.98
1.0
1.0
1.00.59
0.95
1.0
1.01.0
0.89
1.0
010203040506070Myr ago
Syzygium smithiiS. concinnumS. hedraiophyllumS. mulgraveanumS. unipunctatumS. claviflorumS. decussatumS. wesaEugenia unifloraBackhousia myrtifoliaChoricarpia subargenteaThaleropia queenslandicaTristania neriifoliaMelaleuca acacioidesM. arcana GBarcM. arcana MDC9601M. argentea GBargM. leucadendra GBleuM. quinquenervia Hope2M. quinquenervia TDE1M. cajuputi GBcajM. quinquenervia RDE87M. quinquenervia FR1M. quinquenervia SWR1M. quinquenervia MDC10151M. quinquenervia MDC10152M. quinquenervia MDC10153M. quinquenervia MDC10154M. argentea GB4M. argentea LGC00264M. leucadendra LGC00265M. nervosa LGC00258M. nervosa GB52M. viridiflora GB8M. conothamnoidesM. cordataM. cornucopiaeM. glomerataM. nodosaM. uncinataM. zeteticorumM. brophyiM. adnataM. eleuterostachyaM. coronicarpaM. lanceolataM. lanceolataM. apodocephalaM. ctenoidesM. cuticularisM. halmaturorumM. strobophylla
M. leucadendra com
plex
1.0
0.98
0.99
0.97
0.96
1.0
1.0
Fig. 2. Chronogram showing relationships and estimated divergence times in the M. leucadendra complex, the rest of Melaleuca and Myrtaceae, in part.The topology is a majority rule consensus from a MCMC search using ndhF data and a GTR+I+G model in MrBayes. Branch lengths were estimatedusing an F84 model and smoothed using a relaxed molecular clock as implemented in Multidivtime. Support values at nodes are posterior probabilitiesand error bars represent the standard deviation of the estimates of the node ages. The outgroup (Xanthostemon) was deleted during rate smoothing.
L.G. Cook et al. / Molecular Phylogenetics and Evolution 47 (2008) 506–522 513
6.7 (6.4–7.7) Myr (PL, optimal chi-squared error smooth-ing parameter = 100); and 5.8 (0.7–18.0) Myr (Multidiv-time) (Table 3).
3.3.2. rpb2
More than one sequence of rpb2 was recovered fromeach of 16 of the 23 individuals sampled (including out-groups) with up to three different copies being present insome (Table 1 and Fig. 4A). There was up to 6% divergenceacross haplotypes of the M. leucadendra complex, and upto 2% divergence among copies from a single individual(Mq10154, Table 1). There was no evidence of non-func-tional copies being amplified: there were no stop codonsin exons, intron/exon boundaries were intact, and all sub-
stitutions were silent with the inferred amino acid sequenceidentical across all haplotypes from all specimens.
The multiple sequences of rpb2 within each of the out-group species M. cornucopiae, M. acacioides and M. glom-
erata coalesced within each taxon (each represented onlyby a single individual) (Supplementary Fig. S2). However,haplotypes within the M. leucadendra complex did notclearly cluster by individual, morphospecies, or geographicregion. The parsimony network of rpb2 showed someclosed connections, suggesting that there may have beenreticulation among some sequences. However, ILD testsdid not detect significant conflict between the signal derivedfrom exons versus introns (p = 0.40), between introns(p = 0.26), or when the region was divided in two (between

V
Mn.LGC00258Mn.GB52
Mv.GB8
Ml.LGC00265
Marg.LGC00264
Marg.GB4
Mq.MDC10151
Mq.MDC10152
Mq.MDC10153
Mq.RDE87
Mq.SWR1
Mq.FR1
Mq.MDC10154
Marc.GBarc Marc.MDC9601
Mq.HOPE2
Mq.TDE1
Ml.GBleu
Mc.GBcaj
= New South Wales
= Queensland
= Western Australia
= Northern Territory
Marg.GBarg
Fig. 3. Parsimony haplotype network of combined cpDNA (ndhF and psbA-trnH). Taxa are indicated using letters and haplotypes are shaded by region oforigin. Different individuals sharing the same haplotype are grouped in blocks. Small black circles represent inferred, but unsampled, haplotypes.
Table 3Molecular date estimates for the crown age of the M. leucadendra complex
Data Method Age (Myr) CI
ndhF Bayes (Multidivtime) 5.8 0.7–18.0ndhF Penalized likelihood (r8s) (smooth = 3a) 5.0 4.6–5.7ndhF Penalized likelihood (smooth = 100b) 6.7 6.4–7.7ITS Molecular clock 6.3 narpb2 Molecular clock 3.6 na
a Optimal smoothing parameter value estimated from squared error.b Optimal smoothing parameter value estimated from chi-squared error.
514 L.G. Cook et al. / Molecular Phylogenetics and Evolution 47 (2008) 506–522
exons 20 and 21) (p = 0.25). Pair-wise comparisons of dif-ferences between taxa for different partitions of the rpb2
region did not identify any clear cases of conflict.There were multiple cases of alleles being shared across
morphospecies. However, the individuals sharing rpb2
alleles did not correspond to those sharing cpDNA haplo-types. The New Caledonian specimen of M. quinquenervia
shared an allele with one of the M. quinquenervia specimensfrom Coffs Harbour (NSW, 10153) whereas its other copywas unique. Alleles from the south-eastern collections ofM. quinquenervia were scattered across the haplotype net-work. Two M. argentea specimens, GBarg andLGC00264, had the same two different rpb2 alleles.
Using the molecular-clock method on the rpb2 data, thecrown of the M. leucadendra complex was estimated to be3.6 Myr old. The two divergent copies of rpb2 in M. quin-
quenervia MDC10154, the most divergent of all intra-indi-vidual copies, were estimated to have diverged about 2.1Myr ago. Within M. acacioides and M. quinquenervia
HOPE2, the divergences were estimated at about 1.4 Myr.
3.3.3. ITS
The ITS was the most variable of the regions used, withup to 13% divergence between haplotypes within the M.leucadendra complex. Multiple different copies of ITS wereamplified from all but two individuals sampled, with up tofour different sequences obtained from some individuals(Table 1 and Fig. 4B). There was no evidence that somecopies were derived from non-functional ribosomal clus-ters. Each conserved angiosperm motif of ITS and 5.8Swas conserved in all sequences. All variation across thebroad-leaf paperbarks was confined to the ITS1 and ITS2regions, except for three variable sites in the 5.8S rDNAregion (Fig. 5). That variation was between two M. argen-
tea populations (GBarg and GB4) and the rest of the M.
leucadendra complex. All three variable sites fell withinthe loop or bulge region of an otherwise conserved helix(Fig. 5). There was no significant correlation between thenumber of copies of ITS and rpb2 obtained per specimen(r2 = 0.0046); that is, specimens with multiple copies ofITS were not necessarily the same as those with multiplecopies of rpb2.

Fig. 4. Parsimony haplotype networks of (A) rpb2 and (B) ITS + 5.8S rDNA. Taxa are indicated using block color (yellow = M. quinquenervia, blue = M.
argentea, white = M. leucadendra, pink = M. nervosa, brown = M. arcana, green = M. viridiflora, red = M. cajuputi) and haplotypes are coded as in Table1. Some individuals are represented by more than one haplotype and different individuals sharing the same haplotype are grouped in blocks. Outlines ofblocks are color-coded by region (black = north-west Western Australia, red = Northern Territory, maroon = north-east: Queensland and NewCaledonia, blue = south-east: New South Wales). Small black circles represent inferred, but unsampled, haplotypes. The arrows indicate where the twoFlorida haplotypes fit. One is a haplotype not sampled in this study. A cluster of M. argentea haplotypes failed to attach to the remainder of the ITShaplotype network (B) and is shown separately.
L.G. Cook et al. / Molecular Phylogenetics and Evolution 47 (2008) 506–522 515
The multiple sequences of ITS coalesced within theindividual for each of M. cornucopiae, M. acacioides andM. glomerata (Supplementary Fig. S3). Within the M. leu-
cadendra complex, there was some suggestion of clusteringby morphospecies (Fig. 4B and Supplementary Fig. S3)although most such clusters included haplotypes from

Fig. 5. Distribution of substitutions in ITS and 5.8S rDNA. The threesubstitutions in 5.8S rDNA are individually arrowed, and the position ofeach is indicated in the hypothesized secondary structure model shown.
516 L.G. Cook et al. / Molecular Phylogenetics and Evolution 47 (2008) 506–522
other morphospecies. Many haplotypes from individuals ofM. quinquenervia clustered together but not all haplotypesderived from this morphospecies fell within the one cluster.
There was up to 1.8% divergence between copies of ITSfrom the one individual, with M. leucadendra (LGC00265),two specimens of M. quinquenervia (HOPE2 andMDC10153) and the M. viridiflora specimen (GB8) exhib-iting the most divergent intra-individual copies. Melaleuca
viridiflora (GB8) exhibited the most phylogenetic diversity,with the three copies recovered from it falling with threeseparate clades (Fig. 4A). The New Caledonian specimenof M. quinquenervia (HOPE2) had three copies which fellin different parts of the parsimony network. Two wereshared with other specimens of M. quinquenervia: onenorth-eastern and one south-eastern, with the latter differ-ing by only one substitution from alleles from M. cajuputi.The third copy of ITS from HOPE2 was unique. One of theITS sequences obtained from the Florida specimens wasthe same as the common M. quinquenervia copy found inNew South Wales, Queensland and New Caledonia(Fig. 4B, both Florida copies arrowed). The second copyfrom Florida was unique, but differed from a copy fromM. cajuputi and another M. quinquenervia copy by onlyone substitution. This indicates that there might be unsam-pled ITS haplotypes among the Australian populations ofM. quinquenervia.
The parsimony network of ITS (Fig. 4B) showed consid-erable reticulation. Although ILD tests for incongruencebetween ITS1 and ITS2 returned non-significant results(p = 0.10), the SH tests detected significant differencesbetween the fit of ITS1 and ITS2 ML trees to the other’sdata partition (p = 0.0014 for ITS1 partition; p = 0.0006for the ITS2 partition). In other words, there was a signif-icant difference between the fit of the tree derived from onepartition with the signal from the other partition.
Pair-wise comparisons of haplotypes revealed twoinstances where conflict between ITS regions appeared tobe the result of recombination. Both cases were in haplo-types from the one individual (M. quinquenervia
MDC10152). The two ITS regions of clone c10 from thisindividual have affinities with widely separated haplotypesin the TCS network. The ITS2 region is identical to thecommon southern haplotype of M. quinquenervia (e.g.MDC10153c8) (Fig. 6A), whereas ITS1 differs by onlyone substitution from an M. argentea haplotype (GB4clone c2), and by a different substitution from two M. leu-
cadendra haplotypes (GBleu copies 1&2). In contrast, theITS1 region of another haplotype of M. quinquenervia
MDC10152 (clone 3) is identical to the common southernM. quinquenervia haplotype, whereas ITS2 from this clonebest matches haplotype M. viridiflora GB8c6 (Fig. 6B).Thus, the whole of the common M. quinquenervia southernhaplotype (MDC10153c8) is represented in MDC10152,but as parts of two different ITS copies.
Clones from M. argentea LGC00264 and M. leucaden-
dra LGC00265 also exhibited different patterns in place-ment of ITS1 compared with ITS2. The ITS2 regionsfrom these clones were distinct from all other haplotypes,whereas the ITS1 region differed by only one or two substi-tutions from an M. nervosa haplotype and other M. leuca-
dendra and M. argentea haplotypes.Despite the reticulate pattern of haplotypes and the non-
monophyly of most morphotaxa, no ITS allele was sharedacross morphotaxa (Fig. 4B). Although haplotypes withinspecimens and within morphotaxa are sometimes more clo-sely related to haplotypes in other individuals or morpho-taxa, different morphotaxa did not share haplotypes.Furthermore, most sampled haplotypes fell on the outside(tips) of the network, with few inferred internal haplotypessampled.
4. Discussion
4.1. Phylogenetic placement of the M. leucadendra complex
The M. leucadendra complex is well supported as mono-phyletic in the large sample of Myrtaceae comprising thendhF data set (PP = 1.0; Fig. 2). This result supports thetraditional taxonomic circumscription of the group thathas been based on morphology (Barlow, 1988; Blake,1968; Byrnes, 1986; Craven, 1998; Craven and Barlow,1997), even though no morphological synapomorphy forthe group has been discovered. It also agrees with the con-catenated ITS1 plus 5S analysis of Brown et al. (2001).
4.2. Distribution of chloroplast haplotypes
The cpDNA shows a geographic pattern that cuts acrossspecies boundaries, such that samples of the same speciescluster with those of other species from the same region,rather than with conspecific samples from other regions,similar to that previously reported for Eucalyptus globulus.

Fig. 6. Recombination in ITS of Melaleuca quinquenervia MDC10152. The two putative recombinants (A and B) are shown in the middle row in eachcase. Haplotypes similar to inferred ‘parental’ sequences are shown above and below, with the region of similarity between ‘parental’ and putativerecombinant boxed. (A) The ITS1 of MqMDC10152c10 is best match with M. argentea GB4 whereas ITS2 is identical to that of a common M.
quinquenervia allele, here exemplified by MqMDC10153c8. This reconstruction infers a recombination event in the region between ITS1 and ITS2. (B)Putative recombination in another allele from MqMDC10152, with a less clear suggestion of recombination near the start of ITS2.
L.G. Cook et al. / Molecular Phylogenetics and Evolution 47 (2008) 506–522 517
Work by Jackson et al. (1999) has shown that the chloro-plast haplotypes of the subspecies of E. globulus exhibit ageographic rather than phylogenetic distribution. This isexplained by unidirectional introgression of haplotypes asa result of one species swamping another with pollen (con-taining only nuclear genes) over numerous generations.This is hypothesized eventually to produce hybrids thatcarry the chloroplast haplotype of the local species buthave most nuclear genes (and therefore the phenotype)from the pollen donor species (‘chloroplast capture’, Riese-berg and Soltis, 1991). It is suggested that this process ismost likely in cases where hybridisation is biased in favorof one species over another and maternal (seed) dispersalis limited (Petit et al., 2004). In the case of the Melaleuca
chloroplast data presented in this study, this process couldexplain the observed pattern of geographic grouping ofcpDNA haplotypes in contrast to the species boundariesindicated by morphology.
4.3. Multiple copies of nuclear genes
The polymorphisms within individuals observed for thenuclear DNA regions of most of the M. leucadendra com-plex studied here are unlikely to be the result of Taq error.The same polymorphisms were observed in sequencesderived from separate PCR reactions, including those fromindependent DNA extractions of the same sample. Werecorded only the polymorphism that was observable inthe sequences derived from direct PCR and disregardedsubstitutions that were found only in cloned copies.
There was no evidence of pseudogenes of either ITSor rpb2. There was no variation in the inferred aminoacid sequences of rpb2 across Melaleuca, there were nostop codons, and the intron/exon boundaries were intact.Pseudogenes, as reported for some Myrtaceae (Bayly andLadiges, 2007; Ochieng et al., 2007) and other organisms(e.g. Buckler et al., 1997), also do not appear to explainthe number of copies of ITS. There was little variation in5.8S rDNA despite a considerable number of substitu-tions in ITS1 and ITS2, and the variation present in5.8S was within unpaired loop regions (Fig. 5). The con-served regions of the ITS were all present and notdisrupted.
Multiple copies of ITS are not unexpected because theregion is part of the multiple tandem repeats of the nuclearrDNA arrays (Baldwin et al., 1995; Long and Dawid,1980). However, copies at a single locus typically coalescewithin a species, such as those within M. acacioides, M.
glomerata and M. cornucopiae (Supplementary Fig. S3).In the broad-leaf paperbarks, however, the copies do notcoalesce within the morphologically defined species. Thealternative explanation—that there are two separateloci—also does not appear to be the case in the M. leuca-
dendra complex. If two non-recombining loci were present,we could expect that the copies would fall into two differentgene trees. A repeated pattern would be expected, with thetree topology estimated from one locus likely mirrored inthat from the other, such as that found in ITS of Quercus
by Mayol and Rossello (2001). It would also be expectedthat, if the two loci diverged before the taxa, variationbetween loci within an individual would be as great as thatacross the group as a whole. This is not the case herebecause variation within individuals is much less thanacross the complex and, therefore, the presence of twonon-recombining loci appears unlikely. Polyploidy alsodoes not appear to be the likely explanation because nonehas yet been detected for the complex, despite occurrencesin some other melaleucas (Atchison, 1947; Brighton andFerguson, 1976; Rye, 1979; Smith-White, 1948), andbecause there is no correlation between the number of cop-ies of ITS and rpb2 per individual. Populations of both M.
leucadendra and M. quinquenervia have been found to havediploid counts of 22 (Brighton and Ferguson, 1976)—thesame as the apparently ancestral number for Myrtaceaeas a whole (Smith-White, 1948) and the most commoncomplement among the rest of Melaleuca. The most likelyexplanation for multiple copies of ITS in the M. leucaden-
dra complex is incomplete concerted evolution, wheredivergent copies of ITS, possibly from introgression, havenot had sufficient time for homogenization. Alternatively,there may be separate loci that have experienced varyingdegrees of homologous recombination. The clear case oftwo independent recombination events in M. quinquenervia(MDC10152) may be an early part of the process ofhomogenization of copies that, over time, may erase signsof paralogy (Sanderson and Doyle, 1992).

518 L.G. Cook et al. / Molecular Phylogenetics and Evolution 47 (2008) 506–522
Multiple lines of evidence suggest that there has beenrecombination among divergent copies of ITS in the M.
leucadendra complex. These include conflict, as assessedby SH tests, of topologies estimated from ITS1 and ITS2.However, the two clear examples of recombination werefrom within the one individual. That individual also hada non-recombined haplotype (MDC10152c1), representingone of the parental alleles common to the geographicregion from which it was collected. The two putativerecombinants were not the result of a reciprocal transloca-tion, because three different parental alleles were involved.Thus, they cannot represent the products of a single PCRrecombination event. However, a series of recombinationevents during PCR cannot be ruled out, particularly con-sidering that PCR recombination has been demonstratedpreviously for the ITS region (Popp and Oxelman, 2001).Nevertheless, multiple copies of ITS must have been pres-ent in M. quinquenervia MDC10152 for PCR recombina-tion to have occurred. This individual was observed inthe field to lack fruits (melaleucas normally retain maturefruits for a long period) even though adjacent plants borefruits. Therefore, MDC10152 might be a sterile plant ofhybrid origin, which could explain the recombinant copiesof ITS within this individual. However, not all copies ofITS and rpb2 from MDC10152 were recovered from theother specimens of M. quinquenervia with which it was col-lected, suggesting that there may be other genotypes pres-ent in the population that were not sampled.
Rpb2 represents a different case. In a single-locus gene ina diploid organism, we should observe only one or twoalleles in an individual. In this study, two of the outgroupspecimens and two individuals of the M. leucadendra com-plex were found to have at least three different copies ofrpb2. This indicates that the variation among copies isnot solely the result of allelic variation within a diploid.Gene duplication is the most likely explanation of multiplecopies in Melaleuca, as has been reported for rpb2 in someother angiosperms. In Rhododendron, the two loci havediverged (Goetsch et al., 2005) and now differ by about14 amino acid substitutions. In the M. leucadendra com-plex, however, there were no inferred amino acid substitu-tions, indicating that any duplication must have beenrecent. If there has been gene duplication to produce atleast two separate loci, the duplication does not predatethe crown of the M. leucadendra complex (Fig. 2). If itdid, copies from the two outgroups that had three copiesof rpb2 (M. acacioides and M. glomerata) should be inter-spersed with those of the M. leucadendra complex, and thisis not the case. Similarly, if there was a single duplicationwithin the common ancestor of the M. leucadendra com-plex, there should be support for two separate mirrored lin-eages (the daughter lineages of the duplication) but, again,there is not. Also, copies within individuals were less diver-gent than would be expected if the duplication predated theM. leucadendra complex crown. Gene duplication might beimplicated in the occurrence of the same two different hapl-otypes in two specimens of M. argentea (GBarg and
LGC00264). These two specimens are from distant popula-tions and are either both heterozygous for the same twoalleles at the one locus or are homozygous for alleles attwo different loci.
Multiple independent gene duplications of rpb2 cannotbe ruled out; once in each of the outgroups and multipletimes within the M. leucadendra complex. Also, multipleduplications followed by gene loss (see Adams and Wendel,2005) and/or partial or complete gene conversion, such asthat reported for rpd2 in Silene (Popp and Oxelman,2004), cannot be excluded. The mirrored pattern of geneduplication may have been disrupted by introgressionand/or recombination between the different loci (e.g.recombination or gene conversion) and may explain someof the reticulation observed in the parsimony network ofrpb2. The young age estimates for divergent copies ofrpb2 are also consistent with recent introgression, geneduplication and/or recombination. However, even if it isassumed that rpb2 represents as many as three loci, andthat there are multiple copies of ITS, with incomplete sam-pling in both cases, M. quinquenervia and other species inthe group are not monophyletic.
4.4. Speciation within the M. leucadendra complex
All lines of evidence suggest that there has not beenlong-term genetic isolation of the morphotaxa currentlyrecognized within the M. leucadendra complex. This pat-tern contrasts with closely related species (M. acacioides
and M. glomerata), which appear to be monophyletic inthe markers examined. However, it seems unlikely thatthe M. leucadendra complex represents a single polymor-phic species in the typical sense. Divergences within ITS(13%) and cpDNA (1–2%) are greater than might beexpected of intraspecific variation (e.g. Rossello et al.,2006, 2007); in fact, the divergences are similar to orgreater than those found between plant species in general(Kress et al., 2005). Also, estimates of the crown age ofthe M. leucadendra complex (means 3.6–6.7 Myr) are oldfor a single species. High levels of variation could beexplained if the M. leucadendra complex is in an early orintermediate stage of speciation. Omland et al. (2006; seealso Avise, 2000, 2004) argue that, for a long time follow-ing reproductive isolation, two large populations in theprocess of speciation should appear non-monophyletic.They predict that full reciprocal monophyly of the new spe-cies could take millions of years, which is long enough toaccount for the high levels of divergence observed in theM. leucadendra group. Omland et al. (2006) predict anintermediate stage of speciation in which the haplotypesfor a given locus are completely intermixed in a network,although no haplotype is shared between the divergentpopulations, due to divergence and local fixation of haplo-types (‘allotypy’). In our ITS data, no haplotype is sharedbetween morphotaxa, despite the non-monophyly of thelatter, thus fitting Omland et al.’s prediction. Further sup-port for the M. leucadendra complex being in early to inter-

L.G. Cook et al. / Molecular Phylogenetics and Evolution 47 (2008) 506–522 519
mediate stages of speciation was the failure to observemany internal haplotypes in the network. If specimens rep-resented a single species, it would be expected that internal(ancestral) haplotypes would be observed most frequently.
Two alternative speciation models might explain thepattern observed in the broad-leaved paperbarks. First,there could have been partial differentiation of taxa inallopatry, followed by secondary contact and introgres-sion—the conventional model for hybridising species.Under this model it is difficult to explain how the morpho-species became widespread and broadly sympatric. How-ever, it might explain the origin of M. cajuputi as anorthern (SE Asian) segregate, which later spread south-ward to contact populations in Australia. Conversely, M.quinquenervia could have differentiated in south-easternAustralia and spread northward.
An alternative explanation is that morphospecies mightreflect coadapted gene complexes (Wright, 1931) expressedas different morphotypes, repeatedly selected under similarenvironments in widely separated areas. This begs the ques-tion of how the coadapted genotypes became so wide-spread (Gavrilets, 1997; Hadany, 2003). It seems unlikelythat they evolved independently in different areas (i.e.,are convergent). Each coadapted genotype could havespread via a selective sweep through particular habitats.This hypothesis predicts that the morphospecies shouldbe well differentiated ecologically. Published floristicaccounts (Blake, 1968; Dunlop et al., 1995; Wheeleret al., 1992), an ecological analysis (Franklin et al., 2007)and our own observations indicate at least partial ecologi-cal separation of morphospecies in sympatry (Table 4).Most of these differences involve topographic or edaphicsegregation of morphotypes within a site.
4.5. Biogeography of the M. leucadendra complex
The radiation of the present taxa within the M. leuca-
dendra complex appears to have begun about 6 Myr ago(95% CI of 0.7–18 Myr ago) (Table 3). The estimated ageswere remarkably consistent given that several methodswith different assumptions were used, with all meansbetween 5 and 7 Myr. Therefore the complex appears muchyounger than the ‘Gondwanan origin’ suggested by Barlow(1988). The late Miocene and Pliocene (11–5 Myr ago) was
Table 4Habitat differences among some broad-leaf Melaleuca species that occur in sy
Species Habitat
M. arcana Moist swales between coastal dunesM. argentea Riverine, sandy substrates, often in mixedM. cajuputi Heavy clay soils of coastal plains, often iM. dealbata Wide range of soils, less often inundated—M. leucadendra Deeply floodprone sites—riverine and inM. nervosa Sandy soils, often in depressions with undM. quinquenervia Mostly in swamps; extending much fartheM. stenostachya Dry hills with sandy or skeletal soilsM. viridiflora Most commonly in savannah but soil tole
a period during which the global climate, including that ofthe tropics, cooled (Williams et al., 2005) and Australiabecame more arid and variable, with open sclerophyll veg-etation replacing Nothofagus-dominated rainforest(Frakes, 1999; Hill, 2004). During the same period, Austra-lia moved into close proximity with south-east Asia (fromabout 15 Myr ago), which might have enhanced the likeli-hood of dispersal of some members of the group out ofAustralia into nearby regions, e.g. M. cajuputi. However,the presence of M. quinquenervia in New Caledonia, andits putative dispersal date of less than 6 Myr ago (the pop-ulation is nested well within the M. leucadendra crowngroup, which has an estimated age of 6 Myr), suggests thatlong-distance dispersal across 1500 km has occurred atleast once in the M. leucadendra complex.
5. Conclusions
It is clear from this study that genetic relationshipsamong the broad-leaf paperbark morphospecies are com-plex. There appears to be regional sharing of chloroplasthaplotypes and a reticulate pattern of evolution amongthe two nuclear DNA regions examined, with alleles notclustering by morphotype. A lack of reciprocal monophylymay be more likely in such large, widespread populationswhere there might have been some regional differentiationprior to speciation. Additionally, there may not be com-plete reproductive isolation, with distinction maintainedby strong ecological selection. What is not clear is whetherthe haplotype patterns are ancient and have not yetresolved to match current species boundaries or whetherthere is ongoing gene flow across the complex. Samplingin the present study was too limited to distinguish amongthese possibilities. Testing these hypotheses will requiresampling of many individuals per population and use ofa wider range of genetic markers.
The complex relationships discovered here have implica-tions for the biocontrol of the weedy broad-leaf paperbarksin the Americas. Given that all markers we studied werenot fixed in the different morphospecies, it is also likely thattraits of importance to potential biocontrol agents have notbecome fixed. Therefore, a range of biocontrol agents fromother species in the group, rather than just those found onM. quinquenervia, should also be considered.
mpatry
stands with M. leucadendra
nundated or tidalsometimes in mixed stands with M. cajuputi—or in dune swales
freshwater swamps, sometimes in mixed stands with M. argentea
erlying clay; in drier habitats and farther inland than other speciesr south than the other species
rances appear broad and often occurs in mixed stands with other species

520 L.G. Cook et al. / Molecular Phylogenetics and Evolution 47 (2008) 506–522
Acknowledgments
We thank Pauline Ladiges and Gillian Brown for pro-viding some DNA samples that had been used for previousstudies, and Geoff Hope who supplied the New Caledonianspecimen. Lyn Craven kindly organized the collection andidentification of some specimens. John Gaskin (USDA)sent ITS sequences for Florida specimens, and MathieuFourment and Mark Gibbs (ANU) ran the SISCAN anal-yses for us. We also thank two anonymous reviewers forcomments on the manuscript. The study was funded byARC Discovery Projects Grants to LGC and MDC.
Appendix A. Supplementary data
Supplementary data associated with this article can befound, in the online version, at doi:10.1016/j.ympev.2008.02.012.
References
Adams, K.L., Wendel, J.F., 2005. Polyploidy and genome evolution inplants. Curr. Opin. Plant Biol. 8, 135–141.
Albaladejo, R.G., Aguilar, J.F., Aparicio, A., Feliner, G.N., 2005.Contrasting nuclear-plastidial phylogenetic patterns in the recentlydiverged Iberian Phlomis crinita and P. lychnitis lineages (Lamiaceae).Taxon 54, 987–998.
Alvarez, I., Wendel, J.F., 2003. Ribosomal ITS sequences and plantphylogenetic inference. Mol. Phylogenet. Evol. 29, 417–434.
Atchison, E., 1947. Chromosome numbers in the Myrtaceae. Am. J. Bot.34, 159–164.
Avise, J.C., 2000. Phylogeography: The History and Formation of Species.Harvard University Press, Cambridge.
Avise, J.C., 2004. Molecular Markers, Natural History, and Evolution.Sinauer Associates, Sunderland, Massachusetts.
Bailey, C.D., Carr, T.G., Harris, S.A., Hughes, C.E., 2003. Characteriza-tion of angiosperm nrDNA polymorphism, paralogy, and pseudo-genes. Mol. Phylogenet. Evol. 29, 435–455.
Baldwin, B.G., Sanderson, M.J., Porter, J.M., Wojciechowski, M.F.,Campbell, C.S., Donoghue, M.J., 1995. The ITS region of nuclearribosomal DNA: a valuable source of evidence on angiospermphylogeny. Ann. Mo. Bot. Gard. 82, 247–277.
Barlow, B.A., 1987. Contributions to a revision of Melaleuca (Myrtaceae):1–3. Brunonia 9, 163–177.
Barlow, B.A., 1988. Patterns of differentiation in tropical speciesof Melaleuca L. (Myrtaceae). Proc. Ecol. Soc. Aust. 15, 239–247.
Bayly, M.J., Ladiges, P.Y., 2007. Divergent paralogues of ribosomal DNAin eucalypts (Myrtaceae). Mol. Phylogenet. Evol. 44, 346–356.
Bentham, G., 1868. Notes on Myrtaceae. J. Linn. Soc. Bot. 10, 101–166.
Biffin, E., Craven, L.A., Crisp, M.D., Gadek, P.A., 2006. Molecularsystematics of Syzygium and allied genera (Myrtaceae): evidence fromthe chloroplast genome. Taxon 55, 79–84.
Blake, S.T., 1968. A revision of Melaleuca leucadendron and its allies(Myrtaceae). Contrib. Queensland Herbarium 1, 1–114.
Boland, D.J., Brooker, M.I.H., Chippendale, G.M., Hall, N., Hyland,B.P.M., Johnston, R.D., Kleinig, D.A., Turner, J.D., 1984. ForestTrees of Australia. Thomas Nelson Australia, Melbourne.
Brighton, C.A., Ferguson, I.K., 1976. Chromosome counts in the genusMelaleuca (Myrtaceae). Kew Bull. 31, 27–32.
Brown, G.K., Udovicic, F., Ladiges, P.Y., 2001. Molecular phylogeny andbiogeography of Melaleuca, Callistemon and related genera (Myrta-ceae). Aust. Syst. Bot. 14, 565–585.
Buckler, E.S., Ippolito, A., Holtsford, T.P., 1997. The evolution ofribosomal DNA: divergent paralogues and phylogenetic implications.Genetics 145, 821–832.
Byrne, M., Moran, G.F., Tibbits, W.N., 1993. Restriction map andmaternal inheritance of chloroplast DNA in Eucalyptus nitens. J.Hered. 84, 218–220.
Byrnes, N.B., 1984. A revision of Melaleuca L. (Myrtaceae) in northernand eastern Australia, 1. Austrobaileya 2, 65–76.
Byrnes, N.B., 1986. A revision of Melaleuca L. (Myrtaceae) in northernand eastern Australia, 3. Austrobaileya 2, 254–273.
Clement, M., Posada, D., Crandall, K.A., 2000. TCS: a computerprogram to estimate gene genealogies. Mol. Ecol. 9, 1657–1659.
Craven, L.A., 1998. A result of the 1996 Mueller CommemorativeExpedition to northwestern Australia: Melaleuca triumphalis sp. nov.(Myrtaceae). Muelleria 11, 1–4.
Craven, L.A., Barlow, B.A., 1997. New taxa and new combinations inMelaleuca (Myrtaceae). Novon 7, 113–119.
Crisp, M.D., Gilmore, S.R., Weston, P.H., 1999. Phylogenetic relation-ships of two anomalous species of Pultenaea (Fabaceae: Mirbelieae),and description of a new genus. Taxon 48, 701–714.
Davies, K.A., Giblin-Davis, R.M., 2004. The biology and associations ofFergusobia (Nematoda) from the Melaleuca leucadendra-complex ineastern Australia. Invertebr. Syst. 18, 291–319.
Denton, A.L., McConaughy, B.L., Hall, B.D., 1998. Usefulness of RNAPolymerase II coding sequences for estimation of green plant phylog-eny. Mol. Biol. Evol. 15, 1082–1085.
Douglas, M.M., Bunn, S.E., Davies, P.M., 2005. River and wetland foodwebs in Australia, wet–dry tropics: general principles and implicationsfor management. Mar. Freshwater Res. 56, 329–342.
Dover, G., 1982. Molecular drive: a cohesive mode of species evolution.Nature 299, 111–117.
Dray, F.A., Bennett, B.C., Center, T.D., 2006. Invasion history ofMelaleuca quinquenervia (Cav.) S.T. Blake in Florida. Castanea 71,210–225.
Dray, F.A., Bennett, B.C., Center, T.D., Wheeler, G.S., Madeira, P.T.,2004. Genetic variation in Melaleuca quinquenervia affects the biocon-trol agent Oxyops vitiosa. Weed Technol. 18, 1400–1402.
Dunlop, C.R., Leach, G.J., Cowie, I.D., 1995. Flora of the Darwin Region,vol. 2. Conservation Commission of the Northern Territory, Darwin.
Excoffier, L., Smouse, P.E., Quattro, J.M., 1992. Analysis of MolecularVariance inferred from metric distances among DNA haplotypes:application to human mitochondrial-DNA restriction data. Genetics131, 479–491.
Feliner, G.N., Rossello, J.A., 2007. Better the devil you know? Guidelinesfor insightful utilization of nrDNA ITS in species-level evolutionarystudies in plants. Mol. Phylogenet. Evol. 44, 911–919.
Frakes, L.A., 1999. Evolution of Australian environments. In: Orchard,A.E. (Ed.), Flora of Australia, Introduction, vol.1. Springer, NY, pp.163–203.
Franklin, D.C., Brocklehurst, P.S., Lynch, D., Bowman, D.M.J.S., 2007.Niche differentiation and regeneration in the seasonally floodedMelaleuca forests of northern Australia. J. Trop. Ecol. 23, 457–467.
Freeman, J.S., Jackson, H.D., Steane, D.A., McKinnon, G.E., Dutkow-ski, G.W., Potts, B.M., Vaillancourt, R.E., 2001. Chloroplast DNAphylogeography of Eucalyptus globulus. Aust. J. Bot. 39, 585–596.
Gaut, B.S., 1998. Molecular clocks and nucleotide substitution rates inhigher plants. Evol. Biol. 30, 93–120.
Gavrilets, S., 1997. Evolution and speciation on holey adaptive land-scapes. Trends Ecol. Evol. 12, 307–312.
Gibbs, M.J., Armstrong, J.S., Gibbs, A.J., 2000. Sister-Scanning: a MonteCarlo procedure for assessing signals in recombinant sequences.Bioinformatics 16, 573–582.
Giblin-Davis, R.M., Ye, W., Davies, K.A., Scheffer, S.J., Taylor, G.S.,Purcell, M.F., Wheeler, G., Pratt, P., Center, T.D., Thomas, W.K.,2005. Does Melaleuca quinquenervia chemotype matter to the Fer-
gusobia quinquenerviae/Fergusonina turneri complex? Florida Entomo-logical Society Annual Meeting, Sanibel Harbour Resort & Spa Ft.Myers, Florida, USA.

L.G. Cook et al. / Molecular Phylogenetics and Evolution 47 (2008) 506–522 521
Goetsch, L., Eckert, A.J., Hall, B.D., 2005. The molecular systematics ofRhododendron (Ericaceae): a phylogeny based upon rpb2 genesequences. Syst. Bot. 30, 616–626.
Goulding, S.E., Olmstead, R.G., Morden, C.W., Wolfe, K.H., 1996. Ebband flow of the chloroplast inverted repeat. Mol. Gen. Genet. 252,195–206.
Hadany, L., 2003. Adaptive peak shifts in a heterogenous environment.Theor. Popul. Biol. 63, 41–51.
Hill, R.S., 2004. Origins of the southeastern Australian vegetation. Philos.Trans. R. Soc. B 359, 1537–1549.
Ireland, B.F., Hibbert, D.B., Goldsack, R.J., Doran, J.C., Brophy, J.J.,2002. Chemical variation in the leaf essential oil of Melaleuca
quinquenervia (Cav) S.T. Blake. Biochem. Syst. Ecol. 30, 457–470.Jackson, H.D., Steane, D.A., Potts, B.M., Vaillancourt, R.E., 1999.
Chloroplast DNA evidence for reticulate evolution in Eucalyptus
(Myrtaceae). Mol. Ecol. 8, 739–751.Kay, K.M., Whittall, J.B., Hodges, S.A., 2006. A survey of nuclear
ribosomal internal transcribed spacer substitution rates across angio-sperms: an approximate molecular clock with life history effects. BMCEvol. Biol. 6, 36.
Kress, W.J., Wurdack, K.J., Zimmer, E.A., Weigt, L.A., Janzen, D.H.,2005. Use of DNA barcodes to identify flowering plants. Proc. NatlAcad. Sci. USA 102, 8369–8374.
Lalev, A.I., Abeyrathne, P.D., Nazar, R.N., 2000. Ribosomal RNAmaturation in Schizosaccharomyces pombe is dependent on a largeribonucleoprotein complex of the Internal Transcribed Spacer 1.Nucleic Acids Res. 27, 3071–3078.
Lee, M.S.Y., 2001. Uninformative characters and apparent conflictbetween molecules and morphology. Mol. Biol. Evol. 18, 676–680.
Liao, D., 1999. Concerted evolution: molecular mechanism and biologicalimplications. Am. J. Hum. Genet. 64, 24–30.
Liu, J.-S., Schardl, C.L., 1994. A conserved sequence in internaltranscribed spacer 1 of plant nuclear rRNA genes. Plant Mol. Biol.26, 775–778.
Long, E.O., Dawid, I.B., 1980. Repeated genes in eukaryotes. Annu. Rev.Biochem. 49, 727–764.
Mathews, D.H., Sabina, J., Zuker, M., Turner, D.H., 1999. Expandedsequence dependence of thermodynamic parameters improves predic-tion of RNA secondary structure. J. Mol. Biol. 288, 911–940.
Mayol, M., Rossello, J.A., 2001. Why nuclear ribosomal DNA spacers(ITS) tell different stories in Quercus. Mol. Phylogenet. Evol. 19, 167–176.
McKinnon, G.E., Vaillancourt, R.E., Jackson, H.D., Potts, B.M., 2001.Chloroplast sharing in the Tasmanian eucalyptus. Evolution 55, 703–711.
Ochieng, J.W., Henry, R.J., Baverstock, P.R., Steane, D.A., Shepherd,M., 2007. Nuclear ribosomal pseudogenes resolve a corroboratedmonophyly of the eucalypt genus Corymbia despite misleadinghypotheses at functional ITS paralogs. Mol. Phylogenet. Evol. 44,752–764.
Olmstead, R.G., Sweere, J.A., 1994. Combining data in phylogeneticsystematics—an empirical approach using three molecular data sets inthe Solanaceae. Syst. Biol. 43, 467–481.
Omland, K.E., Baker, J.M., Peters, J.L., 2006. Genetic signatures ofintermediate divergence: population history of Old and New WorldHolarctic ravens (Corvus corax). Mol. Ecol. 15, 795–808.
Oxelman, B., Yoshikawa, N., McConaughy, B.L., Luo, J., Denton, A.L.,Hall, B.D., 2004. Rpb2 gene phylogeny in flowering plants, withparticular emphasis on asterids. Mol. Phylogenet. Evol. 32, 462–479.
Pace, N.R., Walker, T.A., Schroeder, E., 1977. Structure of 5.8s RNAcomponent of 5.8s–28s ribosomal-RNA junction complex. Biochem-istry 16, 5321–5328.
Peakall, R., Smouse, P.E., 2006. GenAlEx 6: genetic analysis in Excel.Population genetic software for teaching and research. Mol. Ecol.Notes 6, 288–295.
Petit, R.J., Bodenes, C., Ducousso, A., Roussel, G., Kremer, A., 2004.Hybridization as a mechanism of invasion in oaks. New Phytol. 161,151–164.
Pfeil, B.E., Brubaker, C.L., Craven, L.A., Crisp, M.D., 2004. Paralogyand orthology in the Malvaceae rpb2 gene family: investigation of geneduplication in Hibiscus. Mol. Biol. Evol. 21, 1428–1437.
Poke, F.S., Martin, D.P., Steane, D.A., Vaillancourt, R.E., Reid, J.B.,2006. The impact of intragenic recombination on phylogeneticreconstruction at the sectional level in Eucalyptus when using a singlecopy nuclear gene (cinnamoyl CoA reductase). Mol. Phylogenet. Evol.39, 160–170.
Popp, M., Erixon, P., Eggens, F., Oxelman, B., 2005. Origin and evolutionof a circumpolar polyploid species complex in Silene (Caryophylla-ceae) inferred from low copy nuclear RNA polymerase introns, rDNA,and chloroplast DNA. Syst. Bot. 30, 302–313.
Popp, M., Oxelman, B., 2001. Inferring the history of the polyploid Silene
aegaea (Caryophyllaceae) using plastid and homoeologous nuclearDNA sequences. Mol. Phylogenet. Evol. 20, 474–481.
Popp, M., Oxelman, B., 2004. Evolution of a RNA polymerase genefamily in Silene (Caryophyllaceae): incomplete concerted evolutionand topological congruence among paralogues. Syst. Biol. 53, 914–932.
Posada, D., Crandall, K.A., 1998. MODELTEST: testing the model ofDNA substitution. Bioinformatics 14, 817–818.
Pratt, P.D., Quevedo, V., Bernier, L., Sustache, J., Center, T.D., 2005.Invasions of Puerto Rican wetlands by the Australian tree Melaleuca
quinquenervia. Caribb. J. Sci. 41, 42–54.Rambaut, A., 1996. Se-Al: Sequence Alignment Editor. University of
Oxford, Department of Zoology. Available from: <http://evolve.zoo.ox.ac.uk/>.
Rieseberg, L.H., Soltis, D.E., 1991. Phylogenetic consequences of cyto-plasmic gene flow in plants. Evol. Trends Plants 5, 65–84.
Ronquist, F., Huelsenbeck, J.P., 2003. MrBayes 3: Bayesian phylogeneticinference under mixed models. Bioinformatics 19, 1572–1574.
Rossello, J.A., Cosin, R., Boscaiu, M., Vicente, O., Martinez, I., Soriano,P., 2006. Intragenomic diversity and phylogenetic systematics of wildrosemaries (Rosmarinus officinalis L. s.l., Lamiaceae) assessed bynuclear ribosomal DNA sequences (ITS). Plant Syst. Evol. 262, 1–12.
Rossello, J.A., Lazaro, A., Cosin, R., Molins, A., 2007. A phylogeo-graphic split in Buxus balearica (Buxaceae) as evidenced by nuclearribosomal markers: when ITS paralogues are welcome. J. Mol. Evol.64, 143–157.
Rutschmann, F., 2006. Molecular dating of phylogenetic trees: a briefreview of current methods that estimate divergence times. Divers.Distrib. 12, 35–48.
Rye, B.L., 1979. Chromosome-number variation in the Myrtaceae and itstaxonomic implications. Divers. Distrib. 27, 547–573.
Saiki, R.K., Gelfand, D.H., Stoffel, S., Scharf, S.J., Higuchi, R., Horn,G.T., Mullis, K.B., Erlich, H.A., 1988. Primer-directed enzymaticamplification of DNA with a thermostable DNA-polymerase. Science239, 487–491.
Sanderson, M.J., 2003. r8s: inferring absolute rates of molecular evolutionand divergence times in the absence of a molecular clock. Bioinfor-matics 19, 301–302.
Sanderson, M.J., Doyle, J.J., 1992. Reconstruction of organismal andgene phylogenies from data on multigene families: concerted evolution,homoplasy, and confidence. Syst. Biol. 41, 4–17.
Scheffer, S.J., Giblin-Davis, R.M., Taylor, G.S., Davies, K.A., Purcell,M., Lewis, M.L., Goolsby, J., Center, T.D., 2004. Phylogeneticrelationships, species limits, and host specificity of gall-formingFergusonina flies (Diptera: Fergusoninidae) feeding on Melaleuca
(Myrtaceae). Ann. Entomol. Soc. Am. 97, 1216–1221.Schultz, J., Maisel, S., Gerlach, D., Muller, T., Wolf, M., 2005. A common
core of secondary structure of the internal transcribed spacer 2 (ITS2)throughout the Eukaryota. RNA 11, 361–364.
Serbesoff-King, K., 2003. Melaleuca in Florida: a literature review on thetaxonomy, distribution, biology, ecology, economic importance andcontrol measures. J. Aquat. Plant Manage. 41, 98–112.
Shimodaira, H., Hasegawa, M., 1999. Multiple comparisons of log-likelihoods with applications to phylogenetic inference. Mol. Biol.Evol. 16, 1114–1116.

522 L.G. Cook et al. / Molecular Phylogenetics and Evolution 47 (2008) 506–522
Smith-White, S., 1948. Cytological studies in the Myrtaceae. II. Chromo-some numbers in the Leptospermoideae and Myrtoideae. Proc. Linn.Soc. N. S. W. 73, 16–36.
Swofford, D.L., 2002. PAUP*Phylogenetic Analysis Using Parsimony(* and Other Methods). Sinauer Associates, Sunderland, Massachusetts.
Sytsma, K.J., Litt, A., Zjhra, M.L., Pires, J.C., Nepokroeff, M., Conti, E.,Walker, J., Wilson, P.G., 2004. Clades, clocks, and continents:historical and biogeographical analysis of Myrtaceae, Vochysiaceae,and relatives in the Southern Hemisphere. Int. J. Plant Sci. 165, S85–S105.
Thorne, J.L., Kishino, H., 2002. Divergence time and evolu-tionary rate estimation with multilocus data. Syst. Biol. 51,689–702.
Wheeler, G.S., 2006. Chemotype variation of the weed Melaleuca
quinquenervia influences the biomass and fecundity of the biologicalcontrol agent Oxyops vitiosa. Biol. Control 36, 121–128.
Wheeler, J.R., Rye, B.L., Koch, B.L., Wilson, A.J.G., 1992. Flora of theKimberley Region. Dept of Conservation and Land Management,Como, Western Australia.
Whitehead, P.J., Wilson, B.A., Bowman, D.M.J.S., 1990. Conservation ofcoastal wetlands of the Northern Territory of Australia: the MaryRiver floodplain. Biol. Conserv. 52, 85–111.
Williams, M., Haywood, A.M., Taylor, S.P., Valdes, P.J., Sellwood, B.W.,Hillenbrand, C.D., 2005. Evaluating the efficacy of planktonicforaminifer calcite delta O-18 data for sea surface temperaturereconstruction for the Late Miocene. Geobios 38, 843–863.
Wilson, P.G., O’Brien, M.M., Heslewood, M.M., Quinn, C.J., 2005.Relationships within Myrtaceae sensu lato based on a matK phylog-eny. Plant Syst. Evol. 251, 3–20.
Wright, S., 1931. Evolution in Mendelian populations. Genetics 16, 97–159.Zuker, M., 2003. Mfold web server for nucleic acid folding and
hybridization prediction. Nucleic Acids Res. 31, 3406–3415.