Embed Size (px)
Citation preview

Ann Oper ResDOI 10.1007/s10479-017-2438-y
ANALYTICAL MODELS FOR FINANCIAL MODELING AND RISK MANAGEMENT
Rethinking economic capital management through theintegrated derivative-based treatment of interest rateand credit risk
Mariya Gubareva1,2 · Maria Rosa Borges2,3
© Springer Science+Business Media New York 2017
Abstract This research revisits the economic capital management regarding banking booksof financial institutions exposed to the emerging market sovereign debt. We develop aderivative-based integrated approach to quantify economic capital requirements for consid-ered jointly interest rate and credit risk. Our framework represents a major contribution to theempirical aspects of capital management. The proposed innovativemodeling allows applyingstandard historic value-at-risk techniques developed for stand-alone risk factors to evaluateaggregate impacts of several risks. We use the time-series of credit default swap spreads andinterest rate swap rates as proxy measures for credit risk and interest rate risk, respectively.An elasticity of interest rate risk and credit risk, considered a function of the business cyclephases, maturity of instruments, creditworthiness, and other macroeconomic parameters, isgauged by means of numerical modeling. Our contribution to the new economic thinkingregarding the interest rate risk and credit rate risk management consists in their integratedtreatment as the dynamics of interest rate and credit spreads is found to demonstrate thefeatures of automatic stabilizers of each other. This research sheds light on how financialinstitutions may address hedge strategies against downside risks. It is of special importancefor emerging markets heavily dependent on foreign capital as it potentially allows emergingmarket banks to improve risk management practices in terms of capital adequacy and BaselIII rules. From the regulatory perspective, by taking into account inter-risk diversificationeffects it allows enhancing financial stability through jointly optimizing Pillar 1 and Pillar 2economic capital.
B Mariya [email protected]
Maria Rosa [email protected]
1 ISCAL - Lisbon Accounting and Business School, Polytechnic Institute of Lisbon, Lisbon, Portugal
2 ISEG - Lisbon School of Economics and Management, Universidade de Lisboa, Lisbon, Portugal
3 UECE - Research Unit on Complexity and Economics, Lisbon, Portugal
123

Ann Oper Res
Keywords Emerging markets · Integrated risk modeling · Interest rate risk · Credit risk ·Downside risk management · Economic capital
JEL Classification G15 · G10 · F39
1 Introduction
The interest rate risk (IRR) and the credit risk (CR) relations are at the heart of a busi-ness model of financial institutions. Hence, IRR and CR management are among the mainchallenges faced by fixed-income portfolio managers and regulators.
From the point of view of prudential regulation the CR is addressed in Pillar 1 focusedon minimum capital requirements1 while the IRR in the banking book (IRRBB) enters inPillar 2 of the Basel III financial stability framework.2 Additionally the Basel III accord,see Basel Committee on Banking Supervision (2011), requires banks and other financialinstitutions to estimate their economic capital (ECAP) for all the material risks they faceaccording to specificity of their businesses. This procedure is known as internal capitaladequacy assessment process (ICAAP). Usually banks are forced by regulators to estimatetheir ECAP for CR and IRR in a segregated manner in order not to allow them to benefitfrom the inter-risk diversification effects.The description the de facto banking supervisionlandscape is based on several private communications to authors from banks, regulators,banking associations, and consulting arms of Big 4 firms.
In spite of this imposed de facto, though not really obligatory in the strict sense regulatorycondition, we propose to assess CR and IRR jointly in order to calculate the respective ECAPrequirements. Our study was inspired by the paper of Alessandri and Drehmann (2010).They suggest moving from the independent analyses of risks to an integrated approach. ButAlessandri and Drehmann (2010) arbitrarily assume that IRR and CR amplify one another.Our paper provides the empirical evidence that it is not the case, at least for emerging market(EM) sovereign debt.
The interrelation between CR and IRR was also analyzed using non-derivative (Land-schoot 2008; Boulkeroua and Stark 2013; Chen et al. 2015) and derivative (Tang and Yan2010; Jermann and Yue 2013; Chen et al. 2013; Neal et al. 2015) instruments. The main gen-eral conclusion of these researches is that CR and IRR are related to each other and hardlyseparable.
Following the derivative-based studies, our paper further advances the use of the derivativeinstruments such as credit default swap (CDS) and interest rate swap (IRS) in approachingthe interaction of the CR and IRR.
We study IRR and CR under the expansion and contraction phases of a business cycle.The interaction of these risks is assessed within the flight-to-quality time windows linked tothe business cycle and also over the periods of recovery from flights-to-quality. Thus, in thismanner we also contribute to the research dedicated to flight-to-quality phenomena, whencapital flies from risky to risk-free assets, augmenting credit risk spreads of the former and
1 The minimum capital requirements for the credit risk (CR) are discussed in Section “Capital requirementsfor credit risk” of the Basel Accord, see pp. 72–189 of Regulation (EU) No 575/2013 (European Parliament2013).2 As for interest rate risk (IRR) no minimum capital requirements is established under the Basel Accord,see “Interest rate in the banking book” document by Basel Committee on Banking Supervision (2016) forIRR-related standards.
123

Ann Oper Res
diminishing the yields of the latter (Gubareva 2014; Fuerst et al. 2015; Gubareva and Borges2016a).
Our contribution to the new economic thinking of IRR and CR management is twofold.First, we contribute to the empirical evidence on the mutual attenuation effects between IRRand CR resulting in inter-risk diversification benefits. Second, we provide a better theoreticalunderstanding of the nature of inter-risk diversification benefit arising when IRR and CR aretreated jointly.
We develop a derivative-based integrated framework for assessing ECAP requirements.Our approach is based on historic time series of credit default swap (CDS) spreads and interestrate swap (IRS) rates. We apply our framework to analyze risk dynamics of sovereign debtof 30 developing countries.
The application of our methodology to the EM economies is encouraged by the growingawareness of the International Monetary Fund (2015, 2016) related to the risks of financialinstability rotating towards the developing territories. This is due to the fact that low interestrate environment in most developed countries cannot last infinitely. In its turn, banks andfinancial institutions all over the world face a number of systemic risk challenges and need toadapt to low growth and low interest rates, which place significant strain on their profitabilityand capital adequacy levels (Lin et al. 2016).
Apart from numerical simulations, we give analytical proof that due to the imperfectcorrelation between risks, not only in emerging markets, but in all the markets the interestrate risk is expected to attenuate credit risk and vice versa. But being also interested inproviding numerical examples to show the applicability of our approach we decide to addressthe portfolio exposed to the sovereign debt of the EM. One of the reasons for this choice wasthe availability and reliability of data, apart of the already mentioned growing relevance ofthe developing economies in the global financial system.
The comparative analysis of the proposed here derivative-based integrated methodologywith the regulatory segregated risks assessment requirements proves the robustness accuracy,and advisability of the former. Our method potentially allows for improving financial riskmanagement practices and optimizing ECAP while complying with capital adequacy andBasel III rules. Thus, we believe that our paper provides the long-needed common basisfor the discussion between financial regulators and banking industry regarding the ECAPquantification.
The rest of the paper is organized as follows. Section 2 presents the data sources. Section 3explains the methodology. The results are presented and discussed in Sect. 4. Section 5concludes.
2 Data
Our focus is on EM countries. We address those countries for which the available dataare more extensive and reliable. We align our selection with the FTSE global equity indexseries country classification, as of September 2014, FTSE International Limited (2014).We consider three EM categories, namely, Advanced emerging, Secondary emerging, andFrontier markets.
Table 1 presents the compositions of the investigated EM portfolios, listing the countrieswhose contribution was considered on equal basis while modeling the respective ECAPs.
We focus on 5-year (5Y) point in the interest rate and credit spread term structures.We useCDS quotes for USD denominated instruments due to the following; first, such instrument
123

Ann Oper Res
Table 1 Contributing country members for the modeled EM portfolios: Advanced (AEM), Secondary (SEM)and Frontier (FEM)
AEM (Advanced EM) SEM (Secondary EM) FEM (Frontier EM)
Brazil Chile Bahrain
Czech Republic China Cyprus
Hungary Colombia Estonia
Malaysia Dubai Lithuania
Mexico Egypt Morocco
Poland Indonesia Romania
South Africa Pakistan Serbia
Thailand Peru Slovakia
Turkey Philippines Slovenia
– Russia Tunisia
– – Vietnam
are much more liquid than CDS denominated in other currencies, and, second, our choicefacilitates comparison of credit risks data and results across diverse geographies. As a proxyfor the USD denominated risk-free interest rate we use a fixed IRS rate (Bloomberg ticker:USSW5).
3 Methodology
3.1 Historical VaR approach for economic capital modeling
Our ECAP-focused derivative-based approach to measure IRR and CR is based on a widelyused technique of historical value at risk (VaR). In general terms, the VaR metrics representsthe maximum loss, which is not exceeded in a given time period, called holding period, witha given probability, denominated confidence level (see, for example, Alexander 2008).
In respect to historical simulation VaR method, the main assumption is that the set ofpossible future scenarios is fully represented by what happened over a specific historicalwindow. This method assumes that history will repeat itself, from a risk perspective. Thismethodology involves using the historical time-series of risk factor changes over a historicalwindow. In this research, yearly changes in credit spreads and interest rates are computed ona daily basis, always over the last 5 or 7years prior to the each date of VaR assessment. Itis equivalent to saying that we use 1-year holding period, i.e., 260 banking days, along witheither 5-year or 7-year long data history.
The historical set of observed scenarios is assumed to be a good representation of allpossibilities that could happen in the future. Our forward-looking horizon is set to be equalto 1year. The valuation of the portfolios is then repeated on a daily basis for each of thescenarios. This produces a distribution of portfolio values, or equivalently, a distribution ofchanges, profits and losses, in portfolio value relative to the value on the date of the VaRcalculation. Ordering the changes in portfolio value from worst to best, the 99.9% VaR, forexample, is computed as the loss such that 0.1% of the profits or losses are below it, and99.9% are above it. In other words, the VaR measures the potential loss in value of a riskyasset or portfolio over a defined period for a given confidence interval.
123

Ann Oper Res
Weuse the 99.9%confidence level in ourVaRcalculations supporting ourECAPestimates.Such practice is also consistent with the confidence level of 99.9% defined by Basel II andBasel III capital accords in the VaR-based formula for the credit risk capital requirementsunder the IRB approach, as per the CRR - Capital Requirements Regulation (Regulation (EU)No 575/2013 of the European Parliament, Article 153). For the regulation related discussionand implications of the regulatory choice of the confidence level, see Zimper (2014). In theabsence of regulations, the confidence level for the VaR will depend on the risk attitude ofthe balance sheet preparer. The more risk averse is the balance sheet preparer, the higher theconfidence level used in VaR calculations. That is why various confidence levels for VaR areoften reported.
Additionally, when applied for the assessment of capital adequacy, VaR can be used toestimate the probability of default, i.e., the probability of insolvency. This depends on thecapitalization of the bank and all the risks of its positions, which could crystallize over achosen horizon, usually 1year. From this point of view, the 99.9% confidence interval issomewhat equivalent to the 1-year probability of default of 0.1%. While compared to thelong-term default frequencies calculated by Moody’s (2015) and by Standard and Poor’s(2015), this figure of 0.1% permits rating the bank as an investment grade entity, whichcomforts regulators and solidifies the public reputation of the bank, in terms of solvency.
As mentioned above, we calculate VaR for a 1-year holding period, i.e., 260 banking days.This choice allows achieving consistency between our VaR estimates, on one hand, and, onthe other hand, both, the rating agencies’ 1-year default frequencies and the 1-year forwardlooking ICAAP statements, as traditionally the ICAAP is a forward-looking exercise with atime horizon usually equal to one calendar year.
Also, as already stated, for VaR calculations we employ two different lengths of historicaldata arrays, namely, of 5 and 7years. It is important to highlight that a 5-year long array of datais a common senseminimum for 99.9% confidence levels as it provides 4 × 260 observations,just above the 1000 observations necessary to achieve this 99.9% confidence level. On theother hand, 7-year intervals,widely usedwithin thefinancial sector, also represent a frequentlymet choice.
3.2 Compounded ECAP based on a segregated assessment of IRR and credit risk
Following the commonly used segregated approach to risk assessment in banking books, i.e.,quantifying each of risks individually without considering any impact from other risks, theimpact of the variation of a chosen risk parameter (RP), i.e., the historical VaR due to this RPis calculated with a confidence level of 99.9%. These variations affect asset values throughthe discount factors employed in the net present value (NPV) calculation. The impact in valueof a 5Y maturity bond caused by 1-year move in a chosen RP, affecting yield values of thisbond, ceteris paribus, could be written as
�Value260dRP (t) ={
[1 + yield (t)]5[1 + yield (t) + �yield260dRP (t)
]5 − 1
}× Nominal (1)
where Δyield260d_RP (t) represents the change in the yield caused by the analyzed RP,Nominal stands for face value or par value of the bond and RP can assume values of IRR andCR, representing correspondingly an interest rate risk and the credit risk. The above formulaforΔValue260d_RP (t) represents a result of capitalization into the future at the rate yield(t)followed by discounting of the future value to the present moment at the rate yield(t + 260)changed due to the changes in the analyzed RP.
123

Ann Oper Res
Using the chosen 260 working days’ time window we move along the time and calculateΔValue260d_RP (t) for an array of consecutive dates. In this manner we receive the cor-responding array of the value impacts, i.e., Array[ΔValue260d_RP (t)]. Each of these twoarrays, the consecutive date array or the value impact array, is a column containing the samenumber of fields filled with either dates or delta values, i.e., value impacts. As can be seenfrom Eq. (1) each delta value is determined based on the yield corresponding to a chosendate. Using the array of value impacts, constructed by consecutive computing of Eq. (1), theECAP requirements for the RP with a confidence level of 99.9% could be written as follows:
ECAPRP = Percentile99.9%{Array
[−�Value260d_RP (t)]}
(2)
which is the absolute value or magnitude of the negative impact whose probability to occuris less than 1 out of 1000 that corresponds to the probability value of 0.1%.
In our derivative based research we use IRS fixed rate quotes and CDS spread quotes togauge variations in the interest rate and credit quality. ThusΔyield260d_I R(t) = USSW5(t)−USSW (t − 260), while Δyield260d_CR(t) = CDS_Spread(t) − CDS_Spread(t − 260),representing the change in a chosen country CDS 5Y spread, calculated over the holdingperiod of 260 banking days.
According to the segregated risk assessment the total ECAP to be hold for IRR and CR iscompounded as follows:
ECAPCompounded = ECAPIRR + ECAPCR (3)
3.3 Integrated ECAP calculation based on jointly treated IRR and credit risk
We develop a new approach to IRR and CR assessment based on the integrated treatment ofthese risks. Under the proposed integrated risk approach, the impact in value of a 5Ymaturitybond, with a face value equal to Nominal, caused by the joint dynamics of the 1-year interestrate and 1-year credit spread moves could be written as:
�Value260dI RR+CR (t) ={
[1 + yield (t)]5[1 + yield (t) + �yield260dI RR (t) + �yield260dCR (t)
]5 − 1
}
×Nominal (4)
In this way, the ECAP to be held in order to withstand the joint impact of IRR and CR is:
ECAPIntegrated = Percentile99.9%{Array
[−�Value260d_I RR+CR (t)]}
(5)
The comparison of ECAPCompounded and ECAPIntegrated is capable of shedding lighton interrelation between IRR and CR for any chosen geography. It is expectable thatECAPIntegrated is supposed to be inferior to the ECAPCompounded due to the risk diver-sification effect. i.e., the most value destroying 260days moves in the interest rate and creditspread may occur and, in fact, occur over different time windows, attenuating, hence, thedynamics of their composition. It is also worth noting that, for any given holding period, thedifference between ECAPCompounded and ECAPIntegrated varies as a function of a length ofthe historical data series considered for the ECAP quantification.
A simple analogy is helpful to clarify the essence of the differences existing betweenECAPCompounded and ECAPIntegrated . Imagine there are two traders, one trading interestrate and another credit. On most days, some diversification benefits are surely expectable.When one trader has a bad day, another one could have a good day. So, the volatility of returnsas well as the severity of losses should be reduced. In the focus of our research, instead of
123
Ann Oper Res
these two traders, we have the two subjacent risk factors: interest rates and credit defaultswap spreads. And we are interested not in daily results, but in the impacts that the yearlychanges in these risk parameters would produce in the value of our assets over 1year. Sowhen the IR year is a good one, i.e., interest rates decay, credit spreads could have also agood year of credit spread tightening or, on the contrary, a bad year of credit spread wideningand vice versa.
In this context, the undiversified ECAPCompounded metrics tells us what might happen ina hypothetical bad-bad year. The undiversified ECAPCompounded is a simple summation ofthe ECAPs coming from the individual risk factors. The need to have such ECAP availableat hand could only be crystallized over such bad-bad 1-year long period when the interestrate uptrend and credit spread widening all result together and simultaneously in the mostextreme losses in each risk category. This is theoretically possible, but in reality hardlyconceivable to happen. On the other hand, the metrics of the ECAPIntegrated is diversifiedby construction and takes into account the benefits of diversification, which derives fromsimultaneous exposure to different risk factors whose values do not rise and fall in perfectharmony. In other words, we can say that the total volatility of the two risks, CR and IRR, canbe decomposed into risk-specific volatility and systematic volatility. As correlation betweenthe risks in not perfect, the risk-specific volatility is partially diversified away resulting inlower ECAP requirements.
So when we take a 5years× 260 banking days’ time-series and start to roll along thetime-series our 1-year long impact gauging window with a 1-day step we continuouslyobserve different contributions for the ECAPCompounded and ECAPIntegrated arrays of thevalue impacts. Either the time limits of 5-year long data window, or positioning of the 1-yearholding period relative to the 5-year long data window can attenuate, or make stronger, thedifferences of ECAPIntegrated relative to ECAPCompounded . But, in fact, the attenuation ofthe ECAPIntegrated metrics relative to ECAPCompounded value derives not so much from thewindows themselves, but from the volatility and trends of spread curves and yield curves, sub-jacent to these windows, which transcribe macroeconomic conditions such as gross domesticproduct growth rates, flat or inverted interest rate and credit spread term structures, excessivevolatility of credit default swaps, etc.
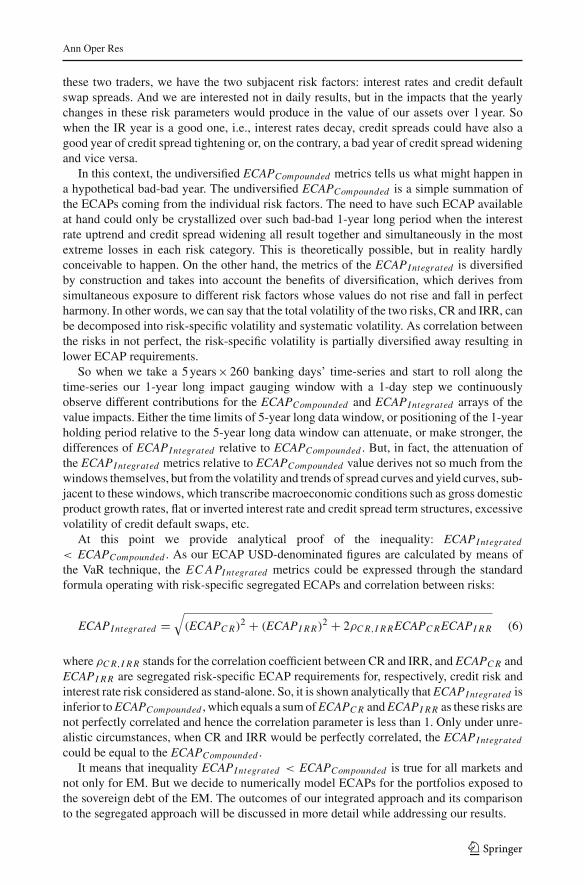
At this point we provide analytical proof of the inequality: ECAPIntegrated
< ECAPCompounded . As our ECAP USD-denominated figures are calculated by means ofthe VaR technique, the ECAPIntegrated metrics could be expressed through the standardformula operating with risk-specific segregated ECAPs and correlation between risks:
ECAPIntegrated =√
(ECAPCR)2 + (ECAPI RR)2 + 2ρCR,I RRECAPCRECAPI RR (6)
where ρCR,I RR stands for the correlation coefficient between CR and IRR, and ECAPCR andECAPI RR are segregated risk-specific ECAP requirements for, respectively, credit risk andinterest rate risk considered as stand-alone. So, it is shown analytically thatECAPIntegrated isinferior toECAPCompounded , which equals a sumofECAPCR andECAPI RR as these risks arenot perfectly correlated and hence the correlation parameter is less than 1. Only under unre-alistic circumstances, when CR and IRR would be perfectly correlated, the ECAPIntegrated
could be equal to the ECAPCompounded .It means that inequality ECAPIntegrated < ECAPCompounded is true for all markets and
not only for EM. But we decide to numerically model ECAPs for the portfolios exposed tothe sovereign debt of the EM. The outcomes of our integrated approach and its comparisonto the segregated approach will be discussed in more detail while addressing our results.
123
Ann Oper Res
3.4 ECAP-wise elasticity of IRR and CR
To study cross-elasticity of IRR and CR impacts, we analyze a problem of minimizing theECAP by diminishing a joint sensitivity of a bond and its tailor-optimized hedge by IRScontract towards the integrated impacts of the aforementioned risks. For such hedge pairconsisting of a bond and its hedging instrument we construct a hypothetical impact in valuedue to 1-year moves in interest rate and credit spread using an expression:
�Value260_Hedge_Pair (t) = �Value260_I R (t) × HedgeCoef f icient
+�Value260_I RR+CR (t) (7)
Then the ECAP for the chosen hedge pair is computed:
ECAPHedge_Pair = Percentile99.9%{Array
[−�Value260d_Hedge_Pair (t)]}
(8)
Defined in this manner ECAPHedge_Pair depends on Hedge_Coefficient. Thus, varyingHedge_Coefficient we solve the ECAP minimization problem:
ECAPMinimum_Hedge_Pair =MINIMUMHedge_Coe f f icient
{ECAPHedge_Pair [Hedge_Coef f icient]
}(9)
The value of the hedge coefficient,which corresponds to theminimumpossible ECAP, definesa possible downside risk hedge strategy from the capital optimization point of view.
In other words, the value of the hedge coefficient characterizes the cross-elasticity of IRRand CR as seen from the point of view of ECAP optimization. Thus, if theHedge_Coefficientis equal to 0, it means that from capital minimization perspective no hedge is needed, asjoint dynamics of the interest rate and credit spread already results in the minimum possiblecapital requirements. It signifies that in this case the cross-elasticity of IRR and CR equals−1, as the subjacent changes in interest rate cancel out negative impacts from credit-spreaddynamics with maximum efficiency. If Hedge_Coefficient is equal to a positive value r , itmeans that in order to diminish exposure to downside risk we may need to augment exposureto the IRR by contracting pay-float receive-fixed IRS with notional, equal to Nominal × r .It signifies that in this case the cross-elasticity of IRR and CR equals −1 − r , i.e., below−1, as additional exposure to the IRR is needed for cancelling out negative impacts fromcredit-spread moves the most efficiently possible. On the other hand, if Hedge_Coefficient isequal to a negative value r , it means that in order to diminish exposure to downside risk wemay need to diminish exposure to the IRR by contracting pay-fixed receive-float IRS withnotional, equal to Nominal× (− r). It signifies that in this case the cross-elasticity of IRRand CR equals −1− r , i.e., above −1, as reducing the excess exposure to the IRR is beneficfor the most efficient cancelling out negative impacts from credit-spread dynamics. At thesingularity point r = −1, the cross-elasticity becomes 0, meaning that the credit spreaddynamics is unrelated to the dynamics of the interest rate, as any non-zero exposure to theIRR worsens the overall ECAP figure.
Apart of cross-elasticity of IRR and CR, many other aspects of diverse nature are neededto be taken into account while evaluating a necessity of IRS-based hedging contracts, such asregulatory limits of the maximum possible impacts of parallel shifts of interest rate curves,accounting efficiency of IRR hedge, and overall profitability of the portfolio, among others.Still an issue of targeting ECAP minimization through downside risk hedging, addressedherein, seems to be undeservedly overlooked by both, academics and practitioners. At least,an ECAP-wise elasticity of IRR and CR should be taken into consideration while optimizingdownside risk hedge strategies implementation and ECAP allocation.
123

Ann Oper Res
From a practical standpoint, each time one decides to define an optimal ECAP-wise hedgestrategy, i.e., to dimension a hedging instrument in a chosen hedge pair in such a way that itwould work best in hedging one’s exposure, the ECAP minimization problem as per Eq. (9)must be solved numerically using the chosen length and chosen time limits of the historicaldata series. Table 6 in the Sect. 4.3 provides several examples of hedge pairs dimensioning.
Obviously, a subjective judgment always exists while determining an optimal hedge strat-egy, as past performance does not guarantee future results. So, it is important to thoroughlychoose such past history, which could be sufficiently representative of what can happen infuture market conditions.
Surely, the choice of a length of historical data samples aswell as holding periods and levelsof confidence will make ECAP fluctuate. But certain meaningful conclusions can be derivedfrom comparison of ECAP requirements for the unhedged positions to ECAP requirementsfor the pairs including the corresponding bonds and the optimally dimensioned hedge by IRSinstruments. Numerical examples of such comparison, i.e., what capital could be potentiallydisposable from economic point of view, are given further in the text in Sect. 4.2, Tables 4and 5.
3.5 Unexpected loss quantified by internal ratings-based (IRB) foundationapproach
The outcomes of the derivative-based model for economic capital are compared to resultsof capital requirements quantification based on comparison of its results country by countrywith outcomes of the regulatory Basel II/III formula for economic capital under the internalratings based (IRB) Foundation approach as defined by CRR - Capital Requirements Regu-lation (Regulation (EU) No 575/2013 of the European Parliament, Article 153). Under thisapproach, using the risk-weighted factor of 8%, capital requirements for exposures to cor-porates, institutions, and central governments shall be calculated according to the followingformulae:
ECAP =exposure value ×
[LGD × N
(1√
1 − R× G (PD) +
√R
1 − R× G (0.999)
)− LGD × PD
]
×1 + (M − 2.5) b
1 − 1.5b× 1.06 (10)
where N (x) is the cumulative distribution function for a standard normal random variable(i.e., the probability that a normal random variable with mean zero and variance of one is lessthan or equal to x); G(Z) denotes the inverse cumulative distribution function for a standardnormal random variable (i.e., the value x such that N (x) = z); R denotes the coefficient ofcorrelation, is defined as:
R = 0.12 × 1 − e−50×PD
1 − e−50+ 0.24 ×
(1 − 1 − e−50×PD
1 − e−50
)(11)
and M represents the maturity term while b stands for the maturity adjustment factor: b =(0.11852 − 0.05478 × ln(PD))2.
We use a regulatory value of 45% for the senior debt LGD (loss given default) parameter.To assess PD (probability of default) parameter we use a Basel rating (second best rating)based on two rating agenciesMoody’s and Standard& Poor’s. Then, according to the countryBasel rating, the second best one, we attribute to the country a PD equal to the average of
123

Ann Oper Res
the long term default frequency calculated byMoody’s (2015) over the years 1983–2014 andof the long term default frequency calculated by Standard and Poor’s (2015) over the years1981–2014.
It can be demonstrated that the results of derivative-based integrated approach to riskassessment are consistent with the described above IRB Foundation approach. Still beingmore issuer specific our derivative-based approach to integrated treatment of IRR and CRseems to be more comprehensive and hence allowing for better optimizing bank economiccapital.
4 Results and discussion
4.1 ECAP for EM portfolios: segregated versus integrated approach to riskassessment
We compare compounded ECAP requirements with the ECAP requirements quantified fol-lowing the proposed herein integrated approach to risk assessment, and present potentiallydisposable fund as a difference between these two estimates in the two tables below for5Y-long and 7Y-long VaR series. We perform this analysis on the equally weighted portfoliobasis. The figures in Tables 2 and 3 are averages of the country specific metrics under thethree considered emerging market categories, namely AEM, SEM, and FEM.
Analyzing ECAP requirements for the Advanced, Secondary, and Frontier equallyweighted portfolios some common patterns could be observed. First, as could be seen forboth, 5Y and 7Y lengths of VaR series, the ECAP under the integrated approach is consider-ably lower than the compounded ECAP following the segregated approach. The former on
Table 2 ECAPs for EM portfolios as of Dec-2014 with 5Y-long VaR history
5Y-long VaR history 99.9%confidence interval
Portfolios
AEM SEM FEM
CR ECAP (%) (A) 6.33 5.82 11.00
IRR ECAP (%) (B) 5.28 5.22 5.16
Compounded ECAP (%) (C = A + B) 11.65 11.04 16.16
Integrated ECAP (%) (D) 6.23 6.40 10.02
Disposable ECAP (%) (E = C − D) 5.42 4.64 6.14
Table 3 ECAPs for EM portfolios as of Dec-2014 with 7Y-long VaR history
7Y-long VaR history 99.9%confidence interval
Portfolios
AEM SEM FEM
CR ECAP (%) (A) 13.01 14.83 17.09
IRR ECAP (%) (B) 5.27 5.21 5.20
Compounded ECAP (%) (C = A + B) 18.28 20.04 22.29
Integrated ECAP (%) (D) 8.93 10.98 13.52
Disposable ECAP (%) (E = C − D) 9.35 9.06 8.77
123

Ann Oper Res
average is roughly equal to 51, 56, and 61% of the latter for Advanced EM, Secondary EM,and Frontier markets, respectively.
Second, comparing 5Y- and 7Y-longVaR series one could conclude that the less Advancedare markets, the greater are non-diversifiable CR components. It also could be interpreted asthat the exposures to the debt of the less Advanced markets are less sensible to the IRR.
Third, for 7Y-long data series, the ECAP requirements under both integrated and segre-gated approaches are higher than for the respective 5Y-long VaR sample that does not capturethe entire history of the crisis development.
Fourth, the common pattern we also observe is that the ECAP requirements under the inte-grated approach are consistently lower than those defined through the segregated approachto ECAP requirements solely for CR. This fact clearly indicates that for 7Y-long VaR seriesconsidered herein, the interest rate downtrend dynamics mitigate the credit spread widening.The following subsections address this observation in more detail first, by considering dif-ferent phases of business cycle and, second, by developing the downside risk hedge strategybased on ECAP-wise cross-elasticity of IRR and CR.
4.2 ECAP for expansion and contraction phases of business cycle
Interrelations of IRR and CR differ between expansion and contraction phases of businesscycle. Gubareva (2014) observes that during the periods of capitalmigration from risky to safeassets, defined as flight-to-quality, the CR spreads of the formers increases while the yields ofthe latter evaporate. Such CR spreads and interest rates dynamics took place during the recentfinancial crisis, when interest rates dropped and simultaneously the average creditworthinessof debt issuers, being banks, corporates or sovereigns, deteriorated too. Gubareva (2014) andGubareva and Borges (2016a) argue that it is not an exceptional case but rather common andexpectable circumstances, as crashes and recessions usually always coincide with downwardtendency in interest rates dynamics.
To address this issue further on, in Tables 4 and 5 we present our results on potentiallydisposable ECAP for the two time windows, namely, pre- and post-crisis phases of the cycle.For these analyses a selected set of sixteen developing countries was employed, as only forthese countries we had an access to the necessary length of historical CDS spread quotes.For each country, and for each 5-year long time window covering the employed historicaldata, we numerically solve the ECAP minimization problem (see Eq. 9). As commented inSect. 3.4, an optimal ECAP-wise dimensioning of hedging instrument, and hence potentiallydisposable ECAP depends upon the risk factors histories covered by the chosen length oftime windows used to gauge ECAP requirements.
Let us consider the concrete example ofBrazil. The potentially disposableECAPevaluatedoverDec 2003–Dec 2008 period is found to represent 11.08%,while the samefigure evaluatedover the Dec 2008–Dec 2013 period equals to 1.40%. Looking forward and trying to definethe optimal ECAP-wise hedge for the future, one needs to make a judgment deciding whatarray of available historical data suits better for describing the future market conditions fromthe risk point of view:Dec 2003–Dec 2008;Dec 2008–Dec 2013;Dec 2007–Dec 2014, or anyother? The only undoubted thing is that a certain amount of ECAP will always be consideredas potentially disposable under each and any adopted assumption. Most likely, no one willopt for selecting the “extreme” options presented in Tables 4 and 5, pre-crisis and post-crisisconjuncture, respectively. Hence, it is more likely the potentially disposable future ECAPwill be inside the interval 1.40–11.08%. We will continue this discussion further on, whileanalyzing Table 6.
123

Ann Oper Res
Table 4 ECAPs estimated with 5Y VaR for December 2008
Country/portfolio CR ECAP (%) IRR ECAP (%) CompoundedECAP (%)
IntegratedECAP (%)
DisposableECAP (%)
(A) (B) (C = A + B) (D) (E = C − D)
Brazil (AEM) 20.38 7.42 27.80 16.72 11.08
Chile (SEM) 12.99 7.80 20.79 8.80 11.99
China (SEM) 11.20 7.80 19.00 7.54 11.46
Colombia (SEM) 19.36 7.54 26.90 15.65 11.25
Hungary (AEM) 22.86 7.81 30.67 19.31 11.36
Malaysia (AEM) 18.34 7.79 26.13 14.47 11.66
Mexico (AEM) 21.93 7.75 29.68 18.33 11.35
Peru (SEM) 19.85 7.55 27.40 16.06 11.34
Philippines (SEM) 25.93 7.46 33.39 22.59 10.80
Poland (AEM) 11.51 7.80 19.31 8.20 11.11
Romania (FEM) 25.80 7.70 33.50 20.54 12.96
Russia (SEM) 36.69 7.69 44.38 33.92 10.46
Slovakia (FEM) 9.79 7.81 17.60 7.45 10.15
South Africa (AEM) 23.73 7.75 31.48 20.17 11.31
Thailand (AEM) 17.57 7.80 25.37 13.75 11.62
Turkey (AEM) 24.99 7.56 32.55 21.62 10.93
Average 19.85 7.69 27.54 16.08 11.46
Table 5 ECAPs estimated with 5Y VaR for December 2013
Country/portfolio CR ECAP (%) IRR ECAP (%) CompoundedECAP (%)
IntegratedECAP (%)
DisposableECAP (%)
(A) (B) (C = A + B) (D) (E = C − D)
Brazil (AEM) 4.95 5.29 10.24 8.84 1.40
Chile (SEM) 4.08 5.31 9.39 5.76 3.63
China (SEM) 6.00 5.31 11.31 6.35 4.96
Colombia (SEM) 4.67 5.30 9.97 6.62 3.35
Hungary (AEM) 16.17 5.16 21.33 12.86 8.47
Malaysia (AEM) 5.91 5.30 11.21 7.08 4.13
Mexico (AEM) 4.57 5.30 9.87 6.45 3.42
Peru (SEM) 4.86 5.30 10.16 6.89 3.27
Philippines (SEM) 5.88 5.29 11.17 5.14 6.03
Poland (AEM) 8.53 5.29 13.82 7.31 6.51
Romania (FEM) 11.08 5.18 16.26 7.52 8.74
Russia (SEM) 7.56 5.28 12.84 7.60 5.24
Slovakia (FEM) 11.79 5.28 17.07 9.21 7.86
South Africa (AEM) 5.25 5.29 10.54 9.60 0.94
Thailand (AEM) 6.60 5.29 11.89 6.30 5.59
Turkey (AEM) 8.94 5.27 14.21 9.64 4.57
Average 6.26 5.28 11.54 5.66 5.88
123

Ann Oper Res
Table6
Optim
alhedg
ecoeffic
ientsminim
izingECAP,forAdvancedEM,2
007–
2014
31-12-20
0731
-12-20
0831
-12-20
0931
-12-20
1031
-12-20
1131
-12-20
1231
-12-20
1331
-12-20
14
Optim
alhedgecoefficientsminim
izingECAPas
peryear
ends
Brazil
−0.89
1.27
1.27
2.39
2.39
0.92
−0.96
−0.96
Hungary
−0.95
0.78
0.78
2.40
1.39
0.84
0.21
0.21
Malaysia
−0.82
0.51
0.51
1.74
1.63
0.41
−0.34
−0.34
Mexico
−1.00
0.83
0.89
2.49
2.49
1.91
−0.53
−0.53
Poland
−0.96
−0.10
0.19
1.28
0.72
0.72
0.03
0.03
SouthAfrica
−0.89
0.86
0.86
2.45
2.73
1.36
−0.98
−0.98
Thailand
−0.82
0.44
0.44
1.59
1.72
0.01
−0.23
−0.32
Turkey
−0.87
0.99
0.99
2.98
2.93
0.52
−0.48
−0.56
Average
− 0.90
0.70
0.74
2.17
2.00
0.84
−0.41
−0.43
123

Ann Oper Res
Comparing Tables 5 and 6, the following statements could be made. First, we observe thatdiversification benefits of the integrated treatment of CR and IRR are more significant forthe 2004–2008 period. Second, taking into consideration the absolute values of the CR andIRR requirements we observe that the proposed herein derivative-based integrated approachaccounts correctly for the higher riskiness of the 2004–2008 period. Third, one could inferthat if the exposure to the IRR in the pre-crisis/crisis period would be bigger, the inter-riskdiversification benefits could be also greater, reducing in this manner the ECAP requirementsunder the integrated approach. In the next section, we discuss in more detail the role ofinteraction between the IRR and CR for the ECAP calculation from the perspective of theeconomic capital-wise elasticity of the IRR and CR.
4.3 Economic capital-wise cross-elasticity of IRR and CR: selected EM countries
To further study the relation between the interest rate and credit risk, we present the resultsof our study on the cross-elasticity of the IRR and CR impacts analyzed through the prism ofECAP quantification. For the hedge pair consisting of a bond and its hedging IRS contractwe minimize hypothetical ECAP requirements quantified with 99.9% confidence level. Ourcalculations are performed for the year-ends of the eight consecutive years, since 2007 until2014, based on 5Y long data history employed in our VaR calculations.
InTable 6 below for theAdvancedEMcountrieswe present the values of optimal downsidehedge coefficient minimizing ECAP of the aforementioned hedge pair, consisting of a bondand a hedging it IRS.
Once again, for each country and for each 5-year long timewindow covering the employedhistorical data we numerically solve the ECAP minimization problem, see Eq. 9. We see thatthe optimal ECAP-wise hedge coefficient changes from year to year, because the 5-year longdata history used in ECAP calculations changes. Let us continue to analyze Brazil. Froma practical standpoint the optimal ECAP-wise hedge during the years 2003–2007 would becontracting pay-fixed receive-float IRS with its notional equal to 89% of bond nominal value.But going 1year forward the situation is changed. The optimal ECAP-wise hedge during theyears 2004–2008 would be contracting pay-float receive-fixed IRS with its notional equal to127% of bond nominal value. It corresponds to 11.08% of potentially disposable ECAP, asshown in Table 4.
Continuing our discussion of optimal hedge coefficient and disposable ECAP, in Table 6we observe that the optimal ECAP-wise hedge during the years 2008–2013 would be con-tracting pay-fixed receive-float IRS with its notional equal to 96% of bond nominal value. Itcorresponds to 1.40% of potentially disposable ECAP, as shown in Table 5. Averaging theoptimal hedge coefficients shown in the first line of the Table 6, we can have an averageperception of what would be an appropriate “medium” hedge along all the considered years.So, as the mean value of the Brazil optimal hedge coefficient is 0.68, the optimal ECAP-wisehedge during the years 2003–2014 would be contracting pay-float receive-fixed IRS with itsnotional equal to 68% of bond nominal value. This is consistent with the result for aggre-gate Advanced EM portfolio of 0.60%, see Fig. 1 and the following discussion. Now let uscontinue our discussion of Table 6 on the aggregate portfolio level.
We observe that the ECAP-minimizing hedge coefficient is a function of the consideredtime windows. For the pre-crisis period 2003–2007 for all the considered countries the ECAPminimizing hedge coefficient on average is closed to −0.9. It means that in order to diminishexposure to downside risk during the economy expansion phase of business cycle, we mayneed to diminish exposure to the IRR by contracting pay-fixed receive-float IRSwith notionalroughly equal to 0.9 times Nominal of an analyzed Advanced EM bond.
123

Ann Oper Res
-1.00
-0.50
0.00
0.50
1.00
1.50
2.00
2.50
Hedge Coefficient
Hedge Coef. Mean
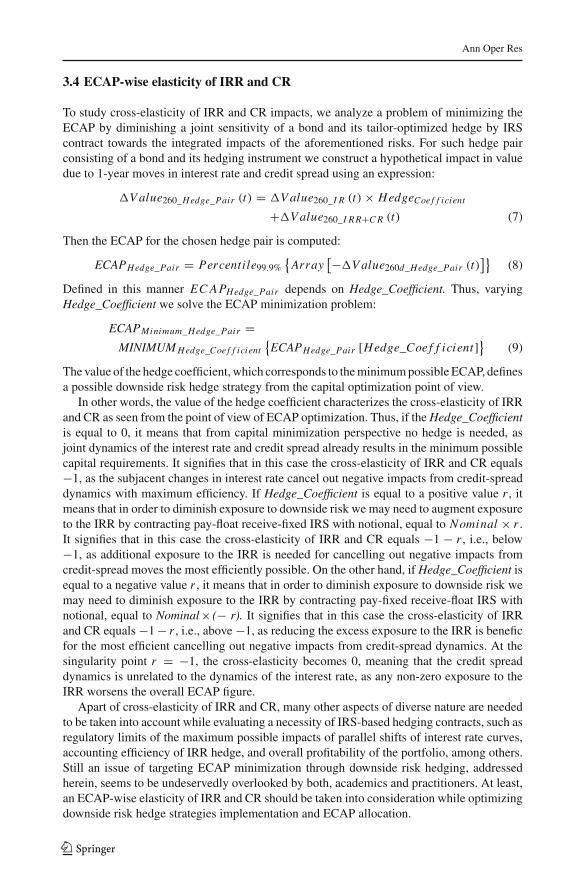
Fig. 1 ECAP-minimizing downside hedge coefficient for the AEM portfolio, 2007–2014
As the 5Y-long VaR data history starts to overlap the apogee of the global financial crisiswhich took place in 2008, since the 2004–2008 time window to the 2008–2012 one, wesee at the aggregate portfolio level that the ECAP-minimizing hedge coefficients begin toassume positive values, meaning that augmenting exposure to IRR was capable of cancelingout the negative impacts of the widening credit spreads. Under these circumstances, in orderto diminish exposure to downside risk we may need to augment exposure to the IRR bycontracting pay-float receive-fixed IRS with notional, equal to bond’s Nominal times hedgecoefficient.
For the post-crisis years of economic recovery the majority of the ECAP-minimizinghedge coefficients newly assume negative values, though on average they represent roughlya half of the pre-crisis figures due to rather modest economic growth, see two columns onthe right-hand side of Table 6. It means that in order to diminish exposure to downside riskduring the recovery from the crisis, we may need to diminish exposure to the IRR.
In general, thefindings described in the two last paragraphs serve as a convincing indicationof the binary behavior of the IR sensitivity of the sovereign debt exposures. In ourmore recentwork, Gubareva and Borges (2016b), following a different, non-derivative, bond yield-basedapproach we demonstrate the binary IR sensitivity of EM corporate bonds. Thus, furtherresearch on the behavior of the IR sensitivity of sovereign debt is highly desirable.
In particular, along the post-crisis period a few hedge coefficients for certain countries,e.g., Hungary and Poland, exhibit values closed to zero, signifying that IRR and CR forthese exposures present almost perfect negative correlation, probably due to the relativelylow embedded leverage, and proving unnecessary downside risk hedge by means of USDdenominated IRS contracts.
In Fig. 1we plot the time dependence of the ECAP-minimizing downside hedge coefficientaveraged over the aforementioned hedge pairs for the considered Advanced EM countriesportfolio (see also the bottom line of Table 6).
Figure 1 indicates that the ECAP-minimizing downside hedge coefficient on averageexhibits positive values for the year-ends since 2008 until 2012, i.e., when 5Y longVaR seriesinclude the crisis apogee year of 2008. Thus, during this period the augmenting exposureto IRR would be benefic in the sense of the ECAP optimization. The stronger affirmationis also correct: over all the considered data history, from 2003 until 2014 the mean valueof the hedge coefficient is about 0.6. Thus, constantly maintaining the exposure to the IRRaugmented in 60% would make us better off in terms of capital allocation.
123
Ann Oper Res
Additionally, as could be seen from the Fig. 1, the portfolio level ECAP-minimizingdownside hedge coefficient reaches its maximum of 2.17 in December 2010. It means thatto minimize the portfolio ECAP, based on the VaR history of 2006–2010, i.e., to diminishthe exposure to downside risk, we ought to augment exposure to the IRR by contractingpay-float receive-fixed IRS with notional, equal to Nominal × 2.17. It signifies that thecross-elasticity of IRR and CR over this period was about −3.17, i.e., the benefic influenceof the IRR component in the bond yield should be augmented 3 times bymeans of contractingthe dimensioned above pay-float receive-fixed IRS with roughly doubled notional in respectto the portfolio nominal.
In Table 5 we present ECAP-wise cross-elasticity between IRR and CR derived fromthe values of optimal downside hedge coefficient minimizing ECAP of the Advanced EMcountries.
The fact that one sees the negative sign in front of the algorithms in the Table 7 intends tostress that for the analyzed time frames and countries, the augmenting of the IRR exposuresdiminishes downside risk for the respective hedge pairs consisting of a bond and a hedgingit IRS. It is also worth noting that the downside risk hedging could be performed either onindividual level, or on the aggregated portfolio level.
In Table 8 we compare the ECAP requirements for non-hedged bonds and achievableminima of ECAP requirements under the optimal downside risk hedge, potentially feasibleby means of the optimal hedge with IRS contracts dimensioned according to the coefficients,exposed in Table 6.
This table clearly evidences that downside risk hedging makes possible the diminishing ofthe ECAP requirements for all the considered herein reference dates and for all the selecteddeveloping geographies. It is also worth noting that ECAP requirements at individual countrylevel as well as at the AEM portfolio level remain unchanged, maintaining the value of 16.86,between December 2009 and December 2011. The explanation of this observed phenomenonis that themajor negative impacts calculatedwith 1-year holding period for the three subjacent5Y VaR series (2005–2009, 2006–2010, and 2007–2011) are the same and correspond to theapogee of the financial crisis. On the other hand, the sensitivity of the individual positionsand of the entire portfolio to the interest rate changes along the time scale. This results in thechanging values of the corresponding ECAP minima under the optimal hedge conditions.
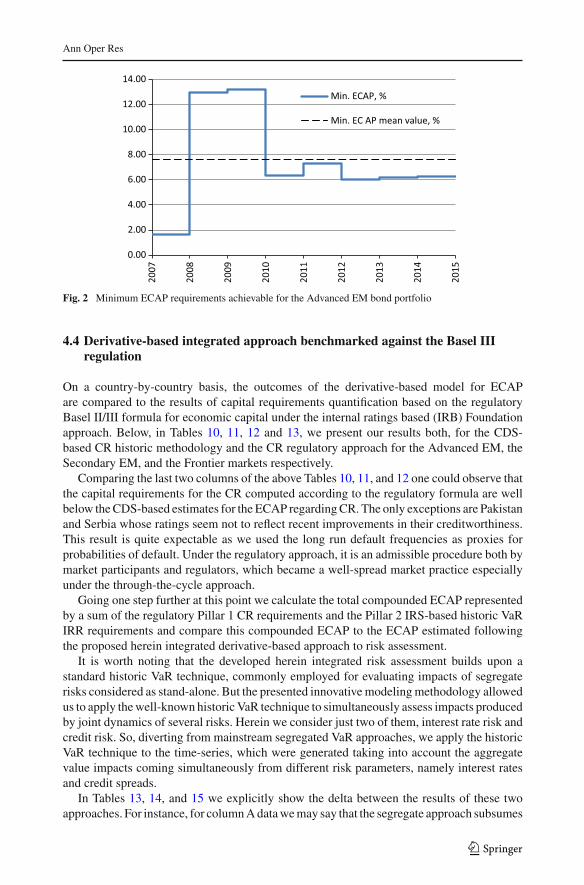
In Fig. 2 we plot the minimal stock of ECAP for the bond portfolio of the selected aboveAdvanced EM countries hedged by optimized IRS contracts against the downside risk. Wealso indicate the level corresponding to the mean values of the ECAP minimum, which wefind to be equal to 7.6% of the portfolio nominal.
Potentially disposable funds under the above-mentioned optimal downside hedge strate-gies are presented in Table 9.
Themean value of the potentially attainable gain in theECAPunder downside risk hedgingfor the eight considered here year-ends is equal to 5.2% of the portfolio nominal. That seemsto be quite an impressive reserve for the risk taking capacity, which could unleash lendingand investment capacity of banks and other financial institutions.
In Fig. 3we plot the potentially disposable, or potentially freed, stock ofECAP for the bondportfolio of the selected above Advanced EM countries hedged by optimized IRS contractsagainst the downside risk. We also indicate the level corresponding to the mean values of thedisposable ECAP, which we find to be equal to 5.2% of the portfolio nominal.
Of course many other aspects, such as profit targets and regulatory limits of exposure toIRR need to be taken into account while evaluating a necessity of IRS-based hedging strategy.
123

Ann Oper Res
Table7
ECAP-wisecross-elastic
ityof
IRRandCRforAdvancedEM,2
007–
2014
Cou
ntry
31-12-20
0731
-12-20
0831
-12-20
0931
-12-20
1031
-12-20
1131
-12-20
1231
-12-20
1331
-12-20
14
ECAP-w
isecross-elasticitycoefficientsforIRRan
dCRas
peryear
ends
Brazil
−0.11
−2.27
−2.27
−3.39
−3.39
−1.92
−0.04
−0.04
Hungary
−0.05
−1.78
−1.78
−3.40
−2.39
−1.84
−1.21
−1.21
Malaysia
−0.18
−1.51
−1.51
−2.74
−2.63
−1.41
−0.66
−0.66
Mexico
0.00
−1.83
−1.89
−3.49
−3.49
−2.91
−0.47
−0.47
Poland
−0.04
−0.90
−1.19
−2.28
−1.72
−1.72
−1.03
−1.03
SouthAfrica
−0.11
−1.86
−1.86
−3.45
−3.73
−2.36
−0.02
−0.02
Thailand
−0.18
−1.44
−1.44
−2.59
−2.72
−1.01
−0.77
−0.68
Turkey
−0.13
−1.99
−1.99
−3.98
−3.93
−1.52
−0.52
−0.44
Average
−0.10
−1.70
−1.74
−3.17
−3.00
−1.84
−0.59
−0.57
123

Ann Oper Res
Table8
ECAPestim
ates
forno
n-hedg
edbo
ndsandtheECAPminim
afortheop
timally
IRS-hedg
edbo
nds
31-12-2007
31-12-2008
31-12-2009
31-12-2010
31-12-2011
31-12-2012
31-12-2013
31-12-2014
ECAP
Min.E
CAP
ECAP
Min.E
CAP
ECAP
Min.E
CAP
ECAP
Min.E
CAP
ECAP
Min.E
CAP
ECAP
Min.E
CAP
ECAP
Min.E
CAP
ECAP
Min.E
CAP
ECAPsfornon-hedged
bondsandachievableminimaof
ECAPsundertheoptimal
hedge(%
)of
nominal
Brazil
7.35
1.24
16.72
10.59
16.72
10.59
16.72
5.21
16.72
5.21
8.23
4.38
8.84
4.88
8.84
4.88
Hungary
9.14
1.62
19.31
15.36
19.31
15.36
19.31
7.37
19.31
12.65
15.99
12.39
12.86
12.11
12.86
12.11
Malaysia
7.74
1.33
14.47
11.82
14.47
11.82
14.47
5.55
14.47
6.13
6.73
5.41
7.08
5.35
7.08
5.35
Mexico
8.90
1.76
18.33
14.38
18.33
14.09
18.33
6.58
18.33
6.58
11.77
4.53
6.45
3.91
6.45
3.91
Poland
8.71
0.77
8.20
7.48
10.50
9.71
10.50
4.69
10.50
7.45
10.50
7.45
7.31
7.29
7.31
7.29
SouthAfrica
8.86
1.70
20.17
15.72
20.17
15.72
20.17
7.48
20.17
6.23
9.45
3.46
9.60
5.10
9.60
5.10
Thailand
8.55
1.59
13.75
11.54
13.75
11.54
13.75
5.68
13.75
6.23
5.97
5.93
6.30
6.01
7.29
6.05
Turkey
9.46
3.25
21.61
16.92
21.61
16.92
21.61
8.22
21.61
7.65
7.84
6.48
9.64
7.69
10.20
7.99
Average
8.59
1.66
16.57
12.98
16.86
13.22
16.86
6.35
16.86
7.27
9.56
6.25
8.51
6.54
8.70
6.59
123
Ann Oper Res
0.00
2.00
4.00
6.00
8.00
10.00
12.00
14.00
2007
2008
2009
2010
2011
2012
2013
2014
2015
Min. ECAP, %
Min. EC AP mean value, %
Fig. 2 Minimum ECAP requirements achievable for the Advanced EM bond portfolio
4.4 Derivative-based integrated approach benchmarked against the Basel IIIregulation
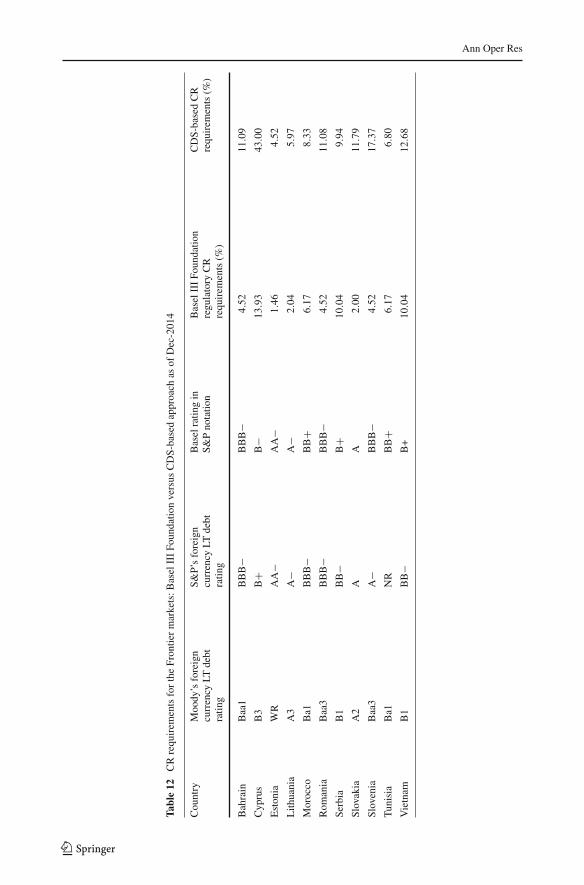
On a country-by-country basis, the outcomes of the derivative-based model for ECAPare compared to the results of capital requirements quantification based on the regulatoryBasel II/III formula for economic capital under the internal ratings based (IRB) Foundationapproach. Below, in Tables 10, 11, 12 and 13, we present our results both, for the CDS-based CR historic methodology and the CR regulatory approach for the Advanced EM, theSecondary EM, and the Frontier markets respectively.
Comparing the last two columns of the above Tables 10, 11, and 12 one could observe thatthe capital requirements for the CR computed according to the regulatory formula are wellbelow theCDS-based estimates for the ECAP regardingCR. The only exceptions are Pakistanand Serbia whose ratings seem not to reflect recent improvements in their creditworthiness.This result is quite expectable as we used the long run default frequencies as proxies forprobabilities of default. Under the regulatory approach, it is an admissible procedure both bymarket participants and regulators, which became a well-spread market practice especiallyunder the through-the-cycle approach.
Going one step further at this point we calculate the total compounded ECAP representedby a sum of the regulatory Pillar 1 CR requirements and the Pillar 2 IRS-based historic VaRIRR requirements and compare this compounded ECAP to the ECAP estimated followingthe proposed herein integrated derivative-based approach to risk assessment.
It is worth noting that the developed herein integrated risk assessment builds upon astandard historic VaR technique, commonly employed for evaluating impacts of segregaterisks considered as stand-alone. But the presented innovativemodelingmethodology allowedus to apply thewell-known historicVaR technique to simultaneously assess impacts producedby joint dynamics of several risks. Herein we consider just two of them, interest rate risk andcredit risk. So, diverting from mainstream segregated VaR approaches, we apply the historicVaR technique to the time-series, which were generated taking into account the aggregatevalue impacts coming simultaneously from different risk parameters, namely interest ratesand credit spreads.
In Tables 13, 14, and 15 we explicitly show the delta between the results of these twoapproaches. For instance, for columnAdatawemay say that the segregate approach subsumes
123

Ann Oper Res
Table9
Potentially
achievableredu
ctionin
ECAPun
derop
timalhedg
econd
ition
s
31-12-20
0731
-12-20
0831
-12-20
0931
-12-20
1031
-12-20
1131
-12-20
1231
-12-20
13-201
4
Potentiallyachievab
leredu
ctionin
ECAP(%
)of
nominal
Brazil
6.11
6.13
6.13
11.51
11.51
3.85
3.96
3.96
Hungary
7.52
3.95
3.95
11.94
6.66
3.60
0.75
0.75
Malaysia
6.41
2.65
2.65
8.92
8.34
1.32
1.73
1.73
Mexico
7.14
3.95
4.24
11.75
11.75
7.24
2.54
2.54
Poland
7.94
0.72
0.79
5.81
3.05
3.05
0.02
0.02
SouthAfrica
7.16
4.45
4.45
12.69
13.94
5.99
4.50
4.50
Thailand
6.96
2.21
2.21
8.07
7.52
0.04
0.29
1.24
Turkey
6.21
4.69
4.69
13.39
13.96
1.36
1.95
2.21
Average
6.93
3.59
3.64
10.51
9.59
3.31
1.97
2.12
123

Ann Oper Res
0.00
2.00
4.00
6.00
8.00
10.00
12.0020
07
2008
2009
2010
2011
2012
2013
2014
Disposable ECAP, %
Disposable ECAP mean, %
Fig. 3 Potentially disposable stock of ECAP for the bond portfolio of the Advanced EM countries hedgedagainst the downside risk by optimized IRS contracts
the information content of the already existed mainstream historic VaR approach, while forthe column D it is valid to state that the newly developed modeling permits to draw newrelationship between the considered risk parameters and the economic capital requirementsallowing to withstand eventual adverse crystallizations of interest rate and credit risk.
Hence, it is empirically demonstrated that the results of the proposed derivative-basedintegrated approach to the risk assessment are consistent with the Basel III IRB Foundationapproach. The average delta, excluding turmoil subjected Cyprus, is about 1.39% certifyingthat proposed herein approach is competitive in the sense that its outcomes present a lessercapital chargewhile compared to the outcomes of the regulatory formula under the segregatedrisk treatment. Additionally, being more issuer specific our derivative-based approach tointegrated treatment of IRR and CR seems to be more comprehensive and, thus, allowingfor better optimizing of economic capital to be held by a bank in order to withstand the jointimpact of IRR and country specific CR.
4.5 ECAP for a portfolio of selected EM countries
To study how the ECAP calculated following the proposed herein integrated derivative-basedapproach behaves along the time we select eight Advanced EM countries, namely Brazil,Hungary, Malaysia, Mexico, Poland, South Africa, Thailand, and Turkey. We choose thesecountries as they belong to Advanced EM and as only for these Advanced EM countrieswe managed to have an access to the necessary length of historical CDS spread quotes. Weperform ourmodeling for all the years for whichwe have a regulatoryminimum of 5Y historyfor VaR analysis. Figure 4 depicts the dynamics of the ECAP following both, the integratedand the segregated approach to the risk assessment. These calculations are made directly onthe eight-countries portfolio level and thus benefit from credit risk diversification.
As could be seen from Fig. 4, the integrated approach to risk assessment allows foroptimizing the ECAP.Wewould like to highlight that under our approach all the results couldbe drilled down in order to understand which components are responsible for major impacts.
123

Ann Oper Res
Table10
CRrequ
irem
entsfortheAdvancedEM:B
aselIIIFo
undatio
nversus
CDS-basedapproach
asof
Dec-201
4
Cou
ntry
Moo
dy’sforeign
currency
LTdebt
ratin
g
S&P’sforeign
currency
LTdebt
ratin
g
Baselratin
gin
S&Pnotatio
nBaselIIIFo
undatio
nregu
latory
CR
requ
irem
ents(%
)
CDS-basedCR
requ
irem
ents(%
)
Brazil
Baa2
BBB
−BBB
−4.52
4.95
Czech
Republik
A1
AA
−A
+2.09
5.13
Hungary
Ba1
BB
BB
6.89
16.17
Malaysia
A3
A−
A−
2.04
5.91
Mexico
A3
BBB
+BBB
+3.15
4.57
Poland
A2
A−
A−
2.04
8.52
SouthAfrica
Baa2
BBB
−BBB
−4.52
5.25
Thaila
ndBaa1
BBB
+BBB
+3.15
6.6
Turkey
Baa3
BB
+BB
+6.17
8.94
123

Ann Oper Res
Table11
CRrequ
irem
entsfortheSecond
aryEM:B
aselIIIFo
undatio
nversus
CDS-basedapproach
asof
Dec-201
4
Cou
ntry
Moo
dy’sforeign
currency
LTdebt
ratin
g
S&P’sforeign
currency
LTdebt
ratin
g
Baselratin
gin
S&Pnotatio
nBaselIIIFo
undatio
nregu
latory
CR
requ
irem
ents(%
)
CDS-basedCR
requ
irem
ents(%
)
Chile
Aa3
AA
−AA
−1.46
4.08
China
Aa3
AA
−AA
−1.46
6.00
Colom
bia
Baa2
BBB
BBB
3.46
4.75
Dub
aiBBB
+n.a.
BBB
+3.15
3.66
Egy
ptB3
B−
B−
13.93
17.3
Indo
nesia
Baa3
BB
+BB
+6.17
7.73
Pakistan
B3
B−
B−
13.93
10.67
Peru
A3
BBB
+BBB
+3.15
4.86
Philipp
ines
Baa2
BBB
BBB
3.46
5.88
Russia
Ba1
BB
+BB
+6.17
16.81
123
Ann Oper Res
Table12
CRrequ
irem
entsfortheFron
tiermarkets:B
aselIIIFo
undatio
nversus
CDS-basedapproach
asof
Dec-201
4
Cou
ntry
Moo
dy’sforeign
currency
LTdebt
ratin
g
S&P’sforeign
currency
LTdebt
ratin
g
Baselratin
gin
S&Pnotatio
nBaselIIIFo
undatio
nregu
latory
CR
requ
irem
ents(%
)
CDS-basedCR
requ
irem
ents(%
)
Bahrain
Baa1
BBB
−BBB
−4.52
11.09
Cyp
rus
B3
B+
B−
13.93
43.00
Estonia
WR
AA
−AA
−1.46
4.52
Lith
uania
A3
A−
A−
2.04
5.97
Morocco
Ba1
BBB
−BB
+6.17
8.33
Rom
ania
Baa3
BBB
−BBB
−4.52
11.08
Serbia
B1
BB
−B
+10
.04
9.94
Slovakia
A2
AA
2.00
11.79
Slovenia
Baa3
A−
BBB
−4.52
17.37
Tunisia
Ba1
NR
BB
+6.17
6.80
Vietnam
B1
BB
−B+
10.04
12.68
123

Ann Oper Res
Table13
Basel
IIIFo
undatio
nCRplus
theIR
S-basedhistoric
VaR
IRRrequ
irem
entsversus
ECAPrequ
irem
entscalculated
accordingto
thehistoric
VaR
derivativ
e-based
risk-integratin
gapproach.A
dvancedEM,asof
Decem
ber20
14
Cou
ntry
IRS-basedIR
RECAP
requ
irem
ents(%
)BaselIIIFo
undatio
nregu
latory
CR
requ
irem
ents(%
)
Totalcom
poun
ded
Pillar1CR+Pillar2
IRRECAP(%
)
Derivative-based
risk-integratin
gapproach
ECAP(%
)
Delta(%
)
AB
C=
A+
BD
E=
C−
D
Brazil
5.29
4.52
9.81
8.84
0.97
Czech
Repub
lic5.30
2.09
7.39
4.86
2.53
Hungary
5.16
6.89
12.05
12.86
−0.81
Malaysia
5.30
2.04
7.34
7.08
0.26
Mexico
5.30
3.15
8.45
6.45
2.00
Poland
5.29
2.04
7.33
7.31
0.02
SouthAfrica
5.29
4.52
9.81
9.60
0.21
Thailand
5.29
3.15
8.44
7.29
1.15
Turkey
5.27
6.17
11.44
10.2
1.24
123

Ann Oper Res
Table14
Basel
IIIFo
undatio
nCRplus
theIR
S-basedhistoric
VaR
IRRrequ
irem
entsversus
ECAPrequ
irem
entscalculated
accordingto
thehistoric
VaR
derivativ
e-based
risk-integratin
gapproach.S
econ
dary
EM,asof
Decem
ber20
14
Cou
ntry
IRS-basedIR
RECAP
requ
irem
ents(%
)BaselIIIFo
undatio
nregu
latory
CR
requ
irem
ents(%
)
Totalcom
poun
ded
Pillar1CR+Pillar2
IRRECAP(%
)
Derivative-based
risk-integratin
gapproach
ECAP(%
)
Delta(%
)
AB
C=
A+
BD
E=
C−
D
Chile
5.31
1.46
6.77
5.76
1.01
China
5.31
1.46
6.77
6.35
0.42
Colom
bia
5.30
3.46
8.76
6.62
2.14
Dubai
5.21
3.15
8.36
4.41
3.95
Egy
pt5.13
13.93
19.06
17.09
1.97
Indo
nesia
5.27
6.17
11.44
10.25
1.19
Pakistan
4.86
13.93
18.79
10.31
8.48
Peru
5.30
3.15
8.45
6.89
1.56
Philippines
5.29
3.46
8.75
5.17
3.58
Russia
5.28
6.17
11.45
17.20
−5.75
123

Ann Oper Res
Table15
Basel
IIIFo
undatio
nCRplus
theIR
S-basedhistoric
VaR
IRRrequ
irem
entsversus
ECAPrequ
irem
entscalculated
accordingto
thehistoric
VaR
derivativ
e-based
risk-integratin
gapproach.F
rontiermarkets,asof
Decem
ber20
14
Cou
ntry
IRS-basedIR
RECAP
requ
irem
ents(%
)BaselIIIFo
undatio
nregu
latory
CR
requ
irem
ents(%
)
Totalcom
poun
ded
Pillar1CR+Pillar2
IRRECAP(%
)
Derivative-based
risk-integratin
gapproach
ECAP(%
)
Delta(%
)
AB
C=
A+
BD
E=
C−
D
Bahrain
5.18
4.52
9.70
10.44
−0.74
Cyp
rus
4.89
13.93
18.82
41.04
Estonia
5.30
1.46
6.76
4.72
2.04
Lith
uania
5.27
2.04
7.31
5.55
1.76
Morocco
5.25
6.17
11.42
7.05
4.37
Rom
ania
5.18
4.52
9.70
7.52
2.18
Serbia
5.12
10.04
15.16
9.29
5.87
Slovakia
5.28
2.00
7.28
9.21
−1.93
Slovenia
5.14
4.52
9.66
15.66
−6.00
Tunisia
5.20
6.17
11.37
8.07
3.3
Vietnam
5.20
10.04
15.24
11.98
3 .26
123

Ann Oper Res
0
5
10
15
20
25
30
31-12-2007 31-12-2008 31-12-2009 31-12-2010 31-12-2011 31-12-2012 31-12-2013 31-12-2014
Intergrated EC
Compounded EC
Fig. 4 Comparison of derivative-based ECAP under integrated versus segregated approach; 5Y long VaRanalysis for year-ends between 2007 and 2014. Source Bloomberg, authors’ calculations
For example, the 4years long plateau-behavior of the ECAP under the integrated approachcould be easily interpreted and comprehensively understood. This plateau-behavior has itsorigin in the fact that the VaR series used in calculations for these 4years, all they containthe maximum yearly crisis-driven increase in credit spreads. Thus, for the four consecutiveyears, namely, 2008, 2009, 2010, and 2011, the percentile analyses result in the very sameoutcomes.
The 2007–2008 increase in the ECAP under the integrated approach is attenuated incomparison to the ECAP under the segregated approach. It is easily comprehensible takinginto consideration the existence of diversification mechanisms between the IRR and CR,discussed in the previous subsections. The integrated ECAP behavior is consistent with thedynamics of the creditworthiness of sovereign EM issuers, as during the global financialcrisis and its aftermath, there was observed only slight increase in default occurrences in EMsovereign debt.
5 Conclusion
This research addresses the ECAP quantification methodology based on an integratedderivative-based treatment of IRR and CR. We apply our approach to the EM sovereigndebt portfolios. This study represents a long needed attempt to define a common basis fordiscussion between banking industry and financial markets regulators. We demonstrate thatan integrated treatment of the IRR and CR accompanied by the analyses of ECAP-wise IRsensitivity of assets can result in an optimized ECAP figures. That is of a special importanceto banks and financial institutions of EM geographies.
We find that the ECAP requirements under the integrated approach are consistently lowerthan the ECAP requirements quantified following the segregated approach just to CR assess-ment. This suggests that the hedging of downside risk could be based on augmenting exposureto the IRR under distressed economic conditions.
123
Ann Oper Res
We demonstrate that the ECAP-wise cross-elasticity is a function of the considered phaseof a business cycle. For exposures with interest risk elasticity values below minus one thedownside risk could be potentially hedged by pay-float receive-fixed IRS contracts, whilethe downside risk of positions with ECAP-wise elasticity above minus one could be hedgedby pay-fixed receive-float IRS contracts.
Our approach potentially allows for distilling liquidity components present in yields bysubtracting the CR and IRR related components from the bond yield.
Finally, we benchmark the proposed derivative-based integrated approach against theBasel III regulation using Basel II/III formula for the CR capital requirements under the inter-nal ratings based (IRB) Foundation approach. It is shown that the proposed herein approachis consistent with the benchmark.
It serves as an additional argument that appeals for better acceptance by the Basel Com-mittee of the joint risk treatment as an appropriate approach to assess ECAP requirementsof financial institutions. Although for internal management processes banks and financialinstitutions in principle can use whatever risk measurement techniques they choose, pre-dominantly only mainstream segregate risk-specific VaR approaches are employed so far insupervisory review and evaluation process (SREP) guided by regulators.
We consider our research as a piece of a promotion effort, necessary for the regulatoryadmittance of joint risk approaches inmeasuring financial institutions’ exposures. Because ofimperfect correlations between risks, the ECAP based on integrated treatment of constituentrisks is smaller than the sum of the individual risk-specific ECAPs. In the considered hereincase: ECAPIntegrated < ECAPCR + ECAPIRR. Thus, being unwilling to accept the benefitsof inter-risk diversification in setting capital requirements, bank regulators, in their attempt tocover potential unidentified risks, systematically overplay the identified risk exposures facedby financial institutions.
Although this research addresses a regulatory perspective of the IRR and CR integrationrelative to the EM government debt, looking ahead, we can affirm that the applicability ofthe integrated derivative-based approach is considerably wider than the sovereign debt ofEM. Thus, further research in this field is highly desirable for positively impacting overallefficiency of financial system as it potentially allows banks and financial institutions toimprove their risk assessment and ECAPmanagement, while unleashing capital which couldbe used to further increase financial fueling of the economy.
Acknowledgements Financial support by FCT (Fundação para a Ciência e a Tecnologia), Portugal is grate-fully acknowledged. This article is part of the Strategic Project (UID/ECO/00436/2013).
References
Alexander, C. (2008). Value-at-risk models. London: Willey.Alessandri, P., & Drehmann, M. (2010). An economic capital model integrating credit and interest rate risk in
the banking book. Journal of Banking and Finance, 34(4), 730–742.Basel Committee on Banking Supervision (BCBS). (2011). Basel III: A global regulatory framework for more
resilient banks and banking systems. http://www.bis.org/publ/bcbs189.pdfBasel Committee on Banking Supervision (BCBS). (2016). Interest rate risk in the banking book. http://www.
bis.org/bcbs/publ/d368.pdfBoulkeroua, M., & Stark, A. (2013). On the determinants of the sensitivity of the yield spread of corporate
bonds to changes in the level and slope of the yield curve. In N. Apergis (Ed.), Proceedings of the IVworld finance conference (pp. 118–167).
Chen, R., Cheng, X., &Wu, L. (2013). Dynamic interactions between interest-rate and credit risk: Theory andevidence on the credit default swap term structure. Review of Finance, 17(1), 403–441.
123

Ann Oper Res
Chen, R., Yang, L., Wang, W., & Tang, L. (2015). Discovering the impact of systemic and idiosyncratic riskfactors on credit spread of corporate bond within the framework of intelligent knowledge management.Annals of Operations Research, 234, 3–15. doi:10.1007/s10479-014-1727-y.
European Parliament. (2013). Regulation (EU) No. 575/2013. http://www.eur-lex.europa.euFTSE International Limited. (2014). FTSE country classification process. http://www.ftse.comFuerst, F., McAllister, P., & Sivitanides, P. (2015). Flight to quality? An investigation of changing price spreads
in commercial real estate markets. Studies in Economics and Finance, 32(1), 2–16.Gubareva, M. (2014). Financial instability through the prism of flight-to-quality. Saarbrucken: Lambert Aca-
demic Publishing.Gubareva, M., & Borges, M. (2016a). Typology for flight-to-quality episodes and downside risk measurement.
Applied Economics, 48(10), 835–853. doi:10.1080/00036846.2015.1088143.Gubareva, M. & Borges, M. (2016b). Binary interest rate sensitivities of emerging market corporate bonds. In
Z. Serrasqueiro, F. Sardo & J. Leitão (Eds.) Proceedings of the 9th Finance conference of the Portuguesefinance network (PFN) (pp. 1685–1718). Covilha: Universidade da Beira Interior. ISBN: 978-989-654-300-6
InternationalMonetary Fund. (2015).Global financial stability report, October 2015: Vulnerabilities, legacies,and policy challenges—risks rotating to emerging markets.
International Monetary Fund. (2016). Global financial stability report, April 2016: Potent policies for asuccessful normalization.
Jermann, U. & Yue, V. (2013). Interest rate swaps and corporate default. Working paper series No. 1590.European Central Bank.
Landschoot, A. (2008). Determinants of yield spread dynamics: Euro versus US dollar corporate bonds.Journal of Banking and Finance, 32(12), 2597–2605.
Lin, E., Sun, E., & Yu, M. (2016). Systemic risk, financial markets, and performance of financial institutions.S.I.: Financial Economics. Annals of Operations Research, 1–25 doi:10.1007/s10479-016-2113-8.
Moody’s. (2015).Annual default study corporate default and recovery rates, 1920–2014. https://www.moodys.com/researchandratings.
Neal, R., Rolph, D., Dupoyet, B., & Jiang, X. (2015). Interest rates and credit spread dynamics. The Journalof Derivatives, 23(1), 25–39.
Standard & Poor’s. (2015). Default, transition, and recovery: 2014 Annual global corporate default study andrating transitions. http://www.standardandpoors.com/ratingsdirecty.
Tang, D. Y., & Yan, H. (2010). Market conditions, default risk and credit spreads. Journal of Banking andFinance, 34(4), 743–753.
Zimper, A. (2014). The minimal confidence level of Basel capital regulation. Journal of Banking Regulation,15(2), 129–143.
123