Embed Size (px)
Citation preview

Proceedings of the Institution of Civil Engineers
Geotechnical Engineering 165 August 2012 Issue GE4
Pages 247–266 http://dx.doi.org/10.1680/geng.9.00091
Paper 900091
Received 23/11/2009 Accepted 03/02/2011
Published online 15/05/2012
Keywords: excavation/field testing & monitoring/retaining walls
ICE Publishing: All rights reserved
Geotechnical EngineeringVolume 165 Issue GE4
Retaining walls in Dublin Boulder Clay,IrelandLong, Brangan, Menkiti, Looby and Casey
Retaining walls in DublinBoulder Clay, Irelandj1 Michael Long MEngSc, PhD, CEng, MICE, MIEI
Senior Lecturer, University College Dublin, Ireland
j2 Carl Brangan PhDGeotechnical Engineer, Applied Ground Engineering Consultants(AGEC) Ltd, Bagenalstown, County Carlow, Ireland
j3 Christopher Menkiti MSc, PhD, CEng, MICEAssociate Director, Geotechnical Consulting Group, London, UK
j4 Michael Looby BAI, MScDirector, Byrne Looby Partners, Dublin, Ireland
j5 Patrick Casey MIEIAssociate, ARUP Consulting Engineers, Dublin, Ireland
j1 j2 j3 j4 j5
A good number of deep excavations have been recently completed in Dublin Boulder Clay, Ireland. These have
included propped walls up to 25 m deep and permanent cantilevers 7.5 m high. Experience elsewhere in the world
was used to design and construct these walls. However, case history data have shown that the behaviour of the
walls in Dublin Boulder Clay is very rigid and much stiffer than comparable systems worldwide. It appears this
behaviour is due to the inherent natural strength and stiffness of the soil and the slow dissipation of excavation-
induced depressed pore pressures or suctions. There appears to be scope for developing more efficient designs and
in particular for reducing propping requirements. For temporary works, the use of undrained parameters in
serviceability limit state calculations together with implementation of the observational approach on site could be
considered for future schemes.
1. IntroductionOver the previous 15 years, economic growth in Ireland has led
to an increase in the use of underground space, with some
developments now including four underground levels. Valuable
full-scale data have been obtained from a good number of these
projects. The purpose of this paper is to provide an overview of
aspects relating to the design, construction and behaviour of
retaining walls in Dublin Boulder Clay. Specifically the paper
will
j briefly review the background geology and ground conditions
j outline the presently used design approach
j review in detail the general behaviour of walls in Dublin
Boulder Clay by reference to four case histories namely:
j lightly supported ‘regular’ wall for 6 m excavation at
Leinster House where pore water and earth pressure
changes were measured in additional to regular
monitoring
j 7.5 m excavation for relatively highly stressed anchored
wall at Trinity College Library
j 7 m cantilever wall excavation at Ballycullen Road where
monitoring information for some six years is available
j 17.5 m excavation at the northern cut and cover section
of the Dublin Port Tunnel project, which is among the
deepest excavations carried out in Dublin to date
j present an overall summary of the behaviour of retaining
walls in Dublin Boulder Clay compared to similar support
systems worldwide
j provide some overall conclusions and recommendations for
the design and construction of future similar schemes.
An exception to the general cover of Dublin Boulder Clay is an
area north of the city centre where an old channel of the River
Liffey has been infilled with fluvio-glacial sands and gravels.
This period has also seen the development of marginal sites, for
example areas of Dublin docklands, built on recent filling over
soft alluvial soils to reclaim land. These sites previously would
have been considered unsuitable for deep basement construction.
Issues relating to the design, construction and performance of
walls in these two areas are the subject of two separate papers by
Long et al. (2012a, 2012b).
2. Background geology, ground conditionsand soil parameters
Bedrock in the Dublin area is a thin to medium interbedded
homogeneous grey argillaceous limestone and calcareous shale.
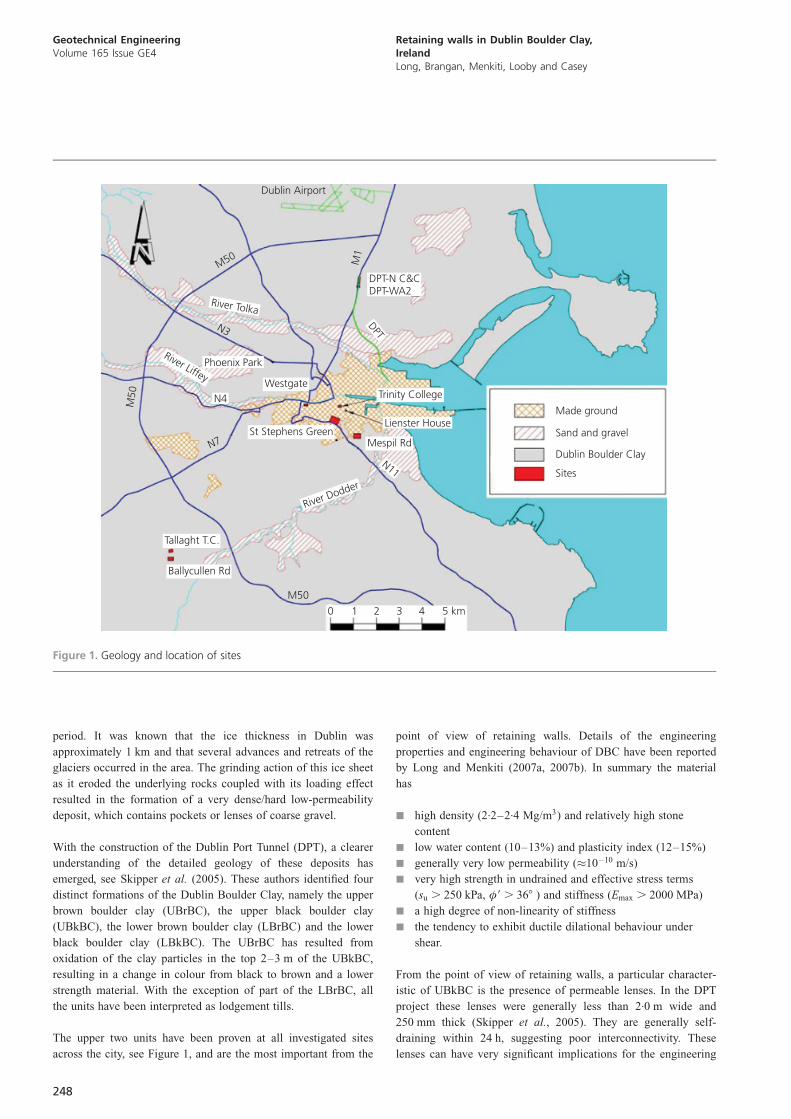
Over much of the city, it is overlain by glacial deposits, known
colloquially as Dublin Boulder Clay (DBC), as shown on Figure
1. This is hard lodgement till, which was deposited beneath the
ice sheet that covered much of Ireland during the Pleistocene
247
period. It was known that the ice thickness in Dublin was
approximately 1 km and that several advances and retreats of the
glaciers occurred in the area. The grinding action of this ice sheet
as it eroded the underlying rocks coupled with its loading effect
resulted in the formation of a very dense/hard low-permeability
deposit, which contains pockets or lenses of coarse gravel.
With the construction of the Dublin Port Tunnel (DPT), a clearer
understanding of the detailed geology of these deposits has
emerged, see Skipper et al. (2005). These authors identified four
distinct formations of the Dublin Boulder Clay, namely the upper
brown boulder clay (UBrBC), the upper black boulder clay
(UBkBC), the lower brown boulder clay (LBrBC) and the lower
black boulder clay (LBkBC). The UBrBC has resulted from
oxidation of the clay particles in the top 2–3 m of the UBkBC,
resulting in a change in colour from black to brown and a lower
strength material. With the exception of part of the LBrBC, all
the units have been interpreted as lodgement tills.
The upper two units have been proven at all investigated sites
across the city, see Figure 1, and are the most important from the
point of view of retaining walls. Details of the engineering
properties and engineering behaviour of DBC have been reported
by Long and Menkiti (2007a, 2007b). In summary the material
has
j high density (2.2–2.4 Mg/m3) and relatively high stone
content
j low water content (10–13%) and plasticity index (12–15%)
j generally very low permeability (�10�10 m/s)
j very high strength in undrained and effective stress terms
(su . 250 kPa, �9 . 368 ) and stiffness (Emax . 2000 MPa)
j a high degree of non-linearity of stiffness
j the tendency to exhibit ductile dilational behaviour under
shear.
From the point of view of retaining walls, a particular character-
istic of UBkBC is the presence of permeable lenses. In the DPT
project these lenses were generally less than 2.0 m wide and
250 mm thick (Skipper et al., 2005). They are generally self-
draining within 24 h, suggesting poor interconnectivity. These
lenses can have very significant implications for the engineering
Dublin Airport
M50
M50
Phoenix Park
N4
St Stephens GreenN7
Tallaght T.C.
Ballycullen Rd
DPT-N C&CDPT-WA2
M1
Made ground
Sand and gravel
Dublin Boulder Clay
Sites
Trinity College
Lienster House
N11
Mespil Rd
M50
Westgate
DPT
River Liffey
River Tolka
N3
River Dodder
0 1 2 3 4 5 km
Figure 1. Geology and location of sites
248
Geotechnical EngineeringVolume 165 Issue GE4
Retaining walls in Dublin Boulder Clay,IrelandLong, Brangan, Menkiti, Looby and Casey

behaviour of the UBkBC, as will be described later. They can, for
example, permit rapid dissipation of induced suctions in open
steep excavations leading to failures. Also the LBrBC unit
contains more frequent, larger and more complex silt/gravel
lenses and cobble lines than the UBkBC. At the DPT site a
continuous 2 m thick layer of silty sand/fine gravel exists within
the LBrBC unit at 10–16 m depth.
Finally at the DPT site, lensoid rafts of the LBrBC up to 15 m
long were found within the UBkBC, close to its true boundary
with the LBrBC. These rafts were slabs of basal material that
were detached, transported, redeposited and recompacted within
the new lodgement till by the glacier. Occasionally rafts of
limestone can also be found within the LBkBC. These are
important in ground investigations and design as they can be
mistaken for intact bedrock (‘false’ rockhead).
3. DesignCurrent geotechnical design procedures for retaining walls in
Dublin Boulder Clay often involve the following steps.
(a) Following the general guidelines of Gaba et al. (2003) or BS
8002 (BSI, 1994), for ultimate limit state, determine the
required retaining wall toe penetration using effective stresses
and conventional free earth or fixed earth embedded wall
calculations. Safety is introduced in various ways, for
example by applying a partial safety factor of 1.3 to the
tangent of the effective constant volume friction angle (�9cv).
Effective cohesion (c9) is usually assumed to be zero and
water pressures are taken as hydrostatic from the groundwater
table (typically at about 2 m). Calculations are often
performed by hand, using conventional Rankine active and
passive earth pressure theory, or with the aid of a relatively
simple piece of computer software such as Oasys–Stawal1,
ReWard1 or Support-It1:
(b) If the retaining wall is required for permanent long-term use,
check that this toe penetration is adequate to support any
vertical loads and also to prevent significant water seepage.
(c) Determine wall bending moments, shears, prop/waler forces
and lateral wall movements (serviceability limit state) by
means of a beam–spring computer program such as Oasys–
Frew1 (perhaps the most popular choice), Wallap1 or
ReWard1:
(d ) As programs such as Frew1 are only able to determine wall
displacements and not the associated ground movements,
these ‘green-field’ movements are often predicted using
empirical based methods, which were developed in the UK
and USA, for example by Clough and O’Rourke (1990).
These predictions can be adjusted to allow for the effects of
the nature of the building and its stiffness if appropriate.
Possible building damage is then assessed by comparing
predicted building differential settlement, angular rotations or
similar, with empirically based tolerable limits, such as those
of Burland et al. (1977).
4. Case history for ‘regular’ retaining wall –Leinster House
4.1 Scheme
Although the depth of excavation involved at this site is
relatively modest, it is of interest owing to its proximity to a
number of important historical buildings and the availability of
additional data from instruments such as pore pressure sensors
and total earth pressure cells. The site location is shown on
Figure 1, with the development bounded immediately to the
south by Leinster House (with the Senate Room overlooking the
site), to the east by the National Gallery of Ireland (but
separated from the new building by Dessie’s Lane), to the
southeast by a sensitive masonry wall referred to as the ‘curved
wall’ and to the west by the former National College of Art and
Design (NCAD), which has since been refurbished and is now
part of the National Library. This latter structure was potentially
the most sensitive of the neighbouring buildings, see Brangan
(2007).
Details of the ground conditions, retaining system and monitoring
scheme for the NCAD side (west) of the site, are shown on
Figure 2. This structure has a masonry structural frame and was
particularly sensitive as it is historically important, had relatively
inadequate foundations, was in poor condition and its foundations
were located within 1 m of the retaining wall. Before the
development, the foundations had been underpinned using con-
ventional mass concrete techniques to +5.9 m OD (metres above
ordnance datum). Ground conditions are typical for central
Dublin. The site is relatively small, being about 45 m 3 45 m in
plan area.
4.2 Construction
The following construction sequence was adopted.
(a) Clear site to an average of +7.5 m OD.
(b) Construct 600 mm diameter secant piled wall with piles at
500 mm centres; reinforcement comprised six T25 bars. The
piles were not socketed into the rock and the pile toes were at
the rock surface at between �1 m OD and �2 m OD. These
piles were constructed using two conventional large-diameter
rotary auger rigs within a steel guide. The rigs were 46 t and
63 t in mass and had torque capacity of 120 kN m and
172 kN m respectively. Typically four to five piles were
constructed per rig per day.
(c) Construct capping beam.
(d ) Cantilever excavation to +4 m OD. At any one location the
wall remained in this state for about 2 weeks.
(e) Insert five universal column (305UC158) raking props, at
approximately 458, in a locally excavated slot (see Figures 2
and 3). Props fixed at base with mass concrete plug and at
top to secant wall. Insert cross bracing at seven locations.
( f ) Complete excavation to +1.2 m OD. Excavation blinded
immediately on exposure. Again approximately 2 weeks
elapsed before the next stage was undertaken.
249
Geotechnical EngineeringVolume 165 Issue GE4
Retaining walls in Dublin Boulder Clay,IrelandLong, Brangan, Menkiti, Looby and Casey

(g) Construct basement slab and insert vertical ground anchors to
prevent long-term uplift. Ground anchors comprised strand
anchors installed into the bedrock using rotary percussive
techniques with high-pressure air flush.
4.3 Monitoring
In addition to conventional techniques for monitoring such as
inclinometers (installed in piles only), geodetic surveying using
electronic distance measurement (EDM) and surface-mounted
NCAD withmovement monitoring
on building
Dead load205 kN/m
�
Live load38 kN/m
�
Inclinometerin pile
N
NC
AD
Inclo 5
10 m
UC props
Cross props
Key plan
�7 m OD
�6 m OD
UC prop
600 mm diameterhard/hard secant pile wall
with piles at 500 mm centres
Piles drilled to top of rock
0 40 80 120SPT : blows/300 mmN
8
6
4
2
0
�2
Elev
atio
n: m
OD
Made ground
UBrBC
UBkBC
BHABHB
Limestone bedrock
�2 0 2 4 6 8 10
8
6
4
2
0
�2
Lateral movement: mm
Inclo-5NCADPredictionby Frew
Figure 2. Leinster House: retaining wall layout, ground conditions
and lateral wall movements on west side of site (NCAD)
N
Cross props
UC prop
10 m
Key plan
Incl
o 2
Des
sie’
s La
ne
0·2 m
Ground level 6·7 m OD
�6 m OD
UC prop
Dredge 1·2 m OD
Down load 270 kN/m�
Pressure cell 3·6 m OD
Pressure cell 2·6 m OD
Piezometer 2·0 m OD
Pressure cell 0·8 m ODPiezometer 0·3 m OD
Instruments approximately1 m from secant wall
�1 0 1 2 3 4Lateral movement: mm
8
6
4
2
0
�2
Inclo-2Dessie’s Lane
Elev
atio
n: m
OD
Figure 3. Leinster House: retaining wall layout, location of
instruments and lateral wall movements on east side of site
(National Gallery)
250
Geotechnical EngineeringVolume 165 Issue GE4
Retaining walls in Dublin Boulder Clay,IrelandLong, Brangan, Menkiti, Looby and Casey

strain gauges, three vibrating wire piezometers and three total
pressure cells were installed approximately 1 m behind the secant
pile wall at the National Gallery (east) side of the site, see Figure
3. As it was not possible to push these instruments into the stony
ground, the piezometers were installed in sand and the pressure
cells were embedded within a cement–bentonite mix with similar
strength and stiffness properties to the boulder clay. This material
also formed a seal above and below the piezometers.
4.4 Monitoring results
Results of lateral movements of the retaining walls are shown for
the NCAD (west) side and the National Gallery (east) sides of
the site on Figures 2 and 3 respectively. Overall the movements
are very small, being a maximum of 3 mm and 1 mm on the west
and east sides respectively. Note that the inclinometers were
installed within the piles and did not extend below. These values
are perhaps on the limits of the measuring accuracy of the
equipment. Similarly the EDM measured structure movements
varied between 0 and �3 mm again at the limits of measuring
accuracy. The movement profile at the National Gallery in
particular is typical for retaining walls in Dublin Boulder Clay.
Results of monitoring of total earth pressure cells and piezo-
meters are shown on Figures 4(a) and 4(b) respectively. The
deepest pressure cell (at +0.8 m OD, slightly below formation
level) showed a total pressure drop of about 10 kPa in response to
total stress release during excavation and a further 5 kPa in the
following 2 weeks. It then remained roughly constant until the
vertical ground anchors were installed, after which it gradually
increased. The highest pressure cell at +3.6 m OD gave almost
constant readings for the entire monitoring period while that at
+2.6 m OD gave fluctuating values during the first 5 weeks
(possibly due to grout cracking) and then remained relatively
constant. These small stress changes are consistent with very
small wall movements.
Similarly to the lower pressure cell, both piezometers recorded a
drop of about 6 kPa during excavation. This occurred entirely
during the second lift of the excavation from +4.0 m OD to
+1.2 m OD. Readings remained almost constant until ground
anchor construction, when a drop of about 5 kPa was measured.
This was possibly due to the effects of air pressures from anchor
construction within 10 m of the wall. Subsequently the readings
gradually returned to their original values.
Effective stress changes (calculated from the above) around
+0.5 m OD and around +2.3 m OD are shown on Figure 4(c). At
the deeper level there was an approximate 10 kPa drop in
effective stress, whereas at the upper level effective stresses
increased by about 10 kPa before returning to their original
values at the end of the monitoring period.
Attempts were made to monitor prop load using vibrating wire
strain gauges. However, temperature effects dominated the read-
ings and the actual construction-induced loads were difficult to
assess.
4.5 Comparison with predictions
A comparison between the measured and predicted movements
for the NCAD wall is also shown on Figure 2. These predictions
were made by Brangan (2007) using Oasys–Frew1 and the
undrained soil parameters summarised in Table 1. It can be seen
that the predictions are significantly greater than the measured
values. Frew1 predicts a more curved deflected shape (and hence
higher bending moments) than actually occurred. A particular
aspect of the predictions is the relatively large movements below
the toe of the wall. Brangan (2007) carried out a sensitivity
analysis by varying the input parameters. He found that the
output was relatively insensitive to undrained shear strength su
(once a value greater than about 100 kPa was chosen), K0 and
wall stiffness. Output was sensitive to choice of undrained
Young’s modulus, Eu, and to prop stiffness.
4.6 Comment
The measured stress changes are very small, much smaller than
would be predicted using conventional calculations, and are
consistent with the observed movements. It is clear that the
combination of the high strength and stiffness together with the
very low permeability of the boulder clay facilitates the construc-
tion of moderately deep basements with little influence on the
adjacent ground. This finding is not unlike that in other stiff clays
and has resulted in the adoption of the empirically based
minimum equivalent fluid pressure (MEFP), approach to give a
lower bound pressure limit, see Gaba et al. (2003). Experience in
Dublin, reported by Long et al. (2003) would suggest that an
excavation, such as that at Leinster House, could have been
completed successfully by open cut without any retaining system.
5. Case history for relatively highly stressedwall – Trinity College Library
5.1 Scheme
The location, shown on Figure 1, was adjacent to the existing
Berkeley Library building and combined Arts Building and
Lecky Library (to the north and northwest of the new building
respectively). Both are relatively modern buildings. The Trinity
College playing fields were to the east. The southern edge of the
excavation runs parallel to a masonry wall separating the college
grounds from Nassau Street, which is a busy thoroughfare linking
north and south Dublin (Brangan, 2007).
Although monitoring was carried out by inclinometers at eight
locations around the site, the focus here is on the Nassau Street
side, where the wall was mostly highly stressed and the greatest
movements occurred. Details of the retaining system and ground
conditions are shown in Figure 5. Ground conditions comprise fill
over medium dense to very dense silty sandy gravel over the
Dublin Boulder Clay. Limestone bedrock is at about �7 m OD on
the Nassau Street side of the site. Although conditions are typical
251
Geotechnical EngineeringVolume 165 Issue GE4
Retaining walls in Dublin Boulder Clay,IrelandLong, Brangan, Menkiti, Looby and Casey

for central Dublin, the SPT N values are relatively high,
particularly below +1 m OD and many refused on cobbles and
boulders.
5.2 Construction
Along Nassau Street an approximately 9 m long secant piled
retaining wall was used to retain the 7.4 m deep dig. The piles
were 600 mm in diameter with reinforced piles at 1.1 m centres
with toe level at about �7 mOD. Reinforcement comprised six
T25 bars over the full length of the piles. The unreinforced piles
comprised lower grade concrete. The piles were constructed using
the continuous flight auger (CFA) technique with a 45 t rig which
had 60 kN pull-down force and a 100 kN m torque. This proved
inadequate to drill through boulders at approximately 6 m depth
20
10
0
�10
�20
Cha
nge
in t
otal
hor
izon
tal s
tres
s: k
Pa
12/10/98 21/11/98 31/12/98 9/2/99 30/4/99
Cell 0·8 m OD
Cell 2·6 m OD
Cell 3·6 m OD
40
30
20
10
0
Piez
omet
ric p
ress
ure:
kPa Ex
cava
tion
Gro
und
anch
ors
Piezo 0·3 m OD
Piezo 2·0 m OD
12/10/98 21/11/98 31/12/98 9/2/99 30/4/99
21/3/99(a)
21/3/99(b)
20
10
0
�10
30
Cha
nge
in t
otal
hor
izon
tal s
tres
s: k
Pa
12/10/98 21/11/98 31/12/98 9/2/99 30/4/99
0·3 and 0·8 m OD
2·0 and 2·6 m OD
21/3/99(c)
Figure 4. Leinster House: (a) total earth pressure changes;
(b) piezometric pressures; (c) effective stress changes
252
Geotechnical EngineeringVolume 165 Issue GE4
Retaining walls in Dublin Boulder Clay,IrelandLong, Brangan, Menkiti, Looby and Casey

and had to be supplemented with eccentric overburden (ODEX)
drilling using a 640 mm drill, which readily dealt with the
boulders encountered. No rock sockets were constructed. Overall
progress of the piling work varied between 10 and 15 piles per
day. Overbreak was not significant and never greater than 5–
10%.
As can be seen on Figure 5, two rows of anchors, at about +1.8 m
OD and �2 m OD and at 3–6 m centres, were used to prop the
wall on the Nassau Street side. A small prestress, imposed by
manual tightening, was applied to the anchors.
Basement construction took approximately 6 months with up to 2
months being required to install ground anchors at a particular
level. Otherwise excavation proceeded as rapidly as allowed by
conventional plant and the formation was blinded immediately on
exposure.
5.3 Monitoring results
Several of the inclinometer tubes did not extend as far as the
dredge level as it proved difficult to get them into the CFA piles.
Lateral movements and wall bending were considerably greater
along the Nassau Street side of the site than elsewhere, see Figure
5. This was because significant surcharge existed along Nassau
Street due to the presence of the busy road. In addition, sumps
located beside inclinometer Nassau 2 locally increased the dig
level to �6.8 m OD. At least 7 mm of displacement was recorded
in both inclinometers, although 12 mm or more relative move-
ment may be inferred from the shape of the profile at Nassau 2.
The profiles shown in Figure 5 are the maximum observed
Material General Undrained Drained
K0 ª: kN/m3 Eu: MPa su: kPa E9: MPa �9: deg c9: kPa
DBC 1.3 22.5 100–120 300 80 36 0
Limestone 1.0 25 1000 500 800 45 0
Note: K0 ¼ coefficient of earth pressure at rest, ª ¼ unit weight, Eu/E9 ¼ undrained/drained Young’s modulus, su ¼ undrained shear strength,�9 ¼ effective friction angle, c9 ¼ effective cohesion.
Table 1. Summary of retaining wall analysis input parameters
Nassau Streetmasonry wall
Surcharge loading60 kPa at bothinclinometers
�
�1·8 m OD
Anchors at 40° andat 6 m centres
Anchors at 35° andat 3 m centres
N
Incl
o N
ass2
Incl
o N
ass1
AnchorsNassau St
Key plan
�2 m OD
Dig level 5·4 m ODbut locally 6·8 m OD
due to sumps
��
600 mm diameter cfahard/hard secant pile wall
with piles at 550 mm centresand inclinometers in pile.
Pile toe level approx. 7 m OD�
4
2
0
�2
�4
�6
�8
Elev
atio
n: m
OD
0 20 40 60 80 100
SPT : blows 300 mmN
Made ground
Glacial gravels
UBrBC
UBkBC
BHs 1–4BH5BH6
Limestone bedrock
�8 �4 0 4 8Lateral movement: mm
4
2
0
�2
�4
�6
�8
Inclo-Nass1Inclo-Nass2
Figure 5. Trinity College Library: retaining wall layout, ground
conditions and lateral wall movements on south side of site
(Nassau Street)
253
Geotechnical EngineeringVolume 165 Issue GE4
Retaining walls in Dublin Boulder Clay,IrelandLong, Brangan, Menkiti, Looby and Casey

movement. It was observed that up to 2 mm of the lateral
movement occurred during the period after the final excavation
and before the construction of the basement slab. After basement
slab construction no additional movement was observed.
5.4 Comment
Here again the measured movements were significantly less than
those predicted using conventional techniques, see Brangan
(2007). Despite the relatively high load on the wall and the lack
of a significant pile penetration below dig level, the recorded
movements are again relatively modest. Once again the inherent
properties of the boulder clay permit relatively deep excavation
without significant strains being developed.
6. Results for a 7.5 m cantilever wall –Ballycullen Road
Case histories similar to those described above have increased
design engineers’ confidence in the ability of the Dublin Boulder
Clay to sustain relatively large excavation-induced loading with
little support. Hence cantilever walls are now being constructed
for excavation depths of up to 8 m. Mostly, these walls are for
temporary works purposes with a design life of 6 months or less.
However, there are some examples of such walls being used in
the permanent condition, for example that at Ballycullen Road,
for which the design life is 50 years.
6.1 Scheme
This project was a residential development located at Hunters
Wood, Ballycullen Road in the Knocklyon area of Dublin, see
Figure 1, and is described in more detail by Looby and Long
(2007). An outline of the scheme, together with the ground
conditions and recorded lateral wall movements, are shown on
Figure 6. Ground level is at about +107 m OD and ground
conditions at the site consisted predominantly of glacial till. SPT
N values were very variable, but were generally consistent with
competent very stiff to hard boulder clay. Groundwater was
encountered at the interface of the UBrBC and UBkBC.
Effective stress design parameters, as summarised in Table 1,
were used for the long-term ultimate limit state design analyses.
Groundwater pressures were determined from simple seepage
calculations. No non-pure two-dimensional cantilever effects were
assumed in the design and the relieving slab was assumed to act
as a simple prop only. Undrained soil parameters, again sum-
marised in Table 1, were used for the serviceability limit state
calculations. Predicted pile deflections were 40 mm and 45 mm
respectively in the temporary and permanent conditions.
The retaining wall comprised a 600 mm diameter contiguous pile
wall with piles at 750 mm centres. Pile length varied between
9 m for a 4.4 m permanent cantilever and 14 m for a 6.3 m
permanent cantilever. The piles are reinforced over their full
length with eight T32 reinforcing bars. Although cantilever height
varied, the entire wall was designed to span 7.5 m during
construction. In the long term a basement concrete slab provided
a low-level prop/restraint and reduced the effective cantilever
height to some 6.5 m, see Figure 6. This slab was not structurally
fixed to the piles and acted as a simple prop only.
The methodology of construction was to follow the observational
High-levelaccess road
to development
0·6 m
Basement slab reducesmax. retained height to
6·3 m in long term
N
Key plan
Dig level 99·5 m OD(7·5 m retained height)
in temporary case
�
600 mm diametercontiguous piles
at 750 mm centreswith inclinometers
in piles
108
106
104
102
100
98
92
Elev
atio
n: m
OD
0 20 40 60 80 100
SPT : blows 300 mmN
Made ground
UBrBC
UBkBC
BH1BH2BH3
0 4 8
Lateral movement: mm
Inclo-B001Inclo-B002
2 m
Pile toe level 93 m OD� �
B002 – finalcantilever height
4·4 m�
B001 – finalcantilever height
6·3 m�
Wat
er m
ain
bene
ath
acce
ss r
oad
96
94
12 16108
106
104
102
100
98
92
96
94 Movements measured atend of excavations (week 28)
Figure 6. Ballycullen Road: retaining wall layout, ground
conditions and lateral wall movements at end of excavation
254
Geotechnical EngineeringVolume 165 Issue GE4
Retaining walls in Dublin Boulder Clay,IrelandLong, Brangan, Menkiti, Looby and Casey

approach as documented by Nicholson et al. (1999). As a result,
before commencement of construction a number of design,
construction and performance criteria (including contingency
measures) were established, including the following.
j If local gravel layers were encountered they would be
shotcreted to prevent loss of ground between piles.
j If more significant gravel layers were encountered a secant
pile wall solution would be installed.
j If movement levels in the construction stage exceeded a
trigger level of 25 mm, tie-back anchors would be installed.
These construction stage trigger values were selected to
ensure that subsequent deflections over the design life would
not be excessive. The main objective was to avoid damage to
the adjacent road and water pipe. Wayleaves for anchor
construction had been negotiated prior to the works. The
piling contractor was in a position to commence installation
of ground anchors within 12 h.
6.2 Construction
The retaining wall was constructed using the continuous flight
auger (CFA) technique with an 85 t, 250 kN m torque rig, which
has a pull-down force of 100 kN. Typically 15–20 revolutions/
min were required to progress the drilling and it took about
20 min to drill the full pile length. Overall progress of the piling
work varied between ten and 15 piles per day and no difficulties
were posed by cobbles and boulders. Overbreak was typically
5–10%.
In order to check for the presence of gravel lenses, every tenth
pile was initially constructed and the arisings were closely
monitored. No gravel deposits were encountered either in the pile
bores or in the subsequent bulk excavation.
6.3 Risk and monitoring
A 600 mm diameter water main was located 2 m behind the
retaining wall (see Figure 6) and damage to this posed the most
considerable risk should excessive movements be recorded. In
addition, a high-level access road is located behind the retaining
wall (Figure 6). Surfacing to this was not completed until after
basement construction so the associated risk was not significant.
Early-stage movements were observed carefully. Recorded pile
deflections at the two inclinometers during the construction stage
were approximately 13 mm (at B001 where the final cantilever
height is 6.3 m) and 7.5 mm (at B002 where the final cantilever
height is 4.4 m), see Figures 6 and 7(a). These values were
significantly less than both the design stage predictions and the
25 mm ‘trigger’ level. Subsequently these values built up gradu-
ally, presumably in response to the gradual dissipation of the
induced pore water suctions. After construction of the basement
slab these deflections have increased slightly and 6 years after
beginning of excavation they had increased to a maximum of
about 21 mm, a value significantly less than the 45 mm originally
predicted. There has been no recorded movement between years
five and six since commencement of monitoring.
No significant water ingress was noted during construction and
the contingency measures described above did not have to be
implemented.
6.4 Comment
A photograph of the completed structure, some 5 years after
construction, is shown in Figure 7(b). It can be seen that despite
the relatively high cantilever the structure has behaved well and
the resulting deflections have been within serviceable limits. This
case history confirms the feasibility of using cantilever walls in
DBC in long-term conditions, once design, construction and
performance criteria (including contingency measures) are estab-
lished before construction. Those parties who carry any residual
risk, such as contractor, employer or designer, also need to be
clearly identified.
25
20
15
10
5
0
Max
imum
late
ral w
all d
ispl
acem
ent:
mm
Inclo – B001Inclo – B002
End ofexcavation
B001 – final cantilever height6·3 m�
B002 – final cantilever height4·4 m�
Constructionof basement slab
0 100 200 300 400Time: weeks
(a)
(b)
Figure 7. Ballycullen Road: (a) retaining wall lateral wall
movements with time; (b) image of completed wall with variable
height cantilever (¼ 6.3 m at inclinometer B001 noted)
255
Geotechnical EngineeringVolume 165 Issue GE4
Retaining walls in Dublin Boulder Clay,IrelandLong, Brangan, Menkiti, Looby and Casey

7. Results for deep excavation – Dublin PortTunnel northern cut and cover
7.1 Scheme
The Dublin Port Tunnel (DPT) provides a link from the motorway
system north of Dublin to the port area (Figure 1). A central section
comprising twin bored tunnels was driven by tunnel boring
machines launched from a central large-diameter shaft, see Cabar-
kapa et al. (2003). Shallower sections of the tunnels at either end,
where the invert level is less than about 25 m below ground level,
were constructed using cut-and-cover methods. The sides of the cut
were generally supported by propped diaphragm walls or bored pile
walls. At the northern section of the works an approximate 300 m
length of the tunnel was constructed, in competent glacial tills,
within propped diaphragm walls. The diaphragm wall was 1.2 m
thick and was constructed using conventional techniques within
7 m long bentonite supported panels using rope-mounted clam
shell grabs. Data were obtained from 13 inclinometers along this
section. At three of these locations the wall was supported by a
single high-level tubular steel prop and at the remaining locations
two props were used, see Figure 8.
7.2 Movement monitoring
Details of the scheme together with the results of some site
investigation are shown in Figure 9. For all 13 locations there
was an initial excavation during which the diaphragm wall was
acting as a cantilever. The retained height in the cantilever mode
varied between 3 m and 7 m with an average of 5.5 m. Move-
ments recorded by inclinometer varied between 0 and 3.2 mm
with an average of about 1.4 mm.
For the three single prop sections the retained height was either
12 m or 13 m and the maximum lateral movement varied between
2 mm and 4.5 mm. An example for DP8, which is characteristic
of the single prop sections, is shown on Figure 9. Of the 4.5 mm
maximum movement, approximately 0.5 mm occurred during the
cantilever stage. Subsequently, during the 3 month period while
excavation took place to formation level, the wall moved out-
wards below the prop to give the curved profile observed.
For the nine double propped cases the retained height varied
between 14 m and 17.5 m and the resulting maximum lateral
movement varied between 2.2 mm and 8.5 mm with an average
of about 5.3 mm. The behaviour of inclinometer DP36 is
characteristic of the double propped sections and its profile at
maximum excavation depth, some 50 days after insertion of the
upper prop, is shown in Figure 9. The deflected shape is typical
for these sections and shows that the wall panels rotate about the
upper prop despite the presence of the lower prop (and later the
concrete base). Subsequently the upper props take the majority of
the load.
7.3 Prop loads
At the northern cut-and-cover section 68 steel props were used to
support the diaphragm walls. These were mostly of 1220 mm
outside diameter (o.d.) with a 14.2 mm wall thickness and had
previously been used in the offshore industry. Some props of
1520 mm o.d. and 1620 mm o.d. were also used. These props
spanned approximately 22 m. Props were connected directly to
the diaphragm wall by way of reaction pads at 7 m centres. This
gave the advantage of having no waling beam. However, it meant
prop positions were fixed and there was the risk of accidental
prop removal. The props were not preloaded.
Vibrating wire strain gauges, type Geokon V4-4101, were
installed in four upper props at a location where there was also a
lower prop. Gauges were attached at the 3, 6, 9 and 12 o’clock
positions at both the centre and end of the prop. Although the
effect of temperature on prop loads is known to be very
significant, see for example Batten et al. (1999) and Twine and
Roscoe (1999), unfortunately no thermistors were fitted with the
strain gauges and hence temperature correction of loads measured
cannot be made.
Figure 8. Photograph of Dublin Port Tunnel northern cut and
cover works
256
Geotechnical EngineeringVolume 165 Issue GE4
Retaining walls in Dublin Boulder Clay,IrelandLong, Brangan, Menkiti, Looby and Casey

Measured prop loads for three typical props (numbers 50, 60 and
66, which were respectively 1220 mm, 1520 mm and 1620 mm
o.d.) are shown in Figure 10(a). It can be seen that much of the
prop load occurs during excavation to formation level. This is
followed by a gradually increasing prop load, which develops
presumably in response to the gradual dissipation of excavation-
induced depressed pore pressures. Maximum measured prop loads
are of the order of 1200 kN, which are significantly less than the
allowable axial compressive load to prevent buckling (equal to
2800 kN for prop 50). Bending moments at the centre and near
the end of prop 66, about the x–x and y–y axes, are shown on
Figure 10(b). Not surprisingly the Mxx values are slightly higher.
Although the calculation of moments towards the end of the prop
(strain gauges were approximately 2 m from the reaction pad) is
questionable, all the values are modest and are consistent with
the simply supported self-weight bending moment of about
350 kN m.
Measured prop loads are significantly less than those that would
be predicted by a beam–spring type program. For example, using
the conventional design approach, Oasys–Frew1 predicts prop
loads in the range 3000–4200 kN for undrained and effective
stress based soil parameters respectively. These parameters were
obtained from Long and Menkiti (2007a, 2007b) and are
summarised in Table 1.
7.4 Comment
Despite the very significant depth of the excavation, once again
measured movements were modest. Prop forces and bending
moments were also lower than expected. Back-analysis of the
data presented using a coupled consolidation finite-element analy-
sis would be very useful. However, the constitutive model for the
DBC needs to be carefully chosen so that it can capture the
unique characteristics of the material, in particular the high
strength and stiffness and the rapid onset of dilation during shear.
8. Results overview
8.1 Propped walls
A database, comprising 30 case histories for propped walls in
competent glacial deposits, is reproduced in Table 2. This table is
an updated version of that originally given by Looby and Long
(2007). A plot of maximum measured lateral movement (�h)
against retained height (H) is shown on Figure 11(a). Except for
the 11 m deep excavations at Mespil Road and Tallaght, all �h
values are less than about 10 mm. Values less than 10 mm include
the very deep Westgate (14 m) and Dublin Port Tunnel (12 m to
25 m) excavations. There does appear to be some weak tendency
for an increase in �h with H. The average �h is 6.3 mm.
Also shown on Figure 11(a) are lines representing normalised
movement (�h/H) of 0.18% and 0.4%. The former relationship
was obtained by Long (2001) for an average of 169 case histories
worldwide where there was stiff soil at dredge level. The behav-
iour of the Dublin projects is significantly stiffer than the world-
wide average, with an average �h/H of 0.08. The 0.4% line
represents a typical design value as recommended by Gaba et al.
(2003) in Ciria report C580 and clearly this relationship is very
conservative for the Dublin cases.
The data shown in Figure 11(a) take no account of the retaining
wall type, its stiffness or the prop/anchor configuration. In order
� �43·5 m OD to 45·6 m OD
Upper prop (at 42 m OD)�
Lower prop when applicableat 36 m OD�
Dig depth 12 m to 13 msingle prop cases
Dig depth 14 m to 17·5 mtwo prop cases
24 m deep, 1 m thickdiaphragm wall
Inclinometersin wall
Toe level 19·5 m OD to 21·6 m OD� �
0 20 40 60 80 100SPT : blows 300 mmN
0
4
8
12
16
20
24
Dep
th: m
Upper brown
Upperblack
Lowerbrown
Design line
Lower black
Upper brownUpper blackLower brownLower black
0
4
8
12
16
20
24
0 2 4 6 8Lateral movement: mm
Inclo-DP8-single propInclo-DP36-double props
Figure 9. DPT northern cut and cover road: retaining wall layout,
ground conditions and lateral wall movements
257
Geotechnical EngineeringVolume 165 Issue GE4
Retaining walls in Dublin Boulder Clay,IrelandLong, Brangan, Menkiti, Looby and Casey

to attempt to include these factors, the data are replotted in
Figure 11(b) in the normalised form of �h/H against Clough et al.
(1989) system stiffness. This is defined as
System stiffness ¼ EI
ªws41:
where EI is wall stiffness, ªw is unit weight of water (required to
make expression unit-less) and s is support spacing.
Lateral movements appear to be independent of stiffness. This
suggests that a more flexible (and hence a more economic) wall
may perform adequately in many cases.
8.2 Cantilever walls
Cantilever walls form ideal temporary or permanent works. The
site remains free of internal props or struts allowing construction
to continue without obstacles. In particular, perimeter works such
as drainage can proceed without hindrance. Difficulties associated
with ground anchorages, such as obtaining wayleaves or proof
testing, are also avoided. Soil mechanics textbooks suggest
cantilever walls are only suitable for modest excavations up to
about 4.5 m retained height. However, throughout the world and
more recently in Ireland cantilever walls have been used to retain
excavations significantly greater than 4.5 m. A summary of
Dublin case histories is given in Table 3. Relatively high
cantilever walls have been used for some time and more recently
cantilever walls of 7.5 m or so are being used regularly (e.g. that
for Ballycullen Road described above).
Mxx – centre
Myy – centre
Mxx – end
Myy – end
2000
1600
1200
800
400
0
Mea
sure
d pr
op lo
ad: k
N
21/10/02 10/12/02 29/1/03 20/03/03 9/5/03 28/6/03 17/8/03 6/10/03 25/11/03(a)
Prop 60formation level
10/02/03
Prop 50formation level
2/02/03
Prop 66formation level
30/11/02
Maximum allowable load inaxial compression 2800 kN
(prop 50)�
Prop 66 – 1620 mm o.d.Prop 60 – 1520 mm o.d.
Prop 50 – 1220 mm o.d.
21/10/02 10/12/02 29/1/03 20/03/03 9/5/03 28/6/03 17/8/03 6/10/03 25/11/03(b)
600
400
200
0
�200
�400
Bend
ing
mom
ent:
kN
m
x
y
x
y
All for prop 66,which has simply supportedself-weight BM of 350 kN m
Figure 10. Dublin Port Tunnel – northern cut and cover:
(a) measured prop loads; (b) bending moment in prop 66
258
Geotechnical EngineeringVolume 165 Issue GE4
Retaining walls in Dublin Boulder Clay,IrelandLong, Brangan, Menkiti, Looby and Casey

Plots of �h against H and �h/H against system stiffness Clough et
al. (1989) are shown on Figures 12(a) and 12(b) respectively. In
each case the best-fit trend line from the worldwide database of
cantilever walls, from Long (2001), is also shown.
The Dublin walls have performed very well with values falling in
general well below the trend lines. Average �h and �h/H values
are 6.5 mm and 0.13% respectively. Here there is clear depen-
dence on excavation depth and system stiffness, with movements
increasing with the former and decreasing with the latter. Irish
practice seems to be conservative and perhaps even more
conservative than that worldwide. Based on these data it seems
there is scope for the use of higher cantilever walls, at least for
temporary works purposes.
8.3 Behaviour of cantilever walls with time
The data presented above omit one very important factor, namely
how does the lateral movement vary with time. This has
important implications as to whether these walls can be used for
permanent work as well as temporary works and also in the
40
30
20
10
0
Max
. lat
eral
wal
l mov
emen
t,: m
mδ h
0 5 10 15 20 25Excavation depth, : m
(a)H
δh/ 0·4%typical design,
Gaba . (2003)
H
et al
�
δh/ 0·18%169 world cases,
Long (2001)
H �
Tallaght
Mespil Rd
W’gate
DPTDPT
DPT - WA2
0·5
0·4
0·3
0·2
0·1
0
δ h/
: %H
0·1 1 10 100 1000 10000Clough . (1989) system stiffness (El/ )et al sγw
4
(b)
δh/ 0·4%H �
δh/ 0·18%H �
Figure 11. Behaviour of propped walls: (a) maximum lateral
movement plotted against excavation depth; (b) normalised
maximum movement plotted against system stiffness
25
20
15
10
5
0M
ax. l
ater
al m
ovem
ent,
: mm
δ h0 2 4 6 8 10
Excavation depth, : m(a)
H
Thorncastle St
Ballycullen RdAverage worldwidecase histories,Long (2001)
Clancy Barracks
0·8
0·4
0·2
0
Nor
mal
sied
max
. lat
eral
mov
emen
t,/
δ hH
Stiff soil at dredgeSoft soil at dredge
0·1 1 10 100 1000Clough . (1989) system stiffness El/
(b)et al s� γw
4
Ballycullen RdTrend line from worldwide
case histories
Thorncastle St
Figure 12. Behaviour of cantilever walls: (a) maximum lateral
movement plotted against excavation depth; (b) normalised
maximum movement plotted against system stiffness
259
Geotechnical EngineeringVolume 165 Issue GE4
Retaining walls in Dublin Boulder Clay,IrelandLong, Brangan, Menkiti, Looby and Casey

Cas
e
his
tory
Loca
tion
Soil
atdre
dge
lev.
Soil
stre
ngth
,s u
:kP
aH
:m
h:
mB:
m
DBC
-P1
Cla
rendon
Stca
rpar
kD
BC
N¼
50+
6. 2
150
DBC
-P2
M&
SG
raft
on
StD
BC
N¼
50+
7. 2
330
DBC
-P3
Dai
lEi
rean
n(L
einst
er
House
)
DBC
N¼
50
–100
60
40
DBC
-P4
Hilt
on
Hote
l,C
olle
ge
StG
rave
l/DBC
ove
rw
th
rock
N¼
50+
6. 3
440
DBC
-P5
ESA
T,G
rand
Can
alD
BC
42
30
DBC
-P6
TCD
Libra
ry–
Leck
yG
rave
love
rD
BC
N¼
30
–100
7. 2
030
DBC
-P7
TCD
Libra
ry–
Nas
sau
Gra
velove
rD
BC
N¼
30
–100
8. 6
050
DBC
-P8
Ely
Plac
eD
BC
N¼
47
–100
3. 5
035
DBC
-P9
Har
court
StG
rave
love
rD
BC
N¼
28
–100
4. 5
035
DBC
-P10
Bal
briggan
Gra
velove
rst
iff
clay
Med
.den
se/s
tiff
5. 7
2. 5
41
DBC
-P11
Wes
tgat
eG
rave
love
rD
BC
N¼
20
–100
14
2125
DBC
-P12
Talla
ght
Cen
tre
DBC
N¼
20
–100
11
1. 5
80
DBC
-P13
TCD
–Sp
ort
sC
entr
eG
rave
love
rD
BC
N¼
30
–100
6. 9
130
DBC
-P14
TCD
–C
rann
Build
ing
Gra
velove
rD
BC
N¼
30
–100
6. 9
130
DBC
-P15
DPT
Nort
her
nC
&C
–D
P8D
BC
N¼
30
–100
12
122
DBC
-P16
DPT
Nort
her
nC
&C
–D
P36
DBC
N¼
30
–100
17
122
DBC
-P17
DPT
–Sh
aft
WA
2D
BC
N¼
30
–100
25
128. 3
DBC
-P18
Mes
pil
Road
DBC
N¼
30
–100
11
265
DBC
-P19
TCD
–Bio
scie
nce
s(3
)G
rave
love
rD
BC
N¼
30
–100
10. 5
438
DBC
-P20
TCD
–Bio
scie
nce
s(2
)G
rave
love
rD
BC
N¼
30
–100
10. 5
4105
DBC
-P21
TCD
–Bio
scie
nce
s(1
)G
rave
love
rD
BC
N¼
30
–100
10. 5
4105
DBC
-P22
Monte
Vet
ro–
Quay
Wal
lG
rave
love
rD
BC
ove
r
rock
N¼
40
–80
13. 7
66
DBC
-P23
Monte
Vet
ro–
CIE
Wal
lM
G,
gra
velove
rD
BC
ove
rro
ck
DBC
40
–80
17. 4
812
–66
DBC
-P24
Monte
Vet
ro–
Bar
row
St
Wal
l
Allu
vium
,gra
velove
r
DBC
ove
rro
ck
DBC
40
–80
11. 4
466
DBC
-P25
H.J
.Ly
ons
Pear
seSt
Gra
velove
rU
BrB
CN¼
18
–50+
12
320-5
0
DBC
-P26
Cher
ryw
ood
Blo
ckF
DBC
N¼
20
–50+
8. 5
132
DBC
-P27
Mat
erH
osp
ital
–an
chore
dD
BC
ove
rgra
vel
N¼
15
–50+
80. 6
50
DBC
-P28
Lidl,
Rat
hm
ines
DBC
ove
rro
ckat
5m
N¼
30
–100
71
20
DBC
-P29
Burlin
gto
nRoad
DBC
ove
rro
ckat
dig
bas
e
N¼
30
–100
10
2?
DBC
-P30
Terr
enure
Fill,
UBrB
C,
UBkB
C20
–50
(40)
3. 2
0. 3
35
(continued
)
260
Geotechnical EngineeringVolume 165 Issue GE4
Retaining walls in Dublin Boulder Clay,IrelandLong, Brangan, Menkiti, Looby and Casey

Support
configura
tion
s:m
Wal
lty
pe
Pile
dia
./sp
acin
g/le
ngth
:m
EI:
kN/m
2�
h:
mm
�v
:m
mRef
eren
ce
Single
pro
p5
Sold
ier
pile
9m
long
357
3171
345
kg/m
UB
at6
mce
ntr
es
3895
70
Long
(1997)
Single
pro
p6
Shee
tpile
sLa
rsse
n16W
,7
mlo
ng
58
500
52
Long
(1997)
Single
pro
p6
Seca
nt
0. 6
/0. 5
/9381
700
30
Bra
ngan
(2007)
Single
pro
p6. 3
Seca
nt
0. 9
/0. 7
5/6
1254
800
1. 2
0Lo
ng
(2002)
Single
anch
or
3. 5
Seca
nt
0. 6
/0. 5
5/1
0347
000
5??
UC
Dfile
s
Thre
ean
chors
2. 5
Seca
nt
0. 6
/0. 5
5/1
0347
000
5??
Bra
ngan
(2007)
Two
anch
ors
3. 5
Seca
nt
0. 6
/0. 5
5/1
1347
000
7??
Bra
ngan
(2007)
Single
pro
p/a
nch
or
3. 5
Seca
nt
0. 4
5/0
. 3/6
201
300
3??
Bra
ngan
(2007)
Single
pro
p3
Seca
nt
0. 6
/0. 5
/8. 5
381
700
4. 7
??Bra
ngan
(2007)
Single
anch
or
5. 7
Seca
nt
0. 9
/har
dat
1. 5
/9. 5
644
126
9??
BLP
file
s
Single
anch
or
14
Seca
nt
0. 9
/har
dat
1. 4
/22
690
135
7??
Looby
and
Long
(2007)
Single
anch
or
6C
ontiguous
0. 6
/0. 7
5/1
3293
620
18
??BLP
file
s
Single
anch
or
5. 5
5Se
cant
0. 9
/har
dat
1. 5
/11
644
126
10. 5
??BLP
file
s
Thre
ele
velan
chors
2. 2
5Se
cant
0. 9
/har
dat
1. 5
/11
644
126
7. 3
??BLP
file
s
Single
pro
p10. 2
Dia
phra
gm
1. 2
thic
k/24
long
4320
000
4. 5
??C
urt
isan
dD
ora
n(2
003)
Two
pro
ps
5. 5
Dia
phra
gm
1. 2
thic
k/24
long
4320
000
6??
Curt
isan
dD
ora
n(2
003)
Single
ring
bea
m12
Dia
phra
gm
1. 5
thic
k/32. 5
long
8437
500
8. 5
??C
abar
kapa
etal
.(2
003)
Single
pro
p8
Seca
nt
0. 9
/0. 7
5/?
1288
250
14
6BLP
file
s
Thre
ean
chors
3. 6
Seca
nt
0. 9
/1. 4
644
125
72
–7
ARU
Pfile
s2009
Two
anch
ors
3Se
cant
0. 9
/1. 4
644
125
8. 5
??A
RU
Pfile
s2009
Single
anch
or
6. 7
Seca
nt
0. 9
/1. 4
644
125
10. 5
??A
RU
Pfile
s2009
Single
pro
p12
Seca
nt
0. 9
/1. 4
5568
400
2. 5
??A
RU
Pfile
s2008
Thre
ele
velan
chors
2. 9
Seca
nt
0. 9
/1. 4
5568
400
3. 9
??A
RU
Pfile
s2008
Two
leve
lan
chors
2. 9
Seca
nt
0. 9
/1. 4
5568
400
1. 4
??A
RU
Pfile
s2008
Two
pro
ps
8Se
cant
0. 7
5/1
. 25
372
750
9??
ARU
Pfile
s2008
Single
anch
or
8. 5
Contiguous
0. 9
/1. 1
/14
878
355
8??
BLP
file
s
Single
anch
or
7. 7
5Se
cant
0. 9
/har
dat
1. 4
/12. 5
690
135
6. 1
BLP
file
s/A
RU
Pfile
s2009
Single
anch
or
6C
ontiguous
0. 3
/0. 4
526
500
3??
BLP
file
s
Single
anch
or
2Se
cant
0. 9
/har
dat
1. 4
/12
690
135
2??
BLP
file
s
Single
rake
dpro
p3. 2
Shee
tpile
sLi
ght
pile
s/H
eavy
tren
chsh
eets
25
700
2??
Kea
ron
(2009)
Note
:H¼
exca
vation
dep
th,
h¼
thic
knes
sof
soft
mat
eria
l,B¼
exca
vation
wid
th,
s¼
support
spac
ing,
E¼
Young’s
modulu
s,I¼
mom
ent
of
iner
tia,
�h,�
v¼
max
imum
late
ralw
allm
ove
men
tan
dve
rtic
algro
und
sett
lem
ent
Tab
le2.Su
mm
ary
of
case
his
tories
–pro
pped
wal
lsin
Dublin
Bould
erC
lay
261
Geotechnical EngineeringVolume 165 Issue GE4
Retaining walls in Dublin Boulder Clay,IrelandLong, Brangan, Menkiti, Looby and Casey

Cas
e
his
tory
Loca
tion
Soil
at
dre
dge
lev.
Soil
stre
ngth
,s u
:kP
aH
:m
h:
mB:
ms:
m
Stiff
soil
atdre
dge
1Sh
ipSt
,D
ublin
DBC
,gra
vV
.st
iff/
den
se3
225
4. 2
2In
tel,
Leix
lipD
BC
V.
stiff/
den
se6. 4
050
8. 9
6
3Sc
hoolh
ouse
Lane
DBC
V.
stiff/
den
se5. 5
033
7. 7
4N
ewSt
DBC
,lm
stN¼
66
–82
5. 5
238
7. 7
5C
ork
StD
BC
N¼
55+
62. 5
40
8. 4
6Bal
lycu
llen
Rd.
DBC
N¼
50
–100
7. 5
1. 5
30
10. 5
7D
PTN
ort
her
nC
&C
–D
P8D
BC
V.
stiff/
har
d4
122
5. 6
8D
PTN
ort
her
nC
&C
–D
P36
DBC
V.
stiff/
har
d6
122
8. 4
9M
ater
Hosp
ital
–ca
ntile
ver
DBC
N¼
35+
6. 5
0. 6
50
9. 1
10
11
Cla
ncy
Bar
rack
s–
cantile
ver
Fill/
silt,
den
segra
vel,
DBC
5–
80
(42)
7. 9
4150
11. 0
6
12
Ham
mond
Lane
Mad
egro
und,
den
segra
vel,
DBC
,lm
st.
20
–80
(42)
43
40
5. 6
13
Churc
hSt
reet
Fill,
den
segra
vels
20
–80
(45)
64. 5
30
8. 4
14
Parn
ellSt
/Gra
nby
Plac
eFi
ll,den
segra
vel
Den
se4
362
5. 6
15
Spen
cer
Dock
,N
CC
build
ing
Fill,
soft
silt,
med
den
segra
velan
dD
BC
Med
den
segra
vel(2
0)
7. 5
7. 5
75
10. 5
16
Nort
hW
allQ
uay
Fill,
soft
silt,
den
segra
velan
dD
BC
Den
segra
velw
ith
N¼
35+
7. 5
4. 5
125
10. 5
Soft
soil
atdre
dge
17
Thorn
cast
leFi
ll,al
luvi
um
,den
segra
vel,
DBC
SPT
N¼
10
413
30
5. 6
18
DPT
South
ern
C&
CC
om
ple
xes
tuar
ine
Soft
tofirm
38
22
4. 2
19
Port
mar
nock
–C
antile
ver
Soft
sandy
silt
As
ove
rw
ith
DBC
1. 5
mbel
ow
,
N¼
2–
6
46
40
5. 6
(continued
)
262
Geotechnical EngineeringVolume 165 Issue GE4
Retaining walls in Dublin Boulder Clay,IrelandLong, Brangan, Menkiti, Looby and Casey

Wal
lty
pe
Pile
dia
./sp
acin
g/le
ngth
:m
EI:
kN/m
2�
h:
mm
�v:
mm
Ref
eren
ce
Seca
nt
0. 6
/har
dat
1. 2
/?95
426
2?
UC
Dfile
s
Contiguous
0. 3
5/0
. 6to
1/9
27
600
2?
Long
(1997)
Contiguous
0. 6
/0. 8
5to
1. 2
/8190
850
2?
Long
(1997)
Seca
nt
0. 6
/0. 5
/8381
700
11
?BLP
file
s
Contiguous
0. 6
/0. 8
/9238
550
7?
BLP
file
s
Contiguous
0. 6
/0. 7
5/1
4254
470
21. 4
?Lo
oby
and
Long
(2007)
Dia
phra
gm
1. 0
thic
k/24
long
4320
000
0. 5
?C
urt
isan
dD
ora
n(2
003)
Dia
phra
gm
1. 0
thic
k/24
long
4320
000
3. 2
?C
urt
isan
dD
ora
n(2
003)
Seca
nt
0. 9
/har
dat
1. 4
/12. 8
mto
14. 3
m690
135
7BLP
file
sin
pro
gre
ss–
IC11
or
14
Seca
nt
0. 9
/1. 5
/15. 5
644
126
15. 5
?Lo
oby
and
Long
(2010)/K
earo
n(2
009)
Seca
nt
0. 6
/0. 5
/9. 5
381
700
1. 5
?Bra
ngan
(2007)
Seca
nt
0. 6
/0. 5
/12. 5
381
700
4?
Looby
and
Long
(2010)
Seca
nt
0. 6
/1/9
. 5190
850
3. 2
?Lo
oby
and
Long
(2010)
Seca
nt
0. 9
/har
dat
1. 5
/15. 2
5644
126
9. 5
?Lo
oby
and
Long
(2007)
–In
clo4
Seca
nt
0. 9
/har
dat
1. 5
/15. 5
644
126
8?
BLP
file
s
6. 5
2
Seca
nt
0. 6
/0. 5
/13
381
700
23. 5
?Bra
ngan
(2007)
Dia
phra
gm
1. 0
thic
k/24
long
2500
000
1?
Curt
isan
dD
ora
n(2
003)
Seca
nt
0. 6
/1. 0
/7191
000
9. 6
?BLP
file
s–
IC1
Note
:H¼
exca
vation
dep
th,
h¼
thic
knes
sof
soft
mat
eria
l,B¼
exca
vation
wid
th,
s¼
support
spac
ing¼
1. 4
Hfo
rca
ntile
ver
wal
ls,
E¼
Young’s
modulu
s,I¼
mom
ent
of
iner
tia,
�h,
�v¼
max
imum
late
ralw
allm
ove
men
tan
dve
rtic
algro
und
sett
lem
ent.
Tab
le3.Su
mm
ary
of
case
his
tories
–ca
ntile
ver
wal
lsin
Dublin
Bould
erC
lay
263
Geotechnical EngineeringVolume 165 Issue GE4
Retaining walls in Dublin Boulder Clay,IrelandLong, Brangan, Menkiti, Looby and Casey

temporary case how long is the useful life span. Data from ten
sites in competent glacial soils – from Long (2002), Curtis and
Doran (2003), Looby and Long (2007), Kearon (2009), Looby
and Long (2010) and other new data – are shown on Figure
13(a). In most of the projects, after a relatively short time, the
retaining wall was incorporated into the permanent works, mean-
ing it was no longer acting as a cantilever. Therefore the data for
the permanent wall at Ballycullen Road are of particular interest
as they span a period of some six years. In Figure 13(b) the data
for the first 50 weeks are shown in more detail.
It can be seen that in all cases there is a gradual development of
movement increasing with time. In particular after the first 50
weeks the rate of movement decreases significantly. This behav-
iour is probably due to the gradual dissipation of depressed pore
pressures (or even suctions). This will be discussed in the
following sections.
9. DiscussionThe reasons for the very stiff behaviour of the retaining walls in
Dublin Boulder Clay are complex but can be attributed to a
combination of the following factors.
j Excavation-induced depressed pore pressures (or even
suctions), as has been demonstrated previously for open cuts
in the material by Long et al. (2003, 2004), result in
increased effective stress and hence stability.
j The low permeability of the material (10�10 m/s or less)
means that the dissipation of the depressed pore pressures
takes a long time.
j The material has extremely high stiffness. For example Long
and Menkiti (2007b) report that it is about six to eight times
stiffer than London Clay and about five times stiffer than
Cowden till.
j It is also very strong with the UBkBC having undrained shear
strength in triaxial compression in excess of 350 kPa (i.e.
close to the strength of a weak rock).
A possible approach for the design of temporary retaining
structures in the material may be in the use of undrained
parameters in conjunction with the observational approach. The
benefits of using undrained parameters are not so much that pile
sizes will be reduced, but that more cost-effective overall solutions
can be employed, for example reduced propping requirements.
This approach should only be considered where the predicted
deflections using an effective stress approach would be within
defect limits to prevent the possibility of damage, economic loss
or unsafe situations. The risk associated with the decision should
be clearly assessed in terms of understanding of the site geology
(e.g. the possibility of encountering gravel lenses), type and
condition of structures to the rear of the pile wall and the quality
of monitoring procedures and contingency measures put in place.
It seems there is scope for the greater use of cantilever walls and
also greater retained heights at least for temporary works
purposes. Possible compromise solutions should also be consid-
ered. An example is the 7 m deep excavation in Dublin Port,
described by Adekunte et al. (2010), where the 600 mm diameter
contiguous piled wall was supported by a 2.5 m wide concrete
counterweight structure behind the wall.
It must also be emphasised that an effective stress design
approach is always needed for the ultimate limit state analysis in
permanent works as the suctions will eventually dissipate.
10. Conclusion(a) Comprehensive case history data confirm that retaining wall
behaviour in Dublin Boulder Clay is extremely stiff. This
applies to propped excavations up to 25 m deep and to
cantilever walls 7.5 m high.
16
12
8
4
0
Max
imum
late
ral w
all d
ispl
acem
ent:
mm
0 10 20 30 40 50Time: weeks
(b)
25
20
15
10
5
0
Max
imum
late
ral w
all d
ispl
acem
ent:
mm
0 100 200 300 400Time: weeks
(a)
Spencer Dock 4Clancy Barracks 2Ballycullen 1Ballycullen 2Cork St 2New St 3Church St 1DPT DP79Parnell St 1Mater Hospital 11
Figure 13. Behaviour of cantilever walls with time: (a) all data;
(b) detail of first 50 weeks
264
Geotechnical EngineeringVolume 165 Issue GE4
Retaining walls in Dublin Boulder Clay,IrelandLong, Brangan, Menkiti, Looby and Casey

(b) The reasons for this stiff behaviour lie in the low
permeability and high strength and stiffness of the material
and the resulting very slow dissipation of depressed
excavation-induced pore pressures.
(c) It appears that the current approach for serviceability limit
state calculations, which usually involves beam–spring type
computer programs, is clearly conservative for the parameters
used.
(d ) In addition to deflections, prop loads are significantly
overpredicted and there would seem to be scope for more
efficient design of the wall support systems.
(e) For temporary works, the use of undrained parameters in
conjunction with the observational approach may be
considered for reducing predicted deflections to simplify the
construction sequence and reduce costs.
( f ) Measurement of pore water pressure at the rear of walls
should be carried out so as to confirm the above observations
and improve the confidence of future engineers in designing
such structures.
AcknowledgementsSome of the data used in this paper were kindly provided by Mr
Tony O’Dowd, PJ Edwards and Co., Mr Pat Fox, Murphy
International Ltd and Mr Douglas Cook, FK Lowry Piling
Contractors; their co-operation is gratefully acknowledged.
REFERENCES
Adekunte A, O’Hara P and Denanny A (2010) Novel methods of
restraining retaining walls. Proceedings of the 13th
International Conference on Piling and Deep Foundations,
Hollywoood, CA, USA, paper 172.
Batten M, Powrie W, Boorman R, Yu H-T and Leiper Q (1999)
Use of vibrating wire strain gauges to measure loads in
tubular steel props supporting deep retaining walls.
Proceedings of the Institution of Civil Engineers –
Geotechnical Engineering 137(1): 3–13.
Brangan C (2007) Retaining Walls in Dublin Boulder Clay. PhD
thesis, Civil Engineering Department, University College
Dublin, Ireland.
BSI (1994) BS 8002: Code of practice for earth retaining
structures. BSI, London, UK.
Burland JB, Broms BB and De Mello V (1977) Behaviour of
foundations and structures. Proceedings of the IXth
International Conference on Soil Mechanics and Foundation
Engineering, Tokyo, Japan, vol. 2, 495–546.
Cabarkapa Z, Milligan GWE, Menkiti CO, Murphy J and Potts
DM (2003) Design and performance of a large diameter shaft
in Dublin Boulder Clay. Proceedings of the British
Geotechnical Association International Conference on
Foundations, Dundee, Scotland. Thomas Telford, London, UK
175–185.
Clough GW and O’Rourke TD (1990) Construction induced
movements of in situ walls. Proceedings of the ASCE
Conference on Design and Performance of Earth Retaining
Structures, Cornell, USA. ASCE, Reston, VA, USA,
Publication No. 25 vol. 2, pp. 439–470.
Clough GW, Smith EM and Sweeney BP (1989) Movement
control of excavation support systems by iterative design.
Proceedings of the ASCE Foundation Engineering: Current
Principles and Practices. ASCE, Reston, VA, USA, vol. 2,
pp. 869–884.
Curtis P and Doran J (2003) Retaining Wall Behaviour at the
Dublin Port Tunnel. BE Project Civil Engineering
Department, University College Dublin, Ireland.
Gaba AR, Simpson B, Powrie W and Beadman DR (2003)
Embedded Retaining Walls – Guidance for Economic Design.
Ciria, London, UK, Report No. C580.
Kearon B (2009) The Use of LiDAR to Monitor Retaining Wall
Movements and the Engineering Geology of the Dublin
Docklands. Civil Engineering Department, Univeristy College
Dublin, Ireland.
Long MM (1997) Design and Construction of Deep Basements in
Dublin, Ireland. Proceedings of the 14th International
Conference on Soil Mechanics and Foundation Engineering,
Hamburg, Germany. Balkema Rotterdam, the Netherlands,
vol. 2, pp. 1377–1380.
Long M (2001) A database for retaining wall and ground
movements due to deep excavations. Journal of Geotechnical
and Geoenvironmental Engineering, ASCE 127(3): 203–
224.
Long M (2002) Observations of ground and structure movements
during site re-development in Dublin. Proceedings of the
Institution of Civil Engineers – Geotechnical Engineering
155(4): 229–242.
Long M and Menkiti CO (2007a) Characterisation and
engineering properties of Dublin Boulder clay. Proceedings of
the 2nd International Workshop on Characterisation and
Engineering Properties of Natural Soils – Natural Soils 2006
(Tan TS et al. (eds)). Taylor and Francis, London, UK, vol. 3,
pp. 2003–2045.
Long M and Menkiti CO (2007b) Geotechnical properties of
Dublin Boulder Clay. Geotechnique 57(7): 595–611.
Long M, Menkiti CO, Kovacevic N et al. (2003) An observational
approach to the design of steep sided excavations in Dublin
glacial till. Proceedings of Underground Construction 2003 –
UC2003, ExCeL. London, Hemming-Group Ltd, pp. 443–454.
Long M, Menkiti CO and Follett B (2004) Some experience in
measuring pore water suctions in Dublin glacial till.
Geotechnical News/Geotechnical Instrumentation News (GIN)
22(3): 21–27.
Long M, Brangan C, Menkiti C and Looby M (2012a) Retaining
wall behaviour in Dublin estuarine deposits, Ireland.
Proceedings of the Institution of Civil Engineers –
Geotechnical Engineering 165(6), http://dx.doi.org/10.1680/
geng.10.00037.
Long M, Daynes PJ, Donohhue S and Looby M (2012b) Retaining
wall behaviour in Dublin’s fluvio-glacial gravel, Ireland.
Proceedings of the Institution of Civil Engineers –
265
Geotechnical EngineeringVolume 165 Issue GE4
Retaining walls in Dublin Boulder Clay,IrelandLong, Brangan, Menkiti, Looby and Casey

Geotechnical Engineering 165(5), http://dx.doi.org/10.1680/
geng.9.00099.
Looby M and Long M (2007) Deep excavations in Dublin –
recent developments. Transactions of Engineers – Ireland
131: 1–15.
Looby M and Long M (2010) Behaviour of cantilever retaining
walls in Dublin soils. Proceedings of the DFI/EFFC 11th
International Conference: Geotechnical Challenges in Urban
Regeneration, ExCeL, London, paper 217.
Nicholson DP, Tse CM and Penny C (1999) The Observational
Method in Ground Engineering: Principles and Practices.
Ciria, London, UK, Report No. 185.
Skipper J, Follett B, Menkiti C, Long M and Clark-Hughes J
(2005) The engineering geology and characterisation of
Dublin Boulder Clay. Quarterly Journal of Engineering
Geology and Hydrogeology (QJEGH) 38(2): 171–
187.
Twine D and Roscoe H (1999) Temporary Propping of Deep
Excavations – Guidance on Design. CIRIA, London, UK,
Report No. C517.
WHAT DO YOU THINK?
To discuss this paper, please email up to 500 words to the
editor at [email protected]. Your contribution will be
forwarded to the author(s) for a reply and, if considered
appropriate by the editorial panel, will be published as a
discussion in a future issue of the journal.
Proceedings journals rely entirely on contributions sent in
by civil engineering professionals, academics and students.
Papers should be 2000–5000 words long (briefing papers
should be 1000–2000 words long), with adequate illustra-
tions and references. You can submit your paper online via
www.icevirtuallibrary.com/content/journals, where you
will also find detailed author guidelines.
266
Geotechnical EngineeringVolume 165 Issue GE4
Retaining walls in Dublin Boulder Clay,IrelandLong, Brangan, Menkiti, Looby and Casey