Embed Size (px)
Citation preview

China Resources Enterprise, Limited
Retailing Strategies and Execution Plan
July, 2002

! Retail-led Distribution Model pp. 3 - 5
! Strategies pp. 6 - 9
! Execution Plan pp. 10 - 15
! Vanguard pp. 16 - 23
! Supply Chain and Logistics Management pp. 24 - 27
! Appendix & Disclaimer pp. 28 - 31
Table of Content
2

First-party logistics
First-party logistics
Supply chainmanagement
Supply chainmanagement
- Increase synergy- Optimize use of resources
-Empower first person bargaining and sourcing capabilities
Retail operationsRetail operations
SupermarketSupermarket
Department storeDepartment store
Retail fashion outletRetail fashion outlet
CRC MedichallCRC Medichall
Centralized functions
- shop selection- renovation- marketing
- procurement- logistics
- MIS- finance- training
Centralized functions
- shop selection- renovation- marketing
- procurement- logistics
- MIS- finance- training
OEM
Private labels
Fresh and frozen foodFresh and frozen food
Textile & garmentTextile & garment
Basic groceryBasic grocery
Beer, distilled waterBeer, distilled water
Supply chain operationsSupply chain operations
Personal care products
Personal care products
Retail-led Distribution Model
3

! Retail sales growth has been faster than GDP growth in China
! Nominal retail sales grew 10.1% in 2001 compared with GDP’s 7.5%
! Chain-store format sales growth was about 50% in 2001
Nominal retail sales growth vs GDP growth
Source: National Bureau of Statistics
Top 100 chain store sales as a proportion of nominal retail sales
Source: China Chain Stores Association
4
Retail-led Distribution Model
0.891.27
2.06
2.87
4.31
0
1
2
3
4
5
1997 1998 1999 2000 2001
%
0
5
10
15
20
25
30
1995 1996 1997 1998 1999 2000 2001
%
Retail sales growth GDP growth

! Fragmented supermarket industry provides a platform for consolidation, like brewery
! Combined with Vanguard, our supermarket operation ranked #10 in 2001 from #13 in six months
! Stores are primarily self-operated and managed rather than franchised
Profile of leading chain stores in China 2001Rank Retailer Turnover (RMBm) Y-o-y change (%) Ranking in H1 2001 Est market share (%) *
1 Shanghai Lianhua 14,063 +26 1 4.262 Shanghai Hualian 8,504 +52 3 2.583 Beijing Hualian 8,000 +60 5 2.424 Shanghai Nong Gong Sang 7,475 +38 2 2.275 San Lian (electrical goods) 7,026 +32 4 2.136 Beijing Guo Mei (electrical goods) 6,150 +120 9 1.867 Jiangsu Su Guo Supermarket 5,282 +31 6 1.608 Bai Sen (fast food) 5,205 +24 7 1.589 Shanghai Jinjiang Metro 4,949 +32 8 1.50
10 China Resources Vanguard 4,648 +35 13 1.41
* Based on estimated chain-store format sales in FY2001 of RMB330bn
5
Source: State Economic and Trade Commission
Retail-led Distribution Model

! Retailers achieve economy of scale through a “cross–region and multi-store format”expansion strategy
Lianhua
Hualian
Guomei
CRC Vanguard(current)
Wumei
Medium and small sized retailers
Region Cross–region National
Store format
Corebusiness
Expansion objective:
– Enhance bargaining power with suppliers
– Quickly obtain economy of scale and competitive advantage
Expansion path for Chinese retailers
Carrefour
WalMart
Strategies
6Source: Roland Berger

Strategies
Weaknesses
Threats Opportunities
Strengths! Local management with extensive experience in China’s retail business
! Sound local knowledge and good relationship with provincial governments
! Unique business model combining retailing and manufacturing operations
! An existing national network with localised supply chain and a good supplier relationship
! Strong balance sheet and cashflow
! Management resources facing growth challenge
! Different logistic and supply chain structures among different businesses
! Various store formats require synergies between them
! Current deflationary economic environment
! Foreign competition and foreign ownership limit will be lifted in 3 years
! Different shopping behavior and preference in different provinces
! Chain store format sales growing at 50% pa in a highly fragmented market
! Most retailers have poor supplier relationship
! Rapid expansion before the liberalisation of the market
SWOT analysis
7

8
Supermarket format in China Strategies
Vanguard-typehypermarket
Superstore Discount store Traditionalsupermarket
Size 15,000-20,000 sm 4,000-6,000 sm 1,000 sm 500 smAssortment 60,000 SKU 7,000-11,000 SKU 1,000 SKU (incl 35% under
private labels)2,000 SKU
Product mix Half supermarket andhalf department store
Food, toiletry and groceriesaccount for ~85%, durables andfashion ~15%
Food account for ~75% Food account for ~65%
Store opening Focus on Shenzhen,Guangdong, Beijing,Shanghai
Enter Jiangsu and Zhejiang first,open stores in Pearl River Deltain 2004, probably in Tianjin
Open stoers in 2004, initially inGuangzhou and Shenzhen andexpand gradually into othercities of the Pearl River Delta
More or less halted
Penetration Penetrate majorresidential andcommercial districts
Penetrate major residential andcommercial districts
Penetrate all residentialdistricts
Penetrate all residentialdistricts
Investment cost per store RMB50m RMB11m RMB2m RMB0.5mNo of store by 2006 50 190 180 400Sales per store by 2006 RMB300m RMB100m RMB15m RMB6mSales per sm RMB20,000 RMB20,000 RMB15,000 RMB12,000Sales per receipt RMB80 RMB35 RMB25 RMB16No of receipts per day 10,000 8,000 1,500 1,000No of staff per store 400 130 12 12Strategies One-stop shopping, rich
merchandisingAttractive pricing, productdifferentiation, rapid expansion
Daily basket with highturnover, pricing 15% cheaperthan supermarket
Convenience
Inventory day 50 30 21 30

StrategiesProduct Distribution
9
Vanguard-type hypermarket * Superstore Discount store% % %
Dry and frozen food 27 51 68Fresh food 11 12 8Toiletry & beauty 15 11 15General merchandise 15 10 10Durables 20 5Fashion 12 11
100 100 100
*FY2001 breakdown

10
Execution Plan
Number of mainland supermarket over the next five years – base case
! Our target of achieving retailing turnover of RMB50bn in five years will be achieved mainly through organic growth
! Approximately, RMB5bn will be invested to generate earnings of about RMB500m
FY2002 FY2003 FY2004 FY2005 FY2006Vanguard-type hypermarket 17 23 31 39 50Superstore 2 29 67 120 190Discount store 0 0 20 80 180Traditional supermarkets and others * 380 385 390 395 400Total 399 437 508 634 820% change +10 +16 +25 +29
*Excluding acquisitions

Execution Plan! Geographical focus determined by a point system, dividing the cities/districts into A,
B, C types according to: market potential, competition, maturity of supply chain as well as city retailing policy
! A nationwide city/district screening process
City District
Market selection and expansion strategies for CRC Vanguard
Prelimenarily select key cities (Tier 1 cities, provincial cities, key cities to be liberalised)
From geographical perspective to identify regional districts (Dongbei, Huabei, Huadong, Huanan, Huazhong, Zhongnan)
Maturity of the retail market(population, retail spending per capita)
Prospects+ Real situation+ Regional characteristics (high acceptanceof modern retail model, similar consumer behaviour)
Key benchmark (competition, supply chain, operational resources, consumers, retail environment)
Key benchmark (competition, supply chain, operational resources, consumers, retail environment)
Level of attraction of the city (synergy, income per capita and growth potential)
Level of attraction of the district (prosperity of the cities in the district, purchasing power of consumers, market maturity)
1st Layer
2nd Layer
3rd Layer
4th Layer
ResultsResults11

Execution Plan
12
! Acquisition as a platform to enter a market or increase market share based on the following two criteria:
Strategic store format fit
- similar main business
- average store size comparable to our format
- location in target provinces
- high average sales per store
- concentrated store locations
Supply chain integration
- leading market share in a target province
- food and grocery items fall into our supply chain

Execution PlanEstimated turnover contribution from different types of retail formats
13
60
35 35 33 30
2
1526 35 42
3850
38 28 21
0 0 1 4 7
0
20
40
60
80
100
FY2002 FY2003 FY2004 FY2005 FY2006
%
Vanguard-type hypermarket SuperstoreTraditional supermarkets and others Discount store
Note: The above estimates are based on the assumption that turnover reaches RMB50bn in 2006

Execution PlanEstimated operating profit contribution from different types of retail formats
14
60
34 39 37 35
0
2532
44 49
40 4129
17 11
0 0 1 5
0
20
40
60
80
100
FY2002 FY2003 FY2004 FY2005 FY2006
%
Vanguard-type hypermarket SuperstoreTraditional supermarkets and others Discount store
Note: The above estimates are based on the assumption that turnover reaches RMB50bn in 2006
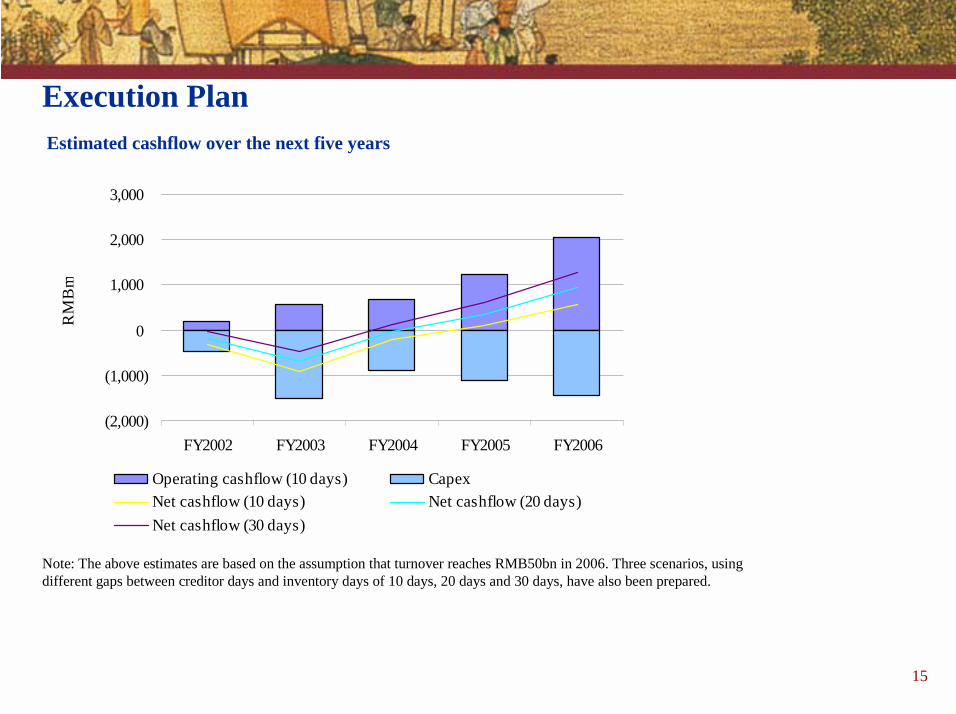
Execution PlanEstimated cashflow over the next five years
15
Note: The above estimates are based on the assumption that turnover reaches RMB50bn in 2006. Three scenarios, using different gaps between creditor days and inventory days of 10 days, 20 days and 30 days, have also been prepared.
(2,000)
(1,000)
0
1,000
2,000
3,000
FY2002 FY2003 FY2004 FY2005 FY2006
RM
Bm
Operating cashflow (10 days) CapexNet cashflow (10 days) Net cashflow (20 days)Net cashflow (30 days)

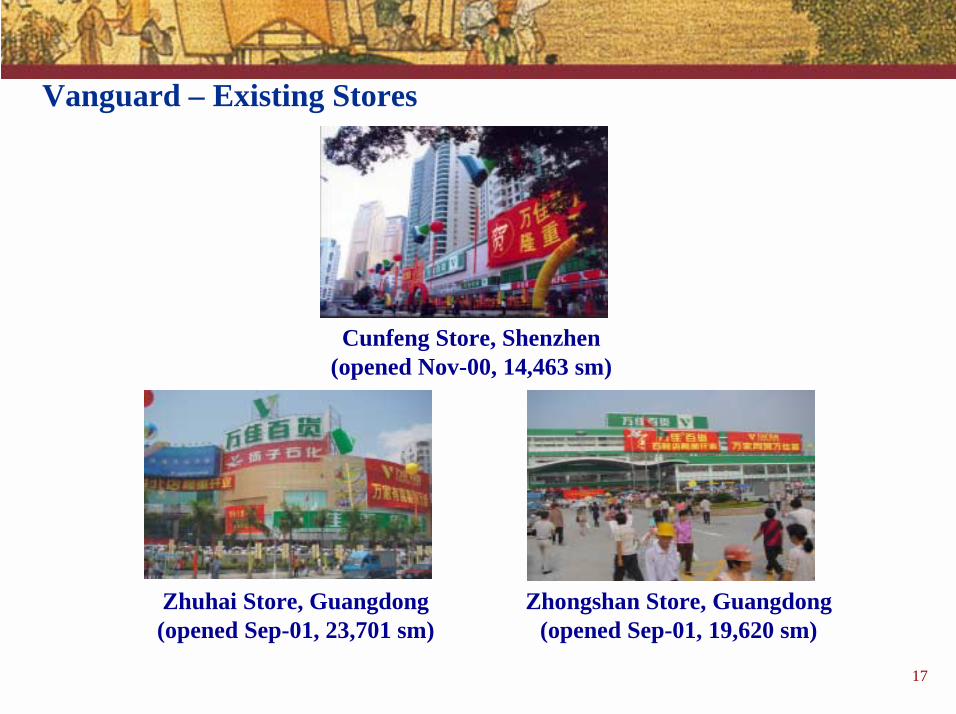
Vanguard – Existing Stores
16
Caitian Store, Shenzhen(opened Dec-98, 10,518 sm)
Cuizhu Store, Shenzhen(opened Nov-96, 9,509 sm)
Baoan Store, Shenzhen(opened Jan-00, 19,068 sm)
Vanguard – Existing Stores
Zhongshan Store, Guangdong(opened Sep-01, 19,620 sm)
Cunfeng Store, Shenzhen(opened Nov-00, 14,463 sm)
Zhuhai Store, Guangdong(opened Sep-01, 23,701 sm)
17

Vanguard – Existing Stores
Wuyang Store, Guangzhou(opened Dec-01, 8,349 sm)
Liwan Store, Guangzhou(opened Jan-02, 19,444 sm)
About 8 more stores will be opened by 2002, all signed:
Fengxing (Tianhe)
Shajin
New World(Tianhe)
Xili
Huizhou
Dongyin(Haizhu)
Huaqiang
Guangdong:
Guangzhou:
FutianShenzhen:
Longgang Store, Shenzhen(opened May-02, 21,071 sm)
18

Consignment for apparel and other services such as shoe repair, kids’ care corner, musical instruments, toys
Durable goods, cosmetics and other general merchandise
Groceries and general merchandise to generate traffic to the stores
Fresh food, cultured Chinese food like condiment
! Typical “four-storey format” to capture different segments of consumers
GF
1/F
2/F
3/F
19
Vanguard – Store Format

Fresh food is available with emphasis on hygiene
Cultured Chinese food like condiment are popular items
Vanguard – Wide Choice for Customers
20

Grocery and general merchandise
Vanguard – Wide Choice for Customers
21

Consignment corners for fashion, leather goods and cosmetics in cosyatmosphere
Vanguard – Wide Choice for Customers
22

Other household goods to broaden customer base
Vanguard – Wide Choice for Customers
23

! Two logistic centers are under construction in Shenzhen and Suzhou with a total GFA of around 80,000 sm. The one in Shenzhen (as shown) has a GFA of 65,000 sm in two phases. It has full capacity to service 40 Vanguard department stores and 400 superstores/discount stores
! A zero inventory concept
24
Supply Chain and Logistics Management

! Reducing procurement cost is the most effective way in improving margin
Reducing cost by 10%… …margin improvement by
Other costs
Logistic cost
Procurement cost
65%
50%
+375%
Sales
100%
75% Procurement cost
10% Logistic cost
13% Other costs
2% Margin
How change in cost of sales affect margin level
25
Supply Chain and Logistics Management
Source: Roland Berger

!“Win-win” results from restructuring and collaboration of supply chain -manufacturer, distributor and retailer are all winners
Result of ECR Europe
26
Supply Chain and Logistics Management
Source: Roland Berger
•Order processing cost
•Transportation cost •Warehouse cost •Warehouse capacity demand
-80%
-10%-60%
-3%-60%
•distributor/retailer •manufacturer •warehouse cost •management cost
•Benefit for distributor/retailer •Benefit for distributor/retailer and manufacturer • Benefit for manufacturer
+42% 99.7% +20%
•profit margin •merchandise service level •profit margin
97.5%
•Warehouse management cost
0
5,000
10,000
15,000
20,000
25,000
30,000
35,000
1977
1979
1981
1983
1985
1987
1989
1991
1993
1995
1997
1999
2001
HK
$m eq
v
0
200
400
600
800
1,000
1,200
1,400H
K$m
eqv
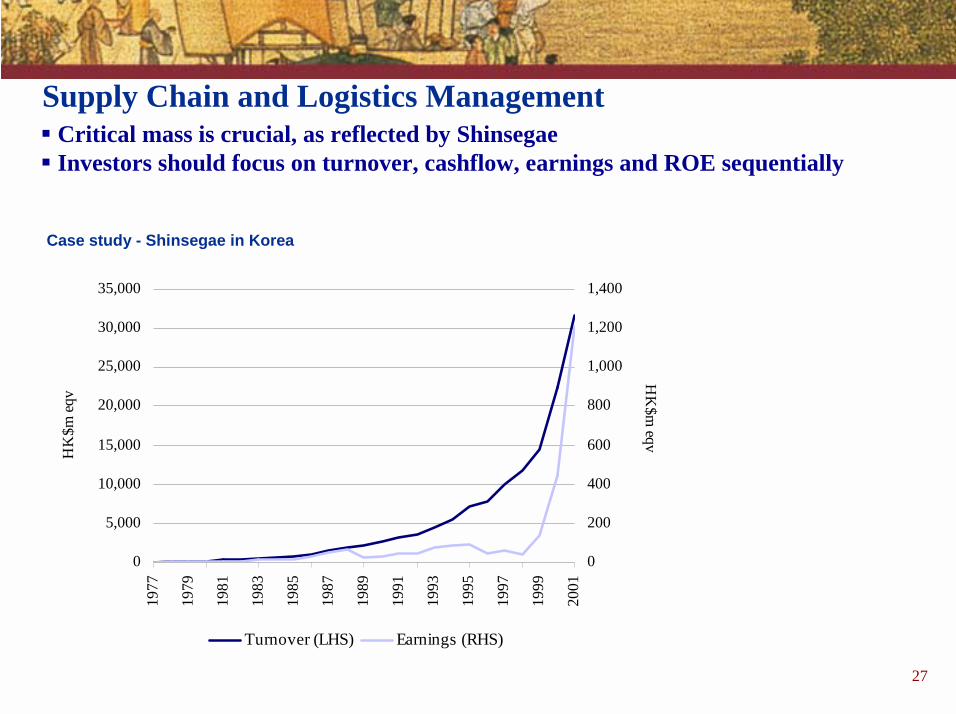
Turnover (LHS) Earnings (RHS)
Case study - Shinsegae in Korea
! Critical mass is crucial, as reflected by Shinsegae! Investors should focus on turnover, cashflow, earnings and ROE sequentially
27
Supply Chain and Logistics Management

Peer comparison
Source: Annual reports of respective companies28
Appendix
Vanguard Walmart Carrefour Hua Lian * Shanghai Friendship **Price (US$) na 56.40 € 54.75 RMB12.72 1.03Valuation:PER (x) 12.4*** 37.9 32.2 39.1 56.9EV/EBITDA (x) 5.3*** 18.7 12.2 16.9 9.0EV/sales (x) 0.3*** 1.3 0.8 0.7 0.5
Profitability:Gross profit margin (%) 20.6 21.2 22.5 14.1 13.3Operating margin (%) 3.3 5.5 4.1 2.5 2.1Net profit margin (%) 2.9 3.1 1.8 1.5 0.6ROE (%) 13.9**** 19.0 15.5 20.5 6.3ROCE (%) 13.9**** 11.5 4.3 7.5 1.7
Balance sheet:Creditor days 61 26 68 31 83Inventory days 36 48 40 40 37Quick ratio (x) 0.54 0.21 0.48 0.39 0.42
Note: The above comparison is based on the historical year performance* A-share price** B-share price*** Based on the acquisition price of HK$372m for a 65% stake**** About 18% using weighted average equity during the year

29
AppendixTurnover breakdown
Year end 31 Dec H1 2001 H2 2001 FY2001 H1 2000 H2 2000 FY2000 Full yearHK$m HK$m HK$m HK$m HK$m HK$m % change
Property development 498 501 999 483 2,342 2,825 -65Rental properties (incl godown) 229 251 480 181 241 422 +14Beverage 1,131 1,282 2,413 865 934 1,799 +34Food processing and distribution 2,854 2,896 5,750 2,689 2,869 5,558 +3Petroleum and chemicals 5,150 4,740 9,889 0 1,851 1,851 +434Building materials 337 330 667 418 437 854 -22Retail (incl supermarkets) 1,894 2,132 4,026 1,655 1,773 3,428 +17Investment & others 43 64 108 90 109 198 -46
12,136 12,195 24,331 6,380 10,556 16,936 +44Less: inter-co transactions (76) (58) (135) (59) (67) (125) +7Turnover 12,059 12,137 24,196 6,321 10,489 16,810 +44
30
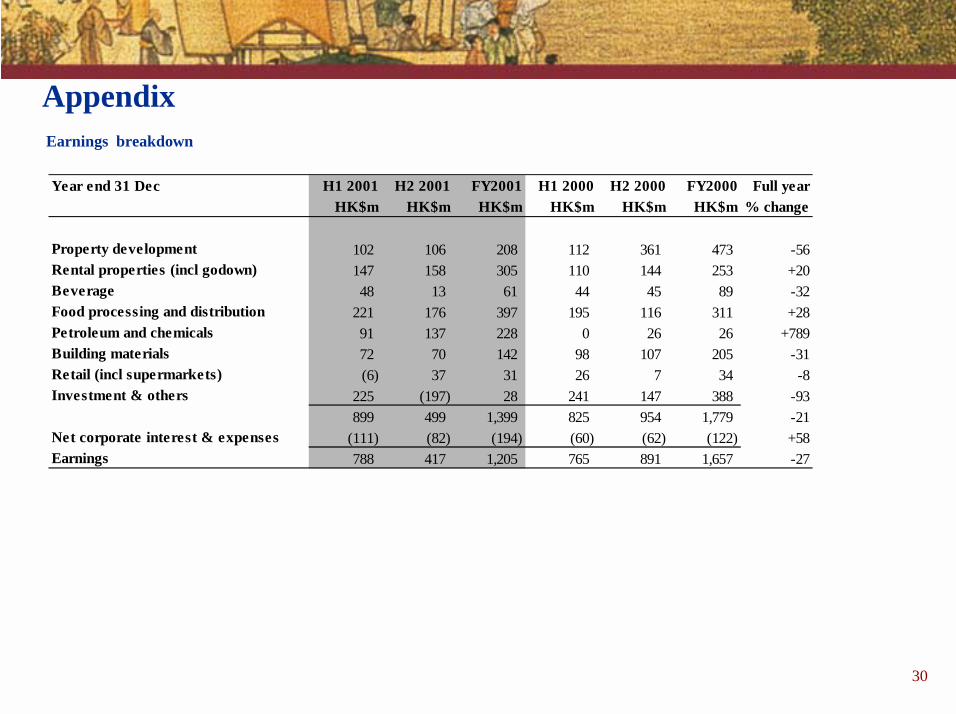
AppendixEarnings breakdown
Year end 31 Dec H1 2001 H2 2001 FY2001 H1 2000 H2 2000 FY2000 Full yearHK$m HK$m HK$m HK$m HK$m HK$m % change
Property development 102 106 208 112 361 473 -56Rental properties (incl godown) 147 158 305 110 144 253 +20Beverage 48 13 61 44 45 89 -32Food processing and distribution 221 176 397 195 116 311 +28Petroleum and chemicals 91 137 228 0 26 26 +789Building materials 72 70 142 98 107 205 -31Retail (incl supermarkets) (6) 37 31 26 7 34 -8Investment & others 225 (197) 28 241 147 388 -93
899 499 1,399 825 954 1,779 -21Net corporate interest & expenses (111) (82) (194) (60) (62) (122) +58Earnings 788 417 1,205 765 891 1,657 -27

Data and information carried in this presentation is provided for informational purposes only. Neither China Resources Enterprise, Limited nor any of its data or content providers shall be liable for any errors or delays in the content, or for any actions taken in reliance thereon. Some data that are provided in this presentation is based solely upon research information provided by third party analysts. China Resources Enterprise, Limited has not reviewed, and in no way endorses the validity of such data. China Resources Enterprise, Limited shall not be liable for any actions taken in reliance thereon.
This presentation also contains forward-looking statements that are based on the current beliefs, assumptions, expectations, estimates, and projections of the management of China Resources Enterprise, Limited about its business and the industry and markets in which it operates. These forward-looking statements include, without limitation, statements relating to revenues, earnings and stock performance. The words “believe”, “intend”, “expect”, anticipate”, “project”, “estimate”, “predict” and similar expressions are also intended to identify forward-looking statements. These statements are not guarantees of future performance and are subject to risks, uncertainties and other factors, some of which are beyond the control of China Resources Enterprise, Limited and are difficult to predict. Consequently, actual results could differ materially from those expressed or forecasted in the forward-looking statements.
Disclaimer
31