Embed Size (px)
Citation preview


Retailer Panel: The Cost of Growing Your BusinessModerator: Henry Armour, Ph. D., President and CEO | NACSPanelists:Ari Haseotes, CEO | Cumberland FarmsGlenn Plumby, Senior Vice President and COO | Speedway SuperAmerica LLCSonja Hubbard, Principal | Yates Group; former CEO | E-Z MART, Inc.

Corporate Overview

Introduction to Cumberland Farms
Cumberland Farms Snapshot
Company Overview
Family-owned fuel retailer and convenience store operator with 563 locations across Connecticut, Rhode Island, Massachusetts, Vermont, New Hampshire, Maine, New York and Florida
Market leading position in the Northeast & Florida
Own ~88% of the store locations
In early 2009, Cumberland Farms launched a long-term rebranding campaign under the Accelerate In-Store Mix (“AIM”) format featuring a food-centric concept, enhanced interior design and a new logo
Achieved significant Average Per Store Week (“APSW”) growth from this initiative as well as closing / selling non-core locations
The Company was founded in 1939 by the Haseotes family
New Store Design
Targeting +80% AIM stores (70% today) over next 2 years, balance thereafter

Established Brand with a Long Operating History
Ari Haseotestakes over
responsibilities of retail division
2008 2017AIM next
generation launch
Early 1980’sLaunched coffee
offering
1939Founded by Vasilios
and Aphrodite Haseotes in
Cumberland, RI
2009Began investing in AIM concept stores to better serve customers
Mid 1950’sBegan selling and
producing ice cream and dairy products
1986Acquired
Northeast and Mid-Atlantic
marketing assets of Gulf Oil
1976Private label
beverage and bakery commissary
Enhanced breakfast offering as a part of
the AIM initiative
Late 2000’s
~2012Introduced pizza
offering as a part of the AIM initiative
Late 1990’sExpanded hot and
cold beverage offering
Exercised its option to acquire all outstanding
shares ofGulf Oil LP
2005
Product introductions
1971Opened first
fuel station inPutnam, CT
2015Sold Gulf and
Assured Dealer businesses
to ArcLight Capital Partners
2014Opened the
Culinary Center at its Distribution
Facility in Westborough, MA
Recap of Recent Strategic Activity
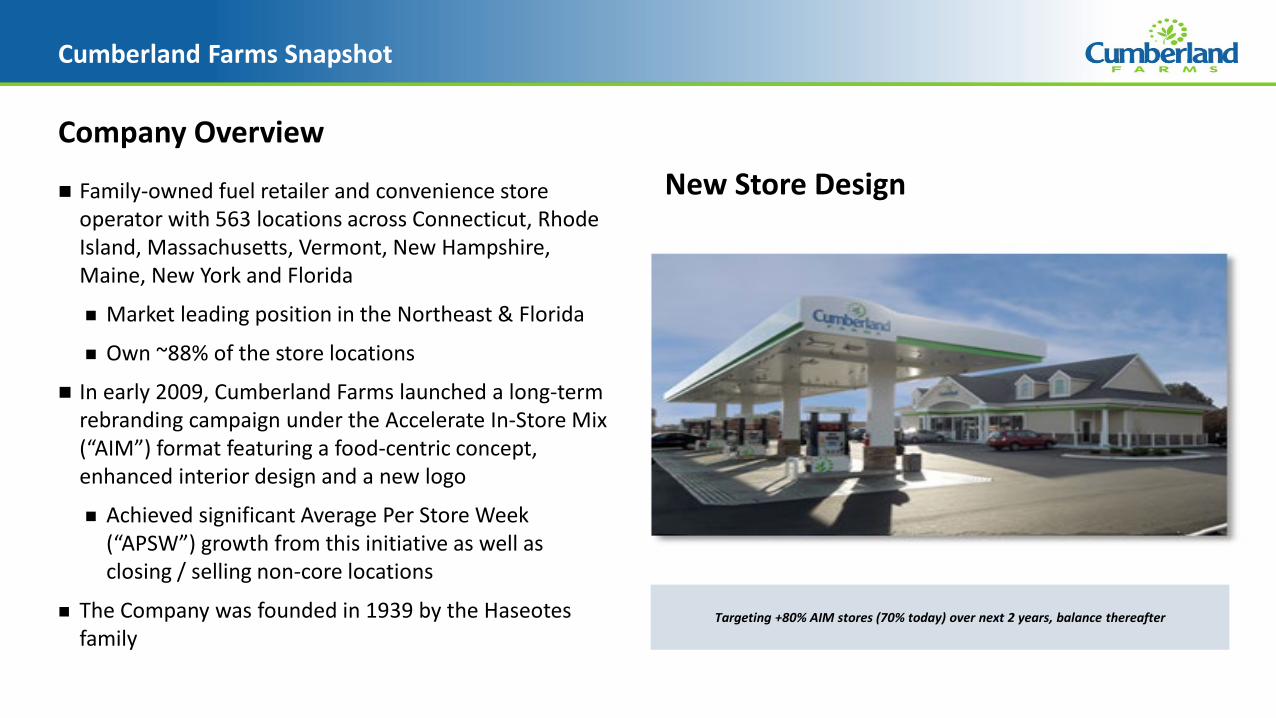
Sale of Gulf Oil and Assured Dealer Division
Singularly Focused on Retail Business With Four Key Tenets
Two divisions divested on December 29, 2015 to ArcLight Capital Partners
Gulf Oil division was reported as a separate entity
Assured Dealer division was historically reported with the Retail segment in Cumberland Farms’ financial statements
Divestitures have further streamlined Company operations and have resulted in a more focused C-store business
Full Adoption of Mission, Vision and
Values based Culture
Continued Capital Investment in
Store Base
Deployment of Food & Beverage
Offerings
Focused Effort to Enhance Guest and
Team Member Experience and
Increase Efficiency
1
2
3
4
Our Mission: To deliver the friendliest, cleanest and most
convenient customer experience by first being the best place to work.
AIM Investments
142 155 165 174 176 20228 67 104 134 172 182170
222 269 308 348 384
FY 2013 FY 2014 FY 2015 FY 2016 FY 2017 FY 2018
AIM Remodels Major Capital Projects
Grow Foodservice Sales
Net Promoter Score
Pizza Coffee Breakfast
Number of locations
7% 16%
27% 21% 24% 43%
27% 33% 37% 37% 35% 46%
FY 2013 FY 2014 FY 2015 FY 2016 FY 2017 FY 2018All CFI Shoppers AIM Shoppers

Leading C-Store Retailer in the Northeast and Florida
Company-operated convenience store network
Revenue from motor fuel sales, food sales, convenience merchandise and service sales
As of December 31, 2018, operated 563 stores
Approximately 88% owned stores
Many new AIM stores anticipated to be over 5,000 sq. ft., although now studying a more compact model
Up to 20 fueling positions for new AIM stores
560,000 sq. ft. owned manufacturing and distribution facility in Westborough, MA services all Northeast stores
FLFLFLFLFLFLFLFLFLFLFLFLFLFLFLFLFLFLFLFLFLFLFLFLFLFLFLFLFLFLFLFLFLFLFLFLFLFLFLFLFLFLFLFLFLFLFLFLFL
CTCTCTCTCTCTCTCTCTCTCTCTCTCTCTCTCTCTCTCTCTCTCTCTCTCTCTCTCTCTCTCTCTCTCTCTCTCTCTCTCTCTCTCTCTCTCTCTCTRIRIRIRIRIRIRIRIRIRIRIRIRIRIRIRIRIRIRIRIRIRIRIRIRIRIRIRIRIRIRIRIRIRIRIRIRIRIRIRIRIRIRIRIRIRIRIRIRI
MAMAMAMAMAMAMAMAMAMAMAMAMAMAMAMAMAMAMAMAMAMAMAMAMAMAMAMAMAMAMAMAMAMAMAMAMAMAMAMAMAMAMAMAMAMAMAMAMA
NJNJNJNJNJNJNJNJNJNJNJNJNJNJNJNJNJNJNJNJNJNJNJNJNJNJNJNJNJNJNJNJNJNJNJNJNJNJNJNJNJNJNJNJNJNJNJNJNJPAPAPAPAPAPAPAPAPAPAPAPAPAPAPAPAPAPAPAPAPAPAPAPAPAPAPAPAPAPAPAPAPAPAPAPAPAPAPAPAPAPAPAPAPAPAPAPAPA
NYNYNYNYNYNYNYNYNYNYNYNYNYNYNYNYNYNYNYNYNYNYNYNYNYNYNYNYNYNYNYNYNYNYNYNYNYNYNYNYNYNYNYNYNYNYNYNYNY
NHNHNHNHNHNHNHNHNHNHNHNHNHNHNHNHNHNHNHNHNHNHNHNHNHNHNHNHNHNHNHNHNHNHNHNHNHNHNHNHNHNHNHNHNHNHNHNHNH
VTVTVTVTVTVTVTVTVTVTVTVTVTVTVTVTVTVTVTVTVTVTVTVTVTVTVTVTVTVTVTVTVTVTVTVTVTVTVTVTVTVTVTVTVTVTVTVTVT
MEMEMEMEMEMEMEMEMEMEMEMEMEMEMEMEMEMEMEMEMEMEMEMEMEMEMEMEMEMEMEMEMEMEMEMEMEMEMEMEMEMEMEMEMEMEMEMEME
Northeast
Florida
Northeast Stores:
515
Florida Stores:
48
Total Stores: 563
Second highest brand equity according to the Nielsen’s 2017 Store Choice Driver Report

Leading Position and Scale in Attractive Markets
CFI convenience stores and fuel stations are generally situated on well-traveled thoroughfares or other easily accessible sites in the Northeast and Florida
Population density, employment and personal income data are very favorable in the Northeast as compared to other regions of the U.S. (1)
Northeast has second fewest number of convenience stores per capita in the U.S. (1)
Lack of developable land combined with the regulatory and permitting considerations for fuel stations limit the threat of competition from new entrants
3.57
4.37 4.63
5.71
0.00
1.00
2.00
3.00
4.00
5.00
6.00
West Northeast Midwest South
U.S. Average
U.S. Convenience Stores per Capita (1)
Stores per 10,000 People
____________________(1) Population from 2016 U.S. Census (as of July 1, 2017), Number of stores from NACS 2016 SOI Report.(2) NACS Report as of December 31, 2016.(3) Represents store count as of December 31, 2017.(4) Market efficiency defined as gas gallon market share divided by gas outlet share.
CFI’s Leading Position in Northeast Markets
Market Share by Store Count
(3) (4)(2)Market CFI Market MarketState Sites Sites Share Efficiency
RI 509 45 8.8% 1.42
MA 3,392 205 6.0% 1.62
NH 900 46 5.1% 1.09
ME 1,028 43 4.2% 1.38
CT 1,695 71 4.2% 1.73
VT 592 19 3.2% 1.12
NY 8,570 77 0.9% 1.21
Northeast 16,686 506 3.0%
FL 9,930 51 0.5% 0.98
Total 26,616 557 2.1%
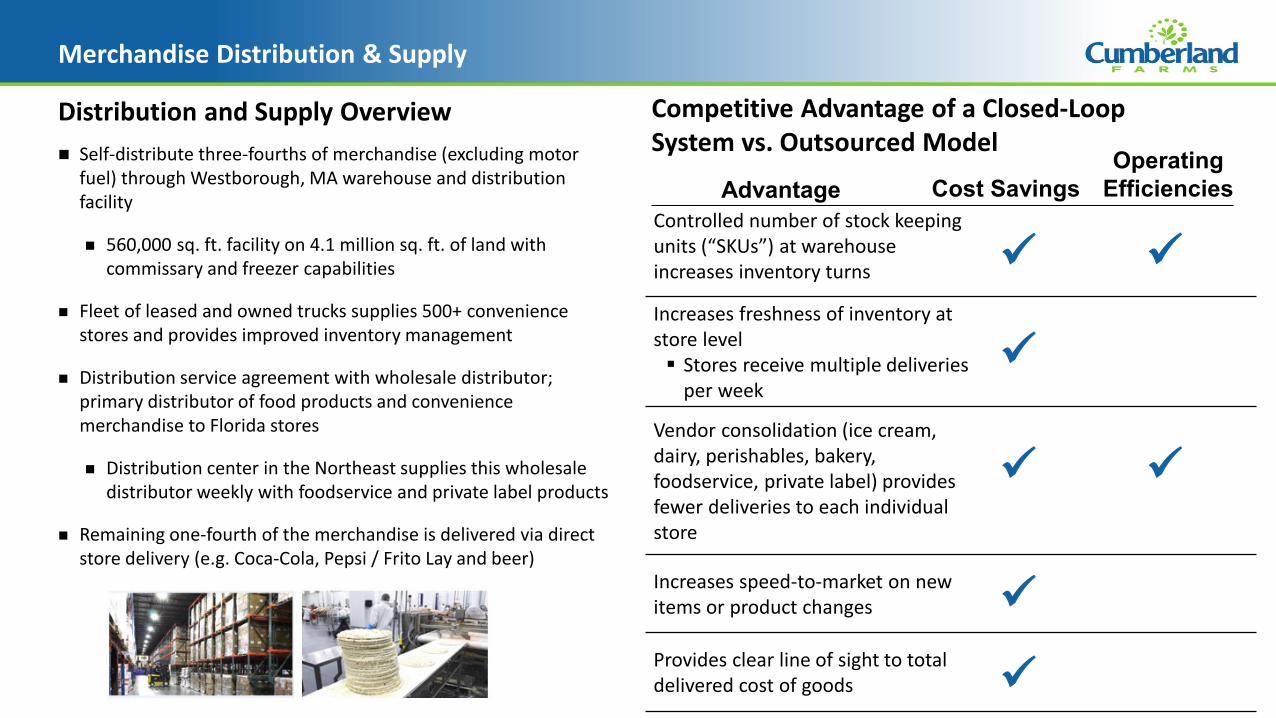
Merchandise Distribution & Supply
Competitive Advantage of a Closed-Loop System vs. Outsourced Model
Distribution and Supply Overview
Controlled number of stock keeping units (“SKUs”) at warehouse increases inventory turns
Increases freshness of inventory at store level Stores receive multiple deliveries
per week
Vendor consolidation (ice cream, dairy, perishables, bakery, foodservice, private label) provides fewer deliveries to each individual store
Increases speed-to-market on new items or product changes
Provides clear line of sight to total delivered cost of goods
Self-distribute three-fourths of merchandise (excluding motor fuel) through Westborough, MA warehouse and distribution facility
560,000 sq. ft. facility on 4.1 million sq. ft. of land with commissary and freezer capabilities
Fleet of leased and owned trucks supplies 500+ convenience stores and provides improved inventory management
Distribution service agreement with wholesale distributor; primary distributor of food products and convenience merchandise to Florida stores
Distribution center in the Northeast supplies this wholesale distributor weekly with foodservice and private label products
Remaining one-fourth of the merchandise is delivered via direct store delivery (e.g. Coca-Cola, Pepsi / Frito Lay and beer)
Advantage Cost SavingsOperating
Efficiencies
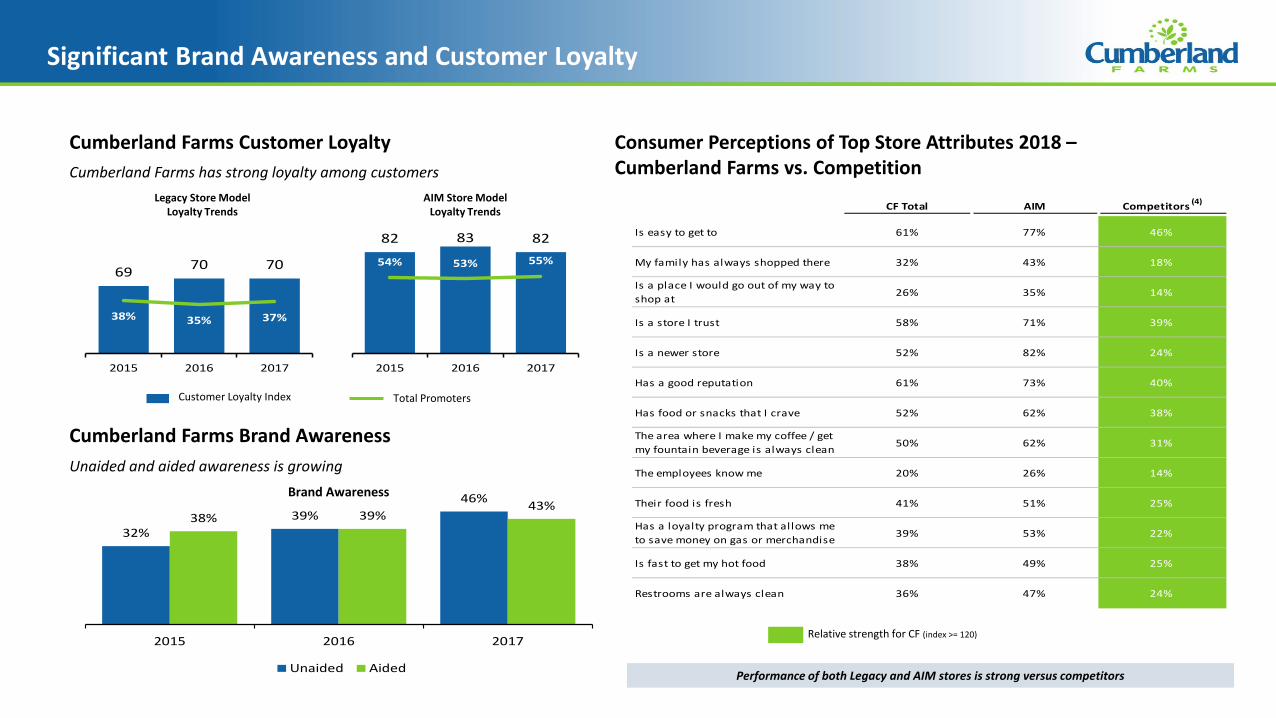
Significant Brand Awareness and Customer Loyalty
CF Total AIM Competitors (4)
Is easy to get to 61% 77% 46%
My family has always shopped there 32% 43% 18%
Is a place I would go out of my way to shop at 26% 35% 14%
Is a store I trust 58% 71% 39%
Is a newer store 52% 82% 24%
Has a good reputation 61% 73% 40%
Has food or snacks that I crave 52% 62% 38%
The area where I make my coffee / get my fountain beverage is always clean 50% 62% 31%
The employees know me 20% 26% 14%
Their food is fresh 41% 51% 25%
Has a loyalty program that allows me to save money on gas or merchandise 39% 53% 22%
Is fast to get my hot food 38% 49% 25%
Restrooms are always clean 36% 47% 24%
Consumer Perceptions of Top Store Attributes 2018 –Cumberland Farms vs. Competition
Performance of both Legacy and AIM stores is strong versus competitors
Relative strength for CF (index >= 120)
32%39%
46%38% 39%
43%
2015 2016 2017
Unaided Aided
Cumberland Farms Customer Loyalty
Cumberland Farms Brand Awareness
Cumberland Farms has strong loyalty among customers
Unaided and aided awareness is growing
82 83 82
54% 53% 55%
2015 2016 2017
69 70 70
38% 35% 37%
2015 2016 2017
Brand Awareness
Legacy Store Model Loyalty Trends
AIM Store Model Loyalty Trends
Total PromotersCustomer Loyalty Index

Multi-Pronged Growth Strategy
Growth Strategy Shifting merchandise mix towards higher-margin, differentiated items (e.g., private label and foodservice items such as coffee, frozen and fountain drinks, pizza, fresh sandwiches and bakery)
Focusing intensively upon brand development, consumer research and understanding and product innovation
Investing in technologies to drive efficiency and allow for more rapid, profitable and accurate decision making (i.e. fuel pricing software to optimize gross profit / volume dynamic and a supply chain management system)
Investing in technologies to drive customer loyalty and drive down credit card processing fees (i.e. SmartPay)
Utilizing AIM Concept stores to grow sales (APSW) and increase store productivity
Aggressively managing general & administrative expenses to enhance productivity and streamline business model
Investing in Team Members – recruiting, compensation / benefits, talent development and engagement
Enhance Sales and Profitability of Existing Stores
Remodeling Existing Locations & Building New Locations in AIM Format
Manage Expenses & Improve Cost Structure

The case for organic growth
It’s all about strategic alignment and, in Cumberland’s case, pursuit of a dual advantage
Differentiation achieved through marketing capabilities and brand recognition
Low Cost & Differentiation achieved through unique regional capabilities
Low Cost & Differentiation through continued growth in our core markets
Low Cost & Differentiation through uniformity in physical assets
Differentiation through superior quality, reliability, loyalty
Strategic Activity/Decision/Insight Aligned with Strategic Position…
Our corporate culture is the critical part of our brand/corporate strategy – how can we ensure continuity of this through acquisition of other cultures?
Store attributes (size, layout, parking/pump configuration) are integral to the brand experience
There is significant headroom in the markets in which we operate today
Our self-distribution model further reinforces our approach to regional scale
Focus on regional density – especially given the nature of the products we sell. “Having enough stores in the market to give our guests the opportunity to be loyal”

The case for organic growth
Some other (more practical) reasons
•We have seen results – our NTI AIM format has been successful and we have reliably achieved/exceeded our financial projections
•Acquiring quality assets that satisfy our store attribute requirements is very difficult and costly (what is the implied multiple assuming we’ve got to invest significantly to convert to our brand?) There can be risk here as well.
The case against organic growth
There are risks…
•A bird in the hand…
and increasing costs…
• While data suggest “headroom”, entitlement process is becoming increasingly challenging


Store Map
• Arkansas• Louisiana• Oklahoma • Texas

We’ve only just begun
Opportunity Awaits…


E-Z Mart Circa 1970
Jim Yates, NACS Chairman 1992-1993
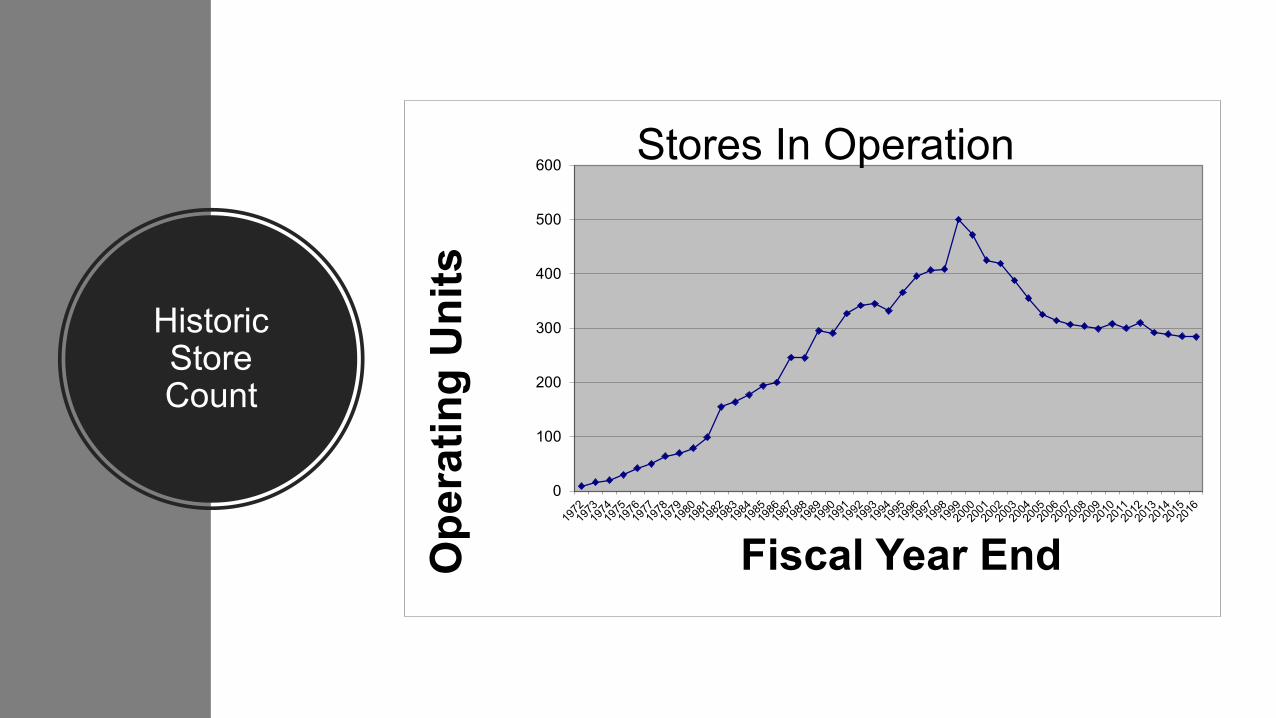
Historic Store Count
0
100
200
300
400
500
600
Ope
ratin
g U
nits
Fiscal Year End
Stores In Operation

Charles Darwin
• “It is not the strongest of the species that survives…nor the most intelligent that survives. It is the one most adaptable to change”.
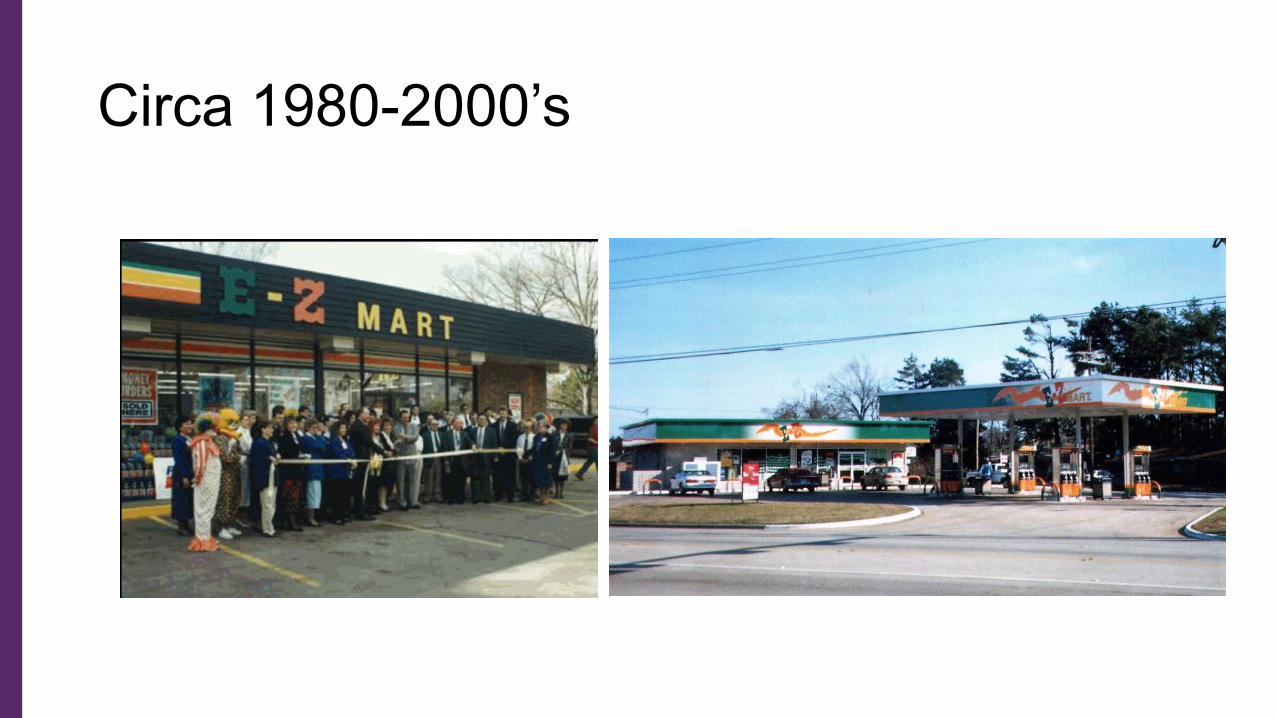
Circa 1980-2000’s

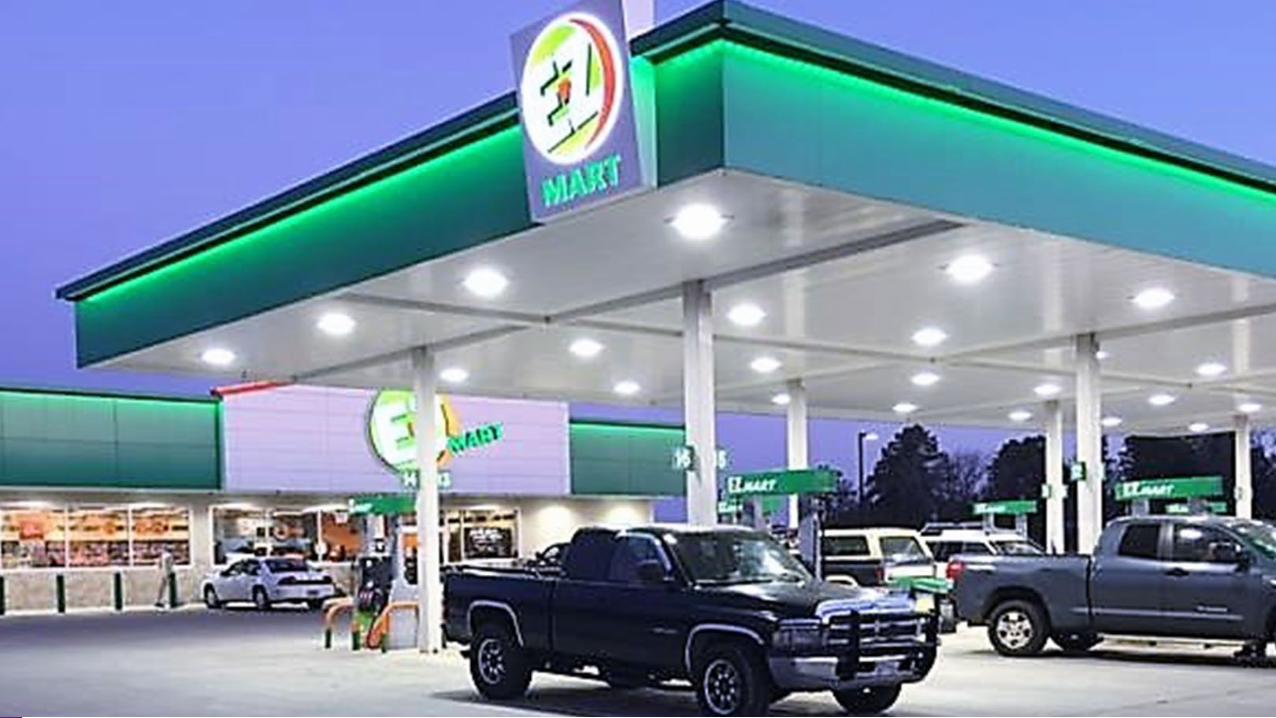
Circa 2000--2017


Right Sizing By Store Improvement
2000 2001 2002 2003 2004 2005 2006 2007 2008 2009 2010 2011 2012 2013 2014 2015 2016
-
20,000.00
40,000.00
60,000.00
80,000.00
100,000.00
120,000.00
140,000.00
-
200,000.00
400,000.00
600,000.00
800,000.00
1,000,000.00
1,200,000.00
2000 2001 2002 2003 2004 2005 2006 2007 2008 2009 2010 2011 2012 2013 2014 2015 2016
Per Store Average Sales & EBITDA Analysis
Series1 Series2 Series3
Small Business Administration
• Only 30% of new businesses transition to the 2nd generation• Only 10-15% remain for the 3rd generation • Only 3-5% of those are around for the 4th generation

Leadership Transition Types
Strategic leadership development is wisely accomplished by identifying future needs, personal goal-setting to recognize potential, professional development and mentoring to sustain.
Unexpected departure requires immediate action to manage risk to trust, focus and even continued operations. A bridge plan is necessary if a permanent plan isn’t immediately evident.
Planned departure is the best case scenario as it affords lead time to create and implement a successful transition and organizational stability.
Benefits of Sell Side Diligence-Self Evaluation• Provides seller with an objective and credible view of your business• Identifies company specific quirks, issues that should be addressed early• Chance to optimize total return by removing assets to optimize portfolio• Maximizes after-tax proceeds by stock discounts, addressing risks & optimizing the deal
structure• Improves the accuracy of the historical and projected financial information• Minimizes surprises and maximizes transaction value by adding credibility and objectivity to
the process• Identifies adjustments that positively impact EBITDA• Collaboration with experts addresses risks early, accelerating time to close• Increases competition between buyers and minimizes negotiations after the letter of intent

Retirement Sucks!