Embed Size (px)
Citation preview

Retail and Leisure Capacity Study
Final Report
North West Leicestershire District Council
February 2019

© 2019 Nathaniel Lichfield & Partners Ltd, trading as Lichfields. All Rights Reserved. Registered in England, no. 2778116. 14 Regent’s Wharf, All Saints Street, London N1 9RL Formatted for double sided printing. Plans based upon Ordnance Survey mapping with the permission of Her Majesty’s Stationery Office. © Crown Copyright reserved. Licence number AL50684A 16460/02/PW/TS 16154628v8

Retail and Leisure Capacity Study : Final Report
Contents
1.0 Introduction 1
Overview 1
Report structure 1
2.0 Policy context 3
National planning policy 3
Local planning policy 6
3.0 Current provision and trends 9
Introduction 9
Retail trends 9
Expenditure growth 9
Centres in North West Leicestershire District and the surrounding area 14
4.0 The need for retail uses 21
Introduction 21
Methodology and base data 21
Existing spending patterns 25
Capacity for future convenience goods floorspace 28
Capacity for future comparison goods floorspace 29
The Retail Study Update 2015 30
Qualitative need for retail floorspace 31
5.0 The need for food / beverage uses 37
Introduction 37
Mix of uses 37
Food and beverage expenditure 38
Future capacity for food and beverage floorspace 39
Qualitative need 41
Conclusions 42
6.0 The need for other town centre uses 43
Introduction 43
Commercial leisure uses 43
7.0 Centre health check assessments 52

Retail and Leisure Capacity Study : Final Report
Coalville town centre 52
Ashby de la Zouch town centre 58
Local centres 63
8.0 Planning policy analysis 72
Introduction 72
The hierarchy of centres 72
Impact thresholds 74
Town centre boundary and primary shopping area 74
The appropriate mix of uses 75
9.0 Accommodating growth 78
Introduction 78
Floorspace projections 78
Vacant units 79
Development opportunities 79
10.0 Conclusions and Recommendations 82
Meeting North West Leicestershire District’s needs 82
Strategy for accommodating growth 84
Policy review 84
Future monitoring 84

Retail and Leisure Capacity Study : Final Report
Figures
Figure 3.1 Real GDP Growth Fan Chart (November 2017) 10
Figure 3.2 Main Centres in North West Leicestershire District 15
Figure 3.3 Study Area Zones (see Appendix 1 for larger plan) 16
Figure 3.4 Venuescore 2016/17 Rankings 18
Figure 4.1 Methodology for Estimating Future Requirements for Retail Floorspace 21
Figure 4.2 Non-Food Shopping (main destinations named by respondents) 28
Figure 4.3 Mix of Class A Uses in North West Leicestershire District’s Main Centres 32
Figure 4.4 Comparison Goods Retail Sales Floorspace in Ashby de la Zouch (sq. m net) 34
Figure 4.5 Comparison Goods Retail Sales Floorspace in Coalville (sq. m net) 35
Figure 5.1 Restaurant / Cafe Destinations (destination named by respondents) 39
Figure 5.2 Pub / Beverage Destinations (destination named by respondents) 39
Figure 5.3 Class A3 to A5 Food and Beverage Outlets in Ashby de la Zouch and Coalville 42
Figure 6.1 Leisure Participation (% of Respondents) 43
Figure 6.2 Cinema Destinations (cinema destination named by respondents) 45
Figure 6.3 Health and Fitness Destinations (health and fitness destination named by
respondents) 47
Figure 6.4 Ten pin bowling Destinations (Ten pin bowling destination named by respondents)48
Figure 6.5 Bingo Destinations (bingo destination named by respondents) 49
Figure 6.6 Trampoline Centre Destinations (trampoline centre destination named by
respondents) 50
Tables
Table 2.1 North West Leicestershire District Settlement Hierarchy 7
Table 3.1 Venuescore UK Shopping Index and UK Rank 17
Table 4.1 Post-Brexit Growth Forecasts 23
Table 4.2 Adjusted Estimates for the UK 24
Table 4.3 Main Food Shopping Destinations Most Used by Respondents by Zone 26
Table 4.4 Convenience Goods Actual/Benchmark Turnover at 2018 27
Table 4.5 Summary of Convenience Goods Floorspace Projections on a Cumulative Basis (sq.m
gross) 29
Table 4.6 Summary of Comparison Goods Floorspace Projections on a Cumulative Basis (sq.m
gross) 30
Table 4.7 Convenience and Comparison Sales Floorspace (in and out of centre) 31

Retail and Leisure Capacity Study : Final Report
Table 4.8 Comparison Goods Expenditure Retention in North West Leicestershire District (% of
respondents) 35
Table 5.1 Mix of Class A / Food and Beverage Uses in the Main Centres in North West
Leicestershire District 38
Table 5.2 Summary of Food and Beverage Floorspace Projections (sq.m gross) 41
Table 6.1 Main Theatre Trip Destinations 46
Table 6.2 Health and Fitness Clubs (Sport England/Active Places Data, 2018) 47
Table 7.1 Coalville - Mix of Uses 53
Table 7.2 Coalville - Mix of Uses 55
Table 7.3 Coalville - National Multiples 55
Table 7.4 Coalville - Mix of Uses 56
Table 7.5 Ashby de la Zouch - Mix of Uses 59
Table 7.6 Ashby de la Zouch - Mix of Uses 60
Table 7.7 Ashby de la Zouch - National Multiples 60
Table 7.8 Ashby de la Zouch - Mix of Uses 61
Table 7.9 Local Centres - Mix of Uses 63
Table 7.10 Castle Donington - Mix of Uses 64
Table 7.11 Castle Donington - Mix of Uses 64
Table 7.12 Castle Donington - Mix of Uses 65
Table 7.13 Ibstock - Mix of Uses 66
Table 7.14 Ibstock - Mix of Uses 66
Table 7.15 Ibstock - Mix of Uses 67
Table 7.16 Kegworth - Mix of Uses 68
Table 7.17 Kegworth - Mix of Uses 68
Table 7.18 Kegworth - Mix of Uses 69
Table 7.19 Measham - Mix of Uses 70
Table 7.20 Measham - Mix of Uses 70
Table 7.21 Measham - Mix of Uses 71
Table 8.1 North West Leicestershire District Settlement Hierarchy 73
Table 9.1 North West Leicestershire District Floorspace Projections (sq.m Gross) 79
Table 9.2 Ashby de la Zouch Floorspace Projections (sq. m Gross) 81
Table 9.3 Coalville Floorspace Projections (sq. m Gross) 81
Table 10.1 Convenience Goods Floorspace Projections on a Cumulative Basis (sq.m gross) 82
Table 10.2 Comparison Goods Floorspace Projections on a Cumulative Basis (sq.m gross) 83

Retail and Leisure Capacity Study : Final Report
Table 10.3 Food and Beverage Floorspace Projections on a Cumulative Basis (sq. m gross) 83
Table 10.4 North West Leicestershire District Retail Hierarchy 84


Retail and Leisure Capacity Study : Final Report
Appendices
Appendix 1: Study area
Appendix 2: Convenience goods capacity
Appendix 3: Comparison goods capacity
Appendix 4: Food / beverage capacity
Appendix 5: Household survey results
Appendix 6: Potential development sites

Retail and Leisure Capacity Study : Final Report
Glossary
Benchmark turnover
Expected turnover of existing retail floorspace based on national averages which the identified
available expenditure can be measured against.
Class A1
Commercial units classed as retail or shop uses within the Use Classes Order.
Class A1 services
Non-retail uses classed as A1 in the Use Classes Order, e.g. hairdressers, travel agents, dry
cleaners.
Class A2
Commercial units classed as financial or professional services, e.g banks and building societies,
within the Use Classes Order.
Class A3
Commercial units classed as restaurants and café food outlets within the Use Classes Order.
Class A4
Commercial units classed as public houses or bars within the Use Classes Order.
Class A5
Commercial units classed as fast food or takeaway food outlets selling cooked hot food.
Class C3 residential
“Dwelling house”, as a principal or secondary residence.
Convenience goods
Consumer goods purchased on a regular basis such as food/groceries and cleaning materials.
Comparison goods
Durable goods such as clothing, household goods, furniture, DIY and electrical goods.
Experian
A data consultancy widely used for retail planning information.

Retail and Leisure Capacity Study : Final Report
Food and beverage
Class A3, A4 and A5 food and drink outlets, eating and drinking away from the home, i.e. not
food, grocery or convenience shopping.
GPDO
The Town and Country Planning (General Permitted Development) (England) Order 2015/596.
Goad Plans
Town centre plans prepared by Experian, which are based on occupier surveys of over 1,250
town centres across the country.
Gross floorspace
Total external floorspace including exterior walls.
Higher order comparison goods
Durable goods which tend to be high value, bought on an occasional basis and/or where
customers are most likely to shop around and compare products in different shops e.g. adult
fashion items, high value electrical goods, jewellery, furniture etc. Customers are usually
prepared to travel further to purchase these items.
Javelin Venuescore
A database of retail locations that enables the user to rank and sort the UK’s shopping venues
against a range of different criteria incl. market size, location type, market position and sector.
Lower order comparison goods
Durable goods which tend to be lower value, bought on a regular basis and/or where customers
are less likely to shop around e.g. small household goods, books, pharmaceuticals and toiletries.
Customers are less likely to travel long distances to purchase these items.
Market share/Penetration rate
The proportion of total consumer expenditure within a given area taken by a particular town
centre or shopping facility.
Multiple traders/outlets
National or regional ‘chain store’ retailers.
Net (sales) floorspace
Retail floorspace devoted to the sale of goods, excluding backstage/storage space and other
areas not accessible to customers.

Retail and Leisure Capacity Study : Final Report
The Requirements List
A published source of information providing known retail and leisure operators’ space
requirements in towns across the country.
Zone A Rent
The annual rental charge per square foot for the first 20-foot depth of a shop unit, which is the
most suitable measure for standardising and comparing rental levels.


Retail and Leisure Capacity Study : Final Report
Pg 1
1.0 Introduction
Overview
1.1 Lichfields was commissioned by North West Leicestershire District Council to prepare a Retail
and Leisure Capacity Study. The study has been prepared in accordance with the National
Planning Policy Framework (NPPF, 2018) and the Planning Practice Guidance (PPG).
1.2 The study will inform future planning policy on retail and town centre matters in the District,
together with a wider strategy for the future of the District’s centres to 2036. It will also form
part of the Council’s evidence base in progressing the early review of the adopted Local Plan.
Any evidence base study carried out at the current time needs to be cognisant of some
significant recent changes:
1 Changes in policy - the NPPF heralded the biggest single change in national planning
policy in a generation, and it raises the bar for local authorities in terms of the positive
approach and a greater emphasis on the deliverability of plans.
2 Changes in the economy - there has been significant uncertainty relating to town
centres and the retail sector, particularly following the EU Referendum vote. The study
must adopt up-to-date and authoritative economic forecasts.
3 Changes in market - the above issues have had an impact on the commercial property
market dynamics, both in terms of local demand and on the overall ability of developers
and firms to access finance.
1.3 The key objective of the North West Leicestershire Retail & Leisure Capacity Study is to provide
a robust and credible evidence base to inform the Council's work on the early review of the
adopted Local Plan, considering changes since previous evidence was prepared. The updated
Local Plan will reflect the emerging housing, employment, retail and leisure needs up to 2036.
1.4 The Retail & Leisure Capacity Study is based on up to date and sound research. The study
establishes existing shopping patterns, based on sound empirical evidence and comprehensive
customer survey research, including both customers who use facilities in the District and those
who shop elsewhere.
1.5 This report provides a quantitative and qualitative assessment of the need for new retail, leisure
and other main town centre uses within North West Leicestershire District. It provides a
description of existing retail facilities within the District, and it identifies the role the centres
play in meeting the needs of customers. The assessment of need includes both food and non-
food retailing and eating / drinking away from the home. The study includes an assessment of:
1 recent changes in circumstances and shopping patterns, not least the effects of the
recession, the requirements of the NPPF and changes to permitted development rights;
2 the future need and (residual) capacity for retail, food and beverage and leisure floorspace
for the period up to 2036;
3 the existing network of centres; and
4 development plan policies, allocations and recommendations on how each centre can
develop its role.
Report structure
1.6 Section 2.0 summarises the relevant policy context and Section 3.0 describes recent trends and
current provision in the District. Sections 4.0, 5.0 and 6.0 provide need assessments for retail
and other main town centre uses. Section 7.0 sets out health check assessments for Ashby de la

Retail and Leisure Capacity Study : Final Report
Pg 2
Zouch, Coalville, Castle Donington, Ibstock, Kegworth and Measham. Section 8.0 provides an
analysis and review of the existing relevant local planning policies. Section 9.0 sets out the
strategy for accommodating growth identified within the study. Section 10.0 sets out the
recommendations and conclusions.

Retail and Leisure Capacity Study : Final Report
Pg 3
2.0 Policy context
National planning policy
2.1 The previous 2015 Retail Study Update was based on the NPPF (published by the Department
for Communities and Local Government on 27 March 2012) and it was subsequently revised on
24 July 2018). It set out the Government’s planning policies for England and replaces all
previously issued Planning Policy Statements (PPSs) and Planning Policy Guidance Notes
(PPGs) with a single national planning policy document.
2.2 The revised NPPF (2018) consolidates a series of proposals that have been made in the last two
and half years, and which have been included in various consultation documents. The policies in
the revised NPPF are material considerations when determining planning applications ‘from the
day of its publication’ (i.e. from 24 July 2018). The policies in the 2012 NPPF still apply to
examining plans submitted on or before 24 January 2019.
2.3 In relation to town centres, the revised NPPF does not change the overall thrust, although there
are some important modifications. These changes are logical points of clarification that address
areas of dispute which have arisen in recent years. The rapid changes that are affecting the retail
sector and England’s town centres, are acknowledged and reflected in the final version of the
revised NPPF. It recognises that diversification is key to the long-term vitality and viability of
town centres, to ‘respond to rapid changes in the retail and leisure industries’. Accordingly,
planning policies should clarify ‘the range of uses permitted in such locations, as part of a
positive strategy for the future of each centre’.
2.4 It is widely accepted that very long-term projections have inherent uncertainties. In response to
these uncertainties, local planning authorities will no longer be required to allocate sites to meet
the need for town centre uses over the full plan period. The need for new town centre uses must
however still be accommodated over a minimum ten-year period, which reflects the
complexities in bringing forward town centre development sites. In line with the Government’s
economic growth agenda, a positive approach to meeting community needs is still required.
2.5 A key change (para. 86 – change underlined) is “main town centre uses should be located in
town centres, then in edge of centre locations; and only if suitable sites are not available (or
expected to become available within a reasonable period) should out of centre sites be
considered”. The reason for this change is to avoid prejudicing more central sites that are in the
pipeline but not available straight away. The definition of a “reasonable period” is still open to
debate, but logically this period should relate to the likely timetable for delivery of the
application proposal.
2.6 At the heart of the NPPF is a presumption in favour of sustainable development (paragraph 11).
For plan-making this means that:
a plans should positively seek opportunities to meet the development needs of their area,
and be sufficiently flexible to adapt to rapid change;
b policies should, as a minimum, provide for objectively assessed needs for housing and
other uses, as well as any needs that cannot be met within neighbouring areas, unless:
i. the application of policies in the Framework that protect areas or assets of importance
provides a strong reason for restricting the overall scale, type or distribution of
development in the plan area; or
ii. any adverse impacts of doing so would significantly and demonstrably outweigh the
benefits, when assessed against the policies in this Framework taken as a whole.

Retail and Leisure Capacity Study : Final Report
Pg 4
2.7 The planning system should be genuinely plan-led. Succinct and up-to-date plans should
provide a positive vision for the future of each area; a framework for addressing housing needs
and other economic, social and environmental priorities; and a platform for local people to
shape their surroundings (paragraph 15).
2.8 Plans should (paragraph 16):
a be prepared with the objective of contributing to the achievement of sustainable
development;
b be prepared positively, in a way that is aspirational but deliverable;
c be shaped by early, proportionate and effective engagement between plan-makers and
communities, local organisations, businesses, infrastructure providers and operators
and statutory consultees;
d contain policies that are clearly written and unambiguous, so it is evident how a
decision maker should react to development proposals;
e be accessible through the use of digital tools to assist public involvement and policy
presentation; and
f serve a clear purpose, avoiding unnecessary duplication of policies that apply to a
particular area (including policies in this Framework, where relevant).
2.9 The development plan must include strategic policies to address each local planning authority’s
priorities for the development and use of land in its area. These strategic policies can be
produced in different ways, depending on the issues and opportunities facing each area (para.
17). Policies to address non-strategic matters should be included in local plans that contain both
strategic and non-strategic policies, and/or in local or neighbourhood plans that contain just
non-strategic policies (paragraph 18).
2.10 Strategic policies should set out an overall strategy for the pattern, scale and quality of
development, and make sufficient provision for (paragraph 20):
a housing (including affordable housing), employment, retail, leisure and other
commercial development;
b infrastructure for transport, telecommunications, security, waste management, water
supply, wastewater, flood risk and coastal change management, and the provision of
minerals and energy (including heat);
c community facilities (such as health, education and cultural infrastructure); and
d conservation and enhancement of the natural, built and historic environment,
including landscapes and green infrastructure, and planning measures to address
climate change mitigation and adaptation.
2.11 Strategic policies should provide a clear strategy for bringing sufficient land forward, and at a
sufficient rate, to address objectively assessed needs over the plan period, in line with the
presumption in favour of sustainable development. This should include planning for and
allocating sufficient sites to deliver the strategic priorities of the area (except insofar as these
needs can be demonstrated to be met more appropriately through other mechanisms, such as
brownfield registers or non-strategic policies) (paragraph 21).
2.12 The preparation and review of all policies should be underpinned by relevant and up-to-date
evidence. This should be adequate and proportionate, focused tightly on supporting and
justifying the policies concerned, accounting for relevant market signals (paragraph 31).
2.13 Planning policies should:

Retail and Leisure Capacity Study : Final Report
Pg 5
a set out a clear economic vision and strategy which positively and proactively
encourages sustainable economic growth, having regard to Local Industrial Strategies
and other local policies for economic development and regeneration;
b set criteria, or identify strategic sites, for local and inward investment to match the
strategy and to meet anticipated needs over the plan period;
c seek to address potential barriers to investment, such as inadequate infrastructure,
services or housing, or a poor environment; and
d be flexible enough to accommodate needs not anticipated in the plan, allow for new
and flexible working practices (such as live-work accommodation), and to enable a
rapid response to changes in economic circumstances.
2.14 In terms of retail, planning policies and decisions should support the role that town centres play
at the heart of local communities, by taking a positive approach to their growth, management
and adaptation. Planning policies should (paragraph 85):
a define a network and hierarchy of town centres and promote their long-term vitality
and viability – by allowing them to grow and diversify in a way that can respond to
rapid changes in the retail and leisure industries, allows a suitable mix of uses
(including housing) and reflects their distinctive characters;
b define the extent of town centres and primary shopping areas, and make clear the
range of uses permitted in such locations, as part of a positive strategy for the future of
each centre;
c retain and enhance existing markets and, where appropriate, re-introduce or create
new ones;
d allocate a range of suitable sites in town centres to meet the scale and type of
development likely to be needed, looking at least ten years ahead. Meeting anticipated
needs for retail, leisure, office and other main town centre uses over this period should
not be compromised by limited site availability, so town centre boundaries should be
kept under review where necessary;
e where suitable and viable town centre sites are not available for main town centre uses,
allocate appropriate edge of centre sites that are well connected to the town centre. If
sufficient edge of centre sites cannot be identified, policies should explain how
identified needs can be met in other accessible locations that are well connected to the
town centre; and
f recognise that residential development often plays an important role in ensuring the
vitality of centres and encourage residential development on appropriate sites.
2.15 Applications for retail and town centre uses that are not in an existing centre and are not in
accordance with an up-to-date Local Plan will be assessed against NPPF policies and the key
sequential and impact tests.
2.16 The sequential approach test indicates main town centre uses should be located in town centres,
then in edge of centre locations; and only if suitable sites are not available (or expected to
become available within a reasonable period) should out of centre sites be considered (para. 86).
When considering edge of centre and out of centre proposals, preference should be given to
accessible sites which are well connected to the town centre. Applicants and local planning
authorities should demonstrate flexibility on issues such as format and scale, so that
opportunities to utilise suitable town centre or edge of centre sites are fully explored (para. 87).
2.17 The NPPF (para. 88) confirms this sequential approach should not be applied to applications for
small scale rural offices or other small scale rural development.

Retail and Leisure Capacity Study : Final Report
Pg 6
2.18 The NPPF states that local planning authorities should require an impact assessment for
applications for retail and leisure development outside of town centres, which are not in
accordance with an up-to-date development plan and are over a proportionate, locally set
floorspace threshold. If there is not a locally set threshold, the default threshold is 2,500 sq. m
(para. 89). This should include an assessment of:
a the impact of the proposal on existing, committed and planned public and private
investment in a centre or centres in the catchment area of the proposal; and
b the impact of the proposal on town centre vitality and viability, including local
consumer choice and trade in the town centre and the wider retail catchment (as
applicable to the scale and nature of the scheme).
2.19 Where an application fails to satisfy the sequential test, or is likely to have a significant adverse
impact on one of more of the above factors, it should be refused (para. 90).
General Permitted Development Order
2.20 Recent changes to the General Permitted Development Order (GPDO) may also have an impact
on town centres. These measures allow for greater flexibility for changes of use e.g. Class A uses
to C3 residential use and Class A1 uses to Class A2 uses. These measures could change the
composition of town centres across the country; in particular the amount of Class A1 space is
likely to reduce. The measures may lead to a reduction in vacant shop premises, particularly in
peripheral shop frontages, but conversely it could have an impact on the ability of operators to
find space in areas where demand is higher.
Local planning policy
2.21 The North West Leicestershire Local Plan (‘Local Plan’) was adopted in November 2017. Local
Plan Policy S1 (Future Housing and Economic Development Needs) sets out that the Council
will commence a review of the Local Plan by the end of January 2018 or within 3 months of the
adoption of the Local Plan (whichever is the later). There are two main reasons why an early
review is required:
• a shortage of employment land up to 2031 compared to what is needed (as identified in the
Council’s Housing and Economic Development Needs Assessment (HEDNA); or
• the possible need to accommodate additional housing arising from unmet needs in Leicester
City.
2.22 The Council started the Local Plan Review by undertaking a Local Plan Partial Review – Issues
Consultation between February and April 2018. Further consultation on Emerging Options was
undertaken between November 2018 and January 2019. Retail capacity projections will need to
be updated and rolled forward, accounting for the latest trends in home / online shopping and
recent changes in the composition of uses within town centres.
2.23 Local Plan Policy Ec8 (Town and Local Centres: Hierarchy and Management of
Development) identifies the locations where retail and main town centre development will be
accommodated which are outlined in Table 2.1 below.

Retail and Leisure Capacity Study : Final Report
Pg 7
Table 2.1 North West Leicestershire District Settlement Hierarchy
Hierarchy Settlement
Town Centres Coalville, Ashby de la Zouch
Local Centres Castle Donington, Ibstock, Kegworth, Measham
Source: North West Leicestershire Local Plan
2.24 Policy Ec8 sets out that development outside of the defined town and local centres will only be
permitted if it can be demonstrated that a sequential approach has been followed which favours
sites in a defined centre, then edge of centre and then out of centre.
2.25 Policy Ec8 considers that Coalville is the district’s principal shopping area and is the Council’s
preferred location for additional retail development to ensure that it continues to fulfil this role
and to assist in the regeneration of the town centre. The Council will work with landowners,
developers and businesses to bring forward proposals for up to 7,300 sq. m of comparison (non-
food) retail floorspace in accordance with the hierarchy set out in this policy.
2.26 Policy Ec8 sets out that new retail and town centre uses development should:
a be of a scale appropriate to the role, function and character of the settlement and not
undermine the balance of the hierarchy; and
b conserve and enhance the character and distinctiveness of each centre in terms of
design and protect and enhance the built and historical assets of the centre and their
wider setting.
2.27 Local Plan Policy Ec9 (Town and Local Centres: Thresholds for Impact Assessments) sets a
threshold that requires an impact assessment for retail, leisure and office development outside
of the town and local centres. For Coalville and Ashby de la Zouch there is a development
threshold of 1,000 sq. m gross. For Castle Donington, Ibstock, Kegworth and Measham there is
a development threshold of 500 sq. m gross.
2.28 Local Plan Policy Ec10 (Town and Local Centres: Primary Shopping Areas – Non-Shopping
Uses) considers that shops (Use Class A1) will be the predominant ground floor use within the
defined Primary Shopping Areas of the town and local centres. Development for other main
town centre uses within the Primary Shopping Area will be acceptable where the proposal:
a makes a positive contribution to the diversity of uses on offer;
b the proposal, along with any committed planning permission, does not undermine the
shopping element within the immediate area of the site;
c would not result in a cluster or over-concentration of non-shop uses; and
d would not lead to a negative impact on the retail character and vitality and viability of
the Primary Shopping Area.
2.29 The residential use of the upper floors of properties within the defined Primary Shopping Area
will be supported subject to parking and amenity considerations.
2.30 Local Plan Policy Ec11 (Town and Local Centres: Primary Shopping Areas – Hot Food
Takeaway Balance) sets out that applications for a proposed hot food takeaway use, within the
defined Primary Shopping Areas of the town and local centres, the following factors will be
considered:
a the number of existing takeaway establishments in the immediate area as related to the
application site and their proximity to each other, to avoid clusters of takeaway uses;

Retail and Leisure Capacity Study : Final Report
Pg 8
b impact on the amenity of the immediate area (including smells, fumes and noise),
traffic or safety issues arising from the proposal itself or cumulatively with the existing
uses in the area; and
c the potential impact upon the health of local residents where it can be demonstrated
that the proposal will raise health issues.
2.31 Policy Ec11 also considers that proposals for a hot food takeaway use should also include the
provision of a litter bin on land within the premises. Within the Market Street frontage of Ashby
de la Zouch, Nos 67 to 89 and Nos 76 to 108, the Council will resist applications for new hot food
takeaway uses over and above those in existence or permitted. The concentration of hot food
takeaway uses within the defined local centre of Ibstock will not be permitted to increase above
the existing number of those in existence or permitted.
2.32 Local Plan Policy Ec12 (Local Centres) considers that planning permission will only be
granted for the loss of shopping and other main town centre uses within the defined local centre
if the premises have been vacant for at least 6 months with evidence of marketing. The following
factors will also be considered:
a the need to maintain an appropriate balance between main town centre and non-main
town centre uses;
b the contribution the unit makes to the function of the centre in terms of its size and
location within the centre;
c the nature and characteristics of the proposed use and the type and characteristics of
other uses within proximity of the application site; and
d the impact of the proposal on the shopping and service character and function of the
local centre – for example, would it create an active frontage, would the use bring
visitors to the centre?
2.33 The residential use of the upper floors of properties within these defined local centres will be
supported subject to parking and amenity considerations.

Retail and Leisure Capacity Study : Final Report
Pg 9
3.0 Current provision and trends
Introduction
3.1 This section outlines national trends that are likely to influence the need for retail and town
centre facilities in North West Leicestershire District and the prospects for attracting new
investment. It also summarises current provision within the District, which provides the
baseline for future projections in later sections of this report.
Retail trends
3.2 The economic downturn had a significant impact on the retail and leisure sectors. Many
national operators failed (e.g. Austin Reed, BHS, Comet, HMV, JJB Sports, Jessops, Maplin,
Clinton Cards, Woolworths, MFI, Toys R Us, Land of Leather, Borders, Game, Firetrap, La
Senza, Past Times, Barratts and Habitat), leaving major voids within centres and retail parks.
The latest operators to experience difficulties include House of Fraser, New Look, Carpetright,
Prezzo, Chimichanga, Strada, Byron, Marks & Spencer and Jamie Oliver, which indicate that
market conditions are still challenging.
3.3 Many town centre development schemes were delayed and the demand for traditional bulky
goods retail warehouse operators has been affected. Even some of the main food store operators
have seen a reduction in growth, with discount operators taking market share from the main
operators. To counteract the loss of market share from ‘top 4’ supermarket operators, Tesco is
preparing to launch a new discount chain called ‘Jack’s’. Up to 60 stores could be launched
including 10-15 planned for new locations, with new stores being rolled out from September
2018. At the time of writing 6 Jack’s stores have now opened.
3.4 Assessing future expenditure levels within this study needs to consider the likely speed of the
economic recovery, particularly in the short term (2018 to 2021). Careful consideration is
needed to establish the appropriate level of expenditure growth to be adopted over the plan
period. This study takes a long-term view for the plan period recognising the cyclical nature of
expenditure growth. Trends in population growth, home shopping/internet sales and growth in
turnover efficiency also need to be carefully considered and a balanced approach taken. An
overview of national trends within the retail sector is set out below.
Expenditure growth
3.5 Historic retail trends indicate that expenditure has consistently grown in real terms in the past,
generally following a cyclical growth trend. The underlying trend shows consistent growth and
this trend is expected to continue in the future. However, the impact of the EU Referendum is
expected to result in slower growth in the short term and home shopping/internet spending is
expected to grow at a faster rate than traditional forms of shopping.
3.6 After the recession in 2008/09, growth rebounded and from 2012 grew to the high of 3% in
2014 and 2% in 2015. The Office for Budget Responsibility’s (OBR) latest (November 2017)
figures for GDP show that real GDP growth averaged 0.3% a quarter in the UK in the first three
quarters of 2017, down from 0.5% in the second half of 2016. OBR’s March 2017 forecasts
assumed that real GDP growth would slow in the second quarter of 2017 as higher inflation
squeezed real incomes. The latest ONS data however indicates that this slowdown came in the
first quarter of 2017 – one quarter earlier than assumed in March 2017, but one quarter later
than assumed in the November 2016 forecast. Real GDP growth was therefore slightly weaker
over the first half of 2017 than expected in March 2017.

Retail and Leisure Capacity Study : Final Report
Pg 10
3.7 The average forecast for GDP growth in 2017 is 1.6% which is slightly higher than the current
forecast of 1.5%. The average forecast for GDP growth in 2018 is 1.4%. The average forecast for
2019 is 1.7%, while the average for 2020 is 2%. The blue shading in Figure 3.1 shows 20%
probability bands around the projection line.
Figure 3.1 Real GDP Growth Fan Chart (November 2017)
Source: OBR Economic and Fiscal Outlook – November 2017
3.8 In the past, expenditure growth has fuelled growth in retail floorspace, including major out-of-
centre development, particularly in the 1980s and 1990s. The speed of recovery from the last
economic downturn has been slow. The high pre-recession growth rates are unlikely to be
achieved in the short term, but the underlying trend over the medium and long term is expected
to lead to a need for further modern retail floorspace, even allowing for continued growth in
home shopping and turnover efficiencies. The growth in the demand for floorspace is expected
to be slow, particularly in the short term. These national trends are anticipated to be mirrored in
North West Leicestershire District.
3.9 For convenience goods, Experian’s forecasts (December 2017) anticipate limited growth (0.1%
per annum) from 2020. For comparison goods, higher levels of growth are expected in the
future (3.2% per annum from 2020), still at a lower rate than previous pre-recession trends (8%
per annum between 1997 and 2007). Historically comparison goods expenditure has grown
significantly more than convenience goods expenditure, and Experian’s latest national growth
rate recommendations are consistent with these past trends.
3.10 Experian’s latest expenditure projections consider the implications of Brexit, indicating this has
created major uncertainties regarding the long-term outlook for the UK economy. Experian’s
baseline forecasts reflect a small downgrade in the UK’s long-term projections for trade,
investment and GDP. However, the revisions to the consumer spending forecast are minimal,
with long term growth expected to remain around 2.2% to 2.3%, underpinned by rises in
population and household incomes. Experian Retail Planner Briefing Note 15 (December 2017)
states:

Retail and Leisure Capacity Study : Final Report
Pg 11
“The expansion in comparison goods volumes, averaging 3.2% per head to 2036, will be less
buoyant than in the three decades to 2015 as key factors that boosted growth, notably the
globalisation that subdued audio-visual prices significantly, will not be repeated to the same
degree.
Convenience goods enjoyed the strongest rise in the decade during 2016, buoyed by the overall
buoyancy in spending. Growth has since slowed but remains above the long-term trend over
the period 1997 to 2015 averaging – 1.2% per head a year. Our central forecast has a renewed
squeeze in convenience goods in the short term, before sales per head growth settles at 0.2% a
year from 2020 to 2036.”
3.11 Low expenditure growth and deflationary pressures (i.e. price cutting) in the non-food sector
have had an impact on the high street in the last few years. Because of these trends, the national
average shop vacancy rate (based on Goad plan data) has increased from around 10% in 2005 to
circa 14% in 2012. Vacancy rates have gradually recovered to 11.2% in 2017.
3.12 Data obtained from Goad and updated during centre visits carried out in July 2018,
demonstrated that there were 48 vacant Class A1-A5 shop units within Coalville, Ashby de la
Zouch, Castle Donington, Ibstock, Measham and Kegworth. This equates to an overall vacancy
rate of 8.8%, which is lower than the Goad national average of 11.3% (2018). Coalville had the
highest vacancy rate (16%), which is well above the national average. Coalville aside, the shop
vacancy figures suggest centres in the District are performing reasonably well despite
challenging market conditions.
New forms of retailing
3.13 New forms of retailing (multi-channel shopping) have continued to grow. Home/electronic
shopping has increased with the growth in the use of personal computers, smart phones and the
internet. Click and collect / click and return shopping has become more popular. The future
growth of multi-channel retailing including home computing, internet connections and
interactive TV will continue to influence retailing in the high street and from traditional stores.
National trends within this sector will have implications for retailing within North West
Leicestershire, because they will affect the amount of expenditure growth that will be potentially
available to support development and the strength of operator demand for new floorspace.
Special forms of trading/home shopping
3.14 Recent trends suggest continued strong growth in this sector. Experian’s Retail Planner Briefing
Note 15 (December 2017) states:
“The strong increase in online shopping in the past decade has lifted the share of special forms
of trading (SFT) to a level where it now accounts for close to 16.5% of total retail sales….
…The rising share of internet sales in total retail transactions dominates the picture of SFT.
Based on data for the first ten months of the year, internet sales’ share of total retail is
expected to come in at roughly 14% in 2017, against 4.7% in 2008.
Retail and Leisure Capacity Study : Final Report
Pg 12
…non-store retailing continues to grow rapidly, outpacing traditional forms of spending. We
retain our assumption that non-store retailing will increase at a faster pace than total retail
sales well into the long term. According to Internet World Stats, as of June 30 2017, there were
an estimated 62.1 million internet users in the UK (representing 94.8% of the population).
Growth of the internet user base will thus be less of a driver than in the past decade. But
growth momentum will be sustained as new technology such as browsing and purchasing
through mobile phones and the development of interactive TV shopping boost internet
retailing. We expect that the SFT market share will continue to increase over the forecast
period, although the pace of e-commerce growth will moderate markedly after about 2022.
Our forecast has the SFT share of total retail sales reaching almost 20% by 2022 rising to
20.5% by the mid-2030s.”
3.15 This study makes an allowance for future growth in e-tailing based on Experian projections. It
will be necessary to monitor the amount of sales attributed to home shopping in the future to
review future policies and development allocations.
3.16 The implications of these trends on the demand for retail space have been carefully considered.
Some retailers operate online sales from their traditional retail premises e.g. food store
operators and click and collect operations, therefore growth in online sales may not always
mean there is a reduction in the need for retail floorspace.
3.17 Given the likelihood that multi-channel shopping is likely to grow at a faster pace than total
retail expenditure, the retail study assessment has adopted relatively cautious growth
projections for retail expenditure and an allowance has been made for retailers to increase their
turnover density, due to growth in home shopping and click and collect.
Food store operators
3.18 In addition to new forms of retailing, retail operators have responded to changes in customers’
requirements. Retailers have also changed their trading formats to include smaller store formats
capable of being accommodated within town and local centres (such as the Tesco Express /
Metro, Sainsbury’s Local, Little Waitrose and Marks & Spencer’s Simply Food / Food Hall
formats).
3.19 The number of Tesco Express, Sainsbury’s Local and Little Waitrose stores has increased
significantly during the last decade (albeit Waitrose has recently decided to close three Little
Waitrose stores). Taking Sainsbury’s as an example, data provided by Mintel indicates that the
number of Sainsbury’s Local stores increased by 88% between 2011 and 2015, compared to the
number of larger format stores which increased by 37% over the same period. The number of
Little Waitrose trebled between 2011 and 2015.
3.20 Several proposed larger food stores have not been implemented across the country. There has
been a move away from larger stores to smaller formats, reflecting changes in customer’s
shopping habits.
3.21 The expansion of European discount food operators Aldi and Lidl has been rapid during the last
decade. This trend is evident in North West Leicestershire District with Aldi and Lidl stores in
Coalville and an Aldi store in Ashby de la Zouch. The discount sector is actively expanding and
Aldi / Lidl may look for further opportunities in North West Leicestershire District in the future.
Comparison retailers
3.22 Comparison retailers have also responded to market conditions. The bulky goods warehouse
sector has rationalised, including a few mergers and failures, and scaled down store sizes. Other

Retail and Leisure Capacity Study : Final Report
Pg 13
traditional high street retailers often seek large out-of-centre stores, for example Boots, Next,
TK Maxx and Poundstretcher. Matalan has also opened numerous discount clothing stores
across the UK. Sports clothing retail warehouses including Decathlon and Sports Direct have
also expanded out-of-centre. This trend has been evident in North West Leicestershire District,
with Sports Direct moving out of Coalville town centre to Whitwick Retail Park.
3.23 The demand for premises within the bulky goods sector, i.e. furniture, carpets, electrical and
DIY goods, has been particularly weak in recent years. This has led to voids on retail warehouse
parks and proposals to extend the range of goods sold to non-bulky goods. This can lead to the
relocation of retailers creating more vacant units in town centres. The retail warehouse sector is
reasonably well represented in North West Leicestershire District including at Whitwick Retail
Park and Nottingham Road Retail Park. These operators sell bulky comparison goods that
complement the town centres, as well as non-bulky good such as fashion on and clothing, which
provide direct competition. At present there are limited retail warehouse voids in North West
Leicestershire and this should restrict pressure to extend the range of non-bulky goods. The
composition of retail parks in North West Leicestershire should continue to be monitored and
controlled if necessary.
3.24 Within town centres, many high street multiple comparison retailers have changed their format.
For over a decade, high street national multiples have increasingly sought larger modern shop
units (over 200 sq. m) with an increasing polarisation of activity into the larger national,
regional and sub-regional centres. In general, operator demand for space has decreased during
the recession and, of those national multiples looking for space, many prefer to locate in centres
larger than Coalville and Ashby de la Zouch, such as Loughborough and Leicester, where footfall
and dwell times are higher due to the range of retailers, eateries and entertainment facilities
available in larger centres. In any event, given the historic nature of Ashby de la Zouch town
centre, many of the existing units are narrow fronted and the unit configuration could constrain
operator demand. Much of the occupier demand in smaller centres has come from non-retail
services occupied by independent operators, rather than higher order comparison goods
shopping.
3.25 The continuation of these trends will influence future operator requirements in North West
Leicestershire District with smaller vacant units becoming less attractive for new multiple
occupiers, and retailers increasingly looking to relocate into larger units. However, smaller
vacant units could still be attractive to independent traders and non-retail services.
Charity and discount shops
3.26 The charity shop sector has grown steadily over the past 20 years and there is no sign this trend
will end. It is generally considered that the general public consider that a town centre containing
a significant number of charity shops is not a healthy centre. Planning policies cannot control
the amount of charity shops because they fall within Class A1, the same category as other shops.
In many centres, charity shops have occupied vacated shop premises during the recession. This
trend is evident in Coalville and Ashby de la Zouch. Charity shops can often afford higher rents
than small independent occupiers because of business rate discounts. It does not follow that
these charity shops will be replaced by traditional shops when the market recovers, particularly
in secondary retail frontages, which is contrary to public perception.
3.27 Discount shops1 are found in Coalville town centre, with Home Bargains and Poundland both
present within the Belvoir Shopping Centre. However, this trend is not replicated in Ashby de la
Zouch nor the local centres.
1 Discount shops are those that sell mostly old stock or end-of-line products, often at a heavily reduced price.
Retail and Leisure Capacity Study : Final Report
Pg 14
Non-retail services
3.28 The growth of money lending/pay day loan shops, betting shops and hot food takeaways has
also raised concerns amongst local planning authorities, and has resulted in a change to
permitted development rights to control the growth of these uses in town centres.
3.29 Recent changes to the GPDO may also have an impact on town centres. These measures allow
for greater flexibility for changes of use from retail to non-retail uses e.g. Class A uses to C3
residential use and Class A1 uses to Class A2 uses. These measures could change the
composition of town centres; the amount of Class A1 space could reduce and the local planning
authority has little control. The measures may lead to a reduction in vacant shop premises,
particularly in peripheral shop frontages. Conversely, it could have an impact on the ability of
operators to find space, in areas where demand is higher. Given that the vacancy rate is
relatively low in North West Leicestershire District (Coalville aside) the latter may be the main
concern.
3.30 In our view it is unlikely that these temporary changes will have a significant impact on Ashby
de la Zouch, Castle Donington, Ibstock, Measham and Kegworth because the current vacancy
rates are relatively low.
3.31 These trends including the growth of home shopping are not new and have been affecting the
high street for many years. In response to these trends, town centres have changed and
diversified. The food and beverage, leisure and non-retail service sectors have been successful in
occupying space no longer attractive to retail tenants. There have been cyclical trends in vacancy
rates reflecting the macro economic trends, but in most cases, town centres recovered during
periods of stronger growth. The most recent trends suggest vacancy rates have been slow to
recover in weaker centres, and many high street retailers are still experiencing difficulties. The
Goad national shop vacancy rate increased to over 14% during the last recession, but has not
returned to pre-recession levels (around 8%). The national vacancy rate remains around 11%,
and therefore a cautious approach to future growth is required.
3.32 Shopping behaviour will continue to change and the high street will need to continue to
respond. All centres will need to focus on their advantages over other forms of multi-channel
shopping, for example using the internet as an extended shop window, click and collect facilities
and providing a combined retail and leisure experience. There will always be demand for a day
out.
Centres in North West Leicestershire District and the surrounding area
3.33 North West Leicestershire District is bound by South Derbyshire, Erewash and Rushcliffe to the
north, Charnwood to the east, Hinckley & Bosworth and North Warwickshire to the south and
Lichfield to the west.
3.34 The North West Leicestershire District Local Plan sets out a settlement hierarchy of North West
Leicestershire District (see Table 2.1 above). The location of the main centres in North West
Leicestershire i.e. Coalville, Ashby de la Zouch, Castle Donington, Ibstock, Kegworth and
Measham are shown in Figure 3.2 below.
Retail and Leisure Capacity Study : Final Report
Pg 15
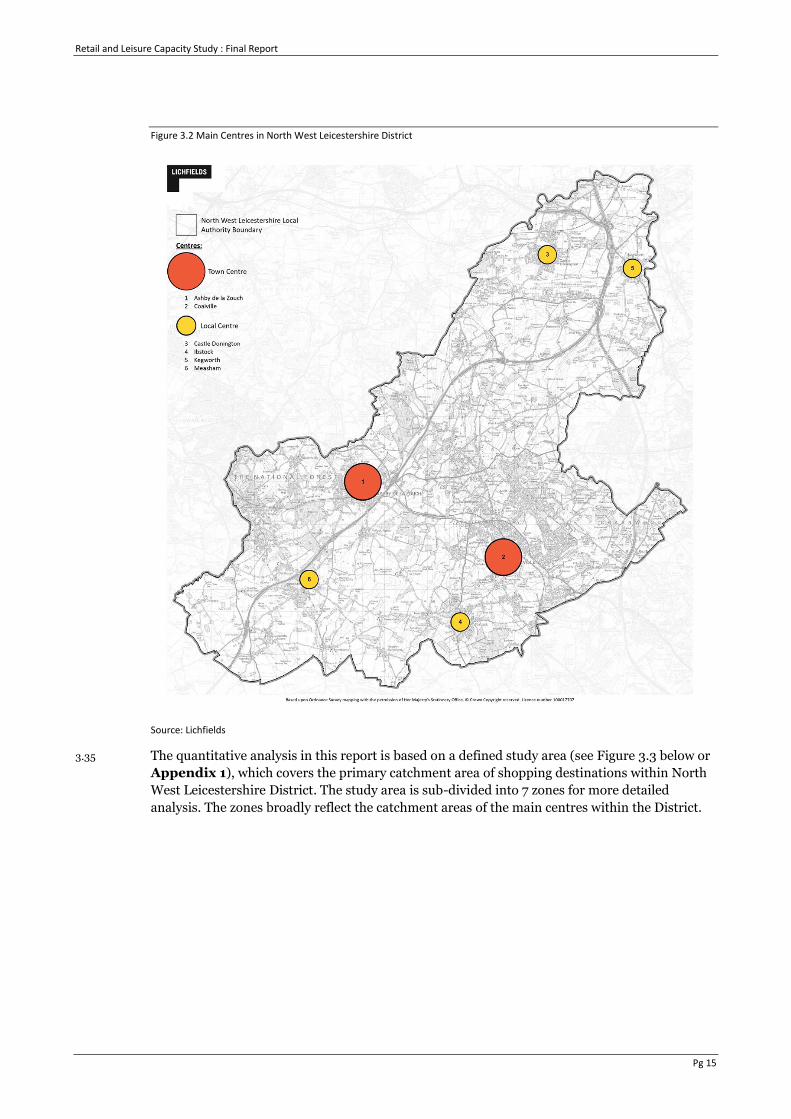
Figure 3.2 Main Centres in North West Leicestershire District
Source: Lichfields
3.35 The quantitative analysis in this report is based on a defined study area (see Figure 3.3 below or
Appendix 1), which covers the primary catchment area of shopping destinations within North
West Leicestershire District. The study area is sub-divided into 7 zones for more detailed
analysis. The zones broadly reflect the catchment areas of the main centres within the District.

Retail and Leisure Capacity Study : Final Report
Pg 16
Figure 3.3 Study Area Zones (see Appendix 1 for larger plan)
Source: Lichfields
Venuescore
3.36 The Javelin Group’s Venuescore ranks over 3,500 retail destinations in the UK including town
centres, malls, retail warehouse parks and factory outlet centres across the country (individual
‘out-of-centre’ stores are not included). Each destination is given a weighted score based on the
number of multiple retailers present, including anchor stores, fashion operators and non-
fashion multiples. The score attached to each retailer is weighted depending on their overall
impact on shopping patterns, e.g. a department store will achieve a high score. The scores relate
to each shopping destination and do not include out of centre stores.
3.37 This Javelin information is widely used in the retail industry to assess the relative strength of
shopping destinations. The results for North West Leicestershire District and other relevant
centres outside of the District are shown in Table 3.1.

Retail and Leisure Capacity Study : Final Report
Pg 17
Table 3.1 Venuescore UK Shopping Index and UK Rank
Shopping Destination Location Grade Venuescore UK Rank Market Position
Leicester Major City 394 15 Middle
Loughborough Regional 137 174 Middle
Lichfield Sub-Regional 100 255 Middle
Fosse Park, Leicester Sub-Regional 94 274 Middle
Long Eaton Sub-Regional 85 323 Lower Middle
Beaumont Leys Major District 62 473 Lower Middle
Ilkeston Major District 61 482 Lower Middle
Swadlincote Major District 57 520 Lower Middle
Hinckley Major District 55 551 Lower Middle
Coalville Major District 54 558 Lower Middle
Thurmaston Retail Park, Thurmaston District 39 799 Middle
Ashby de la Zouch District 33 968 Middle
West Bridgford District 32 1,008 Middle
Corley Minor District 25 1,276 Middle
St Georges Retail Park, Leicester Minor District 24 1,325 Lower Middle
Resolution Road, Ashby Minor District 21 1,481 Middle
Bingham, Nottingham Local 18 1,696 Middle
Rugby Road, Hinckley Local 17 1,775 Middle
Atherstone Local 16 1,888 Lower Middle
Whitwick Retail Park Local 16 1,888 Lower Middle
Kensington Business Park, Ilkeston Local 15 2,021 Middle
Loughborough Road, Nottingham Local 15 2,021 Unknown
Epinal Way, Loughborough Local 14 2,171 Middle
Regents Place Retail Park, Loughborough Local 14 2,171 Middle
Syston Local 14 2,171 Unknown
Waterside Retail Park, Ilkeston Local 14 2,171 Unknown
Gorse Cover Centre, Loughborough Local 13 2,377 Middle
Lichfield Retail Park, Lichfield Local 13 2,377 Lower Middle
Donington Park Services Local 12 2,566 Middle
Gamston, Nottingham Local 12 2,566 Middle
Hawley Road, Hinckley Local 12 2,566 Unknown
Meridian Leisure Park, Leicester Local 12 2,566 Middle
Willowbrook Retail Park, Loughborough Local 12 2,566 Middle
Beacon Street, Lichfield Local 11 2,815 Middle
East Midlands Airport Local 11 2,815 Middle
Charnwood Road, Loughborough Local 11 2,815 Middle
Civic Way, Swadlincote Local 11 2,815 Middle
Hinckley Fields Industrial Estate, Hinckley Local 10 3,133 Middle
Milestone Way / Chasewater, Burntwood Local 10 3,133 Middle
Tamworth MSA, Tamworth Local 10 3,133 Middle
Source: Venuescore, Javelin Group 2016/17

Retail and Leisure Capacity Study : Final Report
Pg 18
Figure 3.4 Venuescore 2016/17 Rankings
Source: Venuescore, Javelin Group 2016/17

Retail and Leisure Capacity Study : Final Report
Pg 19
3.38 The location of Venuescore centres is shown in Figure 3.4, and this indicates that residents in
North West Leicestershire District have good access to several large centres, as well as having a
choice of smaller centres to meet their day to day shopping needs.
3.39 Leicester city centre is at the top of the hierarchy in the sub-region with a Venuescore of 394 and
is ranked 15th in the UK. Javelin places North West Leicestershire’s centres below the next tier of
regional centres such as Loughborough (174th), Lichfield (255th) and Fosse Park (274th). Coalville
is classified as a “Major District” centre with a Venuescore of 54 and a UK rank of 558th. Ashby
de la Zouch is classified as a “District” centre and has a similar Venuescore to Coalville (33) but
has a lower UK ranking (968th).
3.40 The other centres which are the subject of this study have few national multiple retailers and are
not included within the Venuescore analysis. It should also be noted that the Venuescore data is
weighted towards clothing and fashion retailing. Within the sub-region, clothing/fashion
shopping facilities are primarily focused in the city and larger town centres. Therefore, the
relevance to North West Leicestershire’s local centres is limited.
3.41 Javelin also assesses the market position of centres based on the retailers present and the
centre’s relative position along a spectrum running from discount (i.e. pound shops) to luxury
(i.e. brands such as Chanel) or down-market to aspirational (i.e. lower, middle to upscale), as
shown in Table 3.1. The market position is assessed proportional to the size of the respective
centre. Again, this information is weighted towards clothing and fashion retailing.
3.42 Each venue has an estimated average market position score based on the retailers present, with
the ‘market position index’ for each centre then calculated by comparing the venue’s market
position score against the average for all venues. The average market position index is 100, and
Leicester city centre has a market position index of 105. As 105 is just above 100, Leicester city
centre has a ‘middle’ market position. A further example is Nottingham city centre which has a
market position index of 112, well above average, meaning Nottingham city centre has an ‘upper
middle’ market position.
3.43 The market position relates specifically to the fashion offer together with other easily classified
operators, because the range and choice of clothing and fashion shopping is the key driver in the
relative attraction of large comparison shopping destinations. Javelin also provides other
measures of the strength of centres as outlined below.
3.44 Coalville and Ashby de la Zouch are classed as having a “Lower Middle” and “Middle” market
position respectively. This suggests they do not offer the same level of luxury / high quality
retailing as larger town centres or centres within areas with higher levels of affluence. That
being said, Coalville and Ashby de la Zouch are very different town centres, with Ashby de la
Zouch known for selling higher end gifts than Coalville. However, none of the centres within
Table 3.1 have a market position in a higher category than “Middle”.
3.45 In addition to its market position and Venuescore, each destination is also assessed in terms of a
range of other attributes, as follows:
1 age focus (is the offer targeting younger or older consumers?); and
2 fashionability of its offer (is the clothing offer traditional or progressive?).
3.46 The Javelin Group classifies retailers in terms of their “fashionability” ranging from “traditional”
at one end, then “updated classic”, “fashion moderate”, “fashion forward” through to
“progressive” at the other, i.e. least fashionable to the most fashionable. This classification is
only reliable for larger centres because it focuses on national multiples rather than independent
outlets.

Retail and Leisure Capacity Study : Final Report
Pg 20
3.47 The age position of the fashion offer is also classified ranging from “young”, “middle” to “old”,
for example shops such as Hollister, H&M, Miss Selfridge and Superdry appealing more to the
young and shops such as Wallis and Edinburgh Woollen Mill appealing more to the old.
3.48 Coalville and Ashby de la Zouch tend to cater predominantly for older customers, being
described as “updated classic” and “fashion moderate” respectively. This reflects the older age
profile of residents within the District.
3.49 The Javelin information outlined above, indicates that Coalville is the most significant shopping
destination in the District, and has the best prospects for attracting future growth and major
investment.

Retail and Leisure Capacity Study : Final Report
Pg 21
4.0 The need for retail uses
Introduction
4.1 This section assesses the need for Class A1 retail uses within North West Leicestershire District.
The new NPPF (para. 11) indicates that Local Planning Authorities should positively seek
opportunities to meet the development needs of their area, and Local Plans should meet
objectively assessed needs.
4.2 This section objectively assesses the quantitative and qualitative scope for retail uses in North
West Leicestershire District for the period 2018 to 2036. It sets out the methodology adopted
and provides a quantitative capacity analysis in terms of levels of spending for convenience and
comparison shopping. A qualitative assessment of the range and scale of existing shopping
facilities has been undertaken as part of the town centre health check / audits in Section 7.
Methodology and base data
4.3 The methodology is summarised in Figure 4.1. The approach adopted to produce retail
projections follows the key steps identified within the Planning Practice Guidance. The approach
adopts economic growth forecasts that are widely used and accepted for development plan
preparation and at planning inquiries.
Figure 4.1 Methodology for Estimating Future Requirements for Retail Floorspace
Source: Lichfields
4.4 Stage 1 establishes existing demand (population and expenditure) and supply (floorspace and
facilities). Stage 2 assesses the balance between supply and demand and projects forward to

Retail and Leisure Capacity Study : Final Report
Pg 22
quantify future requirements for new facilities. Stage 3 considers how future growth should be
distributed and accommodated.
Price base
4.5 All monetary values expressed in this study are at 2016 prices, consistent with Experian's most
up to date base year expenditure figures for 2016 (Experian Briefing Note 15, December 2017).
Study area
4.6 A study area has been defined to cover these catchment areas and a household telephone survey
has been undertaken to quantify existing shopping and leisure patterns. The study area defined
in the 2013 study and the 2015 retail update study has been reviewed and is considered robust,
and has been adopted in this 2018 study.
4.7 The study area covers the primary catchment areas of the town centres in North West
Leicestershire District. The primary catchment area is the hinterland where each town /
shopping destinations attracts most of its trade. The study area has been sub-divided into 7
zones as shown in Appendix 1, based on Lower Layer Super Output Areas (LSOAs), reflecting
the primary catchment areas of the main destinations within the District i.e. Coalville, Ashby de
la Zouch, Castle Donington, Ibstock, Kegworth, Measham.
Population
4.8 The projected population within the study area between 2018 and 2036 is set out in Table 1,
Appendix 2. Base year population data has been obtained from Experian for each zone. The
2016 Experian population estimate for each zone has been projected forward up to 2036 using
the Office of National Statistics’ latest 2016-based sub-national population projections
(published May 2018). The base year (2018) population within the study area is 99,813 which is
projected to increase by 12.8% to 112,613 by 2036.
4.9 If population projections change during the development process then it may be necessary to
monitor and test the implications of these changes, and revised floorspace capacity figures may
need to be produced. The implications of potential changes to these population projections are
not expected to significantly change the floorspace capacity estimates in this report.
Retail expenditure
4.10 The level of available expenditure to support retailers is based on first establishing per capita
levels of spend for the study area population. Experian's local consumer expenditure estimates
for comparison and convenience goods for each of the study area zones for the year 2016 have
been obtained.
4.11 Experian's EBS national expenditure information (Experian Retail Planner Briefing Note 15,
December 2017) has been used to forecast expenditure within the study area. Experian's
forecasts are based on an econometric model of disaggregated consumer spending. This model
takes several macro-economic forecasts (chiefly consumer spending, incomes and inflation) and
uses them to produce forecasts of consumer spending volumes, prices and values, broken down
into separate categories of goods. The model incorporates assumptions about income and price
elasticities, i.e. the measure of the effect of a price change or a change in the quantity supplied
on the demand for a product or service.

Retail and Leisure Capacity Study : Final Report
Pg 23
Growth rates
4.12 Experian's EBS growth forecast rates for expenditure reflect the current economic circumstance
and post Brexit forecasts. Experian provides an appropriate growth rate for the short term as
per Table 4.1 below. In the longer term it is more difficult to forecast year on year changes in
expenditure, but Experian's longer-term growth average forecasts have been adopted and are set
out in Table 4.1 below.
Table 4.1 Post-Brexit Growth Forecasts
Year Convenience Goods Growth Forecasts Comparison Goods Growth Forecasts
2017 0% +2.3%
2018 -0.6% +0.9%
2019 -0.2% +2.1%
2020-2024 0.1% per annum +3.2% per annum
Post 2024 0.1% per annum +3.2% per annum
Source: Experian Briefing Note 15 (December 2017)
4.13 These growth rates are relatively cautious when compared with past growth rates, but represent
the most realistic forecast for future growth. These growth figures relate to real growth and
exclude inflation.
Special forms of trading
4.14 Special Forms of Trading (SFT) or non-store activity is included within Experian's expenditure
estimates. SFT includes other forms of retail expenditure not spent in shops e.g. mail order
sales, some internet sales, vending machines, party plan selling, market stalls and door to door
selling.
4.15 Home/electronic shopping has emerged with the increasing growth in the use of personal
computers and the internet. This study makes an allowance for future growth in e-tailing based
on Experian projections. It will be necessary to monitor the amount of sales attributed to home
shopping in the future to review future policies and development allocations.
4.16 SFT needs to be excluded from retail assessments because it relates to expenditure not spent in
shops and does not have a direct relationship with the demand for retail floorspace. The growth
in home computing, internet connections and interactive TV may lead to a growth in home
shopping and may have effects on retailing in the high street. Experian provides projections for
special forms of trading and e-tailing. The Experian information suggests that non-store retail
sales in 2017 was:
• 10.8% of convenience goods expenditure; and
• 19.7% of comparison goods expenditure.
4.17 Experian predicts that these figures will increase in the future. Experian recognises that not all
this SFT expenditure should be excluded from a retail capacity analysis, because some of it
relates to internet sales through traditional retail businesses, rather than internet companies.
4.18 The turnover attributable to e-tail through retail businesses is included in the company average
turnovers, and therefore expenditure figures should not exclude this expenditure. Experian has
provided adjusted deductions for SFT and projections. These projections have been used to
exclude only e-tail expenditure attributed to non-retail businesses, which will not directly
impact on the demand for retail floorspace. Furthermore, the growth in online sales through
retail businesses will reduce the need for sales floorspace, but should allow operators to increase

Retail and Leisure Capacity Study : Final Report
Pg 24
their turnover efficiency. This trend has been considered. The adjusted figures for SFT are set
out in Table 4.2 below.
Table 4.2 Adjusted Estimates for the UK
Year Convenience (%) Comparison (%)
2018 3.4% 15.4%
By 2021 3.9% 16.9%
By 2031 5.1% 17.8%
By 2036 5.3% 18.0%
Source: Experian Briefing Note 15 (December 2017)
4.19 These figures relate to the national average for comparison and convenience good expenditure
as a whole. The household shopper survey results suggest the amount of SFT varies significantly
for each category of comparison goods, ranging from 4.0% to 55.7%. SFT has been subtracted
based on national averages shown above.
Forecast spend per head
4.20 Table 2, Appendix 2 sets out the forecast growth in spending per head for convenience goods
within each zone in the study area up to 2036. Forecasts of comparison goods spending per
capita are shown in Table 2, Appendix 3.
4.21 Table 3, Appendix 2 sets out total convenience goods expenditure within the study area up to
2036 (population multiplied by average expenditure per capita). Forecasts of comparison goods
spending are shown in Table 3, Appendix 3.
4.22 Because of growth in population, convenience goods spending within the study area is forecast
to increase by 12.3% from £210.52 million in 2018 to £236.36 million in 2036, as shown in
Table 3, Appendix 2. Comparison goods spending is forecast to increase by some 90.7%
between 2018 and 2036, increasing from £311.68 million in 2018 to £594.47 million in 2036, as
shown in Table 3, Appendix 3. These figures relate to real growth and exclude inflation.
4.23 It should be noted that comparison goods spending is forecast to increase more than
convenience spending as the amount spent on groceries does not necessarily increase
proportionately with disposable income, whereas spending on non-food goods is more closely
linked to income. Growth is still likely to be less than was previously envisaged pre-Brexit.
Market shares/penetration rates
4.24 To assess the capacity for new retail floorspace, penetration rates are estimated for shopping
facilities within the study area. The assessment of penetration rates is based on a range of
factors but primarily information gathered through the July 2018 household survey. The results
of the household shopper questionnaire survey undertaken by NEMS in July 2018 have been
used to estimate existing shopping patterns within the study area zones. The tabulated results
are shown in Appendix 5.
4.25 The total turnover of shops within North West Leicestershire District is estimated based on
penetration rates. For convenience goods shopping turnover estimates are then compared to
average company benchmark or average sales floorspace densities derived from Global Data,
which provides an indication of how individual retail stores and centres are performing against
expected turnover averages. This allows the identification of potential surplus or deficit capacity
for retail sales floorspace.

Retail and Leisure Capacity Study : Final Report
Pg 25
4.26 The results of the household shopper survey relating to main and top-up food and grocery
shopping have been used to estimate existing convenience goods shopping patterns. The
estimates of market share or penetration within each study area zone for convenience goods
shopping are shown in Table 4, Appendix 2. The market shares in Table 4 are a combined
rate for both main and top up shopping based on a 70:30 split, i.e. 70% main food shopping and
30% top-up shopping. This 70:30 split is based on Lichfields’ experience and is widely accepted
in retail studies of this kind.
4.27 The market shares for comparison goods shopping are shown in Table 4, Appendix 3. This
market share is based on a weighted average2 for each comparison goods category including
within the household survey e.g. clothing / footwear, electrical, furniture, floorcoverings, DIY
and health and beauty products.
Benchmark turnover levels
4.28 Company average turnover of sales floorspace densities are available for major food store
operators and are compiled by Global Data. Company average sales densities (adjusted to
exclude petrol and comparison sales and include VAT) have been applied to the sales area of the
large food stores, and a benchmark turnover for each store has been calculated as shown in
Table 10 in Appendix 2.
4.29 The combined benchmark turnover of existing food stores and convenience shops in the District
is £204.91 million, as shown in Table 10 in Appendix 2. This benchmark turnover is not
necessarily the actual turnover of existing facilities, but it does provide a useful benchmark for
assessing existing shopping patterns and the adequacy of current floorspace in quantitative
terms.
4.30 The estimated convenience goods sales areas have been derived from a combination of the
Institute of Oxford Retail Consultants (ORC) StorePoint database, Valuation Office data and
Lichfields’ own on-site surveys. Estimates for comparison sales floorspace within large food
stores has been deducted, for consistency with the use of goods based expenditure figures.
4.31 Global Data and Mintel's Retail Rankings provide company average sales density information
for a selection of national comparison retailers. Based on Lichfields’ experience, the average
sales density for high street comparison retailers usually ranges between £4,000 and £8,000
per sq. m net. The average sales density for food and beverage outlets is usually around £5,000
per sq. m gross.
Existing spending patterns
Convenience shopping
4.32 The estimates of market share or penetration within each study area zone are shown in Table 4,
Appendix 2. A summary of food and grocery shopping patterns for main food shopping trips
for the most frequently used stores (over 5% of respondents) by zone is shown in Table 4.3.
4.33 The survey results indicate most residents in Ashby de la Zouch (Zone 3) do their main food
shopping locally. Ashby de la Zouch also attracts a significant share of customers from Zone 2
(North of Coalville) and Zone 4 (Measham).
2 The weighted average for each comparison goods category is derived from the total expenditure per person within the District for each of the comparison sub-categories

Retail and Leisure Capacity Study : Final Report
Pg 26
Table 4.3 Main Food Shopping Destinations Most Used by Respondents by Zone
Zone Destination Destination Zone
Zone 1 – Castle Donington & Kegworth
Asda, Long Eaton (13.0%) Outside
Tesco Extra, Long Eaton (10.1%) Outside
Morrisons, Loughborough (8.9%) Outside
Aldi, Long Eaton (8.7%) Outside
Aldi, Loughborough (8.1%) Outside
Co-op, Castle Donington (7.3%) 1
Aldi, Ashby de la Zouch (6.4%) 3
Sainsbury’s, Loughborough (5.0%) Outside
Zone 2 – North of Coalville Tesco Extra, Ashby de la Zouch (34.8%) 3
Morrisons, Coalville (21.4%) 6
Aldi, Coalville (15.5%) 6
Co-op, Coalville (5.6%) 6
Zone 3 – Ashby de la Zouch Tesco Extra, Ashby de la Zouch (47.0%) 3
Aldi, Ashby de la Zouch (17.4%) 3
Sainsbury’s, Swadlincote (8.3%) Outside
Morrisons, Swadlincote (8.3%) Outside
Zone 4 – Measham Tesco Extra, Ashby de la Zouch (25.7%) 3
Aldi, Ashby de la Zouch (19.6%) 3
Morrisons, Swadlincote (13.7%) Outside
Aldi, Swadlincote (9.2%) Outside
Sainsbury’s, Swadlincote (5.4%) Outside
Zone 5 – Ibstock Aldi, Coalville (22.3%) 6
Morrisons, Coalville (21.9%) 6
Tesco Extra, Ashby de la Zouch (19.6%) 3
Aldi, Ashby de la Zouch (14.6%) 3
Lidl, Coalville (5.6%) 6
Co-op, Ibstock (5.5%) 5
Zone 6 – Coalville Morrisons, Coalville (41.7%) 6
Aldi, Coalville (24.6%) 6
Tesco Extra, Ashby de la Zouch (13.0%) 3
Lidl, Coalville (7.5%) 6
Co-op, Coalville (5.3%) 6
Zone 7 – Whitwick Morrisons, Coalville (44.6%) 6
Aldi, Coalville (27.3%) 6
Tesco Extra, Ashby de la Zouch (10.1%) 3
Lidl, Coalville (5.3%) 6
Source: NEMS Household Survey, July 2018
4.34 Likewise, the survey results indicate most residents in Coalville (Zone 6) do their main food
shopping locally. Coalville also attracts a significant share of customers from Zone 2 (North of
Coalville), Zone 5 (Ibstock) and Zone 7 (Whitwick).
4.35 In other zones (Ashby de la Zouch and Coalville aside), most respondents do not undertake their
main food shopping locally. This reflects the relative lack of convenience/food store provision
outside of the two main centres within the District. However, the food stores in North West
Leicestershire District retain a high proportion of main food and grocery shopping trips
generated by residents in the District. Households in rural parts of the District need to travel to
Ashby de la Zouch and Coalville to access a range of large food stores. However, this is to be

Retail and Leisure Capacity Study : Final Report
Pg 27
expected as many of the defined centres are small and travel times to the main towns is not
unreasonable.
4.36 Table 4, Appendix 2 indicates the proportion of total convenience goods expenditure (main
and top up trips) within each zone attracted to each destination. North West Leicestershire
District retains over 95% of convenience goods expenditure within zones 5 (Ibstock), 6
(Coalville) and 7 (Whitwick). The overall convenience goods expenditure retention rate in North
West Leicestershire District is 83%.
4.37 The level of convenience goods expenditure attracted to shops / stores from within North West
Leicestershire District in 2018 is estimated to be £189.08 million as shown in Table 5,
Appendix 2, applying the market shares set out in Table 4, Appendix 2.
4.38 Overall North West Leicestershire District has a relatively high retention of convenience goods
expenditure at 83% and there is only limited potential to increase this level of retention. The
base year actual turnover estimate (£189.08 million) when compared with the combined
benchmark turnover (£204.91 million) suggests convenience goods retail sales floorspace in the
District is collectively trading about 7.7% below average. A breakdown for each main destination
is set out in Table 4.4.
Table 4.4 Convenience Goods Actual/Benchmark Turnover at 2018
Destination 2018 Turnover £m Benchmark Turnover £M
Ashby de la Zouch 71.55 83.07
Coalville 81.00 78.36
Castle Donington 8.37 12.33
Ibstock 7.97 8.82
Kegworth 3.12 3.25
Measham 4.43 6.13
Other 12.64 12.94
Total 189.08 204.91
Source: Table 11, Appendix 2
4.39 A qualitative analysis of convenience goods provision is set out later in this section.
Comparison shopping
4.40 Respondents to the household survey were asked where they generally buy most of their
household’s non-food shopping. Results are summarised in Figure 4.2 Non-Food Shopping
(main destinations named by respondents) below. For Zone 3 (Ashby de la Zouch), Ashby de la
Zouch town centre was the most popular destination (39%). For Zone 6 (Coalville), Coalville
town centre was the most popular destination (33%). These relatively low comparison goods
market shares reflect Ashby de la Zouch and Coalville position in the sub-regional retail
hierarchy, i.e. they fall within the catchment areas of larger centres. In the rest of the study area,
Ashby de la Zouch and Coalville retain some market share, but destinations outside of the
District are more popular, such as Leicester City Centre and Loughborough Town Centre.
4.41 A summary of comparison goods shopping patterns is shown in Table 4, Appendix 3. This
table sets out the proportion of comparison goods expenditure within each zone that is spent
within each shopping destination. Destinations in North West Leicestershire District retain a
moderate proportion of comparison goods expenditure within the core zones (Zones 3 and 6).
4.42 The estimated comparison goods expenditure currently attracted by shopping facilities within
North West Leicestershire District is £118.73 million in 2018, as shown in Table 5, Appendix
3. The retention of comparison goods shopping trips within North West Leicestershire District

Retail and Leisure Capacity Study : Final Report
Pg 28
is lower than for convenience goods shopping. This reflects the propensity of customers to do
food and grocery shopping locally, whilst for comparison shopping, customers are more likely to
shop around and travel longer distances to visit larger centres that have a better range and
choice of shops. This is particularly the case in North West Leicester District where comparison
provision is relatively limited and the District is surrounded by higher order centres within
driving distance.
Figure 4.2 Non-Food Shopping (main destinations named by respondents)
Source: NEMS Household Survey, July 2018 (Question 7)
4.43 Total comparison goods sales floorspace within Ashby de la Zouch and Coalville is estimated to
be 27,954 sq. m net, as shown in Table 10, Appendix 3. The average sales density for this
existing comparison goods sales floorspace is £3,616 per sq. m net. The average in Ashby de la
Zouch is £4,367 per sq. m net, higher than the average in Coalville (£3,031 per sq. m net).
4.44 Based on Lichfields’ recent experience across the country, average sales densities for
comparison floorspace can vary significantly. High average sales densities above £6,000 per sq.
m net are usually only achieved by relatively large shopping centres. In smaller centres, usually
where the property costs are much lower, these high sales densities are not normally achieved.
Average sales densities of between £3,000 and £6,000 per sq. m net are generally achieved in
medium sized and smaller centres. Overall trading levels are relatively low in North West
Leicestershire District, particularly in Coalville. An allowance should normally be made for
existing floorspace to increase its sales density in real terms in the future, i.e. increase the
revenue generated for a given area of sales floorspace, to maintain the vitality and viability of
town centres.
Capacity for future convenience goods floorspace
4.45 The future level of available convenience goods expenditure at 2021, 2026, 2031 and 2036 is
shown at Tables 6 to 9, Appendix 2.
4.46 The total level of convenience goods expenditure available for shops in the District between
2018 and 2036 is summarised in Table 11, Appendix 2. Convenience expenditure available to
shopping facilities in the District is expected to increase from £189.08 million in 2018 to £212.3
million in 2036.
18%
11% 11% 10% 10%
6%
0%
5%
10%
15%
20%

Retail and Leisure Capacity Study : Final Report
Pg 29
4.47 Table 11 subtracts the turnover of existing floorspace from available expenditure to calculate the
amount of surplus expenditure that may be available for further development. Within the
District, there is no convenience goods expenditure surplus at 2021 or at 2026. There is a small
surplus of +£1.15 million by 2031, growing to +£7.39 million by 2036, due to future growth
(primarily population growth). Coalville is the exception to this with a need for convenience
floorspace within Coalville of 1,145 sq. m net/1,635 sq. m gross by 2036, much of which is
subsumed by negative capacity in other centres.
4.48 The surplus expenditure projections have been converted into potential new floorspace
estimates in Table 12, Appendix 2. Surplus expenditure is converted into floorspace estimates
based on an assumed average sales density figure of £11,000 per sq. m, an approximate average
turnover density for main food supermarket operators (Aldi, Asda, Lidl, Morrison’s, Sainsbury’s,
Tesco and Waitrose) because new floorspace is likely to be provided by these main operators
rather than small independent convenience shops. The figures are summarised in Table 4.5
below.
4.49 There is a projected expenditure surplus in Coalville that could support a reasonable level of
additional floorspace in line with population growth. Elsewhere in the District, there is a very
limited amount of additional floorspace over the plan period which does not need to be planned
for.
Table 4.5 Summary of Convenience Goods Floorspace Projections on a Cumulative Basis (sq.m gross)
Centre By 2021 By 2026 By 2031 By 2036
Ashby de la Zouch 0 0 0 0
Coalville 558 938 1,288 1,635
Castle Donington 0 0 0 0
Ibstock 0 0 0 17
Kegworth 0 6 20 33
Measham 0 0 0 0
Other NW Leicestershire 0 53 108 162
Total 558 991 1,416 1,847
Source: Table 12 in Appendix 2
Capacity for future comparison goods floorspace
4.50 Future improvements to comparison retail provision within the District could help to increase
market shares within the study area. Some retail development will be necessary in Ashby de la
Zouch and Coalville to maintain its existing market share in the future. Allowing for the growth
in home shopping, the town centre strategy should focus on maintaining and increasing market
shares of traditional forms of expenditure. This approach will respond to future competition in
nearby centres, and help to maintain the vitality and viability of the centre.
4.51 For the purposes of this assessment, the existing comparison goods floorspace is estimated to be
trading at equilibrium in 2018 (i.e. satisfactory levels). Table 11, Appendix 3 assumes that the
turnover of comparison floorspace will increase in real terms in the future. Growth rate of
+0.9% between 2018 and 2019; +1.8% between 2019 and 2020; 2.3% per annum between 2020
to 2024; and 2.2% per annum post 2024 has been adopted, as recommended by Experian
(Retail Planner Briefing Note 15 – December 2017). These growth rates will be required to
maintain the health and viability of town centres in North West Leicestershire. Trends indicate
that comparison retailers historically will achieve some growth in trading efficiency. This is a
function of spend growing at faster rates than new floorspace provision and retailers' ability to
absorb real increases in their costs by increasing their turnover to floorspace ratio.

Retail and Leisure Capacity Study : Final Report
Pg 30
4.52 Table 11 subtracts the turnover of existing floorspace from available expenditure to calculate the
amount of surplus expenditure that may be available for further development. Within the
District, there is an available expenditure surplus of +£5.32 million comparison goods
expenditure by 2021. This surplus will grow to +£17.36 million by 2026, +£33.23 million by
2031 and +£53.03 million by 2036.
4.53 The comparison goods expenditure surplus is converted into net comparison sales floorspace
projections at Table 12, Appendix 3, adopting an average sales density of £6,000 per sq.m
net in 2018, which is projected to grow in the future due to improved turnover efficiency. The
figures are summarised in Table 4.6 below.
Table 4.6 Summary of Comparison Goods Floorspace Projections on a Cumulative Basis (sq.m gross)
Centre By 2021 By 2026 By 2031 By 2036
Ashby de la Zouch 506 1,479 2,539 3,634
Coalville 451 1,317 2,260 3,236
Castle Donington 56 164 281 403
Ibstock 45 131 224 321
Kegworth 11 33 57 82
Measham 36 104 179 256
Other NW Leicestershire 19 56 96 137
Total 1,124 3,284 5,636 8,069
Source: Table 12, Appendix 3
The Retail Study Update 2015
4.54 A Retail Study Update was completed in 2012. That study included quantitative forecasts of
future retail floorspace needs on a District-wide basis. In 2015, the retail study was updated with
the latest information on growth in population and expenditure and other forecasting
parameters, rolling it forward to 2031.
4.55 The 2015 study’s baseline convenience goods net sales floorspace projections up to 2031 are set
out below (Scenario 3 – Static Retention Minus Belvoir Shopping Centre Commitment):
1 By 2021 – 386 sq. m net;
2 By 2026 – 963 sq. m net; and
3 By 2031 – 1,526 sq. m net.
4.56 The 2015 study comparison goods floorspace projection up to 2031 is set out below (Scenario 3
– Static Retention Minus Belvoir Shopping Centre Commitment):
1 By 2021 – 1,699 sq. m net;
2 By 2026 – 4,800 sq. m net; and
3 By 2031 – 8,548 sq. m net.
4.57 According to the 2015 Retail Study Update, the District-wide convenience goods floorspace
projection in 2031 was 1,526 sq.m net. The revised projections in this 2018 study is slightly
lower at 991 sq.m net (1,416 sq.m gross).
4.58 According to the 2015 Retail Study Update, the District-wide comparison goods floorspace
projection in 2031 was 8,548 sq. m net. The revised projections in this 2018 Study is lower at
4,227 sq.m net (5,636 sq.m gross) primarily due to higher sales densities now adopted.

Retail and Leisure Capacity Study : Final Report
Pg 31
Qualitative need for retail floorspace
4.59 The section above quantifies the theoretical capacity to support new retail floorspace within
North West Leicestershire District, based on the population and expenditure projections. The
qualitative need for retail facilities also needs to be considered. Qualitative need can be assessed
through consideration of the following factors:
1 the diversity of uses and deficiencies or 'gaps' in existing provision;
2 consumer choice and competition;
3 levels of expenditure retention and leakage;
4 overtrading, congestion and overcrowding of existing stores;
5 location specific needs such as underserved markets; and
6 the quality of existing provision.
4.60 The assessment of shopping patterns in this section indicates North West Leicestershire District
retains a relatively high proportion of both convenience and comparison goods expenditure, and
there is limited potential to increase market share through the clawback of expenditure leakage.
The existing trading performance does not indicate overtrading or in-store congestion. Other
qualitative indicators of need are explored in the remainder of this section and within the centre
health checks in Section 7.
Existing retail provision in North West Leicestershire District
4.61 As part of the study, an audit of the existing retail and service provision in the main settlements
(Ashby de la Zouch, Coalville, Castle Donington, Ibstock, Kegworth and Measham) was
undertaken in July 2018. These assessments are detailed in Section 7 of this study and a
summary of existing retail provision in Ashby de la Zouch and Coalville is provided in Table 4.7
below.
Table 4.7 Convenience and Comparison Sales Floorspace (in and out of centre)
Centre Convenience Floorspace sq. m net
Comparison Floorspace sq. m net
Total Retail Floorspace sq. m net
Ashby de la Zouch 7,459 12,245 19,704
Coalville 7,382 15,709 23,091
Total 14,841 27,954 42,795
Source: Experian Goad and ORC StorePoint updated by Lichfields
4.62 Coalville is the largest shopping destination within the District with a combined retail sales
floorspace of over 23,000 sq. m net. Ashby de la Zouch is the next largest destination, with a
combined retail sales floorspace of over 19,000 sq. m net. Castle Donington, Ibstock, Kegworth
and Measham are much smaller, with only a very limited number of dispersed shop units that
cater for local needs.
4.63 Figure 4.3 shows the proportional mix of Class A within the main town and local centre,
excluding out of centre food stores and retail warehouses in Ashby de la Zouch and Coalville.
The mix of units has been compared with Goad Plan national average (July 2018) based on
recent land use surveys for over 1,250 town centres across the UK. It should be noted that the
Goad national average is based on a full range of large, medium and small centres throughout
the UK. Smaller centres tend to have a lower proportion of Class A1 comparison shops than
larger centres, and conversely a higher proportion of convenience retailing and non-retail

Retail and Leisure Capacity Study : Final Report
Pg 32
services. Nevertheless, the comparison with the national average data provides a useful
benchmark.
Figure 4.3 Mix of Class A Uses in North West Leicestershire District’s Main Centres
Source: Experian Goad base updated by Lichfields (July 2018)
4.64 In Ashby de la Zouch, the proportion of comparison units is significantly above the national
average, due in part to the low shop vacancy rate. The vacancy rate (4.2%) is significantly below
the national average of 11.3%, suggesting the town centre is relatively healthy. This suggests
Ashby de la Zouch has a good selection of comparison goods shops for a centre of its size.
4.65 The proportion of convenience and comparison units in Coalville are broadly comparable with
their respective national averages. Convenience and comparison provision in the town centre is
supplemented by the Morrison’s food store and various comparison operators at Whitwick
Retail Park. However, Coalville has a high proportion of vacant units (six percentage points
above the national average) which suggested the health of the town centre is more vulnerable
than Ashby de la Zouch. Nevertheless, Coalville has a reasonable selection of comparison goods
shops for a centre of its size.
4.66 Castle Donington, Ibstock, Kegworth and Measham are small centres with between 26 and 43
shop units, and are not included within Goad data. This means that comparing the proportion of
units within the local centres with the national average for larger town centres needs to be
treated with care. These local centres have a small choice of retail uses within each of the Goad
categories. Ibstock does not contain any vacant units, which suggests the centre is performing
well. These centres tend to be anchored by one or two convenience stores such as a Co-op and /
or Tesco Express. The number of comparison units in local centres tends to be low. There are
6.8 8.64.7
12.5
3.8
14.89
41.4
29
23.3
25
15.4
14.830.6
17.3
17.1 34.921.9
26.9
33.3 14.7
19.9
18.6
30.2 34.4
23.1
22.2
24.1
10.5
10.5
2.36.3
23.1
11.1
10.2
4.2
16.2
4.7 7.73.8
11.3
0%
10%
20%
30%
40%
50%
60%
70%
80%
90%
100%
Ashby de laZouch
Coalvilletown centre
CastleDonington
Ibstock Kegworth Measham UK
Vacant
FinancialService
LeisureService
Retail Service
Comparison
Convenience

Retail and Leisure Capacity Study : Final Report
Pg 33
reasonably high numbers of retail services and leisure services which is typical for smaller
centres.
Convenience goods shopping
4.67 Most households undertake two types of food and grocery shopping trips i.e. a weekly shop (or
less frequent main or bulk shopping trip) and more regular top-up shopping trips. The
availability of a wide range of products and free car parking are important requirements for bulk
food shopping trips and large supermarkets or superstores are the usual destinations.
Accessibility and convenience tend to be more important for top up shopping trips.
4.68 Ashby de la Zouch is in Zone 3 (Ashby de la Zouch). Convenience shopping provision in
Ashby de la Zouch town centre is below the Goad national average in terms of the proportion of
shops units, but Ashby de la Zouch has a reasonable choice of large out of centre food stores.
Within the town centre, the key offer includes a Co-op supermarket (1,840 sq. m) and a Co-op
convenience store (330 sq. m). This food store provision is supplemented by independent
sandwich bars, newsagents and bakeries. Outside of the town centre there are several large
convenience stores, including a Tesco Extra (9,884 sq. m gross), an Aldi (1,217 sq. m gross) and
a Marks & Spencer food hall (1,116 sq. m gross), all of which are located to the north east of the
town centre. In terms of convenience goods expenditure retention, Ashby de la Zouch retains
78% within Zone 3. Most of the expenditure leakage is attracted to food stores in Swadlincote.
4.69 Coalville is in Zone 6 (Coalville). Convenience shopping provision in Coalville town centre is
just above the Goad national average in terms of the proportion of shop units. As with Ashby de
la Zouch, Coalville has a reasonable choice of large out of centre food stores. Within the town
centre, the key offer includes an Asda supermarket (1,150 sq. m), a Co-op convenience store (73
sq. m), which is supplemented by a Home Bargains store (1,406 sq. m). Outside of the town
centre there are several large convenience stores including a Morrisons supermarket (5,883 sq.
m) located at Whitwick Retail Park to the north of the town centre and an Aldi and Lidl food
stores located opposite each other on Thornborough Road, also to the north of the town centre.
In terms of convenience goods expenditure retention, Coalville retains 97% within Zone 6. There
is limited expenditure leakage from Zone 6. Based on the choice of food stores, mix of uses and
high expenditure retention, Zone 6 (Coalville) is well served in terms of convenience goods
shopping provision.
4.70 Castle Donington and Kegworth are in Zone 1 (Castle Donington & Kegworth).
Convenience provision in Castle Donington is limited to a Co-op convenience store (101 sq. m)
within the town centre and an out-of-centre Co-op supermarket (1,596 sq. m) to the north of the
town centre. Convenience provision in Kegworth is limited to a Co-op convenience store (450
sq. m). Only 44% of convenience goods expenditure within Zone 1 is retained in North West
Leicestershire District, due to limited food store provision and its location towards the periphery
of the District. Expenditure leakage predominantly goes to Loughborough (24%) and Long
Eaton (23%).
4.71 Zone 2 (North of Coalville) does not contain any main centres, but North West
Leicestershire District retains a high level of convenience expenditure from Zone 2 (88%), with
residents predominantly choosing to shop in the Tesco Extra in Ashby de la Zouch (28%), the
Morrisons supermarket in Coalville (15%) and the Aldi food store in Coalville (12%).
4.72 Measham is in Zone 4 (Measham). There is a limited convenience offer in Measham,
comprising a Tesco Express (364 sq. m) and a Co-op convenience store (363 sq. m). The
convenience offer is consistent with a settlement of this size. Residents look to larger stores in
Ashby de la Zouch to meet their main bulk food shopping needs. Most of the expenditure
leakage is attracted to large food stores in Swadlincote (25%).

Retail and Leisure Capacity Study : Final Report
Pg 34
4.73 Ibstock is in Zone 5 (Ibstock) and is served by an out-of-centre Co-op food store (1,327 sq.
m). Residents of Zone 5 tend to undertake their ‘main-food’ shop in out of centre food stores in
Ashby de la Zouch and Coalville. Convenience goods expenditure retention in North West
Leicestershire District is very high in this zone at 98%.
4.74 Whitwick is in Zone 7 (Whitwick) and is served by a Co-op convenience store (474 sq. m)
within the town centre. Residents of Zone 7 undertake their main food shop within the
Morrison’s supermarket in Coalville (34%) and the Aldi food store on Thornborough Road
(22%). As with Zone 5, convenience goods expenditure retention in North West Leicestershire
District is high in Zone 7 at 96%.
4.75 In summary, food store and convenience retail provision is reasonably strong in North West
Leicestershire District. Large food stores (over 1,000 sq. m net) suitable for main and bulk food
shopping are focused in and around Ashby de la Zouch and Coalville (mainly out of centre).
These stores provide a good distribution of facilities accessible from all parts of the District. The
smaller centres provide smaller food stores suitable for basket and top up shopping. There are
no clear identified areas of qualitative deficiency in food store provision within the District.
Comparison goods shopping
4.76 Within Ashby de la Zouch and Coalville town centres, there are 140 comparison shops/stores. In
total there is comparison goods sales floorspace of almost 28,000 sq. m net (including
comparison floorspace in food stores and retail warehouse parks). Figure 4.4 and Figure 4.5
below provide a breakdown of the comparison floorspace by centre.
Figure 4.4 Comparison Goods Retail Sales Floorspace in Ashby de la Zouch (sq. m net)
Source: Experian Goad base updated by Lichfields (July 2018)
6578
3154
2513
0
2000
4000
6000
8000
Ashby de la Zouch towncentre comparison shops
Ashby de la Zouch foodstores
Ashby de la Zouch retailwarehouses

Retail and Leisure Capacity Study : Final Report
Pg 35
Figure 4.5 Comparison Goods Retail Sales Floorspace in Coalville (sq. m net)
Source: Experian Goad base updated by Lichfields (July 2018)
4.77 As indicated above, the proportion of Class A1 comparison units in Ashby de la Zouch town
centre is significantly above the national average and the proportion of Class A1 comparison
units in Coalville is comparable with the average. The provision of comparison good shopping is
more limited in the smaller centres in the District (with the exception of Ibstock and Castle
Donington), where the retail offer is predominantly small (less than 100 sq. m net) independent
specialist traders. Coalville town centre and to a lesser extent Ashby de la Zouch town centre are
the focus for larger multiple comparison retailers, reflecting their role as the main shopping
destinations in the District.
4.78 North West Leicestershire District has a good provision of retail warehouses, in relation to the
size of its centres. There are two main retail parks in the District, one of which is located near
Ashby de la Zouch (Nottingham Road Retail Park) and the other near to Coalville (Whitwick
Retail Park). National multiple retailers trading in these locations include Wickes, Pets at Home,
B&M, Poundstretcher, Peacocks, Sports Direct, Pets at Home as well as food stores including
Tesco Extra and Morrison’s which sell some comparison goods.
4.79 The household survey (July 2018) asked respondents where they shop for a range of comparison
goods. A breakdown of expenditure retention is shown in Table 4.8.
Table 4.8 Comparison Goods Expenditure Retention in North West Leicestershire District (% of respondents)
Goods category % Retention
Clothes and shoes 12.0
Domestic electric appliances (e.g. fridges and kitchen items) 24.6
Other electric goods (e.g. TV / Hi-Fi and computers) 24.0
Furniture, soft furnishings and floor-coverings 35.0
DIY, hardware and garden items 44.5
Health, beauty and chemist item 82.7
Other comparison goods (e.g. books, CDs, toys and gifts) 49.2
Source: NEMS Household Shopper Survey, July 2018
9490
2414
3805
0
2000
4000
6000
8000
10000
Coalville town centrecomparison shops
Coalville food stores Coalville retail warehouses

Retail and Leisure Capacity Study : Final Report
Pg 36
4.80 The results indicate that North West Leicestershire District has a low level of expenditure
retention for most product categories. Expenditure retention is particularly low for higher order
comparison goods such as clothing, electrical goods and furniture. Ashby de la Zouch and
Coalville town centres provide predominantly for lower order comparison goods and day to day
items, with many residents shopping in higher order centres outside of the District for many
comparison goods. Leicester and Loughborough are the major attractors of expenditure outside
of the District.
4.81 Ashby de la Zouch is in Zone 3 (Ashby de la Zouch). The household survey results confirm
Ashby de la Zouch serves customers across all 7 study area zones, albeit trade draw from
residents of Zone 1 to Ashby de la Zouch is limited to just 1.5%. In terms of comparison goods
expenditure retention, Ashby de la Zouch retains 40% in Zone 3. There is some outflow of
expenditure, primarily to Tamworth (13%) and Burton-on-Trent (9%). This level of retention is
the highest in the District and reflects Ashby de la Zouch’s joint role as one of the main shopping
destinations within the District, along with Coalville. However, this level of retention is
relatively low for a principal destination within a LPA area and is reflective of its small size,
relative to other town centres within the sub-region.
4.82 Coalville is in Zone 6 (Coalville). As with Ashby de la Zouch, the household survey results show
that Coalville serves most customers across the study area, except for Zone 1, where there is no
trade draw to Coalville. Coalville retains 33% of comparison goods expenditure within the local
Zone 6. Outflow of expenditure is primarily to Leicester (20%), Fosse Shopping Park (12%) and
Loughborough (also 12%). As with Ashby de la Zouch, Coalville has a high retention rate in the
District, but a relatively low retention rate when compared with other town centres in the sub-
region. Coalville is located just 25-minute drive from Leicester City Centre, and expenditure
leakage to retail destinations to the east of the District is likely to continue in the future.
4.83 The local centres within the District are small and retain a low level of comparison goods
expenditure. Castle Donington (in Zone 1 Castle Donington and Kegworth) retains 12% of
expenditure within the local zone. Ibstock retains 8% of expenditure within the local Zone 5.
Kegworth retains just 3% of expenditure within Zone 1 (Castle Donington and Kegworth).
Measham retains 6% of expenditure within its local Zone 4. The household survey results
confirm these centres serve local catchment areas, with very limited trade drawn from other
zones.
4.84 In summary, comparison goods retail provision in the District primarily serves lower order
shopping needs, with provision primarily concentrated in Ashby de la Zouch and Coalville.
North West Leicestershire District has a reasonably low level of expenditure retention for all
comparison product categories (chemist goods aside), reflecting Ashby de la Zouch and
Coalville’s limited role as shopping destinations in the sub-region. Ashby de la Zouch and
Coalville’s comparison goods shopping offer, including out of centre retail stores, provide a
reasonable range of comparison goods, for example B&M, Poundstretcher, Peacocks, Sports
Direct, Pets at Home, and Wickes. Residents to the east of the District also have easy access to
other key centres outside the District such as Loughborough and Leicester.
4.85 Due to the strength and proximity of larger competing centres, there is limited potential to
increase the District’s market share of comparison goods expenditure, but investment will still
be needed in the District to retain the existing levels of comparison goods expenditure retention.
The objective of the development strategy for North West Leicestershire District should be to
maintain the District’s shopping role and market share within the sub-region, in the face of
increasing competition. The economic projections in this section assume that new development
will retain the District’s share of comparison expenditure in the study area and will help to
maintain this share in the future.

Retail and Leisure Capacity Study : Final Report
Pg 37
5.0 The need for food / beverage uses
Introduction
5.1 Service uses perform an important role in the overall offer of a centre, and encourage customers
to shop locally. The service uses are categorised as follows:
• Class A1 services cover a range of uses, including hairdressers, dry cleaners, travel agents,
some sandwich shops (those not categorised as Class A3), funeral parlours and post offices.
• Class A2 services include banks, building societies, financial services, betting offices (now
sui generis), pawnbrokers, estate agents and employment agencies.
• Class A3/A5 including restaurants, cafes (A3) and takeaways (A5).
• Class A4 pubs/bars (Class A4).
5.2 Food and beverages is a fast moving and creative sector, with a steady flow of new concepts
emerging. Within this sector there has been a significant increase in the number of national
multiple chains which have sought to increase their geographical coverage. Recently some
chains have experienced difficulties resulting in closures, including operators which may have
over-stretched.
5.3 These types of food and drink operators (Class A3 and A4) i.e. restaurants, bars and pubs have
supported other major leisure uses, in particular cinema developments. Within town centres,
the demand has increased, including a significant expansion in the number of coffee shops, such
as Starbucks, Costa Coffee and Café Nero. National branded pub/restaurant chains have
invested heavily and not exclusively in larger centres. Themed restaurants have also expanded
rapidly.
5.4 The key categories for food and beverage offers are:
• Impulse: characterised by their produce range that is typically highly visual and hand-held
so that it can be eaten “on the go”;
• Speed eating fast food: food that can be purchased and consumed quickly, therefore
price is low and ambience is less important. This sector is dominated by traditional high
volume fast food offers such as burgers and fried chicken;
• Refuel and relax: a drink, snack and a short break in a pleasant environment rather than
focusing on eating a main meal; and
• Casual dining/leisure dining: incorporating several food styles, types and ethnic
origins. The ambience and environment of casual dining is as important as the food, drink
and service provided. The style is informal but is normally table service.
Mix of uses
5.5 Food and beverage establishments (Class A3, A4 and A5) including restaurants, bars, pubs and
takeaways have supported other major leisure uses on leisure and retail parks and are important
services within town centres. National information available from Experian Goad indicates that
the proportion of non-retail uses within town centres across the country has increased
significantly. The current mix of Class A1-A5 uses in the two main centres and local centres
combined in the District is summarised in Table 5.1 below.

Retail and Leisure Capacity Study : Final Report
Pg 38
Table 5.1 Mix of Class A / Food and Beverage Uses in the Main Centres in North West Leicestershire District
Centre Use Class % of Total Class A Units
Class A1 Class A2 Class A3 Class A4 Class A5 Vacant
Ashby de la Zouch 69.2 11.3 7.2 4.6 4.6 3.1
Coalville 58.8 13.6 4.8 3.9 4.8 14.0
Local centres 61.0 9.8 13.8 3.3 8.1 4.1
National Average 56.9 11.8 9.5 4.6 6.0 11.2
Source: Experian Goad base data updated by Lichfields
5.6 Ashby de la Zouch town centre has retained a high level of Class A1 retail use when compared
with the national average. The provision of Class A1 uses in Coalville is slightly above the
national average. The vacancy rate is very low within Ashby de la Zouch, whereas Coalville has
an above average proportion of vacant units. The provision of Class A3 uses and Class A5 uses is
below the national average in both Ashby de la Zouch and Coalville town centres. The provision
of Class A4 uses is broadly comparable with the national average in both town centres. Given the
competing pressures for non-retail uses and the low vacancy rates in Ashby de la Zouch a
balance between Class A1 and Class A3 to A5 uses needs to be maintained to ensure the centre
maintains its current roles. In Coalville a more flexible approach may be necessary in areas
where there is a high concentration of vacant uses.
5.7 Ashby de la Zouch town centre has three restaurants on Market Street all of which are occupied
by independent operators. There are seven pubs and bars along Market Street and six cafés on
Market Street. Coalville town centre has three restaurants on High Street, six pubs and bars and
four cafés spread throughout the centre.
5.8 The local centres combined have an above average proportion of Class A1 uses, Class A3 uses
and Class A5 uses. However, the proportion of Class A2 uses and Class A4 uses is below the
national average. The proportion of vacant units in the local centres combined is significantly
below the national average.
Food and beverage expenditure
5.9 Experian’s food and beverage expenditure per capita projections are shown in Table 2,
Appendix 4. The total food and beverage expenditure in the study area is £98.11 million in
2018, as shown in Table 3, Appendix 4.
5.10 Food and beverage expenditure per capita is expected to increase in real terms (excluding
inflation) by 39% between 2018 and 2036. Accounting for population growth, total food and
drink expenditure within the study is expected to increase from £98.11 million in 2018 to
£135.99 million by 2036, an increase of nearly 39% (Table 3, Appendix 4).
Food and beverage expenditure patterns
5.11 A summary of food and beverage expenditure patterns is shown in Figure 5.1 (restaurant/cafés)
and Figure 5.2 (pubs/bars). The results indicate that the retention of food and beverage trips
within Ashby de la Zouch town centre is higher than for comparison goods shopping,
particularly in Zone 3 (Ashby de la Zouch). The opposite is true for Coalville with the retention
of food and beverage trips generally lower than for comparison goods shopping. Ashby de la
Zouch and Coalville are the main food and beverage destinations in the District and residents
also access larger destinations such as Loughborough and Leicester to meet their food and
beverage needs.

Retail and Leisure Capacity Study : Final Report
Pg 39
5.12 Existing food and beverage expenditure patterns have been modelled based on the household
survey results within the study area zones. Base year (2018) penetration rates are shown in
Table 4, Appendix 4 and expenditure patterns are shown in Table 5, Appendix 4. The
estimated expenditure currently attracted to facilities within North West Leicestershire District
is £64.83 million in 2018.
Figure 5.1 Restaurant / Cafe Destinations (destination named by respondents)
Source: NEMS Household Survey, July 2018
Figure 5.2 Pub / Beverage Destinations (destination named by respondents)
Source: NEMS Household Survey, July 2018
Future capacity for food and beverage floorspace
5.13 The household survey suggests that the District's retention of food and beverage expenditure is
lower than for convenience goods but higher than the retention of comparison goods
expenditure. The levels of food and beverage expenditure retention are high in Zone 3 (Ashby de
la Zouch) at around 74% and in Zone 5 (Ibstock) at around 75%. The food and beverage
26%
18%17%
8%7%
0%
10%
20%
30%
Ashby de laZouch
Other Coalville Loughborough Leicester
24%
19%
10%8%
6% 6%
0%
10%
20%
30%

Retail and Leisure Capacity Study : Final Report
Pg 40
expenditure retention is at a similar level in the remaining zones at around 50% in Zone 1
(Castle Donington & Kegworth), 57% in Zone 2 (North of Coalville), 59% in Zone 4 (Measham),
57% in Zone 6 (Coalville) and 59% in Zone 7 (Whitwick). Across the zones, leakage tends to be
highest to Loughborough followed by Leicester. In Zone 7 (Whitwick), leakage to Loughborough
is 18% and in Zone 6, leakage to Leicester is 16%. Overall, North West Leicestershire District has
reasonably high levels of expenditure retention, although some development will be necessary in
Ashby de la Zouch and Coalville to maintain the existing market share in the future. Town
centre strategies could focus on maintaining the market share for the District.
5.14 Available food and beverage expenditure has been projected forward to 2021, 2026, 2031 and
2036 in Tables 6 to 9, Appendix 4, and summarised in Table 11. Available food and beverage
expenditure to facilities within the District is expected to increase from £64.83 million in 2018
to £89.86 million by 2036.
5.15 For the purposes of this assessment, the existing food and beverage floorspace is estimated to be
trading at equilibrium in 2018 (i.e. satisfactory levels). Table 12, Appendix 4 then assumes
that the turnover of food and beverage facilities will increase in real terms in the future. Growth
in turnover efficiency is a function of spending growing at faster rates than new floorspace
provision, as well as operators’ ability to absorb real increases in their costs by increasing their
turnover to floorspace ratio. Allowing for this growth to be absorbed by existing food and
beverage uses represents a cautious approach to forecasting future needs, helping existing
centres maintain their vitality and viability and compete with new provision.
5.16 Unlike convenience and comparison retailing, Experian does not provide any advice on growth
in turnover efficiency for food and beverage floorspace. However, it is important that existing
facilities can increase their turnover over time. Considering the forecast expenditure per capita
growth rates in the leisure sector, and the need to ensure that new spending is also available to
support new facilities, a rate of 1% per annum is adopted for turnover efficiency of existing
floorspace.
5.17 By 2021, within North West Leicestershire District, there will be a food and beverage
expenditure surplus of £1.72 million, which grows to £5.04 million by 2026, £8.62 million by
2031 and £12.31 million by 2036. These expenditure projections have been converted into
floorspace projections in Table 12, Appendix 4, adopting an average sales density of £5,000
per sq. m gross, which is again projected to grow by 1% in the future due to improved turnover
efficiency.
5.18 Surplus expenditure at 2021 could support 333 sq. m gross of additional food and beverage
floorspace and 931 sq. m gross by 2026. In the longer term, surplus expenditure at 2031 could
support 1,515 sq. m gross, increasing to 2,059 sq. m gross by 2036. The results are summarised
in Table 5.2 below.

Retail and Leisure Capacity Study : Final Report
Pg 41
Table 5.2 Summary of Food and Beverage Floorspace Projections (sq.m gross)
Centre Additional Floorspace (sq.m gross)
By 2021 By 2026 By 2031 By 2036
Ashby de la Zouch 143 400 651 884
Coalville 84 236 384 521
Castle Donington 21 60 97 132
Ibstock 12 35 57 77
Kegworth 8 23 37 50
Measham 11 32 52 70
Other 52 147 238 324
Total 331 933 1,516 2,058
Source: Table 12, Appendix 4
Qualitative need
5.19 Ashby de la Zouch town centre’s Venuescore food / service index (2016/17) is 148 compared
with the national average of 100. In 2015/16, the food / service index was 147. These figures
suggest food service in Ashby de la Zouch has remained stable and is above average for a centre
of its size.
5.20 Coalville town centre’s Venuescore food / service index was 79 in 2016/17, 103 in 2015/16 and
69 in 2013/14. These figures suggest food service provision in Coalville has decreased recently,
and remains below the average for a centre of its size.
5.21 The other main centres (i.e. Castle Donington, Ibstock, Kegworth and Measham) do not feature
on Venuescore, which reflects the predominance of independent food and beverage uses rather
than multiple/chains.
5.22 The proportional mix of Class A3-A5 uses within the main centres indicates:
1 Ashby de la Zouch has a slightly lower provision of Class A3 and A5 uses when compared
with the national average. The proportion of Class A4 uses is equal to the national average.
Most food and beverage outlets are operated by independent operators, with most being
located along Market Street and its connected courtyards. There are also a few multiple /
chain food and beverage outlets, with Costa located on Market Street and Ask located on
Derby Road.
2 Coalville has a very low provision of Class A3 uses and Class A5 uses when compared with
the national average. The proportion of Class A4 uses is slightly below the national average.
As with Ashby de la Zouch, most of the food and beverage outlets are operated by
independent operators. These uses are dispersed throughout the centre, but there is a
concentration of food and beverage uses at Marlborough Square, including a Dominos and
along High Street.
5.23 There are 64 food and beverage outlets within the two main centres. In addition, there are many
country/village pubs throughout the District and in the smaller centres. The town centre health
check/audits in Section 7 provide a more accurate analysis of food and beverage provision
within the main centres. The number of food and beverage outlets within each centre is shown
in Figure 5.3 below.

Retail and Leisure Capacity Study : Final Report
Pg 42
Figure 5.3 Class A3 to A5 Food and Beverage Outlets in Ashby de la Zouch and Coalville
Source: Experian Goad base data updated by Lichfields (July 2018)
Conclusions
5.24 The projections indicate future growth and capacity for additional food and beverage floorspace
in North West Leicestershire District, primarily located in Ashby de la Zouch and Coalville town
centres (up to 884 sq. m gross and 521 sq. m gross respectively by 2036). The potential is more
limited in the smaller centres in the District (50 to 130 sq. m gross by 2036).
14
12 12
9
6
1010
13
9
0
5
10
15
20
Ashby de la Zouch Coalville Local Centres
Class A3 - Restaurants / Cafes Class A4 - Pubs / Bars Class A5 - Takeaways

Retail and Leisure Capacity Study : Final Report
Pg 43
6.0 The need for other town centre uses
Introduction
6.1 This section assesses the potential for commercial leisure and town centre uses in North West
Leicestershire District, including theatres, cinemas, ten pin bowling, bingo, health and fitness,
trampoline centres, art galleries, museums and ice rinks.
6.2 Household survey respondents were asked about their family’s leisure activities. The
participation rates within the study area are shown in Figure 6.1 below and an assessment of
these sectors is set out in this section.
Figure 6.1 Leisure Participation (% of Respondents)
Source: NEMS Household Survey, July 2018
6.3 Within North West Leicestershire District, the household survey identifies that visiting
restaurants / cafes is the most popular leisure activity (70%), followed by visiting pubs / bars
(52%), cinema (50%), health & fitness clubs (28%) and the theatre (26%). Participation rates in
other leisure activities are all at 20% or below. Attendance at ice rinks and bingo halls is just 5%
respectively. Based on Lichfields’ recent experience from similar studies this pattern of
participation is broadly comparable with other parts of the country.
Commercial leisure uses
6.4 Residents in North West Leicestershire District have limited access to many types of commercial
leisure and entertainment facilities within the District itself. Residents need to travel outside of
the District to go to the cinema, theatre, ten pin bowling and many other leisure, entertainment
and cultural uses. Most popular destinations outside of the District include Loughborough,
Leicester and Derby. However, residents do have access to several health and fitness clubs and a
bingo hall and one trampoline centre.
70%
52% 50%
28% 26%20%
16%13% 13%
9% 7% 5% 5%
0%
20%
40%
60%
80%

Retail and Leisure Capacity Study : Final Report
Pg 44
6.5 Based on Lichfields’ experience and household surveys from across the country, commercial
leisure facilities usually draw the main part of their trade from residents up to a 20 minutes
travel time. Major leisure facilities such as multiplex cinemas, ten-pin bowling centres and
family entertainment centres require a large catchment population, and often benefit from
clustering together within leisure parks.
Cinemas
6.6 Cinema admissions in the UK declined steadily during the 1950s, 1960s and 1970s, a period
when the ownership of televisions increased significantly. Cinema admissions continued to
decline in the early 1980s, but increased steadily after 1984 up to 2002. There was a peak in
cinema admissions in 2002 at 175.9 million. Total admissions in 2017 were 170.6 million
(Source: British Film Institute). Cinema trips have plateaued since 2002, despite population
growth of 9.6% during this period (59.4 million to 65.1 million). The BFI indicates the 2017
national average was 2.6 trips per person per annum. The regional average for the Midland
Region was lower at 2.3 trips per person per annum.
6.7 The Cinema Advertising Association identities 771 cinema facilities with 4,115 screens.
Lichfields’ national CINeSCOPE model identifies approximately 800,000 cinema seats in the
UK. The CINeSCOPE model assesses the provision of cinema screens/seats against projected
customer cinema trips across the country, to identify areas of under and over-provision. The
national average is about 40,000 cinema trips per screen per annum or 210 trips per seat per
annum.
6.8 There are no cinemas within North West Leicestershire District. Assessible from the study area
and beyond, there are the following cinemas:
1 Odeon, Cattle Market, Loughborough (6 screens and approximately 1,200 seats);
2 Cineworld, Baxter Gate, Loughborough (8 screens and approximately 1,600 seats);
3 Showcase, Highcross Lane, Leicester (12 screens and 3,000 seats);
4 Phoenix, Midland Street, Leicester (3 screens and 370 seats);
5 Odeon, Aylestone Road, Leicester (12 screens and 2,068 seats);
6 Piccadilly, Green Lane Road, Leicester (3 screens and 640 seats);
7 Vue, Meridian Leisure Park, Leicester (9 screens and 2,391 seats);
8 Showcase, Intu, Derby (12 screens and 2,200 seats);
9 Odeon, Mansfield Road, Derby (10 screens and 1,866 seats);
10 Showcase, Foresters Park, Derby (14 screens and 2,557 seats);
11 Odeon, Bolebridge Street, Tamworth (10 screens and 2,450 seats).
6.9 The survey results indicate that 50% of households within the study area visit the cinema. The
main destinations visited by participating households are set out in Figure 6.2 below.

Retail and Leisure Capacity Study : Final Report
Pg 45
Figure 6.2 Cinema Destinations (cinema destination named by respondents)
Source: NEMS Household Survey, July 2018
6.10 The study area population in 2018 (just under 100,000 people) will generate 230,000 cinema
trips per annum, based on the regional average visitation rate (2.3 trips per annum). Assuming
North West Leicestershire District could retain up to half of the cinema trips generated within
the study area this amount to 115,000 retained trips. Based on the national average of 210 trips
per seat, 115,000 trips per annum would support 548 cinema seats.
6.11 By 2036 the study area population (113,000 people) could generate 260,000 cinema trips, if
which 130,000 trips (50% of the total in the study area) could be retained within North West
Leicestershire District then these cinema trips could support 619 seats.
6.12 These projections suggest that there is theoretical capacity for a small/medium sized cinema (3-
5 screens) in North West Leicestershire District over the plan period. Curzon and Everyman are
art house cinema operators who have expanded in recent years. The latter has cinemas in Bath,
Exeter and Southampton. Curzon has cinemas in Canterbury, Ripon and Sheffield with a new
facility proposed in Colchester. The Ashby de la Zouch and Coalville areas could theoretically
support this type of operator, but the proximity of existing provision in Leicester, Loughborough
and Derby is likely to restrict operator demand.
Theatres
6.13 Within the study area 26% of respondents to the household survey indicated that they visit the
theatre. Table 6.1 summarises where respondents stated that they had last visited the theatre.
The results demonstrate that Leicester is the main theatre destination for residents of the study
area, attracting 37% of the theatre trips.
38%
32%
20%
7%
0%
10%
20%
30%
40%
50%
Other Loughborough Leicester Derby

Retail and Leisure Capacity Study : Final Report
Pg 46
Table 6.1 Main Theatre Trip Destinations
Destination of Last Trip % of Participating Households
Ashby de la Zouch 2.1
Coalville 1.9
Leicester 37.1
Nottingham 14.9
London 14.6
Loughborough 11.5
Birmingham 8.8
Other 9.3
Source: NEMS Household Survey, July 2018
6.14 Data from the British Theatre Consortium, British Theatre Repertoire (2014) indicated British
theatres presented 59,386 performances attracting over 33 million theatre visits, around
121,000 visits per venue (274 venues with SOLT / UK Theatres membership).
6.15 Assuming an average of 0.5 trips to the theatre per person per annum, as implied by the British
Theatre Consortium data, the study area population in 2018 (100,000 people) generates 50,000
theatre trips per annum. Most trips to the theatre will continue to be attracted to productions
within larger towns and cities outside of the study area. The catchment areas of Ashby de la
Zouch and Coalville are unlikely to support a full-time theatre facility.
6.16 There is no clear need for additional theatre provision in North West Leicestershire District over
the plan period.
Health and fitness clubs
6.17 The 2017 State of the UK Fitness Industry Report reveals that the UK health and fitness industry
is continuing to grow. There are now over 9.7 million fitness members in the UK, and the
penetration is now 14.9%. The sector has more clubs, more members and a greater market value
than ever before. The 2017 report highlighted that the industry experienced growth over the
twelve-month period to the end of March 2017, with an increase of 5.1% in the number of
memberships and 4.6% growth in the number of facilities.
6.18 The household survey indicates that 28% of respondents or their families visit health/fitness
clubs. The household survey undertaken for the CISFR suggests are higher participation rate
with 45% of household visiting a fitness gym at least once a month or more often. Of the
participating households, the main destinations mentioned are summarised in Figure 6.3.
6.19 The Sport England/Active Places data indicates that there are 15 registered health and fitness
suites in the District, with 363 fitness stations. Two of these facilities are for private use only.
These private use facilities provide 57 fitness stations in total. The remaining 13 registered
facilities open to the general public (including registered members) have 306 fitness stations in
total as shown in Table 6.2.

Retail and Leisure Capacity Study : Final Report
Pg 47
Figure 6.3 Health and Fitness Destinations (health and fitness destination named by respondents)
Source: NEMS Household Survey, July 2018
Table 6.2 Health and Fitness Clubs (Sport England/Active Places Data, 2018)
Name Type No. Fitness Stations
Hood Park Leisure Centre, Ashby de la Zouch Registered Membership Use 38
Fitness Republic, Ashby de la Zouch Registered Membership Use 27
Champneys Springs, Ashby de la Zouch Registered Membership Use 24
Ashby School, Ashby de la Zouch Sports Club / Community Assoc. 17
Hermitage Leisure Centre, Coalville Registered Membership Use 42
King Edward VII Science Sports College, Coalville Private Use 32
Stephenson College, Coalville Private Use 25
Livingwell Health Club, Castle Donington Registered Membership Use 20
Ibstock Leisure Complex, Ibstock Pay and Play 18
Breedon Prior Health Club, Derby Registered Membership Use 35
Kegworth Hotel Leisure Club, Derby Registered Membership Use 25
Reeds Health Club & Spa, Derby Registered Membership Use 21
Halsa Health Club, Derby Registered Membership Use 14
Castle Donington College, Derby Pay and Play 13
Juvenate Leisure Club, East Midlands Airport Registered Membership Use 12
Total 363
Source: Sport England Active Places
6.20 North West Leicestershire District’s population in 2018 (100,000 people) is projected to grow to
102,000 by 2021, 106,000 by 2026, 110,000 by 2031 and to 113,000 by 2036. The current
population (100,000) indicates that North West Leicestershire District has 3.6 fitness stations
per 1,000 people (363 stations in total).
6.21 The East Midlands region has 579 registered health and fitness suites with 31,161 fitness stations
(average of 54 stations per suite). This existing provision equates to around 6.5 fitness stations
per 1,000 people. North West Leicestershire District has a lower provision of fitness stations
(3.6 per 1,000 people) than the regional average (6.5 stations), which suggests health and fitness
clubs could be trading above average.
29%
15% 15%
12%
6% 6%
0%
10%
20%
30%
40%

Retail and Leisure Capacity Study : Final Report
Pg 48
6.22 The District population is projected to increase by 6,000 people by 2026 and by 13,000 people
by 2036. Based on 3.6 fitness stations per 1,000 people, this population growth could support
22 new fitness stations by 2026, increasing to 47 stations by 2036.
6.23 These figures suggest there is scope for an additional health and fitness facility in the District
over the plan period. Those aged over 65 may be less likely to use health and fitness facilities
and with an aging population the demand for these facilities could potentially decrease in North
West Leicestershire. However, with membership increasing year on year, this trend should
counter-balance the effects of the aging population.
Ten pin bowling
6.24 The household survey results suggest that 13% of households in the study area visit ten pin
bowling facilities. The main destinations are set out in Figure 6.4.
6.25 There are no major ten pin bowling facilities within North West Leicestershire District, although
there may be some small-scale facilities attached to other leisure destinations.
Figure 6.4 Ten pin bowling Destinations (Ten pin bowling destination named by respondents)
Source: NEMS Household Survey, July 2018
6.26 The study area population in 2018 (100,000 people) can in theory support around 8 ten pin
bowling lanes, based on the national average of one lane per 12,000 people. By 2036, the study
area population (113,000 people) could support 9 lanes. This theoretical capacity for ten pin
lanes is probably not sufficient to support a viable ten pin bowling facility.
Bingo, games of chance and gambling
6.27 The household survey results suggest that only 5% of households in the study area visit bingo
facilities, which matches the national average participation rate (around 5%). The main
destinations are set out in Figure 6.5. The only destination within the study area is Flutters on
Jackson Street within Coalville town centre.
6.28 Gala and Mecca are the main bingo operators, controlling over half of the UK market. Marketing
of the bingo sector has been more proactive in recent years and Gala and Mecca have invested in
63%
19%
9%6%
3%
0%
20%
40%
60%
80%
Leicester Other Derby Coalville Nottingham

Retail and Leisure Capacity Study : Final Report
Pg 49
premises, moving out of dated premises (i.e. converted cinemas) into purpose built units. Bingo
clubs have become increasingly sophisticated, and have actively sought to attract all age groups.
The bingo sector usually prefers central locations that are accessible by public transport and by
foot. Major bingo operators require a catchment population of 50,000 - 70,000 (source:
Business in Sport and Leisure BISL). There are no main bingo operators within North West
Leicestershire District.
6.29 The adult (over 18) population in the study area in 2018 (around 80,000 people3) would
generate about 112,000 bingo admissions, based on the national participation rate (1.4 trips per
adult). On this basis, there is theoretical capacity for one bingo facility in the District, in line
with current provision. The dispersed population in the rest of the District may be unviable for
other bingo operators.
Figure 6.5 Bingo Destinations (bingo destination named by respondents)
Source: NEMS Household Survey, July 2018
Trampoline centres
6.30 Indoor trampoline centres are a relatively new leisure activity in the UK. In America outdoor
trampoline centres were popular in the late 1950s and 1960s. This format first seen in America
has been adopted and modernised and is now becoming a popular indoor leisure activity for a
variety of age groups in the UK. The UK’s first indoor trampoline centre was opened by Bounce
on 31 May 2014. The household survey results suggest that 16% of households in the study area
visit trampoline centres.
6.31 Trampoline centres offer a new, recreational experience for both children and adults. They
typically have over 100 interconnected trampolines on site, consisting of differing courts
including a Main Arena, Dodgeball Court, Kids Court, Slam Dunk Area, Foam Pit, Airbag Jump,
Touch Walls, Gladiator Pits and Tumble Tracks, as well as an arcade and party rooms.
6.32 The main destinations in the study area are set out in Figure 6.6. In North West Leicestershire,
there is one trampoline centre – Rebound Trampoline Park to the north of Ashby de la Zouch
3 Based on the proportion of adult population (18+) being 82% - Source: Census 2011 (average of the 18+ population for each zone)
49%
17%13%
10%
4%
0%
20%
40%
60%
Coalville Other Loughborough Leicester Derby

Retail and Leisure Capacity Study : Final Report
Pg 50
town centre along Smisby Road. North West Leicestershire District is well served by existing
provision, as suggested by the high retention rates, but this may not preclude further uses
coming forward over the plan period. There is increasing demand for these uses nationally.
Figure 6.6 Trampoline Centre Destinations (trampoline centre destination named by respondents)
Source: NEMS Household Survey, July 2018
Other leisure, entertainment and cultural uses
6.33 The leisure, entertainment and cultural sectors are fragmented and innovative. In addition to
the main leisure and entertainment uses outlined above, there are a larger number of other
activities that could be promoted e.g. nightclubs, museums, art galleries, exhibition space,
casinos, ice rinks, tourist attractions and new emerging leisure activities such as family
entertainment centres, escape rooms and virtual golf centres. The representation of these uses is
currently limited in North West Leicestershire. Given the fragmented nature of these sectors it is
difficult to quantify the potential demand for these uses over the plan period.
6.34 The household survey results suggest that total participation rates in the study area is around
5% for ice skating, 9% for art galleries and 20% for museums. The study area population is not
significant (around 100,000 people projected to increase to 113,000 people by 2036), and does
not provide a critical mass to attract a broad range of leisure, entertainment and cultural uses,
which tend to be more prevalent in larger towns and cities.
6.35 North West Leicestershire benefits from many tourist visitors, including Donington Park and
the National Forest. This could generate demand for additional hotel and conference facilities.
Hotel facilities within Ashby de la Zouch and Coalville are limited. There is a lack of high quality
hotels with conference facilities.
6.36 The nightclub / live music sector has struggled in recent years. IBIS World suggests they have
lost their competitive advantage over pubs or bars, with lower prices and a more relaxed
atmosphere. Approximately one-quarter of nightclubs have closed in the past decade as
operators have struggled to respond to new challenges from regulation, licensing, planning,
90%
4% 2% 2%
0%
20%
40%
60%
80%
100%
Ashby de la Zouch Other Loughborough Leicester

Retail and Leisure Capacity Study : Final Report
Pg 51
business rates and policing. Despite these national trends there is qualitative scope to provide
additional nightclub facilities in Ashby de la Zouch and Coalville.
6.37 The development strategy needs to be flexible and be able to respond to emerging opportunities
for new facilities of this kind, particularly in the higher order centres of Ashby de la Zouch and
Coalville.
Conclusions
6.38 A summary of the key findings in this Section is set out below:
• There is theoretical capacity for a small/medium cinema (3-4 screens) in North West
Leicestershire District over the plan period.
• There is scope an additional health and fitness facility in the District over the plan period.
• There is no identified need for ten pin bowling facility in the District.
• There is no identified need for a bingo facility in the District.
• Other uses such as hotels, conference facilities, nightclubs, museums, art galleries,
exhibition space, casinos, tourist attractions and new emerging leisure activities could be
appropriate over the plan period. The development strategy needs to be flexible to respond
to emerging opportunities for new facilities of this kind, particularly in Ashby de la Zouch
and Coalville town centres. However, the Council needs to be realistic in the facilities town
centres of this size can attract. Such facilities tend to gravitate to larger towns and cities,
such as Leicester and Loughborough.
6.39 The Local Plan should consider identifying development opportunities for other uses such as
offices and residential uses over the plan period.

Retail and Leisure Capacity Study : Final Report
Pg 52
7.0 Centre health check assessments
7.1 This section provides a health check analysis of the designated centres within the District, based
on the key measures of vitality and viability.
7.2 For Coalville and Ashby de la Zouch town centres, the audit of facilities is based on an Experian
Goad plan for each centre, updated by Lichfields in July 2018. The Goad definition of these
town centres broadly reflects the defined town centre boundaries. It is preferable to utilise the
Experian Goad plans as they contain a lot of background data useful for the analysis of town
centre health. Experian Goad plans are not available for the local centres. The audit of facilities
of the local centres is based on the defined town centre boundaries.
Coalville town centre
7.3 Lichfields undertook health check assessments of Coalville and Ashby de la Zouch town centres
on 30 July 2018.
7.4 Coalville is classified as a town centre in the Local Plan (Policy Ec8). It is the largest centre
within North West Leicestershire District, supporting a range of retail, service and community
facilities. The centre serves shoppers from across the District, particularly for comparison
shopping (except residents of Zone 1 (Castle Donington & Kegworth))4. Its key roles include:
• Convenience shopping – there is one medium-sized supermarket occupied by Asda store on
Ashby Road (1,840 sq. m gross) to the north west of the town centre. A Co-op supermarket
is also located on Bridge Road to the south east of the town centre, which is outside the
Goad town centre area. These facilities are supported by small convenience outlets and serve
both main food and grocery shopping trips and basket / top-up food shopping trips. A
market is located on High Street to the east of the town centre, which sells both convenience
and comparison goods.
• Comparison shopping – a reasonable selection of national multiples including Argos, Bon
Marche, Burton, Clarks, Dorothy Perkins, Home Bargains, New Look, Shoe Zone, WH
Smith and Wilko. There is also a good range of independent shops selling a range of lower
order comparison goods.
• Services – including a good range of high street national banks and 10 restaurants / cafés
and 28 hairdressers / beauty parlours.
• Entertainment – five pubs, a bingo hall and a nightclub.
4 Based on the evidence of the results of the household survey (July 2018)

Retail and Leisure Capacity Study : Final Report
Pg 53
• Community facilities – including a library, two social clubs, a dance and theatre academy
and a dentist.
7.5 The Belvoir Shopping Centre is the central focus of the retail offer. A few smaller units are
located along Ashby Road, High Street, Hotel Street and Belvoir Road. Food / beverage and
leisure uses are predominantly located around Marlborough Square.
7.6 Whitwick Retail Park is in an out-of-centre location, but provides additional convenience
provision in the form of a Morrisons supermarket. Complementary comparison provision is
also provided by B&M, Poundstretcher, Peacocks, Sports Direct and Pets at Home, which are
also located at the retail park.
7.7 The household shopper survey (Appendix 5) provides an indication of the role of the town
centre. For the study area, Coalville town centre was the location that 18% of respondents stated
was the destination for most of their comparison shopping. Of those who undertake their main
food shopping in Coalville, the most popular destinations are the Morrisons supermarket on
Whitwick Road, followed by the Aldi supermarket on Thornborough Road.
Diversity of uses
7.8 Coalville town centre has a total of 210 retail / service units. The diversity of uses present in
Coalville town centre in terms of the number and proportion of units is set out in Table 7.1,
compared against the Goad national average.
Table 7.1 Coalville - Mix of Uses
Type of Unit Number of Units Percentage of Units (%) National Average (%)
Convenience 18 8.6 9.0
Comparison 61 29.0 30.6
Retail Services 36 17.1 14.7
Leisure Services 40 19.0 24.1
Financial & Business Services 22 10.5 10.2
Vacant 33 15.7 11.3
Total 210 100.0 100.0
Source: Experian Goad base data updated by Lichfields (July 2018)
7.9 The mix of uses is broadly comparable with the national average, but the most noticeable
exceptions are the relatively low proportion of leisure services (e.g. Class A3 to A5 and D2
leisure), and the relatively high vacancy rate (see below).
7.10 The proportion of convenience units is comparable with the national average. The centre has a
reasonable provision of comparison retail when compared with the national average. The
proportion of retail services (e.g. non-retail Class A1 services) is marginally higher than the
national average, but leisure services are under-represented. Financial & business services is
comparable to the national average. The proportion of vacant units is nearly 5 percentage points
above the national average.
7.11 Between 2013 and 2018, the composition of uses has not changed significantly. The main
change is the decrease (-12 units) of comparison retail units. Conversely the number of
convenience retail units has increased by two. There has been an increase of three vacant unit
since 2013.

Retail and Leisure Capacity Study : Final Report
Pg 54
Proportion of vacant street level property
7.12 Of the 33 vacant units, 13 are located within the Belvoir Shopping Centre, 7 are on Belvoir Road,
3 are on High Street and 3 are on Hotel Street. There is a concentration of vacant units towards
the east end of the Belvoir Shopping Centre to the west of Wilko.
7.13 Goad Plan data indicates vacant floorspace totals 4,740 sq.m gross. Number 18-20 Jackson
Street (Former Rex Cinema) occupies 1,100 sq. m gross (or 23% of all vacant floorspace). There
are seven vacant units with a floorspace of 200-250 sq. m gross, with the remaining vacant units
having a relatively small floorspace of below 200 sq. m gross.
7.14 The Belvoir Shopping Centre contains 57 retail units and as 13 vacant, and the vacancy rate is
22.8% within the shopping centre, higher than the centre average (15.7%).
Customers’ views and behaviour
7.15 The household survey results indicate 61% of all respondents had visited Coalville for shopping
in the last 12 months, which is a relatively high proportion when compared with other centres in
the District. These respondents were asked what they like or dislike about Coalville town centre.
Around 27% liked that the town centre was close to home and 9% said that there was a good
choice of shops in general. In terms of factors disliked, 22% stated that there are too many
empty shops and 18% consider there are not enough independent shops.
Retailer representation
7.16 Despite the reduction (-12 units) in comparison outlets since 2013, Coalville town centre still has
a reasonable selection of comparison shops (61) reflecting its size and role in the shopping
hierarchy. The proportion of comparison goods is comparable with the national average.
7.17 Table 7.2 provides a breakdown of comparison shop units by category. All Goad categories are
represented which suggests there is a reasonable range of shops. However, there is a relatively
small choice of shops within each category, i.e. 5 or less shops in each.
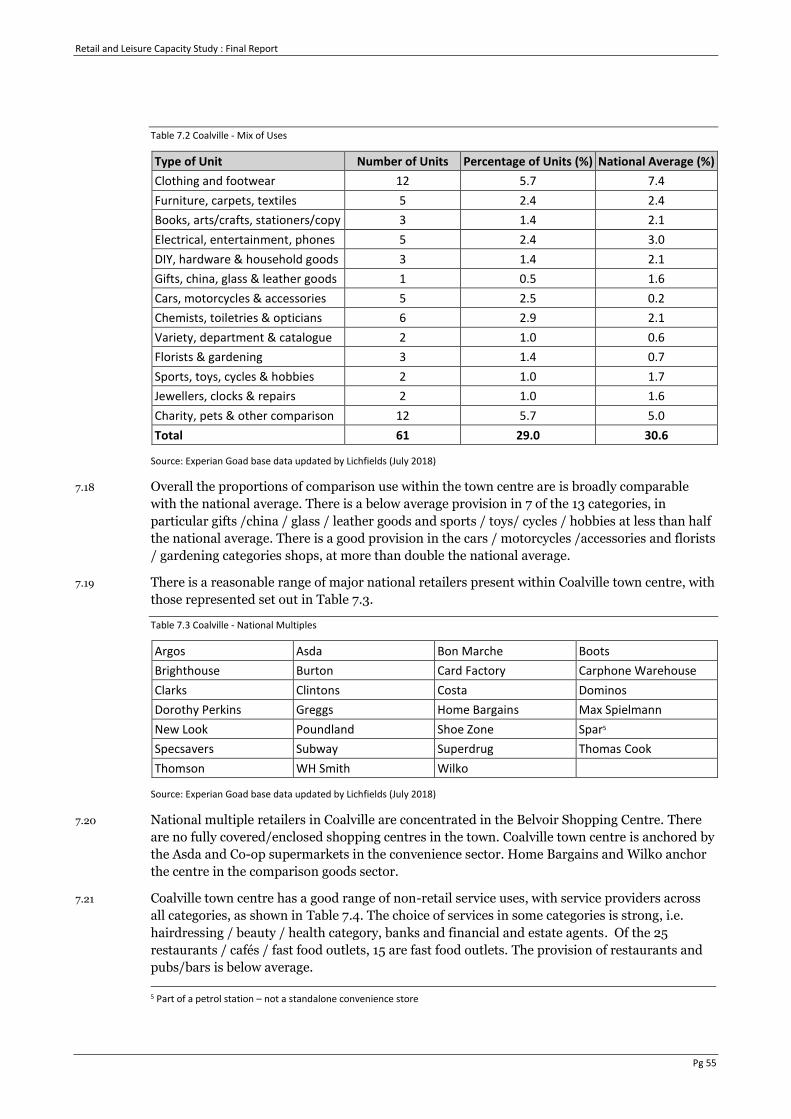
Retail and Leisure Capacity Study : Final Report
Pg 55
Table 7.2 Coalville - Mix of Uses
Type of Unit Number of Units Percentage of Units (%) National Average (%)
Clothing and footwear 12 5.7 7.4
Furniture, carpets, textiles 5 2.4 2.4
Books, arts/crafts, stationers/copy 3 1.4 2.1
Electrical, entertainment, phones 5 2.4 3.0
DIY, hardware & household goods 3 1.4 2.1
Gifts, china, glass & leather goods 1 0.5 1.6
Cars, motorcycles & accessories 5 2.5 0.2
Chemists, toiletries & opticians 6 2.9 2.1
Variety, department & catalogue 2 1.0 0.6
Florists & gardening 3 1.4 0.7
Sports, toys, cycles & hobbies 2 1.0 1.7
Jewellers, clocks & repairs 2 1.0 1.6
Charity, pets & other comparison 12 5.7 5.0
Total 61 29.0 30.6
Source: Experian Goad base data updated by Lichfields (July 2018)
7.18 Overall the proportions of comparison use within the town centre are is broadly comparable
with the national average. There is a below average provision in 7 of the 13 categories, in
particular gifts /china / glass / leather goods and sports / toys/ cycles / hobbies at less than half
the national average. There is a good provision in the cars / motorcycles /accessories and florists
/ gardening categories shops, at more than double the national average.
7.19 There is a reasonable range of major national retailers present within Coalville town centre, with
those represented set out in Table 7.3.
Table 7.3 Coalville - National Multiples
Argos Asda Bon Marche Boots
Brighthouse Burton Card Factory Carphone Warehouse
Clarks Clintons Costa Dominos
Dorothy Perkins Greggs Home Bargains Max Spielmann
New Look Poundland Shoe Zone Spar5
Specsavers Subway Superdrug Thomas Cook
Thomson WH Smith Wilko
Source: Experian Goad base data updated by Lichfields (July 2018)
7.20 National multiple retailers in Coalville are concentrated in the Belvoir Shopping Centre. There
are no fully covered/enclosed shopping centres in the town. Coalville town centre is anchored by
the Asda and Co-op supermarkets in the convenience sector. Home Bargains and Wilko anchor
the centre in the comparison goods sector.
7.21 Coalville town centre has a good range of non-retail service uses, with service providers across
all categories, as shown in Table 7.4. The choice of services in some categories is strong, i.e.
hairdressing / beauty / health category, banks and financial and estate agents. Of the 25
restaurants / cafés / fast food outlets, 15 are fast food outlets. The provision of restaurants and
pubs/bars is below average.
5 Part of a petrol station – not a standalone convenience store

Retail and Leisure Capacity Study : Final Report
Pg 56
Table 7.4 Coalville - Mix of Uses
Type of Unit Number of Units Percentage of Units (%) National Average (%)
Restaurants, cafés, fast food 13 6.2 9.3
Fast food 13 6.2 5.8
Pubs, bars 6 2.9 4.4
Hairdressing, beauty & health 28 13.3 9.1
Laundrettes & dry cleaners 1 0.5 0.7
Travel agents 2 1.0 0.8
Banks, build/socs, financial services 10 4.8 4.0
Estate agents & auctioneers 9 4.3 3.6
Total 82 39.2 37.7
Source: Experian Goad base data updated by Lichfields (July 2018)
7.22 Banks present include Halifax, HSBC, Lloyds and Santander. There are also two building
societies within the town centre (Hinckley & Rugby and Nationwide).
7.23 The Requirements List is a published source of information providing known requirements for
retail and leisure operators’ space in towns across the country. For Coalville, there are just three
known retail and leisure operators’ requirements. Operators seeking space in Coalville include
Topps Tiles (tile and wood flooring specialist), Snap Fitness (gym operator) and Marstons (pub
retailing business).
Property values and commercial rents
7.24 According to the Valuation Office Agency, Zone A retail rents vary significantly throughout the
centre. Commercial retail rents at the Belvoir Shopping Centre are typically £425 / sq. m. Rents
tend to be lower along Belvoir Road (£200 / sq. m) and High Street (£150 / sq. m). Commercial
rents are lower in the more peripheral areas (Ashby Road – £125 / sq. m and Hotel Street –
£100 / sq. m). The highest Zone A retail rents in Coalville (£425 / sq. m) are higher than the
highest Zone A retail rents in Ashby de la Zouch (£350 / sq. m).
7.25 In comparison with Zone A retail rents in similar sized centres in the sub-region, Zone A retail
rents in Coalville are comparable with Castle Street in Hinckley which has Zone A retail rents of
up to £400 / sq. m and High Street in Long Eaton (up to £410 / sq. m), but lower than Bath
Street in Ilkeston (up to £250 / sq. m). In higher order centres Zone A retail rents are much
higher at £1,335-2,000 / sq. m in the Highcross Shopping Centre in Leicester.
Pedestrian flows
7.26 Lichfields’ observations indicate that pedestrian footfall was found to be highest at the Belvoir
Shopping Centre.
Accessibility
7.27 Coalville is located off the A511 which has excellent access to the M1 to the south east and the
A42 to the west.
7.28 There are ten car parks in Coalville i.e. Belvoir Shopping Centre, Bridge Road (241 spaces),
James Street (72 spaces), London Road (89 spaces), Margaret Street (49 spaces), Market Hall
(174 spaces), Needhams Walk (108 spaces), North Service Road (74 spaces), Council offices (160
spaces) and LCC library (15 spaces). Many of the car parks in Coalville are free after 3pm which
is an incentive for visitors to shop in the late afternoon / early evening.

Retail and Leisure Capacity Study : Final Report
Pg 57
7.29 Coalville is well served by bus routes. The 29 bus service travels between Leicester, Coalville,
Ashby de la Zouch and Burton-upon-Trent. Bus stops are in numerous locations along Ashby
Road and High Street / Hotel Street / London Road. The route 29 bus service departs from
Coalville town centre once every 30 minutes. There are also bus stops at Memorial Square at the
top of Belvoir Road and outside the Council offices along Whitwick Road.
Perception of safety and occurrence of crime
7.30 According to Leicestershire Police6, there were 125 reported crimes in the Coalville Town
neighbourhood7 in May 2018, which is comparable with May 2017 (127 reported crimes), but
more than May 2016 (104 reported crimes). This is also slightly higher than the 112 reported
crimes in Ashby de la Zouch neighbourhood in May 2018.
State of town centre environmental quality
7.31 Coalville is not a particularly attractive town centre. The Belvoir Shopping Centre is the central
retail destination within the town centre and was built in the 1960s. The shopping centre is
dated in appearance, although there has been some investment to refresh the centre.
7.32 The Council has been running a Frontage Improvement Scheme, which was launched in
February 2015, to improve the appearance of town centre commercial premises. Ashby Road /
High Street / Hotel Street is a busy road for traffic, which makes access difficult for pedestrians.
However, street furniture including benches, bins and street lighting is in a good state of repair
and flowers/planted areas are present throughout the town centre, helping its attractiveness.
Marlborough Square and Memorial Square are attractive seating areas, but are located to the
periphery of the town centre.
Conclusions
7.33 Coalville is the largest town centre in the District. The town centre caters for convenience
shopping needs. Whilst existing comparison goods facilities meet general day-to-day needs,
shoppers also supplement this with shopping at higher order centres for comparison goods,
such as Leicester, Loughborough and Fosse Shopping Park. The town centre anchors including
Asda, Co-op, Home Bargains and Wilko are important attractions and will assist with linked
trips with other main town centre uses. The town centre has a reasonable selection of national
multiples, which provides contrast with smaller centres in the District which predominantly
contain independent operators. The Council sees the development of Coalville as a key priority.
It is taking a proactive approach to improving the town centre through the Choose Coalville
project. This aims to celebrate and showcase what the town centre has to offer, create new
opportunities, ensure the town centre flourishes and ensures the town centre is part of an
exciting future.
7.34 Many of the retailers within the town centre are discount/value orientated. The proportion of
vacant units is high, but is comparable with the proportion of vacant units in 2013, which
suggests previous decline has stabilised in recent years. The town centre is not particularly
attractive and would benefit from further regeneration, to ensure that it maintains its current
market share of customers, particularly in the comparison goods sector. Some progress has been
made in this regard with the Frontage Improvement Scheme. Any future restructuring in this
sector or the loss of a key town centre anchor would leave Coalville town centre vulnerable.
6 Sourced from https://www.police.uk/leicestershire/ 7 The Coalville Town neighbourhood includes the town centre and wider area including Ashby Road, Hotel Street, Belvoir Road, Whitwick Road and Standard Hill

Retail and Leisure Capacity Study : Final Report
Pg 58
Ashby de la Zouch town centre
7.35 Ashby de la Zouch is classified as a town centre in the Local Plan (Policy Ec8). It is the second
largest centre within North West Leicestershire District, albeit it is a similar size to Coalville and
supports a range of retail, service and community facilities. Like Coalville, the centre serves
shoppers from across the District, particularly for comparison shopping (across all zones and
based on the evidence of the results of the July 2018 household survey). Its key roles include:
• Convenience shopping – there is one medium-sized supermarket operated by the Co-op
store on Derby Road (1,840 sq. m gross) to the west of the town centre. A Co-op
convenience store is also located at 73 Market Street, towards the east of the town centre.
These facilities are supplemented by small convenience outlets and serve both main food
and grocery shopping trips and basket / top-up food shopping trips. A market is located at
the Town Hall on Market Street. A farmer’s market is held on the third Sunday of every
month in North Street Car Park to the north of the town centre.
• Comparison – a small number of national multiples including New Look, Peacocks, Shoe
Care and WH Smith, but a good choice of independent shops selling a range of comparison
and food and beverage goods. There are a few national multiple retailers located at or near
to Nottingham Road Retail Park, 1.5km east of the town centre in an ‘out-of-centre’ location.
Retailers include Tesco Extra, Aldi, M&S food hall, Pets at Home and Wickes.
• Services – including a good range of high street national banks and many restaurants / cafes
and hairdressers / beauty parlours.
• Entertainment – seven pubs and bars, a theatre, a hotel / guest house and a nightclub.
• Community facilities – including a library, doctors, dentist, vet, dance school, gyms,
museum and a number of churches.
7.36 Market Street is the central focus of the retail offer. Several boutique shops are located along
Bath Street. Bakery Court, Bullens Court Yard, Mill Lane Mews and Rushtons Yard Shopping
Centre are alleyways off Market Street, which contain independent operators and set Ashby de
la Zouch apart from other centres in the District by providing a unique shopping offer.
7.37 The householder shopper survey (Appendix 5) provides an indication of the role of the town
centre. For the study area as a whole, Ashby de la Zouch town centre was the location that 10%
of respondents stated was the destination for most of their comparison shopping. Of those who
undertake their main food shopping in Ashby de la Zouch as a whole, the most popular
destinations are the Tesco Extra supermarket on Resolution Road followed by the Aldi
supermarket on Dents Road. This means that a significant proportion of convenience goods
expenditure in the Ashby de la Zouch area is spent in facilities in out-of-centre locations, which
do not contribute to the town centre turnover. This is unlikely to change, as there is little room

Retail and Leisure Capacity Study : Final Report
Pg 59
within the town centre for new major convenience facilities (without comprehensive re-
development).
Diversity of uses
7.38 Ashby de la Zouch town centre has a total of 191 retail / service units. The diversity of uses
present in Ashby de la Zouch town centre in terms of the number of units is set out in Table 7.5,
compared against the national average.
Table 7.5 Ashby de la Zouch - Mix of Uses
Type of Unit Number of Units Percentage of Units (%) National Average (%)
Convenience 13 6.8 9.0
Comparison 78 40.6 30.6
Retail Service 34 17.7 14.7
Leisure Services 38 19.9 24.1
Financial & Business Services 20 10.4 10.2
Vacant 8 4.2 11.3
Total 191 100.0 100.0
Source: Experian Goad base data updated by Lichfields (July 2018)
7.39 The mix of uses is broadly comparable with the national average, but the most noticeable
exceptions are the higher proportion of comparison units, the relatively low proportion of
leisure services (e.g. Class A3 to A5 and D2 leisure), and the low vacancy rate (see below).
7.40 The proportion of convenience units is below the national average, but the centre is well
represented in terms of comparison retail when compared with the national average. The
proportion of retail services is above the national average, whereas leisure services are
significantly under-represented. The proportion of vacant units is just over a third of the
national average.
7.41 Between 2013 and 2018, the composition of uses has not changed significantly. The number of
convenience retail units has decreased by one and the number of comparison retail units has
increased by four. The number of service units has also increased by four. The number of
convenience units has fallen by three since 2013.
Proportion of vacant street level property
7.42 There are just 8 vacant units in Ashby de la Zouch which is a positive indicator that the town
centre is performing well. Goad Plan information suggests vacant floorspace is 1,560 sq.m gross.
There are three vacant units on Market Street, two on Bath Street and one on North Street. The
largest vacant unit is on North Street to the rear of the Queens Head Hotel pub (390 sq. m
gross), followed by 98 Market Street (330 sq. m gross) and 1A Market Street (250 sq. m gross).
The remaining vacant units each have a relatively small floorspace of below 200 sq. m gross.
Customers’ views and behaviour
7.43 The household survey results indicate 71% of all respondents of the household survey had
visited Ashby de la Zouch for shopping in the last 12 months, which is a relatively high
proportion when compared with other centres in the District and 10 percentage points higher
than Coalville. Those respondents were asked what they like or dislike about Ashby de la Zouch
town centre. The main responses are as follows: 14% considered that there is a good choice of
shops in general and 10% considered that Ashby de la Zouch is a nice place to visit. In terms of

Retail and Leisure Capacity Study : Final Report
Pg 60
factors disliked, 10% considered that there are not enough car parking spaces available and 7%
stated that there are too many charity shops.
Retailer representation
7.44 Ashby de la Zouch town centre has a good selection of comparison shops (79) for a centre of its
size, and more so than Coalville. The proportion of comparison goods is above the national
average. Table 7.6 provides a breakdown of comparison shop units by category.
Table 7.6 Ashby de la Zouch - Mix of Uses
Type of Unit Number of Units Percentage of Units (%) National Average (%)
Clothing and footwear 21 11.0 7.4
Furniture, carpets, textiles 6 3.1 2.4
Books, arts/crafts, stationers/copy 9 4.7 2.1
Electrical, entertainment, phones 7 3.7 3.0
DIY, hardware & household goods 4 2.1 2.1
Gifts, china, glass & leather goods 3 1.6 1.6
Cars, motorcycles & accessories 1 0.5 0.2
Chemists, toiletries & opticians 7 3.7 2.1
Variety, department & catalogue 0 0.0 0.6
Florists & gardening 1 0.5 0.7
Sports, toys, cycles & hobbies 2 1.0 1.7
Jewellers, clocks & repairs 4 2.1 1.6
Charity, pets & other comparison 15 7.9 5.0
Total 78 41.9 30.6
Source: Experian Goad base data updated by Lichfields
7.45 Most categories are represented which suggests there is a reasonable range of shops. However,
there is a relatively small choice of shops within 7 of the 13 categories, i.e. 5 or less shops in
each. Overall the proportions of comparison uses within the town centre are is broadly
comparable with the national average. There is a below average provision in only 3 of the 13
categories, i.e. variety /department /catalogue, florists / gardening and sports / toys / cycles /
hobbies. There is a good provision in most of the other categories, but most are independent.
There is a small range of major national retailers present within Ashby de la Zouch town centre,
with those represented set out in Table 7.7.
Table 7.7 Ashby de la Zouch - National Multiples
Boots Card Factory Clintons Co-op
Costa Greggs Johnsons New Look
Peacocks Shoecare Specsavers Subway
Superdrug Thomson Vision Express WH Smith
Source: Experian Goad base data updated by Lichfields
7.46 National multiple retailers in Ashby de la Zouch are primarily located on Market Street. There
is a particularly high concentration at the western end of Market Street between Derby Road
and Brook Street (nine units). Ashby de la Zouch town centre is anchored by the Co-op
supermarket in the convenience sector. The main comparison goods anchor stores are New
Look, Peacocks, Boots and WH Smith. As set out above, the nearby Nottingham Road Retail
Park provides an additional comparison offer.

Retail and Leisure Capacity Study : Final Report
Pg 61
7.47 Ashby de la Zouch town centre has a good range of non-retail service uses, with a choice of
service providers across all categories, as shown in Table 7.8. The choice of services in some
categories is strong, in particular travel agents and financial services.
Table 7.8 Ashby de la Zouch - Mix of Uses
Type of Unit Number of Units Percentage of Units (%) National Average (%)
Restaurants, cafés 15 7.9 9.3
Fast food 10 5.2 5.8
Pubs, bars 9 4.7 4.4
Hairdressing, beauty & health 20 10.5 9.1
Laundrettes & dry cleaners 2 1.0 0.7
Travel agents 4 2.1 0.8
Banks, build/socs, financial services 15 7.9 4.0
Estate agents & auctioneers 5 2.6 3.6
Total 79 41.9 37.7
Source: Experian Goad base data updated by Lichfields
7.48 Of the 25 restaurants / cafés / fast food, 10 are fast food outlets. There is a good mix of food and
beverage uses.
7.49 Banks present include HSBC, Lloyds, Royal Bank of Scotland and Santander. A Nationwide
building society is also present.
7.50 According to The Requirements List, there are five known retail and leisure operators’
requirements within Ashby de la Zouch. Operators seeking space in Ashby de la Zouch include
Holland & Barrett (chain of health food shops), Lidl (global discount supermarket chain), Topps
Tiles (tile and wood flooring specialist), Rainbows (hospice for children and young people) and
Clintons (retailer of greeting cards).
Commercial rents
7.51 According to the VOA, Zone A retail rents vary significantly throughout the centre. Commercial
retail rents on Market Street are between £81-£350 / sq. m / unit, but are typically £210 / sq. m
/ unit. Rental levels in peripheral areas such as on Kilwardby Street are between £90-£175 / sq.
m / unit. Zone A retail rents tend to be lower in Ashby de la Zouch than in Coalville.
Pedestrian flows
7.52 Lichfields’ observations indicate that pedestrian footfall was found to be highest along Market
Street. Footfall is much lower on the in the peripheral areas of the centre to the east of Market
Street and to the west along Kilwardby Street.
Accessibility
7.53 Ashby de la Zouch is located off the A42 which leads to the M1 to the north east.
7.54 There are six car parks in Ashby de la Zouch: Brook Street (12 spaces), Hood Park Leisure
Centre (115 spaces), North Street (82 spaces), South Street (60 spaces), Royal Hotel (100
spaces) and LCC library (27 spaces).
7.55 Ashby de la Zouch is well served by bus routes. The 29 bus service travels between Leicester,
Coalville, Ashby de la Zouch and Burton-upon-Trent and the 29A bus service provides a service
between Ashby de la Zouch and Burton-on-Trent. The 29A bus service typically departs from

Retail and Leisure Capacity Study : Final Report
Pg 62
Ashby de la Zouch town centre once every 30 minutes. Bus stops are located along Market
Street outside Birds Bakery and Boots.
Perception of safety and occurrence of crime
7.56 According to Leicestershire Police8, there were 112 reported crimes in the Ashby de la Zouch
neighbourhood9 in May 2018, which is comparable with May 2017 (110 reported crimes), but
significantly more than May 2016 (56 reported crimes). This is lower than the 125 reported
crimes in Coalville Town neighbourhood in May 2018.
State of town centre environmental quality
7.57 Ashby de la Zouch is an attractive town centre containing many historical buildings dating back
to the Georgian era. The alleyways off Market Street provide a unique and varied offer.
Pavements along Market Street are wide and the centre is relatively flat, making it accessible for
pedestrians. Market Street can get busy with road traffic, but three pedestrian crossings are
provided to aid pedestrians. Street furniture includes bins and benches and there are some
flower beds located along Market Street. Bath Street is particularly attractive.
Conclusions
7.58 In terms of role and characteristics, Ashby de la Zouch is different to Coalville. The centre is
reasonably well catered for in the convenience goods sector, but this sector is dominated by the
Co-op in the town centre. Ashby de la Zouch is well-provided for in the comparison goods
sector, but is under-represented in terms of the proportion of leisure services units. The number
of vacant units was low in 2013 and is now even lower, which is a very positive indicator of town
centre health. Commercial rents tend to be significantly lower than in Coalville, which assists in
the high occupancy rate. The town centre is attractive, and it contains a high number of
independent operators providing a unique offer for local residents and visitors. Ashby de la
Zouch town centre appears to be performing well, even with the out-of-centre competition at
Nottingham Road Retail Park.
8 Sourced from https://www.police.uk/leicestershire/ 9 The Ashby de la Zouch neighbourhood includes the town centre and wider area including Ashby de la Zouch, Packington, Normanton le Heath and Willesley

Retail and Leisure Capacity Study : Final Report
Pg 63
Local centres
7.59 For smaller centres including the local centres in North West Leicestershire District, the same
level of information is not available than is the case for larger town centres. Where information
is available, we have responded to the indicators used to assess the health of centres in our
analysis below.
7.60 As set out in Local Plan Policy Ec8, there are four defined local centres within the District,
including:
• Castle Donington;
• Ibstock;
• Kegworth; and
• Measham.
7.61 Lichfields undertook an audit of facilities of each of these local centres on 30 July 2018, the
findings of which are set out in Table 7.9 below, which has supplemented by local knowledge
from Council officers. These centres are much smaller than Coalville and Ashby de la Zouch.
Table 7.9 Local Centres - Mix of Uses
Category Castle
Donington
Ibstock Kegworth Measham NWLDC
Average
Number of Units
Convenience 1 4 4 4 3
Comparison 12 8 4 3 7
Retail Service 18 6 8 10 11
Leisure Services 14 12 6 6 10
Financial & Business Services 0 3 8 3 4
Vacant 3 1 3 1 2
Total 48 34 33 27 36
Source: Lichfields (July 2018)
Castle Donington
7.62 Castle Donington is located to the north east of the District. It is a linear centre, located on
Borough Street.
7.63 It is the largest of the District’s four local centres, with 47 retail / leisure units and with
representation in each of the main Goad categories. The diversity of uses present in Castle

Retail and Leisure Capacity Study : Final Report
Pg 64
Donington local centre in terms of the number and proportion of units is set out in Table 7.10,
compared with the national average.
Table 7.10 Castle Donington - Mix of Uses
Type of Unit Number of Units Percentage of Units (%) National Average (%)
Convenience 1 2.1 9.0
Comparison 12 25.0 30.6
Retail Service 18 37.5 14.7
Leisure Services 14 29.2 24.1
Financial & Business Services 0 0.0 10.2
Vacant 3 6.3 11.3
Total 48 100.0 100.0
Source: Lichfields
7.64 A Co-op convenience store anchors the centre and is the only national multiple retailer present.
Independent retailers help the centre’s local distinctiveness, which can assist in attracting local
residents and visitors.
7.65 There are only three vacant units which are located towards the south west of the local centre.
7.66 Castle Donington has a small selection of comparison good shops and 6 of the 13 Goad
categories are not represented. Table 7.11 provides a breakdown of comparison shop units by
category.
Table 7.11 Castle Donington - Mix of Uses
Type of Unit Number of Units Percentage of Units (%) National Average (%)
Clothing and footwear 2 4.3 7.4
Furniture, carpets, textiles 2 4.3 2.4
Books, arts/crafts, stationers/copy 0 0.0 2.1
Electrical, entertainment, phones 0 0.0 3.0
DIY, hardware & household goods 1 2.1 2.1
Gifts, china, glass & leather goods 2 4.3 1.6
Cars, motorcycles & accessories 0 0.0 0.2
Chemists, toiletries & opticians 2 4.3 2.1
Variety, department & catalogue 0 0.0 0.6
Florists & gardens 2 4.3 0.7
Sports, toys, cycles & hobbies 0 0.0 1.7
Jewellers, clocks & repairs 0 0.0 1.6
Charity, pets & other comparison 1 2.1 5.0
Total 12 25.7 30.6
Source: Experian Goad base data updated by Lichfields
7.67 Castle Donington’s range of non-retail service uses as shown in Table 7.12 and are dominated by
restaurants / cafés / fast food and the hairdressing / beauty & heath categories.

Retail and Leisure Capacity Study : Final Report
Pg 65
Table 7.12 Castle Donington - Mix of Uses
Type of Unit Number of Units Percentage of Units (%) National Average (%)
Restaurants, cafés, fast food 7 14.6 15.1
Pubs, bars 4 8.3 4.4
Hairdressing, beauty & health 11 22.9 9.1
Laundrettes & dry cleaners 1 2.1 0.7
Travel agents 0 0.0 0.8
Banks, build/socs, financial services 0 0.0 4.0
Estate agents & auctioneers 1 2.1 3.6
Total 23 50.0 37.7
Source: Experian Goad base data updated by Lichfields
7.68 The household survey results indicate 14% of all respondents had visited Castle Donington for
shopping in the last 12 months. These visitors like the centre because it is close to home (36%),
and 12% mentioned the good choice of shops in general and 11% suggested there is a good range
of independent shops. In terms of factors disliked, 13% stated there are not enough independent
shops and 7% stated there are not enough car parking spaces available.
7.69 Lichfields’ observations indicate that pedestrian footfall was highest along Borough Street.
7.70 Castle Donington local centre is located off Bondgate, which leads to the A50 to the north. The
155 bus service travels from Coalville to Castle Donington via East Midlands Airport. The route
155 bus service typically departs from Castle Donington local centre once every 2 hours. There
are three car parks in the centre as follows: Borough Street (29 spaces), Clapgun Street (32
spaces) and Hillside (13 spaces).
7.71 Castle Donington is an attractive local centre with character. Pavements are wide and traffic is
slow moving, making the local centre easy to navigate for pedestrians.
7.72 Castle Donington is a healthy local centre, which performs well against most of the town centre
performance indicators in the Planning Practice Guidance. The attractiveness and independent
retailers within the local centre, make it a unique destination for visitors to Castle Donington.
Ibstock
7.73 Ibstock is located to the south of the District. It is a linear centre, located on High Street. It
contains 34 retail / leisure units, with representation in each of the broad Goad categories
including convenience, comparison, retail service, leisure services and financial & business
services. The diversity of uses present in Ibstock local centre in terms of the number and
proportion of units is set out in Table 7.13, compared against the national average.

Retail and Leisure Capacity Study : Final Report
Pg 66
Table 7.13 Ibstock - Mix of Uses
Type of Unit Number of Units Percentage of Units (%) National Average (%)
Convenience 4 11.8 9.0
Comparison 8 23.5 30.6
Retail Service 6 17.6 14.7
Leisure Services 12 35.3 24.1
Financial & Business Services 3 8.8 10.2
Vacant 1 2.9 11.3
Total 34 100.0 100.0
Source: Lichfields
7.74 A Coral betting shop represents the only national multiple within the centre. A post office is
located at the far south west of the centre. However, a Co-op supermarket is located 0.5km
north west of the local centre in an ‘out-of-centre’ location.
7.75 There was just one vacant unit within Ibstock, which is a positive indicator of the town centre’s
health.
7.76 Ibstock has a small selection of comparison good shops and many of the Goad categories are not
represented. Table 7.14 provides a breakdown of comparison shop units by category.
Table 7.14 Ibstock - Mix of Uses
Type of Unit Number of Units Percentage of Units (%) National Average (%)
Clothing and footwear 1 2.9 7.4
Furniture, carpets, textiles 0 0.0 2.4
Books, arts/crafts, stationers/copy 0 0.0 2.1
Electrical, entertainment, phones 2 5.9 3.0
DIY, hardware & household goods 3 8.8 2.1
Gifts, china, glass & leather goods 0 0.0 1.6
Cars, motorcycles & accessories 0 0.0 0.2
Chemists, toiletries & opticians 1 2.9 2.1
Variety, department & catalogue 0 0.0 0.6
Florists & gardens 0 0.0 0.7
Sports, toys, cycles & hobbies 0 0.0 1.7
Jewellers, clocks & repairs 0 0.0 1.6
Charity, pets & other comparison 1 2.9 5.0
Total 8 23.4 30.6
Source: Experian Goad base data updated by Lichfields
7.77 Ibstock’s range of non-retail service uses is shown in Table 7.15 and are dominated by
restaurants / cafés / fast food, pubs / bars and the hairdressing / beauty & heath categories.

Retail and Leisure Capacity Study : Final Report
Pg 67
Table 7.15 Ibstock - Mix of Uses
Type of Unit Number of Units Percentage of Units (%) National Average (%)
Restaurants, cafés, fast food 5 14.7 15.1
Pubs, bars 4 11.8 4.4
Hairdressing, beauty & health 3 8.8 9.1
Laundrettes & dry cleaners 0 0.0 0.7
Travel agents 0 0.0 0.8
Banks, build/socs, financial services 2 5.9 4.0
Estate agents & auctioneers 0 0.0 3.6
Total 14 41.2 37.7
Source: Experian Goad base data updated by Lichfields
7.78 The household survey results indicate 18% of all respondents of the household survey had
visited Ibstock for shopping in the last 12 months. These visitors like the centre because it is
close to home (35%), with 13% mentioning the Co-op Supermarket (located outside of the
defined town centre boundary) and 11% stated that the centre has a good range of independent
shops. In terms of factors disliked, 14% considered there are not enough independent shops.
7.79 Lichfields’ observations indicate that pedestrian footfall was highest along High Street, albeit
the centre was quiet at the time of the site visit.
7.80 Ibstock local centre is located along High Street, off Melbourne Road (the A447), which is 5.3km
from the nearest ‘A road’ (the A511 to the north). The 159 bus service travels from Coalville to
Ibstock. The route 159 bus service typically departs from Ibstock local centre once every 1.5
hours. There are two free car parks as follows: Gladstone Street (20 spaces) and High Street (70
spaces).
7.81 Flower beds/planting help improve the attractiveness of the local centre, but street furniture is
looking tired. A zebra crossing aids pedestrians crossing High Street.
7.82 Ibstock is reasonably healthy, but lacks an anchor retailer. However, at the time of our visit
there were no vacant units within the local centre.
Kegworth
7.83 Kegworth is located to the north east of the District. It is a linear centre, located on Derby Road.
It is the smallest of the four local centres within the District. It contains 33 retail / leisure units,
albeit with representation in each of the Goad categories. The diversity of uses present in
Kegworth local centre in terms of the number and proportion of units is set out in Table 7.16,
compared against the national average.
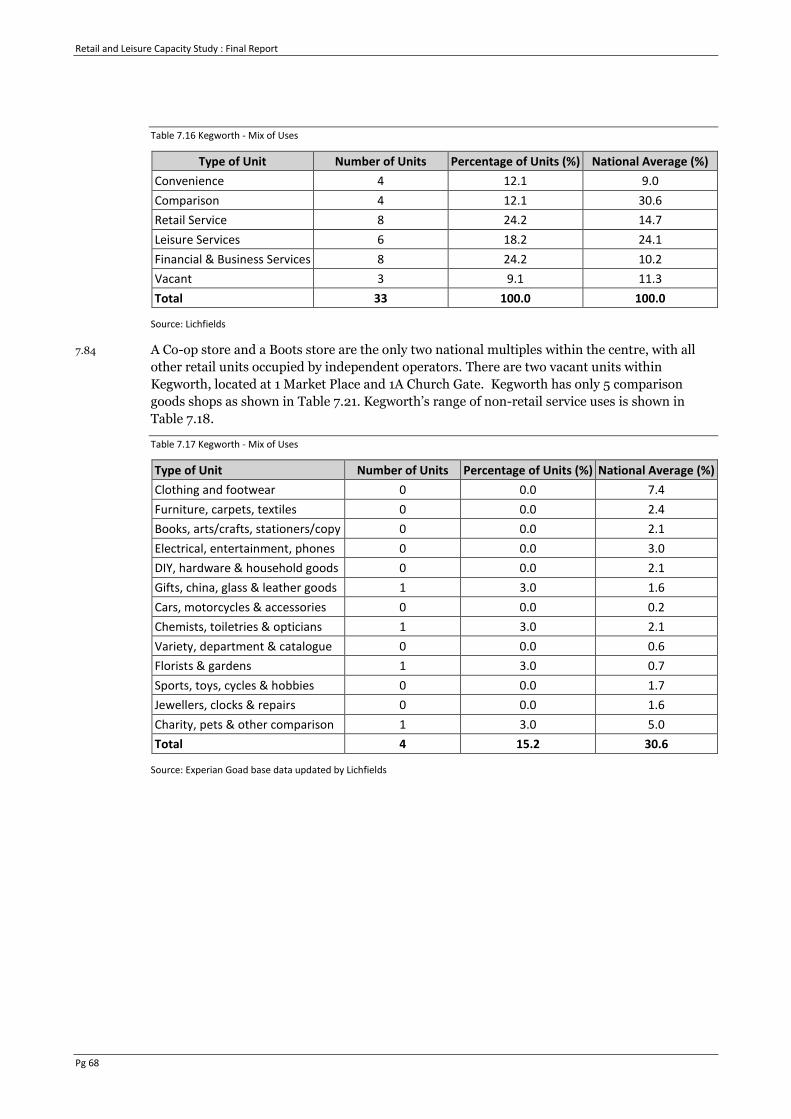
Retail and Leisure Capacity Study : Final Report
Pg 68
Table 7.16 Kegworth - Mix of Uses
Type of Unit Number of Units Percentage of Units (%) National Average (%)
Convenience 4 12.1 9.0
Comparison 4 12.1 30.6
Retail Service 8 24.2 14.7
Leisure Services 6 18.2 24.1
Financial & Business Services 8 24.2 10.2
Vacant 3 9.1 11.3
Total 33 100.0 100.0
Source: Lichfields
7.84 A Co-op store and a Boots store are the only two national multiples within the centre, with all
other retail units occupied by independent operators. There are two vacant units within
Kegworth, located at 1 Market Place and 1A Church Gate. Kegworth has only 5 comparison
goods shops as shown in Table 7.21. Kegworth’s range of non-retail service uses is shown in
Table 7.18.
Table 7.17 Kegworth - Mix of Uses
Type of Unit Number of Units Percentage of Units (%) National Average (%)
Clothing and footwear 0 0.0 7.4
Furniture, carpets, textiles 0 0.0 2.4
Books, arts/crafts, stationers/copy 0 0.0 2.1
Electrical, entertainment, phones 0 0.0 3.0
DIY, hardware & household goods 0 0.0 2.1
Gifts, china, glass & leather goods 1 3.0 1.6
Cars, motorcycles & accessories 0 0.0 0.2
Chemists, toiletries & opticians 1 3.0 2.1
Variety, department & catalogue 0 0.0 0.6
Florists & gardens 1 3.0 0.7
Sports, toys, cycles & hobbies 0 0.0 1.7
Jewellers, clocks & repairs 0 0.0 1.6
Charity, pets & other comparison 1 3.0 5.0
Total 4 15.2 30.6
Source: Experian Goad base data updated by Lichfields

Retail and Leisure Capacity Study : Final Report
Pg 69
Table 7.18 Kegworth - Mix of Uses
Type of Unit Number of Units Percentage of Units (%) National Average (%)
Restaurants, cafés, fast food 5 15.2 15.1
Pubs, bars 0 0.0 4.4
Hairdressing, beauty & health 3 9.1 9.1
Laundrettes & dry cleaners 0 0.0 0.7
Travel agents 0 0.0 0.8
Banks, build/socs, financial services 4 12.1 4.0
Estate agents & auctioneers 3 9.1 3.6
Total 16 50.0 37.7
Source: Experian Goad base data updated by Lichfields
7.85 Just 5% of all respondents of the household survey had visited Kegworth for shopping in the last
12 months. Many of these visitors like the fact that the centre is close to home (47%), and 14%
like the good cafés and restaurants. In terms of factors disliked, 13% stated there are not enough
shops in general, 11% stated that there was a lack of parking spaces and 10% complained about
traffic congestion.
7.86 Lichfields’ observations indicate that pedestrian footfall was highest along Derby Road.
7.87 Kegworth local centre is located along Derby Road (the A6), which is a very busy road, leading to
the M1 to the north. The East Midlands Gateway bypass is currently being constructed further
south of the local centre, which links the A6 to the A453 to the west, which, once in operation,
should significantly reduce the amount of traffic travelling through Kegworth. A Skylink bus
service travels through Derby, East Midlands Airport, Kegworth, Loughborough and Leicester
and departs Kegworth once an hour. Free car parking is located at Market Place; however, this
was close to full capacity at the time of the site visit.
7.88 Pavements are wide, but the amount of traffic in the centre restricts pedestrian movement
crossing Derby Road.
7.89 The Co-op and Boots stores are key anchors for the local centre and provide the opportunity for
linked trips with other main town centre uses present within Kegworth. The high amount of
traffic passing through Kegworth currently hinders movement around the local centre. This
problem should be improved when the new bypass is operational.
Measham
7.90 Measham is located to the south west of the District. It is a linear centre, with main town centre
uses located on either side of High Street. It contains 27 retail / leisure units, with
representation in each of the Goad categories. The diversity of uses present in Measham local

Retail and Leisure Capacity Study : Final Report
Pg 70
centre in terms of the number and proportion of units is set out in Table 7.19, compared against
the national average.
Table 7.19 Measham - Mix of Uses
Type of Unit Number of Units Percentage of Units (%) National Average (%)
Convenience 4 14.8 9.0
Comparison 3 11.1 30.6
Retail Service 10 37.0 14.7
Leisure Services 6 22.2 24.1
Financial & Business Services 3 11.1 10.2
Vacant 1 3.7 11.3
Total 27 100.0 100.0
Source: Lichfields
7.91 A Tesco Express store provides the key convenience provision and anchors the centre. There is
also an edge-of-centre Co-op convenience store located to the south west of the centre, which
provides additional convenience goods provision. Other retail units are independent operators.
7.92 There is just one vacant unit within the centre, located at 50 High Street. Measham has only 3
comparison goods shops as shown in Table 7.20.
Table 7.20 Measham - Mix of Uses
Type of Unit Number of Units Percentage of Units (%) National Average (%)
Clothing and footwear 0 0.0 7.4
Furniture, carpets, textiles 0 0.0 2.4
Books, arts/crafts, stationers/copy 1 3.7 2.1
Electrical, entertainment, phones 0 0.0 3.0
DIY, hardware & household goods 1 3.7 2.1
Gifts, china, glass & leather goods 0 0.0 1.6
Cars, motorcycles & accessories 0 0.0 0.2
Chemists, toiletries & opticians 0 0.0 2.1
Variety, department & catalogue 0 0.0 0.6
Florists & gardens 0 0.0 0.7
Sports, toys, cycles & hobbies 1 3.7 1.7
Jewellers, clocks & repairs 0 0.0 1.6
Charity, pets & other comparison 0 0.0 5.0
Total 3 11.1 30.6
Source: Experian Goad base data updated by Lichfields
7.93 Measham’s range of non-retail service uses is shown in Table 7.21 and are dominated by
restaurants / cafés / fast food and the hairdressing / beauty & heath categories.

Retail and Leisure Capacity Study : Final Report
Pg 71
Table 7.21 Measham - Mix of Uses
Type of Unit Number of Units Percentage of Units (%) National Average (%)
Restaurants, cafés, fast food 5 18.5 15.1
Pubs, bars 2 7.4 4.4
Hairdressing, beauty & health 5 18.5 9.1
Laundrettes & dry cleaners 0 0.0 0.7
Travel agents 0 0.0 0.8
Banks, build/socs, financial services 0 0.0 4.0
Estate agents & auctioneers 1 3.7 3.6
Total 13 48.1 37.7
Source: Experian Goad base data updated by Lichfields
7.94 The household survey results indicate 13% of all respondents of the household survey had
visited Measham for shopping in the last 12 months. These visitors like the centre because it is
close to home (44%). In terms of factors disliked, 9% said there was not enough independent
shops.
7.95 Lichfields’ observations indicate that pedestrian footfall was highest along High Street.
7.96 Measham local centre is located off the A42, which leads to the M42 to the south west. The 19
bus service travels from Burton to Swadlincote, Measham and Ashby de la Zouch. The route 19
bus service typically departs from Measham local centre once an hour. There are two free car
parks as follows: High Street (44 spaces) and Peggs Close (19 spaces).
7.97 Pavements tend to be narrow and the local centre is on a hill, which can be difficult for some to
navigate. A zebra crossing makes crossing High Street easily accessible for pedestrians.
7.98 Measham is a reasonably attractive local centre. The Tesco Express draws trade from residents
of the local area. The local centre serves the primary shopping needs of its residents.

Retail and Leisure Capacity Study : Final Report
Pg 72
8.0 Planning policy analysis
Introduction
8.1 This section reviews the current policy approach to retail and town centres as set out in the
North West Leicestershire Local Plan (‘Local Plan’) in the light of findings within previous
sections of this study.
8.2 The PPG indicates that development plans should develop (and keep under review) town centre
strategies that plan for a 3-5 year period, whilst also giving a Local Plan a lifetime view. Plans
should identify the scale of need for main town centre uses and assess whether the need can be
met on town centre sites or through the expansion of centres.
8.3 The new NPPF (2018) indicates that local plans should allocate a range of suitable sites to meet
the scale and type of retail, leisure and other development needed in town centres for at least 10
years. The need for development should not be compromised by limited site availability. To
accommodate growth, local planning authorities should keep town centre boundaries under
review.
8.4 Consistent with the sequential approach, town centres are expected to be the focus for retail and
leisure development, with larger town centres having the best prospects for attracting
investment from developers and multiple operators.
8.5 The designation of primary shopping areas or centre boundaries is important when applying the
sequential approach, to direct retail and town centre uses to sustainable locations and determine
whether a retail impact assessment is required. The NPPF indicates that the first preference for
retail uses should be the primary shopping area (PSA), which will comprise the primary
frontages and the secondary frontages that are contiguous with the primary frontages. The first
preference for leisure uses is normally the wider defined town centre, which usually includes the
PSA and other parts of the town centre.
8.6 The NPPF states that, when assessing applications for retail and leisure development outside of
town centres which are not in accordance with an up to date local plan, local planning
authorities should require an impact assessment if the development is over a proportionate,
locally set threshold. If there is no locally set threshold, the default threshold is 2,500 sq. m
gross. The PPG provides guidance on setting locally appropriate thresholds, and indicates it will
be important to consider:
• the scale of proposals relative to town centres;
• the existing viability and vitality of town centres;
• cumulative effects of recent developments;
• whether local town centres are vulnerable;
• the likely effects of development on any town centre strategy; and
• the impact on any other planned investment.
8.7 This section examines the existing policy approach within North West Leicestershire District,
including the hierarchy of centres, retail boundaries and retail impact thresholds.
The hierarchy of centres
8.8 The NPPF (paragraph 85) indicates that planning policies should define a network and
hierarchy of centres that is resilient to anticipated economic changes. The PPG indicates that
planning policies should identify the appropriate and realistic role, function and hierarchy of

Retail and Leisure Capacity Study : Final Report
Pg 73
centres over the plan period. The PPG also indicates that strategies should identify changes in
the hierarchy, including where a centre is in decline.
8.9 Local Plan Policy Ec8 (Town and Local Centres: Hierarchy and Management of Development
identifies the locations where retail and main town centre development will be accommodated
which are outlined in Table 8.1 below. This approach is in accordance with the sequential test as
set out in the NPPF.
Table 8.1 North West Leicestershire District Settlement Hierarchy
Hierarchy Settlement
Town Centres Coalville, Ashby de la Zouch
Local Centres Castle Donington, Ibstock, Kegworth, Measham
Source: North West Leicestershire Local Plan
8.10 In accordance with the NPPF, the Local Plan review should continue to define a hierarchy of
centres and ensure new main town uses are focused within these centres. Policy should also
make it clear that an objective of the Local Plan is to maintain the vitality and viability of the
centres identified within the retail hierarchy.
8.11 Based on the scale of facilities available within each settlement and the retail floorspace
projections in this study, it is appropriate to maintain the current settlement hierarchy, with
Ashby de la Zouch and Coalville being the principal retail destinations in the District and the
focus of new retail floorspace. Policy Ec8 indicates that proposals for up to 7,300 sq. m of
comparison goods retail floorspace will be brought forward in Coalville. The estimate should be
updated and should include projections for a wider range of Class A1 to A5 uses to be
considered, rather than just comparison goods retail.
8.12 Ashby de la Zouch (191 units) and Coalville (210 units) are the main shopping destinations in
the District and are town centres. Castle Donington, Ibstock, Kegworth and Measham provide
predominately service and community uses, serving their immediate local catchment area.
Significant new housing development is planned for land north of Ashby de la Zouch (2,050
dwellings) and others, which will need to be supported by additional shops and services.
8.13 Nottingham Road Retail Park in Ashby de la Zouch and Whitwick Retail Park in Coalville are the
other main concentrations of retail floorspace within the District. These are retail warehouse
parks rather than traditional centres. They are predominantly car borne shopping destinations
that do not provide the broader mix of retail, non-retail services and community uses that tend
to be found in designated centres, particularly town and district centres.
8.14 Nottingham Road Retail Park, Ashby de la Zouch and Whitwick Retail Park, Coalville should not
be designated as town centres, because uncontrolled expansion of these shopping destination
could undermine the vitality and viability of designated town centres, by removing the need for
new development to pass the sequential or impact tests. Removal of these tests could encourage
significant expansion of these retail parks and/or the relaxation of restrictions on the good that
can be sold. This type of development, if uncontrolled, could result in significant trade diversion
from the town centres and/or the relocation of occupiers or diversion of investment away from
the town centres, which could have an adverse impact on the health and vitality and viability of
Ashby de la Zouch and Coalville.
8.15 These retail park locations have attracted a mix of bulky goods and non-bulky goods retailers. If
there is pressure in the future, in line with national trends, to attract more non-bulky retailers
then this could result in relocations from the town centres, because these retail park locations
can provide larger units, free car parking and lower cost accommodation. This may be an issue
for Ashby de la Zouch, which has less available retail units that meet the requirements of

Retail and Leisure Capacity Study : Final Report
Pg 74
modern retailers. Maintaining the sequential and impact test will allow each proposal to be
considered on its individual merits.
8.16 All development proposals within out of centre locations should continue to comply with the
sequential and impact tests, to protect the vitality and viability of the network of centres within
the District. The health of the town centres and local centres will need to be monitored.
Impact thresholds
8.17 The PPG states that where authorities decide not to set out specific floorspace thresholds in local
development plans, national policy requires impact assessments to be submitted for retail and
leisure developments over 2,500 sq.m gross. The PPG acknowledges that it may occasionally be
relevant to consider the impact of proposals below this floorspace threshold, for example if they
are large developments when compared with the size of a nearby centre, or likely to have a
disproportionate effect or ‘tip the balance’ of a vulnerable centre. As indicated above,
maintaining the sequential and impact test will allow each proposal to be considered on its
individual merits.
8.18 Local Plan Policy Ec9 (Town and Local Centres: Thresholds for Impact Assessments) sets a
threshold that requires an impact assessment for retail, leisure and office development outside
of the town and local centres. For Coalville and Ashby de la Zouch there is a development
threshold of 1,000 sq. m gross. For Castle Donington, Ibstock, Kegworth and Measham there is
a development threshold of 500 sq. m gross.
8.19 The new NPPF no longer requires an impact assessment to be provided for office development,
and therefore this part of Policy Ec9 is now inconsistent with the NPPF.
8.20 We consider that the NPPF minimum threshold of 2,500 sq.m gross continues to be
inappropriate as a blanket threshold across North West Leicestershire District, because this
scale of development would represent a significant proportion of the overall retail projections
for all centres in the District. Retail development smaller than 2,500 sq.m gross could have a
significant adverse impact, on centres within the District. The continued adoption of a reduced
threshold is recommended.
8.21 In line with the scale of Ashby de la Zouch and Coalville and the projected retail capacity
estimated, the impact thresholds for the two main centres should remain at 1,000 sq. m gross.
8.22 Castle Donington, Ibstock, Kegworth and Measham are much smaller centres and the projected
retail capacity estimates are limited (only 10% of the District wide projection in total). These
centres will be vulnerable to impacts from smaller scale development. The retail floorspace
capacity attributed to other smaller centres is only around 1,200 sq. m gross up to 2036. Based
on this updated projection, the Council should consider reducing the impact threshold from 500
sq. m gross to 250 sq. m gross, in line with the Sunday trading size limit.
Town centre boundary and primary shopping area
8.23 The designation of town centre boundaries and primary shopping areas and are important when
applying the sequential approach. These boundaries are used to determine whether a site is
within an in, edge or out-of-centre location. These boundaries direct retail and town centre uses
to sustainable locations and are also used to determine whether a retail impact assessment is
required. These boundaries are also important in determining what locations will represent
appropriate edge of centre locations for retail and other main town centre uses.
8.24 The NPPF indicates that the first preference for retail uses should be the primary shopping area,
which will comprise a defined area where retail development is concentrated. This suggests

Retail and Leisure Capacity Study : Final Report
Pg 75
retail uses outside the primary shopping area, but still within the town centre boundary could be
considered to be edge of centre.
8.25 The first preference for other town centre uses, such as commercial leisure and office uses, is
normally the wider defined town centre, which usually includes the primary shopping area and
other parts of the town centre. The revised NPPF does not refer to primary secondary frontages
making up the primary shopping area. The aim is to create more flexibility and encourage
positive strategies for town centres. However, the primary shopping area should be the defined
area where retail development is concentrated.
8.26 Policy Ec8 and Policy Ec9, regarding edge and out of centre development is consistent with the
revised NPPF in terms of the sequential and impact tests. However, the Local Plan Proposals
Map defines both town centre boundaries and primary shopping areas for all designated centres
i.e. Ashby de la Zouch, Coalville, Castle Donington, Ibstock, Kegworth and Measham. The
purpose of the town centre boundaries appears to relate to Policy Ec8 and Policy Ec9, i.e. the
application of the sequential approach to site selection, and where development will not be
required to undertake an impact assessment. The Proposals Map Key could be clearer and
indicate that the town centre boundary relates to Policy Ec8 and Ec9 to avoid the potential for
confusion. The Proposals Map Key should also indicate that the primary shopping area relates to
Policy Ec10, regarding non-shopping uses.
8.27 Policy wording should also be aware of the revised NPPF. As outlined in Section 2 of this study,
the most pertinent change in the revised NPPF (underlined) is at paragraph 87 - “main town
centre uses should be located in town centres, then edge of centre locations; and only if suitable
sites are not available (or expected to become available within a reasonable period) should out
of centre sites be considered”.
8.28 The review of the town centre boundaries indicates that the current designations remain
appropriate and no changes are recommended. The town centre boundaries include the
concentrations of main town centre uses (retail, leisure and offices) and offer scope for
expansion.
The appropriate mix of uses
8.29 Town centres should provide a range of and mix complementary uses. A balance between retail,
entertainment and leisure activity helps town centres compete with on-line shopping. Town
centres need a good mix of uses that extend activity throughout the daytime and into the
evenings. This approach is clearly recognised in the new NPPF.
8.30 The retail capacity projections indicate there is a need for a range of new Class A1 to A5
floorspace over the plan period, and a flexible approach capable of accommodate Class D2
leisure and cultural uses is recommended. Policy Ec10 seeks to control non-shopping uses
within the designated primary shopping areas.
8.31 There are four broad policy approaches that could be considered in North West Leicestershire
District, as follows:
1 strengthening Policy Ec10 within the Local Plan to provide more control over the loss of
retail uses. This could involve extending the primary shopping area, and/or introducing
more rigid policy criteria;
2 retain the current policy approach in Policy Ec10;
3 relaxing Policy Ec10 to allow a more flexible approach to enable more non-retail uses. This
could involve reducing the primary shopping areas and or relaxing the policy criteria; or
4 a laissez-faire approach that removes Policy Ec10.

Retail and Leisure Capacity Study : Final Report
Pg 76
8.32 The advantages and disadvantages of these approaches are outlined below.
8.33 The NPPF (paragraph 85) indicates that policies can make clear the range of uses that will be
permitted in town centres and primary shopping areas, as part of a positive strategy for the
future of each centre. A balanced mix of uses is required in town centres, which promotes
growth.
8.34 Local Plan Policy Ec10 (Town and Local Centres: Primary Shopping Areas – Non-Shopping
Uses) considers that shops (Use Class A1) will be the predominant ground floor use within the
defined Primary Shopping Areas of the town and local centres. This approach appears to be
consistent with the NPPF (paragraph 85) and the Glossary (primary shopping areas).
8.35 The current wording provides a relatively flexible approach, that allows other main town centre
uses within the primary shopping areas, provided the following criteria are met:
a the proposals makes a positive contribution to the diversity of uses on offer; and
b the proposal, along with any committed planning permission, does not undermine the
shopping element within the immediate area of the site;
c it would not result in a cluster or over-concentration of non-shop uses; and
d it would not lead to a negative impact on the retail character and vitality and viability of
the Primary Shopping Area.
8.36 The residential use of the upper floors of properties within the defined Primary Shopping Area
will be supported subject to parking and amenity considerations.
8.37 The suitability of this approach needs to be considered in the context of recent changes in the
mix of uses within frontages, the floorspace projections and recent changes to the General
Permitted Development Order (GPDO). The changes to the GPDO will have an impact on
frontage policies. These measures allow for greater flexibility for changes of use from retail to
non-retail uses subject to Prior Approval for example, Class A uses to C3 residential use and
Class A1 to non-A1 uses. These measures could change the composition of town centres, i.e. the
amount of Class A1 space could reduce where shop units are predominantly small (less than 150
sq. m gross).
8.38 The health check assessment of the defined centres in this study suggest (to date) the impact of
the GPDO changes have not been significant. In the future permitted changes of use for smaller
units will have an impact on the enforcement of Local Plan policies, i.e. where units are less than
150 sq. m. The ability to control non-A1 uses within the primary shopping area and the direction
of Class A4 and A5 uses to other parts of the town centre has diminished.
8.39 A ban on changes of use from Class A1 or other Class A would not promote diversity and would
stifle investment, which could be potentially damaging to the vitality and viability of centres. In
our view the current approach in Policy Ec10 is relatively flexible in comparison with many
other local plans. There is no evidence to suggest a less restrictive approach is necessary,
particularly in view of the future retail floorspace growth projections outlined in this report and
low shop vacancy rates (Coalville aside). A balanced approach should continue to be applied and
the mix of uses within the centres should be monitored and protected as necessary.
8.40 Local Plan Policy Ec12 (Local Centres) considers that planning permission will only be
granted for the loss of shopping and other main town centre uses within the defined local centre
if the premises have been vacant for at least 6 months with evidence of marketing. The following
factors will also be considered:
a the need to maintain an appropriate balance between main town centre and non-main
town centre uses;

Retail and Leisure Capacity Study : Final Report
Pg 77
b the contribution the unit makes to the function of the centre in terms of its size and
location within the centre;
c the nature and characteristics of the proposed use and the type and characteristics of
other uses within proximity of the application site; and
d the impact of the proposal on the shopping and service character and function of the
local centre – for example, would it create an active frontage, would the use bring
visitors to the centre?
8.41 The residential use of the upper floors of properties within these defined local centres will be
supported subject to parking and amenity considerations.
8.42 This approach appears to be robust and appropriate. A laissez faire approach could result in the
deterioration of shopping and service uses and could undermine the role of these smaller
shopping centres.
8.43 Local Plan Policy Ec11 (Town and Local Centres: Primary Shopping Areas – Hot Food
Takeaway Balance) sets out that in considering applications for a proposed hot food takeaway
use, within the defined primary shopping areas of the town and local centres, with regard to the
following factors:
a the number of existing takeaway establishments in the immediate area as related to the
application site and their proximity to each other, in order to avoid clusters of takeaway
uses;
b impact on the amenity of the immediate area (including smells, fumes and noise),
traffic or safety issues arising from the proposal itself or cumulatively with the existing
uses in the area; and
c the potential impact upon the health of local residents where it can be demonstrated
that the proposal will raise health issues.
8.44 Policy Ec11 also considers that proposals for a hot food takeaway use should also include the
provision of a litter bin on land within the premises. Within the Market Street frontage of Ashby
de la Zouch, Nos 67 to 89 and Nos 76 to 108, the Council will resist applications for new hot food
takeaway uses over and above those in existence or permitted. The concentration of hot food
takeaway uses within the defined local centre of Ibstock will not be permitted to increase above
the existing number of those in existence or permitted.
8.45 This policy exerts a level of control over the concentration of Hot Food Takeaways, particularly
in vulnerable parts of town centres in Ashby de la Zouch and Ibstock and this approach remains
appropriate.

Retail and Leisure Capacity Study : Final Report
Pg 78
9.0 Accommodating growth
Introduction
9.1 This section explores the implications of the findings of the previous sections for each centre in
North West Leicestershire District. It explores how the potential distribution of future
development could be accommodated, recognising the NPPF requires local authorities to
allocate sites to meet identified needs over the next 10 years as a minimum.
Floorspace projections
9.2 The floorspace projections set out in in the previous sections of this study assume that new
shopping and leisure facilities will help North West Leicestershire District maintain its current
market share of expenditure within the study area, recognising that other competing centres will
also improve in the future. There are several issues that may influence the scope for new
floorspace and the appropriate location for this development, as follows:
1 major retail developments in competing centres;
2 the re-occupation of vacant retail floorspace;
3 the availability of land to accommodate new development;
4 the reliability of long term expenditure projections;
5 the effect of internet/home shopping on the demand for retail property;
6 the level of operator demand for floorspace in North West Leicestershire District;
7 the likelihood that North West Leicestershire District’s existing market share of expenditure
will change in the future in the face of increasing competition; and
8 the potential impact new development may have on existing centres.
9.3 The NPPF suggests the development plan should plan for at least 10 years. Projections up to
2026 are more robust and are based on up-to-date (post EU referendum) forecasts. The longer
term floorspace projections (up to 2031 and 2036) should be treated with caution. Projections to
2036 should only be used as a broad guide, particularly when translated into the development
plan allocations or when used to guide development management decisions. Long term forecasts
may be subject to change due to unforeseen circumstances. Projected surplus expenditure is
primarily attributable to projected growth in spending per capita. If the growth in expenditure is
lower than that forecast then the scope for additional space will reduce. Long term projections
should be monitored and kept under review.
9.4 The expenditure projections in this study exclude growth in expenditure attributed to home
shopping made through non-retail businesses. The study assumes that home shopping will
continue to increase in the future, including the growth of internet shopping.
9.5 Allowing for the impact of growth in home shopping, the quantitative and qualitative
assessment of the potential for new retail and leisure floorspace within the previous sections
suggests there is scope for new development within North West Leicestershire District. The
global projections for the District up to 2026 suggest there is scope for about 5,200 sq. m gross
of Class A1 to A5 floorspace. The long-term projections up to 2031 suggest there is scope for
about 8,600 sq. m gross of Class A1 to A5 floorspace, increasing to about 12,000 sq. m gross by
2036. A breakdown of the floorspace projections for Class A retail (comparison and
convenience) and food and beverage for North West Leicestershire District up to 2036 are
shown in Table 9.1 below.

Retail and Leisure Capacity Study : Final Report
Pg 79
Table 9.1 North West Leicestershire District Floorspace Projections (sq.m Gross)
Type By 2021 By 2026 By 2031 By 2036
Convenience 558 991 1,416 1,847
Comparison 1,124 3,284 5,636 8,069
Food and Beverage 331 933 1,516 2,058
Total 2,013 5,208 8,568 11,974
Source: Table 12, Appendix 2; Table 12, Appendix 3; Table 12, Appendix 4
Vacant units
9.6 The existing stock of premises will have a role to play in accommodating projected growth. The
retail capacity analysis in this report assumes that existing occupied retail floorspace can, on
average, increase its turnover to sales floorspace densities. In addition to the growth in sales
densities for occupied space, vacant shops could help to accommodate future growth.
9.7 There are 49 vacant shop units (see Tables 7.1, 7.5 and 7.9) within Ashby de la Zouch (8 units),
Coalville (33), Castle Donington (3), Ibstock (1), Kegworth (3) and Measham (1), which equates
to an overall vacancy rate of 8.8%, which is lower than the Goad national average of 11.3%. All
centres (except Coalville) have vacancy rates lower than the national average. This suggests the
centres in the District are performing relatively healthily, in comparison with many other town
centres. The healthiest centres generally have a vacancy rate of around 5%, because there will
always be an element of vacancies, reflecting the normal churn of occupiers.
9.8 Nevertheless, vacant premises should help to accommodate growth, given their town / district
centre location and the sequential preference for future investment. If about half the existing
vacant floorspace can be reoccupied then there could be potential for re-occupied vacant space
to accommodate the following new floorspace:
• Ashby de la Zouch town centre – 750 sq. m gross10
• Coalville town centre – 2,400 sq. m gross11
• Other local centres – 400 sq. gross12
9.9 Reoccupied vacant shop units in total could accommodate up to 3,550 sq. m gross. If this
reduction in vacant units can be achieved, then the overall Class A1 to A5 floorspace projection
for North West Leicestershire up to 2026 would reduce from about 4,200 sq. m gross to 650 sq.
m gross. The longer-term projection to 2031 would reduce from 7,300 sq. m gross to 3,750 sq. m
gross.
Development opportunities
9.10 Retail and leisure growth should be focused in the main town centres where there are the best
prospects for attracting investment. This is consistent with the approach set out in the existing
development plan and the NPPF.
9.11 North West Leicestershire District has several strategic housing allocations contained in the
existing Development Plan which may include local shops and services to cater for the needs of
new residents within these schemes (subject to satisfying the sequential and impact tests if
10 Based on Goad Plan vacant floorspace of 1,560 sq. m gross in Ashby de la Zouch 11 Based on Goad Plan vacant floorspace of 4,740 sq. m gross in Coalville 12 Based on seven vacant units and assuming that on average, the vacant units within the local centres are, on average, 50 sq. m gross

Retail and Leisure Capacity Study : Final Report
Pg 80
required). If brought forwards, these developments will also help to meet the projected retail
floorspace identified in this study.
9.12 As indicated above, vacant units within the town and local centres could accommodate up to
3,650 sq. m gross retail floorspace. If this can be achieved, then the short term floorspace
projection up to 2021 (1,457 sq. m gross) could be accommodated.
9.13 In addition to vacant shop units, further sites to accommodate around 850 sq. m gross should to
be identified up to 2026 and around 3,350 sq. m gross up to 2031.
9.14 A review of potential development opportunities has identified several opportunities within the
District. These opportunities have been assessed in Appendix 6. The opportunities and their
development potential is summarised below:
Ashby de la Zouch
• Co-op Store (in-centre) – reasonable potential – 7,000 sq. m gross.
• Hood Car Park (edge-of-centre) – reasonable potential – 3,000 sq. m gross.
• Land Rear of Market Street / North of South Street (edge-of-centre) – reasonable potential
– 3,000 sq. m gross.
• The Pass’s Courtyard (in-centre) – reasonable potential – 1,000 sq. m gross.
Coalville
• Belvoir Centre Car Park (edge-of-centre) – good potential – 15,000 sq. m gross.
• The Vacant Red House Pub (edge-of-centre) – good potential – 2,000 sq. m gross.
• Vacant Land at Hotel Street / Whitwick Road (edge-of-centre) – good potential – 3,000 sq.
m gross.
• Royal Mail and Commercial Premises (edge-of-centre) – reasonable potential – 2,000 sq. m
gross.
• James Street Car Park – reasonable potential (edge-of-centre) – 2,000 sq. m gross.
Local centres
Within local centres demand for space over and above vacant units could be accommodated via
small infill developments and shop extensions. There is no need to identify large scale
development sites.
Ashby de la Zouch
9.15 The floorspace projections for Class A retail/food and beverage uses are shown in Table 9.2
below:

Retail and Leisure Capacity Study : Final Report
Pg 81
Table 9.2 Ashby de la Zouch Floorspace Projections (sq. m Gross)
Type 2026 2031 2036
Convenience 0 0 0
Comparison 1,479 2,539 3,634
Food and Beverage 400 651 884
Total 1,879 3,190 4,518
Source: Table 12, Appendix 2, 3 and 4
9.16 In Ashby de la Zouch, together the development sites identified could accommodate 14,000 sq.
m gross of Class A1 to A5 uses. These opportunity sites, together with the occupation vacant
units (500 sq.m gross), could accommodate more than three times the floorspace capacity up to
2036.
Coalville
9.17 The floorspace projections for Class A retail/food and beverage uses are shown in Table 9.3
below:
Table 9.3 Coalville Floorspace Projections (sq. m Gross)
Type 2026 2031 2036
Convenience 938 1,288 1,635
Comparison 1,317 2,260 3,236
Food and Beverage 236 384 521
Total 2,491 3,932 5,392
Source: Table 12, Appendix 2, 3 and 4
9.18 In Coalville, the development sites identified could accommodate 24,000 sq. m gross of Class A1
to A5 uses. These opportunity sites, together with the occupation vacant units (2,500 sq. m
gross) could accommodate nearly five times the projected floorspace capacity up to 2036.

Retail and Leisure Capacity Study : Final Report
Pg 82
10.0 Conclusions and Recommendations
10.1 This section draws together the analysis set out in previous sections and provides strategic
recommendations for the main centres in North West Leicestershire District. It explores how
the identified growth across the District could be accommodated and the potential distribution
of future development.
Meeting North West Leicestershire District’s needs
10.2 The NPPF states that local planning authorities should assess the quantitative and qualitative
needs for land or floorspace for retail and leisure development over the plan period. When
planning for growth in their town centres, local planning authorities should allocate a range of
suitable sites to meet the scale and type of retail development needed. It is important that the
needs for retail and other main town centre uses are met in full and not compromised by limited
site availability.
10.3 Long term floorspace capacity forecasts beyond 10 years are susceptible to unforeseen
circumstances. Growth forecasts for expenditure and turnover are particularly uncertain and
need to be carefully monitored, including the continued growth in home / internet shopping.
Long term projections must be treated with caution and kept under review, particularly
projections between 2031 and 2036.
Convenience goods development
10.4 The convenience goods expenditure projections, taking account of the growth of home/internet
shopping as currently recommended by Experian, suggest new floorspace could be distributed
as shown in Table 10.1.
Table 10.1 Convenience Goods Floorspace Projections on a Cumulative Basis (sq.m gross)
Centre By 2021 By 2026 By 2031 By 2036
Ashby de la Zouch 0 0 0 0
Coalville 558 938 1,288 1,635
Castle Donington 0 0 0 0
Ibstock 0 0 0 17
Kegworth 0 6 20 33
Measham 0 0 0 0
Other NW Leicestershire 0 53 108 162
Total 558 991 1,416 1,847
Source: Table 12, Appendix 2
10.5 In qualitative terms, food store retail provision is strong in Ashby de la Zouch and Coalville.
There are large food stores (over 1,000 sq. m net) suitable for main and bulk food shopping such
as a Tesco Extra, Morrisons, Aldi and Lidl supermarkets. Other food stores are also suitable for
main food shopping, such as the larger Co-op store and Marks & Spencer food hall in Ashby de
la Zouch and the Asda in Coalville. The other centres provide small food stores suitable for
basket and top up shopping. There are no clear identified areas of qualitative deficiency in food
store provision within the District in terms of national multiple foodstores.
Comparison goods development
10.6 The comparison goods expenditure projections, again taking account of the expected growth of
home/internet shopping as recommended currently by Experian, suggest new floorspace in the
District could be distributed as shown in Table 10.2. Residents lack a good choice of higher

Retail and Leisure Capacity Study : Final Report
Pg 83
order comparison shops in Ashby de la Zouch and Coalville and need to travel outside of the
District to Loughborough and Leicester for a wider range of goods that meet more than their
day-to-day needs.
Table 10.2 Comparison Goods Floorspace Projections on a Cumulative Basis (sq.m gross)
Centre By 2021 By 2026 By 2031 By 2036
Ashby de la Zouch 506 1,479 2,539 3,634
Coalville 451 1,317 2,260 3,236
Castle Donington 56 164 281 403
Ibstock 45 131 224 321
Kegworth 11 33 57 82
Measham 36 104 179 256
Other NW Leicestershire 19 56 96 137
Total 1,124 3,284 5,636 8,069
Source: Table 12, Appendix 3
10.7 Comparison goods expenditure retention in Ashby de la Zouch and Coalville is relatively low,
which is to be expected for smaller town centres. Investment will be needed in the District to
retain the existing levels of comparison goods expenditure. The objective of the development
strategy for North West Leicestershire District should be to maintain the District’s shopping role
and market share within the sub-region, in the face of increasing competition. The economic
projections assume that new development will retain the District’s share of comparison
expenditure in the study area and will help to maintain this share in the future.
Food and beverage development
10.8 The food and beverage projections suggest new floorspace could be distributed as shown in
Table 10.3. Ashby de la Zouch and Coalville have a reasonable provision of Class A3
(restaurant/café) uses. Growth in expenditure should provide opportunities to enhance food
and beverage provision within all centres.
Table 10.3 Food and Beverage Floorspace Projections on a Cumulative Basis (sq. m gross)
Centre Additional Floorspace (sq. m gross)
By 2021 By 2026 By 2031 By 2036
Ashby de la Zouch 143 400 651 884
Coalville 84 236 384 521
Castle Donington 21 60 97 132
Ibstock 12 35 57 77
Kegworth 8 23 37 50
Measham 11 32 52 70
Other NW Leicestershire 52 147 238 324
Total 331 933 1,516 2,058
Source: Table 12, Appendix 4
Other main town centre uses
10.9 Residents in North West Leicestershire District have limited access to most types of commercial
leisure and entertainment facilities, at least within the District. Residents need to travel outside
of the District to go to the cinema, theatre, ten pin bowling and other leisure, entertainment and
cultural uses. There may be potential to improve facilities as follows:
• theoretical capacity for a small/medium sized cinema (3-5 screens); and
• theoretical capacity for a health and fitness facility.

Retail and Leisure Capacity Study : Final Report
Pg 84
10.10 Other uses such as hotels, nightclubs, museums, art galleries, exhibition space, live music
venues, clubs, hotels casinos, tourist attractions and new emerging leisure activities tend to be
located in larger town centres than those in the District. However, they could be appropriate and
the strategy needs to be flexible so it can respond to emerging opportunities for new facilities of
this kind.
Strategy for accommodating growth
10.11 The floorspace projections shown in this study provide broad guidance. Meeting the projections
to 2026 and 2031 is the priority, and longer-term projections need to be monitored.
10.12 The short-term priority should be the reoccupation of vacant floorspace in the centres.
Reoccupied vacant shop units in total could accommodate up to 3,300 sq. m gross, i.e. all the
floorspace capacity up to 2021 and beyond.
10.13 Ashby de la Zouch and Coalville have several development opportunities, which offer potential
to accommodate all of the remaining projected growth up to 2036, if required.
Policy review
The Hierarchy of Centres
10.14 In accordance with the NPPF, the Local Plan review should define a hierarchy of centres and
ensure new main town uses are focused within these centres. The policy should also make it
clear that an objective of the Local Plan is to maintain the vitality and viability of the centres
identified within the retail hierarchy. Based on the scale of facilities available within each
settlement and the retail floorspace projections in this study, a we suggest that the existing retail
hierarchy set out in Table 10.4 is maintained.
Table 10.4 North West Leicestershire District Retail Hierarchy
Centre Hierarchy Centre
Town Centre Ashby de la Zouch and Coalville
Local Centre Castle Donington, Ibstock, Kegworth and Measham
Source: Lichfields' Analysis
Impact Thresholds
10.15 The Local Plan impact threshold is currently below the NPPF’s threshold (2,500 sq. m gross) at
1,000 sq. m gross for the town centres and 500 sq. m gross for the local centres. Based on this
updated projection, the Council should consider reducing the impact threshold from 500 sq. m
gross to 250 sq. m gross, in line with the Sunday trading size limit.
Town centre boundaries and primary shopping area
10.16 The current designated primary shopping areas and town centre boundaries for Ashby de la
Zouch and Coalville town centres remain appropriate and provide a sufficient balance between
flexibility and control.
Future monitoring
10.17 The recommendations and projections within this study are expected to assist the Council in
reviewing development plan policies over the coming years and to assist development control
decisions during this period. The study provides a broad overview of the potential need for
further retail development in the medium to long term up to 2031. Longer term horizon year

Retail and Leisure Capacity Study : Final Report
Pg 85
projections up to 2036 are subject to uncertainty and forecasts will need to be amended to
reflect emerging changes, as and when new information becomes available. Longer-term
projections after 2031 should be treated with caution and provide broad guidance only.
10.18 Projections should be monitored and the floorspace projections rolled forward. The following
key assumptions should be updated as necessary:
1 population projections;
2 local expenditure estimates (information from Experian or other recognised data
providers);
3 growth rate assumptions for expenditure per capita (information from Experian or other
recognised data providers);
4 the impact of potential increases in home and internet shopping (Experian regularly
provides projections for internet shopping and these projections will need to be updated at
the same time as expenditure and population figures);
5 existing retail floorspace and average turnover to floorspace densities; and
6 implemented development within and around the study area.
10.19 These key inputs into the retail capacity assessment can be amended to provide revised capacity
projections.


Appendix 1: Study area

Retail and Leisure Capacity Study: Appendix 1: Study area

Appendix 2: Convenience goods capacity

Retail and Leisure Capacity Study: Appendix 2: Convenience goods capacity
Table 1 - Study Area Population
Zone 2016 2018 2021 2026 2031 2036
Zone 1 - Castle Donington & Kegworth 12,882 13,097 13,434 13,941 14,384 14,777
Zone 2 - North of Coalville 11,987 12,187 12,501 12,972 13,385 13,750
Zone 3 - Ashby de la Zouch 18,714 19,027 19,516 20,252 20,896 21,467
Zone 4 - Measham 10,385 10,559 10,830 11,239 11,596 11,913
Zone 5 - Ibstock 11,173 11,360 11,652 12,091 12,476 12,816
Zone 6 - Coalville 20,136 20,472 20,999 21,791 22,484 23,098
Zone 7 - Whitwick 12,895 13,110 13,447 13,955 14,398 14,792
Total 98,172 99,813 102,378 106,241 109,618 112,613
Sources:
Experian 2016
North West Leicestershire District - Office of National Statistics 2014 SNPP projections
Table 2 - Convenience Goods Expenditure per person per annum (£)
Zone 2018 2021 2026 2031 2036
Zone 1 - Castle Donington & Kegworth 2,158 2,147 2,142 2,142 2,148
Zone 2 - North of Coalville 2,312 2,300 2,295 2,294 2,301
Zone 3 - Ashby de la Zouch 2,090 2,079 2,075 2,074 2,080
Zone 4 - Measham 2,177 2,166 2,161 2,161 2,167
Zone 5 - Ibstock 2,147 2,136 2,131 2,130 2,136
Zone 6 - Coalville 1,963 1,953 1,949 1,948 1,954
Zone 7 - Whitwick 2,039 2,029 2,024 2,024 2,029
Sources:
Experian Local Expenditure 2016 (2016 prices)
Growth Rates: -0.6% in 2018, -0.2% in 2019 and 0.1% beyond 2019.
Excludes Special Forms of Trading based on Experian adjusted national average for non-retail businesses
Table 3 - Total Convenience Goods Expenditure (£m)
Zone 2018 2021 2026 2031 2036
Zone 1 - Castle Donington & Kegworth 28.27 28.84 29.86 30.80 31.74
Zone 2 - North of Coalville 28.18 28.75 29.77 30.71 31.64
Zone 3 - Ashby de la Zouch 39.77 40.58 42.01 43.34 44.65
Zone 4 - Measham 22.99 23.46 24.29 25.05 25.81
Zone 5 - Ibstock 24.39 24.88 25.76 26.57 27.38
Zone 6 - Coalville 40.19 41.01 42.46 43.80 45.13
Zone 7 - Whitwick 26.74 27.28 28.25 29.14 30.02
Study Area Total 210.52 214.81 222.40 229.41 236.36
Source:
Tables 1 and 2

Retail and Leisure Capacity Study: Appendix 2: Convenience goods capacity
Table 4 - Base Year 2018 Convenience Goods Market Shares By Zone (%)
Store/Location Zone 1 Zone 2 Zone 3 Zone 4 Zone 5 Zone 6 Zone 7 Inflow
Main Centres
Co-op, Derby Road, Ashby de la Zouch 0.0% 0.0% 11.9% 2.2% 1.7% 0.0% 1.6% 10.0%
Co-op, Market Street, Ashby de la Zouch 0.0% 0.3% 7.0% 0.6% 0.3% 0.0% 0.6% 10.0%
Tesco Extra, Resolution Road, Ashby de la Zouch 1.8% 27.9% 30.8% 20.9% 19.5% 7.9% 8.2% 10.0%
Aldi, Dents Road, Ashby de la Zouch 3.4% 6.8% 13.5% 13.4% 12.5% 0.9% 0.4% 10.0%
Marks & Spencer Foodhall, Smithy Road, Ashby de la Zouch 0.0% 1.1% 5.1% 1.4% 1.2% 0.9% 0.2% 10.0%
Other - Ashby de la Zouch 0.0% 0.4% 2.8% 0.4% 0.0% 0.0% 0.0% 10.0%
Asda, Ashby Road, Coalville 0.0% 0.5% 0.0% 0.3% 2.0% 7.6% 0.7% 10.0%
Co-op, Bridge Road, Coalville 0.0% 2.5% 0.0% 0.0% 0.6% 8.7% 0.3% 10.0%
Co-op, Cropston Drive, Greenhill, Coalville 0.0% 0.4% 0.0% 0.0% 0.0% 0.7% 3.4% 10.0%
Home Bargains, Belvoir Shopping Centre, Coalville 0.0% 1.5% 0.0% 0.0% 0.0% 2.4% 0.7% 10.0%
Aldi, Thornborough Road, Coalville 0.0% 12.3% 0.0% 1.4% 13.4% 17.3% 22.1% 10.0%
Co-op, Meadlow Lane, Coalville 0.0% 0.5% 0.0% 0.0% 0.0% 1.7% 4.2% 10.0%
Lidl, Thornborough Road, Coalville 0.3% 5.1% 0.4% 0.7% 4.7% 6.7% 7.7% 10.0%
Morrisons, Whitwick Road, Coalville 0.3% 14.5% 0.2% 2.3% 17.0% 30.2% 34.2% 10.0%
Other - Coalville 0.0% 1.9% 0.0% 0.0% 0.0% 2.6% 1.0% 10.0%
Co-op, Borough Street, Castle Donington 9.5% 0.0% 0.0% 0.0% 0.0% 0.0% 0.0% 5.0%
Co-op, Station Road, Castle Donington 12.1% 0.7% 0.0% 0.0% 0.0% 0.0% 0.0% 5.0%
Premier, Huntington Drive, Castle Donington 4.2% 0.0% 0.0% 0.0% 0.0% 0.0% 0.0% 5.0%
Other - Castle Donington 1.2% 0.0% 0.3% 0.0% 0.0% 0.0% 0.0% 5.0%
Co-op, Ashby Road, Ibstock 0.0% 0.0% 0.0% 2.9% 23.4% 2.8% 0.0% 5.0%
Other - Ibstock 0.0% 0.0% 0.0% 0.0% 0.3% 0.0% 0.0% 5.0%
Co-op, Market Place, Kegworth 10.3% 0.2% 0.0% 0.0% 0.0% 0.0% 0.0% 5.0%
Co-op, High Street, Measham 0.0% 0.0% 0.0% 10.0% 0.0% 0.0% 0.0% 5.0%
Tesco Express, High Street, Measham 0.0% 0.0% 0.4% 7.6% 0.0% 0.0% 0.0% 5.0%
Other North West Leicestershire
Local shops, Donisthorpe 0.0% 0.0% 0.0% 0.9% 0.0% 0.0% 0.0% 5.0%
Londis, Whitehill Road, Ellistown 0.0% 0.0% 0.0% 0.0% 0.0% 1.5% 0.0% 5.0%
McColls, Central Road, Hugglescote 0.0% 0.0% 0.0% 0.0% 0.0% 4.3% 0.0% 5.0%
Local shops, Moira 0.0% 0.4% 1.4% 0.0% 0.0% 0.0% 0.0% 5.0%
Local shops, Packington 0.0% 0.0% 0.0% 0.0% 0.9% 0.0% 0.0% 5.0%
Local shops, Ravenstone 0.0% 0.0% 0.0% 0.0% 0.2% 0.0% 0.0% 5.0%
Co-op, High Street, Swadlincote 0.0% 0.0% 0.0% 0.4% 0.0% 0.0% 0.0% 5.0%
Co-op, Shortheath Road, Swadlincote 0.0% 0.0% 3.7% 2.5% 0.0% 0.0% 0.0% 5.0%
Co-op, The Green, Thrigstone 0.0% 8.1% 0.0% 0.0% 0.0% 0.0% 0.7% 5.0%
Local shops, Long Whatton 0.9% 0.0% 0.0% 0.0% 0.0% 0.0% 0.0% 5.0%
Co-op, Market Place, Whitwick 0.0% 2.8% 0.0% 0.0% 0.0% 0.5% 8.2% 5.0%
Local shops, Whitwick 0.0% 0.4% 0.0% 0.0% 0.0% 0.0% 1.4% 5.0%
North West Leicestershire District Total 44.0% 88.3% 77.5% 67.9% 97.7% 96.7% 95.6% -
Elsewhere
Loughborough 24.2% 3.6% 0.3% 0.0% 0.2% 1.3% 2.3% n/a
Long Eaton 23.0% 0.3% 1.1% 0.2% 0.0% 0.0% 0.0% n/a
Hinckley 0.0% 0.0% 0.0% 0.5% 0.2% 0.5% 0.3% n/a
Lichfield 0.0% 0.0% 0.0% 0.4% 0.0% 0.0% 0.0% n/a
Atherston 0.4% 0.0% 0.0% 0.3% 0.0% 0.0% 0.0% n/a
Swadlincote 0.5% 3.7% 18.0% 24.5% 1.1% 0.0% 0.0% n/a
Leicester 0.2% 1.2% 0.0% 0.1% 0.0% 1.3% 1.4% n/a
Tamworth 0.0% 1.5% 1.7% 4.2% 0.8% 0.0% 0.1% n/a
Other 7.7% 1.4% 1.4% 1.9% 0.0% 0.2% 0.3% n/a
Elsewhere Total 56.0% 11.7% 22.5% 32.1% 2.3% 3.3% 4.4% -
TOTAL 100.0% 100.0% 100.0% 100.0% 100.0% 100.0% 100.0% -
NEMS Household Survey July 2018 (weighted results)

Retail and Leisure Capacity Study: Appendix 2: Convenience goods capacity
Table 5 - Base Year 2018 Convenience Goods Expenditure Patterns By Zone (£M)
Location Zone 1 Zone 2 Zone 3 Zone 4 Zone 5 Zone 6 Zone 7 Inflow Total
Expenditure 2018 28.27 28.18 39.77 22.99 24.39 40.19 26.74 210.52
Main Centres
Co-op, Derby Road, Ashby de la Zouch 0.00 0.00 4.73 0.51 0.41 0.00 0.43 0.68 6.76
Co-op, Market Street, Ashby de la Zouch 0.00 0.08 2.78 0.14 0.07 0.00 0.16 0.36 3.60
Tesco Extra, Resolution Road, Ashby de la Zouch 0.51 7.86 12.25 4.80 4.76 3.18 2.19 3.95 39.50
Aldi, Dents Road, Ashby de la Zouch 0.96 1.92 5.37 3.08 3.05 0.36 0.11 1.65 16.49
Marks & Spencer Foodhall, Smithy Road, Ashby de la Zouch 0.00 0.31 2.03 0.32 0.29 0.36 0.05 0.37 3.74
Other - Ashby de la Zouch 0.00 0.11 1.11 0.09 0.00 0.00 0.00 0.15 1.46
Asda, Ashby Road, Coalville 0.00 0.14 0.00 0.07 0.49 3.05 0.19 0.44 4.38
Co-op, Bridge Road, Coalville 0.00 0.70 0.00 0.00 0.15 3.50 0.08 0.49 4.92
Co-op, Cropston Drive, Greenhill, Coalville 0.00 0.11 0.00 0.00 0.00 0.28 0.91 0.14 1.45
Home Bargains, Belvoir Shopping Centre, Coalville 0.00 0.42 0.00 0.00 0.00 0.96 0.19 0.17 1.75
Aldi, Thornborough Road, Coalville 0.00 3.47 0.00 0.32 3.27 6.95 5.91 2.21 22.13
Co-op, Meadlow Lane, Coalville 0.00 0.14 0.00 0.00 0.00 0.68 1.12 0.22 2.16
Lidl, Thornborough Road, Coalville 0.08 1.44 0.16 0.16 1.15 2.69 2.06 0.86 8.60
Morrisons, Whitwick Road, Coalville 0.08 4.09 0.08 0.53 4.15 12.14 9.14 3.36 33.56
Other - Coalville 0.00 0.54 0.00 0.00 0.00 1.05 0.27 0.21 2.05
Co-op, Borough Street, Castle Donington 2.69 0.00 0.00 0.00 0.00 0.00 0.00 0.14 2.83
Co-op, Station Road, Castle Donington 3.42 0.20 0.00 0.00 0.00 0.00 0.00 0.19 3.81
Premier, Huntington Drive, Castle Donington 1.19 0.00 0.00 0.00 0.00 0.00 0.00 0.06 1.25
Other - Castle Donington 0.34 0.00 0.12 0.00 0.00 0.00 0.00 0.02 0.48
Co-op, Ashby Road, Ibstock 0.00 0.00 0.00 0.67 5.71 1.13 0.00 0.39 7.89
Other - Ibstock 0.00 0.00 0.00 0.00 0.07 0.00 0.00 0.00 0.08
Co-op, Market Place, Kegworth 2.91 0.06 0.00 0.00 0.00 0.00 0.00 0.16 3.12
Co-op, High Street, Measham 0.00 0.00 0.00 2.30 0.00 0.00 0.00 0.12 2.42
Tesco Express, High Street, Measham 0.00 0.00 0.16 1.75 0.00 0.00 0.00 0.10 2.01
Other North West Leicestershire
Local shops, Donisthorpe 0.00 0.00 0.00 0.21 0.00 0.00 0.00 0.01 0.22
Londis, Whitehill Road, Ellistown 0.00 0.00 0.00 0.00 0.00 0.60 0.00 0.03 0.63
McColls, Central Road, Hugglescote 0.00 0.00 0.00 0.00 0.00 1.73 0.00 0.09 1.82
Local shops, Moira 0.00 0.11 0.56 0.00 0.00 0.00 0.00 0.04 0.70
Local shops, Packington 0.00 0.00 0.00 0.00 0.22 0.00 0.00 0.01 0.23
Local shops, Ravenstone 0.00 0.00 0.00 0.00 0.05 0.00 0.00 0.00 0.05
Co-op, High Street, Swadlincote 0.00 0.00 0.00 0.09 0.00 0.00 0.00 0.00 0.10
Co-op, Shortheath Road, Swadlincote 0.00 0.00 1.47 0.57 0.00 0.00 0.00 0.11 2.15
Co-op, The Green, Thrigstone 0.00 2.28 0.00 0.00 0.00 0.00 0.19 0.13 2.60
Local shops, Long Whatton 0.25 0.00 0.00 0.00 0.00 0.00 0.00 0.01 0.27
Co-op, Market Place, Whitwick 0.00 0.79 0.00 0.00 0.00 0.20 2.19 0.17 3.35
Local shops, Whitwick 0.00 0.11 0.00 0.00 0.00 0.00 0.37 0.03 0.51
North West Leicestershire District Total 12.44 24.88 30.82 15.61 23.82 38.87 25.56 17.08 189.08
Elsewhere
Loughborough 6.84 1.01 0.12 0.00 0.05 0.52 0.61 n/a 9.16
Long Eaton 6.50 0.08 0.44 0.05 0.00 0.00 0.00 n/a 7.07
Hinckley 0.00 0.00 0.00 0.11 0.05 0.20 0.08 n/a 0.44
Lichfield 0.00 0.00 0.00 0.09 0.00 0.00 0.00 n/a 0.09
Atherston 0.11 0.00 0.00 0.07 0.00 0.00 0.00 n/a 0.18
Swadlincote 0.14 1.04 7.16 5.63 0.27 0.00 0.00 n/a 14.24
Leicester 0.06 0.34 0.00 0.02 0.00 0.52 0.37 n/a 1.31
Tamworth 0.00 0.42 0.68 0.97 0.20 0.00 0.03 n/a 2.29
Other 2.18 0.39 0.56 0.44 0.00 0.08 0.08 n/a 3.73
Elsewhere Total 15.83 3.30 8.95 7.38 0.56 1.33 1.18 n/a 38.52
TOTAL 28.27 28.18 39.77 22.99 24.39 40.19 26.74 17.08 227.60
Source: Tables 3 and 4

Retail and Leisure Capacity Study: Appendix 2: Convenience goods capacity
Table 6 - Future 2021 Convenience Goods Expenditure Patterns By Zone (£M)
Location Zone 1 Zone 2 Zone 3 Zone 4 Zone 5 Zone 6 Zone 7 Inflow Total
Expenditure 2021 28.84 28.75 40.58 23.46 24.88 41.01 27.28 214.81
Main Centres
Co-op, Derby Road, Ashby de la Zouch 0.00 0.00 4.83 0.52 0.42 0.00 0.44 0.69 6.89
Co-op, Market Street, Ashby de la Zouch 0.00 0.09 2.84 0.14 0.07 0.00 0.16 0.37 3.67
Tesco Extra, Resolution Road, Ashby de la Zouch 0.52 8.02 12.50 4.90 4.85 3.24 2.24 4.03 40.30
Aldi, Dents Road, Ashby de la Zouch 0.98 1.96 5.48 3.14 3.11 0.37 0.11 1.68 16.83
Marks & Spencer Foodhall, Smithy Road, Ashby de la Zouch 0.00 0.32 2.07 0.33 0.30 0.37 0.05 0.38 3.82
Other - Ashby de la Zouch 0.00 0.12 1.14 0.09 0.00 0.00 0.00 0.15 1.49
Asda, Ashby Road, Coalville 0.00 0.14 0.00 0.07 0.50 3.12 0.19 0.45 4.47
Co-op, Bridge Road, Coalville 0.00 0.72 0.00 0.00 0.15 3.57 0.08 0.50 5.02
Co-op, Cropston Drive, Greenhill, Coalville 0.00 0.12 0.00 0.00 0.00 0.29 0.93 0.15 1.48
Home Bargains, Belvoir Shopping Centre, Coalville 0.00 0.43 0.00 0.00 0.00 0.98 0.19 0.18 1.79
Aldi, Thornborough Road, Coalville 0.00 3.54 0.00 0.33 3.33 7.10 6.03 2.26 22.58
Co-op, Meadlow Lane, Coalville 0.00 0.14 0.00 0.00 0.00 0.70 1.15 0.22 2.21
Lidl, Thornborough Road, Coalville 0.09 1.47 0.16 0.16 1.17 2.75 2.10 0.88 8.77
Morrisons, Whitwick Road, Coalville 0.09 4.17 0.08 0.54 4.23 12.39 9.33 3.42 34.25
Other - Coalville 0.00 0.55 0.00 0.00 0.00 1.07 0.27 0.21 2.09
Co-op, Borough Street, Castle Donington 2.74 0.00 0.00 0.00 0.00 0.00 0.00 0.14 2.88
Co-op, Station Road, Castle Donington 3.49 0.20 0.00 0.00 0.00 0.00 0.00 0.19 3.89
Premier, Huntington Drive, Castle Donington 1.21 0.00 0.00 0.00 0.00 0.00 0.00 0.06 1.28
Other - Castle Donington 0.35 0.00 0.12 0.00 0.00 0.00 0.00 0.02 0.49
Co-op, Ashby Road, Ibstock 0.00 0.00 0.00 0.68 5.82 1.15 0.00 0.40 8.05
Other - Ibstock 0.00 0.00 0.00 0.00 0.07 0.00 0.00 0.00 0.08
Co-op, Market Place, Kegworth 2.97 0.06 0.00 0.00 0.00 0.00 0.00 0.16 3.19
Co-op, High Street, Measham 0.00 0.00 0.00 2.35 0.00 0.00 0.00 0.12 2.47
Tesco Express, High Street, Measham 0.00 0.00 0.16 1.78 0.00 0.00 0.00 0.10 2.05
Other North West Leicestershire
Local shops, Donisthorpe 0.00 0.00 0.00 0.21 0.00 0.00 0.00 0.01 0.22
Londis, Whitehill Road, Ellistown 0.00 0.00 0.00 0.00 0.00 0.62 0.00 0.03 0.65
McColls, Central Road, Hugglescote 0.00 0.00 0.00 0.00 0.00 1.76 0.00 0.09 1.86
Local shops, Moira 0.00 0.12 0.57 0.00 0.00 0.00 0.00 0.04 0.72
Local shops, Packington 0.00 0.00 0.00 0.00 0.22 0.00 0.00 0.01 0.24
Local shops, Ravenstone 0.00 0.00 0.00 0.00 0.05 0.00 0.00 0.00 0.05
Co-op, High Street, Swadlincote 0.00 0.00 0.00 0.09 0.00 0.00 0.00 0.00 0.10
Co-op, Shortheath Road, Swadlincote 0.00 0.00 1.50 0.59 0.00 0.00 0.00 0.11 2.20
Co-op, The Green, Thrigstone 0.00 2.33 0.00 0.00 0.00 0.00 0.19 0.13 2.65
Local shops, Long Whatton 0.26 0.00 0.00 0.00 0.00 0.00 0.00 0.01 0.27
Co-op, Market Place, Whitwick 0.00 0.81 0.00 0.00 0.00 0.21 2.24 0.17 3.42
Local shops, Whitwick 0.00 0.12 0.00 0.00 0.00 0.00 0.38 0.03 0.52
North West Leicestershire District Total 12.69 25.39 31.45 15.93 24.31 39.66 26.08 17.43 192.94
Elsewhere
Loughborough 6.98 1.04 0.12 0.00 0.05 0.53 0.63 n/a 9.35
Long Eaton 6.63 0.09 0.45 0.05 0.00 0.00 0.00 n/a 7.21
Hinckley 0.00 0.00 0.00 0.12 0.05 0.21 0.08 n/a 0.45
Lichfield 0.00 0.00 0.00 0.09 0.00 0.00 0.00 n/a 0.09
Atherston 0.12 0.00 0.00 0.07 0.00 0.00 0.00 n/a 0.19
Swadlincote 0.14 1.06 7.30 5.75 0.27 0.00 0.00 n/a 14.53
Leicester 0.06 0.35 0.00 0.02 0.00 0.53 0.38 n/a 1.34
Tamworth 0.00 0.43 0.69 0.99 0.20 0.00 0.03 n/a 2.33
Other 2.22 0.40 0.57 0.45 0.00 0.08 0.08 n/a 3.80
Elsewhere Total 16.15 3.36 9.13 7.53 0.57 1.35 1.20 n/a 39.30
TOTAL 28.84 28.75 40.58 23.46 24.88 41.01 27.28 17.43 232.24
Source: Tables 3 and 4

Retail and Leisure Capacity Study: Appendix 2: Convenience goods capacity
Table 7 - Future 2026 Convenience Goods Expenditure Patterns By Zone (£M)
Location Zone 1 Zone 2 Zone 3 Zone 4 Zone 5 Zone 6 Zone 7 Inflow Total
Expenditure 2026 29.86 29.77 42.01 24.29 25.76 42.46 28.25 222.40
Main Centres
Co-op, Derby Road, Ashby de la Zouch 0.00 0.00 5.00 0.53 0.44 0.00 0.45 0.71 7.14
Co-op, Market Street, Ashby de la Zouch 0.00 0.09 2.94 0.15 0.08 0.00 0.17 0.38 3.80
Tesco Extra, Resolution Road, Ashby de la Zouch 0.54 8.31 12.94 5.08 5.02 3.35 2.32 4.17 41.73
Aldi, Dents Road, Ashby de la Zouch 1.02 2.02 5.67 3.25 3.22 0.38 0.11 1.74 17.42
Marks & Spencer Foodhall, Smithy Road, Ashby de la Zouch 0.00 0.33 2.14 0.34 0.31 0.38 0.06 0.40 3.95
Other - Ashby de la Zouch 0.00 0.12 1.18 0.10 0.00 0.00 0.00 0.15 1.55
Asda, Ashby Road, Coalville 0.00 0.15 0.00 0.07 0.52 3.23 0.20 0.46 4.62
Co-op, Bridge Road, Coalville 0.00 0.74 0.00 0.00 0.15 3.69 0.08 0.52 5.20
Co-op, Cropston Drive, Greenhill, Coalville 0.00 0.12 0.00 0.00 0.00 0.30 0.96 0.15 1.53
Home Bargains, Belvoir Shopping Centre, Coalville 0.00 0.45 0.00 0.00 0.00 1.02 0.20 0.18 1.85
Aldi, Thornborough Road, Coalville 0.00 3.66 0.00 0.34 3.45 7.35 6.24 2.34 23.38
Co-op, Meadlow Lane, Coalville 0.00 0.15 0.00 0.00 0.00 0.72 1.19 0.23 2.29
Lidl, Thornborough Road, Coalville 0.09 1.52 0.17 0.17 1.21 2.84 2.17 0.91 9.09
Morrisons, Whitwick Road, Coalville 0.09 4.32 0.08 0.56 4.38 12.82 9.66 3.55 35.46
Other - Coalville 0.00 0.57 0.00 0.00 0.00 1.10 0.28 0.22 2.17
Co-op, Borough Street, Castle Donington 2.84 0.00 0.00 0.00 0.00 0.00 0.00 0.15 2.99
Co-op, Station Road, Castle Donington 3.61 0.21 0.00 0.00 0.00 0.00 0.00 0.20 4.02
Premier, Huntington Drive, Castle Donington 1.25 0.00 0.00 0.00 0.00 0.00 0.00 0.07 1.32
Other - Castle Donington 0.36 0.00 0.13 0.00 0.00 0.00 0.00 0.03 0.51
Co-op, Ashby Road, Ibstock 0.00 0.00 0.00 0.70 6.03 1.19 0.00 0.42 8.34
Other - Ibstock 0.00 0.00 0.00 0.00 0.08 0.00 0.00 0.00 0.08
Co-op, Market Place, Kegworth 3.08 0.06 0.00 0.00 0.00 0.00 0.00 0.17 3.30
Co-op, High Street, Measham 0.00 0.00 0.00 2.43 0.00 0.00 0.00 0.13 2.56
Tesco Express, High Street, Measham 0.00 0.00 0.17 1.85 0.00 0.00 0.00 0.11 2.12
Other North West Leicestershire
Local shops, Donisthorpe 0.00 0.00 0.00 0.22 0.00 0.00 0.00 0.01 0.23
Londis, Whitehill Road, Ellistown 0.00 0.00 0.00 0.00 0.00 0.64 0.00 0.03 0.67
McColls, Central Road, Hugglescote 0.00 0.00 0.00 0.00 0.00 1.83 0.00 0.10 1.92
Local shops, Moira 0.00 0.12 0.59 0.00 0.00 0.00 0.00 0.04 0.74
Local shops, Packington 0.00 0.00 0.00 0.00 0.23 0.00 0.00 0.01 0.24
Local shops, Ravenstone 0.00 0.00 0.00 0.00 0.05 0.00 0.00 0.00 0.05
Co-op, High Street, Swadlincote 0.00 0.00 0.00 0.10 0.00 0.00 0.00 0.01 0.10
Co-op, Shortheath Road, Swadlincote 0.00 0.00 1.55 0.61 0.00 0.00 0.00 0.11 2.28
Co-op, The Green, Thrigstone 0.00 2.41 0.00 0.00 0.00 0.00 0.20 0.14 2.75
Local shops, Long Whatton 0.27 0.00 0.00 0.00 0.00 0.00 0.00 0.01 0.28
Co-op, Market Place, Whitwick 0.00 0.83 0.00 0.00 0.00 0.21 2.32 0.18 3.54
Local shops, Whitwick 0.00 0.12 0.00 0.00 0.00 0.00 0.40 0.03 0.54
North West Leicestershire District Total 13.14 26.29 32.56 16.49 25.17 41.06 27.00 18.05 199.76
Elsewhere
Loughborough 7.23 1.07 0.13 0.00 0.05 0.55 0.65 n/a 9.68
Long Eaton 6.87 0.09 0.46 0.05 0.00 0.00 0.00 n/a 7.47
Hinckley 0.00 0.00 0.00 0.12 0.05 0.21 0.08 n/a 0.47
Lichfield 0.00 0.00 0.00 0.10 0.00 0.00 0.00 n/a 0.10
Atherston 0.12 0.00 0.00 0.07 0.00 0.00 0.00 n/a 0.19
Swadlincote 0.15 1.10 7.56 5.95 0.28 0.00 0.00 n/a 15.05
Leicester 0.06 0.36 0.00 0.02 0.00 0.55 0.40 n/a 1.39
Tamworth 0.00 0.45 0.71 1.02 0.21 0.00 0.03 n/a 2.42
Other 2.30 0.42 0.59 0.46 0.00 0.08 0.08 n/a 3.94
Elsewhere Total 16.72 3.48 9.45 7.80 0.59 1.40 1.24 n/a 40.69
TOTAL 29.86 29.77 42.01 24.29 25.76 42.46 28.25 18.05 240.45
Source: Tables 3 and 4
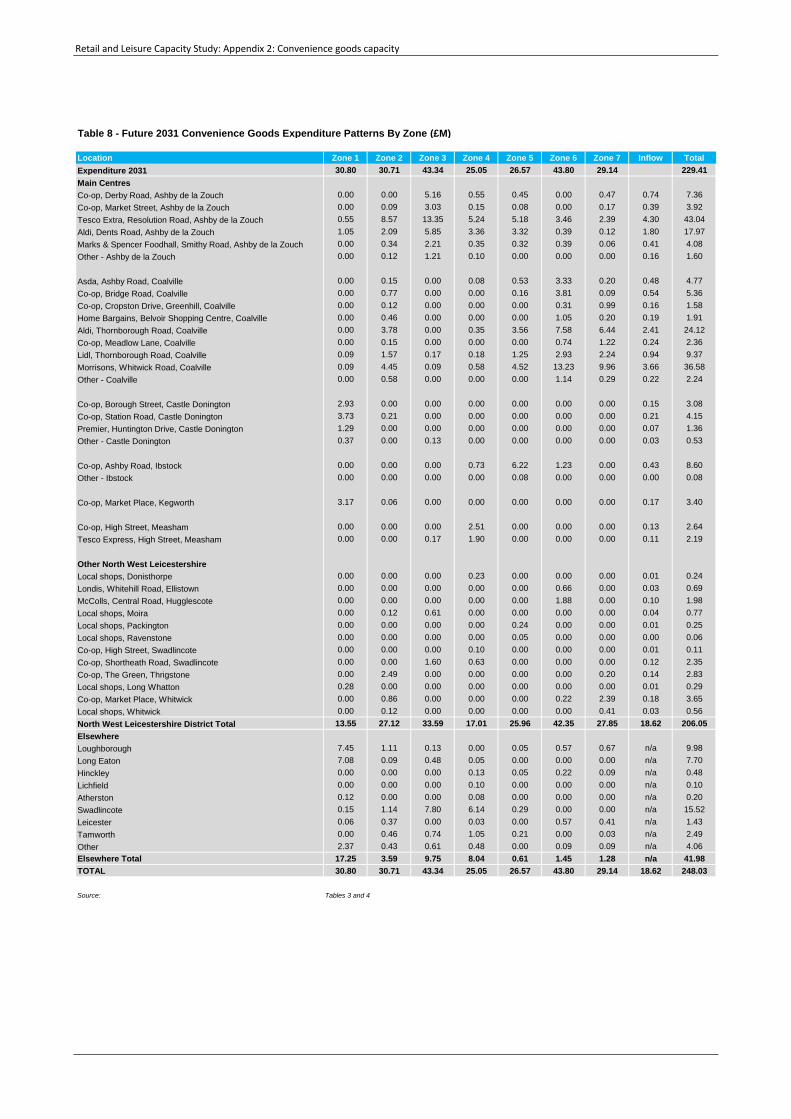
Retail and Leisure Capacity Study: Appendix 2: Convenience goods capacity
Table 8 - Future 2031 Convenience Goods Expenditure Patterns By Zone (£M)
Location Zone 1 Zone 2 Zone 3 Zone 4 Zone 5 Zone 6 Zone 7 Inflow Total
Expenditure 2031 30.80 30.71 43.34 25.05 26.57 43.80 29.14 229.41
Main Centres
Co-op, Derby Road, Ashby de la Zouch 0.00 0.00 5.16 0.55 0.45 0.00 0.47 0.74 7.36
Co-op, Market Street, Ashby de la Zouch 0.00 0.09 3.03 0.15 0.08 0.00 0.17 0.39 3.92
Tesco Extra, Resolution Road, Ashby de la Zouch 0.55 8.57 13.35 5.24 5.18 3.46 2.39 4.30 43.04
Aldi, Dents Road, Ashby de la Zouch 1.05 2.09 5.85 3.36 3.32 0.39 0.12 1.80 17.97
Marks & Spencer Foodhall, Smithy Road, Ashby de la Zouch 0.00 0.34 2.21 0.35 0.32 0.39 0.06 0.41 4.08
Other - Ashby de la Zouch 0.00 0.12 1.21 0.10 0.00 0.00 0.00 0.16 1.60
Asda, Ashby Road, Coalville 0.00 0.15 0.00 0.08 0.53 3.33 0.20 0.48 4.77
Co-op, Bridge Road, Coalville 0.00 0.77 0.00 0.00 0.16 3.81 0.09 0.54 5.36
Co-op, Cropston Drive, Greenhill, Coalville 0.00 0.12 0.00 0.00 0.00 0.31 0.99 0.16 1.58
Home Bargains, Belvoir Shopping Centre, Coalville 0.00 0.46 0.00 0.00 0.00 1.05 0.20 0.19 1.91
Aldi, Thornborough Road, Coalville 0.00 3.78 0.00 0.35 3.56 7.58 6.44 2.41 24.12
Co-op, Meadlow Lane, Coalville 0.00 0.15 0.00 0.00 0.00 0.74 1.22 0.24 2.36
Lidl, Thornborough Road, Coalville 0.09 1.57 0.17 0.18 1.25 2.93 2.24 0.94 9.37
Morrisons, Whitwick Road, Coalville 0.09 4.45 0.09 0.58 4.52 13.23 9.96 3.66 36.58
Other - Coalville 0.00 0.58 0.00 0.00 0.00 1.14 0.29 0.22 2.24
Co-op, Borough Street, Castle Donington 2.93 0.00 0.00 0.00 0.00 0.00 0.00 0.15 3.08
Co-op, Station Road, Castle Donington 3.73 0.21 0.00 0.00 0.00 0.00 0.00 0.21 4.15
Premier, Huntington Drive, Castle Donington 1.29 0.00 0.00 0.00 0.00 0.00 0.00 0.07 1.36
Other - Castle Donington 0.37 0.00 0.13 0.00 0.00 0.00 0.00 0.03 0.53
Co-op, Ashby Road, Ibstock 0.00 0.00 0.00 0.73 6.22 1.23 0.00 0.43 8.60
Other - Ibstock 0.00 0.00 0.00 0.00 0.08 0.00 0.00 0.00 0.08
Co-op, Market Place, Kegworth 3.17 0.06 0.00 0.00 0.00 0.00 0.00 0.17 3.40
Co-op, High Street, Measham 0.00 0.00 0.00 2.51 0.00 0.00 0.00 0.13 2.64
Tesco Express, High Street, Measham 0.00 0.00 0.17 1.90 0.00 0.00 0.00 0.11 2.19
Other North West Leicestershire
Local shops, Donisthorpe 0.00 0.00 0.00 0.23 0.00 0.00 0.00 0.01 0.24
Londis, Whitehill Road, Ellistown 0.00 0.00 0.00 0.00 0.00 0.66 0.00 0.03 0.69
McColls, Central Road, Hugglescote 0.00 0.00 0.00 0.00 0.00 1.88 0.00 0.10 1.98
Local shops, Moira 0.00 0.12 0.61 0.00 0.00 0.00 0.00 0.04 0.77
Local shops, Packington 0.00 0.00 0.00 0.00 0.24 0.00 0.00 0.01 0.25
Local shops, Ravenstone 0.00 0.00 0.00 0.00 0.05 0.00 0.00 0.00 0.06
Co-op, High Street, Swadlincote 0.00 0.00 0.00 0.10 0.00 0.00 0.00 0.01 0.11
Co-op, Shortheath Road, Swadlincote 0.00 0.00 1.60 0.63 0.00 0.00 0.00 0.12 2.35
Co-op, The Green, Thrigstone 0.00 2.49 0.00 0.00 0.00 0.00 0.20 0.14 2.83
Local shops, Long Whatton 0.28 0.00 0.00 0.00 0.00 0.00 0.00 0.01 0.29
Co-op, Market Place, Whitwick 0.00 0.86 0.00 0.00 0.00 0.22 2.39 0.18 3.65
Local shops, Whitwick 0.00 0.12 0.00 0.00 0.00 0.00 0.41 0.03 0.56
North West Leicestershire District Total 13.55 27.12 33.59 17.01 25.96 42.35 27.85 18.62 206.05
Elsewhere
Loughborough 7.45 1.11 0.13 0.00 0.05 0.57 0.67 n/a 9.98
Long Eaton 7.08 0.09 0.48 0.05 0.00 0.00 0.00 n/a 7.70
Hinckley 0.00 0.00 0.00 0.13 0.05 0.22 0.09 n/a 0.48
Lichfield 0.00 0.00 0.00 0.10 0.00 0.00 0.00 n/a 0.10
Atherston 0.12 0.00 0.00 0.08 0.00 0.00 0.00 n/a 0.20
Swadlincote 0.15 1.14 7.80 6.14 0.29 0.00 0.00 n/a 15.52
Leicester 0.06 0.37 0.00 0.03 0.00 0.57 0.41 n/a 1.43
Tamworth 0.00 0.46 0.74 1.05 0.21 0.00 0.03 n/a 2.49
Other 2.37 0.43 0.61 0.48 0.00 0.09 0.09 n/a 4.06
Elsewhere Total 17.25 3.59 9.75 8.04 0.61 1.45 1.28 n/a 41.98
TOTAL 30.80 30.71 43.34 25.05 26.57 43.80 29.14 18.62 248.03
Source: Tables 3 and 4

Retail and Leisure Capacity Study: Appendix 2: Convenience goods capacity
Table 9 - Future 2036 Convenience Goods Expenditure Patterns By Zone (£M)
Location Zone 1 Zone 2 Zone 3 Zone 4 Zone 5 Zone 6 Zone 7 Inflow Total
Expenditure 2036 31.74 31.64 44.65 25.81 27.38 45.13 30.02 236.36
Main Centres
Co-op, Derby Road, Ashby de la Zouch 0.00 0.00 5.31 0.57 0.47 0.00 0.48 0.76 7.59
Co-op, Market Street, Ashby de la Zouch 0.00 0.09 3.13 0.15 0.08 0.00 0.18 0.40 4.04
Tesco Extra, Resolution Road, Ashby de la Zouch 0.57 8.83 13.75 5.39 5.34 3.56 2.46 4.43 44.35
Aldi, Dents Road, Ashby de la Zouch 1.08 2.15 6.03 3.46 3.42 0.41 0.12 1.85 18.52
Marks & Spencer Foodhall, Smithy Road, Ashby de la Zouch 0.00 0.35 2.28 0.36 0.33 0.41 0.06 0.42 4.20
Other - Ashby de la Zouch 0.00 0.13 1.25 0.10 0.00 0.00 0.00 0.16 1.64
Asda, Ashby Road, Coalville 0.00 0.16 0.00 0.08 0.55 3.43 0.21 0.49 4.91
Co-op, Bridge Road, Coalville 0.00 0.79 0.00 0.00 0.16 3.93 0.09 0.55 5.52
Co-op, Cropston Drive, Greenhill, Coalville 0.00 0.13 0.00 0.00 0.00 0.32 1.02 0.16 1.63
Home Bargains, Belvoir Shopping Centre, Coalville 0.00 0.47 0.00 0.00 0.00 1.08 0.21 0.20 1.96
Aldi, Thornborough Road, Coalville 0.00 3.89 0.00 0.36 3.67 7.81 6.63 2.48 24.85
Co-op, Meadlow Lane, Coalville 0.00 0.16 0.00 0.00 0.00 0.77 1.26 0.24 2.43
Lidl, Thornborough Road, Coalville 0.10 1.61 0.18 0.18 1.29 3.02 2.31 0.97 9.66
Morrisons, Whitwick Road, Coalville 0.10 4.59 0.09 0.59 4.65 13.63 10.27 3.77 37.68
Other - Coalville 0.00 0.60 0.00 0.00 0.00 1.17 0.30 0.23 2.31
Co-op, Borough Street, Castle Donington 3.02 0.00 0.00 0.00 0.00 0.00 0.00 0.16 3.17
Co-op, Station Road, Castle Donington 3.84 0.22 0.00 0.00 0.00 0.00 0.00 0.21 4.28
Premier, Huntington Drive, Castle Donington 1.33 0.00 0.00 0.00 0.00 0.00 0.00 0.07 1.40
Other - Castle Donington 0.38 0.00 0.13 0.00 0.00 0.00 0.00 0.03 0.54
Co-op, Ashby Road, Ibstock 0.00 0.00 0.00 0.75 6.41 1.26 0.00 0.44 8.86
Other - Ibstock 0.00 0.00 0.00 0.00 0.08 0.00 0.00 0.00 0.09
Co-op, Market Place, Kegworth 3.27 0.06 0.00 0.00 0.00 0.00 0.00 0.18 3.51
Co-op, High Street, Measham 0.00 0.00 0.00 2.58 0.00 0.00 0.00 0.14 2.72
Tesco Express, High Street, Measham 0.00 0.00 0.18 1.96 0.00 0.00 0.00 0.11 2.25
Other North West Leicestershire
Local shops, Donisthorpe 0.00 0.00 0.00 0.23 0.00 0.00 0.00 0.01 0.24
Londis, Whitehill Road, Ellistown 0.00 0.00 0.00 0.00 0.00 0.68 0.00 0.04 0.71
McColls, Central Road, Hugglescote 0.00 0.00 0.00 0.00 0.00 1.94 0.00 0.10 2.04
Local shops, Moira 0.00 0.13 0.63 0.00 0.00 0.00 0.00 0.04 0.79
Local shops, Packington 0.00 0.00 0.00 0.00 0.25 0.00 0.00 0.01 0.26
Local shops, Ravenstone 0.00 0.00 0.00 0.00 0.05 0.00 0.00 0.00 0.06
Co-op, High Street, Swadlincote 0.00 0.00 0.00 0.10 0.00 0.00 0.00 0.01 0.11
Co-op, Shortheath Road, Swadlincote 0.00 0.00 1.65 0.65 0.00 0.00 0.00 0.12 2.42
Co-op, The Green, Thrigstone 0.00 2.56 0.00 0.00 0.00 0.00 0.21 0.15 2.92
Local shops, Long Whatton 0.29 0.00 0.00 0.00 0.00 0.00 0.00 0.02 0.30
Co-op, Market Place, Whitwick 0.00 0.89 0.00 0.00 0.00 0.23 2.46 0.19 3.76
Local shops, Whitwick 0.00 0.13 0.00 0.00 0.00 0.00 0.42 0.03 0.58
North West Leicestershire District Total 13.96 27.94 34.60 17.53 26.75 43.64 28.70 19.18 212.30
Elsewhere
Loughborough 7.68 1.14 0.13 0.00 0.05 0.59 0.69 n/a 10.29
Long Eaton 7.30 0.09 0.49 0.05 0.00 0.00 0.00 n/a 7.94
Hinckley 0.00 0.00 0.00 0.13 0.05 0.23 0.09 n/a 0.50
Lichfield 0.00 0.00 0.00 0.10 0.00 0.00 0.00 n/a 0.10
Atherston 0.13 0.00 0.00 0.08 0.00 0.00 0.00 n/a 0.20
Swadlincote 0.16 1.17 8.04 6.32 0.30 0.00 0.00 n/a 15.99
Leicester 0.06 0.38 0.00 0.03 0.00 0.59 0.42 n/a 1.48
Tamworth 0.00 0.47 0.76 1.08 0.22 0.00 0.03 n/a 2.57
Other 2.44 0.44 0.63 0.49 0.00 0.09 0.09 n/a 4.18
Elsewhere Total 17.77 3.70 10.05 8.29 0.63 1.49 1.32 n/a 43.25
TOTAL 31.74 31.64 44.65 25.81 27.38 45.13 30.02 19.18 255.54
Source: Tables 3 and 4

Retail and Leisure Capacity Study: Appendix 2: Convenience goods capacity
Table 10 - Convenience Goods Floorspace in North West Leicestershire Main Settlements and Stores (2016 prices)
Store/AreaSales Floorspace
(sq.m net)
Convenience Goods
Floorspace (%)
Convenience Goods
Floorspace (sq.m net)
Turnover
(£ per sq.m)
Total Turnover
(£m)
Co-op, Derby Road, Ashby-de-la-Zouch 1,168 85% 993 £10,298 £10.22
Co-op, Market Street, Ashby-de-la-Zouch 143 95% 136 £10,298 £1.40
Aldi, Dents Road, Ashby-de-la-Zouch 852 85% 724 £11,145 £8.07
Marks & Spencer Foodhall, Ashby de la Zouch 781 95% 742 £11,283 £8.37
Tesco Extra, Resolution Road, Ashby-de-la-Zouch 6,919 60% 4,151 £12,221 £50.73
Other - Ashby de la Zouch 750 95% 713 £6,000 £4.28
Ashby-de-la-Zouch Total 10,613 7,459 £83.07
Asda, Ashby Road, Coalville 805 90% 725 £13,317 £9.65
Co-op, Bridge Road, Coalville 51 95% 48 £10,298 £0.50
Co-op, Cropston Drive, Greenhill, Coalville 268 95% 255 £10,298 £2.62
Home Bargains, Belvoir Shopping Centre, Coalville 984 30% 295 £8,000 £2.36
Iceland, Bridge Road, Coalville 229 98% 224 £6,451 £1.45
Aldi, Thornborough Road, Coalville 1,096 85% 932 £11,145 £10.38
Co-op, Meadow Lane, Coalville 170 95% 162 £10,298 £1.66
Lidl, Thornborough Road, Coalville 1,125 85% 956 £8,661 £8.28
Morrisons, Whitwick Road, Coalville 4,118 70% 2,883 £12,369 £35.65
Spar, London Road, Coalville 200 95% 190 £8,000 £1.52
Other - Coalville 750 95% 713 £6,000 £4.28
Coalville Total 9,796 7,382 £78.36
Co-op, Borough Street, Castle Donington 71 95% 67 £10,298 £0.69
Co-op, Station Road, Castle Donington 1,117 85% 949 £10,298 £9.78
Premier, Huntington Drive, Castle Donington 200 95% 190 £8,000 £1.52
Other - Castle Donington 60 95% 57 £6,000 £0.34
Castle Donington Total 1,448 1,264 £12.33
Co-op, Ashby Road, Ibstock 929 85% 790 £10,298 £8.13
Other - Ibstock 120 95% 114 £6,000 £0.68
Ibstock Total 1,049 904 £8.82
Co-op, Market Place, Kegworth 315 95% 299 £10,298 £3.08
Other - Kegworth 30 95% 29 £6,000 £0.17
Kegworth Total 345 328 £3.25
Co-op, High Street, Measham 254 95% 241 £10,298 £2.48
Tesco Express, High Street, Measham 255 95% 242 £12,221 £2.96
Other - Measham 120 95% 114 £6,000 £0.68
Measham Total 629 598 £6.13
Co-op, High Street, Swadlincote 174 95% 165 £10,298 £1.70
Co-op, Shortheath Road, Swadlincote 315 95% 299 £10,298 £3.08
Co-op, The Green, Thrigstone 245 95% 233 £10,298 £2.40
Londis, Whitehill Road, Ellistown 200 95% 190 £8,000 £1.52
McColls, Central Road, Hugglescote 131 95% 124 £8,000 £1.00
Co-op, Market Place, Whitwick 332 95% 315 £10,298 £3.25
Other Total 1,397 1,327 £12.94
Total 25,277 - 19,260 - £204.91
Source: Experian Goad Plan May 2017, VOA and ORC Storepoint 2018 and Global Data 2017
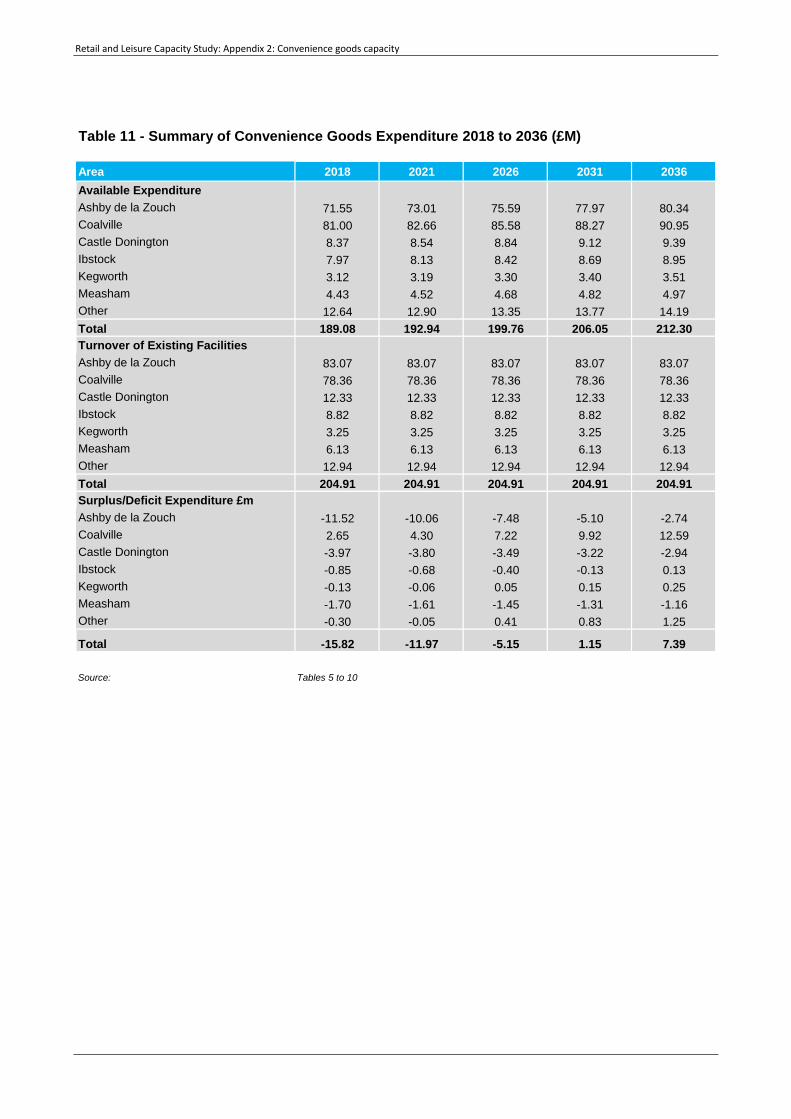
Retail and Leisure Capacity Study: Appendix 2: Convenience goods capacity
Table 11 - Summary of Convenience Goods Expenditure 2018 to 2036 (£M)
Area 2018 2021 2026 2031 2036
Available Expenditure
Ashby de la Zouch 71.55 73.01 75.59 77.97 80.34
Coalville 81.00 82.66 85.58 88.27 90.95
Castle Donington 8.37 8.54 8.84 9.12 9.39
Ibstock 7.97 8.13 8.42 8.69 8.95
Kegworth 3.12 3.19 3.30 3.40 3.51
Measham 4.43 4.52 4.68 4.82 4.97
Other 12.64 12.90 13.35 13.77 14.19
Total 189.08 192.94 199.76 206.05 212.30
Turnover of Existing Facilities
Ashby de la Zouch 83.07 83.07 83.07 83.07 83.07
Coalville 78.36 78.36 78.36 78.36 78.36
Castle Donington 12.33 12.33 12.33 12.33 12.33
Ibstock 8.82 8.82 8.82 8.82 8.82
Kegworth 3.25 3.25 3.25 3.25 3.25
Measham 6.13 6.13 6.13 6.13 6.13
Other 12.94 12.94 12.94 12.94 12.94
Total 204.91 204.91 204.91 204.91 204.91
Surplus/Deficit Expenditure £m
Ashby de la Zouch -11.52 -10.06 -7.48 -5.10 -2.74
Coalville 2.65 4.30 7.22 9.92 12.59
Castle Donington -3.97 -3.80 -3.49 -3.22 -2.94
Ibstock -0.85 -0.68 -0.40 -0.13 0.13
Kegworth -0.13 -0.06 0.05 0.15 0.25
Measham -1.70 -1.61 -1.45 -1.31 -1.16
Other -0.30 -0.05 0.41 0.83 1.25
Total -15.82 -11.97 -5.15 1.15 7.39
Source: Tables 5 to 10

Retail and Leisure Capacity Study: Appendix 2: Convenience goods capacity
Table 12 - Convenience Goods Floorspace Capacity
Area 2021 2026 2031 2036
Turnover Density New Floorspace (£ per sq.m) £11,000 £11,000 £11,000 £11,000
Sales Floorspace Projection (sq.m net)
Ashby de la Zouch -915 -680 -464 -249
Coalville 391 656 902 1,145
Castle Donington -345 -318 -292 -267
Ibstock -62 -36 -12 12
Kegworth -6 4 14 23
Measham -147 -132 -119 -105
Other -4 37 75 113
Total -1,088 -468 104 672
Floorspace Projection (sq.m gross)
Ashby de la Zouch -1,307 -972 -662 -356
Coalville 558 938 1,288 1,635
Castle Donington -493 -454 -418 -382
Ibstock -89 -51 -17 17
Kegworth -8 6 20 33
Measham -209 -189 -170 -151
Other -6 53 108 162
Total -1,554 -669 149 960
Source: Table 11


Appendix 3: Comparison goods capacity

Retail and Leisure Capacity Study: Appendix 3: Comparison goods capacity
Table 1 - Study Area Population
Zone 2016 2018 2021 2026 2031 2036
Zone 1 - Castle Donington & Kegworth 12,882 13,097 13,434 13,941 14,384 14,777
Zone 2 - North of Coalville 11,987 12,187 12,501 12,972 13,385 13,750
Zone 3 - Ashby de la Zouch 18,714 19,027 19,516 20,252 20,896 21,467
Zone 4 - Measham 10,385 10,559 10,830 11,239 11,596 11,913
Zone 5 - Ibstock 11,173 11,360 11,652 12,091 12,476 12,816
Zone 6 - Coalville 20,136 20,472 20,999 21,791 22,484 23,098
Zone 7 - Whitwick 12,895 13,110 13,447 13,955 14,398 14,792
Total 98,172 99,813 102,378 106,241 109,618 112,613
Sources:
Experian 2016
North West Leicestershire District - Office of National Statistics 2014 SNPP projections
Table 2 - Comparison Goods Expenditure per person per annum (£)
Zone 2018 2021 2026 2031 2036
Zone 1 - Castle Donington & Kegworth 3,352 3,581 4,161 4,853 5,667
Zone 2 - North of Coalville 3,477 3,714 4,316 5,034 5,879
Zone 3 - Ashby de la Zouch 3,248 3,469 4,031 4,702 5,490
Zone 4 - Measham 3,131 3,344 3,886 4,532 5,292
Zone 5 - Ibstock 3,186 3,403 3,955 4,613 5,386
Zone 6 - Coalville 2,823 3,016 3,505 4,087 4,773
Zone 7 - Whitwick 2,788 2,978 3,460 4,036 4,713
Sources:
Experian Local Expenditure 2016 (2016 prices)
Growth Rates: 0.9% in 2018, 2.1% in 2019 and 3.2% beyond 2019
Excludes Special Forms of Trading based on Experian adjusted national average for non-retail businesses
Table 3 - Total Comparison Goods Expenditure (£m)
Zone 2018 2021 2026 2031 2036
Zone 1 - Castle Donington & Kegworth 43.90 48.10 58.01 69.81 83.74
Zone 2 - North of Coalville 42.38 46.43 55.99 67.38 80.83
Zone 3 - Ashby de la Zouch 61.79 67.70 81.64 98.25 117.86
Zone 4 - Measham 33.05 36.21 43.67 52.55 63.04
Zone 5 - Ibstock 36.19 39.65 47.82 57.55 69.03
Zone 6 - Coalville 57.80 63.32 76.37 91.90 110.25
Zone 7 - Whitwick 36.55 40.04 48.29 58.11 69.71
Study Area Total 311.68 341.46 411.79 495.55 594.47
Source: Tables 1 and 2

Retail and Leisure Capacity Study: Appendix 3: Comparison goods capacity
Table 4 - Base Year 2018 Comparison Goods Market Shares by Zone (%)
Location Zone 1 Zone 2 Zone 3 Zone 4 Zone 5 Zone 6 Zone 7 Inflow
Main Centres
Ashby de la Zouch 1.5% 16.0% 39.5% 18.6% 15.3% 5.3% 4.2% 10.0%
Coalville 0.0% 13.9% 1.7% 3.5% 16.9% 33.3% 25.7% 10.0%
Castle Donington 11.7% 0.7% 0.2% 0.0% 0.0% 0.0% 0.2% 5.0%
Ibstock 0.0% 0.6% 0.3% 0.9% 8.1% 1.1% 0.5% 5.0%
Kegworth 2.5% 0.1% 0.0% 0.0% 0.0% 0.0% 0.0% 5.0%
Measham 0.0% 0.0% 0.8% 6.0% 1.1% 0.9% 0.5% 5.0%
Other North West Leicestershire
Hugglescote 0.0% 0.0% 0.0% 0.0% 0.1% 0.3% 0.1% 5.0%
Isley Walton 0.0% 0.0% 0.0% 0.0% 0.0% 0.0% 0.0% 5.0%
Long Whatton 0.6% 0.0% 0.0% 0.0% 0.0% 0.0% 0.0% 5.0%
Moira 0.0% 0.0% 0.0% 0.0% 0.2% 0.1% 0.0% 5.0%
Packington 0.0% 0.0% 0.0% 0.0% 0.0% 0.0% 0.0% 5.0%
Ravenstone 0.0% 0.1% 0.0% 0.0% 0.1% 0.0% 0.0% 5.0%
Thrigstone 0.0% 0.1% 0.0% 0.0% 0.0% 0.0% 0.0% 5.0%
Whitwick 0.0% 0.9% 0.0% 0.0% 0.0% 0.2% 1.8% 5.0%
North West Leicestershire District Total 16.3% 32.4% 42.5% 29.0% 41.8% 41.2% 33.0% n/a
Elsewhere
Burton-on-Trent 0.4% 1.6% 8.8% 14.2% 3.4% 2.2% 1.7% n/a
Derby 21.9% 9.3% 4.4% 3.9% 2.9% 0.3% 0.2% n/a
Leicester 1.8% 12.1% 6.6% 5.7% 23.7% 20.0% 17.5% n/a
Fosse Shopping Park, Leicester 1.1% 11.6% 2.2% 2.1% 7.8% 11.8% 13.6% n/a
Loughborough 23.2% 17.2% 1.9% 0.5% 7.1% 12.0% 22.9% n/a
Nottingham 12.1% 2.3% 5.2% 1.6% 1.3% 1.4% 0.7% n/a
Tamworth Town Centre 0.0% 3.0% 13.2% 23.9% 6.1% 1.9% 1.0% n/a
Other 23.2% 10.5% 15.2% 19.1% 5.9% 9.2% 9.4% n/a
Elsewhere Total 83.7% 67.6% 57.5% 71.0% 58.2% 58.8% 67.0% n/a
TOTAL 100.0% 100.0% 100.0% 100.0% 100.0% 100.0% 100.0% n/a
Source: NEMS Household Survey July 2018 (weighted results)

Retail and Leisure Capacity Study: Appendix 3: Comparison goods capacity
Table 5 - Base Year 2018 Comparison Goods Expenditure Patterns (£M)
Location Zone 1 Zone 2 Zone 3 Zone 4 Zone 5 Zone 6 Zone 7 Inflow Total
Expenditure 2018 43.90 42.38 61.79 33.05 36.19 57.80 36.55 311.68
Main Centres
Ashby de la Zouch 0.66 6.78 24.41 6.15 5.54 3.06 1.54 5.35 53.48
Coalville 0.00 5.89 1.05 1.16 6.12 19.25 9.39 4.76 47.62
Castle Donington 5.14 0.30 0.12 0.00 0.00 0.00 0.07 0.30 5.93
Ibstock 0.00 0.25 0.19 0.30 2.93 0.64 0.18 0.24 4.72
Kegworth 1.10 0.04 0.00 0.00 0.00 0.00 0.00 0.06 1.20
Measham 0.00 0.00 0.49 1.98 0.40 0.52 0.18 0.19 3.77
Other North West Leicestershire
Hugglescote 0.00 0.00 0.00 0.00 0.04 0.17 0.04 0.01 0.26
Isley Walton 0.00 0.00 0.00 0.00 0.00 0.00 0.00 0.00 0.00
Long Whatton 0.26 0.00 0.00 0.00 0.00 0.00 0.00 0.01 0.28
Moira 0.00 0.00 0.00 0.00 0.07 0.06 0.00 0.01 0.14
Packington 0.00 0.00 0.00 0.00 0.00 0.00 0.00 0.00 0.00
Ravenstone 0.00 0.04 0.00 0.00 0.04 0.00 0.00 0.00 0.08
Thrigstone 0.00 0.04 0.00 0.00 0.00 0.00 0.00 0.00 0.04
Whitwick 0.00 0.38 0.00 0.00 0.00 0.12 0.66 0.06 1.22
North West Leicestershire Total 7.16 13.73 26.26 9.59 15.13 23.81 12.06 10.99 118.73
Elsewhere
Burton-on-Trent 0.18 0.68 5.44 4.69 1.23 1.27 0.62 n/a 14.11
Derby 9.62 3.94 2.72 1.29 1.05 0.17 0.07 n/a 18.86
Leicester 0.79 5.13 4.08 1.88 8.58 11.56 6.40 n/a 38.42
Fosse Shopping Park, Leicester 0.48 4.92 1.36 0.69 2.82 6.82 4.97 n/a 22.07
Loughborough 10.19 7.29 1.17 0.17 2.57 6.94 8.37 n/a 36.69
Nottingham 5.31 0.97 3.21 0.53 0.47 0.81 0.26 n/a 11.56
Tamworth Town Centre 0.00 1.27 8.16 7.90 2.21 1.10 0.37 n/a 21.00
Other 10.19 4.45 9.39 6.31 2.14 5.32 3.44 n/a 41.23
Other Total 36.75 28.65 35.53 23.47 21.06 33.99 24.49 n/a 203.94
TOTAL 43.90 42.38 61.79 33.05 36.19 57.80 36.55 10.99 322.67
Source: Tables 3 and 4

Retail and Leisure Capacity Study: Appendix 3: Comparison goods capacity
Table 6 - 2021 Comparison Goods Expenditure Patterns (£M)
Location Zone 1 Zone 2 Zone 3 Zone 4 Zone 5 Zone 6 Zone 7 Inflow Total
Expenditure 2021 48.10 46.43 67.70 36.21 39.65 63.32 40.04 341.46
Main Centres
Ashby de la Zouch 0.72 7.43 26.74 6.74 6.07 3.36 1.68 5.86 58.59
Coalville 0.00 6.45 1.15 1.27 6.70 21.09 10.29 5.22 52.17
Castle Donington 5.63 0.33 0.14 0.00 0.00 0.00 0.08 0.32 6.49
Ibstock 0.00 0.28 0.20 0.33 3.21 0.70 0.20 0.26 5.17
Kegworth 1.20 0.05 0.00 0.00 0.00 0.00 0.00 0.07 1.31
Measham 0.00 0.00 0.54 2.17 0.44 0.57 0.20 0.21 4.13
Other North West Leicestershire
Hugglescote 0.00 0.00 0.00 0.00 0.04 0.19 0.04 0.01 0.28
Isley Walton 0.00 0.00 0.00 0.00 0.00 0.00 0.00 0.00 0.00
Long Whatton 0.29 0.00 0.00 0.00 0.00 0.00 0.00 0.02 0.30
Moira 0.00 0.00 0.00 0.00 0.08 0.06 0.00 0.01 0.15
Packington 0.00 0.00 0.00 0.00 0.00 0.00 0.00 0.00 0.00
Ravenstone 0.00 0.05 0.00 0.00 0.04 0.00 0.00 0.00 0.09
Thrigstone 0.00 0.05 0.00 0.00 0.00 0.00 0.00 0.00 0.05
Whitwick 0.00 0.42 0.00 0.00 0.00 0.13 0.72 0.07 1.33
North West Leicestershire Total 7.84 15.04 28.77 10.50 16.57 26.09 13.21 12.04 130.08
Elsewhere
Burton-on-Trent 0.19 0.74 5.96 5.14 1.35 1.39 0.68 n/a 15.46
Derby 10.53 4.32 2.98 1.41 1.15 0.19 0.08 n/a 20.66
Leicester 0.87 5.62 4.47 2.06 9.40 12.66 7.01 n/a 42.09
Fosse Shopping Park, Leicester 0.53 5.39 1.49 0.76 3.09 7.47 5.45 n/a 24.18
Loughborough 11.16 7.99 1.29 0.18 2.82 7.60 9.17 n/a 40.20
Nottingham 5.82 1.07 3.52 0.58 0.52 0.89 0.28 n/a 12.67
Tamworth Town Centre 0.00 1.39 8.94 8.65 2.42 1.20 0.40 n/a 23.01
Other 11.16 4.88 10.29 6.92 2.34 5.83 3.76 n/a 45.17
Other Total 40.26 31.39 38.93 25.71 23.08 37.23 26.83 n/a 223.43
TOTAL 48.10 46.43 67.70 36.21 39.65 63.32 40.04 12.04 353.50
Source: Tables 3 and 4

Retail and Leisure Capacity Study: Appendix 3: Comparison goods capacity
Table 7 - 2026 Comparison Goods Expenditure Patterns (£M)
Location Zone 1 Zone 2 Zone 3 Zone 4 Zone 5 Zone 6 Zone 7 Inflow Total
Expenditure 2026 58.01 55.99 81.64 43.67 47.82 76.37 48.29 411.79
Main Centres
Ashby de la Zouch 0.87 8.96 32.25 8.12 7.32 4.05 2.03 7.07 70.66
Coalville 0.00 7.78 1.39 1.53 8.08 25.43 12.41 6.29 62.91
Castle Donington 6.79 0.39 0.16 0.00 0.00 0.00 0.10 0.39 7.83
Ibstock 0.00 0.34 0.24 0.39 3.87 0.84 0.24 0.31 6.24
Kegworth 1.45 0.06 0.00 0.00 0.00 0.00 0.00 0.08 1.59
Measham 0.00 0.00 0.65 2.62 0.53 0.69 0.24 0.25 4.98
Other North West Leicestershire
Hugglescote 0.00 0.00 0.00 0.00 0.05 0.23 0.05 0.02 0.34
Isley Walton 0.00 0.00 0.00 0.00 0.00 0.00 0.00 0.00 0.00
Long Whatton 0.35 0.00 0.00 0.00 0.00 0.00 0.00 0.02 0.37
Moira 0.00 0.00 0.00 0.00 0.10 0.08 0.00 0.01 0.18
Packington 0.00 0.00 0.00 0.00 0.00 0.00 0.00 0.00 0.00
Ravenstone 0.00 0.06 0.00 0.00 0.05 0.00 0.00 0.01 0.11
Thrigstone 0.00 0.06 0.00 0.00 0.00 0.00 0.00 0.00 0.06
Whitwick 0.00 0.50 0.00 0.00 0.00 0.15 0.87 0.08 1.61
North West Leicestershire Total 9.46 18.14 34.70 12.66 19.99 31.46 15.94 14.52 156.87
Elsewhere
Burton-on-Trent 0.23 0.90 7.18 6.20 1.63 1.68 0.82 n/a 18.64
Derby 12.70 5.21 3.59 1.70 1.39 0.23 0.10 n/a 24.92
Leicester 1.04 6.78 5.39 2.49 11.33 15.27 8.45 n/a 50.75
Fosse Shopping Park, Leicester 0.64 6.50 1.80 0.92 3.73 9.01 6.57 n/a 29.16
Loughborough 13.46 9.63 1.55 0.22 3.40 9.16 11.06 n/a 48.48
Nottingham 7.02 1.29 4.25 0.70 0.62 1.07 0.34 n/a 15.28
Tamworth Town Centre 0.00 1.68 10.78 10.44 2.92 1.45 0.48 n/a 27.74
Other 13.46 5.88 12.41 8.34 2.82 7.03 4.54 n/a 54.47
Other Total 48.55 37.85 46.94 31.01 27.83 44.90 32.35 n/a 269.44
TOTAL 58.01 55.99 81.64 43.67 47.82 76.37 48.29 14.52 426.32
Source: Tables 3 and 4

Retail and Leisure Capacity Study: Appendix 3: Comparison goods capacity
Table 8 - 2031 Comparison Goods Expenditure Patterns (£M)
Location Zone 1 Zone 2 Zone 3 Zone 4 Zone 5 Zone 6 Zone 7 Inflow Total
Expenditure 2031 69.81 67.38 98.25 52.55 57.55 91.90 58.11 495.55
Main Centres
Ashby de la Zouch 1.05 10.78 38.81 9.77 8.80 4.87 2.44 8.50 85.03
Coalville 0.00 9.37 1.67 1.84 9.73 30.60 14.93 7.57 75.71
Castle Donington 8.17 0.47 0.20 0.00 0.00 0.00 0.12 0.47 9.42
Ibstock 0.00 0.40 0.29 0.47 4.66 1.01 0.29 0.38 7.51
Kegworth 1.75 0.07 0.00 0.00 0.00 0.00 0.00 0.10 1.91
Measham 0.00 0.00 0.79 3.15 0.63 0.83 0.29 0.30 5.99
Other North West Leicestershire
Hugglescote 0.00 0.00 0.00 0.00 0.06 0.28 0.06 0.02 0.41
Isley Walton 0.00 0.00 0.00 0.00 0.00 0.00 0.00 0.00 0.00
Long Whatton 0.42 0.00 0.00 0.00 0.00 0.00 0.00 0.02 0.44
Moira 0.00 0.00 0.00 0.00 0.12 0.09 0.00 0.01 0.22
Packington 0.00 0.00 0.00 0.00 0.00 0.00 0.00 0.00 0.00
Ravenstone 0.00 0.07 0.00 0.00 0.06 0.00 0.00 0.01 0.13
Thrigstone 0.00 0.07 0.00 0.00 0.00 0.00 0.00 0.00 0.07
Whitwick 0.00 0.61 0.00 0.00 0.00 0.18 1.05 0.10 1.93
North West Leicestershire Total 11.38 21.83 41.76 15.24 24.05 37.86 19.18 17.48 188.78
Elsewhere
Burton-on-Trent 0.28 1.08 8.65 7.46 1.96 2.02 0.99 n/a 22.43
Derby 15.29 6.27 4.32 2.05 1.67 0.28 0.12 n/a 29.99
Leicester 1.26 8.15 6.48 3.00 13.64 18.38 10.17 n/a 61.08
Fosse Shopping Park, Leicester 0.77 7.82 2.16 1.10 4.49 10.84 7.90 n/a 35.09
Loughborough 16.19 11.59 1.87 0.26 4.09 11.03 13.31 n/a 58.34
Nottingham 8.45 1.55 5.11 0.84 0.75 1.29 0.41 n/a 18.39
Tamworth Town Centre 0.00 2.02 12.97 12.56 3.51 1.75 0.58 n/a 33.39
Other 16.19 7.08 14.93 10.04 3.40 8.45 5.46 n/a 65.55
Other Total 58.43 45.55 56.49 37.31 33.49 54.04 38.93 n/a 324.25
TOTAL 69.81 67.38 98.25 52.55 57.55 91.90 58.11 17.48 513.02
Source: Tables 3 and 4

Retail and Leisure Capacity Study: Appendix 3: Comparison goods capacity
Table 9 - 2036 Comparison Goods Expenditure Patterns (£M)
Location Zone 1 Zone 2 Zone 3 Zone 4 Zone 5 Zone 6 Zone 7 Inflow Total
Expenditure 2036 83.74 80.83 117.86 63.04 69.03 110.25 69.71 594.47
Main Centres
Ashby de la Zouch 1.26 12.93 46.55 11.73 10.56 5.84 2.93 10.20 102.00
Coalville 0.00 11.24 2.00 2.21 11.67 36.71 17.92 9.08 90.82
Castle Donington 9.80 0.57 0.24 0.00 0.00 0.00 0.14 0.57 11.30
Ibstock 0.00 0.49 0.35 0.57 5.59 1.21 0.35 0.45 9.01
Kegworth 2.09 0.08 0.00 0.00 0.00 0.00 0.00 0.11 2.29
Measham 0.00 0.00 0.94 3.78 0.76 0.99 0.35 0.36 7.18
Other North West Leicestershire
Hugglescote 0.00 0.00 0.00 0.00 0.07 0.33 0.07 0.02 0.49
Isley Walton 0.00 0.00 0.00 0.00 0.00 0.00 0.00 0.00 0.00
Long Whatton 0.50 0.00 0.00 0.00 0.00 0.00 0.00 0.03 0.53
Moira 0.00 0.00 0.00 0.00 0.14 0.11 0.00 0.01 0.26
Packington 0.00 0.00 0.00 0.00 0.00 0.00 0.00 0.00 0.00
Ravenstone 0.00 0.08 0.00 0.00 0.07 0.00 0.00 0.01 0.16
Thrigstone 0.00 0.08 0.00 0.00 0.00 0.00 0.00 0.00 0.09
Whitwick 0.00 0.73 0.00 0.00 0.00 0.22 1.25 0.12 2.32
North West Leicestershire Total 13.65 26.19 50.09 18.28 28.86 45.42 23.00 20.96 226.46
Elsewhere
Burton-on-Trent 0.33 1.29 10.37 8.95 2.35 2.43 1.19 n/a 26.91
Derby 18.34 7.52 5.19 2.46 2.00 0.33 0.14 n/a 35.97
Leicester 1.51 9.78 7.78 3.59 16.36 22.05 12.20 n/a 73.27
Fosse Shopping Park, Leicester 0.92 9.38 2.59 1.32 5.38 13.01 9.48 n/a 42.09
Loughborough 19.43 13.90 2.24 0.32 4.90 13.23 15.96 n/a 69.98
Nottingham 10.13 1.86 6.13 1.01 0.90 1.54 0.49 n/a 22.06
Tamworth Town Centre 0.00 2.43 15.56 15.07 4.21 2.09 0.70 n/a 40.05
Other 19.43 8.49 17.91 12.04 4.07 10.14 6.55 n/a 78.64
Other Total 70.09 54.64 67.77 44.76 40.18 64.82 46.71 n/a 388.98
TOTAL 83.74 80.83 117.86 63.04 69.03 110.25 69.71 20.96 615.44
Source: Tables 3 and 4
Table 10 - Comparison Goods Sales Floorspace in North West Leicestershire's Main Towns
Area Gross Floorspace (sq. m) Net Sales Floorspace (sq. m)
Ashby de la Zouch town centre comparison shops 10,120 6,578
Ashby de la Zouch food stores n/a 3,154
Ashby de la Zouch retail warehouses 3,351 2,513
Ashby de la Zouch sub-total 13,471 12,245
Coalville town centre comparison shops 14,600 9,490
Coalville food stores n/a 2,414
Coalville retail warehouses 5,073 3,805
Coalville sub-total 19,673 15,709
TOTAL 33,144 27,954
Source:
Goad Plan May 2017, VOA, Completely Retail and Lichfields' site survey.

Retail and Leisure Capacity Study: Appendix 3: Comparison goods capacity
Table 11 - Summary of Comparison Goods Expenditure 2018 to 2036 (£M)
Area 2018 2021 2026 2031 2036
Available Expenditure
Ashby de la Zouch 53.48 58.59 70.66 85.03 102.00
Coalville 47.62 52.17 62.91 75.71 90.82
Castle Donington 5.93 6.49 7.83 9.42 11.30
Ibstock 4.72 5.17 6.24 7.51 9.01
Kegworth 1.20 1.31 1.59 1.91 2.29
Measham 3.77 4.13 4.98 5.99 7.18
Other 2.02 2.21 2.66 3.21 3.85
Total 118.73 130.08 156.87 188.78 226.46
Projected Turnover of Existing Facilities
Ashby de la Zouch 53.48 56.20 62.84 70.06 78.12
Coalville 47.62 50.04 55.95 62.38 69.55
Castle Donington 5.93 6.23 6.96 7.76 8.66
Ibstock 4.72 4.96 5.55 6.19 6.90
Kegworth 1.20 1.26 1.41 1.57 1.75
Measham 3.77 3.96 4.43 4.94 5.50
Other 2.02 2.12 2.37 2.64 2.95
Total 118.73 124.76 139.51 155.55 173.43
Surplus Expenditure (£m)
Ashby de la Zouch 0.00 2.39 7.82 14.97 23.89
Coalville 0.00 2.13 6.96 13.33 21.27
Castle Donington 0.00 0.27 0.87 1.66 2.65
Ibstock 0.00 0.21 0.69 1.32 2.11
Kegworth 0.00 0.05 0.18 0.34 0.54
Measham 0.00 0.17 0.55 1.05 1.68
Other 0.00 0.09 0.29 0.56 0.90
Total 0.00 5.32 17.36 33.23 53.03
Source: Tables 5 to 9

Retail and Leisure Capacity Study: Appendix 3: Comparison goods capacity
Table 12 - North West Leicestershire Comparison Goods Floorspace Capacity up to 2036
2018 2021 2026 2031 2036
Turnover Density New Floorspace (£ per sq.m) £6,000 £6,305 £7,050 £7,860 £8,764
Floorspace Projection (sq.m net)
Ashby de la Zouch 0 380 1,109 1,904 2,726
Coalville 0 338 987 1,695 2,427
Castle Donington 0 42 123 211 302
Ibstock 0 34 98 168 241
Kegworth 0 9 25 43 61
Measham 0 27 78 134 192
Other 0 14 42 72 103
Total 0 843 2,462 4,227 6,051
Floorspace Projection (sq.m gross)
Ashby de la Zouch 0 506 1,479 2,539 3,634
Coalville 0 451 1,317 2,260 3,236
Castle Donington 0 56 164 281 403
Ibstock 0 45 131 224 321
Kegworth 0 11 33 57 82
Measham 0 36 104 179 256
Other 0 19 56 96 137
Total 0 1,124 3,283 5,636 8,068
Source: Table 11

Appendix 4: Food / beverage capacity

Retail and Leisure Capacity Study: Appendix 4: Food / beverage capacity
Table 1 - Study Area Population
Zone 2016 2018 2021 2026 2031 2036
Zone 1 - Castle Donington & Kegworth 12,882 13,097 13,434 13,941 14,384 14,777
Zone 2 - North of Coalville 11,987 12,187 12,501 12,972 13,385 13,750
Zone 3 - Ashby de la Zouch 18,714 19,027 19,516 20,252 20,896 21,467
Zone 4 - Measham 10,385 10,559 10,830 11,239 11,596 11,913
Zone 5 - Ibstock 11,173 11,360 11,652 12,091 12,476 12,816
Zone 6 - Coalville 20,136 20,472 20,999 21,791 22,484 23,098
Zone 7 - Whitwick 12,895 13,110 13,447 13,955 14,398 14,792
Total 98,172 99,813 102,378 106,241 109,618 112,613
Sources:
Experian 2016
North West Leicestershire District - Office of National Statistics 2014 SNPP projections
Table 2 - Food and Beverage Expenditure per person per annum (£)
Zone 2018 2021 2026 2031 2036
Zone 1 - Castle Donington & Kegworth 1,045 1,076 1,139 1,209 1,283
Zone 2 - North of Coalville 1,073 1,106 1,170 1,242 1,318
Zone 3 - Ashby de la Zouch 999 1,030 1,090 1,157 1,228
Zone 4 - Measham 977 1,007 1,066 1,131 1,201
Zone 5 - Ibstock 996 1,026 1,086 1,153 1,224
Zone 6 - Coalville 912 940 994 1,055 1,120
Zone 7 - Whitwick 918 946 1,001 1,063 1,128
Sources:
Experian Local Expenditure 2016 (2016 prices)
Growth Rates: -0.1% in 2018, 0.8% in 2019, 1.1% from 2020 to 2024 and 1.2% p.a. beyond 2024
Table 3 - Total Food and Beverage Expenditure (£m)
Zone 2018 2021 2026 2031 2036
Zone 1 - Castle Donington & Kegworth 13.68 14.46 15.88 17.39 18.96
Zone 2 - North of Coalville 13.08 13.82 15.18 16.63 18.13
Zone 3 - Ashby de la Zouch 19.01 20.09 22.07 24.17 26.36
Zone 4 - Measham 10.32 10.90 11.98 13.12 14.30
Zone 5 - Ibstock 11.31 11.96 13.13 14.38 15.68
Zone 6 - Coalville 18.67 19.73 21.67 23.73 25.88
Zone 7 - Whitwick 12.04 12.72 13.97 15.30 16.68
Study Area Total 98.11 103.69 113.87 124.71 135.99
Source:
Tables 1 and 2

Retail and Leisure Capacity Study: Appendix 4: Food / beverage capacity
Table 4 - Base Year 2018 Food and Beverage Market Shares by Zone (%)
Location Zone 1 Zone 2 Zone 3 Zone 4 Zone 5 Zone 6 Zone 7 Inflow
Main Centres
Ashby de la Zouch 0.0% 20.7% 65.5% 28.4% 35.3% 9.4% 10.1% 10.0%
Coalville 0.0% 11.7% 0.3% 2.2% 15.4% 42.1% 34.7% 10.0%
Castle Donington 27.1% 1.9% 0.0% 0.0% 0.0% 0.0% 0.0% 5.0%
Ibstock 0.0% 0.0% 0.0% 0.0% 17.5% 1.0% 1.1% 5.0%
Kegworth 10.4% 0.6% 0.0% 0.0% 0.0% 0.0% 0.0% 5.0%
Measham 0.0% 0.0% 3.3% 11.9% 1.3% 0.5% 0.0% 5.0%
Other North West Leicestershire 12.6% 22.5% 4.9% 16.8% 5.0% 3.9% 13.1% 5.0%
North West Leicestershire Total 50.1% 57.4% 74.0% 59.3% 74.5% 56.9% 59.0% -
Elsewhere
Loughborough 9.2% 14.3% 0.0% 0.0% 3.9% 13.0% 17.7% 0.0%
Melbourne 0.0% 1.2% 1.9% 0.0% 0.0% 0.0% 2.3% 0.0%
Derby 12.5% 2.7% 1.1% 0.0% 0.0% 4.4% 3.9% 0.0%
Leicester 3.5% 4.4% 0.0% 7.3% 5.8% 15.6% 8.0% 0.0%
Nottingham 4.7% 6.7% 6.5% 0.7% 2.4% 0.0% 0.0% 0.0%
Other 20.0% 13.3% 16.5% 32.7% 13.4% 10.1% 9.1% 0.0%
Elsewhere Total 49.9% 42.6% 26.0% 40.7% 25.5% 43.1% 41.0% -
TOTAL 100.0% 100.0% 100.0% 100.0% 100.0% 100.0% 100.0% -
Source: NEMS Household Survey July 2018 (weighted results)

Retail and Leisure Capacity Study: Appendix 4: Food / beverage capacity
Table 5 - Base Year 2018 Food and Beverage Expenditure Patterns (£M)
Location Zone 1 Zone 2 Zone 3 Zone 4 Zone 5 Zone 6 Zone 7 Inflow Total
Expenditure 2018 13.68 13.08 19.01 10.32 11.31 18.67 12.04 98.11
Main Centres
Ashby de la Zouch 0.00 2.71 12.45 2.93 3.99 1.75 1.22 2.78 27.84
Coalville 0.00 1.53 0.06 0.23 1.74 7.86 4.18 0.82 16.41
Castle Donington 3.71 0.25 0.00 0.00 0.00 0.00 0.00 0.21 4.16
Ibstock 0.00 0.00 0.00 0.00 1.98 0.19 0.13 0.12 2.42
Kegworth 1.42 0.08 0.00 0.00 0.00 0.00 0.00 0.08 1.58
Measham 0.00 0.00 0.63 1.23 0.15 0.09 0.00 0.11 2.21
Other North West Leicestershire 1.72 2.94 0.93 1.73 0.57 0.73 1.58 0.00 10.20
North West Leicestershire Total 6.85 7.51 14.07 6.12 8.43 10.62 7.10 4.12 64.83
Elsewhere
Loughborough 1.26 1.87 0.00 0.00 0.44 2.43 2.13 n/a 8.13
Melbourne 0.00 0.16 0.36 0.00 0.00 0.00 0.28 n/a 0.80
Derby 1.71 0.35 0.21 0.00 0.00 0.82 0.47 n/a 3.56
Leicester 0.48 0.58 0.00 0.75 0.66 2.91 0.96 n/a 6.34
Nottingham 0.64 0.88 1.24 0.07 0.27 0.00 0.00 n/a 3.10
Other 2.74 1.74 3.14 3.37 1.52 1.89 1.10 n/a 15.48
Elsewhere Total 6.83 5.57 4.94 4.20 2.89 8.05 4.94 n/a 37.41
TOTAL 13.68 13.08 19.01 10.32 11.31 18.67 12.04 n/a 102.24
Source: Tables 3 and 4
Table 6 - 2021 Food and Beverage Expenditure Patterns (£M)
Location Zone 1 Zone 2 Zone 3 Zone 4 Zone 5 Zone 6 Zone 7 Inflow Total
Expenditure 2021 14.46 13.82 20.09 10.90 11.96 19.73 12.72 103.69
Main Centres
Ashby de la Zouch 0.00 2.86 13.16 3.10 4.22 1.85 1.28 2.94 29.42
Coalville 0.00 1.62 0.06 0.24 1.84 8.31 4.41 0.87 17.35
Castle Donington 3.92 0.26 0.00 0.00 0.00 0.00 0.00 0.22 4.40
Ibstock 0.00 0.00 0.00 0.00 2.09 0.20 0.14 0.13 2.56
Kegworth 1.50 0.08 0.00 0.00 0.00 0.00 0.00 0.08 1.67
Measham 0.00 0.00 0.66 1.30 0.16 0.10 0.00 0.12 2.33
Other North West Leicestershire 1.82 3.11 0.98 1.83 0.60 0.77 1.67 0.00 10.78
North West Leicestershire Total 7.24 7.93 14.87 6.47 8.91 11.23 7.51 4.36 68.51
Elsewhere
Loughborough 1.33 1.98 0.00 0.00 0.47 2.56 2.25 n/a 8.59
Melbourne 0.00 0.17 0.38 0.00 0.00 0.00 0.29 n/a 0.84
Derby 1.81 0.37 0.22 0.00 0.00 0.87 0.50 n/a 3.77
Leicester 0.51 0.61 0.00 0.80 0.69 3.08 1.02 n/a 6.70
Nottingham 0.68 0.93 1.31 0.08 0.29 0.00 0.00 n/a 3.28
Other 2.89 1.84 3.32 3.57 1.60 1.99 1.16 n/a 16.36
Elsewhere Total 7.21 5.89 5.22 4.44 3.05 8.50 5.22 n/a 39.53
TOTAL 14.46 13.82 20.09 10.90 11.96 19.73 12.72 n/a 108.04
Source: Tables 3 and 4

Retail and Leisure Capacity Study: Appendix 4: Food / beverage capacity
Table 7 - 2026 Food and Beverage Expenditure Patterns (£M)
Location Zone 1 Zone 2 Zone 3 Zone 4 Zone 5 Zone 6 Zone 7 Inflow Total
Expenditure 2026 15.88 15.18 22.07 11.98 13.13 21.67 13.97 113.87
Main Centres
Ashby de la Zouch 0.00 3.14 14.45 3.40 4.64 2.04 1.41 3.23 32.31
Coalville 0.00 1.78 0.07 0.26 2.02 9.12 4.85 0.95 19.05
Castle Donington 4.30 0.29 0.00 0.00 0.00 0.00 0.00 0.24 4.83
Ibstock 0.00 0.00 0.00 0.00 2.30 0.22 0.15 0.14 2.81
Kegworth 1.65 0.09 0.00 0.00 0.00 0.00 0.00 0.09 1.83
Measham 0.00 0.00 0.73 1.43 0.17 0.11 0.00 0.13 2.56
Other North West Leicestershire 2.00 3.42 1.08 2.01 0.66 0.85 1.83 0.00 11.84
North West Leicestershire Total 7.96 8.71 16.33 7.10 9.78 12.33 8.24 4.79 75.24
Elsewhere
Loughborough 1.46 2.17 0.00 0.00 0.51 2.82 2.47 n/a 9.43
Melbourne 0.00 0.18 0.42 0.00 0.00 0.00 0.32 n/a 0.92
Derby 1.98 0.41 0.24 0.00 0.00 0.95 0.54 n/a 4.14
Leicester 0.56 0.67 0.00 0.87 0.76 3.38 1.12 n/a 7.36
Nottingham 0.75 1.02 1.43 0.08 0.32 0.00 0.00 n/a 3.60
Other 3.18 2.02 3.64 3.92 1.76 2.19 1.27 n/a 17.97
Elsewhere Total 7.92 6.47 5.74 4.87 3.35 9.34 5.73 n/a 43.42
TOTAL 15.88 15.18 22.07 11.98 13.13 21.67 13.97 n/a 118.66
Source: Tables 3 and 4
Table 8 - 2031 Food and Beverage Expenditure Patterns (£M)
Location Zone 1 Zone 2 Zone 3 Zone 4 Zone 5 Zone 6 Zone 7 Inflow Total
Expenditure 2031 17.39 16.63 24.17 13.12 14.38 23.73 15.30 124.71
Main Centres
Ashby de la Zouch 0.00 3.44 15.83 3.72 5.08 2.23 1.55 3.54 35.39
Coalville 0.00 1.95 0.07 0.29 2.21 9.99 5.31 1.04 20.86
Castle Donington 4.71 0.32 0.00 0.00 0.00 0.00 0.00 0.26 5.29
Ibstock 0.00 0.00 0.00 0.00 2.52 0.24 0.17 0.15 3.08
Kegworth 1.81 0.10 0.00 0.00 0.00 0.00 0.00 0.10 2.01
Measham 0.00 0.00 0.80 1.56 0.19 0.12 0.00 0.14 2.80
Other North West Leicestershire 2.19 3.74 1.18 2.20 0.72 0.93 2.00 0.00 12.97
North West Leicestershire Total 8.71 9.54 17.89 7.78 10.71 13.50 9.03 5.24 82.40
Elsewhere
Loughborough 1.60 2.38 0.00 0.00 0.56 3.08 2.71 n/a 10.33
Melbourne 0.00 0.20 0.46 0.00 0.00 0.00 0.35 n/a 1.01
Derby 2.17 0.45 0.27 0.00 0.00 1.04 0.60 n/a 4.53
Leicester 0.61 0.73 0.00 0.96 0.83 3.70 1.22 n/a 8.06
Nottingham 0.82 1.11 1.57 0.09 0.35 0.00 0.00 n/a 3.94
Other 3.48 2.21 3.99 4.29 1.93 2.40 1.39 n/a 19.68
Elsewhere Total 8.68 7.08 6.28 5.34 3.67 10.23 6.27 n/a 47.55
TOTAL 17.39 16.63 24.17 13.12 14.38 23.73 15.30 n/a 129.95
Source: Tables 3 and 4

Retail and Leisure Capacity Study: Appendix 4: Food / beverage capacity
Table 9 - 2036 Food and Beverage Expenditure Patterns (£M)
Location Zone 1 Zone 2 Zone 3 Zone 4 Zone 5 Zone 6 Zone 7 Inflow Total
Expenditure 2036 18.96 18.13 26.36 14.30 15.68 25.88 16.68 135.99
Main Centres
Ashby de la Zouch 0.00 3.75 17.26 4.06 5.54 2.43 1.69 3.86 38.59
Coalville 0.00 2.12 0.08 0.31 2.42 10.89 5.79 1.14 22.75
Castle Donington 5.14 0.34 0.00 0.00 0.00 0.00 0.00 0.29 5.77
Ibstock 0.00 0.00 0.00 0.00 2.74 0.26 0.18 0.17 3.35
Kegworth 1.97 0.11 0.00 0.00 0.00 0.00 0.00 0.11 2.19
Measham 0.00 0.00 0.87 1.70 0.20 0.13 0.00 0.15 3.06
Other North West Leicestershire 2.39 4.08 1.29 2.40 0.78 1.01 2.19 0.00 14.14
North West Leicestershire Total 9.50 10.41 19.50 8.48 11.68 14.72 9.84 5.72 89.86
Elsewhere
Loughborough 1.74 2.59 0.00 0.00 0.61 3.36 2.95 n/a 11.27
Melbourne 0.00 0.22 0.50 0.00 0.00 0.00 0.38 n/a 1.10
Derby 2.37 0.49 0.29 0.00 0.00 1.14 0.65 n/a 4.94
Leicester 0.66 0.80 0.00 1.04 0.91 4.04 1.33 n/a 8.79
Nottingham 0.89 1.21 1.71 0.10 0.38 0.00 0.00 n/a 4.30
Other 3.79 2.41 4.35 4.68 2.10 2.61 1.52 n/a 21.46
Elsewhere Total 9.46 7.72 6.85 5.82 4.00 11.15 6.84 n/a 51.85
TOTAL 18.96 18.13 26.36 14.30 15.68 25.88 16.68 n/a 141.71
Source: Tables 3 and 4
Table 10 - Food and Beverage Facilities in North West Leicestershire
Floorspace Sq. M Gross
Class A3 Class A4 Class A5 Total
Ashby de la Zouch town centre 1,630 2,000 680 4,310
Coalville town centre 1,740 2,260 1,550 5,550
Number of Unit Units
Class A3 Class A4 Class A5 Total
Castle Donington 5 4 2 11
Ibstock 2 3 3 8
Kegworth 3 1 1 5
Measham 2 2 3 7
12 10 9 31
Source:
Goad Plan May 2017 and Lichfields' site survey

Retail and Leisure Capacity Study: Appendix 4: Food / beverage capacity
Table 11 - Summary of Food and Beverage Expenditure 2018 to 2036 (£M)
Area 2018 2021 2026 2031 2036
Available Expenditure
Ashby de la Zouch 27.84 29.42 32.31 35.39 38.59
Coalville 16.41 17.35 19.05 20.86 22.75
Castle Donington 4.16 4.40 4.83 5.29 5.77
Ibstock 2.42 2.56 2.81 3.08 3.35
Kegworth 1.58 1.67 1.83 2.01 2.19
Measham 2.21 2.33 2.56 2.80 3.06
Other 10.20 10.78 11.84 12.97 14.14
Total 64.83 68.51 75.24 82.40 89.86
Turnover of Existing Facilities
Ashby de la Zouch 27.84 28.68 30.15 31.69 33.30
Coalville 16.41 16.91 17.77 18.68 19.63
Castle Donington 4.16 4.29 4.51 4.74 4.98
Ibstock 2.42 2.49 2.62 2.75 2.89
Kegworth 1.58 1.63 1.71 1.80 1.89
Measham 2.21 2.27 2.39 2.51 2.64
Other 10.20 10.51 11.05 11.61 12.20
Total 64.83 66.79 70.20 73.78 77.54
Source: Table 6 to 9

Retail and Leisure Capacity Study: Appendix 4: Food / beverage capacity
Table 12: Food and Beverage Floorspace Capacity up to 2036
2018 2021 2026 2031 2036
Surplus Expenditure (£m)
Ashby de la Zouch 0.00 0.74 2.16 3.70 5.29
Coalville 0.00 0.43 1.28 2.18 3.12
Castle Donington 0.00 0.11 0.32 0.55 0.79
Ibstock 0.00 0.06 0.19 0.32 0.46
Kegworth 0.00 0.04 0.12 0.21 0.30
Measham 0.00 0.06 0.17 0.29 0.42
Other 0.00 0.27 0.79 1.36 1.94
Total 0.00 1.72 5.04 8.62 12.31
Turnover Density New Floorspace (£ per sq.m) £5,000 £5,152 £5,414 £5,690 £5,981
Floorspace Projection (sq.m gross)
Ashby de la Zouch 0 143 400 651 884
Coalville 0 84 236 384 521
Castle Donington 0 21 60 97 132
Ibstock 0 12 35 57 77
Kegworth 0 8 23 37 50
Measham 0 11 32 52 70
Other 0 52 147 238 324
Total 0 333 931 1,515 2,059
Source: Table 11

Appendix 5: Household survey results

Retail and Leisure Capacity Study: Appendix 5: Household survey results
NEMS Market Research carried out a telephone survey of 700 households across the study area
in July 2018. The study area was split into 7 zones, based on lower layer super output area
boundaries. To provide statistically reliable sub-samples 100 completed interviews were
undertaken in each zone. The main aims of the survey were to establish patterns for the
following:
• main food and top up grocery shopping;
• non-food shopping, including:
- clothing and footwear;
- domestic electrical appliances;
- other electrical goods (TV, Hi-Fi and computers);
- furniture, soft furnishing or carpets;
- DIY/hardware items and garden items;
- chemist, health and beauty items;
- other non-food items (e.g. books, CDs, DVDs, toys and gifts); and
- leisure activities.

by Zone North West Leicestershire Retail & Leisure Study Page 1
Weighted: For Lichfields July 2018
Total Zone 1 Zone 2 Zone 3 Zone 4 Zone 5 Zone 6 Zone 7
Column %ges.060718 NEMS market research
Q01 In which shop or other location does your household do most of its main food and grocery shopping?
Aldi, Dents Road,Ashby-de-la-Zouch
8.3% 58 6.4% 6 3.7% 3 17.4% 23 19.6% 14 14.6% 11 0.8% 1 0.0% 0
Aldi, Station Street,Atherstone
0.1% 0 0.0% 0 0.0% 0 0.0% 0 0.5% 0 0.0% 0 0.0% 0 0.0% 0
Aldi, Thornborough Road,Coalville
13.4% 94 0.0% 0 15.5% 13 0.0% 0 1.7% 1 22.3% 16 24.6% 35 27.3% 28
Aldi, Uttoxeter New Road,Derby
0.4% 3 3.4% 3 0.0% 0 0.0% 0 0.0% 0 0.0% 0 0.0% 0 0.0% 0
Aldi, Cross Street, LongEaton
1.1% 8 8.7% 8 0.0% 0 0.0% 0 0.0% 0 0.0% 0 0.0% 0 0.0% 0
Aldi, Belton Road,Loughborough
1.4% 10 8.1% 7 1.7% 1 0.0% 0 0.0% 0 0.0% 0 0.0% 0 0.7% 1
Aldi, The Pipeworks,Coppice Side, Swadlincote
1.0% 7 0.0% 0 0.0% 0 0.0% 0 9.2% 7 0.0% 0 0.0% 0 0.0% 0
Aldi, Saxon Drive,Tamworth
0.2% 1 0.0% 0 0.0% 0 0.0% 0 2.0% 1 0.0% 0 0.0% 0 0.0% 0
Asda, Ashby Road, Coalville 0.2% 2 0.0% 0 0.0% 0 0.0% 0 0.0% 0 0.0% 0 1.2% 2 0.0% 0Asda, Sinfin District Centre,
Arleston Lane, Derby0.1% 1 0.9% 1 0.0% 0 0.0% 0 0.0% 0 0.0% 0 0.0% 0 0.0% 0
Asda, Narborough RoadSouth, Braunstone,Leicester
0.3% 2 0.0% 0 0.0% 0 0.0% 0 0.0% 0 0.0% 0 0.6% 1 0.9% 1
Asda, Midland Street, LongEaton
1.7% 12 13.0% 12 0.0% 0 0.0% 0 0.0% 0 0.0% 0 0.0% 0 0.0% 0
Asda, Ventura Retail Park,Bonehill, Tamworth
1.2% 9 0.0% 0 3.2% 3 3.1% 4 2.4% 2 0.0% 0 0.0% 0 0.0% 0
Co-op, Derby Road,Ashby-de-la-Zouch
0.6% 4 0.0% 0 0.0% 0 2.5% 3 0.5% 0 0.6% 0 0.0% 0 0.0% 0
Co-op, Market Street,Ashby-de-la-Zouch
0.5% 3 0.0% 0 0.0% 0 2.2% 3 0.5% 0 0.0% 0 0.0% 0 0.0% 0
Co-op, Borough Street,Castle Donington
0.5% 3 3.6% 3 0.0% 0 0.0% 0 0.0% 0 0.0% 0 0.0% 0 0.0% 0
Co-op, Station Road, CastleDonington
1.0% 7 7.3% 7 0.7% 1 0.0% 0 0.0% 0 0.0% 0 0.0% 0 0.0% 0
Co-op, Bridge Road,Coalville
1.8% 13 0.0% 0 5.6% 5 0.0% 0 0.0% 0 0.4% 0 5.3% 8 0.0% 0
Co-op, Cropston Drive,Greenhill, Coalville
0.1% 1 0.0% 0 0.0% 0 0.0% 0 0.0% 0 0.0% 0 0.0% 0 0.7% 1
Co-op, Ashby Road, Ibstock 1.3% 9 0.0% 0 0.0% 0 0.0% 0 2.4% 2 5.5% 4 2.3% 3 0.0% 0Co-op, Market Place,
Kegworth0.5% 4 4.2% 4 0.0% 0 0.0% 0 0.0% 0 0.0% 0 0.0% 0 0.0% 0
Co-op, High Street,Measham
0.1% 0 0.0% 0 0.0% 0 0.0% 0 0.5% 0 0.0% 0 0.0% 0 0.0% 0
Co-op, The Green,Thrigstone
0.2% 2 0.0% 0 2.0% 2 0.0% 0 0.0% 0 0.0% 0 0.0% 0 0.0% 0
Iceland, Bridge Road,Coalville
0.1% 1 0.0% 0 0.0% 0 0.0% 0 0.0% 0 0.0% 0 0.0% 0 0.5% 1
Lidl, Thornborough Road,Coalville
3.6% 26 0.0% 0 4.8% 4 0.9% 1 0.0% 0 5.6% 4 7.5% 11 5.3% 6
Lidl, Belmont Street,Swadlincote
0.1% 1 0.0% 0 0.0% 0 0.0% 0 1.1% 1 0.0% 0 0.0% 0 0.0% 0
Marks & Spencer Foodhall,Smithy Road, Ashy de laZouch
1.0% 7 0.0% 0 0.7% 1 2.8% 4 0.7% 1 0.4% 0 1.1% 2 0.0% 0
Morrisons, Whitwick Road,Coalville
20.1% 141 0.6% 1 21.4% 18 0.0% 0 0.7% 1 21.9% 16 41.7% 60 44.6% 46
Morrisons, Normandy Way,Hinckley
0.2% 2 0.0% 0 0.0% 0 0.0% 0 1.0% 1 0.0% 0 0.6% 1 0.0% 0
Morrisons, Gorse CovertDistrict Centre, MaxwellDrive, Loughborough
1.1% 8 8.9% 8 0.0% 0 0.0% 0 0.0% 0 0.0% 0 0.0% 0 0.0% 0
Morrisons, Coppice Side,Swadlincote
3.4% 24 1.1% 1 1.7% 1 8.3% 11 13.7% 10 0.6% 0 0.0% 0 0.0% 0
Sainsbury's Local, TamworthRoad, Long Eaton
0.4% 3 0.0% 0 0.0% 0 2.3% 3 0.0% 0 0.0% 0 0.0% 0 0.0% 0
Sainsbury's Local, HighStreet, Newhall,Swadlincote
0.1% 0 0.0% 0 0.0% 0 0.0% 0 0.5% 0 0.0% 0 0.0% 0 0.0% 0
Sainsbury's Superstore,Wyvern Way,Chaddesden, Derby
0.4% 3 2.9% 3 0.0% 0 0.0% 0 0.0% 0 0.0% 0 0.0% 0 0.0% 0
Sainsbury's Superstore, 0.9% 6 5.0% 5 0.7% 1 0.0% 0 0.0% 0 0.0% 0 0.6% 1 0.0% 0

by Zone North West Leicestershire Retail & Leisure Study Page 2
Weighted: For Lichfields July 2018
Total Zone 1 Zone 2 Zone 3 Zone 4 Zone 5 Zone 6 Zone 7
Column %ges.060718 NEMS market research
Greenclose Lane,Loughborough
Sainsbury's Superstore, CivicWay, Swadlincote
2.2% 15 0.0% 0 0.0% 0 8.3% 11 5.4% 4 0.4% 0 0.0% 0 0.0% 0
Sainsbury's Superstore,Ventura Retail Park,Tamworth
0.1% 0 0.0% 0 0.0% 0 0.0% 0 0.5% 0 0.0% 0 0.0% 0 0.0% 0
Tesco Express, CranfleetWay, Long Eaton
0.1% 1 0.6% 1 0.0% 0 0.0% 0 0.0% 0 0.0% 0 0.0% 0 0.0% 0
Tesco Express, LeicesterRoad, Loughborough
0.1% 0 0.0% 0 0.5% 0 0.0% 0 0.0% 0 0.0% 0 0.0% 0 0.0% 0
Tesco Extra, ResolutionRoad, Ashby-de-la-Zouch
22.3% 157 2.5% 2 34.8% 30 47.0% 63 25.7% 19 19.6% 14 13.0% 19 10.1% 11
Tesco Extra, WaverleyStreet, Long Eaton
1.3% 9 10.1% 9 0.0% 0 0.0% 0 0.0% 0 0.0% 0 0.0% 0 0.0% 0
Tesco Extra, Park Road,Shelthorpe, Loughborough
0.5% 4 2.0% 2 0.5% 0 0.0% 0 0.0% 0 0.0% 0 0.0% 0 1.5% 2
Tesco Extra, Swiney Way,Toton, Nottingham
0.1% 1 0.0% 0 0.0% 0 0.5% 1 0.0% 0 0.0% 0 0.0% 0 0.0% 0
Tesco Superstore, TheRushes Shopping Centre,Loughborough
0.1% 1 1.1% 1 0.0% 0 0.0% 0 0.0% 0 0.0% 0 0.0% 0 0.0% 0
Tesco Superstore, KiplingDrive, Mickleover
0.5% 3 3.8% 3 0.0% 0 0.0% 0 0.0% 0 0.0% 0 0.0% 0 0.0% 0
Internet 5.1% 36 5.8% 5 0.7% 1 4.7% 6 10.7% 8 8.1% 6 0.8% 1 8.3% 9Asda, Derby Road, Derby 0.1% 0 0.0% 0 0.5% 0 0.0% 0 0.0% 0 0.0% 0 0.0% 0 0.0% 0Marks & Spencer, Fosse
Park Shopping Centre,Fosse Park Avenue,Leicester
0.1% 0 0.0% 0 0.5% 0 0.0% 0 0.0% 0 0.0% 0 0.0% 0 0.0% 0
Waitrose, Darwin Park,Stonneyland Drive,Lichfield
0.1% 0 0.0% 0 0.0% 0 0.0% 0 0.5% 0 0.0% 0 0.0% 0 0.0% 0
Waitrose, Harborough Road,Oadby
0.1% 0 0.0% 0 0.5% 0 0.0% 0 0.0% 0 0.0% 0 0.0% 0 0.0% 0
Weighted base: 702 91 85 134 73 72 143 104Sample: 702 100 100 102 100 100 100 100

by Zone North West Leicestershire Retail & Leisure Study Page 3
Weighted: For Lichfields July 2018
Total Zone 1 Zone 2 Zone 3 Zone 4 Zone 5 Zone 6 Zone 7
Column %ges.060718 NEMS market research
Q02 Apart from (STORE / LOCATION MENTIONED AT Q01), are there any other stores or shops your household regularly buy your mainfood and grocery shopping from? [MR]
Aldi, Dents Road,Ashby-de-la-Zouch
6.7% 47 1.1% 1 12.3% 10 10.7% 14 11.6% 8 12.0% 9 1.9% 3 1.4% 1
Aldi, Thornborough Road,Coalville
8.9% 63 0.0% 0 10.3% 9 0.0% 0 0.0% 0 7.8% 6 19.7% 28 19.3% 20
Aldi, Cross Street, LongEaton
0.9% 6 5.9% 5 1.0% 1 0.0% 0 0.0% 0 0.0% 0 0.0% 0 0.0% 0
Aldi, Belton Road,Loughborough
0.4% 3 3.2% 3 0.0% 0 0.0% 0 0.0% 0 0.0% 0 0.0% 0 0.0% 0
Aldi, The Pipeworks,Coppice Side, Swadlincote
2.5% 18 0.0% 0 0.0% 0 9.1% 12 7.4% 5 0.0% 0 0.0% 0 0.0% 0
Aldi, Saxon Drive,Tamworth
0.2% 1 0.0% 0 0.0% 0 0.0% 0 1.7% 1 0.0% 0 0.0% 0 0.0% 0
Asda, Ashby Road, Coalville 3.5% 25 0.0% 0 1.3% 1 0.0% 0 0.0% 0 4.1% 3 12.7% 18 2.4% 2Asda, Sinfin District Centre,
Arleston Lane, Derby0.1% 1 0.6% 1 0.0% 0 0.0% 0 0.0% 0 0.0% 0 0.0% 0 0.0% 0
Asda, Barwell Lane,Hinckley
0.2% 1 0.0% 0 0.0% 0 0.0% 0 0.0% 0 0.6% 0 0.0% 0 0.9% 1
Asda, Narborough RoadSouth, Braunstone,Leicester
0.5% 3 0.0% 0 0.0% 0 0.0% 0 0.0% 0 0.0% 0 0.0% 0 3.0% 3
Asda, Midland Street, LongEaton
0.8% 6 6.2% 6 0.0% 0 0.0% 0 0.0% 0 0.0% 0 0.0% 0 0.0% 0
Asda, Charnwood Road,Shepshed
0.5% 3 2.8% 3 1.1% 1 0.0% 0 0.0% 0 0.0% 0 0.0% 0 0.0% 0
Asda, Ventura Retail Park,Bonehill, Tamworth
0.5% 3 0.0% 0 0.0% 0 0.0% 0 2.0% 1 2.7% 2 0.0% 0 0.0% 0
Co-op, Derby Road,Ashby-de-la-Zouch
2.8% 19 0.0% 0 0.0% 0 8.8% 12 4.8% 4 2.3% 2 0.0% 0 2.3% 2
Co-op, Market Street,Ashby-de-la-Zouch
1.3% 9 0.0% 0 0.5% 0 4.3% 6 0.5% 0 0.0% 0 0.0% 0 2.3% 2
Co-op, Borough Street,Castle Donington
0.3% 2 2.4% 2 0.0% 0 0.0% 0 0.0% 0 0.0% 0 0.0% 0 0.0% 0
Co-op, Station Road, CastleDonington
1.2% 9 9.0% 8 0.5% 0 0.0% 0 0.0% 0 0.0% 0 0.0% 0 0.0% 0
Co-op, Bridge Road,Coalville
1.2% 8 0.0% 0 0.0% 0 0.0% 0 0.0% 0 0.6% 0 4.7% 7 0.9% 1
Co-op, Cropston Drive,Greenhill, Coalville
0.1% 1 0.0% 0 0.0% 0 0.0% 0 0.0% 0 0.0% 0 0.0% 0 0.5% 1
Co-op, Meadow Lane,Coalville
0.6% 4 0.0% 0 0.0% 0 0.0% 0 0.0% 0 0.0% 0 2.6% 4 0.5% 1
Co-op, Ashby Road, Ibstock 1.0% 7 0.0% 0 0.0% 0 0.0% 0 0.0% 0 4.9% 4 2.6% 4 0.0% 0Co-op, Market Place,
Kegworth0.7% 5 5.7% 5 0.0% 0 0.0% 0 0.0% 0 0.0% 0 0.0% 0 0.0% 0
Co-op, High Street,Measham
0.5% 3 0.0% 0 0.0% 0 0.0% 0 4.4% 3 0.0% 0 0.0% 0 0.0% 0
Co-op, Hallcroft, Shepshed 0.1% 1 0.0% 0 1.1% 1 0.0% 0 0.0% 0 0.0% 0 0.0% 0 0.0% 0Co-op, Shortheath Road,
Swadlincote0.8% 5 0.0% 0 0.0% 0 4.0% 5 0.0% 0 0.0% 0 0.0% 0 0.0% 0
Co-op, The Green,Thrigstone
0.2% 2 0.0% 0 1.9% 2 0.0% 0 0.0% 0 0.0% 0 0.0% 0 0.0% 0
Co-op, Market Place,Whitwick
0.1% 0 0.0% 0 0.5% 0 0.0% 0 0.0% 0 0.0% 0 0.0% 0 0.0% 0
Iceland, Bridge Road,Coalville
0.4% 3 0.0% 0 0.0% 0 0.0% 0 0.0% 0 0.0% 0 1.4% 2 0.9% 1
Iceland, Market Street,Loughborough
0.1% 1 0.9% 1 0.0% 0 0.0% 0 0.0% 0 0.0% 0 0.0% 0 0.0% 0
Lidl, Thornborough Road,Coalville
6.3% 45 0.9% 1 9.4% 8 0.0% 0 3.1% 2 4.1% 3 12.1% 17 12.6% 13
Lidl, Belmont Street,Swadlincote
0.3% 2 0.0% 0 0.0% 0 0.5% 1 1.5% 1 0.4% 0 0.0% 0 0.0% 0
Marks & Spencer Foodhall,Smithy Road, Ashy de laZouch
2.7% 19 0.0% 0 1.8% 2 7.9% 11 4.7% 3 3.6% 3 0.0% 0 0.7% 1
Marks & Spencer Foodhall,St Modwen's Walk,Burton-on-Trent
0.7% 5 0.0% 0 0.0% 0 3.1% 4 0.0% 0 0.0% 0 0.6% 1 0.0% 0
Marks & Spencer Foodhall,Ventura Park, Bitterscote,Tamworth
0.1% 1 0.0% 0 0.0% 0 0.0% 0 0.0% 0 0.0% 0 0.0% 0 0.5% 1
Marks & Spencer SimplyFood, The Rushes
0.2% 1 1.2% 1 0.0% 0 0.0% 0 0.0% 0 0.0% 0 0.0% 0 0.0% 0

by Zone North West Leicestershire Retail & Leisure Study Page 4
Weighted: For Lichfields July 2018
Total Zone 1 Zone 2 Zone 3 Zone 4 Zone 5 Zone 6 Zone 7
Column %ges.060718 NEMS market research
Shopping Centre,Loughborough
Morrisons, Whitwick Road,Coalville
13.6% 95 0.0% 0 14.8% 13 0.7% 1 7.4% 5 15.1% 11 26.2% 37 27.0% 28
Morrisons, Gorse CovertDistrict Centre, MaxwellDrive, Loughborough
1.1% 8 8.2% 7 0.5% 0 0.0% 0 0.0% 0 0.0% 0 0.0% 0 0.0% 0
Morrisons, Coppice Side,Swadlincote
3.5% 24 0.0% 0 0.0% 0 8.7% 12 17.5% 13 0.0% 0 0.0% 0 0.0% 0
Morrisons, Hilmore Way,Tamworth
0.1% 1 0.0% 0 0.0% 0 0.0% 0 1.0% 1 0.0% 0 0.0% 0 0.0% 0
Sainsbury's Local, HighStreet, Newhall,Swadlincote
0.8% 6 0.0% 0 0.0% 0 1.2% 2 5.8% 4 0.0% 0 0.0% 0 0.0% 0
Sainsbury's Superstore,Union Street,Burton-on-Trent
0.1% 0 0.0% 0 0.0% 0 0.0% 0 0.5% 0 0.0% 0 0.0% 0 0.0% 0
Sainsbury's Superstore,Wyvern Way,Chaddesden, Derby
0.3% 2 2.4% 2 0.0% 0 0.0% 0 0.0% 0 0.0% 0 0.0% 0 0.0% 0
Sainsbury's Superstore,Fosse Park, Grove FarmTriangle, Enderby,Leicester
0.1% 1 0.0% 0 0.0% 0 0.0% 0 0.0% 0 0.0% 0 0.6% 1 0.0% 0
Sainsbury's Superstore,Greenclose Lane,Loughborough
1.2% 8 4.5% 4 1.1% 1 0.9% 1 0.0% 0 0.6% 0 1.1% 2 0.0% 0
Sainsbury's Superstore, PeakDrive, Osmaston Park,Osmaston
0.1% 1 0.6% 1 0.0% 0 0.0% 0 0.0% 0 0.0% 0 0.0% 0 0.0% 0
Sainsbury's Superstore, CivicWay, Swadlincote
1.8% 13 0.0% 0 0.5% 0 4.9% 7 6.0% 4 1.8% 1 0.0% 0 0.0% 0
Sainsbury's Superstore,Ventura Retail Park,Tamworth
0.1% 1 0.0% 0 0.0% 0 0.0% 0 1.1% 1 0.0% 0 0.0% 0 0.0% 0
Tesco Express, LeicesterRoad, Loughborough
0.1% 0 0.0% 0 0.5% 0 0.0% 0 0.0% 0 0.0% 0 0.0% 0 0.0% 0
Tesco Express, High Street,Measham
0.2% 1 0.0% 0 0.0% 0 0.0% 0 1.8% 1 0.0% 0 0.0% 0 0.0% 0
Tesco Extra, ResolutionRoad, Ashby-de-la-Zouch
14.7% 103 2.0% 2 20.3% 17 18.4% 25 25.7% 19 27.2% 20 6.1% 9 11.7% 12
Tesco Extra, BeaumontCentre, Beaumont Leys,Leicester
0.8% 6 0.0% 0 0.0% 0 0.0% 0 0.5% 0 0.0% 0 3.6% 5 0.0% 0
Tesco Extra, WaverleyStreet, Long Eaton
1.1% 8 8.6% 8 0.0% 0 0.0% 0 0.0% 0 0.0% 0 0.0% 0 0.0% 0
Tesco Extra, Park Road,Shelthorpe, Loughborough
0.6% 4 4.1% 4 0.0% 0 0.0% 0 0.0% 0 0.0% 0 0.0% 0 0.5% 1
Tesco Superstore, TheRushes Shopping Centre,Loughborough
0.1% 1 0.0% 0 0.0% 0 0.0% 0 0.0% 0 0.0% 0 0.0% 0 0.9% 1
Waitrose, Granite Way,Mountsorrel,Loughborough
0.1% 1 0.0% 0 0.0% 0 0.0% 0 0.0% 0 0.0% 0 0.0% 0 0.7% 1
Internet 1.3% 9 3.7% 3 2.9% 2 0.0% 0 1.5% 1 1.4% 1 1.1% 2 0.0% 0Aldi, Woodgate, Leicester 0.1% 1 0.0% 0 0.0% 0 0.0% 0 0.0% 0 0.0% 0 0.0% 0 0.5% 1Co-op, Princess Way,
Stretton0.1% 1 0.0% 0 0.0% 0 0.0% 0 1.0% 1 0.0% 0 0.0% 0 0.0% 0
Costco, Wyvern Way, Derby 0.1% 1 0.6% 1 0.0% 0 0.0% 0 0.0% 0 0.0% 0 0.0% 0 0.0% 0Home Bargains, Belvoir
Shopping Centre, NewBroadway, Coalville
0.1% 1 0.0% 0 0.0% 0 0.0% 0 0.0% 0 0.0% 0 0.0% 0 0.5% 1
Home Bargains, ThePipeworks, Coppice Side,Swadlincote
0.1% 1 0.0% 0 0.0% 0 0.0% 0 0.7% 1 0.0% 0 0.0% 0 0.0% 0
Iceland, The Pipeworks,Coppice Side, Swadlincote
0.1% 1 0.0% 0 0.0% 0 0.5% 1 0.0% 0 0.0% 0 0.0% 0 0.0% 0
Lidl, Nottingham Road,Chaddesden
0.1% 1 0.6% 1 0.0% 0 0.0% 0 0.0% 0 0.0% 0 0.0% 0 0.0% 0
Local shops,Ashby-de-la-Zouch TownCentre
0.3% 2 0.0% 0 0.5% 0 1.4% 2 0.0% 0 0.0% 0 0.0% 0 0.0% 0
Local shops, Coalville TownC entre
0.3% 2 0.0% 0 2.4% 2 0.0% 0 0.0% 0 0.0% 0 0.0% 0 0.0% 0

by Zone North West Leicestershire Retail & Leisure Study Page 5
Weighted: For Lichfields July 2018
Total Zone 1 Zone 2 Zone 3 Zone 4 Zone 5 Zone 6 Zone 7
Column %ges.060718 NEMS market research
Local shops, Derby CityCentre
0.1% 1 0.6% 1 0.0% 0 0.0% 0 0.0% 0 0.0% 0 0.0% 0 0.0% 0
Marks & Spencer, FossePark Shopping Centre,Fosse Park Avenue,Leicester
0.5% 3 0.6% 1 3.2% 3 0.0% 0 0.0% 0 0.0% 0 0.0% 0 0.0% 0
Morrisons, Wheatcroft Way,Derby
0.1% 1 0.6% 1 0.0% 0 0.0% 0 0.0% 0 0.0% 0 0.0% 0 0.0% 0
Premier Stores, HuntingdonDrive, Castle Donington
0.5% 3 3.8% 3 0.0% 0 0.0% 0 0.0% 0 0.0% 0 0.0% 0 0.0% 0
Sainsbury's Local, DerbyRoad, Melbourne
0.2% 1 0.0% 0 1.5% 1 0.0% 0 0.0% 0 0.0% 0 0.0% 0 0.0% 0
Spar, London Road,Coalville
0.2% 2 0.0% 0 0.0% 0 0.0% 0 0.0% 0 0.0% 0 1.1% 2 0.0% 0
Waitrose, Darwin Park,Stonneyland Drive,Lichfield
0.1% 1 0.0% 0 0.0% 0 0.0% 0 0.7% 1 0.0% 0 0.0% 0 0.0% 0
(Don't know / varies) 0.2% 2 0.0% 0 0.0% 0 0.5% 1 0.0% 0 0.4% 0 0.0% 0 0.7% 1(Nowhere else) 23.8% 167 28.6% 26 27.2% 23 24.8% 33 19.6% 14 27.8% 20 19.3% 28 21.7% 23Weighted base: 702 91 85 134 73 72 143 104Sample: 702 100 100 102 100 100 100 100
Q03 When your household last did your main food shopping at (STORE / LOCATION MENTIONED AT Q01), was this trip combined with otheractivities within the town centre?Excluding those who do their main food shopping via the Internet at Q01:
Yes 20.8% 139 30.0% 26 13.8% 12 22.2% 28 21.5% 14 21.7% 14 16.2% 23 23.0% 22No 78.9% 526 69.4% 59 85.2% 72 77.8% 99 78.5% 51 78.3% 52 83.8% 119 77.0% 73(Don’t know / can't
remember )0.2% 1 0.7% 1 1.0% 1 0.0% 0 0.0% 0 0.0% 0 0.0% 0 0.0% 0
Weighted base: 666 85 84 128 65 67 142 95Sample: 667 93 99 98 92 92 99 94
Q04 What activities did your household undertake on that occasion? [MR]Those who combined their last main food shopping trip with another activity at Q03:
Other food shopping 34.1% 47 26.5% 7 34.3% 4 40.8% 12 28.7% 4 51.7% 7 14.0% 3 47.4% 10Healthcare (e.g. doctor,
dentist, optician etc.)4.8% 7 4.0% 1 3.8% 0 4.8% 1 2.8% 0 0.0% 0 10.4% 2 4.9% 1
Non-food shopping 31.0% 43 50.2% 13 16.9% 2 9.3% 3 58.2% 8 12.5% 2 32.7% 7 37.4% 8Social / leisure reason (e.g.
meeting friends, going togym etc.)
10.7% 15 3.1% 1 16.9% 2 22.0% 6 5.1% 1 9.6% 1 16.5% 4 0.0% 0
To have a walk / strollaround
1.8% 3 2.2% 1 0.0% 0 6.9% 2 0.0% 0 0.0% 0 0.0% 0 0.0% 0
To use services (e.g. bank,post office, hairdresseretc.)
10.0% 14 10.6% 3 9.2% 1 0.0% 0 9.4% 1 6.1% 1 29.0% 7 5.8% 1
To visit a restaurant / café / public house
9.2% 13 9.3% 2 7.1% 1 11.7% 3 18.3% 3 3.9% 1 7.3% 2 6.9% 2
Tourism (e.g. holiday, daytrip etc.)
0.0% 0 0.0% 0 0.0% 0 0.0% 0 0.0% 0 0.0% 0 0.0% 0 0.0% 0
Visit parks / gardens 1.8% 3 9.9% 3 0.0% 0 0.0% 0 0.0% 0 0.0% 0 0.0% 0 0.0% 0Window shopping /
browsing4.9% 7 2.2% 1 14.2% 2 2.4% 1 16.9% 2 0.0% 0 3.6% 1 3.4% 1
Work / business purposes 4.7% 7 6.1% 2 5.3% 1 7.8% 2 5.1% 1 3.0% 0 0.0% 0 4.5% 1Other 0.0% 0 0.0% 0 0.0% 0 0.0% 0 0.0% 0 0.0% 0 0.0% 0 0.0% 0Car wash 1.0% 1 0.0% 0 7.1% 1 0.0% 0 0.0% 0 3.9% 1 0.0% 0 0.0% 0Get petrol 3.4% 5 7.1% 2 0.0% 0 3.3% 1 0.0% 0 13.6% 2 0.0% 0 0.0% 0(Don’t know / can't
remember )0.0% 0 0.0% 0 0.0% 0 0.0% 0 0.0% 0 0.0% 0 0.0% 0 0.0% 0
Weighted base: 139 26 12 28 14 14 23 22Sample: 149 30 18 22 21 20 12 26

by Zone North West Leicestershire Retail & Leisure Study Page 6
Weighted: For Lichfields July 2018
Total Zone 1 Zone 2 Zone 3 Zone 4 Zone 5 Zone 6 Zone 7
Column %ges.060718 NEMS market research
Q05 How does your household normally travel to do the main food shopping?Excluding those who do their main food shopping via the Internet at Q01:
Car-driver 84.9% 566 80.4% 69 90.1% 76 86.7% 111 95.7% 63 85.5% 57 75.7% 107 88.0% 84Car-passenger 8.7% 58 8.6% 7 6.8% 6 7.9% 10 2.8% 2 9.9% 7 14.5% 21 6.1% 6Bus, minibus or coach 1.4% 9 4.7% 4 0.5% 0 0.0% 0 0.0% 0 0.5% 0 2.4% 3 1.1% 1Train 0.0% 0 0.0% 0 0.0% 0 0.0% 0 0.0% 0 0.0% 0 0.0% 0 0.0% 0Taxi 0.5% 4 0.0% 0 0.5% 0 1.1% 1 0.0% 0 0.6% 0 0.0% 0 1.3% 1Walk 4.0% 27 5.2% 4 2.0% 2 4.3% 6 1.4% 1 3.5% 2 6.9% 10 2.4% 2Bicycle 0.0% 0 0.0% 0 0.0% 0 0.0% 0 0.0% 0 0.0% 0 0.0% 0 0.0% 0Motorcycle, scooter or
moped0.3% 2 1.2% 1 0.0% 0 0.0% 0 0.0% 0 0.0% 0 0.6% 1 0.0% 0
Mobility scooter / wheelchair 0.0% 0 0.0% 0 0.0% 0 0.0% 0 0.0% 0 0.0% 0 0.0% 0 0.0% 0Other 0.0% 0 0.0% 0 0.0% 0 0.0% 0 0.0% 0 0.0% 0 0.0% 0 0.0% 0(Don’t know / varies) 0.1% 1 0.0% 0 0.0% 0 0.0% 0 0.0% 0 0.0% 0 0.0% 0 1.0% 1Weighted base: 666 85 84 128 65 67 142 95Sample: 667 93 99 98 92 92 99 94

by Zone North West Leicestershire Retail & Leisure Study Page 7
Weighted: For Lichfields July 2018
Total Zone 1 Zone 2 Zone 3 Zone 4 Zone 5 Zone 6 Zone 7
Column %ges.060718 NEMS market research
Q06 Where did your household last buy small scale / top up grocery shopping?
Aldi, Dents Road,Ashby-de-la-Zouch
2.3% 16 0.0% 0 4.3% 4 5.4% 7 2.4% 2 4.7% 3 0.0% 0 0.0% 0
Aldi, Thornborough Road,Coalville
2.8% 19 0.0% 0 6.3% 5 0.0% 0 1.5% 1 0.6% 0 2.8% 4 8.1% 8
Aldi, Uttoxeter New Road,Derby
0.1% 1 1.1% 1 0.0% 0 0.0% 0 0.0% 0 0.0% 0 0.0% 0 0.0% 0
Aldi, Cross Street, LongEaton
0.1% 1 0.6% 1 0.0% 0 0.0% 0 0.0% 0 0.0% 0 0.0% 0 0.0% 0
Aldi, Belton Road,Loughborough
0.3% 2 1.1% 1 1.0% 1 0.0% 0 0.0% 0 0.0% 0 0.0% 0 0.0% 0
Aldi, The Pipeworks,Coppice Side, Swadlincote
0.1% 1 0.0% 0 0.0% 0 0.5% 1 0.0% 0 0.0% 0 0.0% 0 0.0% 0
Aldi, Saxon Drive,Tamworth
0.1% 1 0.0% 0 0.0% 0 0.7% 1 0.0% 0 0.0% 0 0.0% 0 0.0% 0
Asda, Ashby Road, Coalville 2.3% 16 0.0% 0 0.5% 0 0.0% 0 0.7% 1 1.9% 1 9.6% 14 0.0% 0Asda, Midland Street, Long
Eaton0.2% 1 1.2% 1 0.0% 0 0.0% 0 0.0% 0 0.0% 0 0.0% 0 0.0% 0
Asda, Charnwood Road,Shepshed
0.2% 1 0.6% 1 0.0% 0 0.0% 0 0.0% 0 0.0% 0 0.0% 0 0.7% 1
Asda, Ventura Retail Park,Bonehill, Tamworth
0.1% 1 0.0% 0 0.0% 0 0.0% 0 0.7% 1 0.0% 0 0.0% 0 0.0% 0
Co-op, Derby Road,Ashby-de-la-Zouch
4.7% 33 0.0% 0 0.0% 0 20.4% 27 2.4% 2 1.9% 1 0.0% 0 2.3% 2
Co-op, Market Street,Ashby-de-la-Zouch
2.4% 17 0.0% 0 0.5% 0 11.8% 16 0.5% 0 0.8% 1 0.0% 0 0.0% 0
Co-op, Station Street,Atherstone
0.1% 1 0.9% 1 0.0% 0 0.0% 0 0.0% 0 0.0% 0 0.0% 0 0.0% 0
Co-op, Borough Street,Castle Donington
2.1% 15 16.4% 15 0.0% 0 0.0% 0 0.0% 0 0.0% 0 0.0% 0 0.0% 0
Co-op, Station Road, CastleDonington
1.8% 13 13.5% 12 0.5% 0 0.0% 0 0.0% 0 0.0% 0 0.0% 0 0.0% 0
Co-op, Swarkestone Road,Chellaston
0.1% 1 0.0% 0 0.0% 0 0.0% 0 0.0% 0 0.0% 0 0.0% 0 0.7% 1
Co-op, Bridge Road,Coalville
2.7% 19 0.0% 0 0.0% 0 0.0% 0 0.0% 0 0.6% 0 13.0% 18 0.0% 0
Co-op, Cropston Drive,Greenhill, Coalville
1.5% 11 0.0% 0 1.0% 1 0.0% 0 0.0% 0 0.0% 0 1.7% 2 7.0% 7
Co-op, Meadow Lane,Coalville
2.1% 15 0.0% 0 1.3% 1 0.0% 0 0.0% 0 0.0% 0 2.6% 4 9.7% 10
Co-op, Ashby Road, Ibstock 6.0% 42 0.0% 0 0.0% 0 0.0% 0 4.5% 3 47.7% 35 2.8% 4 0.0% 0Co-op, Market Place,
Kegworth2.0% 14 15.1% 14 0.5% 0 0.0% 0 0.0% 0 0.0% 0 0.0% 0 0.0% 0
Co-op, High Street,Measham
2.4% 17 0.0% 0 0.0% 0 0.0% 0 23.4% 17 0.0% 0 0.0% 0 0.0% 0
Co-op, Hallcroft, Shepshed 0.1% 0 0.0% 0 0.5% 0 0.0% 0 0.0% 0 0.0% 0 0.0% 0 0.0% 0Co-op, Main Street, Stretton 0.1% 0 0.0% 0 0.5% 0 0.0% 0 0.0% 0 0.0% 0 0.0% 0 0.0% 0Co-op, Burton Road,
Overseal, Swadlincote0.1% 1 0.0% 0 0.0% 0 0.0% 0 0.7% 1 0.0% 0 0.0% 0 0.0% 0
Co-op, High Street,Swadlincote
0.1% 1 0.0% 0 0.0% 0 0.0% 0 1.0% 1 0.0% 0 0.0% 0 0.0% 0
Co-op, Shortheath Road,Swadlincote
1.9% 13 0.0% 0 0.0% 0 6.4% 9 6.7% 5 0.0% 0 0.0% 0 0.0% 0
Co-op, The Green,Thrigstone
2.4% 17 0.0% 0 18.1% 15 0.0% 0 0.0% 0 0.0% 0 0.0% 0 1.7% 2
Co-op, Market Place,Whitwick
4.1% 29 0.0% 0 7.3% 6 0.0% 0 0.0% 0 0.0% 0 1.4% 2 19.5% 20
Home Bargains, BelvoirShopping Centre,Coalville
1.1% 8 0.0% 0 3.6% 3 0.0% 0 0.0% 0 0.0% 0 3.2% 5 0.0% 0
Iceland, Tamworth Road,Long Eaton
0.1% 0 0.0% 0 0.0% 0 0.0% 0 0.5% 0 0.0% 0 0.0% 0 0.0% 0
Lidl, Thornborough Road,Coalville
1.0% 7 0.0% 0 0.7% 1 0.0% 0 0.0% 0 1.9% 1 0.6% 1 3.8% 4
Lidl, Belmont Street,Swadlincote
0.1% 0 0.0% 0 0.0% 0 0.0% 0 0.5% 0 0.0% 0 0.0% 0 0.0% 0
Marks & Spencer Foodhall,Smithy Road, Ashy de laZouch
1.0% 7 0.0% 0 0.7% 1 3.6% 5 0.0% 0 0.0% 0 1.1% 2 0.0% 0
Marks & Spencer SimplyFood, Castle DoningtonServices, M1 Junction23A, Castle Donington
0.1% 1 0.6% 1 0.0% 0 0.0% 0 0.0% 0 0.0% 0 0.0% 0 0.0% 0

by Zone North West Leicestershire Retail & Leisure Study Page 8
Weighted: For Lichfields July 2018
Total Zone 1 Zone 2 Zone 3 Zone 4 Zone 5 Zone 6 Zone 7
Column %ges.060718 NEMS market research
McColls, Central Road,Coalville
2.0% 14 0.0% 0 0.0% 0 0.0% 0 0.0% 0 0.0% 0 9.9% 14 0.0% 0
Morrisons, Whitwick Road,Coalville
4.8% 34 0.0% 0 1.6% 1 0.0% 0 0.7% 1 5.0% 4 11.4% 16 11.6% 12
Morrisons, Gorse CovertDistrict Centre, MaxwellDrive, Loughborough
0.6% 4 4.9% 4 0.0% 0 0.0% 0 0.0% 0 0.0% 0 0.0% 0 0.0% 0
Morrisons, Coppice Side,Swadlincote
0.7% 5 0.0% 0 0.0% 0 3.8% 5 0.0% 0 0.0% 0 0.0% 0 0.0% 0
Sainsbury's Local, HighStreet, Newhall,Swadlincote
0.1% 1 0.0% 0 0.7% 1 0.0% 0 0.0% 0 0.0% 0 0.0% 0 0.0% 0
Sainsbury's Superstore,Wyvern Way,Chaddesden, Derby
0.1% 1 0.0% 0 0.7% 1 0.0% 0 0.0% 0 0.0% 0 0.0% 0 0.0% 0
Sainsbury's Superstore,Greenclose Lane,Loughborough
0.1% 1 0.6% 1 0.0% 0 0.0% 0 0.0% 0 0.0% 0 0.0% 0 0.0% 0
Sainsbury's Superstore, CivicWay, Swadlincote
0.4% 3 0.0% 0 0.0% 0 1.6% 2 0.5% 0 0.0% 0 0.0% 0 0.0% 0
Sainsbury's Superstore,Ventura Retail Park,Tamworth
0.1% 0 0.0% 0 0.0% 0 0.0% 0 0.5% 0 0.0% 0 0.0% 0 0.0% 0
Tesco Express, LeicesterRoad, Loughborough
0.1% 1 1.1% 1 0.0% 0 0.0% 0 0.0% 0 0.0% 0 0.0% 0 0.0% 0
Tesco Express, High Street,Measham
2.2% 15 0.0% 0 0.0% 0 0.9% 1 19.2% 14 0.0% 0 0.0% 0 0.0% 0
Tesco Express, Best Avenue,Stapenhill
0.3% 2 0.0% 0 0.0% 0 0.0% 0 2.4% 2 0.0% 0 0.0% 0 0.0% 0
Tesco Express, CommonRoad, Church Gresley,Swadlincote
0.1% 1 0.0% 0 0.0% 0 0.7% 1 0.0% 0 0.0% 0 0.0% 0 0.0% 0
Tesco Extra, ResolutionRoad, Ashby-de-la-Zouch
5.0% 35 0.0% 0 17.1% 15 8.2% 11 5.9% 4 5.4% 4 1.2% 2 0.0% 0
Tesco Extra, Station Road,Beeston
0.1% 1 0.0% 0 0.0% 0 0.0% 0 0.7% 1 0.0% 0 0.0% 0 0.0% 0
Tesco Extra, Park Road,Shelthorpe, Loughborough
0.3% 2 1.1% 1 0.0% 0 0.0% 0 0.0% 0 0.0% 0 0.0% 0 0.7% 1
Tesco Extra, Swiney Way,Toton, Nottingham
0.1% 1 0.0% 0 0.0% 0 0.5% 1 0.0% 0 0.0% 0 0.0% 0 0.0% 0
Internet 0.3% 2 1.1% 1 0.0% 0 0.0% 0 0.0% 0 0.0% 0 0.8% 1 0.0% 0B&M Bargains, Whitwick
Road, Stephenson Way,Coalville
0.2% 1 0.0% 0 0.0% 0 0.0% 0 0.0% 0 0.0% 0 0.8% 1 0.0% 0
Co-op, Princess Way,Stretton
0.1% 1 0.0% 0 0.0% 0 0.0% 0 1.0% 1 0.0% 0 0.0% 0 0.0% 0
Home Bargains, BelvoirShopping Centre, NewBroadway, Coalville
0.8% 6 0.0% 0 0.5% 0 0.0% 0 0.0% 0 0.0% 0 2.8% 4 1.2% 1
Home Bargains, DevonshireSquare, Loughborough
0.1% 1 0.0% 0 0.7% 1 0.0% 0 0.0% 0 0.0% 0 0.0% 0 0.0% 0
Iceland, The Pipeworks,Coppice Side, Swadlincote
0.1% 1 0.0% 0 0.0% 0 0.5% 1 0.0% 0 0.0% 0 0.0% 0 0.0% 0
Local shops,Ashby-de-la-Zouch TownCentre
1.3% 9 0.0% 0 0.7% 1 5.8% 8 1.1% 1 0.0% 0 0.0% 0 0.0% 0
Local shops, Belton VillageCentre
0.2% 1 0.0% 0 1.3% 1 0.0% 0 0.0% 0 0.0% 0 0.0% 0 0.0% 0
Local shops, Belvoir Retailand Leisure Quarter
0.4% 3 0.0% 0 3.2% 3 0.0% 0 0.0% 0 0.0% 0 0.0% 0 0.0% 0
Local shops, CastleDonington Town Centre
0.4% 3 2.1% 2 0.0% 0 0.7% 1 0.0% 0 0.0% 0 0.0% 0 0.0% 0
Local shops, Coalville TownC entre
0.5% 3 0.0% 0 0.0% 0 0.0% 0 0.0% 0 0.0% 0 2.0% 3 0.5% 1
Local shops, DonisthorpeVillage Centre
0.3% 2 0.0% 0 0.0% 0 0.0% 0 2.4% 2 0.0% 0 0.0% 0 0.0% 0
Local shops, Ibstock VillageCentre
0.1% 1 0.0% 0 0.0% 0 0.0% 0 0.0% 0 0.8% 1 0.0% 0 0.0% 0
Local shops, Long WhattonVillage Centre
0.3% 2 2.1% 2 0.0% 0 0.0% 0 0.0% 0 0.0% 0 0.0% 0 0.0% 0
Local shops, LoughboroughTown Centre
0.4% 3 0.0% 0 0.0% 0 0.0% 0 0.0% 0 0.0% 0 2.0% 3 0.0% 0
Local shops, Moira VillageCentre
0.8% 6 0.0% 0 1.0% 1 3.6% 5 0.0% 0 0.0% 0 0.0% 0 0.0% 0

by Zone North West Leicestershire Retail & Leisure Study Page 9
Weighted: For Lichfields July 2018
Total Zone 1 Zone 2 Zone 3 Zone 4 Zone 5 Zone 6 Zone 7
Column %ges.060718 NEMS market research
Local shops, PackingtonVillage Centre
0.2% 2 0.0% 0 0.0% 0 0.0% 0 0.0% 0 2.2% 2 0.0% 0 0.0% 0
Local shops, RavenstoneVillage Centre
0.0% 0 0.0% 0 0.0% 0 0.0% 0 0.0% 0 0.4% 0 0.0% 0 0.0% 0
Local shops, WhitwickVillage Centre
0.6% 4 0.0% 0 1.0% 1 0.0% 0 0.0% 0 0.0% 0 0.0% 0 3.3% 3
Londis, Whitehill Road,Ellistown
0.8% 5 0.0% 0 0.0% 0 0.0% 0 0.0% 0 0.0% 0 3.7% 5 0.0% 0
McColls, Central Road,Hugglescote
0.2% 2 0.0% 0 0.0% 0 0.0% 0 0.0% 0 0.0% 0 1.1% 2 0.0% 0
Nisa Local, Station Road,Bagworth
0.1% 1 0.0% 0 0.0% 0 0.0% 0 0.0% 0 0.0% 0 0.6% 1 0.0% 0
Premier Stores, HuntingdonDrive, Castle Donington
0.9% 6 6.9% 6 0.0% 0 0.0% 0 0.0% 0 0.0% 0 0.0% 0 0.0% 0
Sainsbury's Local, DerbyRoad, Melbourne
0.7% 5 0.0% 0 5.6% 5 0.0% 0 0.0% 0 0.0% 0 0.0% 0 0.0% 0
Spar, London Road,Coalville
0.5% 4 0.0% 0 0.0% 0 0.0% 0 0.0% 0 0.0% 0 2.2% 3 0.7% 1
(Don't know / varies) 2.7% 19 0.6% 1 4.2% 4 5.6% 7 6.7% 5 0.0% 0 0.6% 1 1.7% 2(Don't do this type of
shopping)21.5% 151 28.1% 25 14.3% 12 19.1% 26 13.2% 10 26.1% 19 22.1% 31 26.7% 28
Weighted base: 702 91 85 134 73 72 143 104Sample: 702 100 100 102 100 100 100 100

by Zone North West Leicestershire Retail & Leisure Study Page 10
Weighted: For Lichfields July 2018
Total Zone 1 Zone 2 Zone 3 Zone 4 Zone 5 Zone 6 Zone 7
Column %ges.060718 NEMS market research
Q07 Where do you buy most of your household's non-food shopping?
Ashby-de-la-Zouch TownCentre
9.6% 68 2.4% 2 14.1% 12 21.7% 29 13.1% 10 12.0% 9 1.1% 2 4.5% 5
Beeston Town Centre 0.1% 1 0.6% 1 0.0% 0 0.0% 0 0.0% 0 0.0% 0 0.0% 0 0.0% 0Birmingham City Centre 0.7% 5 0.0% 0 0.0% 0 3.1% 4 0.7% 1 0.0% 0 0.0% 0 0.0% 0Burton-on-Trent Town
Centre6.2% 44 0.0% 0 2.2% 2 18.6% 25 17.4% 13 2.4% 2 1.7% 2 0.0% 0
Castle Donington TownCentre
0.6% 4 4.4% 4 0.0% 0 0.0% 0 0.0% 0 0.0% 0 0.0% 0 0.0% 0
Coalville Town Centre 18.3% 128 0.6% 1 6.3% 5 2.0% 3 4.1% 3 24.7% 18 40.0% 57 39.9% 42Derby City Centre 4.0% 28 24.8% 22 3.8% 3 0.7% 1 0.0% 0 1.9% 1 0.0% 0 0.0% 0Hinckley Town Centre 0.2% 2 0.0% 0 0.0% 0 0.0% 0 0.0% 0 0.6% 0 0.8% 1 0.0% 0Ibstock Town Centre 0.1% 1 0.0% 0 0.0% 0 0.0% 0 0.0% 0 0.9% 1 0.0% 0 0.0% 0Leicester City Centre 10.4% 73 0.9% 1 6.7% 6 4.8% 6 1.5% 1 15.6% 11 22.9% 33 14.4% 15Long Eaton Town Centre 0.7% 5 5.6% 5 0.0% 0 0.0% 0 0.0% 0 0.0% 0 0.0% 0 0.0% 0Loughborough Town Centre 11.4% 80 21.4% 19 14.7% 12 1.9% 3 0.0% 0 8.3% 6 15.1% 22 17.2% 18Measham Village Centre 0.3% 2 0.0% 0 0.0% 0 0.0% 0 2.6% 2 0.0% 0 0.0% 0 0.0% 0Nottingham City Centre 3.0% 21 13.7% 12 1.8% 2 3.1% 4 0.0% 0 1.0% 1 1.1% 2 0.7% 1Nuneaton Town Centre 0.1% 1 0.0% 0 0.0% 0 0.0% 0 1.1% 1 0.0% 0 0.0% 0 0.0% 0Packington Village Centre 0.3% 2 0.0% 0 0.0% 0 0.0% 0 0.0% 0 2.6% 2 0.0% 0 0.0% 0Shepshed Town Centre 0.1% 0 0.0% 0 0.0% 0 0.0% 0 0.5% 0 0.0% 0 0.0% 0 0.0% 0Swadlincote Town Centre 2.0% 14 0.0% 0 1.9% 2 2.6% 3 12.7% 9 0.0% 0 0.0% 0 0.0% 0Tamworth Town Centre 3.2% 23 0.0% 0 0.5% 0 8.5% 11 12.8% 9 0.0% 0 0.6% 1 0.7% 1Thurmaston District Centre 0.1% 1 0.0% 0 0.0% 0 0.0% 0 0.0% 0 0.0% 0 0.0% 0 0.5% 1Fosse Shopping Park, Fosse
Park Avenue, Leicester(JD Sports, Marks &Spencer, ScS)
3.7% 26 0.9% 1 9.4% 8 1.6% 2 0.5% 0 1.0% 1 4.8% 7 6.8% 7
Giltbrook Retail Park, IkeaWay, Giltbrook,Nottingham (Harveys,Ikea, Sofology)
0.4% 2 0.0% 0 0.0% 0 0.7% 1 0.0% 0 0.0% 0 1.1% 2 0.0% 0
Jolly Sailor Retail Park,Bonehill Road, Bitterscote,Tamworth (Argos,Poundland, TK Maxx)
0.1% 1 0.0% 0 0.0% 0 0.0% 0 0.7% 1 0.0% 0 0.0% 0 0.0% 0
Kingsway Retail Park,Kingsway, Derby (Argos,Halfords, Next)
0.1% 1 0.0% 0 0.7% 1 0.0% 0 0.0% 0 0.0% 0 0.0% 0 0.0% 0
Regents Place Retail Park,Broad Street,Loughborough (CarphoneWarehouse, Currys PCWorld, Dunelm)
0.1% 1 1.1% 1 0.0% 0 0.0% 0 0.0% 0 0.0% 0 0.0% 0 0.0% 0
Ventura Retail Park, VenturaPark Road, Tamworth (JDSports, Marks & Spencer,Next)
2.8% 20 0.0% 0 5.0% 4 6.9% 9 7.8% 6 0.4% 0 0.0% 0 0.0% 0
Whitwick Retail Park,Whitwick Road, Coalville(Peacocks, Ponden Mill,Sports Direct)
1.1% 7 0.0% 0 1.0% 1 0.0% 0 0.0% 0 2.6% 2 2.6% 4 0.9% 1
Willowbrook Retail Park,Derby Road,Loughborough (B&M,Dreams, Halfords)
0.1% 1 0.0% 0 0.0% 0 0.0% 0 0.0% 0 0.0% 0 0.0% 0 0.7% 1
Wyvern Retail Park, WyvernWay, Chaddesden, Derby(Homebase, Next Home,Sainsbury's)
0.6% 4 1.8% 2 3.2% 3 0.0% 0 0.0% 0 0.0% 0 0.0% 0 0.0% 0
Internet / mail order 11.2% 79 14.5% 13 18.0% 15 12.1% 16 14.1% 10 16.7% 12 4.1% 6 5.7% 6Other 4.1% 29 1.5% 1 5.0% 4 5.8% 8 4.5% 3 6.2% 4 1.2% 2 5.5% 6(Don't know / varies) 4.4% 31 5.9% 5 5.7% 5 5.8% 8 5.8% 4 3.1% 2 2.9% 4 2.3% 2Weighted base: 702 91 85 134 73 72 143 104Sample: 702 100 100 102 100 100 100 100

by Zone North West Leicestershire Retail & Leisure Study Page 11
Weighted: For Lichfields July 2018
Total Zone 1 Zone 2 Zone 3 Zone 4 Zone 5 Zone 6 Zone 7
Column %ges.060718 NEMS market research
Q08 When your household last did your non-food shopping, was this trip combined with other activities within the town centre?Excluding those who do their non-food shopping via the Internet at Q07:
Yes 29.5% 184 34.4% 27 30.5% 21 27.5% 32 32.2% 20 26.7% 16 29.7% 41 27.0% 27No 69.3% 432 63.5% 49 68.9% 48 71.2% 84 66.1% 42 69.8% 42 70.3% 96 72.2% 71(Don’t know / can't
remember )1.2% 8 2.2% 2 0.6% 0 1.4% 2 1.7% 1 3.5% 2 0.0% 0 0.8% 1
Weighted base: 623 77 70 118 63 60 137 98Sample: 628 88 89 91 90 83 95 92
Q09 What activities did your household undertake on that occasion? [MR]Those who combined their last non-food shopping trip with another activity at Q08:
Food and grocery shopping 12.7% 23 7.1% 2 21.0% 4 19.4% 6 2.7% 1 29.6% 5 4.1% 2 14.3% 4Healthcare (e.g. doctor,
dentist, optician etc.)1.4% 2 4.2% 1 0.0% 0 4.2% 1 0.0% 0 0.0% 0 0.0% 0 0.0% 0
Social / leisure reason (e.g.meeting friends, going togym etc.)
27.4% 50 24.1% 6 32.4% 7 38.6% 12 12.4% 3 34.4% 6 35.6% 14 7.4% 2
To have a walk / strollaround
1.6% 3 2.1% 1 0.0% 0 0.0% 0 1.9% 0 12.1% 2 0.0% 0 0.0% 0
To use services (e.g. bank,post office, hairdresseretc.)
9.7% 18 23.1% 6 4.2% 1 4.2% 1 7.3% 1 10.5% 2 2.9% 1 19.4% 5
To visit a restaurant / café / public house
41.1% 75 28.6% 8 48.5% 10 35.0% 11 52.6% 11 14.0% 2 49.5% 20 49.8% 13
Tourism (e.g. holiday, daytrip etc.)
0.7% 1 0.0% 0 2.1% 0 0.0% 0 0.0% 0 0.0% 0 2.1% 1 0.0% 0
Visit parks / gardens 3.9% 7 6.8% 2 0.0% 0 5.0% 2 0.0% 0 0.0% 0 9.3% 4 0.0% 0Window shopping /
browsing4.4% 8 4.2% 1 2.9% 1 8.4% 3 3.5% 1 2.7% 0 0.0% 0 9.1% 2
Work / business purposes 5.4% 10 3.9% 1 3.9% 1 2.9% 1 23.1% 5 5.3% 1 3.8% 2 0.0% 0Other 0.0% 0 0.0% 0 0.0% 0 0.0% 0 0.0% 0 0.0% 0 0.0% 0 0.0% 0Attend church 0.5% 1 0.0% 0 0.0% 0 0.0% 0 0.0% 0 0.0% 0 2.1% 1 0.0% 0Visit market 0.5% 1 0.0% 0 0.0% 0 0.0% 0 0.0% 0 0.0% 0 0.0% 0 3.7% 1(Don’t know / can't
remember )0.0% 0 0.0% 0 0.0% 0 0.0% 0 0.0% 0 0.0% 0 0.0% 0 0.0% 0
Weighted base: 184 27 21 32 20 16 41 27Sample: 177 31 25 26 22 22 27 24
Q10 How does your household normally travel to do its non-food shopping?Excluding those who do their non-food shopping via the Internet at Q07:
Car - driver 77.1% 480 69.3% 54 85.8% 60 77.6% 91 92.2% 58 79.2% 48 64.9% 89 82.4% 81Car - passenger 5.6% 35 5.6% 4 5.5% 4 4.5% 5 1.5% 1 10.2% 6 8.3% 11 3.2% 3Bus, minibus or coach 6.6% 41 13.5% 10 1.9% 1 5.9% 7 2.5% 2 3.3% 2 9.1% 13 6.5% 6Train 0.4% 2 2.3% 2 0.0% 0 0.0% 0 0.9% 1 0.0% 0 0.0% 0 0.0% 0Taxi 0.6% 4 0.0% 0 0.0% 0 0.0% 0 0.0% 0 0.0% 0 0.0% 0 3.9% 4Walk 6.5% 41 1.3% 1 0.9% 1 10.3% 12 2.1% 1 6.5% 4 13.3% 18 3.5% 3Bicycle 0.2% 1 1.3% 1 0.0% 0 0.0% 0 0.0% 0 0.0% 0 0.0% 0 0.0% 0Motorcycle, scooter or
moped0.3% 2 0.0% 0 0.0% 0 0.0% 0 0.0% 0 0.0% 0 1.2% 2 0.0% 0
Mobility scooter / wheelchair 0.0% 0 0.0% 0 0.0% 0 0.0% 0 0.0% 0 0.0% 0 0.0% 0 0.0% 0Use internet / get it delivered 0.0% 0 0.0% 0 0.0% 0 0.0% 0 0.0% 0 0.0% 0 0.0% 0 0.0% 0Other 0.0% 0 0.0% 0 0.0% 0 0.0% 0 0.0% 0 0.0% 0 0.0% 0 0.0% 0Aeroplane 0.1% 0 0.0% 0 0.6% 0 0.0% 0 0.0% 0 0.0% 0 0.0% 0 0.0% 0Park & Ride 0.1% 1 0.0% 0 0.0% 0 0.0% 0 0.0% 0 0.0% 0 0.0% 0 0.5% 1Tram 0.2% 1 1.3% 1 0.0% 0 0.0% 0 0.0% 0 0.0% 0 0.0% 0 0.0% 0(Don’t know / varies) 2.4% 15 5.2% 4 5.2% 4 1.6% 2 0.9% 1 0.7% 0 3.1% 4 0.0% 0Weighted base: 623 77 70 118 63 60 137 98Sample: 628 88 89 91 90 83 95 92

by Zone North West Leicestershire Retail & Leisure Study Page 12
Weighted: For Lichfields July 2018
Total Zone 1 Zone 2 Zone 3 Zone 4 Zone 5 Zone 6 Zone 7
Column %ges.060718 NEMS market research
Q11 Where does your household do most of its shopping for clothes and shoes, this can include retail parks and the internet as well astown / district / city centres?
Ashby-de-la-Zouch TownCentre
3.9% 28 1.9% 2 6.3% 5 12.8% 17 1.3% 1 2.4% 2 0.6% 1 0.0% 0
Beaumont Leys DistrictCentre
0.2% 1 0.0% 0 1.0% 1 0.0% 0 0.0% 0 0.0% 0 0.0% 0 0.5% 1
Birmingham City Centre 0.8% 6 0.0% 0 0.0% 0 3.1% 4 2.2% 2 0.0% 0 0.0% 0 0.0% 0Burton-on-Trent Town
Centre6.0% 42 0.0% 0 2.0% 2 11.1% 15 20.1% 15 4.9% 4 2.6% 4 3.8% 4
Coalville Town Centre 4.1% 29 0.0% 0 5.1% 4 1.4% 2 0.0% 0 7.7% 6 5.8% 8 8.1% 8Derby City Centre 5.9% 42 29.2% 26 11.6% 10 1.4% 2 4.7% 3 0.0% 0 0.0% 0 0.0% 0Hinckley Town Centre 0.1% 0 0.0% 0 0.0% 0 0.0% 0 0.5% 0 0.0% 0 0.0% 0 0.0% 0Leicester City Centre 18.4% 129 1.8% 2 8.9% 8 5.6% 7 4.6% 3 29.2% 21 44.7% 64 23.0% 24London (Central / West End) 0.2% 1 0.9% 1 0.5% 0 0.0% 0 0.0% 0 0.0% 0 0.0% 0 0.0% 0Long Eaton Town Centre 0.8% 6 4.5% 4 0.0% 0 0.0% 0 0.0% 0 0.0% 0 1.1% 2 0.0% 0Loughborough Town Centre 9.1% 64 16.6% 15 8.4% 7 0.0% 0 0.0% 0 6.8% 5 10.8% 15 20.5% 21Melbourne Town Centre 0.5% 3 3.8% 3 0.0% 0 0.0% 0 0.0% 0 0.0% 0 0.0% 0 0.0% 0Moira Village Centre 0.2% 1 0.0% 0 0.0% 0 0.0% 0 0.0% 0 0.6% 0 0.6% 1 0.0% 0Nottingham City Centre 3.8% 27 10.5% 10 1.8% 2 8.6% 12 0.7% 1 2.6% 2 1.1% 2 0.0% 0Nuneaton Town Centre 0.1% 0 0.0% 0 0.0% 0 0.0% 0 0.5% 0 0.0% 0 0.0% 0 0.0% 0Sheffield City Centre 0.1% 1 0.0% 0 0.0% 0 0.0% 0 0.0% 0 0.0% 0 0.0% 0 0.7% 1Shepshed Town Centre 1.1% 7 1.2% 1 6.4% 5 0.0% 0 0.0% 0 0.0% 0 0.6% 1 0.0% 0Swadlincote Town Centre 0.1% 1 0.0% 0 1.0% 1 0.0% 0 0.0% 0 0.0% 0 0.0% 0 0.0% 0Tamworth Town Centre 3.0% 21 0.0% 0 1.1% 1 5.4% 7 11.4% 8 2.0% 1 0.8% 1 1.7% 2York City Centre 0.2% 1 0.6% 1 0.0% 0 0.5% 1 0.0% 0 0.0% 0 0.0% 0 0.0% 0Chilwell Retail Park, Barton
Lane, Beeston,Nottingham (Matalan,Sports Direct, TK Maxx)
0.1% 1 0.9% 1 0.0% 0 0.0% 0 0.0% 0 0.0% 0 0.0% 0 0.0% 0
East Midlands DesignerShopping Outlet,Mansfield Road, SouthNormanton, Alfreton(Sketchers, The BodyShop, Yankee Candle)
0.2% 2 0.0% 0 0.0% 0 0.0% 0 0.0% 0 0.0% 0 1.1% 2 0.0% 0
Fosse Shopping Park, FossePark Avenue, Leicester(JD Sports, Marks &Spencer, ScS)
6.7% 47 0.9% 1 13.5% 11 1.2% 2 6.2% 5 3.0% 2 6.7% 10 16.5% 17
Kingsway Retail Park,Kingsway, Derby (Argos,Halfords, Next)
0.1% 1 0.0% 0 0.7% 1 0.0% 0 0.0% 0 0.0% 0 0.0% 0 0.0% 0
Ventura Retail Park, VenturaPark Road, Tamworth (JDSports, Marks & Spencer,Next)
4.5% 32 0.0% 0 5.0% 4 10.5% 14 14.7% 11 3.4% 2 0.0% 0 0.0% 0
Whitwick Retail Park,Whitwick Road, Coalville(Peacocks, Ponden Mill,Sports Direct)
0.3% 2 0.0% 0 0.0% 0 0.0% 0 0.0% 0 0.4% 0 1.1% 2 0.5% 1
Wyvern Retail Park, WyvernWay, Chaddesden, Derby(Homebase, Next Home,Sainsbury's)
0.1% 1 1.1% 1 0.0% 0 0.0% 0 0.0% 0 0.0% 0 0.0% 0 0.0% 0
Internet / mail order 24.1% 169 21.2% 19 23.6% 20 25.5% 34 28.9% 21 31.6% 23 19.9% 28 22.2% 23Abroad 0.6% 4 1.1% 1 0.5% 0 0.9% 1 0.7% 1 0.0% 0 0.8% 1 0.0% 0Bridlington Town Centre 0.1% 1 0.0% 0 0.0% 0 0.0% 0 0.0% 0 0.0% 0 0.6% 1 0.0% 0Centurion Park, Watling
Street, Wilnecote,Tamworth
0.1% 0 0.0% 0 0.5% 0 0.0% 0 0.0% 0 0.0% 0 0.0% 0 0.0% 0
Chesterfield Town Centre 0.0% 0 0.0% 0 0.0% 0 0.0% 0 0.0% 0 0.4% 0 0.0% 0 0.0% 0Milton Keynes Town Centre 0.1% 1 1.1% 1 0.0% 0 0.0% 0 0.0% 0 0.0% 0 0.0% 0 0.0% 0Royal Leamington Spa Town
Centre0.4% 3 0.0% 0 0.0% 0 2.3% 3 0.0% 0 0.0% 0 0.0% 0 0.0% 0
Solihull Town Centre 0.4% 3 0.0% 0 0.0% 0 2.3% 3 0.0% 0 0.0% 0 0.0% 0 0.0% 0Tesco Extra, Resolution
Road, Ashby-de-la-Zouch0.2% 1 0.0% 0 0.5% 0 0.0% 0 0.0% 0 1.0% 1 0.0% 0 0.0% 0
(Don't know / varies) 1.3% 9 0.0% 0 1.5% 1 2.2% 3 1.5% 1 1.9% 1 0.6% 1 1.5% 2(Don't do this type of
shopping)2.0% 14 2.7% 2 0.0% 0 5.1% 7 1.8% 1 1.9% 1 0.6% 1 1.0% 1
Weighted base: 702 91 85 134 73 72 143 104Sample: 702 100 100 102 100 100 100 100

by Zone North West Leicestershire Retail & Leisure Study Page 13
Weighted: For Lichfields July 2018
Total Zone 1 Zone 2 Zone 3 Zone 4 Zone 5 Zone 6 Zone 7
Column %ges.060718 NEMS market research
Q12 Where else does your household do most of its shopping for clothes and shoes? [MR]Those who buy clothes and shoes at Q11:
Ashby-de-la-Zouch TownCentre
3.0% 21 0.0% 0 4.9% 4 7.6% 10 2.1% 1 3.0% 2 0.0% 0 3.1% 3
Beaumont Leys DistrictCentre
0.1% 1 0.0% 0 0.0% 0 0.0% 0 0.0% 0 0.0% 0 0.6% 1 0.0% 0
Birmingham City Centre 1.7% 12 0.0% 0 5.0% 4 0.7% 1 6.2% 4 0.0% 0 1.1% 2 0.7% 1Burton-on-Trent Town
Centre4.8% 33 0.0% 0 2.5% 2 7.3% 9 8.0% 6 4.1% 3 7.8% 11 1.8% 2
Coalville Town Centre 3.3% 23 0.0% 0 4.0% 3 0.0% 0 0.5% 0 3.9% 3 6.9% 10 6.0% 6Derby City Centre 7.5% 51 11.6% 10 1.3% 1 19.8% 25 7.4% 5 4.6% 3 2.8% 4 2.3% 2Hinckley Town Centre 0.2% 1 0.0% 0 0.0% 0 0.0% 0 0.0% 0 0.4% 0 0.0% 0 1.0% 1Ibstock Town Centre 0.1% 0 0.0% 0 0.0% 0 0.0% 0 0.0% 0 0.6% 0 0.0% 0 0.0% 0Kegworth Village Centre 0.1% 1 0.6% 1 0.0% 0 0.0% 0 0.0% 0 0.0% 0 0.0% 0 0.0% 0Leicester City Centre 13.1% 90 3.6% 3 17.3% 15 15.6% 20 11.8% 8 19.8% 14 9.7% 14 15.7% 16Lichfield City Centre 0.3% 2 0.0% 0 0.5% 0 0.5% 1 1.3% 1 0.0% 0 0.0% 0 0.0% 0London (Central / West End) 0.3% 2 0.6% 1 1.3% 1 0.0% 0 0.0% 0 0.4% 0 0.0% 0 0.0% 0Long Eaton Town Centre 0.6% 4 4.4% 4 0.0% 0 0.0% 0 0.0% 0 0.0% 0 0.0% 0 0.0% 0Loughborough Town Centre 7.2% 50 3.7% 3 9.0% 8 1.3% 2 0.8% 1 7.6% 5 7.1% 10 20.7% 21Nottingham City Centre 5.1% 35 19.6% 17 5.9% 5 2.3% 3 2.4% 2 2.6% 2 2.2% 3 3.2% 3Nuneaton Town Centre 0.2% 1 0.0% 0 0.0% 0 0.0% 0 0.5% 0 0.0% 0 0.6% 1 0.0% 0Sheffield City Centre 0.2% 2 0.0% 0 0.0% 0 0.0% 0 0.0% 0 0.0% 0 1.1% 2 0.0% 0Shepshed Town Centre 0.7% 5 0.6% 1 0.5% 0 0.0% 0 0.5% 0 0.6% 0 1.8% 3 0.5% 1Swadlincote Town Centre 1.1% 8 0.0% 0 0.0% 0 3.2% 4 4.9% 4 0.0% 0 0.0% 0 0.0% 0Tamworth Town Centre 3.5% 24 0.0% 0 3.7% 3 8.7% 11 4.7% 3 6.3% 4 0.6% 1 1.0% 1Thurmaston District Centre 0.1% 1 0.0% 0 0.0% 0 0.0% 0 0.0% 0 0.0% 0 0.0% 0 0.7% 1York City Centre 0.1% 1 0.0% 0 0.0% 0 0.0% 0 0.0% 0 0.0% 0 0.0% 0 0.5% 1Chilwell Retail Park, Barton
Lane, Beeston,Nottingham (Matalan,Sports Direct, TK Maxx)
0.2% 1 1.5% 1 0.0% 0 0.0% 0 0.0% 0 0.0% 0 0.0% 0 0.0% 0
Cross Street Retail Park,Cross Street, Long Eaton(Aldi, Farmfoods, Just forPets)
0.2% 2 0.0% 0 0.0% 0 0.0% 0 0.0% 0 0.0% 0 0.0% 0 1.5% 2
East Midlands DesignerShopping Outlet,Mansfield Road, SouthNormanton, Alfreton(Sketchers, The BodyShop, Yankee Candle)
0.1% 1 0.0% 0 0.0% 0 0.5% 1 0.0% 0 0.0% 0 0.0% 0 0.0% 0
Fosse Shopping Park, FossePark Avenue, Leicester(JD Sports, Marks &Spencer, ScS)
9.4% 65 1.8% 2 4.4% 4 1.0% 1 0.8% 1 13.2% 9 24.1% 34 13.4% 14
Meteor Centre, MansfieldRoad, Derby (AlliedCarpets, Bensons for Beds,DFS)
0.4% 3 2.9% 3 0.0% 0 0.0% 0 0.0% 0 0.0% 0 0.0% 0 0.0% 0
Ventura Retail Park, VenturaPark Road, Tamworth (JDSports, Marks & Spencer,Next)
2.4% 16 0.0% 0 0.0% 0 4.3% 5 12.5% 9 1.6% 1 0.6% 1 0.0% 0
Whitwick Retail Park,Whitwick Road, Coalville(Peacocks, Ponden Mill,Sports Direct)
0.7% 5 0.0% 0 0.0% 0 0.0% 0 0.0% 0 0.8% 1 0.0% 0 3.9% 4
Internet / mail order 6.8% 47 10.6% 9 4.6% 4 7.5% 10 8.9% 6 11.6% 8 3.4% 5 4.3% 4Abroad 0.1% 0 0.0% 0 0.0% 0 0.0% 0 0.5% 0 0.0% 0 0.0% 0 0.0% 0Chilwell Local Centre 0.2% 1 1.2% 1 0.0% 0 0.0% 0 0.0% 0 0.0% 0 0.0% 0 0.0% 0Grantham Town Centre 0.1% 1 0.0% 0 0.0% 0 0.0% 0 0.0% 0 0.0% 0 0.6% 1 0.0% 0Meadowhall Shopping
Centre, Sheffield0.2% 2 0.9% 1 0.0% 0 0.0% 0 0.0% 0 0.0% 0 0.6% 1 0.0% 0
Oxford City Centre 0.2% 2 0.0% 0 0.0% 0 0.0% 0 0.0% 0 0.0% 0 1.1% 2 0.0% 0Solihull Town Centre 0.1% 0 0.0% 0 0.0% 0 0.0% 0 0.5% 0 0.0% 0 0.0% 0 0.0% 0Stevenage Town Centre 0.1% 1 0.0% 0 0.0% 0 0.0% 0 0.0% 0 0.0% 0 0.6% 1 0.0% 0Sutton Coldfield Town
Centre0.1% 1 0.0% 0 0.0% 0 0.0% 0 0.5% 0 0.8% 1 0.0% 0 0.0% 0
Tesco Extra, ResolutionRoad, Ashby-de-la-Zouch
0.1% 1 0.0% 0 1.0% 1 0.0% 0 0.0% 0 0.0% 0 0.0% 0 0.0% 0
Walsall Town Centre 0.1% 1 0.0% 0 0.0% 0 0.0% 0 0.0% 0 0.0% 0 0.6% 1 0.0% 0(Don't know / varies) 1.5% 11 0.0% 0 1.1% 1 1.5% 2 2.3% 2 3.7% 3 1.1% 2 2.0% 2(Nowhere else) 33.2% 229 44.0% 39 39.1% 33 31.3% 40 35.8% 26 25.2% 18 34.8% 49 23.1% 24

by Zone North West Leicestershire Retail & Leisure Study Page 14
Weighted: For Lichfields July 2018
Total Zone 1 Zone 2 Zone 3 Zone 4 Zone 5 Zone 6 Zone 7
Column %ges.060718 NEMS market research
Weighted base: 688 88 85 127 72 71 142 103Sample: 687 96 100 98 97 99 99 98

by Zone North West Leicestershire Retail & Leisure Study Page 15
Weighted: For Lichfields July 2018
Total Zone 1 Zone 2 Zone 3 Zone 4 Zone 5 Zone 6 Zone 7
Column %ges.060718 NEMS market research
Q13 Where does your household do most of its shopping for domestic electric appliances (e.g. fridges and kitchen items), this can includeretail parks and the internet as well as town / district / city centres?
Ashby-de-la-Zouch TownCentre
2.6% 18 0.0% 0 2.0% 2 10.6% 14 1.6% 1 0.4% 0 0.6% 1 0.0% 0
Atherstone Town Centre 0.6% 4 3.8% 3 0.0% 0 0.0% 0 1.0% 1 0.0% 0 0.0% 0 0.0% 0Birmingham City Centre 0.2% 1 0.9% 1 0.7% 1 0.0% 0 0.0% 0 0.0% 0 0.0% 0 0.0% 0Burton-on-Trent Town
Centre2.6% 18 0.0% 0 0.0% 0 6.1% 8 11.5% 8 1.9% 1 0.0% 0 0.0% 0
Castle Donington TownCentre
0.1% 1 0.6% 1 0.0% 0 0.0% 0 0.0% 0 0.0% 0 0.0% 0 0.0% 0
Coalville Town Centre 6.1% 43 0.0% 0 3.2% 3 0.5% 1 0.5% 0 12.2% 9 15.6% 22 7.9% 8Derby City Centre 0.9% 7 6.4% 6 1.0% 1 0.0% 0 0.0% 0 0.0% 0 0.0% 0 0.0% 0Ibstock Town Centre 2.4% 17 0.0% 0 1.1% 1 0.9% 1 1.1% 1 9.6% 7 3.7% 5 1.5% 2Ilkeston Town Centre 0.0% 0 0.0% 0 0.0% 0 0.0% 0 0.0% 0 0.4% 0 0.0% 0 0.0% 0Leicester City Centre 5.0% 35 0.0% 0 1.1% 1 1.2% 2 0.5% 0 11.8% 9 8.4% 12 11.5% 12Long Eaton Town Centre 0.4% 3 2.9% 3 0.0% 0 0.0% 0 0.0% 0 0.0% 0 0.0% 0 0.0% 0Loughborough Town Centre 6.4% 45 5.4% 5 12.3% 10 1.2% 2 2.4% 2 1.2% 1 11.5% 16 8.4% 9Measham Village Centre 0.1% 0 0.0% 0 0.0% 0 0.0% 0 0.5% 0 0.0% 0 0.0% 0 0.0% 0Melbourne Town Centre 0.2% 1 0.0% 0 1.3% 1 0.0% 0 0.0% 0 0.0% 0 0.0% 0 0.0% 0Nottingham City Centre 1.5% 11 5.4% 5 1.1% 1 3.6% 5 0.0% 0 0.0% 0 0.0% 0 0.0% 0Swadlincote Town Centre 1.2% 8 0.0% 0 1.0% 1 4.1% 5 3.0% 2 0.0% 0 0.0% 0 0.0% 0Tamworth Town Centre 2.5% 17 0.0% 0 1.1% 1 9.8% 13 4.4% 3 0.0% 0 0.0% 0 0.0% 0Centrum East Retail Park,
Wellington Road,Burton-on-Trent(Carpetright, Currys PCWorld, Dreams)
0.3% 2 0.0% 0 0.0% 0 0.0% 0 2.5% 2 0.4% 0 0.0% 0 0.0% 0
Fosse Shopping Park, FossePark Avenue, Leicester(JD Sports, Marks &Spencer, ScS)
6.7% 47 0.0% 0 7.1% 6 4.8% 6 0.0% 0 6.4% 5 13.5% 19 10.5% 11
Jolly Sailor Retail Park,Bonehill Road, Bitterscote,Tamworth (Argos,Poundland, TK Maxx)
0.0% 0 0.0% 0 0.0% 0 0.0% 0 0.0% 0 0.4% 0 0.0% 0 0.0% 0
Kingsway Retail Park,Kingsway, Derby (Argos,Halfords, Next)
0.7% 5 3.1% 3 2.4% 2 0.0% 0 0.0% 0 0.0% 0 0.0% 0 0.0% 0
Meteor Centre, MansfieldRoad, Derby (AlliedCarpets, Bensons for Beds,DFS)
0.1% 1 0.6% 1 0.0% 0 0.0% 0 0.0% 0 0.0% 0 0.0% 0 0.0% 0
Regents Place Retail Park,Broad Street,Loughborough (CarphoneWarehouse, Currys PCWorld, Dunelm)
2.5% 18 12.0% 11 0.5% 0 0.0% 0 0.0% 0 0.0% 0 1.4% 2 4.1% 4
Ventura Retail Park, VenturaPark Road, Tamworth (JDSports, Marks & Spencer,Next)
2.7% 19 0.0% 0 4.5% 4 5.0% 7 8.0% 6 0.0% 0 0.0% 0 2.3% 2
Willowbrook Retail Park,Derby Road,Loughborough (B&M,Dreams, Halfords)
0.6% 4 0.0% 0 3.2% 3 0.0% 0 0.0% 0 0.0% 0 0.0% 0 1.4% 1
Wyvern Retail Park, WyvernWay, Chaddesden, Derby(Homebase, Next Home,Sainsbury's)
0.4% 3 3.2% 3 0.0% 0 0.0% 0 0.0% 0 0.0% 0 0.0% 0 0.0% 0
Internet / mail order 41.2% 289 39.4% 36 44.5% 38 32.8% 44 50.0% 37 47.9% 35 41.3% 59 40.0% 42Bardon 22 Industrial Estate,
Bardon Hill, Coalville0.1% 0 0.0% 0 0.5% 0 0.0% 0 0.0% 0 0.0% 0 0.0% 0 0.0% 0
Centurion Park, WatlingStreet, Wilnecote,Tamworth
0.1% 0 0.0% 0 0.5% 0 0.0% 0 0.0% 0 0.0% 0 0.0% 0 0.0% 0
Tesco Extra, ResolutionRoad, Ashby-de-la-Zouch
0.2% 1 0.0% 0 0.0% 0 0.0% 0 0.7% 1 1.0% 1 0.0% 0 0.0% 0
Thrigstone Village Centre 0.1% 1 0.0% 0 1.0% 1 0.0% 0 0.0% 0 0.0% 0 0.0% 0 0.0% 0(Don't know / varies) 3.1% 22 1.7% 2 0.5% 0 6.4% 9 2.1% 2 0.8% 1 1.2% 2 6.9% 7(Don't do this type of
shopping)8.5% 60 14.6% 13 9.7% 8 12.9% 17 10.1% 7 5.6% 4 2.9% 4 5.3% 6
Weighted base: 702 91 85 134 73 72 143 104Sample: 702 100 100 102 100 100 100 100

by Zone North West Leicestershire Retail & Leisure Study Page 16
Weighted: For Lichfields July 2018
Total Zone 1 Zone 2 Zone 3 Zone 4 Zone 5 Zone 6 Zone 7
Column %ges.060718 NEMS market research

by Zone North West Leicestershire Retail & Leisure Study Page 17
Weighted: For Lichfields July 2018
Total Zone 1 Zone 2 Zone 3 Zone 4 Zone 5 Zone 6 Zone 7
Column %ges.060718 NEMS market research
Q14 Where else does your household do most of its shopping for domestic electric appliances (e.g. fridges and kitchen items)? [MR]Those who buy domestic electric appliances at Q13:
Ashby-de-la-Zouch TownCentre
1.6% 10 0.0% 0 4.6% 4 5.1% 6 0.0% 0 0.8% 1 0.0% 0 0.0% 0
Birmingham City Centre 0.1% 0 0.0% 0 0.0% 0 0.0% 0 0.6% 0 0.0% 0 0.0% 0 0.0% 0Burton-on-Trent Town
Centre1.8% 12 1.3% 1 1.7% 1 6.6% 8 0.6% 0 0.0% 0 0.8% 1 0.0% 0
Castle Donington TownCentre
0.1% 1 0.7% 1 0.0% 0 0.0% 0 0.0% 0 0.0% 0 0.0% 0 0.0% 0
Coalville Town Centre 2.2% 14 0.0% 0 2.0% 2 1.1% 1 0.8% 1 0.5% 0 3.5% 5 5.6% 6Derby City Centre 1.4% 9 2.8% 2 4.6% 4 1.4% 2 0.0% 0 2.0% 1 0.0% 0 0.0% 0Hinckley Town Centre 0.2% 1 0.0% 0 0.0% 0 0.0% 0 0.0% 0 0.0% 0 0.0% 0 1.0% 1Ibstock Town Centre 1.0% 6 0.0% 0 0.6% 0 0.0% 0 0.0% 0 3.1% 2 2.2% 3 0.5% 1Leicester City Centre 3.2% 21 0.7% 1 3.1% 2 1.7% 2 0.0% 0 9.3% 6 2.7% 4 5.8% 6Lichfield City Centre 0.1% 1 0.0% 0 0.0% 0 0.6% 1 0.0% 0 0.0% 0 0.0% 0 0.0% 0Long Eaton Town Centre 0.1% 1 0.0% 0 1.1% 1 0.0% 0 0.0% 0 0.0% 0 0.0% 0 0.0% 0Loughborough Town Centre 5.4% 35 5.6% 4 8.4% 6 4.2% 5 0.0% 0 1.9% 1 5.2% 7 10.6% 10Nottingham City Centre 1.9% 12 8.7% 7 0.8% 1 3.6% 4 0.8% 1 0.5% 0 0.0% 0 0.0% 0Shepshed Town Centre 0.1% 0 0.0% 0 0.6% 0 0.0% 0 0.0% 0 0.0% 0 0.0% 0 0.0% 0Swadlincote Town Centre 0.7% 4 0.0% 0 0.0% 0 0.8% 1 1.6% 1 0.0% 0 0.0% 0 2.5% 2Tamworth Town Centre 2.3% 15 0.0% 0 0.0% 0 1.4% 2 5.1% 3 6.0% 4 4.2% 6 0.0% 0Castle Marina Retail Park,
Castle Bridge Road,Nottingham (Bensons forBeds, Harveys, Pets at Home)
0.1% 1 1.0% 1 0.0% 0 0.0% 0 0.0% 0 0.0% 0 0.0% 0 0.0% 0
Centrum East Retail Park,Wellington Road,Burton-on-Trent(Carpetright, Currys PCWorld, Dreams)
0.5% 3 0.0% 0 0.0% 0 0.0% 0 3.6% 2 0.0% 0 0.0% 0 1.0% 1
Fosse Shopping Park, FossePark Avenue, Leicester(JD Sports, Marks &Spencer, ScS)
4.3% 28 0.0% 0 5.1% 4 1.4% 2 0.6% 0 3.0% 2 9.2% 13 7.1% 7
Giltbrook Retail Park, IkeaWay, Giltbrook,Nottingham (Harveys,Ikea, Sofology)
0.2% 1 1.3% 1 0.0% 0 0.0% 0 0.0% 0 0.0% 0 0.0% 0 0.0% 0
Regents Place Retail Park,Broad Street,Loughborough (CarphoneWarehouse, Currys PCWorld, Dunelm)
0.7% 4 0.0% 0 0.8% 1 0.8% 1 0.0% 0 0.6% 0 0.0% 0 2.4% 2
St George's Retail Park, StGeorge's Way, Leicester(Aldi, Currys PC World,Wickes)
0.4% 3 0.0% 0 0.0% 0 0.0% 0 0.0% 0 0.6% 0 1.1% 2 0.8% 1
Ventura Retail Park, VenturaPark Road, Tamworth (JDSports, Marks & Spencer,Next)
1.5% 10 0.0% 0 0.0% 0 5.2% 6 3.6% 2 0.5% 0 0.8% 1 0.0% 0
Whitwick Retail Park,Whitwick Road, Coalville(Peacocks, Ponden Mill,Sports Direct)
0.2% 2 0.0% 0 0.0% 0 0.0% 0 0.0% 0 1.1% 1 0.6% 1 0.0% 0
Willowbrook Retail Park,Derby Road,Loughborough (B&M,Dreams, Halfords)
0.2% 2 0.0% 0 0.0% 0 0.0% 0 0.0% 0 0.0% 0 1.1% 2 0.0% 0
Wyvern Retail Park, WyvernWay, Chaddesden, Derby(Homebase, Next Home,Sainsbury's)
0.3% 2 2.7% 2 0.0% 0 0.0% 0 0.0% 0 0.0% 0 0.0% 0 0.0% 0
Internet / mail order 7.2% 46 10.3% 8 3.0% 2 12.5% 15 9.6% 6 12.2% 8 2.3% 3 3.4% 3Currys PC World, Axletree
Way, Wednesbury0.1% 1 0.0% 0 0.0% 0 0.0% 0 0.8% 1 0.0% 0 0.0% 0 0.0% 0
Tesco Extra, ResolutionRoad, Ashby-de-la-Zouch
0.1% 1 0.0% 0 0.0% 0 0.0% 0 0.6% 0 0.6% 0 0.0% 0 0.0% 0
(Don't know / varies) 2.1% 13 3.4% 3 0.0% 0 1.2% 1 4.0% 3 0.9% 1 0.8% 1 4.9% 5(Nowhere else) 61.9% 397 62.1% 48 68.3% 52 53.1% 62 68.3% 45 57.9% 40 69.4% 96 55.0% 54Weighted base: 642 77 77 117 66 68 139 99Sample: 629 84 88 87 89 94 95 92

by Zone North West Leicestershire Retail & Leisure Study Page 18
Weighted: For Lichfields July 2018
Total Zone 1 Zone 2 Zone 3 Zone 4 Zone 5 Zone 6 Zone 7
Column %ges.060718 NEMS market research

by Zone North West Leicestershire Retail & Leisure Study Page 19
Weighted: For Lichfields July 2018
Total Zone 1 Zone 2 Zone 3 Zone 4 Zone 5 Zone 6 Zone 7
Column %ges.060718 NEMS market research
Q15 Where does your household do most of its shopping for other kinds of electric goods such as TV / Hi-Fi and computers, this caninclude retail parks and the internet as well as town / district / city centres?
Ashby-de-la-Zouch TownCentre
4.7% 33 0.0% 0 5.2% 4 8.9% 12 2.3% 2 2.5% 2 9.2% 13 0.0% 0
Atherstone Town Centre 0.1% 1 0.0% 0 0.0% 0 0.0% 0 1.0% 1 0.0% 0 0.0% 0 0.0% 0Beaumont Leys District
Centre0.1% 1 0.0% 0 0.0% 0 0.0% 0 0.0% 0 0.0% 0 0.0% 0 0.9% 1
Birmingham City Centre 0.2% 1 0.9% 1 0.0% 0 0.0% 0 0.5% 0 0.0% 0 0.0% 0 0.0% 0Burton-on-Trent Town
Centre1.8% 13 1.1% 1 0.5% 0 5.8% 8 4.9% 4 0.0% 0 0.0% 0 0.0% 0
Castle Donington TownCentre
0.5% 3 3.8% 3 0.0% 0 0.0% 0 0.0% 0 0.0% 0 0.0% 0 0.0% 0
Coalville Town Centre 4.7% 33 0.0% 0 4.7% 4 0.5% 1 2.3% 2 6.7% 5 11.4% 16 5.6% 6Coventry City Centre 0.7% 5 0.0% 0 0.0% 0 0.0% 0 0.0% 0 0.0% 0 3.6% 5 0.0% 0Derby City Centre 1.4% 10 7.6% 7 1.5% 1 0.0% 0 2.4% 2 0.0% 0 0.0% 0 0.0% 0Ibstock Town Centre 2.3% 16 0.0% 0 1.6% 1 2.2% 3 1.6% 1 5.1% 4 2.9% 4 2.5% 3Leicester City Centre 6.2% 44 1.5% 1 4.5% 4 3.5% 5 5.8% 4 10.0% 7 7.6% 11 11.0% 11Lichfield City Centre 0.1% 1 0.0% 0 0.0% 0 0.7% 1 0.0% 0 0.0% 0 0.0% 0 0.0% 0Long Eaton Town Centre 1.0% 7 7.6% 7 0.0% 0 0.0% 0 0.0% 0 0.0% 0 0.0% 0 0.0% 0Loughborough Town Centre 6.9% 48 11.4% 10 10.4% 9 2.4% 3 0.7% 1 0.6% 0 10.6% 15 9.5% 10Measham Village Centre 0.1% 0 0.0% 0 0.0% 0 0.0% 0 0.5% 0 0.0% 0 0.0% 0 0.0% 0Melbourne Town Centre 0.2% 2 0.0% 0 1.8% 2 0.0% 0 0.0% 0 0.0% 0 0.0% 0 0.0% 0Nottingham City Centre 1.3% 9 7.4% 7 0.5% 0 0.5% 1 0.0% 0 0.0% 0 0.0% 0 0.9% 1Swadlincote Town Centre 1.6% 12 0.0% 0 1.0% 1 5.9% 8 0.5% 0 0.0% 0 0.0% 0 2.3% 2Tamworth Town Centre 2.7% 19 0.0% 0 1.1% 1 7.9% 11 5.7% 4 1.2% 1 0.8% 1 0.9% 1Castle Marina Retail Park,
Castle Bridge Road,Nottingham (Bensons forBeds, Harveys, Pets at Home)
0.1% 1 0.9% 1 0.0% 0 0.0% 0 0.0% 0 0.0% 0 0.0% 0 0.0% 0
Centrum East Retail Park,Wellington Road,Burton-on-Trent(Carpetright, Currys PCWorld, Dreams)
1.0% 7 0.0% 0 0.0% 0 0.0% 0 7.8% 6 0.0% 0 0.0% 0 0.9% 1
Fosse Shopping Park, FossePark Avenue, Leicester(JD Sports, Marks &Spencer, ScS)
10.8% 76 0.9% 1 12.1% 10 9.4% 13 0.5% 0 14.6% 11 19.3% 28 12.9% 13
Giltbrook Retail Park, IkeaWay, Giltbrook,Nottingham (Harveys,Ikea, Sofology)
0.1% 1 1.1% 1 0.0% 0 0.0% 0 0.0% 0 0.0% 0 0.0% 0 0.0% 0
Kingsway Retail Park,Kingsway, Derby (Argos,Halfords, Next)
0.5% 4 2.0% 2 2.4% 2 0.0% 0 0.0% 0 0.0% 0 0.0% 0 0.0% 0
Meteor Centre, MansfieldRoad, Derby (AlliedCarpets, Bensons for Beds,DFS)
0.2% 1 1.5% 1 0.0% 0 0.0% 0 0.0% 0 0.0% 0 0.0% 0 0.0% 0
Regents Place Retail Park,Broad Street,Loughborough (CarphoneWarehouse, Currys PCWorld, Dunelm)
2.8% 20 4.9% 4 1.7% 1 0.7% 1 0.0% 0 3.8% 3 0.0% 0 9.5% 10
St George's Retail Park, StGeorge's Way, Leicester(Aldi, Currys PC World,Wickes)
0.2% 2 0.0% 0 0.5% 0 0.0% 0 0.0% 0 0.6% 0 0.0% 0 0.7% 1
Ventura Retail Park, VenturaPark Road, Tamworth (JDSports, Marks & Spencer,Next)
2.5% 18 0.0% 0 0.0% 0 7.2% 10 9.7% 7 0.0% 0 0.6% 1 0.0% 0
Whitwick Retail Park,Whitwick Road, Coalville(Peacocks, Ponden Mill,Sports Direct)
0.1% 1 0.0% 0 0.0% 0 0.0% 0 0.0% 0 0.0% 0 0.6% 1 0.0% 0
Willowbrook Retail Park,Derby Road,Loughborough (B&M,Dreams, Halfords)
0.8% 5 0.9% 1 3.2% 3 0.0% 0 0.0% 0 0.6% 0 1.1% 2 0.0% 0
Wyvern Retail Park, WyvernWay, Chaddesden, Derby
0.4% 3 3.2% 3 0.0% 0 0.0% 0 0.0% 0 0.0% 0 0.0% 0 0.0% 0

by Zone North West Leicestershire Retail & Leisure Study Page 20
Weighted: For Lichfields July 2018
Total Zone 1 Zone 2 Zone 3 Zone 4 Zone 5 Zone 6 Zone 7
Column %ges.060718 NEMS market research
(Homebase, Next Home,Sainsbury's)
Internet / mail order 29.6% 208 22.1% 20 40.0% 34 22.9% 31 40.6% 30 45.2% 33 20.5% 29 30.3% 32Brook Park, Gaddesby Lane,
Rearsby0.2% 2 0.0% 0 0.0% 0 0.0% 0 0.0% 0 0.0% 0 1.1% 2 0.0% 0
Centurion Park, WatlingStreet, Wilnecote,Tamworth
0.1% 0 0.0% 0 0.5% 0 0.0% 0 0.0% 0 0.0% 0 0.0% 0 0.0% 0
Corby Town Centre 0.1% 1 0.0% 0 1.0% 1 0.0% 0 0.0% 0 0.0% 0 0.0% 0 0.0% 0Durham City Centre 0.1% 1 0.6% 1 0.0% 0 0.0% 0 0.0% 0 0.0% 0 0.0% 0 0.0% 0Madford Retail Park,
Foregate Street, Stafford0.1% 1 0.0% 0 0.0% 0 0.0% 0 1.0% 1 0.0% 0 0.0% 0 0.0% 0
Stevenage Town Centre 0.1% 1 0.0% 0 0.0% 0 0.0% 0 0.0% 0 0.0% 0 0.6% 1 0.0% 0Tesco Extra, Resolution
Road, Ashby-de-la-Zouch1.7% 12 0.0% 0 0.0% 0 0.7% 1 2.3% 2 2.2% 2 2.6% 4 3.7% 4
(Don't know / varies) 1.3% 9 0.6% 1 2.2% 2 1.2% 2 1.8% 1 0.4% 0 0.6% 1 2.2% 2(Don't do this type of
shopping)10.6% 74 20.1% 18 3.7% 3 19.7% 26 8.1% 6 6.4% 5 6.9% 10 6.0% 6
Weighted base: 702 91 85 134 73 72 143 104Sample: 702 100 100 102 100 100 100 100

by Zone North West Leicestershire Retail & Leisure Study Page 21
Weighted: For Lichfields July 2018
Total Zone 1 Zone 2 Zone 3 Zone 4 Zone 5 Zone 6 Zone 7
Column %ges.060718 NEMS market research
Q16 Where else does your household do most of its shopping for other kinds of electric goods such as TV / Hi-Fi and computers? [MR]Those who buy other kinds of electric goods at Q15:
Ashby-de-la-Zouch TownCentre
1.4% 9 0.8% 1 1.0% 1 3.9% 4 0.0% 0 3.4% 2 0.6% 1 0.0% 0
Beaumont Leys DistrictCentre
0.2% 1 0.0% 0 0.0% 0 0.0% 0 0.0% 0 0.0% 0 0.0% 0 1.0% 1
Birmingham City Centre 0.1% 1 0.0% 0 0.0% 0 0.0% 0 0.0% 0 0.8% 1 0.0% 0 0.0% 0Burton-on-Trent Town
Centre0.7% 4 0.0% 0 2.0% 2 2.4% 3 0.0% 0 0.0% 0 0.0% 0 0.0% 0
Coalville Town Centre 1.9% 12 0.0% 0 4.8% 4 1.2% 1 0.0% 0 3.0% 2 0.0% 0 4.9% 5Derby City Centre 1.5% 9 1.6% 1 4.1% 3 2.4% 3 1.1% 1 2.0% 1 0.0% 0 0.0% 0Ibstock Town Centre 0.7% 4 0.0% 0 0.0% 0 0.0% 0 0.8% 1 1.7% 1 1.2% 2 1.1% 1Leicester City Centre 4.3% 27 0.0% 0 5.0% 4 4.8% 5 0.0% 0 8.1% 6 4.2% 6 6.6% 6Lichfield City Centre 0.3% 2 0.0% 0 0.0% 0 1.2% 1 0.8% 1 0.0% 0 0.0% 0 0.0% 0Long Eaton Town Centre 0.1% 1 0.8% 1 0.0% 0 0.0% 0 0.0% 0 0.0% 0 0.0% 0 0.0% 0Loughborough Town Centre 4.2% 26 3.3% 2 7.7% 6 2.4% 3 0.0% 0 1.7% 1 1.5% 2 12.0% 12Nottingham City Centre 2.9% 18 8.8% 6 0.0% 0 7.8% 8 2.6% 2 0.0% 0 1.5% 2 0.0% 0Sheffield City Centre 0.1% 1 0.0% 0 0.0% 0 0.0% 0 1.1% 1 0.0% 0 0.0% 0 0.0% 0Shepshed Town Centre 0.1% 0 0.0% 0 0.5% 0 0.0% 0 0.0% 0 0.0% 0 0.0% 0 0.0% 0Swadlincote Town Centre 0.1% 1 0.0% 0 0.0% 0 0.0% 0 0.8% 1 0.0% 0 0.0% 0 0.0% 0Tamworth Town Centre 2.3% 14 0.0% 0 3.3% 3 4.7% 5 3.4% 2 0.6% 0 2.8% 4 0.0% 0Thurmaston District Centre 0.1% 1 0.0% 0 0.0% 0 0.0% 0 0.0% 0 0.0% 0 0.0% 0 0.8% 1Castle Marina Retail Park,
Castle Bridge Road,Nottingham (Bensons forBeds, Harveys, Pets at Home)
0.1% 1 1.1% 1 0.0% 0 0.0% 0 0.0% 0 0.0% 0 0.0% 0 0.0% 0
Centrum East Retail Park,Wellington Road,Burton-on-Trent(Carpetright, Currys PCWorld, Dreams)
0.1% 1 0.0% 0 0.0% 0 0.0% 0 1.4% 1 0.0% 0 0.0% 0 0.0% 0
Fosse Shopping Park, FossePark Avenue, Leicester(JD Sports, Marks &Spencer, ScS)
3.9% 25 1.1% 1 2.5% 2 0.0% 0 0.0% 0 3.9% 3 7.9% 10 8.9% 9
Kingsway Retail Park,Kingsway, Derby (Argos,Halfords, Next)
0.3% 2 1.6% 1 0.0% 0 0.6% 1 0.0% 0 0.0% 0 0.0% 0 0.0% 0
Meteor Centre, MansfieldRoad, Derby (AlliedCarpets, Bensons for Beds,DFS)
0.1% 1 0.8% 1 0.0% 0 0.0% 0 0.0% 0 0.0% 0 0.0% 0 0.0% 0
Regents Place Retail Park,Broad Street,Loughborough (CarphoneWarehouse, Currys PCWorld, Dunelm)
1.4% 9 6.0% 4 0.5% 0 0.0% 0 0.0% 0 0.0% 0 2.8% 4 0.0% 0
St George's Retail Park, StGeorge's Way, Leicester(Aldi, Currys PC World,Wickes)
0.2% 2 0.0% 0 0.0% 0 0.0% 0 0.0% 0 0.0% 0 1.2% 2 0.0% 0
Ventura Retail Park, VenturaPark Road, Tamworth (JDSports, Marks & Spencer,Next)
0.8% 5 0.0% 0 0.5% 0 1.8% 2 2.7% 2 0.0% 0 0.6% 1 0.0% 0
Whitwick Retail Park,Whitwick Road, Coalville(Peacocks, Ponden Mill,Sports Direct)
0.1% 1 0.0% 0 0.0% 0 0.0% 0 0.0% 0 0.0% 0 0.0% 0 0.5% 1
Willowbrook Retail Park,Derby Road,Loughborough (B&M,Dreams, Halfords)
0.2% 1 0.0% 0 0.0% 0 0.0% 0 0.0% 0 0.6% 0 0.0% 0 0.8% 1
Wyvern Retail Park, WyvernWay, Chaddesden, Derby(Homebase, Next Home,Sainsbury's)
0.3% 2 2.9% 2 0.0% 0 0.0% 0 0.0% 0 0.0% 0 0.0% 0 0.0% 0
Internet / mail order 8.8% 55 3.6% 3 3.5% 3 9.5% 10 11.1% 7 5.2% 4 11.7% 16 13.3% 13Milton Keynes Town Centre 0.2% 1 1.4% 1 0.0% 0 0.0% 0 0.0% 0 0.0% 0 0.0% 0 0.0% 0Tesco Extra, Resolution
Road, Ashby-de-la-Zouch0.3% 2 0.0% 0 0.0% 0 0.0% 0 0.0% 0 0.6% 0 0.0% 0 1.8% 2
(Don't know / varies) 2.0% 13 2.6% 2 3.9% 3 0.6% 1 2.2% 1 0.5% 0 1.2% 2 3.6% 3

by Zone North West Leicestershire Retail & Leisure Study Page 22
Weighted: For Lichfields July 2018
Total Zone 1 Zone 2 Zone 3 Zone 4 Zone 5 Zone 6 Zone 7
Column %ges.060718 NEMS market research
(Nowhere else) 61.5% 386 63.7% 46 62.0% 51 58.8% 63 73.2% 49 70.2% 48 63.4% 84 45.9% 45Weighted base: 628 72 82 108 67 68 133 98Sample: 625 81 93 84 89 94 89 95

by Zone North West Leicestershire Retail & Leisure Study Page 23
Weighted: For Lichfields July 2018
Total Zone 1 Zone 2 Zone 3 Zone 4 Zone 5 Zone 6 Zone 7
Column %ges.060718 NEMS market research
Q17 Where does your household do most of its shopping for furniture, soft furnishings and floor-coverings, this can include retail parks andthe internet as well as town / district / city centres?
Anstey Village Centre 0.6% 4 0.0% 0 1.3% 1 0.0% 0 0.0% 0 0.0% 0 1.1% 2 1.7% 2Ashby-de-la-Zouch Town
Centre5.1% 36 0.0% 0 1.3% 1 20.7% 28 2.0% 1 4.6% 3 0.8% 1 1.2% 1
Birmingham City Centre 0.2% 1 0.0% 0 0.0% 0 0.0% 0 1.3% 1 0.8% 1 0.0% 0 0.0% 0Burton-on-Trent Town
Centre2.0% 14 0.0% 0 0.0% 0 3.0% 4 11.6% 8 0.9% 1 0.0% 0 0.9% 1
Castle Donington TownCentre
0.1% 1 1.1% 1 0.0% 0 0.0% 0 0.0% 0 0.0% 0 0.0% 0 0.0% 0
Castle Gresley VillageCentre
0.5% 3 0.0% 0 0.5% 0 0.5% 1 1.5% 1 0.4% 0 0.6% 1 0.0% 0
Church Gresley VillageCentre
0.5% 4 0.0% 0 0.0% 0 0.5% 1 0.7% 1 0.0% 0 1.1% 2 0.7% 1
Coalville Town Centre 11.4% 80 0.0% 0 15.2% 13 1.7% 2 7.4% 5 18.0% 13 22.7% 32 13.2% 14Derby City Centre 2.1% 15 10.4% 9 6.3% 5 0.0% 0 0.0% 0 0.0% 0 0.0% 0 0.0% 0Ibstock Town Centre 0.8% 6 0.0% 0 0.0% 0 0.0% 0 0.0% 0 7.9% 6 0.0% 0 0.0% 0Leicester City Centre 4.5% 31 0.0% 0 3.4% 3 1.6% 2 1.8% 1 8.9% 6 9.5% 14 4.7% 5Long Eaton Town Centre 0.5% 4 4.2% 4 0.0% 0 0.0% 0 0.0% 0 0.0% 0 0.0% 0 0.0% 0Loughborough Town Centre 5.5% 39 13.4% 12 8.0% 7 0.7% 1 0.5% 0 3.1% 2 5.9% 8 7.6% 8Measham Village Centre 2.6% 18 0.0% 0 0.0% 0 4.6% 6 4.5% 3 5.6% 4 1.9% 3 1.7% 2Nottingham City Centre 2.2% 15 4.0% 4 1.1% 1 4.6% 6 0.0% 0 0.6% 0 1.9% 3 1.4% 1Nuneaton Town Centre 0.2% 1 0.6% 1 0.0% 0 0.0% 0 1.0% 1 0.0% 0 0.0% 0 0.0% 0Swadlincote Town Centre 3.3% 23 0.0% 0 3.3% 3 8.1% 11 5.5% 4 3.6% 3 1.2% 2 0.9% 1Tamworth Town Centre 2.0% 14 0.0% 0 0.5% 0 7.1% 9 5.6% 4 0.0% 0 0.0% 0 0.0% 0Thurmaston District Centre 0.0% 0 0.0% 0 0.0% 0 0.0% 0 0.0% 0 0.4% 0 0.0% 0 0.0% 0Castle Marina Retail Park,
Castle Bridge Road,Nottingham (Bensons forBeds, Harveys, Pets at Home)
0.1% 1 0.9% 1 0.0% 0 0.0% 0 0.0% 0 0.0% 0 0.0% 0 0.0% 0
Centrum East Retail Park,Wellington Road,Burton-on-Trent(Carpetright, Currys PCWorld, Dreams)
0.1% 1 0.0% 0 0.0% 0 0.0% 0 0.7% 1 0.0% 0 0.0% 0 0.0% 0
Fosse Shopping Park, FossePark Avenue, Leicester(JD Sports, Marks &Spencer, ScS)
5.9% 41 2.0% 2 2.9% 2 2.8% 4 1.3% 1 6.9% 5 12.4% 18 9.3% 10
Giltbrook Retail Park, IkeaWay, Giltbrook,Nottingham (Harveys,Ikea, Sofology)
2.0% 14 3.1% 3 0.0% 0 1.9% 3 0.7% 1 3.6% 3 1.1% 2 3.9% 4
Meteor Centre, MansfieldRoad, Derby (AlliedCarpets, Bensons for Beds,DFS)
0.3% 2 0.9% 1 0.0% 0 0.0% 0 0.0% 0 0.0% 0 1.1% 2 0.0% 0
Regents Place Retail Park,Broad Street,Loughborough (CarphoneWarehouse, Currys PCWorld, Dunelm)
1.5% 11 0.6% 1 1.3% 1 0.0% 0 0.0% 0 2.3% 2 3.2% 5 2.5% 3
Riverside Retail Park,Electric Avenue,Nottingham (B&Q, Next,Topshop)
0.6% 4 0.0% 0 0.0% 0 3.1% 4 0.0% 0 0.0% 0 0.0% 0 0.0% 0
Ventura Retail Park, VenturaPark Road, Tamworth (JDSports, Marks & Spencer,Next)
1.1% 8 0.0% 0 0.0% 0 3.8% 5 2.5% 2 0.0% 0 0.6% 1 0.0% 0
Whitwick Retail Park,Whitwick Road, Coalville(Peacocks, Ponden Mill,Sports Direct)
0.3% 2 0.0% 0 0.0% 0 0.0% 0 0.0% 0 0.0% 0 1.7% 2 0.0% 0
Willowbrook Retail Park,Derby Road,Loughborough (B&M,Dreams, Halfords)
0.9% 6 2.6% 2 0.0% 0 0.0% 0 0.0% 0 0.0% 0 1.9% 3 0.9% 1
Wyvern Retail Park, WyvernWay, Chaddesden, Derby(Homebase, Next Home,Sainsbury's)
0.3% 2 2.6% 2 0.0% 0 0.0% 0 0.0% 0 0.0% 0 0.0% 0 0.0% 0

by Zone North West Leicestershire Retail & Leisure Study Page 24
Weighted: For Lichfields July 2018
Total Zone 1 Zone 2 Zone 3 Zone 4 Zone 5 Zone 6 Zone 7
Column %ges.060718 NEMS market research
Internet / mail order 13.6% 96 14.9% 14 16.4% 14 6.3% 8 23.2% 17 11.7% 8 11.7% 17 16.9% 18B&Q, Jubilee Drive, Belton
Road, Loughborough0.1% 1 0.0% 0 0.0% 0 0.0% 0 0.0% 0 0.0% 0 0.6% 1 0.0% 0
Centurion Park, WatlingStreet, Wilnecote,Tamworth
0.1% 0 0.0% 0 0.5% 0 0.0% 0 0.0% 0 0.0% 0 0.0% 0 0.0% 0
Durham City Centre 0.1% 1 0.6% 1 0.0% 0 0.0% 0 0.0% 0 0.0% 0 0.0% 0 0.0% 0Gallagher Shopping Park,
Axletree Way,Wednesbury
0.1% 1 0.0% 0 0.0% 0 0.0% 0 0.0% 0 0.8% 1 0.0% 0 0.0% 0
Kidderminster Town Centre 0.3% 2 0.0% 0 2.4% 2 0.0% 0 0.0% 0 0.0% 0 0.0% 0 0.0% 0Matlock Town Centre 0.1% 1 0.0% 0 0.0% 0 0.7% 1 0.0% 0 0.0% 0 0.0% 0 0.0% 0Newhall Town Centre 0.2% 1 0.0% 0 1.0% 1 0.0% 0 0.5% 0 0.0% 0 0.0% 0 0.0% 0Ravenstone Village Centre 0.0% 0 0.0% 0 0.0% 0 0.0% 0 0.0% 0 0.4% 0 0.0% 0 0.0% 0(Don't know / varies) 9.5% 66 4.8% 4 17.8% 15 7.8% 10 13.5% 10 8.5% 6 4.5% 6 13.4% 14(Don't do this type of
shopping)18.6% 131 33.2% 30 16.9% 14 20.4% 27 14.1% 10 10.9% 8 14.7% 21 18.9% 20
Weighted base: 702 91 85 134 73 72 143 104Sample: 702 100 100 102 100 100 100 100

by Zone North West Leicestershire Retail & Leisure Study Page 25
Weighted: For Lichfields July 2018
Total Zone 1 Zone 2 Zone 3 Zone 4 Zone 5 Zone 6 Zone 7
Column %ges.060718 NEMS market research
Q18 Where else does your household do most of its shopping for furniture, soft furnishings and floor-coverings? [MR]Those who buy furniture, soft furnishings and floor-coverings at Q17
Anstey Village Centre 0.1% 1 0.0% 0 0.0% 0 0.0% 0 0.0% 0 0.0% 0 0.0% 0 0.6% 1Ashby-de-la-Zouch Town
Centre1.2% 7 0.0% 0 1.8% 1 4.0% 4 1.1% 1 0.7% 0 0.0% 0 0.0% 0
Birmingham City Centre 0.7% 4 0.0% 0 0.0% 0 0.0% 0 0.9% 1 0.5% 0 0.0% 0 4.0% 3Burton-on-Trent Town
Centre0.4% 3 1.3% 1 0.0% 0 0.9% 1 0.6% 0 0.7% 0 0.0% 0 0.0% 0
Castle Donington TownCentre
0.6% 3 3.4% 2 0.0% 0 1.2% 1 0.0% 0 0.0% 0 0.0% 0 0.0% 0
Castle Gresley VillageCentre
1.1% 6 0.0% 0 0.0% 0 3.9% 4 2.8% 2 0.5% 0 0.0% 0 0.0% 0
Church Gresley VillageCentre
0.3% 2 0.0% 0 0.0% 0 1.3% 1 0.0% 0 0.0% 0 0.0% 0 0.6% 1
Coalville Town Centre 4.0% 23 0.0% 0 8.0% 6 0.6% 1 0.6% 0 4.2% 3 6.7% 8 6.4% 5Coventry City Centre 0.1% 1 0.0% 0 0.0% 0 0.0% 0 0.9% 1 0.0% 0 0.0% 0 0.0% 0Derby City Centre 2.5% 15 9.0% 5 3.9% 3 2.1% 2 3.0% 2 3.5% 2 0.0% 0 0.0% 0Ibstock Town Centre 0.1% 1 0.0% 0 0.0% 0 0.0% 0 0.9% 1 0.0% 0 0.0% 0 0.0% 0Leicester City Centre 3.7% 21 0.9% 1 8.4% 6 0.0% 0 2.8% 2 8.2% 5 3.6% 4 4.1% 3Long Eaton Town Centre 0.1% 1 1.3% 1 0.0% 0 0.0% 0 0.0% 0 0.0% 0 0.0% 0 0.0% 0Loughborough Town Centre 3.4% 19 3.0% 2 2.9% 2 0.0% 0 0.9% 1 5.7% 4 4.1% 5 7.6% 6Measham Village Centre 2.1% 12 0.0% 0 0.0% 0 0.9% 1 5.7% 4 1.4% 1 4.2% 5 1.8% 2Melbourne Town Centre 0.1% 0 0.0% 0 0.6% 0 0.0% 0 0.0% 0 0.0% 0 0.0% 0 0.0% 0Nottingham City Centre 2.5% 14 13.6% 8 1.2% 1 0.0% 0 6.6% 4 0.0% 0 0.7% 1 0.0% 0Swadlincote Town Centre 2.7% 15 0.0% 0 0.0% 0 7.9% 8 6.8% 4 0.5% 0 0.0% 0 2.9% 2Tamworth Town Centre 1.6% 9 0.0% 0 0.0% 0 2.1% 2 2.6% 2 3.3% 2 0.7% 1 2.9% 2Fosse Shopping Park, Fosse
Park Avenue, Leicester(JD Sports, Marks &Spencer, ScS)
2.9% 16 0.0% 0 1.8% 1 0.0% 0 0.9% 1 4.5% 3 3.6% 4 8.6% 7
Giltbrook Retail Park, IkeaWay, Giltbrook,Nottingham (Harveys,Ikea, Sofology)
1.3% 7 3.0% 2 0.0% 0 0.0% 0 5.1% 3 2.2% 1 0.0% 0 0.9% 1
Jolly Sailor Retail Park,Bonehill Road, Bitterscote,Tamworth (Argos,Poundland, TK Maxx)
0.2% 1 0.0% 0 0.0% 0 0.0% 0 0.0% 0 0.9% 1 0.7% 1 0.0% 0
Regents Place Retail Park,Broad Street,Loughborough (CarphoneWarehouse, Currys PCWorld, Dunelm)
0.7% 4 0.0% 0 0.0% 0 0.0% 0 0.0% 0 0.0% 0 1.3% 2 2.9% 2
Ventura Retail Park, VenturaPark Road, Tamworth (JDSports, Marks & Spencer,Next)
0.5% 3 0.0% 0 0.9% 1 0.0% 0 3.5% 2 0.0% 0 0.0% 0 0.0% 0
Willowbrook Retail Park,Derby Road,Loughborough (B&M,Dreams, Halfords)
0.2% 1 0.9% 1 0.9% 1 0.0% 0 0.0% 0 0.0% 0 0.0% 0 0.0% 0
Wyvern Retail Park, WyvernWay, Chaddesden, Derby(Homebase, Next Home,Sainsbury's)
0.3% 2 2.6% 2 0.0% 0 0.0% 0 0.0% 0 0.0% 0 0.0% 0 0.0% 0
Internet / mail order 4.1% 24 5.6% 3 6.7% 5 2.4% 3 2.6% 2 9.5% 6 2.5% 3 2.4% 2Belton Village Centre 0.1% 1 0.0% 0 0.9% 1 0.0% 0 0.0% 0 0.0% 0 0.0% 0 0.0% 0Long Whatton Village
Centre0.1% 1 0.9% 1 0.0% 0 0.0% 0 0.0% 0 0.0% 0 0.0% 0 0.0% 0
Ratby Village Centre 0.1% 0 0.0% 0 0.0% 0 0.0% 0 0.0% 0 0.5% 0 0.0% 0 0.0% 0Ravenstone Village Centre 0.1% 0 0.0% 0 0.6% 0 0.0% 0 0.0% 0 0.0% 0 0.0% 0 0.0% 0Sutton Coldfield Town
Centre0.1% 0 0.0% 0 0.6% 0 0.0% 0 0.0% 0 0.0% 0 0.0% 0 0.0% 0
Wheatbridge Retail Park,Wheathbridge Road,Chesterfield
0.1% 0 0.0% 0 0.0% 0 0.0% 0 0.0% 0 0.5% 0 0.0% 0 0.0% 0
(Don't know / varies) 8.0% 46 8.5% 5 6.9% 5 4.1% 4 9.5% 6 7.5% 5 6.8% 8 14.4% 12(Nowhere else) 57.2% 327 51.2% 31 59.0% 42 71.8% 76 46.1% 29 48.4% 31 66.8% 81 42.8% 36Weighted base: 571 61 71 107 63 65 122 84Sample: 567 67 81 82 85 90 79 83
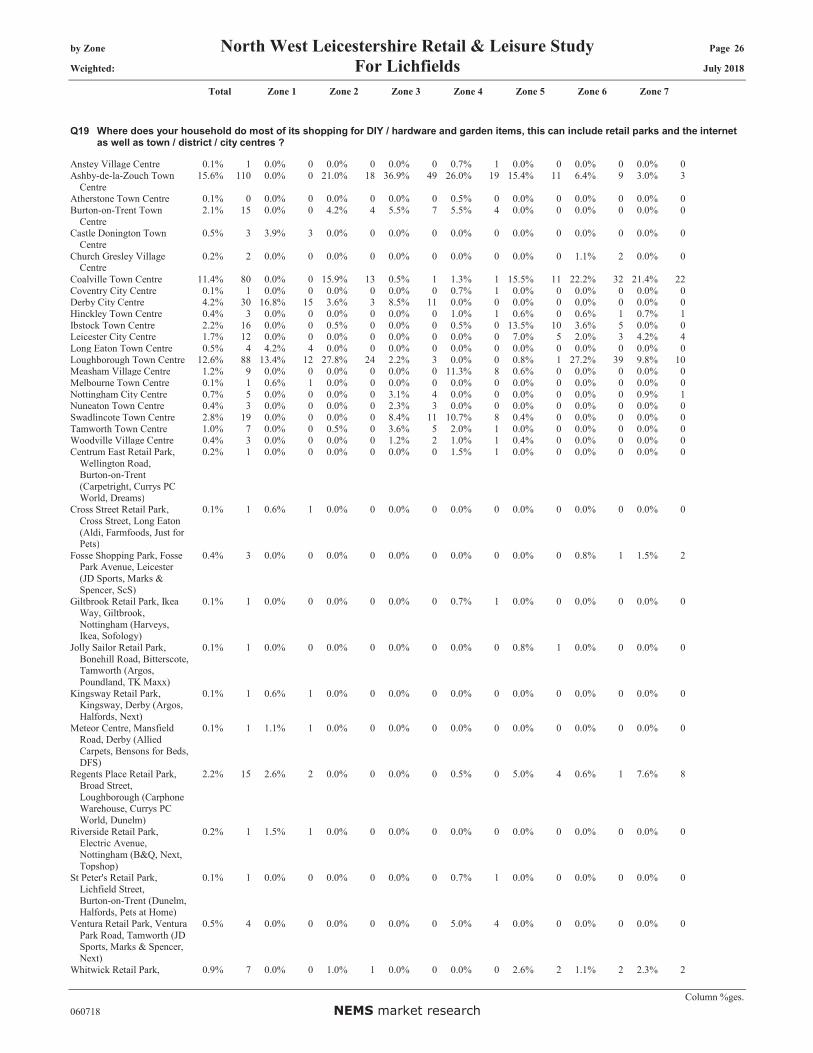
by Zone North West Leicestershire Retail & Leisure Study Page 26
Weighted: For Lichfields July 2018
Total Zone 1 Zone 2 Zone 3 Zone 4 Zone 5 Zone 6 Zone 7
Column %ges.060718 NEMS market research
Q19 Where does your household do most of its shopping for DIY / hardware and garden items, this can include retail parks and the internetas well as town / district / city centres ?
Anstey Village Centre 0.1% 1 0.0% 0 0.0% 0 0.0% 0 0.7% 1 0.0% 0 0.0% 0 0.0% 0Ashby-de-la-Zouch Town
Centre15.6% 110 0.0% 0 21.0% 18 36.9% 49 26.0% 19 15.4% 11 6.4% 9 3.0% 3
Atherstone Town Centre 0.1% 0 0.0% 0 0.0% 0 0.0% 0 0.5% 0 0.0% 0 0.0% 0 0.0% 0Burton-on-Trent Town
Centre2.1% 15 0.0% 0 4.2% 4 5.5% 7 5.5% 4 0.0% 0 0.0% 0 0.0% 0
Castle Donington TownCentre
0.5% 3 3.9% 3 0.0% 0 0.0% 0 0.0% 0 0.0% 0 0.0% 0 0.0% 0
Church Gresley VillageCentre
0.2% 2 0.0% 0 0.0% 0 0.0% 0 0.0% 0 0.0% 0 1.1% 2 0.0% 0
Coalville Town Centre 11.4% 80 0.0% 0 15.9% 13 0.5% 1 1.3% 1 15.5% 11 22.2% 32 21.4% 22Coventry City Centre 0.1% 1 0.0% 0 0.0% 0 0.0% 0 0.7% 1 0.0% 0 0.0% 0 0.0% 0Derby City Centre 4.2% 30 16.8% 15 3.6% 3 8.5% 11 0.0% 0 0.0% 0 0.0% 0 0.0% 0Hinckley Town Centre 0.4% 3 0.0% 0 0.0% 0 0.0% 0 1.0% 1 0.6% 0 0.6% 1 0.7% 1Ibstock Town Centre 2.2% 16 0.0% 0 0.5% 0 0.0% 0 0.5% 0 13.5% 10 3.6% 5 0.0% 0Leicester City Centre 1.7% 12 0.0% 0 0.0% 0 0.0% 0 0.0% 0 7.0% 5 2.0% 3 4.2% 4Long Eaton Town Centre 0.5% 4 4.2% 4 0.0% 0 0.0% 0 0.0% 0 0.0% 0 0.0% 0 0.0% 0Loughborough Town Centre 12.6% 88 13.4% 12 27.8% 24 2.2% 3 0.0% 0 0.8% 1 27.2% 39 9.8% 10Measham Village Centre 1.2% 9 0.0% 0 0.0% 0 0.0% 0 11.3% 8 0.6% 0 0.0% 0 0.0% 0Melbourne Town Centre 0.1% 1 0.6% 1 0.0% 0 0.0% 0 0.0% 0 0.0% 0 0.0% 0 0.0% 0Nottingham City Centre 0.7% 5 0.0% 0 0.0% 0 3.1% 4 0.0% 0 0.0% 0 0.0% 0 0.9% 1Nuneaton Town Centre 0.4% 3 0.0% 0 0.0% 0 2.3% 3 0.0% 0 0.0% 0 0.0% 0 0.0% 0Swadlincote Town Centre 2.8% 19 0.0% 0 0.0% 0 8.4% 11 10.7% 8 0.4% 0 0.0% 0 0.0% 0Tamworth Town Centre 1.0% 7 0.0% 0 0.5% 0 3.6% 5 2.0% 1 0.0% 0 0.0% 0 0.0% 0Woodville Village Centre 0.4% 3 0.0% 0 0.0% 0 1.2% 2 1.0% 1 0.4% 0 0.0% 0 0.0% 0Centrum East Retail Park,
Wellington Road,Burton-on-Trent(Carpetright, Currys PCWorld, Dreams)
0.2% 1 0.0% 0 0.0% 0 0.0% 0 1.5% 1 0.0% 0 0.0% 0 0.0% 0
Cross Street Retail Park,Cross Street, Long Eaton(Aldi, Farmfoods, Just forPets)
0.1% 1 0.6% 1 0.0% 0 0.0% 0 0.0% 0 0.0% 0 0.0% 0 0.0% 0
Fosse Shopping Park, FossePark Avenue, Leicester(JD Sports, Marks &Spencer, ScS)
0.4% 3 0.0% 0 0.0% 0 0.0% 0 0.0% 0 0.0% 0 0.8% 1 1.5% 2
Giltbrook Retail Park, IkeaWay, Giltbrook,Nottingham (Harveys,Ikea, Sofology)
0.1% 1 0.0% 0 0.0% 0 0.0% 0 0.7% 1 0.0% 0 0.0% 0 0.0% 0
Jolly Sailor Retail Park,Bonehill Road, Bitterscote,Tamworth (Argos,Poundland, TK Maxx)
0.1% 1 0.0% 0 0.0% 0 0.0% 0 0.0% 0 0.8% 1 0.0% 0 0.0% 0
Kingsway Retail Park,Kingsway, Derby (Argos,Halfords, Next)
0.1% 1 0.6% 1 0.0% 0 0.0% 0 0.0% 0 0.0% 0 0.0% 0 0.0% 0
Meteor Centre, MansfieldRoad, Derby (AlliedCarpets, Bensons for Beds,DFS)
0.1% 1 1.1% 1 0.0% 0 0.0% 0 0.0% 0 0.0% 0 0.0% 0 0.0% 0
Regents Place Retail Park,Broad Street,Loughborough (CarphoneWarehouse, Currys PCWorld, Dunelm)
2.2% 15 2.6% 2 0.0% 0 0.0% 0 0.5% 0 5.0% 4 0.6% 1 7.6% 8
Riverside Retail Park,Electric Avenue,Nottingham (B&Q, Next,Topshop)
0.2% 1 1.5% 1 0.0% 0 0.0% 0 0.0% 0 0.0% 0 0.0% 0 0.0% 0
St Peter's Retail Park,Lichfield Street,Burton-on-Trent (Dunelm,Halfords, Pets at Home)
0.1% 1 0.0% 0 0.0% 0 0.0% 0 0.7% 1 0.0% 0 0.0% 0 0.0% 0
Ventura Retail Park, VenturaPark Road, Tamworth (JDSports, Marks & Spencer,Next)
0.5% 4 0.0% 0 0.0% 0 0.0% 0 5.0% 4 0.0% 0 0.0% 0 0.0% 0
Whitwick Retail Park, 0.9% 7 0.0% 0 1.0% 1 0.0% 0 0.0% 0 2.6% 2 1.1% 2 2.3% 2

by Zone North West Leicestershire Retail & Leisure Study Page 27
Weighted: For Lichfields July 2018
Total Zone 1 Zone 2 Zone 3 Zone 4 Zone 5 Zone 6 Zone 7
Column %ges.060718 NEMS market research
Whitwick Road, Coalville(Peacocks, Ponden Mill,Sports Direct)
Willowbrook Retail Park,Derby Road,Loughborough (B&M,Dreams, Halfords)
5.0% 35 16.1% 15 0.0% 0 0.0% 0 3.1% 2 3.3% 2 4.2% 6 9.7% 10
Wyvern Retail Park, WyvernWay, Chaddesden, Derby(Homebase, Next Home,Sainsbury's)
0.7% 5 5.7% 5 0.0% 0 0.0% 0 0.0% 0 0.0% 0 0.0% 0 0.0% 0
Internet / mail order 3.3% 23 2.3% 2 5.9% 5 0.0% 0 0.7% 1 6.1% 4 5.4% 8 3.4% 4B&Q, Jubilee Drive, Belton
Road, Loughborough5.6% 39 5.6% 5 3.0% 3 0.7% 1 0.0% 0 2.0% 1 8.1% 12 16.8% 17
B&Q, Wellington Road,Derby
0.5% 4 4.1% 4 0.0% 0 0.0% 0 0.0% 0 0.0% 0 0.0% 0 0.0% 0
Centurion Park, WatlingStreet, Wilnecote,Tamworth
0.1% 0 0.0% 0 0.5% 0 0.0% 0 0.0% 0 0.0% 0 0.0% 0 0.0% 0
Garden King Garden Centre,Park Road, Newhall
0.2% 1 0.0% 0 0.0% 0 0.5% 1 0.5% 0 0.0% 0 0.0% 0 0.0% 0
Ivanhoe Business Park,Ashby-de-la-Zouch
0.3% 2 0.0% 0 0.0% 0 0.0% 0 2.4% 2 0.4% 0 0.0% 0 0.0% 0
Newton Regis Garden Store,Newton Lane, NewtonRegis
0.1% 1 0.0% 0 0.0% 0 0.0% 0 1.0% 1 0.0% 0 0.0% 0 0.0% 0
Planters Garden Centre,Woodlands Farm, TrinityRoad, Tamworth
0.6% 4 0.0% 0 0.0% 0 3.1% 4 0.0% 0 0.0% 0 0.0% 0 0.0% 0
Screwfix, ThornboroughRoad, Coalville
0.9% 6 0.0% 0 0.0% 0 0.0% 0 0.0% 0 2.6% 2 2.5% 4 0.7% 1
Sunnyside Garden Centre,Leicester Road, Ibstock
0.1% 1 0.0% 0 0.0% 0 0.0% 0 0.0% 0 0.4% 0 0.0% 0 0.5% 1
Tesco Extra, ResolutionRoad, Ashby-de-la-Zouch
0.1% 0 0.0% 0 0.0% 0 0.0% 0 0.0% 0 0.6% 0 0.0% 0 0.0% 0
The Garden Warehouse,Gallows Lane, Measham
0.1% 0 0.0% 0 0.0% 0 0.0% 0 0.5% 0 0.0% 0 0.0% 0 0.0% 0
Ticknall Village Centre 0.1% 1 0.0% 0 0.0% 0 0.5% 1 0.0% 0 0.0% 0 0.0% 0 0.0% 0Wickes, Nottingham Road
Industrial Estate,Ashby-de-la-Zouch
2.5% 17 0.0% 0 2.2% 2 0.7% 1 9.2% 7 9.0% 7 0.8% 1 0.0% 0
Wyevale Garden Centre,Ashby Road, Stapleton
0.4% 3 0.0% 0 0.5% 0 2.0% 3 0.0% 0 0.0% 0 0.0% 0 0.0% 0
(Don't know / varies) 4.7% 33 2.4% 2 5.7% 5 5.5% 7 5.2% 4 1.8% 1 5.3% 7 5.7% 6(Don't do this type of
shopping)11.5% 81 18.4% 17 7.6% 6 14.7% 20 7.6% 6 11.1% 8 8.4% 12 11.7% 12
Weighted base: 702 91 85 134 73 72 143 104Sample: 702 100 100 102 100 100 100 100

by Zone North West Leicestershire Retail & Leisure Study Page 28
Weighted: For Lichfields July 2018
Total Zone 1 Zone 2 Zone 3 Zone 4 Zone 5 Zone 6 Zone 7
Column %ges.060718 NEMS market research
Q20 Where else does your household do most of its shopping for DIY / hardware and garden items? [MR]Those who buy DIY / hardware and garden items at Q19:
Anstey Village Centre 0.1% 1 0.0% 0 0.0% 0 0.0% 0 0.0% 0 0.0% 0 0.0% 0 0.8% 1Ashby-de-la-Zouch Town
Centre11.2% 69 0.0% 0 12.4% 10 22.0% 25 15.3% 10 9.2% 6 8.2% 11 8.3% 8
Burton-on-Trent TownCentre
2.3% 14 1.4% 1 0.0% 0 8.1% 9 3.6% 2 0.5% 0 0.0% 0 1.1% 1
Castle Donington TownCentre
0.3% 2 2.3% 2 0.0% 0 0.0% 0 0.0% 0 0.0% 0 0.0% 0 0.0% 0
Coalville Town Centre 9.0% 56 0.0% 0 12.2% 10 0.0% 0 2.2% 1 9.0% 6 22.5% 29 10.2% 9Derby City Centre 1.4% 9 4.0% 3 2.1% 2 1.1% 1 0.6% 0 2.2% 1 0.9% 1 0.0% 0Hinckley Town Centre 0.2% 1 0.0% 0 0.0% 0 0.0% 0 0.0% 0 2.2% 1 0.0% 0 0.0% 0Ibstock Town Centre 0.9% 5 0.0% 0 0.0% 0 0.0% 0 0.0% 0 4.5% 3 0.0% 0 2.7% 3Leicester City Centre 0.7% 4 0.0% 0 0.0% 0 0.0% 0 0.0% 0 1.5% 1 1.8% 2 1.1% 1Long Eaton Town Centre 0.1% 1 0.8% 1 0.0% 0 0.0% 0 0.0% 0 0.0% 0 0.0% 0 0.0% 0Loughborough Town Centre 7.7% 48 7.7% 6 13.1% 10 4.0% 5 0.0% 0 1.1% 1 14.1% 18 8.8% 8Measham Village Centre 0.8% 5 0.0% 0 0.6% 0 0.0% 0 5.7% 4 0.0% 0 0.0% 0 0.8% 1Moira Village Centre 0.1% 0 0.0% 0 0.0% 0 0.0% 0 0.6% 0 0.0% 0 0.0% 0 0.0% 0Nottingham City Centre 1.4% 9 6.0% 4 0.0% 0 3.7% 4 0.0% 0 0.0% 0 0.0% 0 0.0% 0Swadlincote Town Centre 1.5% 10 0.0% 0 2.2% 2 3.7% 4 4.8% 3 0.5% 0 0.0% 0 0.0% 0Tamworth Town Centre 1.9% 12 0.0% 0 0.0% 0 3.6% 4 3.4% 2 2.9% 2 2.9% 4 0.0% 0Cross Street Retail Park,
Cross Street, Long Eaton(Aldi, Farmfoods, Just forPets)
0.3% 2 1.4% 1 0.0% 0 0.0% 0 1.1% 1 0.0% 0 0.0% 0 0.0% 0
Fosse Shopping Park, FossePark Avenue, Leicester(JD Sports, Marks &Spencer, ScS)
0.2% 1 0.0% 0 0.0% 0 0.0% 0 0.0% 0 0.0% 0 0.0% 0 1.6% 1
Kingsway Retail Park,Kingsway, Derby (Argos,Halfords, Next)
0.1% 1 0.8% 1 0.0% 0 0.0% 0 0.0% 0 0.0% 0 0.0% 0 0.0% 0
Meteor Centre, MansfieldRoad, Derby (AlliedCarpets, Bensons for Beds,DFS)
0.2% 1 1.4% 1 0.0% 0 0.0% 0 0.0% 0 0.0% 0 0.0% 0 0.0% 0
Regents Place Retail Park,Broad Street,Loughborough (CarphoneWarehouse, Currys PCWorld, Dunelm)
0.5% 3 0.8% 1 0.8% 1 0.0% 0 0.0% 0 1.1% 1 0.0% 0 1.4% 1
St George's Retail Park, StGeorge's Way, Leicester(Aldi, Currys PC World,Wickes)
0.1% 0 0.0% 0 0.0% 0 0.0% 0 0.0% 0 0.7% 0 0.0% 0 0.0% 0
Ventura Retail Park, VenturaPark Road, Tamworth (JDSports, Marks & Spencer,Next)
0.5% 3 0.0% 0 0.0% 0 0.0% 0 4.9% 3 0.0% 0 0.0% 0 0.0% 0
Whitwick Retail Park,Whitwick Road, Coalville(Peacocks, Ponden Mill,Sports Direct)
0.4% 3 0.0% 0 0.0% 0 0.0% 0 0.0% 0 1.5% 1 1.2% 2 0.0% 0
Willowbrook Retail Park,Derby Road,Loughborough (B&M,Dreams, Halfords)
2.2% 14 7.8% 6 0.0% 0 0.0% 0 0.0% 0 2.2% 1 2.9% 4 3.2% 3
Wyvern Retail Park, WyvernWay, Chaddesden, Derby(Homebase, Next Home,Sainsbury's)
0.2% 1 0.8% 1 0.6% 0 0.0% 0 0.0% 0 0.0% 0 0.0% 0 0.0% 0
Internet / mail order 2.0% 12 1.4% 1 4.3% 3 2.5% 3 0.0% 0 3.3% 2 0.6% 1 2.2% 2B&Q, Jubilee Drive, Belton
Road, Loughborough2.2% 14 0.8% 1 0.6% 0 1.1% 1 2.6% 2 4.2% 3 2.5% 3 3.9% 4
B&Q, Wellington Road,Derby
0.7% 4 2.9% 2 0.0% 0 0.0% 0 1.2% 1 2.2% 1 0.0% 0 0.0% 0
Ivanhoe Business Park,Ashby-de-la-Zouch
0.3% 2 0.0% 0 0.0% 0 0.0% 0 1.9% 1 0.5% 0 0.0% 0 0.0% 0
Newton Regis Garden Store,Newton Lane, NewtonRegis
0.1% 1 0.0% 0 0.0% 0 0.0% 0 0.8% 1 0.0% 0 0.0% 0 0.0% 0
Planters Garden Centre,Woodlands Farm, Trinity
0.3% 2 0.0% 0 0.0% 0 0.0% 0 0.6% 0 0.0% 0 1.2% 2 0.0% 0

by Zone North West Leicestershire Retail & Leisure Study Page 29
Weighted: For Lichfields July 2018
Total Zone 1 Zone 2 Zone 3 Zone 4 Zone 5 Zone 6 Zone 7
Column %ges.060718 NEMS market research
Road, TamworthScrewfix, Jubilee Drive,
Loughborough0.1% 0 0.0% 0 0.0% 0 0.0% 0 0.0% 0 0.5% 0 0.0% 0 0.0% 0
Stapleton Village Centre 0.2% 2 0.0% 0 0.0% 0 0.0% 0 0.0% 0 0.0% 0 1.2% 2 0.0% 0Sunnyside Garden Centre,
Leicester Road, Ibstock0.2% 1 0.0% 0 0.0% 0 0.0% 0 0.0% 0 0.7% 0 0.6% 1 0.0% 0
Tesco Extra, ResolutionRoad, Ashby-de-la-Zouch
0.1% 1 0.0% 0 0.0% 0 0.0% 0 0.0% 0 0.9% 1 0.0% 0 0.0% 0
Wickes, Belton Road,Loughborough
0.2% 1 0.8% 1 0.0% 0 0.0% 0 0.0% 0 0.0% 0 0.0% 0 0.8% 1
Wickes, Nottingham RoadIndustrial Estate,Ashby-de-la-Zouch
1.6% 10 0.0% 0 4.3% 3 0.8% 1 6.3% 4 0.0% 0 0.0% 0 1.6% 1
Wyevale Garden Centre,Ashby Road, Stapleton
0.5% 3 0.8% 1 0.0% 0 0.0% 0 0.0% 0 0.0% 0 1.9% 3 0.0% 0
(Don't know / varies) 1.7% 11 0.8% 1 0.0% 0 2.5% 3 2.8% 2 2.7% 2 1.3% 2 2.0% 2(Nowhere else) 49.0% 304 59.4% 44 48.5% 38 49.9% 57 47.3% 32 47.2% 30 42.3% 55 51.8% 48Weighted base: 621 74 78 114 68 64 131 92Sample: 625 86 91 85 89 92 90 92

by Zone North West Leicestershire Retail & Leisure Study Page 30
Weighted: For Lichfields July 2018
Total Zone 1 Zone 2 Zone 3 Zone 4 Zone 5 Zone 6 Zone 7
Column %ges.060718 NEMS market research
Q21 Where does your household do most of its shopping for health, beauty and chemist items, this can include retail parks and the internetas well as town / district / city centres ?
Anstey Village Centre 0.2% 1 0.0% 0 0.0% 0 0.9% 1 0.0% 0 0.0% 0 0.0% 0 0.0% 0Ashby-de-la-Zouch Town
Centre23.7% 166 3.8% 3 24.8% 21 72.4% 97 38.6% 28 15.5% 11 0.0% 0 5.2% 5
Burton-on-Trent TownCentre
0.8% 6 0.0% 0 0.0% 0 3.1% 4 0.7% 1 0.0% 0 0.6% 1 0.0% 0
Castle Donington TownCentre
4.5% 32 34.8% 32 0.0% 0 0.0% 0 0.0% 0 0.0% 0 0.0% 0 0.0% 0
Coalville Town Centre 25.4% 178 0.0% 0 22.9% 19 0.0% 0 1.7% 1 23.4% 17 61.3% 87 51.0% 53Derby City Centre 1.4% 10 8.6% 8 0.5% 0 0.0% 0 0.0% 0 1.9% 1 0.0% 0 0.0% 0Hugglescote Village Centre 0.3% 2 0.0% 0 0.0% 0 0.0% 0 0.0% 0 0.8% 1 0.6% 1 0.5% 1Ibstock Town Centre 3.4% 24 0.0% 0 0.0% 0 0.0% 0 3.3% 2 25.6% 19 1.9% 3 0.0% 0Kegworth Village Centre 2.3% 16 17.2% 16 0.5% 0 0.0% 0 0.0% 0 0.0% 0 0.0% 0 0.0% 0Leicester City Centre 2.5% 18 0.0% 0 0.5% 0 4.1% 5 0.0% 0 4.9% 4 5.1% 7 0.9% 1Long Eaton Town Centre 0.6% 4 4.5% 4 0.0% 0 0.0% 0 0.0% 0 0.0% 0 0.0% 0 0.0% 0Loughborough Town Centre 2.8% 20 6.5% 6 5.6% 5 0.0% 0 0.0% 0 3.2% 2 0.8% 1 5.3% 6Measham Village Centre 2.5% 17 0.0% 0 0.0% 0 0.0% 0 23.6% 17 0.0% 0 0.0% 0 0.0% 0Melbourne Town Centre 0.2% 2 0.0% 0 1.9% 2 0.0% 0 0.0% 0 0.0% 0 0.0% 0 0.0% 0Nottingham City Centre 0.3% 2 2.4% 2 0.0% 0 0.0% 0 0.0% 0 0.0% 0 0.0% 0 0.0% 0Nuneaton Town Centre 0.4% 3 0.0% 0 0.0% 0 2.3% 3 0.0% 0 0.0% 0 0.0% 0 0.0% 0Shepshed Town Centre 0.1% 1 0.6% 1 0.5% 0 0.0% 0 0.0% 0 0.0% 0 0.0% 0 0.0% 0Swadlincote Town Centre 2.2% 15 0.0% 0 0.0% 0 4.5% 6 12.4% 9 0.0% 0 0.0% 0 0.0% 0Tamworth Town Centre 0.2% 1 0.0% 0 0.0% 0 0.0% 0 1.7% 1 0.0% 0 0.0% 0 0.0% 0Whitwick Village Centre 2.0% 14 0.0% 0 5.4% 5 0.0% 0 0.0% 0 0.0% 0 1.4% 2 7.0% 7Woodville Village Centre 0.1% 1 0.0% 0 0.0% 0 0.5% 1 0.0% 0 0.0% 0 0.0% 0 0.0% 0Fosse Shopping Park, Fosse
Park Avenue, Leicester(JD Sports, Marks &Spencer, ScS)
1.7% 12 0.9% 1 0.0% 0 0.0% 0 0.0% 0 0.0% 0 5.9% 8 2.6% 3
Ventura Retail Park, VenturaPark Road, Tamworth (JDSports, Marks & Spencer,Next)
0.3% 2 0.0% 0 0.0% 0 0.0% 0 3.1% 2 0.0% 0 0.0% 0 0.0% 0
Whitwick Retail Park,Whitwick Road, Coalville(Peacocks, Ponden Mill,Sports Direct)
0.9% 6 0.0% 0 1.7% 1 0.0% 0 0.0% 0 1.9% 1 1.1% 2 1.7% 2
Willowbrook Retail Park,Derby Road,Loughborough (B&M,Dreams, Halfords)
0.1% 1 0.6% 1 0.0% 0 0.0% 0 0.0% 0 0.0% 0 0.0% 0 0.0% 0
Wyvern Retail Park, WyvernWay, Chaddesden, Derby(Homebase, Next Home,Sainsbury's)
0.3% 2 2.0% 2 0.7% 1 0.0% 0 0.0% 0 0.0% 0 0.0% 0 0.0% 0
Internet / mail order 5.4% 38 6.2% 6 7.5% 6 3.2% 4 4.2% 3 6.0% 4 5.9% 8 5.8% 6Belton Village Centre 0.1% 1 0.0% 0 0.7% 1 0.0% 0 0.0% 0 0.0% 0 0.0% 0 0.0% 0Tesco Extra, Resolution
Road, Ashby-de-la-Zouch3.6% 25 0.0% 0 7.5% 6 0.5% 1 0.5% 0 9.0% 7 3.7% 5 5.5% 6
(Don't know / varies) 1.9% 13 0.9% 1 4.1% 3 1.2% 2 2.3% 2 0.0% 0 1.2% 2 3.9% 4(Don't do this type of
shopping)10.0% 70 11.1% 10 15.0% 13 7.2% 10 7.9% 6 7.9% 6 10.5% 15 10.6% 11
Weighted base: 702 91 85 134 73 72 143 104Sample: 702 100 100 102 100 100 100 100

by Zone North West Leicestershire Retail & Leisure Study Page 31
Weighted: For Lichfields July 2018
Total Zone 1 Zone 2 Zone 3 Zone 4 Zone 5 Zone 6 Zone 7
Column %ges.060718 NEMS market research
Q22 Where else does your household do most of its shopping for health, beauty and chemist items? [MR]Those who buy health, beauty and chemist items at Q21:
Anstey Village Centre 0.1% 1 0.0% 0 0.0% 0 0.0% 0 0.0% 0 0.0% 0 0.0% 0 0.6% 1Ashby-de-la-Zouch Town
Centre6.1% 39 1.3% 1 6.0% 4 8.4% 10 17.3% 12 5.9% 4 2.8% 4 4.1% 4
Burton-on-Trent TownCentre
1.3% 8 0.0% 0 0.9% 1 2.4% 3 5.7% 4 0.0% 0 0.7% 1 0.0% 0
Castle Donington TownCentre
1.2% 8 8.3% 7 0.0% 0 0.0% 0 0.0% 0 0.0% 0 0.0% 0 1.1% 1
Coalville Town Centre 3.6% 23 0.0% 0 5.6% 4 0.0% 0 2.6% 2 9.4% 6 5.1% 6 4.5% 4Derby City Centre 1.8% 12 10.4% 8 0.9% 1 1.0% 1 0.0% 0 2.1% 1 0.0% 0 0.0% 0Hinckley Town Centre 0.7% 4 0.0% 0 0.0% 0 0.0% 0 0.6% 0 0.0% 0 3.0% 4 0.0% 0Hugglescote Village Centre 0.3% 2 0.0% 0 0.0% 0 0.0% 0 0.0% 0 0.0% 0 1.3% 2 0.0% 0Ibstock Town Centre 1.2% 8 0.0% 0 0.0% 0 0.0% 0 0.0% 0 10.4% 7 0.7% 1 0.0% 0Kegworth Village Centre 0.2% 1 1.4% 1 0.0% 0 0.0% 0 0.0% 0 0.0% 0 0.0% 0 0.0% 0Leicester City Centre 2.0% 12 1.0% 1 1.8% 1 1.0% 1 0.0% 0 1.9% 1 4.7% 6 1.9% 2Long Eaton Town Centre 0.9% 6 4.6% 4 1.1% 1 0.0% 0 0.0% 0 0.0% 0 0.0% 0 1.1% 1Loughborough Town Centre 5.3% 34 12.7% 10 8.9% 6 0.0% 0 0.0% 0 3.2% 2 4.9% 6 9.2% 9Measham Village Centre 0.7% 4 0.0% 0 0.0% 0 0.0% 0 6.4% 4 0.0% 0 0.0% 0 0.0% 0Nottingham City Centre 0.9% 6 1.7% 1 0.0% 0 3.4% 4 0.0% 0 0.6% 0 0.0% 0 0.0% 0Shepshed Town Centre 0.1% 0 0.0% 0 0.6% 0 0.0% 0 0.0% 0 0.0% 0 0.0% 0 0.0% 0Swadlincote Town Centre 2.5% 16 1.3% 1 0.9% 1 7.3% 9 7.4% 5 0.0% 0 0.0% 0 0.0% 0Tamworth Town Centre 1.3% 8 0.0% 0 0.0% 0 1.3% 2 4.0% 3 0.0% 0 3.0% 4 0.0% 0Whitwick Village Centre 1.0% 6 0.0% 0 0.6% 0 0.0% 0 0.0% 0 0.0% 0 0.0% 0 6.1% 6Woodville Village Centre 0.3% 2 0.0% 0 0.0% 0 0.0% 0 2.6% 2 0.0% 0 0.0% 0 0.0% 0Cross Street Retail Park,
Cross Street, Long Eaton(Aldi, Farmfoods, Just forPets)
0.1% 1 0.0% 0 0.0% 0 0.0% 0 0.0% 0 0.0% 0 0.0% 0 0.6% 1
Fosse Shopping Park, FossePark Avenue, Leicester(JD Sports, Marks &Spencer, ScS)
2.1% 13 0.0% 0 3.7% 3 0.0% 0 0.0% 0 5.4% 4 3.7% 5 2.4% 2
St George's Retail Park, StGeorge's Way, Leicester(Aldi, Currys PC World,Wickes)
0.1% 1 0.0% 0 0.0% 0 0.0% 0 0.0% 0 0.0% 0 0.0% 0 0.8% 1
Ventura Retail Park, VenturaPark Road, Tamworth (JDSports, Marks & Spencer,Next)
1.0% 6 0.0% 0 0.9% 1 4.1% 5 0.8% 1 0.0% 0 0.0% 0 0.0% 0
Whitwick Retail Park,Whitwick Road, Coalville(Peacocks, Ponden Mill,Sports Direct)
0.0% 0 0.0% 0 0.0% 0 0.0% 0 0.0% 0 0.5% 0 0.0% 0 0.0% 0
Wyvern Retail Park, WyvernWay, Chaddesden, Derby(Homebase, Next Home,Sainsbury's)
0.1% 1 0.7% 1 0.0% 0 0.0% 0 0.0% 0 0.0% 0 0.0% 0 0.0% 0
Internet / mail order 3.1% 20 3.6% 3 1.1% 1 6.4% 8 2.4% 2 7.7% 5 0.9% 1 0.0% 0Sainsbury's, Civic Way,
Swadlincote0.3% 2 0.0% 0 0.0% 0 0.0% 0 3.2% 2 0.0% 0 0.0% 0 0.0% 0
Tesco Extra, ResolutionRoad, Ashby-de-la-Zouch
0.6% 4 0.0% 0 0.0% 0 0.0% 0 0.8% 1 3.0% 2 0.0% 0 1.1% 1
(Don't know / varies) 1.8% 11 1.0% 1 0.6% 0 0.6% 1 1.1% 1 2.1% 1 1.6% 2 5.7% 5(Nowhere else) 62.2% 393 55.6% 45 71.0% 51 64.1% 80 53.6% 36 52.6% 35 69.1% 88 62.3% 58Weighted base: 632 81 72 124 67 67 128 93Sample: 641 93 87 95 91 96 90 89

by Zone North West Leicestershire Retail & Leisure Study Page 32
Weighted: For Lichfields July 2018
Total Zone 1 Zone 2 Zone 3 Zone 4 Zone 5 Zone 6 Zone 7
Column %ges.060718 NEMS market research
Q23 Where does your household do most of its shopping for books, CDs, toys and gifts, this can include retail parks and the internet as wellas town / district / city centres ?
Ashby-de-la-Zouch TownCentre
6.4% 45 0.0% 0 5.2% 4 21.1% 28 5.9% 4 5.9% 4 2.7% 4 0.0% 0
Birmingham City Centre 0.1% 0 0.0% 0 0.5% 0 0.0% 0 0.0% 0 0.0% 0 0.0% 0 0.0% 0Burton-on-Trent Town
Centre1.0% 7 0.0% 0 0.0% 0 1.5% 2 3.3% 2 1.9% 1 0.6% 1 0.0% 0
Castle Donington TownCentre
1.2% 8 8.5% 8 0.5% 0 0.0% 0 0.0% 0 0.0% 0 0.0% 0 0.0% 0
Coalville Town Centre 7.5% 53 0.0% 0 2.0% 2 1.0% 1 2.0% 1 2.2% 2 26.7% 38 8.2% 9Derby City Centre 1.1% 8 5.1% 5 2.0% 2 0.0% 0 0.0% 0 1.9% 1 0.0% 0 0.0% 0Hinckley Town Centre 0.4% 3 0.0% 0 0.0% 0 0.0% 0 0.5% 0 0.0% 0 0.8% 1 0.9% 1Ibstock Town Centre 0.1% 0 0.0% 0 0.5% 0 0.0% 0 0.0% 0 0.0% 0 0.0% 0 0.0% 0Leicester City Centre 4.4% 31 0.0% 0 6.1% 5 2.3% 3 2.4% 2 9.2% 7 6.2% 9 5.0% 5Lichfield City Centre 0.1% 1 0.0% 0 0.0% 0 0.0% 0 0.7% 1 0.0% 0 0.0% 0 0.0% 0Long Eaton Town Centre 0.2% 1 1.2% 1 0.0% 0 0.0% 0 0.0% 0 0.0% 0 0.0% 0 0.0% 0Loughborough Town Centre 4.4% 31 14.0% 13 5.9% 5 0.9% 1 0.0% 0 3.3% 2 2.0% 3 6.6% 7Nottingham City Centre 0.5% 4 2.6% 2 0.7% 1 0.5% 1 0.0% 0 0.0% 0 0.0% 0 0.0% 0Nuneaton Town Centre 0.5% 4 0.0% 0 0.0% 0 2.3% 3 0.0% 0 0.6% 0 0.0% 0 0.0% 0Shepshed Town Centre 0.3% 2 0.6% 1 0.0% 0 0.0% 0 2.4% 2 0.0% 0 0.0% 0 0.0% 0Swadlincote Town Centre 1.0% 7 1.1% 1 1.0% 1 2.9% 4 1.8% 1 0.4% 0 0.0% 0 0.0% 0Tamworth Town Centre 0.4% 3 0.0% 0 0.0% 0 0.0% 0 3.2% 2 0.4% 0 0.0% 0 0.0% 0Fosse Shopping Park, Fosse
Park Avenue, Leicester(JD Sports, Marks &Spencer, ScS)
1.3% 9 0.0% 0 7.1% 6 0.0% 0 0.0% 0 0.0% 0 0.6% 1 2.2% 2
Ventura Retail Park, VenturaPark Road, Tamworth (JDSports, Marks & Spencer,Next)
1.1% 8 0.0% 0 0.0% 0 1.4% 2 5.3% 4 2.6% 2 0.0% 0 0.0% 0
Whitwick Retail Park,Whitwick Road, Coalville(Peacocks, Ponden Mill,Sports Direct)
0.1% 1 0.0% 0 0.0% 0 0.0% 0 0.0% 0 1.0% 1 0.0% 0 0.0% 0
Wyvern Retail Park, WyvernWay, Chaddesden, Derby(Homebase, Next Home,Sainsbury's)
0.1% 0 0.0% 0 0.5% 0 0.0% 0 0.0% 0 0.0% 0 0.0% 0 0.0% 0
Internet / mail order 42.5% 298 35.8% 32 40.2% 34 44.8% 60 44.4% 33 52.3% 38 40.6% 58 41.7% 43Buckingham Town Centre 0.1% 1 1.1% 1 0.0% 0 0.0% 0 0.0% 0 0.0% 0 0.0% 0 0.0% 0Long Whatton Village
Centre0.1% 1 0.9% 1 0.0% 0 0.0% 0 0.0% 0 0.0% 0 0.0% 0 0.0% 0
Tesco Extra, ResolutionRoad, Ashby-de-la-Zouch
1.2% 8 0.0% 0 0.5% 0 0.0% 0 6.2% 5 3.1% 2 0.8% 1 0.0% 0
Whitby Town Centre 0.3% 2 0.0% 0 0.0% 0 0.0% 0 2.4% 2 0.0% 0 0.0% 0 0.0% 0(Don't know / varies) 2.6% 18 0.0% 0 5.4% 5 3.6% 5 2.3% 2 0.0% 0 2.3% 3 3.4% 3(Don't do this type of
shopping)21.2% 149 29.1% 26 21.8% 19 17.5% 23 17.1% 13 15.1% 11 16.7% 24 32.0% 33
Weighted base: 702 91 85 134 73 72 143 104Sample: 702 100 100 102 100 100 100 100

by Zone North West Leicestershire Retail & Leisure Study Page 33
Weighted: For Lichfields July 2018
Total Zone 1 Zone 2 Zone 3 Zone 4 Zone 5 Zone 6 Zone 7
Column %ges.060718 NEMS market research
Q24 Where else does your household do most of its shopping for other non-food items such as books, CDs, toys and gifts? [MR]Those who buy other non-food items at Q23:
Ashby-de-la-Zouch TownCentre
6.6% 36 0.9% 1 5.5% 4 19.1% 21 5.3% 3 4.8% 3 2.7% 3 2.4% 2
Atherstone Town Centre 0.2% 1 1.6% 1 0.0% 0 0.0% 0 0.0% 0 0.0% 0 0.0% 0 0.0% 0Beaumont Leys District
Centre0.2% 1 0.0% 0 0.0% 0 0.0% 0 0.0% 0 0.0% 0 0.7% 1 0.0% 0
Burton-on-Trent TownCentre
2.3% 13 0.0% 0 0.9% 1 4.7% 5 6.5% 4 0.5% 0 1.0% 1 1.8% 1
Castle Donington TownCentre
0.1% 1 0.0% 0 1.2% 1 0.0% 0 0.0% 0 0.0% 0 0.0% 0 0.0% 0
Coalville Town Centre 2.6% 14 0.0% 0 1.3% 1 0.6% 1 0.0% 0 7.5% 5 3.0% 4 6.3% 4Coventry City Centre 1.3% 7 0.0% 0 0.0% 0 0.0% 0 0.0% 0 2.3% 1 4.3% 5 0.8% 1Derby City Centre 3.1% 17 8.1% 5 7.8% 5 3.9% 4 4.4% 3 0.0% 0 0.0% 0 0.0% 0Hinckley Town Centre 0.2% 1 0.0% 0 0.0% 0 0.0% 0 0.0% 0 0.5% 0 0.0% 0 0.8% 1Ibstock Town Centre 0.2% 1 0.0% 0 0.0% 0 0.0% 0 0.0% 0 1.7% 1 0.0% 0 0.0% 0Leicester City Centre 3.5% 19 1.2% 1 3.2% 2 1.5% 2 1.8% 1 6.0% 4 3.6% 4 8.1% 6Lichfield City Centre 0.1% 0 0.0% 0 0.0% 0 0.0% 0 0.6% 0 0.0% 0 0.0% 0 0.0% 0Long Eaton Town Centre 0.2% 1 2.1% 1 0.0% 0 0.0% 0 0.0% 0 0.0% 0 0.0% 0 0.0% 0Loughborough Town Centre 5.2% 29 6.9% 4 6.9% 5 1.1% 1 0.0% 0 0.7% 0 8.0% 10 12.0% 8Measham Village Centre 0.3% 2 0.0% 0 0.0% 0 0.0% 0 1.8% 1 0.7% 0 0.0% 0 0.0% 0Nottingham City Centre 0.5% 3 0.9% 1 0.7% 0 0.0% 0 0.0% 0 0.7% 0 1.3% 2 0.0% 0Swadlincote Town Centre 0.4% 2 0.0% 0 0.0% 0 1.8% 2 0.9% 1 0.0% 0 0.0% 0 0.0% 0Tamworth Town Centre 0.8% 5 0.0% 0 0.0% 0 0.6% 1 4.4% 3 0.7% 0 0.7% 1 0.0% 0York City Centre 0.1% 1 0.9% 1 0.0% 0 0.0% 0 0.0% 0 0.0% 0 0.0% 0 0.0% 0Fosse Shopping Park, Fosse
Park Avenue, Leicester(JD Sports, Marks &Spencer, ScS)
0.8% 5 0.0% 0 0.0% 0 0.0% 0 0.0% 0 3.1% 2 1.0% 1 2.1% 2
Ventura Retail Park, VenturaPark Road, Tamworth (JDSports, Marks & Spencer,Next)
1.4% 8 0.0% 0 0.0% 0 2.3% 3 5.3% 3 3.1% 2 0.0% 0 0.0% 0
Whitwick Retail Park,Whitwick Road, Coalville(Peacocks, Ponden Mill,Sports Direct)
0.1% 1 0.0% 0 0.0% 0 0.0% 0 0.0% 0 0.0% 0 0.0% 0 0.8% 1
Willowbrook Retail Park,Derby Road,Loughborough (B&M,Dreams, Halfords)
0.1% 1 0.0% 0 0.0% 0 0.0% 0 0.9% 1 0.0% 0 0.0% 0 0.0% 0
Internet / mail order 8.2% 45 11.4% 7 5.6% 4 7.3% 8 5.9% 4 10.2% 6 12.0% 14 2.8% 2Abroad 0.2% 1 0.0% 0 0.0% 0 0.9% 1 0.0% 0 0.0% 0 0.0% 0 0.0% 0Airport Retail Park, London
Road, Coventry0.9% 5 0.0% 0 0.0% 0 0.0% 0 0.0% 0 0.0% 0 4.3% 5 0.0% 0
Brierley Hill Town Centre 0.1% 1 0.0% 0 0.0% 0 0.0% 0 0.9% 1 0.0% 0 0.0% 0 0.0% 0Sainsbury's, Civic Way,
Swadlincote0.2% 1 0.0% 0 0.0% 0 0.0% 0 1.8% 1 0.0% 0 0.0% 0 0.0% 0
Tesco Extra, ResolutionRoad, Ashby-de-la-Zouch
0.1% 1 0.0% 0 0.0% 0 0.6% 1 0.0% 0 0.0% 0 0.0% 0 0.0% 0
Waitrose, Harborough Road,Oadby
0.1% 0 0.0% 0 0.7% 0 0.0% 0 0.0% 0 0.0% 0 0.0% 0 0.0% 0
(Don't know / varies) 2.0% 11 0.0% 0 4.7% 3 0.6% 1 3.6% 2 0.9% 1 2.7% 3 2.1% 2(Nowhere else) 61.8% 342 67.8% 44 62.7% 42 60.0% 66 64.0% 39 60.2% 37 59.1% 70 62.8% 44Weighted base: 553 64 66 110 61 62 119 71Sample: 551 73 76 85 82 82 81 72
Q25 Which of the following town centres has your household visited for shopping in the last 12 months? [MR/PR]
Ashby-de-la-Zouch 70.4% 495 22.3% 20 76.4% 65 92.8% 124 93.2% 68 83.8% 61 64.8% 92 61.2% 64Coalville 61.1% 429 10.6% 10 59.6% 51 43.2% 58 55.2% 40 84.7% 61 85.7% 122 83.3% 87Measham 13.1% 92 0.0% 0 2.4% 2 15.1% 20 65.0% 48 13.9% 10 4.9% 7 4.6% 5Castle Donington 13.6% 95 57.9% 52 13.5% 12 6.0% 8 10.1% 7 5.3% 4 4.2% 6 5.8% 6Ibstock 18.1% 127 0.0% 0 2.8% 2 8.7% 12 22.9% 17 62.3% 45 30.2% 43 7.9% 8Kegworth 5.4% 38 36.1% 33 1.3% 1 0.5% 1 3.1% 2 0.4% 0 0.0% 0 0.9% 1(None of these) 6.7% 47 23.1% 21 2.0% 2 2.0% 3 4.3% 3 2.5% 2 4.2% 6 10.8% 11Weighted base: 702 91 85 134 73 72 143 104Sample: 702 100 100 102 100 100 100 100

by Zone North West Leicestershire Retail & Leisure Study Page 34
Weighted: For Lichfields July 2018
Total Zone 1 Zone 2 Zone 3 Zone 4 Zone 5 Zone 6 Zone 7
Column %ges.060718 NEMS market research
Q26 What does your household like about shopping in Ashby-de-la-Zouch? [MR]Those who have visited Ashby-de-la-Zouch in the last 12 months at Q25:
Cheap car parking 0.2% 1 0.0% 0 0.0% 0 0.6% 1 0.6% 0 0.0% 0 0.0% 0 0.0% 0Close to friends / relatives 1.2% 6 0.0% 0 3.1% 2 0.6% 1 0.0% 0 0.7% 0 1.7% 2 2.3% 1Close to home 30.2% 150 8.3% 2 18.3% 12 68.4% 85 43.3% 30 22.3% 14 5.1% 5 5.1% 3Close to work / en route to
work1.8% 9 0.0% 0 3.1% 2 0.0% 0 6.3% 4 1.6% 1 1.7% 2 0.0% 0
Easy to get to by bus 0.1% 0 0.0% 0 0.7% 0 0.0% 0 0.0% 0 0.0% 0 0.0% 0 0.0% 0Easy to get to by car 1.4% 7 0.0% 0 0.0% 0 1.6% 2 0.0% 0 4.0% 2 0.0% 0 3.8% 2Familiar / know where
everything is3.2% 16 0.0% 0 0.7% 0 2.5% 3 4.0% 3 5.3% 3 1.7% 2 7.3% 5
Feels safe 0.7% 3 0.0% 0 0.0% 0 0.6% 1 2.9% 2 1.2% 1 0.0% 0 0.0% 0Good amount of car parking 0.9% 5 2.8% 1 0.0% 0 0.0% 0 5.1% 4 1.0% 1 0.0% 0 0.0% 0Good bus services 0.1% 0 0.0% 0 0.0% 0 0.0% 0 0.6% 0 0.0% 0 0.0% 0 0.0% 0Good cafés / restaurants 2.8% 14 6.6% 1 5.5% 4 1.3% 2 4.0% 3 3.7% 2 0.9% 1 2.7% 2Good choice of clothing
shops1.2% 6 0.0% 0 0.7% 0 1.6% 2 0.0% 0 1.2% 1 1.8% 2 2.0% 1
Good choice of discount /value shops
0.8% 4 2.8% 1 0.7% 0 0.0% 0 2.6% 2 0.7% 0 0.0% 0 0.8% 1
Good choice of shops ingeneral
14.0% 69 19.2% 4 18.3% 12 6.1% 8 9.4% 6 17.6% 11 17.8% 16 19.8% 13
Good choice of supermarkets 4.7% 23 0.0% 0 2.8% 2 6.0% 7 2.2% 1 3.5% 2 7.6% 7 5.3% 3Good disabled access 0.1% 0 0.0% 0 0.0% 0 0.0% 0 0.6% 0 0.0% 0 0.0% 0 0.0% 0Good for financial services
(e.g. banks / buildingsocieties)
2.2% 11 19.8% 4 0.7% 0 0.0% 0 1.9% 1 2.3% 1 2.2% 2 2.4% 2
Good layout / shops closetogether
5.4% 27 5.1% 1 0.7% 0 4.9% 6 1.6% 1 12.8% 8 8.5% 8 3.8% 2
Good market 1.4% 7 0.0% 0 2.0% 1 0.0% 0 1.9% 1 0.0% 0 4.0% 4 1.2% 1Good quality of shops 3.9% 19 0.0% 0 2.3% 2 5.2% 6 3.7% 3 3.1% 2 6.4% 6 1.5% 1Good range of independent
shops7.2% 35 7.9% 2 23.4% 15 2.3% 3 4.7% 3 6.8% 4 4.7% 4 6.3% 4
I can get everything I needthere
2.7% 13 17.0% 3 0.7% 0 1.9% 2 3.1% 2 4.9% 3 0.9% 1 1.5% 1
Nice atmosphere / friendlypeople
9.5% 47 13.0% 3 10.4% 7 7.7% 10 9.0% 6 12.6% 8 11.4% 11 5.9% 4
Nice place to visit 10.0% 50 7.9% 2 2.6% 2 2.3% 3 19.1% 13 4.5% 3 15.0% 14 21.6% 14Parking - it's easy to find a
space0.9% 5 0.0% 0 4.8% 3 0.0% 0 0.6% 0 0.0% 0 0.0% 0 1.5% 1
Quiet / not busy 1.0% 5 0.0% 0 3.1% 2 0.0% 0 2.4% 2 0.5% 0 1.3% 1 0.0% 0Well maintained and clean 2.4% 12 17.0% 3 0.0% 0 0.6% 1 0.0% 0 7.9% 5 1.3% 1 2.7% 2(Don’t know) 3.8% 19 0.0% 0 3.1% 2 0.0% 0 1.6% 1 3.1% 2 5.3% 5 14.0% 9(Don't like anything) 10.8% 53 18.6% 4 9.5% 6 11.7% 15 7.6% 5 6.5% 4 12.0% 11 13.6% 9Convenient for school run 0.2% 1 3.9% 1 0.0% 0 0.0% 0 0.0% 0 0.0% 0 0.0% 0 0.0% 0Good choice / quality of
personal services (e.g.hairdressers, nail bar etc.)
0.1% 1 0.0% 0 0.0% 0 0.6% 1 0.0% 0 0.0% 0 0.0% 0 0.0% 0
Good choice of charity shops 0.1% 0 0.0% 0 0.0% 0 0.0% 0 0.6% 0 0.0% 0 0.0% 0 0.0% 0Good choice of leisure
facilities1.3% 7 0.0% 0 0.7% 0 0.0% 0 0.0% 0 3.1% 2 4.1% 4 0.8% 1
Good for window shopping /browsing
0.1% 0 0.0% 0 0.0% 0 0.0% 0 0.6% 0 0.0% 0 0.0% 0 0.0% 0
Good pubs / bars 0.1% 0 0.0% 0 0.0% 0 0.0% 0 0.0% 0 0.7% 0 0.0% 0 0.0% 0Old-fashioned / traditional
appearance1.2% 6 5.1% 1 2.5% 2 0.0% 0 0.0% 0 0.0% 0 1.7% 2 2.7% 2
Part of an overall day out 0.1% 1 2.8% 1 0.0% 0 0.0% 0 0.0% 0 0.0% 0 0.0% 0 0.0% 0Supporting local shops 0.5% 2 0.0% 0 0.0% 0 1.9% 2 0.0% 0 0.0% 0 0.0% 0 0.0% 0Weighted base: 495 20 65 124 68 61 92 64Sample: 477 22 70 95 91 79 62 58

by Zone North West Leicestershire Retail & Leisure Study Page 35
Weighted: For Lichfields July 2018
Total Zone 1 Zone 2 Zone 3 Zone 4 Zone 5 Zone 6 Zone 7
Column %ges.060718 NEMS market research
Q27 What does your household dislike about shopping in Ashby-de-la-Zouch? [MR]Those who have visited Ashby-de-la-Zouch in the last 12 months at Q25:
Hard to get to by car 0.5% 3 0.0% 0 0.0% 0 0.0% 0 0.0% 0 1.6% 1 1.7% 2 0.0% 0Hard to get to by train 0.2% 1 5.1% 1 0.0% 0 0.0% 0 0.0% 0 0.0% 0 0.0% 0 0.0% 0Lack of key national anchor
shops0.4% 2 0.0% 0 0.0% 0 0.0% 0 0.6% 0 0.7% 0 0.0% 0 1.5% 1
Lack of pedestrianised areas 0.5% 2 0.0% 0 1.0% 1 0.0% 0 2.6% 2 0.0% 0 0.0% 0 0.0% 0Lack of security / don't feel
safe1.1% 6 0.0% 0 0.0% 0 0.8% 1 4.4% 3 0.0% 0 1.7% 2 0.0% 0
Needs an update / revamp 1.5% 7 0.0% 0 0.0% 0 4.4% 5 0.0% 0 3.1% 2 0.0% 0 0.0% 0Not attractive / poor
environment0.3% 1 0.0% 0 0.0% 0 0.0% 0 1.9% 1 0.0% 0 0.0% 0 0.0% 0
Not enough / poor qualitycafés / restaurants
0.2% 1 0.0% 0 0.0% 0 0.0% 0 1.6% 1 0.0% 0 0.0% 0 0.0% 0
Not enough / poor qualitypublic toilets
0.1% 0 0.0% 0 0.0% 0 0.0% 0 0.6% 0 0.0% 0 0.0% 0 0.0% 0
Not enough / poor qualityseating areas
0.2% 1 0.0% 0 0.0% 0 0.0% 0 0.0% 0 0.0% 0 0.0% 0 1.5% 1
Not enough car parking 2.5% 13 2.8% 1 0.0% 0 1.1% 1 1.8% 1 1.7% 1 5.5% 5 5.0% 3Not enough food
supermarkets1.1% 6 0.0% 0 0.0% 0 0.0% 0 4.5% 3 1.5% 1 1.7% 2 0.0% 0
Not enough independentshops
3.9% 19 0.0% 0 5.5% 4 1.6% 2 11.6% 8 4.3% 3 0.0% 0 5.0% 3
Opening hours not longenough
0.1% 0 0.0% 0 0.0% 0 0.0% 0 0.6% 0 0.0% 0 0.0% 0 0.0% 0
Parking - expensive parking 6.3% 31 0.0% 0 4.3% 3 9.7% 12 11.1% 8 6.1% 4 2.5% 2 3.8% 2Parking - no free parking 3.3% 16 0.0% 0 0.0% 0 4.9% 6 7.6% 5 6.8% 4 0.0% 0 1.2% 1Parking - not enough spaces
available9.7% 48 3.9% 1 9.1% 6 15.0% 19 6.7% 5 15.0% 9 6.8% 6 3.9% 3
Poor disabled access 0.1% 0 0.0% 0 0.0% 0 0.0% 0 0.6% 0 0.0% 0 0.0% 0 0.0% 0Too busy / noisy 1.0% 5 0.0% 0 1.0% 1 1.9% 2 1.4% 1 0.5% 0 0.9% 1 0.0% 0Too many betting shops 0.1% 0 0.0% 0 0.0% 0 0.0% 0 0.0% 0 0.7% 0 0.0% 0 0.0% 0Too many charity shops 6.9% 34 0.0% 0 2.2% 1 19.3% 24 4.3% 3 5.0% 3 0.9% 1 2.7% 2Too many discount / value
shops0.3% 1 0.0% 0 0.0% 0 1.0% 1 0.0% 0 0.0% 0 0.0% 0 0.0% 0
Too many empty shops 2.1% 10 0.0% 0 4.9% 3 0.0% 0 0.0% 0 0.0% 0 5.0% 5 3.8% 2Too many national multiple
shops0.1% 1 0.0% 0 1.0% 1 0.0% 0 0.0% 0 0.0% 0 0.0% 0 0.0% 0
Traffic congestion 1.5% 7 0.0% 0 4.1% 3 0.8% 1 0.8% 1 0.9% 1 1.7% 2 1.5% 1No Primark store 0.4% 2 0.0% 0 0.0% 0 0.0% 0 0.0% 0 3.1% 2 0.0% 0 0.0% 0Not enough clothes / shoe
shops3.2% 16 5.1% 1 2.3% 2 7.3% 9 0.0% 0 0.0% 0 2.2% 2 3.8% 2
Not enough quality shops 0.2% 1 0.0% 0 0.0% 0 0.8% 1 0.0% 0 0.0% 0 0.0% 0 0.0% 0Not enough shops in general 1.8% 9 2.8% 1 1.4% 1 0.6% 1 0.6% 0 1.2% 1 1.7% 2 6.7% 4Prefer to shop elsewhere 0.1% 1 0.0% 0 0.0% 0 0.6% 1 0.0% 0 0.0% 0 0.0% 0 0.0% 0Too far from home 0.4% 2 0.0% 0 3.1% 2 0.0% 0 0.0% 0 0.0% 0 0.0% 0 0.0% 0Too hilly 0.4% 2 2.8% 1 0.0% 0 0.0% 0 0.0% 0 0.0% 0 1.7% 2 0.0% 0Too many cafés / restaurants 0.9% 5 0.0% 0 0.0% 0 0.6% 1 4.2% 3 0.7% 0 0.0% 0 1.2% 1Too many clothes shops 0.2% 1 0.0% 0 0.0% 0 0.6% 1 0.0% 0 0.5% 0 0.0% 0 0.0% 0Too many estate agents 0.2% 1 0.0% 0 1.3% 1 0.0% 0 0.0% 0 0.0% 0 0.0% 0 0.0% 0Too many expensive shops 0.1% 1 0.0% 0 1.0% 1 0.0% 0 0.0% 0 0.0% 0 0.0% 0 0.0% 0Too many hairdressers / nail
bars0.8% 4 0.0% 0 0.0% 0 3.4% 4 0.0% 0 0.0% 0 0.0% 0 0.0% 0
Too many shops of one type 0.3% 1 0.0% 0 0.0% 0 0.0% 0 0.0% 0 2.3% 1 0.0% 0 0.0% 0Too small 0.1% 0 0.0% 0 0.0% 0 0.0% 0 0.0% 0 0.7% 0 0.0% 0 0.0% 0(Don’t know) 2.0% 10 0.0% 0 0.0% 0 0.6% 1 0.8% 1 1.4% 1 5.0% 5 4.8% 3(Don't dislike anything) 57.7% 285 80.4% 16 64.9% 42 44.9% 56 56.6% 39 54.4% 33 63.4% 59 63.9% 41Weighted base: 495 20 65 124 68 61 92 64Sample: 477 22 70 95 91 79 62 58

by Zone North West Leicestershire Retail & Leisure Study Page 36
Weighted: For Lichfields July 2018
Total Zone 1 Zone 2 Zone 3 Zone 4 Zone 5 Zone 6 Zone 7
Column %ges.060718 NEMS market research
Q28 What does your household like about shopping in Coalville? [MR]Those who have visited Coalville in the last 12 months at Q25:
Cheap car parking 0.1% 0 0.0% 0 0.0% 0 0.0% 0 0.0% 0 0.5% 0 0.0% 0 0.0% 0Close to friends / relatives 0.6% 3 0.0% 0 0.0% 0 1.2% 1 1.0% 0 0.0% 0 1.4% 2 0.0% 0Close to home 27.3% 117 43.7% 4 31.4% 16 14.4% 8 10.1% 4 34.1% 21 26.9% 33 35.4% 31Close to work / en route to
work0.6% 2 0.0% 0 4.0% 2 0.0% 0 0.0% 0 0.7% 0 0.0% 0 0.0% 0
Easy to get to by car 1.0% 4 0.0% 0 0.0% 0 0.0% 0 4.4% 2 0.0% 0 0.0% 0 2.8% 2Familiar / know where
everything is1.0% 4 5.8% 1 0.9% 0 2.2% 1 0.0% 0 0.0% 0 0.7% 1 1.2% 1
Feels safe 0.6% 3 0.0% 0 0.0% 0 0.0% 0 0.0% 0 0.0% 0 1.3% 2 1.1% 1Good amount of car parking 3.2% 14 0.0% 0 0.0% 0 0.0% 0 8.4% 3 10.4% 6 3.1% 4 0.0% 0Good bus services 0.2% 1 0.0% 0 0.0% 0 0.0% 0 0.0% 0 0.0% 0 0.7% 1 0.0% 0Good cafés / restaurants 0.5% 2 0.0% 0 0.0% 0 1.2% 1 1.0% 0 0.0% 0 1.0% 1 0.0% 0Good choice of clothing
shops0.1% 0 0.0% 0 0.0% 0 0.0% 0 1.0% 0 0.0% 0 0.0% 0 0.0% 0
Good choice of discount /value shops
1.9% 8 0.0% 0 4.9% 2 2.4% 1 2.3% 1 1.2% 1 1.6% 2 0.9% 1
Good choice of shops ingeneral
8.4% 36 11.6% 1 1.8% 1 17.9% 10 10.7% 4 16.2% 10 5.6% 7 3.2% 3
Good choice of supermarkets 3.5% 15 19.7% 2 4.1% 2 5.5% 3 8.4% 3 4.5% 3 0.7% 1 0.9% 1Good disabled access 0.3% 1 0.0% 0 0.0% 0 0.0% 0 0.0% 0 0.0% 0 1.0% 1 0.0% 0Good for financial services
(e.g. banks / buildingsocieties)
0.8% 3 0.0% 0 0.0% 0 0.0% 0 0.0% 0 4.2% 3 0.7% 1 0.0% 0
Good layout / shops closetogether
3.6% 15 0.0% 0 1.8% 1 3.4% 2 1.3% 1 0.5% 0 9.6% 12 0.0% 0
Good market 0.1% 0 0.0% 0 0.0% 0 0.0% 0 0.0% 0 0.5% 0 0.0% 0 0.0% 0Good quality of shops 1.1% 5 0.0% 0 0.0% 0 3.4% 2 4.4% 2 0.5% 0 0.7% 1 0.0% 0Good range of independent
shops1.7% 7 0.0% 0 1.6% 1 2.8% 2 1.3% 1 0.0% 0 1.6% 2 2.8% 2
I can get everything I needthere
1.0% 4 0.0% 0 5.4% 3 0.0% 0 0.0% 0 0.0% 0 0.7% 1 0.9% 1
Nice atmosphere / friendlypeople
0.5% 2 5.8% 1 0.0% 0 0.0% 0 0.0% 0 0.9% 1 1.0% 1 0.0% 0
Nice place to visit 0.3% 1 8.1% 1 0.0% 0 0.0% 0 0.0% 0 0.0% 0 0.0% 0 0.6% 1Parking - it's easy to find a
space1.4% 6 0.0% 0 1.2% 1 2.4% 1 2.3% 1 2.3% 1 1.0% 1 0.9% 1
Pedestrianised streets / areas 0.1% 0 0.0% 0 0.0% 0 0.0% 0 1.0% 0 0.0% 0 0.0% 0 0.0% 0Quiet / not busy 0.9% 4 0.0% 0 0.0% 0 0.0% 0 0.0% 0 0.0% 0 3.1% 4 0.0% 0(Don’t know) 1.9% 8 0.0% 0 0.0% 0 0.0% 0 10.6% 4 0.5% 0 1.3% 2 2.1% 2(Don't like anything) 45.0% 193 21.4% 2 50.9% 26 50.0% 29 46.2% 19 36.1% 22 45.2% 55 46.3% 40Convenient for school run 0.1% 1 0.0% 0 0.0% 0 0.0% 0 1.3% 1 0.0% 0 0.0% 0 0.0% 0Free car parking 0.6% 3 0.0% 0 0.0% 0 0.0% 0 0.0% 0 4.5% 3 0.0% 0 0.0% 0Has a Home Bargains store 1.3% 5 0.0% 0 0.9% 0 0.0% 0 0.0% 0 1.4% 1 0.7% 1 3.8% 3Old-fashioned / traditional
appearance0.4% 2 0.0% 0 0.0% 0 0.0% 0 0.0% 0 0.0% 0 1.3% 2 0.0% 0
Weighted base: 429 10 51 58 40 61 122 87Sample: 420 10 62 46 49 80 89 84

by Zone North West Leicestershire Retail & Leisure Study Page 37
Weighted: For Lichfields July 2018
Total Zone 1 Zone 2 Zone 3 Zone 4 Zone 5 Zone 6 Zone 7
Column %ges.060718 NEMS market research
Q29 What does your household dislike about shopping in Coalville? [MR]Those who have visited Coalville in the last 12 months at Q25:
Hard to get to by bus 0.2% 1 0.0% 0 0.0% 0 1.2% 1 0.0% 0 0.0% 0 0.0% 0 0.0% 0Hard to get to by car 0.1% 0 0.0% 0 0.0% 0 0.0% 0 0.0% 0 0.5% 0 0.0% 0 0.0% 0Lack of key national anchor
shops2.8% 12 0.0% 0 0.0% 0 0.0% 0 1.8% 1 0.0% 0 0.0% 0 12.9% 11
Needs an update / revamp 5.5% 24 0.0% 0 2.7% 1 7.5% 4 3.1% 1 8.0% 5 2.9% 4 9.5% 8Not attractive / poor
environment7.9% 34 10.7% 1 7.9% 4 12.7% 7 14.2% 6 5.7% 3 3.5% 4 9.1% 8
Not enough / poor qualitycafés / restaurants
0.2% 1 0.0% 0 0.0% 0 0.0% 0 0.0% 0 1.4% 1 0.0% 0 0.0% 0
Not enough / poor qualitypublic toilets
0.5% 2 0.0% 0 0.0% 0 0.0% 0 0.0% 0 0.0% 0 1.6% 2 0.0% 0
Not enough car parking 0.5% 2 0.0% 0 0.0% 0 0.0% 0 0.0% 0 0.7% 0 0.0% 0 2.0% 2Not enough food
supermarkets7.0% 30 0.0% 0 0.9% 0 0.0% 0 6.3% 3 7.2% 4 5.7% 7 18.1% 16
Not enough independentshops
18.0% 77 0.0% 0 18.2% 9 1.6% 1 13.1% 5 15.1% 9 21.7% 27 29.9% 26
Parking - expensive parking 4.0% 17 0.0% 0 6.2% 3 1.2% 1 3.6% 1 9.3% 6 3.3% 4 2.6% 2Parking - no free parking 4.6% 20 0.0% 0 4.1% 2 1.2% 1 2.7% 1 5.6% 3 1.3% 2 12.7% 11Parking - not enough spaces
available1.6% 7 0.0% 0 0.0% 0 3.5% 2 5.0% 2 1.9% 1 1.3% 2 0.0% 0
Poor atmosphere / unfriendlypeople
6.5% 28 0.0% 0 13.6% 7 17.3% 10 3.6% 1 5.0% 3 5.4% 7 0.0% 0
Poor layout / shops too farapart
1.1% 5 0.0% 0 0.0% 0 1.2% 1 1.3% 1 0.0% 0 1.9% 2 1.1% 1
Poor market 0.3% 1 0.0% 0 0.0% 0 0.0% 0 0.0% 0 0.0% 0 0.0% 0 1.7% 1Too many betting shops 0.7% 3 0.0% 0 0.0% 0 0.0% 0 0.0% 0 0.0% 0 0.0% 0 3.4% 3Too many charity shops 7.9% 34 0.0% 0 10.4% 5 0.0% 0 1.0% 0 6.1% 4 11.4% 14 12.1% 11Too many discount / value
shops0.4% 2 0.0% 0 0.0% 0 0.0% 0 0.0% 0 0.0% 0 1.3% 2 0.0% 0
Too many empty shops 21.9% 94 10.7% 1 22.6% 11 13.9% 8 3.6% 1 12.9% 8 36.4% 44 22.7% 20Traffic congestion 0.6% 2 0.0% 0 0.0% 0 0.0% 0 0.0% 0 0.0% 0 0.7% 1 1.8% 2Dirty streets / unclean 0.7% 3 0.0% 0 0.0% 0 0.0% 0 5.9% 2 0.0% 0 0.0% 0 0.6% 1General dislike of the town 0.2% 1 5.8% 1 0.0% 0 0.0% 0 0.0% 0 0.5% 0 0.0% 0 0.0% 0Lack of leisure facilities (e.g.
cinema, theatre etc.)0.3% 1 0.0% 0 0.0% 0 0.0% 0 0.0% 0 0.9% 1 0.0% 0 0.9% 1
No Primark store 1.2% 5 0.0% 0 0.0% 0 0.0% 0 0.0% 0 3.1% 2 0.0% 0 3.8% 3Not enough clothes / shoe
shops1.2% 5 0.0% 0 0.0% 0 0.0% 0 1.8% 1 0.0% 0 1.9% 2 2.3% 2
Not enough facilities /activities for children
0.5% 2 0.0% 0 0.0% 0 0.0% 0 0.0% 0 0.0% 0 1.6% 2 0.0% 0
Not enoughfamily-orientated facilities
0.2% 1 0.0% 0 0.0% 0 0.0% 0 0.0% 0 0.0% 0 0.7% 1 0.0% 0
Not enough outdoor shops 0.1% 0 0.0% 0 0.0% 0 0.0% 0 0.0% 0 0.5% 0 0.0% 0 0.0% 0Not enough quality shops 1.3% 6 0.0% 0 3.4% 2 0.0% 0 0.0% 0 0.0% 0 2.5% 3 0.9% 1Not enough shops in general 7.9% 34 0.0% 0 8.8% 4 1.2% 1 1.3% 1 19.9% 12 4.9% 6 11.3% 10Poor indoor shopping centre 0.2% 1 0.0% 0 0.0% 0 1.2% 1 0.0% 0 0.0% 0 0.0% 0 0.0% 0Prefer to shop elsewhere 0.3% 1 0.0% 0 0.0% 0 2.2% 1 0.0% 0 0.0% 0 0.0% 0 0.0% 0Shop rents / rates too high 0.1% 1 0.0% 0 0.0% 0 0.0% 0 0.0% 0 0.0% 0 0.0% 0 0.6% 1Too far from home 0.1% 1 5.8% 1 0.0% 0 0.0% 0 0.0% 0 0.0% 0 0.0% 0 0.0% 0Too many banks 0.5% 2 0.0% 0 0.9% 0 0.0% 0 0.0% 0 0.0% 0 1.3% 2 0.0% 0Too many cafés / restaurants 0.4% 2 0.0% 0 1.2% 1 0.0% 0 0.0% 0 0.0% 0 1.0% 1 0.0% 0Too many clothes shops 0.6% 3 0.0% 0 0.0% 0 0.0% 0 0.0% 0 1.4% 1 1.4% 2 0.0% 0Too many fast food /
takeaway restaurants0.1% 1 0.0% 0 1.2% 1 0.0% 0 0.0% 0 0.0% 0 0.0% 0 0.0% 0
Too many independent shops 0.4% 2 0.0% 0 0.0% 0 0.0% 0 0.0% 0 0.0% 0 1.3% 2 0.0% 0Too many shops of one type 0.8% 3 0.0% 0 0.0% 0 0.0% 0 4.4% 2 0.0% 0 1.4% 2 0.0% 0(Don’t know) 2.2% 9 0.0% 0 0.0% 0 7.2% 4 9.8% 4 0.0% 0 0.0% 0 1.5% 1(Don't dislike anything) 27.1% 116 66.9% 6 23.9% 12 39.1% 23 42.7% 17 28.1% 17 19.2% 24 19.6% 17Weighted base: 429 10 51 58 40 61 122 87Sample: 420 10 62 46 49 80 89 84

by Zone North West Leicestershire Retail & Leisure Study Page 38
Weighted: For Lichfields July 2018
Total Zone 1 Zone 2 Zone 3 Zone 4 Zone 5 Zone 6 Zone 7
Column %ges.060718 NEMS market research
Q30 What does your household like about shopping in Measham? [MR]Those who have visited Measham in the last 12 months at Q25:
Close to friends / relatives 8.2% 7 0.0% 0 0.0% 0 37.1% 7 0.0% 0 0.0% 0 0.0% 0 0.0% 0Close to home 43.6% 40 0.0% 0 0.0% 0 12.5% 3 77.7% 37 4.2% 0 0.0% 0 0.0% 0Close to work / en route to
work4.9% 5 0.0% 0 0.0% 0 6.2% 1 0.0% 0 32.5% 3 0.0% 0 0.0% 0
Easy to get to by car 0.4% 0 0.0% 0 0.0% 0 0.0% 0 0.8% 0 0.0% 0 0.0% 0 0.0% 0Familiar / know where
everything is0.9% 1 0.0% 0 0.0% 0 0.0% 0 1.6% 1 0.0% 0 0.0% 0 0.0% 0
Feels safe 0.9% 1 0.0% 0 0.0% 0 0.0% 0 1.6% 1 0.0% 0 0.0% 0 0.0% 0Good cafés / restaurants 1.4% 1 0.0% 0 0.0% 0 3.4% 1 0.0% 0 5.6% 1 0.0% 0 0.0% 0Good choice of clothing
shops0.7% 1 0.0% 0 0.0% 0 3.4% 1 0.0% 0 0.0% 0 0.0% 0 0.0% 0
Good choice of shops ingeneral
1.9% 2 0.0% 0 0.0% 0 0.0% 0 2.5% 1 5.6% 1 0.0% 0 0.0% 0
Good choice of supermarkets 4.8% 4 0.0% 0 0.0% 0 0.0% 0 6.2% 3 13.8% 1 0.0% 0 0.0% 0Good for financial services
(e.g. banks / buildingsocieties)
0.6% 1 0.0% 0 0.0% 0 0.0% 0 1.1% 1 0.0% 0 0.0% 0 0.0% 0
Good market 0.4% 0 0.0% 0 0.0% 0 0.0% 0 0.8% 0 0.0% 0 0.0% 0 0.0% 0Good quality of shops 2.3% 2 0.0% 0 0.0% 0 3.4% 1 2.3% 1 3.1% 0 0.0% 0 0.0% 0Good range of independent
shops3.9% 4 0.0% 0 0.0% 0 0.0% 0 4.2% 2 0.0% 0 12.0% 1 15.6% 1
I can get everything I needthere
1.2% 1 0.0% 0 0.0% 0 3.4% 1 0.8% 0 0.0% 0 0.0% 0 0.0% 0
Nice atmosphere / friendlypeople
7.7% 7 0.0% 0 0.0% 0 12.5% 3 4.8% 2 0.0% 0 22.0% 2 15.6% 1
Nice place to visit 3.4% 3 0.0% 0 0.0% 0 0.0% 0 6.5% 3 0.0% 0 0.0% 0 0.0% 0Quiet / not busy 1.0% 1 0.0% 0 0.0% 0 4.7% 1 0.0% 0 0.0% 0 0.0% 0 0.0% 0(Don't like anything) 20.3% 19 0.0% 0 0.0% 0 13.5% 3 9.8% 5 35.2% 4 66.0% 5 63.8% 3Has a good garden centre 1.1% 1 0.0% 0 0.0% 0 0.0% 0 0.0% 0 0.0% 0 0.0% 0 20.7% 1Old-fashioned / traditional
appearance2.8% 3 0.0% 0 100.0% 2 0.0% 0 1.1% 1 0.0% 0 0.0% 0 0.0% 0
Weighted base: 92 0 2 20 48 10 7 5Sample: 109 0 1 19 66 13 4 6

by Zone North West Leicestershire Retail & Leisure Study Page 39
Weighted: For Lichfields July 2018
Total Zone 1 Zone 2 Zone 3 Zone 4 Zone 5 Zone 6 Zone 7
Column %ges.060718 NEMS market research
Q31 What does your household dislike about shopping in Measham? [MR]Those who have visited Measham in the last 12 months at Q25:
Lack of security / don't feelsafe
1.3% 1 0.0% 0 0.0% 0 3.4% 1 1.1% 1 0.0% 0 0.0% 0 0.0% 0
Needs an update / revamp 1.2% 1 0.0% 0 0.0% 0 3.4% 1 0.8% 0 0.0% 0 0.0% 0 0.0% 0Not attractive / poor
environment1.2% 1 0.0% 0 0.0% 0 0.0% 0 2.3% 1 0.0% 0 0.0% 0 0.0% 0
Not enough / poor qualitycafés / restaurants
0.6% 1 0.0% 0 0.0% 0 0.0% 0 1.1% 1 0.0% 0 0.0% 0 0.0% 0
Not enough foodsupermarkets
4.0% 4 0.0% 0 0.0% 0 0.0% 0 7.6% 4 0.0% 0 0.0% 0 0.0% 0
Not enough independentshops
8.9% 8 0.0% 0 0.0% 0 0.0% 0 9.1% 4 0.0% 0 54.0% 4 0.0% 0
Opening hours not longenough
0.8% 1 0.0% 0 0.0% 0 0.0% 0 1.5% 1 0.0% 0 0.0% 0 0.0% 0
Parking - expensive parking 1.2% 1 0.0% 0 0.0% 0 0.0% 0 2.3% 1 0.0% 0 0.0% 0 0.0% 0Parking - no free parking 1.2% 1 0.0% 0 0.0% 0 0.0% 0 2.3% 1 0.0% 0 0.0% 0 0.0% 0Parking - not enough spaces
available4.6% 4 0.0% 0 0.0% 0 3.4% 1 6.8% 3 3.1% 0 0.0% 0 0.0% 0
Poor atmosphere / unfriendlypeople
1.8% 2 0.0% 0 0.0% 0 8.1% 2 0.0% 0 0.0% 0 0.0% 0 0.0% 0
Canal restorations taking toolong
1.4% 1 0.0% 0 0.0% 0 0.0% 0 2.6% 1 0.0% 0 0.0% 0 0.0% 0
Dirty streets / unclean 0.4% 0 0.0% 0 0.0% 0 0.0% 0 0.8% 0 0.0% 0 0.0% 0 0.0% 0Not enough clothes / shoe
shops0.4% 0 0.0% 0 0.0% 0 0.0% 0 0.8% 0 0.0% 0 0.0% 0 0.0% 0
Not enough shops in general 1.4% 1 0.0% 0 0.0% 0 0.0% 0 2.6% 1 0.0% 0 0.0% 0 0.0% 0Parking restrictions are not
enforced1.9% 2 0.0% 0 0.0% 0 0.0% 0 3.7% 2 0.0% 0 0.0% 0 0.0% 0
Poor indoor shopping centre 0.6% 1 0.0% 0 0.0% 0 0.0% 0 1.1% 1 0.0% 0 0.0% 0 0.0% 0Too many cafés / restaurants 0.6% 1 0.0% 0 0.0% 0 0.0% 0 1.1% 1 0.0% 0 0.0% 0 0.0% 0Too many hairdressers / nail
bars0.6% 1 0.0% 0 0.0% 0 0.0% 0 1.1% 1 0.0% 0 0.0% 0 0.0% 0
Too many shops of one type 0.6% 1 0.0% 0 0.0% 0 0.0% 0 1.1% 1 0.0% 0 0.0% 0 0.0% 0Too small 0.7% 1 0.0% 0 0.0% 0 3.4% 1 0.0% 0 0.0% 0 0.0% 0 0.0% 0(Don’t know) 2.2% 2 0.0% 0 0.0% 0 0.0% 0 3.1% 1 0.0% 0 0.0% 0 11.2% 1(Don't dislike anything) 70.0% 64 0.0% 0 100.0% 2 78.4% 16 61.2% 29 97.0% 10 46.0% 3 88.8% 4Weighted base: 92 0 2 20 48 10 7 5Sample: 109 0 1 19 66 13 4 6

by Zone North West Leicestershire Retail & Leisure Study Page 40
Weighted: For Lichfields July 2018
Total Zone 1 Zone 2 Zone 3 Zone 4 Zone 5 Zone 6 Zone 7
Column %ges.060718 NEMS market research
Q32 What does your household like about shopping in Castle Donington? [MR]Those who have visited Castle Doningtton in the last 12 months at Q25:
Close to friends / relatives 1.3% 1 0.0% 0 0.0% 0 15.7% 1 0.0% 0 0.0% 0 0.0% 0 0.0% 0Close to home 36.0% 34 60.8% 32 20.3% 2 0.0% 0 0.0% 0 0.0% 0 0.0% 0 0.0% 0Close to work / en route to
work2.0% 2 1.5% 1 5.4% 1 0.0% 0 7.3% 1 0.0% 0 0.0% 0 0.0% 0
Easy to get to by car 0.8% 1 1.5% 1 0.0% 0 0.0% 0 0.0% 0 0.0% 0 0.0% 0 0.0% 0Familiar / know where
everything is1.7% 2 3.0% 2 0.0% 0 0.0% 0 0.0% 0 0.0% 0 0.0% 0 0.0% 0
Good amount of car parking 1.8% 2 0.0% 0 0.0% 0 0.0% 0 23.7% 2 0.0% 0 0.0% 0 0.0% 0Good cafés / restaurants 1.6% 2 3.0% 2 0.0% 0 0.0% 0 0.0% 0 0.0% 0 0.0% 0 0.0% 0Good choice of shops in
general12.3% 12 10.8% 6 0.0% 0 11.8% 1 0.0% 0 0.0% 0 86.0% 5 0.0% 0
Good choice of supermarkets 1.2% 1 2.1% 1 0.0% 0 0.0% 0 0.0% 0 0.0% 0 0.0% 0 0.0% 0Good layout / shops close
together0.9% 1 0.0% 0 7.2% 1 0.0% 0 0.0% 0 0.0% 0 0.0% 0 0.0% 0
Good market 1.3% 1 0.0% 0 0.0% 0 15.7% 1 0.0% 0 0.0% 0 0.0% 0 0.0% 0Good quality of shops 2.4% 2 3.0% 2 0.0% 0 8.5% 1 0.0% 0 0.0% 0 0.0% 0 0.0% 0Good range of independent
shops10.9% 10 10.0% 5 16.5% 2 31.3% 3 9.7% 1 0.0% 0 0.0% 0 0.0% 0
I can get everything I needthere
2.2% 2 3.9% 2 0.0% 0 0.0% 0 0.0% 0 0.0% 0 0.0% 0 0.0% 0
Nice atmosphere / friendlypeople
4.7% 4 2.0% 1 17.6% 2 8.5% 1 0.0% 0 0.0% 0 0.0% 0 12.4% 1
Nice place to visit 1.5% 1 0.0% 0 5.4% 1 0.0% 0 0.0% 0 0.0% 0 14.1% 1 0.0% 0Number of large format
shops0.8% 1 1.5% 1 0.0% 0 0.0% 0 0.0% 0 0.0% 0 0.0% 0 0.0% 0
(Don’t know) 4.5% 4 0.0% 0 0.0% 0 0.0% 0 32.1% 2 49.0% 2 0.0% 0 0.0% 0(Don't like anything) 19.2% 18 15.9% 8 0.0% 0 8.5% 1 27.2% 2 51.0% 2 0.0% 0 87.6% 5Good choice / quality of
personal services (e.g.hairdressers, nail bar etc.)
1.9% 2 2.6% 1 3.9% 0 0.0% 0 0.0% 0 0.0% 0 0.0% 0 0.0% 0
Good choice of leisurefacilities
1.8% 2 0.0% 0 0.0% 0 0.0% 0 23.7% 2 0.0% 0 0.0% 0 0.0% 0
Good pubs / bars 2.9% 3 0.0% 0 23.8% 3 0.0% 0 0.0% 0 0.0% 0 0.0% 0 0.0% 0Weighted base: 95 52 12 8 7 4 6 6Sample: 102 64 13 8 8 3 2 4

by Zone North West Leicestershire Retail & Leisure Study Page 41
Weighted: For Lichfields July 2018
Total Zone 1 Zone 2 Zone 3 Zone 4 Zone 5 Zone 6 Zone 7
Column %ges.060718 NEMS market research
Q33 What does your household dislike about shopping in Castle Donington? [MR]Those who have visited Castle Doningtton in the last 12 months at Q25:
Hard to get to by train 1.1% 1 2.0% 1 0.0% 0 0.0% 0 0.0% 0 0.0% 0 0.0% 0 0.0% 0Lack of key national anchor
shops0.6% 1 1.1% 1 0.0% 0 0.0% 0 0.0% 0 0.0% 0 0.0% 0 0.0% 0
Not enough car parking 2.3% 2 2.6% 1 7.2% 1 0.0% 0 0.0% 0 0.0% 0 0.0% 0 0.0% 0Not enough financial
services (e.g. banks /building societies)
3.6% 3 6.5% 3 0.0% 0 0.0% 0 0.0% 0 0.0% 0 0.0% 0 0.0% 0
Not enough foodsupermarkets
2.8% 3 5.1% 3 0.0% 0 0.0% 0 0.0% 0 0.0% 0 0.0% 0 0.0% 0
Not enough independentshops
12.8% 12 20.8% 11 0.0% 0 15.7% 1 0.0% 0 0.0% 0 0.0% 0 0.0% 0
Parking - expensive parking 0.6% 1 0.0% 0 0.0% 0 0.0% 0 7.3% 1 0.0% 0 0.0% 0 0.0% 0Parking - no free parking 0.6% 1 0.0% 0 0.0% 0 0.0% 0 7.3% 1 0.0% 0 0.0% 0 0.0% 0Parking - not enough spaces
available7.4% 7 9.8% 5 0.0% 0 11.8% 1 12.6% 1 0.0% 0 0.0% 0 0.0% 0
Too many charity shops 0.6% 1 1.1% 1 0.0% 0 0.0% 0 0.0% 0 0.0% 0 0.0% 0 0.0% 0Too many discount / value
shops0.6% 1 1.1% 1 0.0% 0 0.0% 0 0.0% 0 0.0% 0 0.0% 0 0.0% 0
Traffic congestion 1.5% 1 0.0% 0 12.6% 1 0.0% 0 0.0% 0 0.0% 0 0.0% 0 0.0% 0Noise pollution (e.g.
aeroplanes overhead)1.3% 1 0.0% 0 0.0% 0 15.7% 1 0.0% 0 0.0% 0 0.0% 0 0.0% 0
Not enough clothes / shoeshops
4.2% 4 7.6% 4 0.0% 0 0.0% 0 0.0% 0 0.0% 0 0.0% 0 0.0% 0
Not enough shops in general 1.2% 1 2.1% 1 0.0% 0 0.0% 0 0.0% 0 0.0% 0 0.0% 0 0.0% 0Too far from home 5.4% 5 0.0% 0 0.0% 0 0.0% 0 0.0% 0 0.0% 0 86.0% 5 0.0% 0Too many cafés / restaurants 0.6% 1 1.1% 1 0.0% 0 0.0% 0 0.0% 0 0.0% 0 0.0% 0 0.0% 0Too many estate agents 0.6% 1 1.1% 1 0.0% 0 0.0% 0 0.0% 0 0.0% 0 0.0% 0 0.0% 0Too many fast food /
takeaway restaurants1.4% 1 2.6% 1 0.0% 0 0.0% 0 0.0% 0 0.0% 0 0.0% 0 0.0% 0
Too many shops of one type 4.5% 4 6.5% 3 7.2% 1 0.0% 0 0.0% 0 0.0% 0 0.0% 0 0.0% 0(Don’t know) 4.9% 5 3.5% 2 3.9% 0 0.0% 0 7.3% 1 49.0% 2 0.0% 0 0.0% 0(Don't dislike anything) 53.4% 51 45.0% 24 69.2% 8 56.9% 5 80.1% 6 51.0% 2 14.1% 1 100.0% 6Weighted base: 95 52 12 8 7 4 6 6Sample: 102 64 13 8 8 3 2 4

by Zone North West Leicestershire Retail & Leisure Study Page 42
Weighted: For Lichfields July 2018
Total Zone 1 Zone 2 Zone 3 Zone 4 Zone 5 Zone 6 Zone 7
Column %ges.060718 NEMS market research
Q34 What does your household like about shopping in Ibstock? [MR]Those who have visited Ibstock in the last 12 months at Q25:
Close to home 34.7% 44 0.0% 0 18.5% 0 10.8% 1 44.3% 7 62.6% 28 15.7% 7 0.0% 0Close to work / en route to
work2.9% 4 0.0% 0 0.0% 0 0.0% 0 3.2% 1 0.9% 0 6.3% 3 0.0% 0
Familiar / know whereeverything is
2.7% 3 0.0% 0 25.8% 1 0.0% 0 0.0% 0 2.7% 1 3.6% 2 0.0% 0
Feels safe 0.7% 1 0.0% 0 25.8% 1 0.0% 0 0.0% 0 0.7% 0 0.0% 0 0.0% 0Good amount of car parking 0.5% 1 0.0% 0 0.0% 0 0.0% 0 0.0% 0 1.4% 1 0.0% 0 0.0% 0Good cafés / restaurants 0.7% 1 0.0% 0 0.0% 0 0.0% 0 0.0% 0 0.7% 0 0.0% 0 6.5% 1Good choice of clothing
shops1.1% 1 0.0% 0 0.0% 0 5.9% 1 4.3% 1 0.0% 0 0.0% 0 0.0% 0
Good choice of discount /value shops
1.0% 1 0.0% 0 0.0% 0 0.0% 0 7.5% 1 0.0% 0 0.0% 0 0.0% 0
Good choice of shops ingeneral
3.8% 5 0.0% 0 18.5% 0 16.7% 2 4.3% 1 3.9% 2 0.0% 0 0.0% 0
Good choice of supermarkets 3.1% 4 0.0% 0 0.0% 0 0.0% 0 12.8% 2 0.7% 0 3.6% 2 0.0% 0Good for financial services
(e.g. banks / buildingsocieties)
0.4% 1 0.0% 0 0.0% 0 0.0% 0 0.0% 0 1.3% 1 0.0% 0 0.0% 0
Good market 0.2% 0 0.0% 0 0.0% 0 0.0% 0 0.0% 0 0.7% 0 0.0% 0 0.0% 0Good quality of shops 2.0% 3 0.0% 0 0.0% 0 0.0% 0 0.0% 0 5.7% 3 0.0% 0 0.0% 0Good range of independent
shops10.5% 13 0.0% 0 0.0% 0 44.1% 5 3.2% 1 10.1% 5 3.6% 2 19.6% 2
Nice atmosphere / friendlypeople
5.9% 8 0.0% 0 0.0% 0 0.0% 0 0.0% 0 3.8% 2 11.8% 5 9.1% 1
Nice place to visit 0.3% 0 0.0% 0 0.0% 0 0.0% 0 0.0% 0 0.9% 0 0.0% 0 0.0% 0Parking - it's easy to find a
space1.8% 2 0.0% 0 0.0% 0 0.0% 0 0.0% 0 3.1% 1 1.9% 1 0.0% 0
(Don’t know) 3.6% 5 0.0% 0 0.0% 0 0.0% 0 17.4% 3 1.9% 1 0.0% 0 9.1% 1(Don't like anything) 15.9% 20 0.0% 0 18.5% 0 11.7% 1 11.6% 2 11.5% 5 15.7% 7 55.7% 5Free car parking 1.6% 2 0.0% 0 0.0% 0 0.0% 0 0.0% 0 4.4% 2 0.0% 0 0.0% 0Good choice / quality of
personal services (e.g.hairdressers, nail bar etc.)
0.7% 1 0.0% 0 0.0% 0 0.0% 0 0.0% 0 0.0% 0 1.9% 1 0.0% 0
Good garden centre 1.9% 2 0.0% 0 0.0% 0 10.8% 1 0.0% 0 0.7% 0 1.9% 1 0.0% 0Has a Co-op supermarket 13.2% 17 0.0% 0 0.0% 0 0.0% 0 0.0% 0 2.2% 1 36.6% 16 0.0% 0Has a good garden centre 0.8% 1 0.0% 0 18.5% 0 0.0% 0 0.0% 0 0.0% 0 0.0% 0 6.5% 1Has a petrol station 0.4% 1 0.0% 0 0.0% 0 0.0% 0 3.2% 1 0.0% 0 0.0% 0 0.0% 0Old-fashioned / traditional
appearance3.0% 4 0.0% 0 0.0% 0 0.0% 0 0.0% 0 0.0% 0 8.8% 4 0.0% 0
Weighted base: 127 0 2 12 17 45 43 8Sample: 140 0 5 9 21 67 29 9

by Zone North West Leicestershire Retail & Leisure Study Page 43
Weighted: For Lichfields July 2018
Total Zone 1 Zone 2 Zone 3 Zone 4 Zone 5 Zone 6 Zone 7
Column %ges.060718 NEMS market research
Q35 What does your household dislike about shopping in Ibstock? [MR]Those who have visited Ibstock in the last 12 months at Q25:
Lack of key national anchorshops
3.0% 4 0.0% 0 0.0% 0 0.0% 0 0.0% 0 8.5% 4 0.0% 0 0.0% 0
Needs an update / revamp 1.0% 1 0.0% 0 0.0% 0 0.0% 0 0.0% 0 1.6% 1 0.0% 0 6.5% 1Not attractive / poor
environment0.6% 1 0.0% 0 0.0% 0 0.0% 0 0.0% 0 1.6% 1 0.0% 0 0.0% 0
Not enough foodsupermarkets
5.2% 7 0.0% 0 0.0% 0 0.0% 0 0.0% 0 3.9% 2 3.6% 2 40.0% 3
Not enough independentshops
14.0% 18 0.0% 0 0.0% 0 16.7% 2 4.6% 1 22.0% 10 2.7% 1 49.1% 4
Parking - no free parking 0.3% 0 0.0% 0 0.0% 0 0.0% 0 2.3% 0 0.0% 0 0.0% 0 0.0% 0Parking - not enough spaces
available1.8% 2 0.0% 0 0.0% 0 0.0% 0 5.5% 1 3.1% 1 0.0% 0 0.0% 0
Poor atmosphere / unfriendlypeople
0.3% 0 0.0% 0 0.0% 0 0.0% 0 2.3% 0 0.0% 0 0.0% 0 0.0% 0
Too many empty shops 3.4% 4 0.0% 0 0.0% 0 0.0% 0 2.3% 0 5.0% 2 3.9% 2 0.0% 0Lack of leisure facilities (e.g.
cinema, theatre etc.)0.7% 1 0.0% 0 0.0% 0 0.0% 0 0.0% 0 0.0% 0 1.9% 1 0.0% 0
Not enough shops in general 3.8% 5 0.0% 0 0.0% 0 0.0% 0 0.0% 0 7.2% 3 3.6% 2 0.0% 0Too many cafés / restaurants 0.2% 0 0.0% 0 0.0% 0 0.0% 0 0.0% 0 0.7% 0 0.0% 0 0.0% 0Too many expensive shops 1.1% 1 0.0% 0 0.0% 0 0.0% 0 0.0% 0 3.1% 1 0.0% 0 0.0% 0Too many fast food /
takeaway restaurants0.6% 1 0.0% 0 0.0% 0 0.0% 0 0.0% 0 1.6% 1 0.0% 0 0.0% 0
Too many shops of one type 1.5% 2 0.0% 0 0.0% 0 0.0% 0 3.2% 1 3.1% 1 0.0% 0 0.0% 0(Don’t know) 2.9% 4 0.0% 0 0.0% 0 0.0% 0 9.8% 2 1.6% 1 0.0% 0 15.6% 1(Don't dislike anything) 66.3% 84 0.0% 0 100.0% 2 83.3% 10 74.5% 13 44.7% 20 86.3% 37 28.7% 2Weighted base: 127 0 2 12 17 45 43 8Sample: 140 0 5 9 21 67 29 9
Q36 What does your household like about shopping in Kegworth? [MR]Those who have visited Kegworth in the last 12 months at Q25:
Close to home 47.1% 18 49.4% 16 0.0% 0 0.0% 0 76.5% 2 0.0% 0 0.0% 0 0.0% 0Close to work / en route to
work6.2% 2 5.5% 2 0.0% 0 0.0% 0 23.5% 1 0.0% 0 0.0% 0 0.0% 0
Familiar / know whereeverything is
1.5% 1 1.7% 1 0.0% 0 0.0% 0 0.0% 0 0.0% 0 0.0% 0 0.0% 0
Good cafés / restaurants 13.6% 5 10.5% 3 0.0% 0 0.0% 0 76.5% 2 0.0% 0 0.0% 0 0.0% 0Good choice of shops in
general1.5% 1 1.7% 1 0.0% 0 0.0% 0 0.0% 0 0.0% 0 0.0% 0 0.0% 0
Good range of independentshops
6.2% 2 7.2% 2 0.0% 0 0.0% 0 0.0% 0 0.0% 0 0.0% 0 0.0% 0
Nice atmosphere / friendlypeople
2.6% 1 0.0% 0 0.0% 0 0.0% 0 0.0% 0 0.0% 0 0.0% 0 100.1% 1
Nice place to visit 5.8% 2 4.9% 2 58.1% 1 0.0% 0 0.0% 0 0.0% 0 0.0% 0 0.0% 0(Don't like anything) 24.6% 9 24.2% 8 41.8% 0 100.1% 1 0.0% 0 100.1% 0 0.0% 0 0.0% 0Has a Co-op supermarket 2.7% 1 3.2% 1 0.0% 0 0.0% 0 0.0% 0 0.0% 0 0.0% 0 0.0% 0Weighted base: 38 33 1 1 2 0 0 1Sample: 43 36 2 1 2 1 0 1
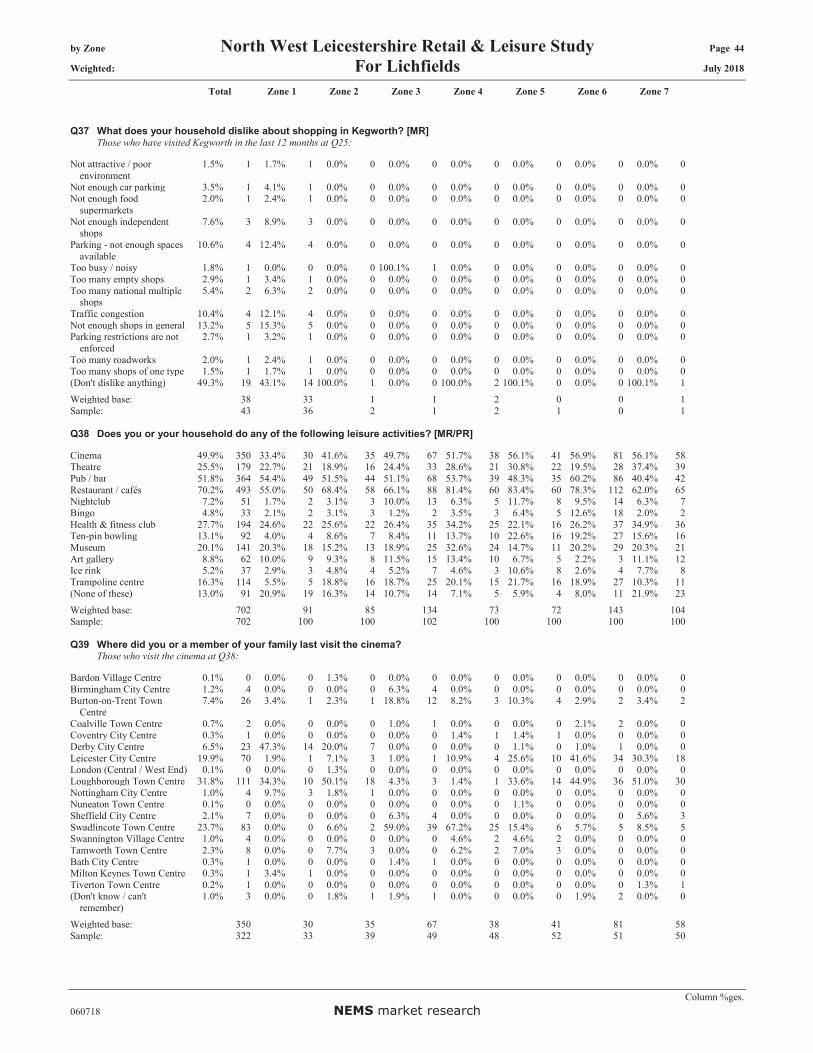
by Zone North West Leicestershire Retail & Leisure Study Page 44
Weighted: For Lichfields July 2018
Total Zone 1 Zone 2 Zone 3 Zone 4 Zone 5 Zone 6 Zone 7
Column %ges.060718 NEMS market research
Q37 What does your household dislike about shopping in Kegworth? [MR]Those who have visited Kegworth in the last 12 months at Q25:
Not attractive / poorenvironment
1.5% 1 1.7% 1 0.0% 0 0.0% 0 0.0% 0 0.0% 0 0.0% 0 0.0% 0
Not enough car parking 3.5% 1 4.1% 1 0.0% 0 0.0% 0 0.0% 0 0.0% 0 0.0% 0 0.0% 0Not enough food
supermarkets2.0% 1 2.4% 1 0.0% 0 0.0% 0 0.0% 0 0.0% 0 0.0% 0 0.0% 0
Not enough independentshops
7.6% 3 8.9% 3 0.0% 0 0.0% 0 0.0% 0 0.0% 0 0.0% 0 0.0% 0
Parking - not enough spacesavailable
10.6% 4 12.4% 4 0.0% 0 0.0% 0 0.0% 0 0.0% 0 0.0% 0 0.0% 0
Too busy / noisy 1.8% 1 0.0% 0 0.0% 0 100.1% 1 0.0% 0 0.0% 0 0.0% 0 0.0% 0Too many empty shops 2.9% 1 3.4% 1 0.0% 0 0.0% 0 0.0% 0 0.0% 0 0.0% 0 0.0% 0Too many national multiple
shops5.4% 2 6.3% 2 0.0% 0 0.0% 0 0.0% 0 0.0% 0 0.0% 0 0.0% 0
Traffic congestion 10.4% 4 12.1% 4 0.0% 0 0.0% 0 0.0% 0 0.0% 0 0.0% 0 0.0% 0Not enough shops in general 13.2% 5 15.3% 5 0.0% 0 0.0% 0 0.0% 0 0.0% 0 0.0% 0 0.0% 0Parking restrictions are not
enforced2.7% 1 3.2% 1 0.0% 0 0.0% 0 0.0% 0 0.0% 0 0.0% 0 0.0% 0
Too many roadworks 2.0% 1 2.4% 1 0.0% 0 0.0% 0 0.0% 0 0.0% 0 0.0% 0 0.0% 0Too many shops of one type 1.5% 1 1.7% 1 0.0% 0 0.0% 0 0.0% 0 0.0% 0 0.0% 0 0.0% 0(Don't dislike anything) 49.3% 19 43.1% 14 100.0% 1 0.0% 0 100.0% 2 100.1% 0 0.0% 0 100.1% 1Weighted base: 38 33 1 1 2 0 0 1Sample: 43 36 2 1 2 1 0 1
Q38 Does you or your household do any of the following leisure activities? [MR/PR]
Cinema 49.9% 350 33.4% 30 41.6% 35 49.7% 67 51.7% 38 56.1% 41 56.9% 81 56.1% 58Theatre 25.5% 179 22.7% 21 18.9% 16 24.4% 33 28.6% 21 30.8% 22 19.5% 28 37.4% 39Pub / bar 51.8% 364 54.4% 49 51.5% 44 51.1% 68 53.7% 39 48.3% 35 60.2% 86 40.4% 42Restaurant / cafés 70.2% 493 55.0% 50 68.4% 58 66.1% 88 81.4% 60 83.4% 60 78.3% 112 62.0% 65Nightclub 7.2% 51 1.7% 2 3.1% 3 10.0% 13 6.3% 5 11.7% 8 9.5% 14 6.3% 7Bingo 4.8% 33 2.1% 2 3.1% 3 1.2% 2 3.5% 3 6.4% 5 12.6% 18 2.0% 2Health & fitness club 27.7% 194 24.6% 22 25.6% 22 26.4% 35 34.2% 25 22.1% 16 26.2% 37 34.9% 36Ten-pin bowling 13.1% 92 4.0% 4 8.6% 7 8.4% 11 13.7% 10 22.6% 16 19.2% 27 15.6% 16Museum 20.1% 141 20.3% 18 15.2% 13 18.9% 25 32.6% 24 14.7% 11 20.2% 29 20.3% 21Art gallery 8.8% 62 10.0% 9 9.3% 8 11.5% 15 13.4% 10 6.7% 5 2.2% 3 11.1% 12Ice rink 5.2% 37 2.9% 3 4.8% 4 5.2% 7 4.6% 3 10.6% 8 2.6% 4 7.7% 8Trampoline centre 16.3% 114 5.5% 5 18.8% 16 18.7% 25 20.1% 15 21.7% 16 18.9% 27 10.3% 11(None of these) 13.0% 91 20.9% 19 16.3% 14 10.7% 14 7.1% 5 5.9% 4 8.0% 11 21.9% 23Weighted base: 702 91 85 134 73 72 143 104Sample: 702 100 100 102 100 100 100 100
Q39 Where did you or a member of your family last visit the cinema?Those who visit the cinema at Q38:
Bardon Village Centre 0.1% 0 0.0% 0 1.3% 0 0.0% 0 0.0% 0 0.0% 0 0.0% 0 0.0% 0Birmingham City Centre 1.2% 4 0.0% 0 0.0% 0 6.3% 4 0.0% 0 0.0% 0 0.0% 0 0.0% 0Burton-on-Trent Town
Centre7.4% 26 3.4% 1 2.3% 1 18.8% 12 8.2% 3 10.3% 4 2.9% 2 3.4% 2
Coalville Town Centre 0.7% 2 0.0% 0 0.0% 0 1.0% 1 0.0% 0 0.0% 0 2.1% 2 0.0% 0Coventry City Centre 0.3% 1 0.0% 0 0.0% 0 0.0% 0 1.4% 1 1.4% 1 0.0% 0 0.0% 0Derby City Centre 6.5% 23 47.3% 14 20.0% 7 0.0% 0 0.0% 0 1.1% 0 1.0% 1 0.0% 0Leicester City Centre 19.9% 70 1.9% 1 7.1% 3 1.0% 1 10.9% 4 25.6% 10 41.6% 34 30.3% 18London (Central / West End) 0.1% 0 0.0% 0 1.3% 0 0.0% 0 0.0% 0 0.0% 0 0.0% 0 0.0% 0Loughborough Town Centre 31.8% 111 34.3% 10 50.1% 18 4.3% 3 1.4% 1 33.6% 14 44.9% 36 51.0% 30Nottingham City Centre 1.0% 4 9.7% 3 1.8% 1 0.0% 0 0.0% 0 0.0% 0 0.0% 0 0.0% 0Nuneaton Town Centre 0.1% 0 0.0% 0 0.0% 0 0.0% 0 0.0% 0 1.1% 0 0.0% 0 0.0% 0Sheffield City Centre 2.1% 7 0.0% 0 0.0% 0 6.3% 4 0.0% 0 0.0% 0 0.0% 0 5.6% 3Swadlincote Town Centre 23.7% 83 0.0% 0 6.6% 2 59.0% 39 67.2% 25 15.4% 6 5.7% 5 8.5% 5Swannington Village Centre 1.0% 4 0.0% 0 0.0% 0 0.0% 0 4.6% 2 4.6% 2 0.0% 0 0.0% 0Tamworth Town Centre 2.3% 8 0.0% 0 7.7% 3 0.0% 0 6.2% 2 7.0% 3 0.0% 0 0.0% 0Bath City Centre 0.3% 1 0.0% 0 0.0% 0 1.4% 1 0.0% 0 0.0% 0 0.0% 0 0.0% 0Milton Keynes Town Centre 0.3% 1 3.4% 1 0.0% 0 0.0% 0 0.0% 0 0.0% 0 0.0% 0 0.0% 0Tiverton Town Centre 0.2% 1 0.0% 0 0.0% 0 0.0% 0 0.0% 0 0.0% 0 0.0% 0 1.3% 1(Don't know / can't
remember)1.0% 3 0.0% 0 1.8% 1 1.9% 1 0.0% 0 0.0% 0 1.9% 2 0.0% 0
Weighted base: 350 30 35 67 38 41 81 58Sample: 322 33 39 49 48 52 51 50

by Zone North West Leicestershire Retail & Leisure Study Page 45
Weighted: For Lichfields July 2018
Total Zone 1 Zone 2 Zone 3 Zone 4 Zone 5 Zone 6 Zone 7
Column %ges.060718 NEMS market research
Q40 Where did you or a member of your family last visit the Theatre?Those who visit the theatre at Q38:
Ashby-de-la-Zouch TownCentre
1.9% 3 0.0% 0 0.0% 0 8.0% 3 0.0% 0 0.0% 0 0.0% 0 1.9% 1
Birmingham City Centre 7.9% 14 0.0% 0 3.9% 1 7.9% 3 43.9% 9 1.4% 0 0.0% 0 3.8% 1Coalville Town Centre 1.7% 3 0.0% 0 2.8% 0 0.0% 0 0.0% 0 0.0% 0 7.2% 2 1.4% 1Coventry City Centre 1.2% 2 0.0% 0 0.0% 0 0.0% 0 7.9% 2 2.5% 1 0.0% 0 0.0% 0Derby City Centre 2.8% 5 14.1% 3 6.6% 1 0.0% 0 5.3% 1 0.0% 0 0.0% 0 0.0% 0Hinckley Town Centre 0.3% 1 0.0% 0 0.0% 0 0.0% 0 0.0% 0 0.0% 0 0.0% 0 1.4% 1Leicester City Centre 33.3% 60 5.0% 1 20.3% 3 15.1% 5 18.0% 4 58.1% 13 38.7% 11 59.0% 23Lichfield City Centre 1.9% 3 0.0% 0 0.0% 0 2.9% 1 0.0% 0 0.0% 0 0.0% 0 6.2% 2London (Central / West End) 13.1% 23 10.1% 2 0.0% 0 28.5% 9 7.0% 1 9.7% 2 23.3% 6 5.2% 2Loughborough Town Centre 10.3% 19 15.1% 3 34.5% 6 0.0% 0 0.0% 0 16.6% 4 6.0% 2 11.5% 4Nottingham City Centre 13.4% 24 50.2% 10 15.5% 2 10.0% 3 12.8% 3 9.8% 2 0.0% 0 7.7% 3Buxton Town Centre 0.9% 2 0.0% 0 0.0% 0 0.0% 0 0.0% 0 0.0% 0 5.6% 2 0.0% 0Leeds City Centre 0.3% 1 2.7% 1 0.0% 0 0.0% 0 0.0% 0 0.0% 0 0.0% 0 0.0% 0Manchester City Centre 0.3% 1 0.0% 0 0.0% 0 0.0% 0 2.6% 1 0.0% 0 0.0% 0 0.0% 0North Kilworth Village
Centre0.3% 1 2.7% 1 0.0% 0 0.0% 0 0.0% 0 0.0% 0 0.0% 0 0.0% 0
Stratford-upon-Avon TownCentre
0.3% 1 0.0% 0 0.0% 0 0.0% 0 2.6% 1 0.0% 0 0.0% 0 0.0% 0
(Don't know / can'tremember)
10.1% 18 0.0% 0 16.4% 3 27.6% 9 0.0% 0 1.9% 0 19.2% 5 1.9% 1
Weighted base: 179 21 16 33 21 22 28 39Sample: 182 24 18 23 33 27 20 37

by Zone North West Leicestershire Retail & Leisure Study Page 46
Weighted: For Lichfields July 2018
Total Zone 1 Zone 2 Zone 3 Zone 4 Zone 5 Zone 6 Zone 7
Column %ges.060718 NEMS market research
Q41 Where did you or a member of your family last visit a pub / bar?Those who visit for pubs / bars at Q38:
Appleby Magna VillageCentre
0.5% 2 0.0% 0 0.0% 0 1.0% 1 3.0% 1 0.0% 0 0.0% 0 0.0% 0
Ashby-de-la-Zouch TownCentre
22.6% 82 0.0% 0 18.7% 8 71.4% 49 13.8% 5 22.6% 8 5.1% 4 17.6% 7
Bardon Village Centre 0.2% 1 0.0% 0 0.0% 0 0.0% 0 0.0% 0 1.6% 1 0.0% 0 0.0% 0Belton Village Centre 0.1% 0 0.0% 0 1.0% 0 0.0% 0 0.0% 0 0.0% 0 0.0% 0 0.0% 0Birmingham City Centre 0.5% 2 0.0% 0 0.0% 0 0.0% 0 4.5% 2 0.0% 0 0.0% 0 0.0% 0Blackfordby Village Centre 0.4% 2 0.0% 0 0.0% 0 2.4% 2 0.0% 0 0.0% 0 0.0% 0 0.0% 0Breedon-on-the-Hill Village
Centre0.5% 2 1.1% 1 2.9% 1 0.0% 0 0.0% 0 0.0% 0 0.0% 0 0.0% 0
Burton-on-Trent TownCentre
0.6% 2 0.0% 0 0.0% 0 0.0% 0 5.9% 2 0.0% 0 0.0% 0 0.0% 0
Castle Donington TownCentre
5.5% 20 34.9% 17 6.2% 3 0.0% 0 0.0% 0 0.0% 0 0.0% 0 0.0% 0
Church Gresley VillageCentre
0.3% 1 0.0% 0 0.0% 0 0.0% 0 1.8% 1 0.9% 0 0.0% 0 0.0% 0
Coalville Town Centre 18.2% 66 0.0% 0 6.7% 3 1.0% 1 6.3% 2 17.3% 6 49.4% 42 27.4% 12Coleorton Village Centre 1.2% 4 0.0% 0 5.9% 3 1.0% 1 0.0% 0 0.0% 0 0.0% 0 2.3% 1Coventry City Centre 0.2% 1 0.0% 0 0.0% 0 0.0% 0 0.0% 0 1.6% 1 0.0% 0 0.0% 0Derby City Centre 1.9% 7 8.2% 4 1.4% 1 1.8% 1 0.0% 0 0.0% 0 1.0% 1 0.0% 0Diseworth Village Centre 0.3% 1 1.6% 1 1.0% 0 0.0% 0 0.0% 0 0.0% 0 0.0% 0 0.0% 0Donisthorpe Village Centre 0.9% 3 0.0% 0 0.0% 0 0.0% 0 8.2% 3 0.0% 0 0.0% 0 0.0% 0Heather Village Centre 0.1% 1 0.0% 0 0.0% 0 0.0% 0 0.0% 0 0.0% 0 0.0% 0 1.3% 1Ibstock Town Centre 1.8% 7 0.0% 0 0.0% 0 0.0% 0 0.0% 0 19.0% 7 0.0% 0 0.0% 0Kegworth Village Centre 1.6% 6 12.2% 6 0.0% 0 0.0% 0 0.0% 0 0.0% 0 0.0% 0 0.0% 0Leicester City Centre 6.0% 22 1.6% 1 7.1% 3 0.0% 0 4.5% 2 7.9% 3 11.2% 10 8.8% 4Lichfield City Centre 0.2% 1 0.0% 0 0.0% 0 1.0% 1 0.0% 0 0.0% 0 0.0% 0 0.0% 0London (Central / West End) 0.4% 2 0.0% 0 0.0% 0 0.0% 0 0.0% 0 0.0% 0 1.8% 2 0.0% 0Long Whatton Village
Centre0.8% 3 5.9% 3 0.0% 0 0.0% 0 0.0% 0 0.0% 0 0.0% 0 0.0% 0
Loughborough Town Centre 7.8% 28 7.3% 4 9.2% 4 0.0% 0 0.0% 0 0.0% 0 15.7% 14 17.1% 7Lount Village Centre 0.5% 2 0.0% 0 3.3% 1 0.0% 0 0.0% 0 0.9% 0 0.0% 0 0.0% 0Market Bosworth Town
Centre0.4% 1 0.0% 0 0.0% 0 0.0% 0 1.4% 1 0.0% 0 1.0% 1 0.0% 0
Markfield Village Centre 0.6% 2 0.0% 0 0.0% 0 0.0% 0 0.0% 0 4.0% 1 1.0% 1 0.0% 0Measham Village Centre 1.9% 7 0.0% 0 0.0% 0 0.0% 0 14.1% 6 4.0% 1 0.0% 0 0.0% 0Melbourne Town Centre 1.5% 6 0.0% 0 1.4% 1 6.1% 4 0.0% 0 0.0% 0 0.0% 0 1.8% 1Moira Village Centre 0.4% 1 0.0% 0 0.0% 0 2.0% 1 0.0% 0 0.0% 0 0.0% 0 0.0% 0Nottingham City Centre 1.9% 7 1.6% 1 4.6% 2 6.1% 4 0.0% 0 0.0% 0 0.0% 0 0.0% 0Nuneaton Town Centre 0.1% 0 0.0% 0 0.0% 0 0.0% 0 0.0% 0 1.2% 0 0.0% 0 0.0% 0Packington Village Centre 0.8% 3 0.0% 0 0.0% 0 1.0% 1 4.6% 2 1.2% 0 0.0% 0 0.0% 0Ravenstone Village Centre 0.1% 0 0.0% 0 0.0% 0 0.0% 0 0.0% 0 0.9% 0 0.0% 0 0.0% 0Shardlow Village Centre 1.1% 4 8.1% 4 0.0% 0 0.0% 0 0.0% 0 0.0% 0 0.0% 0 0.0% 0Sheffield City Centre 0.5% 2 0.0% 0 0.0% 0 0.0% 0 0.0% 0 5.4% 2 0.0% 0 0.0% 0Shepshed Town Centre 0.1% 0 0.0% 0 1.0% 0 0.0% 0 0.0% 0 0.0% 0 0.0% 0 0.0% 0Swadlincote Town Centre 0.9% 3 0.0% 0 1.9% 1 1.4% 1 2.4% 1 0.0% 0 0.0% 0 1.8% 1Swannington Village Centre 0.1% 0 0.0% 0 1.0% 0 0.0% 0 0.0% 0 0.0% 0 0.0% 0 0.0% 0Tamworth Town Centre 0.1% 1 0.0% 0 0.0% 0 0.0% 0 1.4% 1 0.0% 0 0.0% 0 0.0% 0Thringstone Village Centre 1.5% 5 0.0% 0 12.1% 5 0.0% 0 0.0% 0 0.0% 0 0.0% 0 0.0% 0Whitwick Village Centre 2.5% 9 0.0% 0 8.2% 4 0.0% 0 0.0% 0 0.0% 0 1.0% 1 11.0% 5Abroad 0.7% 3 5.1% 3 0.0% 0 0.0% 0 0.0% 0 0.0% 0 0.0% 0 0.0% 0Aston-on-Trent Village
Centre0.1% 0 0.0% 0 1.0% 0 0.0% 0 0.0% 0 0.0% 0 0.0% 0 0.0% 0
Broadway Village Centre 0.1% 1 0.0% 0 0.0% 0 0.0% 0 1.4% 1 0.0% 0 0.0% 0 0.0% 0Chilcote Village Centre 0.3% 1 2.1% 1 0.0% 0 0.0% 0 0.0% 0 0.0% 0 0.0% 0 0.0% 0Copt Oak Local Centre 0.1% 0 0.0% 0 1.0% 0 0.0% 0 0.0% 0 0.0% 0 0.0% 0 0.0% 0Donington-le-Heath Village
Centre0.3% 1 0.0% 0 0.0% 0 0.0% 0 0.0% 0 0.0% 0 1.4% 1 0.0% 0
East Leake Village Centre 0.1% 0 0.0% 0 1.0% 0 0.0% 0 0.0% 0 0.0% 0 0.0% 0 0.0% 0Edinburgh City Centre 0.1% 0 0.0% 0 1.0% 0 0.0% 0 0.0% 0 0.0% 0 0.0% 0 0.0% 0Gelsmoor Local Centre 0.1% 1 0.0% 0 0.0% 0 0.0% 0 0.0% 0 0.0% 0 0.0% 0 1.3% 1Hemington Village Centre 1.1% 4 8.2% 4 0.0% 0 0.0% 0 0.0% 0 0.0% 0 0.0% 0 0.0% 0Ingleby Village Centre 0.3% 1 0.0% 0 0.0% 0 1.8% 1 0.0% 0 0.0% 0 0.0% 0 0.0% 0Nailstone Village Centre 0.1% 0 0.0% 0 0.0% 0 0.0% 0 0.0% 0 0.9% 0 0.0% 0 0.0% 0Newton Burgoland Local
Centre0.3% 1 0.0% 0 0.0% 0 0.0% 0 2.4% 1 0.9% 0 0.0% 0 0.0% 0
Osbaston Village Centre 0.1% 0 0.0% 0 0.0% 0 0.0% 0 0.0% 0 0.9% 0 0.0% 0 0.0% 0Oxford City Centre 0.1% 0 0.0% 0 0.0% 0 0.0% 0 0.0% 0 0.9% 0 0.0% 0 0.0% 0Repton Village Centre 0.2% 1 0.0% 0 0.0% 0 1.0% 1 0.0% 0 0.0% 0 0.0% 0 0.0% 0Snarestone Village Centre 1.0% 4 0.0% 0 0.0% 0 0.0% 0 9.6% 4 0.0% 0 0.0% 0 0.0% 0Southport Town Centre 0.3% 1 2.1% 1 0.0% 0 0.0% 0 0.0% 0 0.0% 0 0.0% 0 0.0% 0
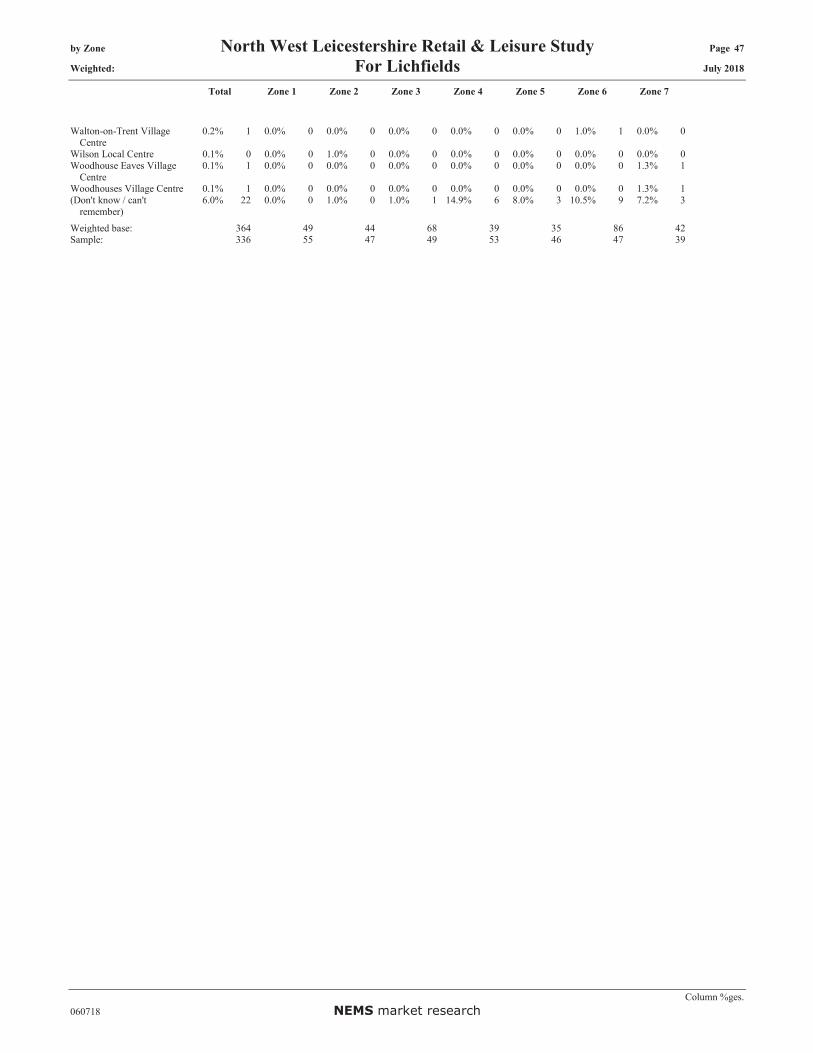
by Zone North West Leicestershire Retail & Leisure Study Page 47
Weighted: For Lichfields July 2018
Total Zone 1 Zone 2 Zone 3 Zone 4 Zone 5 Zone 6 Zone 7
Column %ges.060718 NEMS market research
Walton-on-Trent VillageCentre
0.2% 1 0.0% 0 0.0% 0 0.0% 0 0.0% 0 0.0% 0 1.0% 1 0.0% 0
Wilson Local Centre 0.1% 0 0.0% 0 1.0% 0 0.0% 0 0.0% 0 0.0% 0 0.0% 0 0.0% 0Woodhouse Eaves Village
Centre0.1% 1 0.0% 0 0.0% 0 0.0% 0 0.0% 0 0.0% 0 0.0% 0 1.3% 1
Woodhouses Village Centre 0.1% 1 0.0% 0 0.0% 0 0.0% 0 0.0% 0 0.0% 0 0.0% 0 1.3% 1(Don't know / can't
remember)6.0% 22 0.0% 0 1.0% 0 1.0% 1 14.9% 6 8.0% 3 10.5% 9 7.2% 3
Weighted base: 364 49 44 68 39 35 86 42Sample: 336 55 47 49 53 46 47 39

by Zone North West Leicestershire Retail & Leisure Study Page 48
Weighted: For Lichfields July 2018
Total Zone 1 Zone 2 Zone 3 Zone 4 Zone 5 Zone 6 Zone 7
Column %ges.060718 NEMS market research
Q42 Where did you or a member of your family last visit a restaurant / café?Those who visit for restaurants at Q38:
Appleby Magna VillageCentre
0.2% 1 0.0% 0 0.0% 0 0.0% 0 0.9% 1 0.5% 0 0.0% 0 0.0% 0
Ashby-de-la-Zouch TownCentre
24.5% 121 0.0% 0 19.6% 11 62.0% 55 28.7% 17 35.7% 22 10.6% 12 6.1% 4
Bardon Village Centre 0.2% 1 0.0% 0 0.0% 0 0.0% 0 0.0% 0 0.9% 1 0.0% 0 0.8% 1Birmingham City Centre 0.6% 3 2.1% 1 0.0% 0 0.0% 0 3.0% 2 0.5% 0 0.0% 0 0.0% 0Blackfordby Village Centre 0.4% 2 0.0% 0 0.0% 0 0.0% 0 3.0% 2 0.0% 0 0.0% 0 0.0% 0Breedon-on-the-Hill Village
Centre0.1% 1 1.1% 1 0.0% 0 0.0% 0 0.0% 0 0.0% 0 0.0% 0 0.0% 0
Burton-on-Trent TownCentre
1.0% 5 0.0% 0 0.0% 0 2.6% 2 4.3% 3 0.0% 0 0.0% 0 0.0% 0
Castle Donington TownCentre
2.1% 11 21.2% 11 0.0% 0 0.0% 0 0.0% 0 0.0% 0 0.0% 0 0.0% 0
Coalville Town Centre 15.6% 77 0.0% 0 12.7% 7 0.0% 0 0.0% 0 12.5% 8 35.2% 39 35.3% 23Coleorton Village Centre 2.0% 10 0.0% 0 2.9% 2 3.0% 3 0.0% 0 1.4% 1 2.1% 2 3.5% 2Coventry City Centre 0.1% 1 0.0% 0 0.0% 0 0.0% 0 0.0% 0 0.9% 1 0.0% 0 0.0% 0Derby City Centre 3.7% 18 12.8% 6 2.9% 2 0.8% 1 0.0% 0 0.0% 0 5.6% 6 5.3% 3Diseworth Village Centre 0.2% 1 2.1% 1 0.0% 0 0.0% 0 0.0% 0 0.0% 0 0.0% 0 0.0% 0Heather Village Centre 0.2% 1 0.0% 0 1.4% 1 0.0% 0 0.0% 0 0.0% 0 0.0% 0 0.0% 0Hinckley Town Centre 0.8% 4 0.0% 0 0.0% 0 0.0% 0 0.0% 0 0.0% 0 3.4% 4 0.0% 0Ibstock Town Centre 2.3% 11 0.0% 0 0.0% 0 0.0% 0 0.0% 0 14.5% 9 1.4% 2 1.5% 1Kegworth Village Centre 1.0% 5 8.6% 4 0.8% 0 0.0% 0 0.0% 0 0.0% 0 0.0% 0 0.0% 0Leicester City Centre 6.7% 33 3.8% 2 2.9% 2 0.0% 0 6.9% 4 4.0% 2 16.4% 18 7.1% 5Lichfield City Centre 0.1% 0 0.0% 0 0.0% 0 0.0% 0 0.7% 0 0.0% 0 0.0% 0 0.0% 0London (Central / West End) 0.2% 1 0.0% 0 1.5% 1 0.0% 0 0.0% 0 0.0% 0 0.0% 0 0.0% 0Long Whatton Village
Centre0.9% 4 5.9% 3 0.0% 0 0.8% 1 0.0% 0 0.0% 0 0.0% 0 1.2% 1
Loughborough Town Centre 7.9% 39 8.9% 4 15.1% 9 0.0% 0 0.0% 0 4.9% 3 10.6% 12 16.6% 11Lount Village Centre 0.2% 1 0.0% 0 1.4% 1 0.0% 0 0.0% 0 0.5% 0 0.0% 0 0.0% 0Market Bosworth Town
Centre0.4% 2 0.0% 0 0.8% 0 0.0% 0 0.9% 1 2.0% 1 0.0% 0 0.0% 0
Markfield Village Centre 1.0% 5 0.0% 0 0.0% 0 0.0% 0 0.0% 0 0.0% 0 3.4% 4 2.0% 1Measham Village Centre 2.0% 10 0.0% 0 0.0% 0 4.7% 4 8.4% 5 0.0% 0 0.7% 1 0.0% 0Melbourne Town Centre 0.4% 2 0.0% 0 1.1% 1 0.0% 0 0.0% 0 0.0% 0 0.0% 0 2.3% 1Nottingham City Centre 3.0% 15 5.4% 3 7.0% 4 6.6% 6 0.9% 1 3.1% 2 0.0% 0 0.0% 0Nuneaton Town Centre 0.1% 1 0.0% 0 1.1% 1 0.0% 0 0.0% 0 0.0% 0 0.0% 0 0.0% 0Oakthorpe Village Centre 0.1% 0 0.0% 0 0.0% 0 0.0% 0 0.7% 0 0.0% 0 0.0% 0 0.0% 0Packington Village Centre 0.1% 0 0.0% 0 0.0% 0 0.0% 0 0.0% 0 0.7% 0 0.0% 0 0.0% 0Shardlow Village Centre 0.3% 2 3.2% 2 0.0% 0 0.0% 0 0.0% 0 0.0% 0 0.0% 0 0.0% 0Sheffield City Centre 0.5% 3 0.0% 0 0.0% 0 0.0% 0 0.0% 0 3.1% 2 0.0% 0 1.2% 1Shepshed Town Centre 0.8% 4 0.0% 0 0.8% 0 0.0% 0 0.9% 1 0.0% 0 1.8% 2 1.2% 1Swadlincote Town Centre 1.3% 7 0.0% 0 0.8% 0 3.3% 3 4.6% 3 0.0% 0 0.0% 0 0.8% 1Swannington Village Centre 0.6% 3 0.0% 0 1.4% 1 0.0% 0 0.7% 0 0.0% 0 1.4% 2 0.0% 0Tamworth Town Centre 0.7% 3 0.0% 0 0.0% 0 0.0% 0 3.7% 2 0.0% 0 1.0% 1 0.0% 0Thringstone Village Centre 1.2% 6 0.0% 0 5.7% 3 0.0% 0 0.0% 0 0.0% 0 0.0% 0 3.7% 2Whitwick Village Centre 0.1% 1 0.0% 0 0.0% 0 0.0% 0 0.0% 0 0.0% 0 0.0% 0 0.8% 1Woodville Village Centre 0.6% 3 0.0% 0 0.8% 0 1.4% 1 0.7% 0 0.0% 0 0.0% 0 1.2% 1Abroad 1.0% 5 7.3% 4 0.8% 0 0.0% 0 1.2% 1 0.0% 0 0.0% 0 0.0% 0Alton Village Centre 0.1% 1 0.0% 0 0.0% 0 0.0% 0 0.9% 1 0.0% 0 0.0% 0 0.0% 0Appleby Parva Local Centre 0.1% 0 0.0% 0 0.0% 0 0.0% 0 0.7% 0 0.0% 0 0.0% 0 0.0% 0Bath City Centre 0.2% 1 1.6% 1 0.0% 0 0.0% 0 0.0% 0 0.0% 0 0.0% 0 0.0% 0Belper Town Centre 0.1% 1 1.1% 1 0.0% 0 0.0% 0 0.0% 0 0.0% 0 0.0% 0 0.0% 0Boundary Local Centre 0.2% 1 0.0% 0 0.0% 0 0.0% 0 0.0% 0 0.0% 0 0.7% 1 0.0% 0Broadway Village Centre 0.1% 1 0.0% 0 0.0% 0 0.0% 0 0.9% 1 0.0% 0 0.0% 0 0.0% 0Clawton Village Centre 0.1% 1 0.0% 0 0.0% 0 0.0% 0 0.0% 0 0.0% 0 0.0% 0 0.8% 1Copt Oak Local Centre 0.2% 1 0.0% 0 0.0% 0 0.0% 0 0.0% 0 0.0% 0 0.0% 0 1.5% 1Draycott-in-the-Clay Village
Centre0.2% 1 2.1% 1 0.0% 0 0.0% 0 0.0% 0 0.0% 0 0.0% 0 0.0% 0
Edinburgh City Centre 0.1% 0 0.0% 0 0.8% 0 0.0% 0 0.0% 0 0.0% 0 0.0% 0 0.0% 0Gelsmoor Local Centre 0.1% 1 0.0% 0 0.0% 0 0.0% 0 0.0% 0 0.0% 0 0.0% 0 0.8% 1Griffydam Village Centre 0.1% 0 0.0% 0 0.0% 0 0.0% 0 0.7% 0 0.0% 0 0.0% 0 0.0% 0Hartshorme Village Centre 0.1% 1 0.0% 0 0.0% 0 0.8% 1 0.0% 0 0.0% 0 0.0% 0 0.0% 0Hoby Local Centre 0.1% 1 1.1% 1 0.0% 0 0.0% 0 0.0% 0 0.0% 0 0.0% 0 0.0% 0Ingleby Village Centre 0.3% 1 0.0% 0 0.0% 0 1.4% 1 0.0% 0 0.0% 0 0.0% 0 0.0% 0Kirby Muxloe Village Centre 0.1% 0 0.0% 0 0.0% 0 0.0% 0 0.7% 0 0.0% 0 0.0% 0 0.0% 0Leeds City Centre 0.1% 1 1.1% 1 0.0% 0 0.0% 0 0.0% 0 0.0% 0 0.0% 0 0.0% 0Lount Local Centre 0.1% 1 0.0% 0 0.0% 0 0.0% 0 0.9% 1 0.0% 0 0.0% 0 0.0% 0Mountsorrel Village Centre 0.1% 0 0.0% 0 0.8% 0 0.0% 0 0.0% 0 0.0% 0 0.0% 0 0.0% 0Newbold Local Centre 0.1% 1 0.0% 0 1.1% 1 0.0% 0 0.0% 0 0.0% 0 0.0% 0 0.0% 0Newtown Linford Village
Centre0.1% 1 0.0% 0 0.0% 0 0.8% 1 0.0% 0 0.0% 0 0.0% 0 0.0% 0

by Zone North West Leicestershire Retail & Leisure Study Page 49
Weighted: For Lichfields July 2018
Total Zone 1 Zone 2 Zone 3 Zone 4 Zone 5 Zone 6 Zone 7
Column %ges.060718 NEMS market research
Osbaston Village Centre 0.3% 2 0.0% 0 0.0% 0 0.0% 0 0.0% 0 2.8% 2 0.0% 0 0.0% 0Oxford City Centre 0.1% 0 0.0% 0 0.0% 0 0.0% 0 0.0% 0 0.5% 0 0.0% 0 0.0% 0Peggs Green Local Centre 0.1% 1 0.0% 0 0.0% 0 0.0% 0 1.2% 1 0.0% 0 0.0% 0 0.0% 0Redditch Town Centre 0.4% 2 0.0% 0 0.0% 0 0.0% 0 3.0% 2 0.0% 0 0.0% 0 0.0% 0Repton Village Centre 1.8% 9 0.0% 0 5.5% 3 6.1% 5 0.0% 0 0.7% 0 0.0% 0 0.0% 0Rowsley Village Centre 0.1% 0 0.0% 0 0.8% 0 0.0% 0 0.0% 0 0.0% 0 0.0% 0 0.0% 0Solihull Town Centre 0.1% 1 0.0% 0 0.0% 0 0.0% 0 0.9% 1 0.0% 0 0.0% 0 0.0% 0Southampton City Centre 0.1% 1 0.0% 0 0.0% 0 0.0% 0 0.0% 0 0.0% 0 0.0% 0 0.8% 1Twycross Village Centre 0.9% 4 0.0% 0 0.0% 0 0.0% 0 4.5% 3 0.0% 0 1.4% 2 0.0% 0Uxbridge Town Centre 0.8% 4 0.0% 0 0.0% 0 4.7% 4 0.0% 0 0.0% 0 0.0% 0 0.0% 0Walton-on-Trent Village
Centre0.3% 2 0.0% 0 0.0% 0 0.0% 0 1.2% 1 0.0% 0 0.7% 1 0.0% 0
Wilson Local Centre 0.2% 1 0.0% 0 1.4% 1 0.0% 0 0.0% 0 0.0% 0 0.0% 0 0.0% 0Woodhouses Village Centre 0.2% 1 0.0% 0 0.0% 0 0.0% 0 0.0% 0 0.0% 0 0.0% 0 1.2% 1(Don't know / can't
remember)6.7% 33 10.7% 5 8.4% 5 1.1% 1 14.5% 9 10.6% 6 3.5% 4 4.3% 3
Weighted base: 493 50 58 88 60 60 112 65Sample: 483 58 65 64 79 83 70 64
Q43 Where did you or a member of your family last visit a nightclub?Those who visit for nightclubs at Q38:
Ashby-de-la-Zouch TownCentre
23.9% 12 0.0% 0 100.0% 3 0.0% 0 11.8% 1 22.2% 2 28.0% 4 50.0% 3
Coalville Town Centre 13.6% 7 0.0% 0 0.0% 0 0.0% 0 38.2% 2 0.0% 0 37.9% 5 0.0% 0Derby City Centre 11.7% 6 0.0% 0 0.0% 0 31.2% 4 38.2% 2 0.0% 0 0.0% 0 0.0% 0Ibstock Town Centre 0.8% 0 0.0% 0 0.0% 0 0.0% 0 0.0% 0 5.1% 0 0.0% 0 0.0% 0Leicester City Centre 12.2% 6 0.0% 0 0.0% 0 0.0% 0 0.0% 0 28.2% 2 28.0% 4 0.0% 0Loughborough Town Centre 8.9% 5 0.0% 0 0.0% 0 9.4% 1 0.0% 0 0.0% 0 0.0% 0 50.0% 3Nottingham City Centre 11.1% 6 0.0% 0 0.0% 0 28.2% 4 0.0% 0 22.2% 2 0.0% 0 0.0% 0Sheffield City Centre 3.7% 2 0.0% 0 0.0% 0 0.0% 0 0.0% 0 22.2% 2 0.0% 0 0.0% 0Abroad 3.2% 2 50.0% 1 0.0% 0 0.0% 0 0.0% 0 0.0% 0 6.2% 1 0.0% 0Leeds City Centre 8.2% 4 0.0% 0 0.0% 0 31.2% 4 0.0% 0 0.0% 0 0.0% 0 0.0% 0(Don't know / can't
remember)2.6% 1 50.0% 1 0.0% 0 0.0% 0 11.8% 1 0.0% 0 0.0% 0 0.0% 0
Weighted base: 51 2 3 13 5 8 14 7Sample: 26 2 2 5 4 7 4 2
Q44 Where did you or a member of your family last go to play bingo?Those who visit for Bingo at Q38:
Beaumont Leys DistrictCentre
15.3% 5 0.0% 0 0.0% 0 0.0% 0 0.0% 0 0.0% 0 28.5% 5 0.0% 0
Castle Donington TownCentre
2.5% 1 0.0% 0 0.0% 0 0.0% 0 0.0% 0 0.0% 0 4.7% 1 0.0% 0
Coalville Town Centre 45.6% 15 0.0% 0 0.0% 0 0.0% 0 69.3% 2 59.6% 3 54.0% 10 48.0% 1Derby City Centre 3.5% 1 41.0% 1 0.0% 0 0.0% 0 15.4% 0 0.0% 0 0.0% 0 0.0% 0Leicester City Centre 8.8% 3 0.0% 0 23.5% 1 0.0% 0 0.0% 0 0.0% 0 12.9% 2 0.0% 0Loughborough Town Centre 12.2% 4 29.5% 1 76.5% 2 58.1% 1 0.0% 0 0.0% 0 0.0% 0 26.0% 1Measham Village Centre 1.2% 0 0.0% 0 0.0% 0 0.0% 0 15.4% 0 0.0% 0 0.0% 0 0.0% 0Moira Village Centre 2.0% 1 0.0% 0 0.0% 0 41.9% 1 0.0% 0 0.0% 0 0.0% 0 0.0% 0Swannington Village Centre 1.7% 1 29.5% 1 0.0% 0 0.0% 0 0.0% 0 0.0% 0 0.0% 0 0.0% 0(Don't know / can't
remember)7.2% 2 0.0% 0 0.0% 0 0.0% 0 0.0% 0 40.4% 2 0.0% 0 26.0% 1
Weighted base: 33 2 3 2 3 5 18 2Sample: 26 3 2 2 3 3 10 3

by Zone North West Leicestershire Retail & Leisure Study Page 50
Weighted: For Lichfields July 2018
Total Zone 1 Zone 2 Zone 3 Zone 4 Zone 5 Zone 6 Zone 7
Column %ges.060718 NEMS market research
Q45 Where did you or a member of your family last go to a healthclub?Those who visit healthclubs at Q38:
Ashby-de-la-Zouch TownCentre
26.5% 51 0.0% 0 6.7% 1 63.1% 22 57.3% 14 37.6% 6 6.4% 2 13.8% 5
Bardon Village Centre 2.9% 6 0.0% 0 0.0% 0 0.0% 0 0.0% 0 0.0% 0 13.2% 5 2.0% 1Breedon-on-the-Hill Village
Centre1.2% 2 0.0% 0 2.1% 0 5.5% 2 0.0% 0 0.0% 0 0.0% 0 0.0% 0
Burton-on-Trent TownCentre
1.7% 3 0.0% 0 0.0% 0 2.7% 1 0.0% 0 0.0% 0 0.0% 0 6.7% 2
Castle Donington TownCentre
5.4% 11 47.1% 11 0.0% 0 0.0% 0 0.0% 0 0.0% 0 0.0% 0 0.0% 0
Coalville Town Centre 14.3% 28 0.0% 0 4.9% 1 1.9% 1 0.0% 0 5.3% 1 30.4% 11 38.0% 14Derby City Centre 1.9% 4 13.9% 3 2.9% 1 0.0% 0 0.0% 0 0.0% 0 0.0% 0 0.0% 0Diseworth Village Centre 0.5% 1 4.6% 1 0.0% 0 0.0% 0 0.0% 0 0.0% 0 0.0% 0 0.0% 0Heather Village Centre 0.7% 1 0.0% 0 0.0% 0 0.0% 0 0.0% 0 8.7% 1 0.0% 0 0.0% 0Hinckley Town Centre 0.9% 2 0.0% 0 0.0% 0 0.0% 0 7.0% 2 0.0% 0 0.0% 0 0.0% 0Hugglescote Village Centre 0.4% 1 0.0% 0 0.0% 0 0.0% 0 0.0% 0 0.0% 0 2.2% 1 0.0% 0Ibstock Town Centre 0.5% 1 0.0% 0 2.1% 0 0.0% 0 0.0% 0 3.5% 1 0.0% 0 0.0% 0Kegworth Village Centre 1.6% 3 14.3% 3 0.0% 0 0.0% 0 0.0% 0 0.0% 0 0.0% 0 0.0% 0Leicester City Centre 2.0% 4 0.0% 0 0.0% 0 0.0% 0 0.0% 0 0.0% 0 4.1% 2 6.7% 2Lichfield City Centre 0.5% 1 0.0% 0 0.0% 0 2.7% 1 0.0% 0 0.0% 0 0.0% 0 0.0% 0Long Eaton Town Centre 1.4% 3 8.5% 2 0.0% 0 0.0% 0 0.0% 0 0.0% 0 0.0% 0 2.0% 1Loughborough Town Centre 5.2% 10 8.1% 2 17.5% 4 0.0% 0 0.0% 0 14.4% 2 2.2% 1 3.5% 1Markfield Village Centre 0.3% 1 0.0% 0 0.0% 0 0.0% 0 0.0% 0 0.0% 0 0.0% 0 1.5% 1Measham Village Centre 2.6% 5 0.0% 0 4.9% 1 0.0% 0 12.7% 3 4.6% 1 0.0% 0 0.0% 0Nottingham City Centre 0.7% 1 3.5% 1 2.9% 1 0.0% 0 0.0% 0 0.0% 0 0.0% 0 0.0% 0Oakthorpe Village Centre 0.2% 0 0.0% 0 0.0% 0 0.0% 0 0.0% 0 2.7% 0 0.0% 0 0.0% 0Swadlincote Town Centre 4.0% 8 0.0% 0 0.0% 0 20.5% 7 2.2% 1 0.0% 0 0.0% 0 0.0% 0Tamworth Town Centre 1.8% 3 0.0% 0 0.0% 0 0.0% 0 13.8% 3 0.0% 0 0.0% 0 0.0% 0Whitwick Village Centre 14.1% 27 0.0% 0 32.8% 7 0.0% 0 0.0% 0 8.7% 1 31.4% 12 19.7% 7Hermitage Village Centre 0.4% 1 0.0% 0 0.0% 0 0.0% 0 0.0% 0 0.0% 0 0.0% 0 2.0% 1Wilson Local Centre 0.8% 2 0.0% 0 7.0% 2 0.0% 0 0.0% 0 0.0% 0 0.0% 0 0.0% 0(Don't know / can't
remember)7.3% 14 0.0% 0 16.4% 4 3.6% 1 7.0% 2 14.4% 2 10.1% 4 4.1% 1
Weighted base: 194 22 22 35 25 16 37 36Sample: 160 23 23 21 27 17 19 30
Q46 Where did you or a member of your family last go for ten-pin bowling?Those who visit for ten-pin bowling at Q38:
Burton-on-Trent TownCentre
2.2% 2 0.0% 0 27.7% 2 0.0% 0 0.0% 0 0.0% 0 0.0% 0 0.0% 0
Coalville Town Centre 5.6% 5 0.0% 0 0.0% 0 0.0% 0 0.0% 0 0.0% 0 18.6% 5 0.0% 0Derby City Centre 8.5% 8 21.5% 1 8.5% 1 45.8% 5 5.4% 1 0.0% 0 0.0% 0 4.6% 1Leicester City Centre 62.6% 58 0.0% 0 55.3% 4 37.3% 4 17.6% 2 73.1% 12 75.7% 21 92.1% 15Nottingham City Centre 3.0% 3 50.0% 2 0.0% 0 8.5% 1 0.0% 0 0.0% 0 0.0% 0 0.0% 0Nuneaton Town Centre 0.6% 1 0.0% 0 0.0% 0 0.0% 0 0.0% 0 3.5% 1 0.0% 0 0.0% 0Sheffield City Centre 0.6% 1 0.0% 0 0.0% 0 0.0% 0 0.0% 0 3.5% 1 0.0% 0 0.0% 0Swadlincote Town Centre 0.6% 1 0.0% 0 0.0% 0 0.0% 0 5.4% 1 0.0% 0 0.0% 0 0.0% 0Tamworth Town Centre 11.8% 11 0.0% 0 8.5% 1 8.5% 1 60.8% 6 20.0% 3 0.0% 0 0.0% 0Braunston Village Centre 1.7% 2 0.0% 0 0.0% 0 0.0% 0 0.0% 0 0.0% 0 5.6% 2 0.0% 0Camberley Town Centre 1.1% 1 28.5% 1 0.0% 0 0.0% 0 0.0% 0 0.0% 0 0.0% 0 0.0% 0Gloucester City Centre 0.6% 1 0.0% 0 0.0% 0 0.0% 0 5.4% 1 0.0% 0 0.0% 0 0.0% 0(Don't know / can't
remember)1.2% 1 0.0% 0 0.0% 0 0.0% 0 5.4% 1 0.0% 0 0.0% 0 3.3% 1
Weighted base: 92 4 7 11 10 16 27 16Sample: 64 4 5 5 12 17 10 11

by Zone North West Leicestershire Retail & Leisure Study Page 51
Weighted: For Lichfields July 2018
Total Zone 1 Zone 2 Zone 3 Zone 4 Zone 5 Zone 6 Zone 7
Column %ges.060718 NEMS market research
Q47 Where did you or a member of your family last go to a museum?Those who visit museums at Q38:
Ashby-de-la-Zouch TownCentre
5.2% 7 0.0% 0 0.0% 0 9.2% 2 9.0% 2 5.3% 1 5.4% 2 3.5% 1
Birmingham City Centre 5.8% 8 0.0% 0 0.0% 0 10.0% 3 18.0% 4 5.3% 1 0.0% 0 3.5% 1Castle Donington Town
Centre1.7% 2 3.0% 1 0.0% 0 0.0% 0 0.0% 0 2.9% 0 5.4% 2 0.0% 0
Coalville Town Centre 3.6% 5 0.0% 0 0.0% 0 0.0% 0 0.0% 0 0.0% 0 17.8% 5 0.0% 0Derby City Centre 5.0% 7 18.8% 3 0.0% 0 12.7% 3 1.6% 0 0.0% 0 0.0% 0 0.0% 0Leicester City Centre 24.2% 34 9.8% 2 15.2% 2 11.9% 3 22.1% 5 28.1% 3 47.3% 14 26.1% 6Lichfield City Centre 0.4% 1 0.0% 0 0.0% 0 0.0% 0 2.3% 1 0.0% 0 0.0% 0 0.0% 0London (Central / West End) 20.7% 29 17.3% 3 20.8% 3 19.2% 5 25.6% 6 31.6% 3 9.4% 3 29.6% 6Loughborough Town Centre 4.7% 7 16.8% 3 22.0% 3 2.7% 1 0.0% 0 0.0% 0 0.0% 0 0.0% 0Measham Village Centre 0.7% 1 0.0% 0 0.0% 0 0.0% 0 3.9% 1 0.0% 0 0.0% 0 0.0% 0Nottingham City Centre 3.5% 5 4.2% 1 0.0% 0 16.5% 4 0.0% 0 0.0% 0 0.0% 0 0.0% 0Nuneaton Town Centre 0.3% 0 0.0% 0 0.0% 0 0.0% 0 1.6% 0 0.0% 0 0.0% 0 0.0% 0York City Centre 1.7% 2 3.0% 1 0.0% 0 0.0% 0 0.0% 0 2.9% 0 5.4% 2 0.0% 0Abroad 4.6% 6 8.7% 2 0.0% 0 2.7% 1 3.0% 1 13.0% 1 5.4% 2 2.5% 1Bath City Centre 0.7% 1 0.0% 0 0.0% 0 3.8% 1 0.0% 0 0.0% 0 0.0% 0 0.0% 0Buxton Town Centre 0.4% 1 3.0% 1 0.0% 0 0.0% 0 0.0% 0 0.0% 0 0.0% 0 0.0% 0Chester City Centre 0.3% 0 0.0% 0 3.5% 0 0.0% 0 0.0% 0 0.0% 0 0.0% 0 0.0% 0Durham City Centre 0.4% 1 3.0% 1 0.0% 0 0.0% 0 0.0% 0 0.0% 0 0.0% 0 0.0% 0Exeter City Centre 0.5% 1 0.0% 0 0.0% 0 0.0% 0 3.0% 1 0.0% 0 0.0% 0 0.0% 0Glasgow City Centre 0.4% 1 3.0% 1 0.0% 0 0.0% 0 0.0% 0 0.0% 0 0.0% 0 0.0% 0Liverpool City Centre 1.3% 2 0.0% 0 0.0% 0 0.0% 0 3.0% 1 0.0% 0 4.0% 1 0.0% 0Manchester City Centre 1.3% 2 0.0% 0 4.8% 1 5.0% 1 0.0% 0 0.0% 0 0.0% 0 0.0% 0Oxford City Centre 0.5% 1 0.0% 0 0.0% 0 0.0% 0 3.0% 1 0.0% 0 0.0% 0 0.0% 0Pickering Town Centre 0.4% 1 3.0% 1 0.0% 0 0.0% 0 0.0% 0 0.0% 0 0.0% 0 0.0% 0Portsmouth City Centre 0.5% 1 0.0% 0 0.0% 0 0.0% 0 0.0% 0 0.0% 0 0.0% 0 3.5% 1South Molton Village Centre 0.5% 1 0.0% 0 0.0% 0 0.0% 0 0.0% 0 0.0% 0 0.0% 0 3.5% 1Thornborough Village
Centre0.4% 1 0.0% 0 4.8% 1 0.0% 0 0.0% 0 0.0% 0 0.0% 0 0.0% 0
West Kirby Town Centre 0.3% 0 0.0% 0 3.5% 0 0.0% 0 0.0% 0 0.0% 0 0.0% 0 0.0% 0(Don't know / can't
remember)9.9% 14 6.1% 1 25.5% 3 6.5% 2 3.9% 1 10.9% 1 0.0% 0 27.6% 6
Weighted base: 141 18 13 25 24 11 29 21Sample: 150 24 17 21 31 18 17 22
Q48 Where did you or a member of your family last go to an art gallery?Those who visit art galleries at Q38:
Birmingham City Centre 6.1% 4 0.0% 0 0.0% 0 8.1% 1 9.5% 1 11.6% 1 0.0% 0 8.5% 1Coventry City Centre 0.9% 1 0.0% 0 0.0% 0 0.0% 0 5.5% 1 0.0% 0 0.0% 0 0.0% 0Derby City Centre 6.2% 4 14.8% 1 10.5% 1 8.1% 1 4.0% 0 0.0% 0 0.0% 0 0.0% 0Leicester City Centre 14.2% 9 14.8% 1 0.0% 0 8.8% 1 5.5% 1 17.6% 1 26.5% 1 33.1% 4London (Central / West End) 36.4% 23 40.4% 4 61.1% 5 31.4% 5 43.5% 4 24.3% 1 36.8% 1 22.1% 3Loughborough Town Centre 2.3% 1 0.0% 0 5.7% 0 6.1% 1 0.0% 0 0.0% 0 0.0% 0 0.0% 0Nottingham City Centre 7.6% 5 17.6% 2 5.7% 0 6.1% 1 0.0% 0 0.0% 0 0.0% 0 14.9% 2Nuneaton Town Centre 0.6% 0 0.0% 0 0.0% 0 0.0% 0 4.0% 0 0.0% 0 0.0% 0 0.0% 0Abroad 6.8% 4 6.2% 1 5.7% 0 4.4% 1 11.3% 1 28.5% 1 0.0% 0 0.0% 0Chester City Centre 0.7% 0 0.0% 0 5.7% 0 0.0% 0 0.0% 0 0.0% 0 0.0% 0 0.0% 0Durham City Centre 0.9% 1 6.2% 1 0.0% 0 0.0% 0 0.0% 0 0.0% 0 0.0% 0 0.0% 0Liverpool City Centre 2.0% 1 0.0% 0 0.0% 0 8.1% 1 0.0% 0 0.0% 0 0.0% 0 0.0% 0Manchester City Centre 2.0% 1 0.0% 0 0.0% 0 8.1% 1 0.0% 0 0.0% 0 0.0% 0 0.0% 0Newcastle-upon-Tyne City
Centre0.7% 0 0.0% 0 5.7% 0 0.0% 0 0.0% 0 0.0% 0 0.0% 0 0.0% 0
Staunton Harold LocalCentre
3.0% 2 0.0% 0 0.0% 0 4.4% 1 0.0% 0 0.0% 0 36.8% 1 0.0% 0
Willington Village Centre 0.9% 1 0.0% 0 0.0% 0 0.0% 0 0.0% 0 11.6% 1 0.0% 0 0.0% 0(Don't know / can't
remember)8.7% 5 0.0% 0 0.0% 0 6.1% 1 16.8% 2 6.3% 0 0.0% 0 21.4% 2
Weighted base: 62 9 8 15 10 5 3 12Sample: 81 12 12 13 16 9 3 16

by Zone North West Leicestershire Retail & Leisure Study Page 52
Weighted: For Lichfields July 2018
Total Zone 1 Zone 2 Zone 3 Zone 4 Zone 5 Zone 6 Zone 7
Column %ges.060718 NEMS market research
Q49 Where did you or a member of your family last go to an ice rink?Those who visit ice rinks at Q38:
Coventry City Centre 6.6% 2 0.0% 0 0.0% 0 0.0% 0 0.0% 0 0.0% 0 0.0% 0 30.2% 2Leicester City Centre 2.0% 1 0.0% 0 0.0% 0 0.0% 0 0.0% 0 0.0% 0 0.0% 0 9.3% 1Nottingham City Centre 21.5% 8 60.1% 2 84.8% 3 13.5% 1 0.0% 0 24.4% 2 0.0% 0 0.0% 0Sheffield City Centre 5.1% 2 0.0% 0 0.0% 0 0.0% 0 0.0% 0 24.4% 2 0.0% 0 0.0% 0Swadlincote Town Centre 6.6% 2 0.0% 0 0.0% 0 0.0% 0 0.0% 0 0.0% 0 0.0% 0 30.2% 2Tamworth Town Centre 56.6% 21 39.9% 1 15.2% 1 86.5% 6 84.0% 3 51.2% 4 100.0% 4 30.2% 2(Don't know / can't
remember)1.5% 1 0.0% 0 0.0% 0 0.0% 0 16.0% 1 0.0% 0 0.0% 0 0.0% 0
Weighted base: 37 3 4 7 3 8 4 8Sample: 27 3 4 4 4 7 1 4
Q50 Where did you or a member of your family last go to a trampoline centre?Those who visit trampoline centres at Q38:
Ashby-de-la-Zouch TownCentre
86.1% 98 68.8% 3 100.0% 16 100.0% 25 92.7% 14 88.0% 14 67.1% 18 77.5% 8
Burton-on-Trent TownCentre
0.5% 1 0.0% 0 0.0% 0 0.0% 0 3.7% 1 0.0% 0 0.0% 0 0.0% 0
Derby City Centre 0.7% 1 15.6% 1 0.0% 0 0.0% 0 0.0% 0 0.0% 0 0.0% 0 0.0% 0Leicester City Centre 1.6% 2 0.0% 0 0.0% 0 0.0% 0 0.0% 0 12.0% 2 0.0% 0 0.0% 0Loughborough Town Centre 2.1% 2 0.0% 0 0.0% 0 0.0% 0 0.0% 0 0.0% 0 0.0% 0 22.5% 2Nottingham City Centre 0.7% 1 15.6% 1 0.0% 0 0.0% 0 0.0% 0 0.0% 0 0.0% 0 0.0% 0Tamworth Town Centre 3.8% 4 0.0% 0 0.0% 0 0.0% 0 3.7% 1 0.0% 0 14.0% 4 0.0% 0(Don't know / can't
remember)4.5% 5 0.0% 0 0.0% 0 0.0% 0 0.0% 0 0.0% 0 18.9% 5 0.0% 0
Weighted base: 114 5 16 25 15 16 27 11Sample: 70 3 11 12 16 12 8 8
Q51 Do you or your household use the Internet for shopping purposes?
Yes 74.2% 521 69.5% 63 77.7% 66 71.8% 96 73.3% 54 84.8% 61 71.4% 102 75.6% 79No 25.8% 181 30.5% 28 22.3% 19 28.2% 38 26.7% 20 15.2% 11 28.6% 41 24.4% 25Weighted base: 702 91 85 134 73 72 143 104Sample: 702 100 100 102 100 100 100 100

by Zone North West Leicestershire Retail & Leisure Study Page 53
Weighted: For Lichfields July 2018
Total Zone 1 Zone 2 Zone 3 Zone 4 Zone 5 Zone 6 Zone 7
Column %ges.060718 NEMS market research
Q52 What type of goods do you or your household regularly buy on the Internet? [MR]Those who use the Internet for shopping purposes at Q51:
Baby items 1.6% 8 1.2% 1 0.0% 0 0.0% 0 3.3% 2 3.1% 2 1.5% 2 3.1% 2Banking / finance 1.4% 7 1.2% 1 0.0% 0 0.0% 0 0.0% 0 3.1% 2 0.0% 0 6.0% 5Books 24.1% 126 35.2% 22 24.0% 16 22.0% 21 22.0% 12 21.6% 13 19.9% 20 26.8% 21Books, CDs, toys and gifts 31.3% 163 44.4% 28 24.7% 16 29.5% 28 29.9% 16 25.3% 16 26.2% 27 40.5% 32Clothes and shoes 57.2% 298 69.1% 43 48.2% 32 54.2% 52 57.6% 31 61.7% 38 57.3% 58 54.8% 43Computer / printer
accessories1.6% 8 4.7% 3 0.9% 1 0.7% 1 1.0% 1 4.8% 3 0.0% 0 0.9% 1
Console / PC games 0.8% 4 0.0% 0 0.9% 1 1.0% 1 4.4% 2 0.7% 0 0.0% 0 0.0% 0Craft / hobby items 2.6% 13 0.9% 1 2.3% 2 5.7% 6 2.2% 1 3.8% 2 0.8% 1 1.9% 1DIY / Hardware and garden
items11.0% 57 17.5% 11 14.0% 9 5.3% 5 13.0% 7 11.8% 7 9.0% 9 10.7% 8
Domestic electric appliances(e.g. fridges and kitchenitems)
27.1% 141 31.0% 20 18.4% 12 17.4% 17 31.1% 17 32.1% 20 32.3% 33 29.4% 23
Downloadable content (e.g.music / movies / tv /games / apps)
4.1% 21 1.2% 1 4.3% 3 1.0% 1 5.0% 3 3.8% 2 1.6% 2 12.7% 10
Food and groceries 12.4% 64 11.4% 7 15.5% 10 7.5% 7 20.7% 11 12.2% 8 10.5% 11 13.2% 10Furniture, soft furnishings
and floor coverings7.0% 37 15.9% 10 4.1% 3 3.1% 3 12.1% 6 8.4% 5 2.5% 3 8.6% 7
Health, beauty and chemistitems
5.4% 28 11.9% 7 6.0% 4 0.7% 1 4.0% 2 4.5% 3 4.5% 5 7.9% 6
Holiday and / or Travel / Event Tickets
3.3% 17 7.4% 5 1.2% 1 1.0% 1 1.0% 1 4.0% 2 1.6% 2 7.7% 6
Jewellery 1.2% 6 1.6% 1 0.7% 0 0.0% 0 0.0% 0 0.0% 0 3.0% 3 1.9% 1Mobile phone accessories 2.1% 11 4.1% 3 0.0% 0 0.0% 0 0.0% 0 5.0% 3 0.0% 0 7.0% 6Other kinds of electrical
goods (e.g. TV / Hi-Fi andcomputers)
28.4% 148 31.1% 20 23.3% 15 26.9% 26 27.7% 15 27.7% 17 32.0% 33 28.5% 22
Pet food / products 2.2% 11 2.9% 2 2.6% 2 0.7% 1 5.3% 3 1.4% 1 1.5% 2 2.3% 2Small household goods 11.3% 59 23.2% 15 17.7% 12 4.0% 4 10.1% 5 4.2% 3 10.6% 11 12.3% 10Sports goods 1.8% 9 4.1% 3 8.3% 5 0.0% 0 0.0% 0 0.5% 0 0.0% 0 0.9% 1Vehicle parts 2.2% 12 1.6% 1 4.2% 3 1.4% 1 0.7% 0 1.2% 1 4.5% 5 0.9% 1Vehicles / vehicle parts 0.8% 4 2.9% 2 0.0% 0 0.0% 0 1.0% 1 0.0% 0 0.8% 1 0.9% 1Other 0.0% 0 0.0% 0 0.0% 0 0.0% 0 0.0% 0 0.0% 0 0.0% 0 0.0% 0Antiques 0.1% 0 0.0% 0 0.7% 0 0.0% 0 0.0% 0 0.0% 0 0.0% 0 0.0% 0Camping equipment 0.1% 1 0.0% 0 0.9% 1 0.0% 0 0.0% 0 0.0% 0 0.0% 0 0.0% 0Staionery 0.2% 1 0.0% 0 1.9% 1 0.0% 0 0.0% 0 0.0% 0 0.0% 0 0.0% 0(Don’t know / can't
remember)6.0% 31 8.3% 5 2.2% 1 7.1% 7 6.4% 3 6.7% 4 3.8% 4 8.3% 6
Weighted base: 521 63 66 96 54 61 102 79Sample: 494 69 73 70 68 77 62 75

by Zone North West Leicestershire Retail & Leisure Study Page 54
Weighted: For Lichfields July 2018
Total Zone 1 Zone 2 Zone 3 Zone 4 Zone 5 Zone 6 Zone 7
Column %ges.060718 NEMS market research
Q53 Why do you or your household use the Internet for online shopping? [MR]Those who use the Internet for shopping purposes at Q51:
Allows me to compare goods/ prices at my leisure
12.6% 65 15.7% 10 8.6% 6 10.8% 10 21.9% 12 4.8% 3 0.0% 0 31.4% 25
Better choice of goods 13.9% 72 8.8% 6 9.3% 6 17.5% 17 9.6% 5 14.4% 9 23.1% 24 7.8% 6Better quality goods online 0.9% 5 2.9% 2 0.0% 0 0.0% 0 2.0% 1 3.1% 2 0.0% 0 0.0% 0Can download items
purchased online0.1% 1 0.0% 0 0.0% 0 0.0% 0 0.0% 0 0.0% 0 0.0% 0 0.7% 1
Can read reviews of productsonline
0.3% 1 1.6% 1 0.7% 0 0.0% 0 0.0% 0 0.0% 0 0.0% 0 0.0% 0
Can shop 24 hours 7.2% 38 10.2% 6 0.9% 1 20.9% 20 3.0% 2 5.7% 3 4.6% 5 0.9% 1Can use my loyalty points
online0.0% 0 0.0% 0 0.0% 0 0.0% 0 0.0% 0 0.0% 0 0.0% 0 0.0% 0
Cheaper prices 15.1% 79 13.9% 9 8.3% 6 18.7% 18 10.1% 5 19.5% 12 24.6% 25 5.2% 4City / town centre too large
to walk round1.4% 7 5.4% 3 0.0% 0 2.3% 2 1.3% 1 0.7% 0 0.0% 0 0.7% 1
Delivery service / savescarrying goods home
16.8% 87 13.3% 8 19.6% 13 14.7% 14 22.3% 12 18.2% 11 6.4% 6 28.3% 22
Disabled / find it hardwalking
2.3% 12 3.0% 2 1.2% 1 0.7% 1 4.0% 2 2.3% 1 1.1% 1 4.8% 4
Don't have to find a parkingspace / drive there
1.1% 6 1.8% 1 3.7% 2 0.7% 1 0.7% 0 0.5% 0 0.0% 0 0.9% 1
Don't like store shopping 1.0% 5 0.0% 0 3.7% 2 1.3% 1 0.0% 0 2.3% 1 0.0% 0 0.0% 0Easier to find the special
offers online1.9% 10 2.1% 1 0.9% 1 1.3% 1 0.0% 0 3.7% 2 1.6% 2 3.6% 3
For ease / speed / moreconvenient
53.0% 276 45.2% 28 63.0% 42 48.4% 46 46.8% 25 48.5% 30 66.0% 67 47.4% 37
Get better guarantees online 0.6% 3 0.0% 0 0.7% 0 0.0% 0 0.0% 0 2.3% 1 1.1% 1 0.0% 0Lack of access to large food
supermarkets0.0% 0 0.0% 0 0.0% 0 0.0% 0 0.0% 0 0.0% 0 0.0% 0 0.0% 0
Lack of access to non-foodshops
0.1% 0 0.0% 0 0.0% 0 0.0% 0 0.7% 0 0.0% 0 0.0% 0 0.0% 0
Makes it easier to keep to abudget
0.3% 1 0.0% 0 0.0% 0 0.0% 0 0.0% 0 2.3% 1 0.0% 0 0.0% 0
No car available / don't drive 0.3% 2 0.0% 0 0.0% 0 0.0% 0 3.3% 2 0.0% 0 0.0% 0 0.0% 0Saves time 7.1% 37 7.6% 5 8.7% 6 3.7% 4 14.9% 8 2.3% 1 9.6% 10 4.8% 4Other 0.0% 0 0.0% 0 0.0% 0 0.0% 0 0.0% 0 0.0% 0 0.0% 0 0.0% 0A reliable way to shop 0.2% 1 0.0% 0 0.0% 0 0.0% 0 0.0% 0 0.0% 0 0.8% 1 0.0% 0Can buy items not available
in shops0.7% 4 0.0% 0 3.1% 2 1.3% 1 1.0% 1 0.0% 0 0.0% 0 0.0% 0
Don't have to leave the house 0.2% 1 0.9% 1 0.0% 0 0.7% 1 0.0% 0 0.0% 0 0.0% 0 0.0% 0Don't have to rely on public
transport0.1% 1 0.0% 0 0.0% 0 0.0% 0 0.0% 0 0.9% 1 0.0% 0 0.0% 0
Easily accessible 0.5% 3 0.0% 0 0.0% 0 0.0% 0 0.0% 0 2.8% 2 0.8% 1 0.0% 0Easy to return goods 0.9% 5 0.0% 0 1.2% 1 0.0% 0 0.7% 0 3.0% 2 0.0% 0 2.2% 2I can see what I'm buying 0.2% 1 0.0% 0 0.0% 0 0.0% 0 0.0% 0 0.0% 0 0.8% 1 0.0% 0More / better discounts and
special offers0.4% 2 2.9% 2 0.0% 0 0.0% 0 0.0% 0 0.7% 0 0.0% 0 0.0% 0
Safer than store shopping 0.1% 1 0.0% 0 0.0% 0 0.0% 0 1.0% 1 0.0% 0 0.0% 0 0.0% 0(Don’t know) 2.3% 12 2.7% 2 0.7% 0 2.0% 2 1.0% 1 5.9% 4 1.5% 2 2.6% 2Weighted base: 521 63 66 96 54 61 102 79Sample: 494 69 73 70 68 77 62 75
GEN Gender of respondent:
Male 35.9% 252 47.2% 43 34.4% 29 37.7% 51 43.3% 32 40.6% 29 30.9% 44 23.1% 24Female 64.1% 450 52.8% 48 65.6% 56 62.3% 83 56.7% 42 59.4% 43 69.1% 99 76.9% 80Weighted base: 702 91 85 134 73 72 143 104Sample: 702 100 100 102 100 100 100 100
AGE How old are you?
18-24 7.8% 55 7.6% 7 9.7% 8 12.5% 17 3.3% 2 7.8% 6 3.6% 5 9.4% 1025-34 13.4% 94 11.4% 10 16.1% 14 21.8% 29 6.5% 5 15.6% 11 10.8% 15 9.4% 1035-44 19.0% 134 8.4% 8 19.0% 16 9.2% 12 31.2% 23 36.4% 26 18.5% 26 20.9% 2245-54 18.1% 127 18.9% 17 13.9% 12 14.2% 19 28.8% 21 17.7% 13 14.7% 21 23.6% 2555-64 18.8% 132 22.8% 21 15.5% 13 17.8% 24 13.7% 10 10.2% 7 23.8% 34 21.8% 2365+ 22.8% 160 31.0% 28 25.8% 22 24.5% 33 16.5% 12 12.3% 9 28.7% 41 14.9% 16(Refused) 0.0% 0 0.0% 0 0.0% 0 0.0% 0 0.0% 0 0.0% 0 0.0% 0 0.0% 0Weighted base: 702 91 85 134 73 72 143 104Sample: 702 100 100 102 100 100 100 100

by Zone North West Leicestershire Retail & Leisure Study Page 55
Weighted: For Lichfields July 2018
Total Zone 1 Zone 2 Zone 3 Zone 4 Zone 5 Zone 6 Zone 7
Column %ges.060718 NEMS market research
PC Postcode Sector
DE11 8 1.3% 9 0.0% 0 0.0% 0 6.8% 9 0.0% 0 0.0% 0 0.0% 0 0.0% 0DE12 6 3.7% 26 0.0% 0 0.0% 0 19.3% 26 0.0% 0 0.0% 0 0.0% 0 0.0% 0DE12 7 9.4% 66 0.0% 0 0.0% 0 0.0% 0 90.4% 66 0.0% 0 0.0% 0 0.0% 0DE12 8 0.1% 1 0.0% 0 0.0% 0 0.0% 0 0.7% 1 0.0% 0 0.0% 0 0.0% 0DE72 2 0.4% 3 2.8% 3 0.0% 0 0.0% 0 0.0% 0 0.0% 0 0.0% 0 0.0% 0DE73 8 1.5% 11 0.0% 0 12.5% 11 0.0% 0 0.0% 0 0.0% 0 0.0% 0 0.0% 0DE74 2 11.6% 81 86.7% 79 3.3% 3 0.0% 0 0.0% 0 0.0% 0 0.0% 0 0.0% 0LE12 5 1.4% 10 10.5% 10 0.0% 0 0.0% 0 0.0% 0 0.0% 0 0.0% 0 0.0% 0LE12 9 1.0% 7 0.0% 0 7.6% 6 0.0% 0 0.0% 0 0.0% 0 0.0% 0 0.7% 1LE65 1 6.3% 44 0.0% 0 6.4% 5 24.1% 32 0.0% 0 9.3% 7 0.0% 0 0.0% 0LE65 2 9.5% 67 0.0% 0 0.0% 0 49.8% 67 0.0% 0 0.0% 0 0.0% 0 0.0% 0LE67 1 3.0% 21 0.0% 0 0.0% 0 0.0% 0 0.0% 0 3.8% 3 12.8% 18 0.0% 0LE67 2 10.4% 73 0.0% 0 0.0% 0 0.0% 0 8.9% 6 22.3% 16 35.4% 50 0.0% 0LE67 3 7.7% 54 0.0% 0 2.7% 2 0.0% 0 0.0% 0 0.8% 1 36.0% 51 0.0% 0LE67 4 10.4% 73 0.0% 0 0.0% 0 0.0% 0 0.0% 0 0.0% 0 15.9% 23 48.1% 50LE67 5 8.9% 62 0.0% 0 10.7% 9 0.0% 0 0.0% 0 0.0% 0 0.0% 0 51.2% 53LE67 6 6.6% 46 0.0% 0 0.0% 0 0.0% 0 0.0% 0 63.8% 46 0.0% 0 0.0% 0LE67 8 6.9% 48 0.0% 0 56.8% 48 0.0% 0 0.0% 0 0.0% 0 0.0% 0 0.0% 0Weighted base: 702 91 85 134 73 72 143 104Sample: 702 100 100 102 100 100 100 100
QUOTA Zone
Zone 1 12.9% 91 100.0% 91 0.0% 0 0.0% 0 0.0% 0 0.0% 0 0.0% 0 0.0% 0Zone 2 12.1% 85 0.0% 0 100.0% 85 0.0% 0 0.0% 0 0.0% 0 0.0% 0 0.0% 0Zone 3 19.1% 134 0.0% 0 0.0% 0 100.0% 134 0.0% 0 0.0% 0 0.0% 0 0.0% 0Zone 4 10.4% 73 0.0% 0 0.0% 0 0.0% 0 100.0% 73 0.0% 0 0.0% 0 0.0% 0Zone 5 10.3% 72 0.0% 0 0.0% 0 0.0% 0 0.0% 0 100.0% 72 0.0% 0 0.0% 0Zone 6 20.3% 143 0.0% 0 0.0% 0 0.0% 0 0.0% 0 0.0% 0 100.0% 143 0.0% 0Zone 7 14.8% 104 0.0% 0 0.0% 0 0.0% 0 0.0% 0 0.0% 0 0.0% 0 100.0% 104Weighted base: 702 91 85 134 73 72 143 104Sample: 702 100 100 102 100 100 100 100

Appendix 6: Potential development sites

Retail and Leisure Capacity Study: Appendix 6: Potential development sites
Coalville town centre
Belvoir Centre car park, Coalville
Evaluation Criteria Comment
Site Size Approx. 1.5 hectares.
Current Use Public long and stay car parks.
Sequential Status Edge of centre site on eastern fringe of town centre.
Availability The site is Council owned, but is currently used as one of the town
centre’s main car parks.
Potential Uses The site has potential to be linked with an expansion of the Belvoir
Centre. Alternatively, potential for large format retail and leisure uses.
Replacement multi-storey car parking could be provided to the rear of
the site.
Scale of Development Large scale - over 5,000 sq.m gross at ground floor level.
Development Constraints Need to re-provide lost car parking spaces.
Access Existing car park access.
Overall Development
Prospects
Good
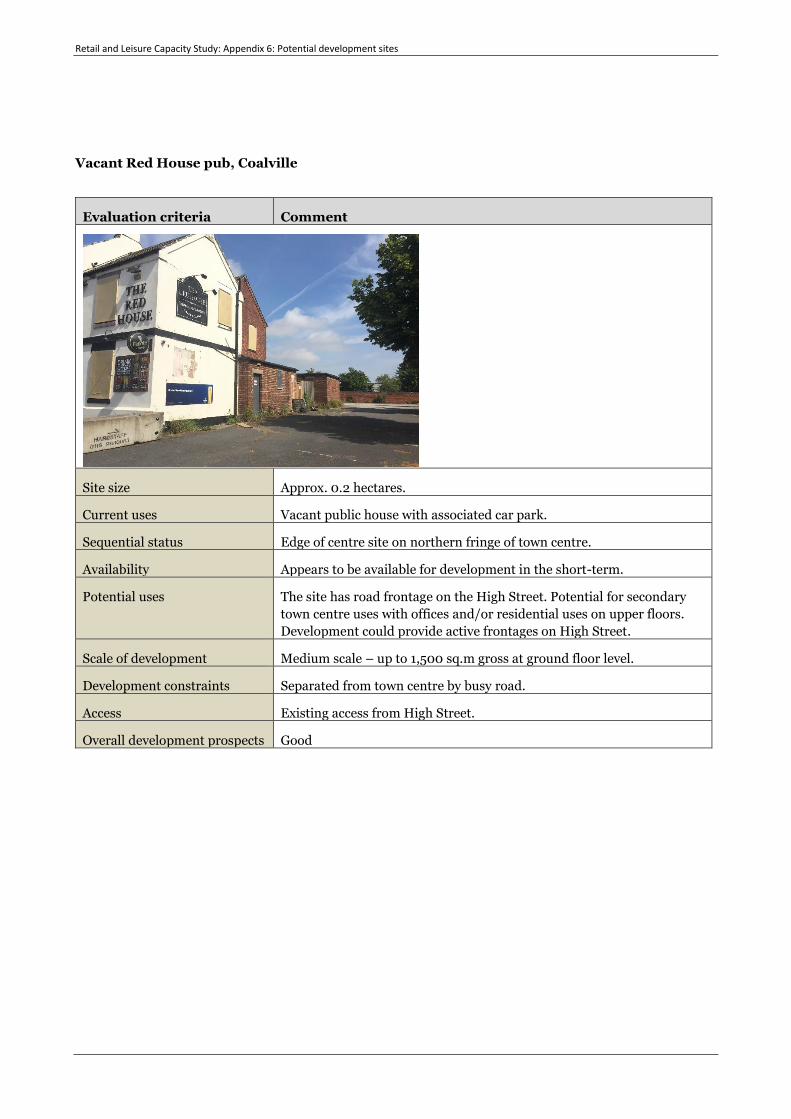
Retail and Leisure Capacity Study: Appendix 6: Potential development sites
Vacant Red House pub, Coalville
Evaluation criteria Comment
Site size Approx. 0.2 hectares.
Current uses Vacant public house with associated car park.
Sequential status Edge of centre site on northern fringe of town centre.
Availability Appears to be available for development in the short-term.
Potential uses The site has road frontage on the High Street. Potential for secondary
town centre uses with offices and/or residential uses on upper floors.
Development could provide active frontages on High Street.
Scale of development Medium scale – up to 1,500 sq.m gross at ground floor level.
Development constraints Separated from town centre by busy road.
Access Existing access from High Street.
Overall development prospects Good

Retail and Leisure Capacity Study: Appendix 6: Potential development sites
Vacant land at Hotel Street/Whitwick Road
Evaluation criteria Comment
Site size Approx. 0.3 hectares.
Current uses Vacant cleared land.
Sequential status Edge of centre site on eastern fringe of town centre.
Availability Appears to be available for development in the short-term.
Potential uses The site has road frontage on the Hotel Street. Potential for secondary
town centre uses with offices and/or residential uses on upper floors.
Development could provide active frontages on Hotel Street.
Scale of development Medium scale – up to 2,000 sq.m gross at ground floor level.
Development constraints Separated from town centre by busy road.
Access Existing access from Hotel Street.
Overall development prospects Good

Retail and Leisure Capacity Study: Appendix 6: Potential development sites
Royal Mail and commercial premises, Ashby Road, Coalville
Evaluation Criteria Comment
Site size Approx. 0.2 hectares.
Current uses Occupied by Royal Mail Vacant land car park.
Sequential status Edge of centre site on north west fringe of town centre.
Availability Currently occupied and availability for development uncertain. Long-
term opportunity.
Potential uses The site has road frontage on Ashby Road. Potential for secondary town
centre uses with offices and/or residential uses on upper floors.
Development could provide active frontages on Ashby Road.
Scale of development Small scale – up to 1,000 sq.m gross at ground floor level.
Development constraints Separated from town centre by busy road.
Access Existing access from Ashby Road.
Overall development prospects Reasonable

Retail and Leisure Capacity Study: Appendix 6: Potential development sites
James Street car park, Coalville
Evaluation Criteria Comment
Site size Approx. 0.2 hectares.
Current uses Public long and stay car parks.
Sequential status Edge of centre site on southern fringe of town centre.
Availability The site is Council owned, but is currently a well-used car park.
Potential uses The site has road frontage on the Belvoir Road and James Street.
Potential for secondary town centre uses with offices and/or residential
uses on upper floors.
Scale of development Small scale – up to 1,000 sq.m gross at ground floor level.
Development constraints Replacement off site car parking may be required.
Access Existing access from James Street.
Overall development prospects Reasonable.
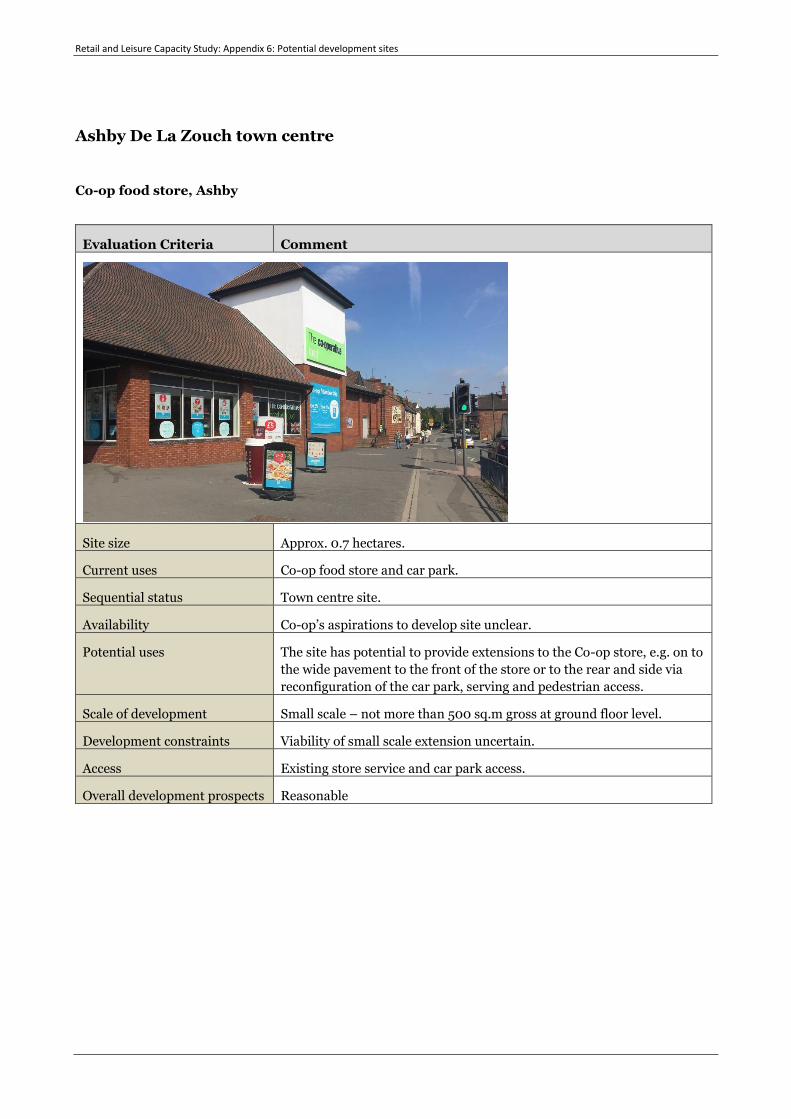
Retail and Leisure Capacity Study: Appendix 6: Potential development sites
Ashby De La Zouch town centre
Co-op food store, Ashby
Evaluation Criteria Comment
Site size Approx. 0.7 hectares.
Current uses Co-op food store and car park.
Sequential status Town centre site.
Availability Co-op’s aspirations to develop site unclear.
Potential uses The site has potential to provide extensions to the Co-op store, e.g. on to
the wide pavement to the front of the store or to the rear and side via
reconfiguration of the car park, serving and pedestrian access.
Scale of development Small scale – not more than 500 sq.m gross at ground floor level.
Development constraints Viability of small scale extension uncertain.
Access Existing store service and car park access.
Overall development prospects Reasonable

Retail and Leisure Capacity Study: Appendix 6: Potential development sites
Hood car park, Ashby
Evaluation Criteria Comment
Site size Approx. 0.3 hectares.
Current uses Public car park (previously health centre – now demolished)
Sequential status Edge of centre site.
Availability The site is Council owned, but is currently used as new town centre car
park.
Potential uses The site has road frontage on the Green / North Street. Potential for
secondary town centre uses with offices and/or residential uses on
upper floors.
Scale of development Medium scale – up to 1,500 sq.m gross at ground floor level.
Development constraints Replacement off site car parking may be required.
Access Existing access from North Street.
Overall development prospects Reasonable.

Retail and Leisure Capacity Study: Appendix 6: Potential development sites
Land rear of Market Street / north of South Street, Ashby
Evaluation Criteria Comment
Site size Approx. 0.3 hectares.
Current uses Public long and stay car parks.
Sequential status Edge of centre site on eastern fringe of town centre.
Availability Potentially multiple ownerships– mostly used for surface car parking.
Potential uses The site has potential to be linked to Market Street to provide new
commercial mews development to provide small units for independent
outlets, perhaps with residential on upper floors.
Scale of development Medium scale – up to 1,500 sq.m gross at ground floor level.
Development constraints Need to re-provide lost car parking spaces. Land assembly
Access Existing car park access from South Street. Pedestrian in access to
Market Street via mews.
Overall development prospects Reasonable – subject to land assembly

Retail and Leisure Capacity Study: Appendix 6: Potential development sites
The Pass’s Courtyard, Ashby
Evaluation criteria Comment
Site size Approx. 0.1 hectares.
Current uses Private car parks and back-land plots.
Sequential status Within town centre.
Availability Potentially multiple ownerships.
Potential uses The site has potential to be linked to Market Street to provide new
commercial mews development to provide small units for independent
outlets, perhaps with residential on upper floors.
Scale of development Small scale – up to 500 sq.m gross at ground floor level.
Development constraints Land assembly
Access Existing access from North Street. Pedestrian in access to Market Street
via existing mews.