Embed Size (px)
Citation preview

Resources,Energy and
TourismChina
Review
June 2012
© Commonwealth of Australia 2012
This work is copyright, the copyright being owned by the Commonwealth of Australia. The Commonwealth of Australia has, however, decided that, consistent with the need for free and open re-use and adaptation, public sector information should be licensed by agencies under the Creative Commons BY standard as the default position. The material in this publication is available for use according to the Creative Commons BY licensing protocol whereby when a work is copied or redistributed, the Commonwealth of Australia (and any other nominated parties) must be credited and the source linked to by the user. It is recommended that users wishing to make copies from BREE publications contact the Chief Economist, Bureau of Resources and Energy Economics (BREE). This is especially important where a publication contains material in respect of which the copyright is held by a party other than the Commonwealth of Australia as the Creative Commons licence may not be acceptable to those copyright owners.The Australian Government acting through BREE has exercised due care and skill in the preparation and compilation of the information and data set out in this publication. Notwithstanding, BREE, its employees and advisers disclaim all liability, including liability for negligence, for any loss, damage, injury, expense or cost incurred by any person as a result of accessing, using or relying upon any of the information or data set out in this publication to the maximum extent permitted by law.ISSN 978-1-922106-07-0 (Print)ISSN 978-1-922106-08-7 (PDF)From 1 July 2011, responsibility for resources and energy data and research was transferred from ABARES to the Bureau of Resources and Energy Economics (BREE).
Resources, Energy and Tourism • China Review • June 2012 1

Postal address:Bureau of Resources and Energy EconomicsGPO Box 1564Canberra ACT 2601 AustraliaPhone: +61 2 6276 1000Email: [email protected]: www.bree.gov.au
Resources, Energy and Tourism • China Review • June 2012 2

AcknowledgementsThis publication was jointly undertaken by the Bureau of Resources and Energy Economics (BREE) and Tourism Research Australia (TRA), the Department of Resources, Energy and Tourism (RET). AuthorsBureau of Resources and Energy Economics (BREE): Quentin Grafton and Jin Liu.Tourism Research Australia (TRA): Robyn Agnew, Geoff Bailey and Grant Keys (RET)By Invitation: Zheng (Annie) Wei and Rui HaoOther contributorsA number of colleagues at BREE and RET have contributed to the preparation and development of the statistical tables in this report and include: Jin Liu, George Stanwix, Yuan Yuan Liu, Seema Mulye and Matt Unicomb.Design and productionTypeyard Design and Advertising Pty LtdCover imagePaul Gunning
Resources, Energy and Tourism • China Review • June 2012 3

ForewordThe past three decades has witnessed the re-emergence of China as one of the world’s largest economies. This change has been dramatic such that by 2010, measured on purchasing power parity, China became the world’s second-largest economy after the United States. China’s GDP in 2011 was 46 times higher than it was in 1980 and accounted for about 14 per cent of global GDP. By comparison, the United States’ GDP in 2011 represented about 19 per cent of world GDP, while Australia’s share was 1.2 per cent.Along with China’s own economic transformation there has been a structural shift in its trading relationship with Australia. China has become Australia’s most important trading partner and is both our largest export destination and the largest source of our imports in value terms. The change in the Australian-China trading relationship is most visible in terms of resources, energy and tourism. The real value of Australian exports of mineral resources to China increased from A$0.2 billion (in $2010-11) in 1989–90 to A$49.9 billion in 2010–11. In volume terms, China accounted for around 69 per cent of Australian total exports of iron ore in 2010–11, compared to around six per cent in 1989–90. Over the period 1989–90 to 2010–11, China’s share of Australian total exports of metallurgical coal increased from one per cent to around 11 per cent, while its share of Australian thermal coal increased from 0.1 per cent to around 12 per cent.From a low base in the mid-1990s, the Chinese tourism market has grown to be Australia’s most important market by value worth A$3.5 billion in export value, and the third largest inbound market by visitor arrivals, with 542 000 arrivals in 2011. By 2020–21, it is projected that Chinese arrivals in Australia could grow to over one million visitors with a total inbound economic value of A$6.9 billion. Given the importance of China to Australia, especially in terms of my portfolio responsibilities, I am very pleased that the Bureau of Resources and Energy Economics (BREE) and Tourism Research Australia (TRA) have collaborated to produce Resources, Energy and Tourism China Review. In this, the inaugural issue, there is a valuable overview of China’s economic re-emergence and
its economic relations with Australia. There are also three review articles. These include: a ‘By Invitation’ article on China’s demographic transition provided by two Chinese scholars; a review of the Chinese gas market; and a review of China’s demand for tourism and prospects for the future. In addition, this issue includes a unique collection of statistical tables, figures, charts and comparisons to illustrate the ‘China story’ and China’s economic relations with Australia and also the rest of the world.
Hon. Martin FergusonMinister for Resources and EnergyMiniter for Tourism
Resources, Energy and Tourism • China Review • June 2012 4

ContentsAcknowledgements 2Foreword 3Acronyms and abbreviations 5Overview 6
China’s economic growth and transition (Quentin Grafton and Jin Liu) 6Reviews 24
By Invitation: China’s demographic transition and economic growth (Zheng (Annie) Wei and Rui Hao) 25China’s demand for natural gas: drivers and prospects (Jin Liu) 30China’s demand for tourism: Opportunities and implications for Australia (Robyn Agnew, Geoff Bailey and Grant Keys) 34
Statistical Tables and Figures 45Part 1: Chinese trends: economic and social indicators 46Part 2: Chinese trends: resources and energy activities 61Part 3: Australian exports to and imports from China 78
Resources, Energy and Tourism • China Review • June 2012 5

Acronyms and abbreviationsABARES Australian Bureau of Agricultural and Resource Economics and ScienceABS Australian Bureau of StatisticsADS scheme Approved Destination Status schemebcm billion cubic metresBREE Bureau of Resources and Energy Economicscm cubic metresFDI foreign direct investmentFYP Five Year PlanGDP gross domestic productGFC global financial crisisGFCF gross fixed capital formationGNP gross national productGTEM global trade and environment modelIEA International Energy AgencyIMF International Monetary Fundkoe kilogram of oil equivalentkWh kilowatt hourLNG liquefied natural gasMt million tonnesNTAF National Tourism Accreditation Framework (also known as T-QUAL Accreditation)ODI outward direct investmentPPP purchasing-power parityRET Department of Resources, Energy and TourismTFC Tourism Forecasting CommitteeTIEV total inbound economic valueT-QUAL tourism quality assuredTRA Tourism Research AustraliaUNCTAD United Nations Conference on Trade and Development
Resources, Energy and Tourism • China Review • June 2012 6

Overview: China’s economic growth and transitionQuentin Grafton and Jin Liu*
IntroductionChina’s rapid economic growth in the late 20th and early 21st centuries is one of the world’s most remarkable stories of economic development. Today, China is the world’s second largest economy, its largest exporter and manufacturer. Over the past three decades, growth in gross domestic product (GDP) averaged over 9 per cent a year, and over 500 million people were lifted out of poverty (World Bank 2012). As a result, in 2011 China produced 14 per cent of global GDP (measured by purchase power parity), a sevenfold increase from 2 per cent of global GDP in 1980. Over the decade 2001–10, China’s economy was a key engine of growth for the world economy—for example, during the global financial crisis in 2009 China provided almost all of the positive contribution to the world’s real GDP growth (see Figure 1). Figure 1: China’s contributions to world real GDP growth, 2001–10
Source: IMF database 2012; BREE.Note: ‘Advanced economies’ comprises 34 countries: Australia, Austria, Belgium, Canada, Cyprus, Czech Republic, Denmark, Estonia, Finland, France, Germany, Greece, Hong Kong SAR, Iceland, Ireland, Israel, Italy, Japan, Korea, Luxembourg, Malta, Netherlands, New Zealand, Norway, Portugal, Singapore, Slovak Republic, Slovenia, Spain, Sweden, Switzerland, Taiwan Province of China, United Kingdom, and United States. ‘Emerging and developing economies’ comprises 149 countries, excluding China.
*: The views expressed in this review are those of the authors alone and are not necessarily those of the Bureau of Resources and Energy Economics (BREE) or the Department of Resources, Energy and Tourism (RET).While China’s growth has been spectacular, its economic development is not fundamentally different to that which has occurred elsewhere in a resurgent Asia, or in Japan, in earlier decades. That is to say, its ‘super growth’ in per capita incomes has been characterised by: (1) very high rates of investment in physical capital coupled with substantial foreign direct investment that draws upon on a large pool of ‘surplus’ labour; (2) large improvements in the quality of human capital; and (3) export-led development through rapid increases in exports as a proportion of GDP. Nevertheless, China is special due to its population, in excess of 1.3
Resources, Energy and Tourism • China Review • June 2012 7

billion in 2010, and because of the size of its economy. In particular, China’s economic integration into world trade over the past two decades has had a profound global impact.
Resources, Energy and Tourism • China Review • June 2012 8

Economic divergence and convergence Until the 19th century China was one of the most economically advanced countries, and Chinese GDP accounted for a third of global GDP in the early 1800s. At that time, its GDP per capita was similar to that of Japan and about half that of Western Europe (see Figure 2). From the first half of the nineteenth century China experienced economic divergence as Western Europe grew while China’s GDP per capita relative to European nations fell (see Figure 2). As a result, in 1950 China’s GDP per capita was only 9 per cent of Western Europe’s and 38 per cent of Japan’s, while its share of global GDP was less than 5 per cent. China’s economic divergence was a result of both foreign interventions and domestic failures. According to Lin (2012), China’s economic retrogression was a result of longstanding competitive deficiencies and very limited technological developments over this period. In part, this was because China had a bureaucratic system that was less favourable to commercial interests and that reduced incentives for innovation. China’s re-emergence in recent decades has reduced its income gap with the West. When Chinese Economic Reform began in 1980, China’s GDP per capita was just 8 per cent of Europe’s, while its share of global GDP was around 5 per cent. By 2010, its GDP per capita was more than 30 per cent of Europe’s and its share of global GDP had more than doubled. Figure 2: Economic divergence and convergence, 1700–2010
Source: Liu & McDonald 2010.Note: Europe refers to Western Europe. GDP measured by 1990 PPP-adjusted international dollars.
Economic transformation and industrialisationIndustrialisation is normally measured by an increased share of industry and manufacturing as a proportion of total economic activity (Weiss 2002). This transformation is, typically, characterised by a shift from agriculture to high-value economic activities, such as manufacturing and services. This process of industrialisation occurred first in Britain in the 18th and 19th centuries, in the United States and Western Europe in the 19th century, in Japan and Korea in the 20th century, and in China in the late 20th and 21st centuries.China’s path of industrialisation since 1950 has been uneven and has been shaped by various economic and social events. During the period 1950 to the late 1970s, China’s economy was
Resources, Energy and Tourism • China Review • June 2012 9

dominated by agriculture and was heavily influenced by the so-called ‘Great Leap Forward’ and ‘Cultural Revolution’. Since the late 1970s, China has experienced ‘Chinese Economic Reform’, with a very rapid economic transformation and growth. The Great Leap Forward in 1958–59 was an economic and social campaign that aimed to use China’s population to transform the country from an agrarian economy into a modern society through rapid industrialisation and collectivisation. After the Great Leap Forward, when GDP fell between 1960 and 1962, China went through economic restructuring over the period 1963–65 designed to promote faster growth in agriculture. The Cultural Revolution was a sociopolitical movement that took place in China from 1966 through 1976. China’s worst ever earthquake, at Tangshan, and a leadership change after Mao’s death, that both occurred in 1976, had a short-term negative impact on China’s economy.Chinese Economic Reform is the program of economic reforms called ‘socialism with Chinese characteristics’ that began in December 1978, and was initiated by Deng Xiaoping. The economic reforms were in two stages. The first stage, in the late 1970s and early 1980s, involved the de-collectivisation of agriculture and the opening up of the country to foreign investment that allowed Chinese entrepreneurs to establish their own businesses. The second stage of the reforms, in the late 1980s and 1990s, involved the privatisation and contracting out of some state-owned industry, the relaxation of price controls, and the lifting of protectionist policies and regulations. Despite these reforms, key economic sectors, such as banking, remained within the state ownership and/or control.Following the Chinese Communist Party’s Third Plenum, held in October 2003, Chinese legislators unveiled several proposed amendments to the state’s constitution. One of the most significant was a proposal to provide protection for private property rights. At the Plenum, Legislators indicated there would be a new emphasis on government economic policy, so as to reduce unemployment, to rebalance income distribution between urban and rural regions, and to maintain economic growth while protecting the environment and improving social equity. The structural transformation in China in the past three decades has involved a shift that has diminished the importance of agriculture in the economy. This can be measured by changes in the share of output in GDP and employment of different sectors of the economy. Figure 3 shows that China’s industrialisation drive dates from its first Five Year Plan (FYP), which began in 1953. Figure 3: Structural transformation, output and employment shares, 1952–2010
(a) Output share
Resources, Energy and Tourism • China Review • June 2012 10

Resources, Energy and Tourism • China Review • June 2012 11

(b) Employment share
Source: China statistical yearbook 2011; CEIC.Note: In China, economic activities are categorised into three strata of industry. Primary industry refers to agriculture; forestry; animal husbandry and fishery; and the services in support of these industries. Secondary industry refers to mining and quarrying; manufacturing; production and supply of electricity, water and gas; and construction. Tertiary industry refers to all economic activities not included in primary or secondary industries.
Changes in China’s economic structure are shown in the primary sector’s decreased GDP share, and the industry and tertiary sectors’ increased share of both GDP and employment. Primary industry’s share of GDP, which includes agriculture, fell from 30 per cent in 1980 to 10 per cent in 2010. In 1980, seven in 10 Chinese worked in primary industry, but by 2010 it had fallen to 3 in 10. By contrast, China’s secondary industry continues to dominate the economy and accounted for about 45 per cent of its GDP, on average, over the past three decades. The output share of the tertiary or service sector has grown rapidly and almost doubled, from around 22 per cent to more than 43 per cent, between 1980 and 2010.Structural transformation has contributed to a massive shift in population from rural to urban areas, and to higher-value-added manufacturing and the service sector. Figure 4 shows the spectacular impact on real GDP per capita.
Resources, Energy and Tourism • China Review • June 2012 12

Figure 4: Real GDP per capita (PPP) by the end of each FYP, 1953–2010
Source: The Conference Board Total Economy Database.Note: PPP refers to purchasing-power-parity.
Resources, Energy and Tourism • China Review • June 2012 13

Box 1: China’s eleven Five Year Plans (FYP), 1953–2010The First FYP (1953–57) set the goal of higher economic growth and emphasised the development of heavy industries (mining, iron manufacturing and steel manufacturing) and technology (for example, machine construction), and followed the Soviet model of economic development.The goal in the Second FYP (1958–62) was to rapidly increase China’s industrial output by ‘mobilising’ the country’s vast rural workforce. This campaign was known as the Great Leap Forward. China began repaying its Soviet-issued loans with agricultural products. During this period the Great Chinese Famine occurred in which millions of people either starved or were malnourished.The Third FYP (1966–70) aimed to deliver ‘basics’, including food and clothing, to the Chinese population and outlined agricultural and economic goals. This FYP coincided with the beginning of the Cultural Revolution (1966–76).The Fourth FYP (1971–75) set the target of 12.5 per cent annual growth in industrial and agricultural gross output, with 130 billion Yuan budgeted for infrastructure development. Implemented during the latter stages of the Cultural Revolution, the Fourth FYP stressed the importance of both industry and agriculture. There was faster economic growth in the period of the fourth FYP than there was in all previous five-year periods.The Fifth FYP (1976–80) was created as part of the Ten Year National Economic Development Plan for 1976–85. It included the institution of the one child policy, which was introduced by Deng Xiaoping in 1979 as a way to control population growth. This policy limits Chinese couples to having only one child. The Fifth FYP began a gradual movement away from a Soviet-style command economy and a gradual introduction of market reforms.The Sixth FYP (1980–85) was created as part of the Ten Year National Economic Development Plan for 1976–85, but was amended in 1980 and 1982. The final version of the Sixth FYP was ratified in December 1982. The institution of the household responsibility system for farming and the rise of quasi-private township and village enterprises coincided with unprecedented economic growth and capital accumulation in China’s rural sector. During this period the central government, for the first time, opened China’s economy to foreign direct investment. Beginning in 1980, special economic zones were created in southern coastal areas where it became legal for foreign companies to invest in export-producing joint ventures using local Chinese labour.The Seventh FYP (1986–90) continued to emphasise innovation and economic expansion. Gross national product (GNP) and fixed asset investment both increased over the period, but the 1989 Tiananmen incident had a negative economic impact as foreign loans to China declined or were suspended, and foreign investment fell.The Eighth FYP (1991–95) marked the beginning of a phase of renewed economic reform under the leadership of Deng Xiaoping. Deng undertook his famous ‘Southern Tour’ in 1992 when he signalled his support for expanding market reforms. The Ninth FYP (1996–2000) was the first plan enacted under a ‘socialist market economy’. This plan, which straddled the 20th and 21st centuries, aimed to quadruple per capita GNP and double gross national product by 2000. The Tenth FYP (2001–05) continued and extended previous FYP objectives, including increasing annual economic growth and income, keeping the unemployment rate at 5 per cent, maintaining price stability, continuing the development of foreign trade and increasing international competitiveness, closing the gap between rich and poor by raising levels of urbanisation, increasing research funding to more than 1.5 per cent of GDP, and expanding science and technological progress.The Eleventh FYP (2006–10) had the same goals as the previous two plans: continue strong economic growth, support urbanisation, improve the quality of life, protect the environment, improve education and access to jobs, and build a better system of medical care and pensions.China’s industrialisation and urbanisation are, in part, a consequence of foreign investment. China’s admission to the World Trade Organisation (WTO) in 2001, in particular, coincided with a large increase in its exports, imports and inward foreign direct investment. For example, Figure 5 shows that foreign direct investment in China increased 30-fold in nominal dollars from US$3 billion in 1990 to US$106 billion in 2010, with an average annual growth rate of around 24 per cent.
Over the period 1990–2010 the total value of Chinese exports in nominal dollars increased 25-fold, from US$62 billion in 1990 to US$1,578 billion in 2010, while total imports increased 26-fold, from US$53 billion in 1990 to US$1,396 billion in 2010. On average, the growth rate for total exports and imports was 18 per cent per annum over the same period. China’s
Resources, Energy and Tourism • China Review • June 2012 14

export-led growth has translated into very large trade and current account surpluses. As a result, its foreign exchange reserves in nominal dollars increased from US$3 billion in 1981 to US$2,847 billion in 2010, with an average annual growth rate of 35 per cent.
Resources, Energy and Tourism • China Review • June 2012 15

Figure 5: China’s foreign direct investment, export and import (nominal dollars), 1990-2010
Source: China statistical yearbook 2011.Note: *Refers to foreign direct investment.
A ‘go global’ policy was unveiled in 1999 and consolidated at the Chinese Communist Party’s Sixteenth Congress in 2002. The objectives of this policy were to encourage outward direct investment (ODI) to support national exports, to push domestic firms to internationalise their activities and to link to overseas markets (Hurst 2011). By 2010, total Chinese ODI flows in nominal dollars were US$68.81 billion and the cumulative flows were US$317.21 billion, a dramatic increase from US$2.7 billion in ODI and US$29.9 billion in stock in 2002 (see Figure 6).
Figure 6: China’s outward FDI flows and stock (nominal dollars), 2002–10
Source: MOFCOM (Ministry of Commerce, China) 2012.
Resources, Energy and Tourism • China Review • June 2012 16

UrbanisationSince the early 1980s the Chinese government has gradually relaxed the ‘hukou’ system, a formerly very strict policy of household registration. This has helped the rural–urban migration of workers, supported rapid growth in the construction and manufacturing sectors and, in some cases, the settlement of rural workers in urbanised areas. Partly due to the changes in these policies the proportion of China’s population living in cities in 2010 was almost 50 per cent and included some 670 million people (see Figure 7). Figure 7: Urbanisation in China, 1978–2010
Source: China statistical yearbook 2011.
Based on United Nations (UN) projections, the rate of urbanisation in China is expected to be 68 per cent by 2040, which is equivalent to the urbanisation rate projected for Japan in 2015. By 2050, the urbanisation rate in China is expected to be 73 per cent, equivalent to the rate of urbanisation projected for Europe in 2015. The UN projects that China’s urban population will reach one billion by 2030. By 2025, China will have 163 cities with one million–plus inhabitants, compared with 63 cities of that size in Europe. This growth will put major pressure on public funding for the provision of social services and increase the need to supply adequate land, energy and water for cities. On the positive side, concentrated urbanisation has the economic advantage of ‘clustering’ the most skilled workers who promote innovation and higher-value-added economic activities.Rapid urbanisation has fuelled construction and transportation in China’ s cities. Most of the Chinese middle class live in cities and with increases in their living standards demand better housing and more and higher-quality consumer durables including refrigerators, colour televisions, air conditioners, computers and cars. Rising incomes have meant that, today, most urban households in China have a refrigerator and a colour television, and a growing number have air conditioners. Car ownership has increased from one car per 100 urban households in 2000, to three cars per 100 households in 2005, to 13 cars per 100 households in 2010 (see Figure 8).
Resources, Energy and Tourism • China Review • June 2012 17

Figure 8: Ownership of major durable consumer goods per 100 urban households
Source: China statistical yearbook 2011.
Urbanisation and higher incomes have both increased the resource intensity of commodities in China’s economy. Figure 9 shows the relationship between per capita consumption of crude steel, aluminium, copper and zinc and real per capita GDP for selected countries, including China. China’s steel consumption increased sharply over recent decades from a low base in 1980. Steel intensity of use (measured by kilogram consumption per person) in China overtook that of the United States in 2009 and is rapidly approaching the per capita intensity of Japan. Rapid increases in per capita resources intensities have also occurred for aluminium, copper and zinc.Figure 9: Commodity consumption per capita and GDP per capita: crude steel, aluminium, copper and zinc, selected countries(a) Crude steel, 1980 to 2010 (b) Aluminium, 1988 to 2010
Resources, Energy and Tourism • China Review • June 2012 18

Source: BREE; Steel statistical yearbook; IMF database 2012.
(c) Copper, 1980 to 2010 (d) Zinc, 1990 to 2010
Source: BREE and IMF database 2012.
Economic catch-upThe ‘catch-up effect’ is the view that per capita incomes in poorer economies tend to grow at a faster rate than those in richer economies. It purports that countries starting out with lower output per capita experience faster growth and the rate of catch-up, in part, is determined by
Resources, Energy and Tourism • China Review • June 2012 19

a country’s ability to absorb ideas and knowledge from the technological frontier (Rodrik 2011). The convergence or catch-up potential of countries is, typically, measured by the income gap that separates poor countries from rich nations. Starting from a low level of income and high incidence of poverty in the early 1980s, China’s catch-up has proceeded at a remarkable pace. Based on measures of purchasing-power parity by the IMF, China’s GDP per capita increased from US$251 (lower than Nepal’s, US$265) in 1980 to US$7,544 (more than two times higher than in India) in 2010, a 30-fold increase over the period. Over the past three decades the Chinese economy has maintained an average annual growth rate of over 9 per cent, equivalent to doubling its size every eight years. As a result, China’s real GDP per capita rose from below 3 per cent of that of the United States in 1980 to 18 per cent in 2010. While China is now the world’s second largest economy, in 2011 it ranked 93 (US$8,382 PPP measure) on the IMF’s GDP per capita rankings of 181 economies.China’s economic catch-up has been very rapid and is comparable to the pace of economic growth of South Korea from the mid to late 1960s, and Japan from the mid 1950s (see Figure 10). In part, the fast speed of China’s economic convergence to richer countries is because it started from a significantly lower per capita level than did many other Asian economies (Liu & McDonald 2010). For instance, in 1955 Japan’s real GDP per capita was around 27 per cent that of the United States, higher than China’s relative level of 18 per cent in 2010. Moreover, as the global frontiers of income and productivity continue to extend over time, the latecomers (such as China) can move more rapidly than their predecessors (Garnaut 2006).
Resources, Energy and Tourism • China Review • June 2012 20

Figure 10: Economic convergence(a) Percentage of US GDP per capita (b) GDP per capita growth after take-off
Source: Liu & McDonald 2010.Note: GDP per capita is in purchasing-power parity (PPP) terms. Growth take-off is assumed to have occurred in 1955 for Japan, 1967 for South Korea, 1973 for Malaysia and Thailand, and 1979 for China.
Key determinants of long-term GDP per capita include workforce participation along with the size and quality of the labour force. Labour force utilisation in the workforce depends on several factors including the number of working-age people in the population, the level of structural unemployment, and hours worked per worker. Labour productivity depends on improvements in labour quality (such as skills and education) and the pace of technical change associated with the capital–output ratio and the quality of capital used by labour.Figure 11 shows that the ratio of China’s labour productivity to that of the US was about 3 per cent in 1960, but increased to 14 per cent in 2010. By comparison, the ratio of India’s labour productivity to that of the US increased from 5 per cent in 1960 to 9 per cent in 2010 while for Venezuela and South Africa the ratio fell over the same period.
Resources, Energy and Tourism • China Review • June 2012 21

Figure 11: Labour productivity relative to the US: selected economies, 1960–2010
Source: The Conference Board Total Economy Database.
As a result of China’s catch-up with developed countries, its economy has moved from the seventh largest in the world in 1990, with a GDP that accounted for 4 per cent of world output, to the world’s second largest economy, contributing about 14 per cent of world GDP by 2010 (see Table 1).Table 1: World economic rankings (purchasing-power parity US$billion)
Ranking1990
Country PPP(US$b)
% World GDP
Ranking2010
Country PPP(US$b)
% World GDP
1 United States 5801 24.7 1 United States 14 527 19.5
2 Japan 2328 9.9 2 China 10 120 13.6
3 Germany 1447 6.2 3 Japan 4 324 5.8
4 France 1031 4.4 4 India 4 058 5.5
5 Italy 973 4.1 5 Germany 2 944 4.0
6 United Kingdom 961 4.1 6 Russia 2 231 3.0
7 China 911 3.9 7 United Kingdom 2 181 2.9
8 Brazil 783 3.3 8 Brazil 2 179 2.9
9 India 745 3.2 9 France 2 135 2.9
10 Mexico 612 2.6 10 Italy 1 779 2.4
Source: IMF database 2012.
Resources, Energy and Tourism • China Review • June 2012 22

Economic differencesChina’s aggregate catch-up, however, masks diverging paths for different parts of China. Three regions with discrete development paths have emerged in the past two or more decades: (1) the ‘leading’ coastal areas, characterised by high income levels and a high growth rate; (2) the ‘catching-up’ central regions, with average income levels, but rapid structural changes from agriculture to industry and services; and (3) the ‘backward’ regions of the west, with a much lower growth rate. China’s ‘dual-track’ approach to economic transition has helped it to achieve enviable stability and growth by achieving ‘reform without losers’ (Lin 2012). China’s transition strategy has included a desire to: (1) maintain state-owned industries and (2) achieve dynamic growth while simultaneously pursuing China’s comparative advantage via a market-based approach to economic development. This so-called dual-track system has been used extensively in its urbanisation polices, the conduct of foreign trade and with various reforms in terms of labour regulation, housing, social security and private ownership. The most significant achievement of China’s dual-track transition has been the rapid development of the ‘new track’, or the non-state sector, which includes rural collective industries, urban corporations, private and individual businesses, and foreign joint-venture companies.Despite rapid growth in China’s economy, there remain large disparities between rural and urban areas. For example, the annual disposable income of urban households was 2.5 times higher than that of rural households in 1980, but more than three times higher in 2010. While rural incomes increased faster than urban incomes from 1980 until the early 2000s, since 2003 rural incomes have lagged behind urban incomes (see Figure 12).Figure 12: Growth in annual disposable income of urban households and net income of rural households, 1980–2010
Source: China statistical yearbook 2011.Note: 1: Net income refers to the total income of rural households from all sources minus all corresponding expenses. It is principally used for reinvestment in production and as consumption expenditure for the year while also providing funds for saving and non-compulsory expenses.
Economic transition During China’s economic transition, trade has provided the impetus for investment and also the transfer of knowledge that has allowed China’s per capita income levels to converge towards the levels in the West. In the early ‘catch-up’ years, China’s comparative advantage was in cheap labour in manufacturing. Over time, however, there has been a gradual shift
Resources, Energy and Tourism • China Review • June 2012 23

from the labour-intensive sectors to capital-intensive or high-value-added industries. China’s future prosperity will increasingly depend on growing its domestic demand. Its household consumption share of GDP was around 50 per cent in 1980, but fell to 34 per cent in 2010. By contrast, the share of gross fixed capital formation of GDP increased from around 29 per cent in 1980 to more than 46 per cent in 2010 (see Figure 13).
Resources, Energy and Tourism • China Review • June 2012 24

Figure 13: Household consumption and gross fixed capital formation: share of GDP, 1978–2010
Source: China statistical yearbook 2011.
As China approaches the global technology frontier and its capital intensity converges to that of the West, its speed of convergence will likely decline. In other words, as the easy catch-up gains diminish, future growth will increasingly depend on total factor productivity growth (Eichengreen et al. 2011). China’s future economic growth will become relatively less resource-intensive and become more reliant on services and private domestic consumption. These trends suggest that China’s economic growth rates will moderate and the growth rate in its resource intensity will decline. During this process of economic and structural adjustment, China’s faces a number of risks that include higher and more volatile levels of inflation and a change in asset prices and income relativities.
China and AustraliaChina’s economic growth and transition have had a major impact on Australia. In particular, China’s spectacular economic growth in the recent past has fuelled the resource commodities boom of which Australia has been a major beneficiary in the form of both higher export prices and volumes. Thus, over the past 20 years the real value of Australian exports of mineral resources to China has increased from A$0.2 billion in 1989–90 to A$49.9 billion in 2010–11, and the value of Australian total merchandised exports to China has increased from A$1.2 billion to A$64.9 billion over the same period (see Figure 14).
Resources, Energy and Tourism • China Review • June 2012 25

Figure 14: Australian exports of mineral resources and merchandised goods to China (A$2010–11), 1989–90 to 2010–11
Sources: BREE; ABS cat. no. 5368.0 and 5302.0.Note: a Not based on balance of payments number; b Chain value calculation. Merchandised goods have sub-categories rural and non-rural. Non-rural has the further sub-categories metal ores and minerals; coal, coke and briquettes; other mineral fuels metals (excl. non-monetary gold); machinery, transport equipment; other manufactures and other non-rural.
Australian export of iron ore to China accounted for around 69 per cent of Australian total iron ore exports in 2010–11 compared to around 6 per cent in 1989–90. Over the period of 1989–90 to 2010–11 the share of Australian export of metallurgical coal to China increased from 1 per cent to around 11 per cent, while the share of Australian exports of thermal coal to China increased from 0.1 per cent to around 12 per cent (see Figure 15). (see Box 2 for a snapshot of Australian commodity exports). Figure 15: Volume share of exports to China as proportion of the Australia’s total exports: metallurgical coal, thermal coal and iron ore, 1989–90 to 2010–11
Sources: BREE; ABS cat. no. 5465.0.
Resources, Energy and Tourism • China Review • June 2012 26

Resources, Energy and Tourism • China Review • June 2012 27

Box 2: Snapshot of Australian commodity exports Australia supplied around a quarter of the world’s iron ore production in 2010 and exported more than 90 per cent of its production. Based on 2011 statistical information provided by the IEA, in 2010 Australian export of
metallurgical coal accounted for 57 per cent of the global total, compared to 18 per cent from the United States, 10 per cent from Canada, 5 per cent from Russia and 4 per cent from Mongolia.
Based on the IEA’s estimates, in 2010 Australian export of thermal coal accounted for 21 per cent of the global total, compared to 23 per cent from Indonesia, 14 per cent from Russia and 10 per cent from South Africa.
Based on the 2011 BP statistical review, in 2010 Australian LNG export accounted for about 9 per cent of the global total, compared to some 26 per cent from Qatar and 8 per cent from Nigeria.
Source: Liu & Grafton 2011.
Strong Chinese demand for resources and energy, due to its re-emergence, has resulted in large volumes of Australian exports, more Australian jobs and investment, higher incomes for working Australians and tax revenue.Direct employment in Australian mining accounted for around 2 per cent of total employment in Australia in 2011, and the number of jobs in the sector has increased by more than 130,000 since 2001. In 2010–11 gross fixed capital formation (GFCF) in the Australian mining sector was worth A$48 billion, or about 4 per cent of Australia’s GDP. The direct value of the mining sector has more than tripled in terms of its importance to the economy from less than 3 per cent in 1980–81 to 9 per cent in 2010–11.Since 2003, strong investment and employment in the mining and construction industries have contributed to strong growth in employment in states with large mining sectors. At the state level, the average annual employment growth rate in mining was 12 per cent in Queensland and 11 per cent in both Western Australia and New South Wales.Higher mineral resource prices, combined with reduced prices in imports (especially imports from low-cost producing countries in Asia), have translated into an improvement in Australia’s terms of trade (the ratio of prices we receive for our exports to the prices we pay for imports). Higher terms of trade, partly attributable to increased prices for resources and energy commodities, increase Australia’s national income and household incomes. The upward trend in the terms of trade has been occurring since 2003, despite a temporary fall associated with the onset of the GFC (see Figure 16), and peaked in 2011. Figure 16: Terms of trade, June 1960–June 2011
Source: ABS cat. no. 5206.0.
The prospect for China’s commodity demand over the medium term depends on the pace and composition of its economic growth and structural adjustment (IMF 2012). The Chinese government, however, has committed to rebalancing demand away from investment and exports and towards consumption.
Resources, Energy and Tourism • China Review • June 2012 28

China’s re-emergence has had important effects on the non-mining parts of the economy as it is both Australia’s largest export destination and the largest source of Australian imports. In particular, Chinese growth has had a major impact on Australia’s tourism industry. As incomes in China rise, consumption patterns will shift towards higher order goods and services (such as consumer durables, culture, tourism, and advanced education). The growth in Chinese tourists visiting Australia has been dramatic such that more Chinese than Americans or Japanese visit Australia (see Figure 17).
Figure 17: International arrivals in Australia, by country, 2000–01 to 2010–11
Source: TRA 2012.
Concluding remarks China was the world’s largest economy until the early years of the eighteenth century. The period from the mid 1800s to 1950, however, was a time of relative economic decline. Starting from a very low base in terms of per capita income China’s has transformed itself over the past 30 years into one of the world’s fast growing economies. China’s re-emergence, especially in the past decade, has had a profound global impact. To support its very rapid growth, China has undertaken massive capital investments, particularly in its infrastructure, and has become the world’s largest exporter. As a result of this transformation, its demand for key resources, such as for iron ore and coal, has supported very large increases in the real prices of bulk resource commodities in which Australia is a major exporter. Higher commodity prices have also encouraged spectacular growth in mining investments in Australia over the past decade. China is expected to continue to grow rapidly in the years to come, but at a lower rate than the average over the past decade. The nature of its future growth will also likely change with lower growth in terms of its resource intensity. This structural transformation already underway in China poses both challenges and opportunities for Australia in the decades ahead.
Resources, Energy and Tourism • China Review • June 2012 29

ReferencesEichengreen, B, Park, D & Shin, K (2011). When fast growing economies slow down: international evidence and implications for the People’s Republic of China, ADB Economics Working Paper Series No. 262, Asian Development Bank.Garnaut, R (2006). The China resources boom, paper presented at the Australian Agricultural and Resource Economics, Sydney, 8-10 February 2006.Hurst, L (2011), Comparative analysis of the determinants of China’s state owned overseas direct investment in OECD and non-OECD countries, China & World Economy, Vol. 19(4), pp. 74-91.IMF (2012). World economic outlook: growth resuming, dangers remain, International Monetary Fund, April 2012.Lin, J (2012). Demystifying the Chinese economy, Cambridge University Press, Cambridge.Liu, J & Grafton, Q (2011). Resources and energy prices: trends, volatility and demand shocks, Resources and Energy Quarterly Review, Bureau of Resources and Energy Economics, September 2011.Liu, J & McDonald, T (2010). China: growth, urbanisation and mineral resource demand, Economic Roundup, issue 2, Department of the Treasury.TRA (2012). Forecast 2012, Tourism Research Australia.Rodrik, D (2011). The future of economic convergence, paper prepared for the 2011 Jackson Hole Symposium of the Federal Reserve Bank of Kansas City.Weiss, J (2002). Industrialization and globalization: theory and evidence from developing countries, Routledge, London.World Bank (2012). Global monitoring report 2012: food prices, nutrition, and the millennium development goals.
Resources, Energy and Tourism • China Review • June 2012 30

China ReviewReviews
Resources, Energy and Tourism • China Review • June 2012 31

By Invitation: China’s demographic transition and economic growth1
Zheng (Annie) Wei, Crawford School of Public Policy, Australian National University, CanberraRui Hao, Institute for Advanced Study (IAS), Shenzhen University, Shenzhen, China2
In the past four decades few countries in the world have experienced more pronounced economic growth than has China. In 2011 the growth rate of China’s GDP per capita was over 9 per cent—even higher than its average growth rate over the past 30 years. The ‘miracle’ of China’s growth has been attributed to various factors, including institutional reforms, rapid accumulation of capital and substantial improvement in total factor productivity (see overview in this issue). However, one fundamental factor that has rarely been investigated is China’s demographic structure. During the past few decades China has experienced significant changes not only in its institutions and economy, but also in the age structure of its population. By applying China’s provincial-level data over the period 1989–2004 to a growth regression that incorporated age structure dynamics, we find that changes in demographic structure have had profound implications for the development of China’s economy.
Theoretical frameworkAccording to the demographic transition model (Notestein 1945), a population usually experiences four stages of demographic transition from high fertility and mortality to low fertility and mortality, eventually becoming an ageing society. When a population enters the third stage of demographic transition, fertility starts to decline. This leads to a considerable decrease in the number of dependants, particularly youth dependants. Given the relatively small number of elderly dependants, the demographic structure of the population is dominated by the working-age population (aged between 15 and 65 years); thus the ratio of total dependants—the sum of youth and elderly dependants—to working-age population declines. This ratio, known as the total dependency ratio, is often used as a proxy for a country’s demographic structure. The so-called ‘demographic window’ opens when the total dependency ratio in a country falls to approximately 40 to 60 per cent (United Nations 2004). During the demographic window, the working-age population provides an ‘ample’ labour supply to an economy. A substantial decline in fertility means more capital is available for productive investment. In smaller families, parents tend to invest more in ‘child quality’—that is, they invest more in their child’s education and health—and, thus, more human capital is accumulated. In short, changes in the demographic structure during the demographic window can boost economic growth by providing an ample labour force, contributing to savings and promoting the accumulation of human capital. The contribution these demographic changes make is often referred to as the ‘demographic dividend’ or ‘demographic gift’ to economic growth (Bloom & Williamson 1998). The concept of the demographic dividend has been assessed in various cross-country cases. For example, Bloom, Canning and Malaney (2000) found that dramatic changes in 1 This report relies heavily on the authors’ paper ‘Demographic structure and economic growth: evidence from
China’, published in the Journal of Comparative Economics 38(4), pp.472–91, 2010. 2 The views expressed in this review are those of the authors alone and not the Department of Resources, Energy
and Tourism (RET). ‘By Invitation’ provides an opportunity for scholars and experts tp present their research findings on issues of relevance to the Bureau of Resources and Energy Economics (BREE) and/or Tourism Research Australia (TRA)
Resources, Energy and Tourism • China Review • June 2012 32

demographic structure contributed to at least a third of the extraordinary economic growth in East Asia during the years 1965–90. Despite having experienced similar demographic transition, Latin America as a whole was unable to achieve a demographic dividend in the 1960s to 1990s because of its unstable socio-political environment, hyperinflation and severe unemployment (Bloom & Canning 2004). In this study, we examine the demographic dividend to China’s provincial-level economic growth over the period 1998–2004.
Resources, Energy and Tourism • China Review • June 2012 33

China’s demographic changes and economic developmentThe Chinese population has experienced dramatic demographic transitions over the past five decades. As shown in Figure 1, birth rates rose as high as 4.34 per cent while mortality declined substantially, except for the three famine years in the 1960s. This was as a result of improvements in preventive health and in environmental sanitation and hygiene. Consequently, China’s total population grew at a rate of 1.95 per cent per annum on average over 1949–70. This relatively high population growth rate began to slow in the early 1970s when the so-called ‘later marriage, longer birth intervals and fewer births’ family planning program was adopted. It declined further once the one-child policy was formally announced and implemented in the 1980s. By 2007 China’s fertility rate had fallen to 1.8 births per woman, from 7.5 births per woman in the 1960s, and was below the replacement rate. Mortality also declined dramatically, from 2 per cent to a level close to that for developed countries, while the annual growth rate of the total population fell to just 0.59 per cent (World Bank 2009).Figure 1: The demographic transition of the Chinese population, 1949–2006
Source: Comprehensive statistical data and materials on 55 years of NewChina (National bureau of statistics of China, 2005), World development indicators (World Bank, 2009).
Figure 2: China’s dependency ratios, 1960–2005
Resources, Energy and Tourism • China Review • June 2012 34

Source: World development indicators (World Bank, 2009).
The dramatic transition of China’s population has changed its demographic structure. As illustrated in Figure 2, the total dependency ratio declined by 38 per cent, from 80 per cent to 41 per cent, over the 30 years from 1965 to 2005. This can be attributed largely to changes in the youth dependency ratio, which fell from 72.5 per cent to 30.2 per cent between 1965 and 2005. By contrast, the elderly dependency ratio remained relatively stable at an average rate of 7.8 per cent. Since 1990 the total dependency ratio has fallen to 49.8 per cent, indicating that China has entered the so-called demographic window, with the opportunity to achieve a demographic dividend to growth.
Figure 3: China’s dependency ratio and economic growth, 1960–2006
Resources, Energy and Tourism • China Review • June 2012 35

Source: World Development Indicators (World Bank, 2009).
The implications of demographic transition for economic growthWe investigated the economic implications of the demographic transition in 1989–2004 in a convergence equation that incorporated the key demographic variable—namely the age structure represented by the total dependency ratio.As shown in the equation below, both the initial level (denoted as lnDi,t-1) and growth rates (gD) of the total dependency ratio were included in order to capture the long-run and short-run effects of changes in demographic structure. Other demographic variables, such as urban population share (lnurbani,t-1), population size (lnpopi,t-1) and population density (lnpopdeni,t-1), were also included.
gy = α1 lnyi,t-1 + α2 lnDi,t-1 + α3 lnurbani,t-1 + α4 lnpopdeni,t-1 + α5 lnpopi,t-1 + α6 gD + β Xi,t-1 + γ geogi + ηi + δt + εit
The following variables were used:gy is provincial growth rates of GDP per capitalnyi,t-1 is the initial level of log GDP per capita for capturing the income convergence effectXi,t-1 represents a set of control variables, including openness, marketisation, government
expenditure and investment ratesgeogi captures geographic proximity to sea-based international trade and pure geographic
topography.Dummies for periods (ηi) and regions (δt) were included to account for unobserved heterogeneities across regions and over time. In addition to ordinary least squares, the instrumental variable (IV) and feasible generalised least squared (FGLS) estimation were applied to account for endogeneity and heterogeneity. Table 1 presents a snapshot of the
Resources, Energy and Tourism • China Review • June 2012 36

results.Even after controlling for other growth determinants and the endogeneity of demographic variables, we found that changes in demographic structure had a significant impact on China’s economic growth. Specifically, a 1 per cent decline in the total dependency ratio leads to a 0.11 per cent increase in the growth rate of GDP per capita. In 1989–2004, China’s provincial-level total dependency ratio fell by 13 per cent on average, which contributed 1.43 per cent to economic growth. Given that provincial GDP per capita grew at an average rate of 8.6 per cent per annum, this indicates that changes in demographic structure contributed about one-sixth of China’s provincial economic growth over the defined period. This finding is similar to the 15 per cent demographic contribution to economic growth reported by Wang and Mason (2008). The impact of changes in demographic structure on China’s economic growth appears to be more important in the long run than in the short run. The urban population share, representing the degree of urbanisation of an economy, was included to account for the impact of economies of scale. In the past few decades, China’s urbanisation has increased by more than 20 per cent as a proportion of the total population, from 25 per cent in 1978. A larger urban population share is a natural consequence of the expanded labour supply that has come from the demographic transition. Increasing urbanisation can help urban industries achieve economies of scale in production, but it may also generate congestion. The ultimate effect of urbanisation depends on the trade-off between economies of scale and congestion effects. We find that the impact of urbanisation on economic growth becomes positive and statistically significant only if we control for cross-sectional heteroskedasticity and time series autocorrelation. In our analysis, population density and size were used to examine the effects of density and scale on economic growth. In 1978–2004, provincial-level population density increased by 43 per cent on average, and the population grew from 31.9 million to 43.1 million. Higher population density may promote economic growth by stimulating technological change, reducing transportation costs, increasing production efficiency and facilitating specialisation, but may hamper it via diminishing returns to limited resources such as land. Likewise, a larger population can help facilitate specialisation and diversification between firms, but may also cause congestion. In our results, both density and scale appear to have a negative effect on economic growth.As noted by Bloom and Williamson (1998), the benefits of the demographic dividend are not automatic, but critically hinge on a compatible economic and policy environment. As shown in Figure 3, China’s economy has grown particularly rapidly since the late 1980s, when additional market reforms were formally launched. Marketisation reforms have largely removed impediments to private sector development and optimised allocation of economic resources. As a result, the flexibility of labour and capital markets has been greatly improved. These changes have helped ‘absorb’ the increased labour supply released during the demographic window and translated accumulated savings into productive investment in the economy.Economic reforms have coincided with the opening of the demographic window, but we contend that reforms may also have helped realise the demographic dividend. We tested this hypothesis by introducing an interaction term between the total dependency ratio and the degree of marketisation. Our results, displayed in Table 1, show that the interaction term is negatively associated with economic growth at the 1 per cent level of significance, while the total dependency ratio itself becomes significantly positive. This implies that marketisation may have played an important role in facilitating the demographic dividend to China’s economic growth. In summary, our study shows that since the 1990s China has experienced a remarkable demographic transition. This has had a profound impact on the Chinese economy and contributed one-sixth of its rapid rate of economic growth. During this period, marketisation appears to have played a pivotal role in the demographic dividend in the economy. In 2010 China’s total dependency ratio fell to 34.2 per cent, and the fertility rate was even lower than the replacement rate. However, China’s ageing and its dependency ratio will begin to rise in three to five years. A future and less beneficial demographic transition demands further and deeper marketisation in both its labour market and the social security system. Such changes will enable China, the world’s most populous country, to prepare to become an ageing
Resources, Energy and Tourism • China Review • June 2012 37

society.
Resources, Energy and Tourism • China Review • June 2012 38

Table 1: Contribution of China’s demographic structure to its economic growth
Average growth rate of GDP per capita in five-year intervals Contribution Impact (+/-)Total dependency ratio, initial level –3.793** NegativePopulation density –0.484** NegativePopulation size –0.082 NegativeInitial GDP per capita –3.394*** NegativeTrade openness 1.389*** Positive
Market reform 2.111** Positive
Note: ***, ** and * denote statistical significance at the 1%, 5% and 10% levels respectively. For other estimations, please see Wei and Hao 2010.
ReferencesBloom, DE & Canning, D (2004). Global demographic change: dimensions and economic significance, NBER Working Paper No. 10817, National Bureau of Economic Research.Bloom, DE, Canning, D, Hu, L, Liu, Y, Mahal, A & Yip, W (2006). Why has China’s economy taken off faster than India’s?, paper presented at the Pan Asia 2006 conference, Stanford Centre for International Development, 3 June 2006.Bloom, DE, Canning, D & Malaney, PN (2000). Population dynamics and economic growth in Asia, Population and Development Review 26, pp. 257–90.Bloom, DE & Williamson, JG (1998), Demographic transitions and economic miracles in emerging Asia, World Bank Economic Review 12(3), pp. 419–56. National Bureau of Statistics of China (2005). Comprehensive statistical data and materials on 55 years of New China, China Statistical Press, Beijing.Notestein, F (1945). Population—the long view, in Theodore W Schultz (ed.), Food for the world, University of Chicago Press, Chicago.Perkins, DH & Rawski, TG (2008). Forecasting China’s economic growth to 2025, in L Brandt & T Rawski (eds), China’s great economic transformation, Cambridge University Press, Cambridge, New York.United Nations Population Division (2004). World Population in 2300, Proceedings of the United Nations expert meeting on world population in 2300, United Nations, New York.Wang, F & Mason, A (2008). The demographic factor in China’s transition, in L Brandt & T Rawski (eds), China’s great economic transformation, Cambridge University Press, Cambridge, New York, pp. 136–66.Wei, Z & Hao, R (2010). Demographic structure and economic growth: evidence from China, Journal of Comparative Economics 38(4), pp. 472–91.World Bank (2009). World development indicators, World Bank,Washington.
Resources, Energy and Tourism • China Review • June 2012 39

China’s demand for natural gas: drivers and prospectsJin Liu3
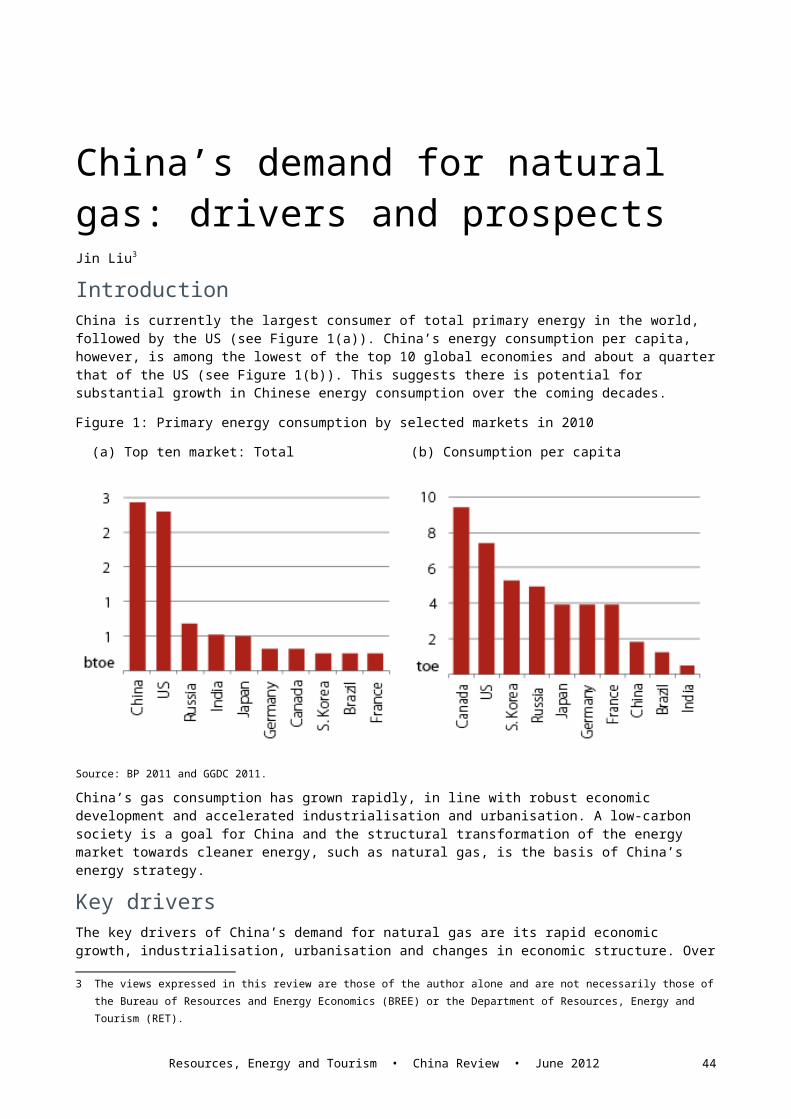
IntroductionChina is currently the largest consumer of total primary energy in the world, followed by the US (see Figure 1(a)). China’s energy consumption per capita, however, is among the lowest of the top 10 global economies and about a quarter that of the US (see Figure 1(b)). This suggests there is potential for substantial growth in Chinese energy consumption over the coming decades.Figure 1: Primary energy consumption by selected markets in 2010 (a) Top ten market: Total (b) Consumption per capita
Source: BP 2011 and GGDC 2011.
China’s gas consumption has grown rapidly, in line with robust economic development and accelerated industrialisation and urbanisation. A low-carbon society is a goal for China and the structural transformation of the energy market towards cleaner energy, such as natural gas, is the basis of China’s energy strategy.
Key driversThe key drivers of China’s demand for natural gas are its rapid economic growth, industrialisation, urbanisation and changes in economic structure. Over the past three decades, China’s path to industrialisation has been characterised by structural transformation. The agricultural sector’s share of gross domestic product (GDP) has decreased from 30 per cent in 1980 to less than 10 per cent in 2010. Since China started to open up its economy in 1979 the average annual growth rate of its urban population has been 3 per cent, meaning that from 1981 to 2011 the proportion of the population living in cities more than doubled, increasing from 20 per cent to around 50 per cent (see Figure 2).
3 The views expressed in this review are those of the author alone and are not necessarily those of the Bureau of Resources and Energy Economics (BREE) or the Department of Resources, Energy and Tourism (RET).
Resources, Energy and Tourism • China Review • June 2012 40

Figure 2: Urbanisation and GDP per capita in China, 1981–2011
Source: World Bank 2011 and IMF 2011.
Gas consumption has increased at an average annual rate of 16 per cent over the past decade. This exceeds the growth in consumption of coal (9 per cent) and oil (7 per cent) over the same period. In volume terms, total Chinese gas consumption increased fourfold, from 27.4 billion cubic metres (bcm) in 2001 to 109 bcm in 2010. Despite this robust growth, China’s per capita gas consumption in 2010 was 27 times less than that of the US and nine times less than that of Japan (see Figure 3).Figure 3: Gas consumption per capita, China and other economies, 1965–2010
Source: BP 2011 and GGDC 2011.
Per capita gas consumption in China is relatively low partly because of an ongoing energy security policy of ‘more coal; less oil and gas’. As a result, oil’s contribution to primary energy
Resources, Energy and Tourism • China Review • June 2012 41

consumption declined by 10 percentage points between 2001 and 2010, from around 28 per cent to 18 per cent. In the same period, coal’s contribution increased from 62 per cent to 70 per cent, while that of gas increased by one percentage point, from 3 per cent to 4 per cent. Gas consumption in China is affected by the size of household incomes and structural changes in the economy that have affected the distribution of gas among end-use sectors. Table 1 shows that end-use consumption of natural gas has changed substantially over the past decade. For instance, the proportion of gas consumed as an industrial fuel declined from 41 per cent to 28 per cent while the proportion for use in chemical production fell from 37 per cent to 22 per cent between 2000 and 2010. By contrast, the proportion of gas consumption for civilian fuel use increased from 18 per cent to 34 per cent and for power generation rose from 4 per cent to 16 per cent over the same period. Table 1: Natural gas in China, share of consumption by end-use sector, 2000 and 2010,
End use 2000 2010Industry fuel 41% 28%Chemical 37% 22%Civilian fuel 18% 34%Power generation 4% 16%
Source: Pan 2011.
While the growth in gas consumption has been very rapid, the growth in gas production has been slower. As a result, imports have become increasingly important in meeting Chinese gas demand, and in 2006 China began importing liquefied natural gas (LNG) from Australia. Between 2006 and 2010, imports of natural gas (both pipeline and LNG) into China increased 16-fold. In 2010, the bulk of the imports were in the form of LNG, with Australia providing about 40 per cent of China’s total gas imports.
Prospects for gas demand Continued strong growth in Chinese natural gas consumption and imports is expected due to: (1) robust economic growth and (2) a policy imperative in the existing Twelfth Five Year Plan to increase the share of energy consumed from clean energy sources, including natural gas. The growth in Chinese demand for natural gas will likely be faster than for other fossil fuels, including coal and oil, because of relatively low carbon emissions from the combustion of gas and the stated objective of the Chinese government to diversity its fuel sources. Another potentially positive factor to growth is the anticipated increase in production of unconventional natural gas, especially shale gas. Rapid advances in gas-fired power generation technologies, the relative price of gas and coal, the removal of gas price subsidies, and investment in fuel infrastructure and distribution networks are also expected to affect future Chinas natural gas consumption and imports.The Chinese government is actively seeking ways to mitigate energy-related carbon emissions and accelerate the transition to a low-carbon economy. Its policies include a range of measures that support renewable energy generation and the introduction of a carbon tax in 2016. These measures are likely to reduce China’s carbon intensity in coming years, while its energy and emissions intensity are already in decline. The carbon intensity of China’s energy supply increased from 2.5 kg CO2 per kilogram of oil equivalent (koe) in 1980 to 3.3 kg CO2 per koe in 2008. Over the same period, its energy intensity declined from 1.2 tonnes of oil equivalent (toe) per US$1000 GDP (in 2005 price, purchasing power parity) to 0.3 toe, and its emissions intensity declined from 2.9 kg CO2 per GDP to 0.9 kg CO2 per GDP. China’s Twelfth Fifth Year Plan, for 2011–15, proposed to increase China’s target gas consumption from 5.3 per cent of total primary energy consumption, the amount in the previous plan, to about 8 per cent by 2015 (IEA 2011a). In 2011, China announced the twin targets of reducing energy intensity by 16 per cent and carbon intensity by 17 per cent during the Twelfth Five Year Plan period. As part of this strategy, China will undertake various measures, including the optimisation of the industrial structure and energy mix, further
Resources, Energy and Tourism • China Review • June 2012 42

conservation of energy and improvements in energy efficiency, and the enhancement of the capacity of carbon sinks to sequester greenhouse gas emissions.To achieve its carbon mitigation goal, China will need to reduce coal’s contribution to electricity generation which increased from 50 per cent in 1980 to 78 per cent in 2010. This suggests that other energy fuels, including uranium and gas, will play an increasing role in power generation. In particular, gas use which currently provides less than 2 per cent of total electricity generation in China compared to the average of over 22 per cent in developed countries (IEA 2011b) should increase dramatically.ABARES (Australian Bureau of Agricultural and Resource Economics and Sciences) global trade and environmental model, GTEM4, can be used to provide projections of the fuel mix for China by 2025. The results of GTEM indicate that the electricity generation generated by coal is expected to fall from 78 per cent to 59 per cent, while the gas share is expected to rise from 1 per cent to 7 per cent over the period 2010 to 2025.Based on the assumption of 8.3 per cent average annual growth in its GDP, the GTEM projection is that China’s total gas consumption will increase to 653 bcm (at a 13 per cent average annual compounded growth rate) while imports will increase to 112 bcm (at a 14 per cent average annual compounded growth rate) over the period 2010–25 (see Table 2). This means that China’s gas consumption and imports are expected to increase sixfold and sevenfold, respectively, over the 15 years between 2010 and 2025. If these projections materialise, there will be opportunities for Australia to substantially increase its exports of LNG to China. Table 2: China’s natural gas consumption and imports, 2010–25
2010(bcm)
2015(bcm)
2020(bcm
2025(bcm
Average annual
compounded growth rate
(%)Consumption 109.0 237.9 457.4 653.4 12.7Imports 16.4 37.7 76.5 112.4 13.7
Source: GTEM and BREE.
ConclusionsChina’s total gas consumption has grown rapidly over the past decade from a low per capita base. Consumption of natural gas has the potential to grow rapidly in China over the medium term supported by continued rapid growth in economic activity and by policy and structural changes that favour fuel sources with lower emissions. Over the near term, China’s domestic gas production will not be able to keep up with projected increases in demand. This is expected to result in rapid growth in Chinese gas imports from both pipelines and LNG.
ReferencesBP (2011). BP Statistical review of world energy, June 2011.GGDC (2011). The Conference Board Total Economy Database (TED), Groningen Growth and Development Centre & The Conference Board.IEA (2011a). World energy outlook 2011, International Energy Agency, November 2011.IEA (2011b). Are we entering a golden age of gas?, special report for the World energy outlook 2011, International Energy Agency, June 2011.IMF (2011), World Economic Outlook Database, International Monetary Fund.Pan, J. (2011), China’s natural gas industry and its market prospect, Research Centre of Oil
4 GTEM is a multiregion, multisector dynamic general equilibrium model of the world economy. GTEM’s projections of commodity demand come from interactions among sectors within an economy as well as bilateral trade flows among various economies in the world. It also captures impacts of climate change policies.
Resources, Energy and Tourism • China Review • June 2012 43
and Gas Resources, Ministry of Land & Resources, PRC, the paper was presented at the inaugural Australia Gas Conference, Sydney.World Bank (2011). World Bank Database.
Resources, Energy and Tourism • China Review • June 2012 44

China’s demand for tourism: Opportunities and implications for AustraliaRobyn Agnew, Geoff Bailey and Grant Keys5
IntroductionTourism is an important industry for Australian social and economic development. While tourism directly contributed around 2.5 per cent (or $35 billion) to Australia’s gross domestic product (GDP) in 2010–11, it had a much higher share of exports, where it accounted for 8 per cent of Australia’s total export earnings and 4.5 per cent of jobs in Australia in 2010–11 (ABS 2011). The Australian tourism industry is starting to see significant growth from Asian markets, particularly China, while at the same time growth has slowed in the traditional markets of the United Kingdom, Europe and the United States.As well as generating important export income for Australia, inbound tourism also enhances intercultural understanding for both Australians and international visitors. In 2010–11 Australia welcomed 5.9 million international visitors with a total inbound economic value (TIEV or tourism exports) of $23.7 billion.
The importance of China In the past ten years, China has become Asia’s largest outbound market. The United Nations World Tourism Organization (UNWTO) forecasts that by 2020, China will be the fourth largest source of outbound travel in the world, with 100 million outbound travellers. UNWTO data shows that between 2001 and 2008, the average growth rate of Chinese outbound departures was over 20 per cent. A combination of effects, including the 2008 Beijing Olympics, the Global Financial Crisis and the 2009 H1N1 pandemic saw this growth slow, and then recover again in 2010.Given the uneven nature of economic growth across China, the major cities and surrounding areas of Beijing, Shanghai and Guangdong are the primary source of outbound tourists, although the potential of the second tier cities is being recognised. Part of Tourism Australia’s China 2020 Strategic Plan is to expand current marketing and distribution in 136 cities to more than 30 cities by 2020.Australia’s inbound Chinese tourism market has grown rapidly in recent years. From a low base in the mid-1990s7, the Chinese market has grown to be Australia’s most important market by value ($3.5 billion in exports), and the third largest inbound market by visitor arrivals, with 542 000 arrivals in 2011.The Tourism Forecasting Committee (TFC) projects that by 2020–21, Chinese arrivals to Australia will grow to over one million, with a TIEV of $6.9 billion (see Table 1 and Appendix 1). At this value, the Chinese market is forecast to represent around one-fifth of total tourism exports in 2020–21, with solid growth in real terms across all purpose categories (Table 1).
5 The views expressed in this review are those of the authors alone and are not necessarily those of Tourism Research Australia (TRA) or the Department of Resources, Energy and Tourism (RET).
6 Tourism Australia’s existing Chinese markets are Beijing, Shanghai, Guangzhou, Hangzhou, Tianjin, Nanjing, Chongqing, Qingdao, Xiamen, Ningbo, Shenzhen, Foshan and Dongguan.
7 There were just 42 600 Chinese visitor arrivals in Australia in 1995. In 2000, Chinese arrivals reached 100 000 for the first time.
Resources, Energy and Tourism • China Review • June 2012 45

Over the period 2010–11 to 2020–21, China is expected to account for 40 per cent of the total growth in tourism exports.
Resources, Energy and Tourism • China Review • June 2012 46

Table 1: China’s importance to Australia’s inbound tourism sector
Purpose of visit
TIEV, 2010–11
($m)
Share of inbound
expenditure, 2010–11
(%)
TIEV, forecast, 2020–21
($m)
Share of inbound
sector, 2020–21
(%)
Forecast average
annual growth
(%)
Forecast contribution to
total sector growth
(%)
(2010–11 to 2020–21)Business 398 13.8 538 15.3 3.1 32Holiday 670 7.8 1632 14.0 9.3 43Visiting friends and relatives
498 10.7 869 14.0 5.7 29
Other (education and employment)
1836 22.7 3820 28.6 7.6 43
All travel 3402 14.1 6860 19.7 7.3 40
Note: the sum of the individual expenditure sub-items (by purpose) may not equal to ‘All travel’, due to rounding
Source: Tourism Forecasting Committee, 2012, Issue 1
Figure 1 illustrates the strong growth in Chinese outbound travel since 1998. For Australia to continue growing its share of Chinese outbound tourism, Australian tourism product must be desirable and relevant to a fast-growing Chinese middle class in an increasingly competitive global tourism marketplace. Figure 1: Chinese outbound trips, all travel and overnight travel, 1999–2011
Source: Tourism Economics.
While the growth of the Chinese outbound tourism market has significant economic value for the Australian tourism industry, Australia will face challenges in capturing these opportunities. As can be seen in Figure 2, while overall Chinese expenditure is high, a significant proportion of this growth is currently being derived from the education market.
Resources, Energy and Tourism • China Review • June 2012 47

Figure 2: Chinese expenditure by main purpose of trip 2000-2011
As the Chinese outbound market matures, more Chinese travellers will seek an independent leisure holiday experience. If Australia can gain a share of this independent travel and also continue to grow Approved Destination Status (ADS) travel, it can increase the proportion of holiday visitors from China. As detailed in Figure 3, Australia accounts for only a small share (1.4 per cent) of the Chinese overnight outbound tourism market8, with global competition to attract Chinese visitors intensifying. Of particular concern is the emergence of new intra-Asia markets, such as Macao and intra-China, as investment in tourism (aviation and accommodation) has been very strong in these regions (see Appendix 2). In 2010, Chinese travellers’ top five outbound destinations were Hong Kong, Macao, Korea, Singapore and Japan. In terms of destinations outside of North East Asia, Chinese travellers chose to visit Singapore, Vietnam, Malaysia, Thailand and Russia. Australia ranked tenth among out-of-region destinations.
8 An alternative measure of Australia’s share of China overnight outbound travel is to exclude ‘intra-regional’ travel—that is, from North-East Asia. Chinese travel to North-East Asia represented 62 per cent of all outbound overnight travel in 2010 (see Appendix 2). Australia’s share excluding this region was 3.5 per cent in 2010.
Resources, Energy and Tourism • China Review • June 2012 48

Figure 3: Australia’s share of Chinese overnight outbound travel
Source: Tourism Economics.
Australia’s geographic location will remain a challenge in an increasingly competitive global environment. European, North American and other Asian nations are all aggressively targeting Chinese tourists, with many of these nations seeing tourism as a means of diversifying their maturing economic base.
Current government policy: Tourism 2020The National Long-Term Tourism Strategy (Strategy), released in December 2009, was premised on maximising the net economic benefits of tourism to Australia, with a focus on supply-side strategies. Tourism 2020 (an update to the strategy) was released on 6 December 2011 to respond to ongoing challenges and emerging opportunities for the Australian tourism industry. Tourism 2020 provides a framework for growth and aims to give industry the tools to compete in the global economy, remain competitive and take advantage of the opportunities offered by the Asian Century. Tourism 2020, which is outlined in Box 1, takes a six-strand approach, where the first strand is a specific focus on growing demand from Asia.
Resources, Energy and Tourism • China Review • June 2012 49

Box 1: Tourism 20201. Grow demand from Asia
While it is necessary to market investment across a balanced portfolio of markets, Australia has a unique opportunity to drive demand from Asia. Industry and government need to deepen consumer understanding, strengthen distribution, tailor marketing campaigns and product appropriately and develop relevant policy frameworks.2. Build competitive digital capability
Strong digital capability is essential both in marketing Australia and in distributing product. Eighty per cent of Australians have online access and 66 per cent of the world is expected be online by 2020. Developing strong and efficient digital marketing and transactional capabilities is essential to remaining competitive. Currently, only a third of Australia’s tourism operators have online booking and payment facilities, which limits their ability to service customers both domestically and overseas. Governments will continue to work with industry to ensure more tourism enterprises are able to take advantage of online opportunities. 3. Encourage investment and implement the regulatory reform agenda
Tourism investment in Australia is lagging. From 2000–01 to 2009–10, investment in tourism grew at only half the pace of investment in the rest of the Australian economy. Tourism currently faces a disproportionate regulatory burden that impacts negatively on investment. Governments will work with industry to reduce barriers to investment so that industry can invest in the products and infrastructure consumers are seeking.4. Ensure tourism transport supports growth
There must be adequate tourism transport capacity and infrastructure for the increasing number of visitors travelling to, from and within Australia. Governments will work in partnership with industry to ensure transport capacity and infrastructure continues to precede demand and facilitate, rather than hinder, tourism traffic.5. Increase supply of labour, skills and Indigenous participation
The tourism industry has a labour shortage of 36 000 and an employee vacancy rate over four times the national average, which is preventing parts of the industry from effectively servicing global customers. By 2015, an additional 56 000 people will be needed to fill vacancies (including 26 000 skilled positions). Governments will work with industry to support industry recruitment, staff retention, labour mobility, education and training to fill these gaps. They will also explore ways to increase the supply of skilled tourism labour and Indigenous participation.6. Build industry resilience, productivity and quality
Industry productivity is low when compared with the rest of the Australian economy and with tourism firms in competitor countries. This is making it difficult for Australian tourism operators to give consumers value for money. Building on Australia’s competitive advantages, governments will work with industry to increase industry productivity, innovation and quality.
As part of Tourism 2020, the Australian, state and territory governments will work in partnership with industry to achieve the 2020 Tourism Industry Potential. Its strategies seek to double annual overnight expenditure from $70 billion in 2009 to $140 billion in 2020. For the Chinese inbound market, the 2020 Tourism Industry Potential indicates that overnight expenditure will need to grow from the current $3.6 billion to between $7.4 billion and $9.0 billion in 2020. China has already delivered very strong growth in expenditure in recent years. As illustrated in Figure 4, growth in Chinese inbound tourism is tracking ahead of the 2020 Tourism Industry Potential.
Resources, Energy and Tourism • China Review • June 2012 50

Figure 4: 2020 Tourism Industry Potential: Chinese inbound travel (total overnight expenditure in nominal terms)
Source: Tourism Australia; BDA Marketing Planning.
Chinese outbound travel to Australia and the Approved Destination Status (ADS) schemeFor well over a decade the Approved Destination Status (ADS) scheme has underpinned China–Australian tourism. ADS is a bilateral tourism arrangement between the Chinese Government and other governments that allows Chinese tourists to undertake leisure travel in groups to destinations around the world. Australia and New Zealand were the first western destinations to be granted this status in 1999. Without the ADS scheme, Tourism Australia could not market Australia in China.Initially, ADS travel was available only to Chinese citizens from Beijing, Shanghai and Guangzhou. In 2004, a further six areas were given access to the scheme by the Chinese Government, and in 2006 the policy was applied to the whole nation.Since 1999, Australia has received over 730 000 ADS tourists in around 53 000 groups, which has underpinned the strong growth in Chinese holiday travel to Australia (see Figure 5). Overall, both ADS and non-ADS leisure arrivals have grown steadily (see Appendix 3). Non-ADS leisure arrivals are generally either for short-term study or to visit friends and relatives.
Resources, Energy and Tourism • China Review • June 2012 51

Figure 5: The relationship between Chinese ADS and holiday travel
Source: Department of Immigration and Citizenship.
In 2008 the Department of Resources, Energy and Tourism commissioned research on whether ADS visitors to Australia were satisfied with their experience. Overall, satisfaction with Australia was significantly higher than satisfaction with the tour itself 79 per cent (and 77 per cent for those only on a group tour) compared to 64 per cent.When this was compared to a similar survey conducted in 2003, it was found that overall satisfaction with the tour had increased 11 percentage points, from 53 per cent to 64 per cent, and that 97 per cent of ADS visitors would recommend Australia as a holiday destination, compared with 73 per cent in 2003. From 2011 TRA has included visitor satisfaction questions for Chinese group travellers in its International Visitor Survey. Another 138 countries have gained approved destination status since Australia and New Zealand received theirs in 1999. The challenge for the Australian tourism industry will be to remain competitive against key tourism markets such as the United States of America and Canada.
Non-ADS leisure travel to AustraliaThe number of inbound Chinese visitors to Australia travelling outside of the ADS scheme has grown considerably (see Appendix 3). While the number of ADS scheme visitors is expected to grow as new parts of China take up this form of group travel, other more experienced travellers are likely to look for new leisure travel experiences and opportunities. This may include the opportunity to travel in a more independent manner.Drivers of Chinese travel choicesTourism Australia recently conducted extensive research on the target customer in China and what drives their travel decisions, which will help the Australian tourism industry increase its competitiveness and market share. Key findings of the research were: Chinese tourists prefer group tours when visiting destinations for the first time. While more experienced travellers will use some element of a group tour, around one in
five will opt for individual travel. When returning to a destination, Chinese tourists prefer to travel independently for some
aspects of the trip, with a Chinese-speaking tour guide. Actions to support growth in the marketChina 2020 Strategic PlanTourism Australia’s China 2020 Strategic Plan, developed in collaboration with industry and
Resources, Energy and Tourism • China Review • June 2012 52

government, identifies a clear direction for enhancing tourism business from China. The five key areas of the plan are: Knowing the customer. During the first year of the plan’s implementation, Tourism
Australia will increase its direct marketing effort in China. Tourism Australia’s target audience in China is affluent couples who have an independent travel mindset and want to explore and experience local culture. This group delivers high volume and spend and is geographically concentrated in Tourism Australia’s current priority cities.
A dedicated geographic strategy. This will identify the focus for Tourism Australia’s resources in order to maximise opportunities for growth in the Chinese market and achieve the 2020 goal.
Quality Australian tourism experiences. This area of the plan will address concerns with current travel experiences and develop new products and services for Chinese visitors.
A healthy aviation environment. Tourism Australia will work with relevant partners to ensure there is sufficient capacity to meet demand from existing and immediate growth markets.
Strong partnerships between government and industry. This will streamline consultation and engagement on whole-of-government issues and approaches to market development.
Tourism 2020 – China strategic projectsKey to growing the independent tourism market in partnership with the Chinese Government will be the development of innovative technologies and the supply of quality tour guides and commission shops. The tourism industry needs to further understand the Asian consumer and provide the relevant and high quality products and services that this market demands. Part of this will be developing cultural awareness, language skills and services to meet Asian expectations, as much of Australia’s tourism industry remains focused on serving its traditional markets.Capitalising on the fast-emerging independent travel segment in Asia will require a shift in current business models and practices. Independent travellers will be affluent and expect high quality, Asia-relevant service. Tourism opportunities continue to arise as trade with Asia grows. There are, for example, major opportunities to increase high-yield Asian education and business tourism following strong growth in these areas in recent years. Over the period 1999–2000 to 2010–11, expenditure from Asian education visitor trips rose by 178 per cent in real terms to $5.4 billion. Asian business visitor trip expenditure has also risen strongly in recent years, up 21 per cent in the two years to 2010–11.
ConclusionsFrom a low base in the mid-1990s, the Chinese inbound market has grown to become Australia’s most important market by value in 2011. The Tourism Forecasting Committee forecasts indicate that its importance for Australian tourism is likely to grow over the next 10 years. This growth cannot be taken for granted, however, as the rest of the world is also looking to China for a share of its global travel.China is not just one tourism market; therefore Australia needs to focus on several targets. New waves of first-time ADS visitors to Australia are likely, as new areas of China increase their participation in the ADS scheme, and Australia must continue to provide the products and services that this market is looking for. There is scope for future work by TRA to understand the regions these tourists are coming from so that the industry is best placed to service their needs.Developing experiences that a more independent Chinese traveller is seeking could reap significant rewards for Australia as well as help to meet meet the expectations that the different demographic groups (based on age, region and income level) demand. While competition for the Chinese tourist globally is increasing, Australia faces an additional, internal challenge—how to encourage regional dispersal of Chinese visitors throughout Australia so that non-traditional destinations can benefit from this growth.
Resources, Energy and Tourism • China Review • June 2012 53

Resources, Energy and Tourism • China Review • June 2012 54

Appendix 1: International visitor arrivals, China
Business VFRa Holida
y Otherd Totale Change
Total nights Exportsbc
‘002 ‘001 ‘000 ‘001 ‘002 (%) (m) ($m)1999–00 31 15 35 16 105 n.a. 3.5 7002000–01 39 18 57 23 143 36.6 3.9 8892001–02 36 19 70 31 172 20.1 5.4 11192002–03 38 19 74 35 177 2.8 7.1 12102003–04 51 24 91 41 217 22.4 8.6 14462004–05 62 28 120 50 274 26.5 11.6 18352005–06 67 34 132 58 292 6.5 12.6 16872006–07 73 40 158 65 338 15.8 15.9 19482007–08 71 46 177 78 375 10.9 16.4 22362008–09 46 52 171 86 358 -4.6 17.8 25652009–10 53 67 165 104 394 10.0 22.6 29592010–11 66 82 226 120 500 26.9 26.0 34022011–12 78 94 280 136 595 18.9 28.9 40232012–13 89 106 322 145 669 12.6 31.4 44992013–14 97 117 359 155 736 9.9 33.9 49212014–15 104 128 389 166 795 8.1 36.3 53042015–16 110 137 408 179 843 6.0 38.6 56042016–17 115 145 425 191 886 5.1 40.9 58782017–18 119 151 439 204 925 4.4 43.0 61222018–19 123 158 452 219 963 4.1 45.1 63692019–20 126 163 465 233 1001 4.0 47.0 66192020–21 130 169 477 249 1039 3.8 48.9 6860Compound annual growth 2000/01– 11.8 13.2 18.1 20.2 15.3 26.3 13.72005/06– -0.3 19.1 11.4 15.7 11.3 15.6 15.12010/11– 10.7 10.8 12.5 8.3 11.0 8.3 10.52015/16– 3.4 4.3 3.2 6.8 4.3 4.8 4.12000/01– 5.6 16.1 14.7 17.9 13.3 20.8 14.42010/11– 7.0 7.5 7.8 7.6 7.6 6.5 7.3
Note: Numbers shaded are forecasts. a Visiting friends and relativesb Tourism exports (or Total inbound economic value), TRA calculationsc in real terms, base = quarter 4, 2011d Other refers to education and employment visitors who stay in Australia for one year or less as well as arrivals for transit and other purposes of visit. On average, education and employment visitors spend more and stay longer than the average tourist.e Sum of purpose does not add to total as the total includes arrivals who did not state a purpose for their visit.Source: Tourism Forecasting Committee
Resources, Energy and Tourism • China Review • June 2012 55

Appendix 2: Chinese outbound travel, 1995, 2000, 2005 and 2010
1995 2000 2005 2010
Share of overnigh
t outbound
travel
Compound
average annual
growth, (‘000) (‘000) (‘000) (‘000) (%) (%)
Asia 4 339 7 541 16 016 27 584 82.8 11.5 South Asia 31 41 124 330 1.0 21.6 Southeast Asia 793 2 338 3 043 6 148 18.5 15.1 Northeast Asia 3 455 5 003 12 469 20 505 61.6 10.5 Hong Kong 2 060 2 707 8 030 11 678 35.1 7.8 Japan 221 352 653 1 413 4.2 16.7 Republic of 178 443 710 2 058 6.2 23.7 Macao (SAR) 548 1 038 2 370 4 012 12.0 11.1 Taiwan 398 413 537 1 128 3.4 16.0 Oceania 60 159 380 601 1.8 9.6 Australia 43 120 285 454 1.4 9.7 New Zealand 9 34 88 123 0.4 7.0Europe 1 155 1 488 2 534 3 613 10.8 7.3 Western Europe 737 943 1 609 2 239 6.7 6.8 France 383 338 554 897 2.7 10.1 Germany 117 215 418 488 1.5 3.1 United 31 41 95 109 0.3 2.8 Emerging Europe 418 545 926 1 374 4.1 8.2Americas 260 371 452 1 099 3.3 19.4 South America 21 30 46 77 0.2 10.8 North America 227 323 388 997 3.0 20.8 United States 167 249 270 802 2.4 24.3 Central America 9 12 7 8 0.0 4.2 Caribbean 3 7 11 17 0.1 8.5Middle East 58 49 112 285 0.9 20.7Africa 67 94 257 723 2.2 23.0Total overnight outbound trips
5 879 9 543 19 371 33 305 100.0 11.4
Australia’s share of Chinese outbound excluding N-E Asia,
1.8 2.6 4.1 3.5 na na
Total Chinese outbound trips (day
na 10 473 31 026 57 386 na 13.1
Source: Tourism EconomicsNa: not available or relevant
Resources, Energy and Tourism • China Review • June 2012 56

Appendix 3: Visa Class 676 grants: Chinese nationals
Year Non-ADS ADSTotal 676 (ADS
and non-ADS) grants
Share of ADS grants
(No.) (No.) No. (%)
1999–00 30 520 7 243 37 763 19.2
2000–01 34 286 25 539 59 825 42.7
2001–02 40 265 31 690 71 955 44.0
2002–03 43 861 29 254 73 115 40.0
2003–04 59 158 33 431 92 589 36.1
2004–05 62 283 46 908 109 191 43.0
2005–06 71 259 57 389 128 648 44.6
2006–07 69 790 84 404 154 194 54.7
2007–08 80 180 97 113 177 293 54.8
2008–09 90 120 85 975 176 095 48.8
2009–10 107 116 80 272 187 388 42.8
2010–11 135 561 110 609 246 170 44.9
Source: Department of Immigration and Citizenship
ReferencesABS (2011). Australian national accounts: tourism satellite account, cat. No. 5249.0, Australian Bureau of Statistics, December 2011.TFC (2012). Forecast 2012, issue 1, Tourism Forecasting Committee, Tourism Research Australia.TRA (2012). Tourism Research Australia, Tourism’s contribution to the Australian economy, 1997–98 to 2010–11, Tourism Research Australia, Canberra.
Resources, Energy and Tourism • China Review • June 2012 57

China ReviewStatistical Tables
and Figures
Resources, Energy and Tourism • China Review • June 2012 58
Statistical Tables and Figures Part 1: Chinese trends: economic and social indicatorsTable 1: Gross domestic product, billion yuan (current price), billion US$ (2000 price), 1978–2010
YearGross
domestic Primary1 Secondary2 Tertiary3Gross
domestic
product industry industry Industry Construction industry product
yuan yuan yuan yuan yuan yuan US$20001978 365 103 175 161 14 87 1581979 406 127 191 177 14 88 1701980 455 137 219 200 20 98 1831981 489 156 226 205 21 108 1921982 532 178 238 216 22 116 2101983 596 198 265 238 27 134 2331984 721 232 311 279 32 179 2681985 902 256 387 345 42 259 3041986 1,028 279 449 397 53 299 3311987 1,206 323 525 459 67 357 3701988 1,504 387 659 578 81 459 4111989 1,699 427 728 648 79 545 4281990 1,867 506 772 686 86 589 4451991 2,178 534 910 809 102 734 4861992 2,692 587 1,170 1,028 142 936 5541993 3,533 696 1,645 1,419 227 1,192 6321994 4,820 957 2,245 1,948 296 1,618 7151995 6,079 1,214 2,868 2,495 373 1,998 7931996 7,118 1,402 3,383 2,945 439 2,333 8721997 7,897 1,444 3,754 3,292 462 2,699 9531998 8,440 1,482 3,900 3,402 499 3,058 1,0281999 8,968 1,477 4,103 3,586 517 3,387 1,1062000 9,921 1,494 4,556 4,003 552 3,871 1,1982001 10,966 1,578 4,951 4,358 593 4,436 1,2982002 12,033 1,654 5,390 4,743 647 4,990 1,4162003 13,582 1,738 6,244 5,495 749 5,600 1,5582004 15,988 2,141 7,390 6,521 869 6,456 1,7152005 18,494 2,242 8,760 7,723 1,037 7,492 1,9092006 21,631 2,404 10,372 9,131 1,241 8,855 2,1512007 26,581 2,863 12,583 11,053 1,530 11,135 2,4572008 31,405 3,370 14,900 13,026 1,874 13,134 2,6932009 34,090 3,523 15,764 13,524 2,240 14,804 2,940
Resources, Energy and Tourism • China Review • June 2012 59

2010 40,120 4,053 18,758 16,087 2,671 17,309 3,246
Source: China statistical yearbook 2011.Note: In China, economic activities are categorised into three industry strata. 1. Primary industry refers to agriculture, forestry, animal husbandry and fishery, and services in support of these industries. 2. Secondary industry refers to mining and quarrying; manufacturing; the production and supply of electricity, water and gas; and construction. 3. Tertiary industry refers to all economic activities not included in primary or secondary industries.
Table 2: Gross domestic product, composition (per cent), 1978–2010
YearPrimaryindustry
Secondary1
industry Industry2 ConstructionTertiaryindustry
1978 28 48 44 4 241979 31 47 44 4 221980 30 48 44 4 221981 32 46 42 4 221982 33 45 41 4 221983 33 44 40 5 221984 32 43 39 4 251985 28 43 38 5 291986 27 44 39 5 291987 27 44 38 6 301988 26 44 38 5 311989 25 43 38 5 321990 27 41 37 5 321991 25 42 37 5 341992 22 43 38 5 351993 20 47 40 6 341994 20 47 40 6 341995 20 47 41 6 331996 20 48 41 6 331997 18 48 42 6 341998 18 46 40 6 361999 16 46 40 6 382000 15 46 40 6 392001 14 45 40 5 402002 14 45 39 5 412003 13 46 40 6 412004 13 46 41 5 402005 12 47 42 6 412006 11 48 42 6 412007 11 47 42 6 422008 11 47 41 6 422009 10 46 40 7 432010 10 47 40 7 43
Resources, Energy and Tourism • China Review • June 2012 60

Source: China statistical yearbook 2011.Note: 1. Secondary Industry = Industry + Construction2. Industry refers to mining and quarrying; manufacturing; the production and supply of electricity, water and gas.
Box 1: GDP and GDP per capita (purchasing power parity) In 2010, measured on purchasing power parity (PPP), which adjusts for price differences, China’s economy became the world’s second-largest after that of the United States. China’s GDP reached US$11,316 billion in 2011, 46 times higher than it was in 1980. In 2011, China’s GDP accounted for 14.4 per cent of world GDP. By comparison, the United States’ GDP represented 19.1 per cent of world GDP, while Australia’s share was only 1.2 per cent.
GDP (US$billion PPP): United States, China, India and Australia
Note: PPP refers to purchasing power parity (US$).
Source: World economic outlook database 2012.
Resources, Energy and Tourism • China Review • June 2012 61

Box 2: Economic Catch UpIn 1980, the ratio of China’s GDP per capita (PPP measured in US dollars) to that of the United States was only 2.1 per cent. China’s income per capita relative to that of the United States has grown much faster, such that in 2011 the ratio of its per capita income to that of the United States was 17.4 per cent, more than double that of India (7.7 per cent).
China’s and India’s GDP per capita as a proportion of US GDP per capita
Source: World economic outlook database 2012.
Resources, Energy and Tourism • China Review • June 2012 62
Table 3: Reference exchange rate of renminbi (RMB1 yuan), 1981–2010Year US$ ¥100 HK$1001981 171 1 301982 189 1 311983 198 1 271984 233 1 301985 294 1 381986 345 2 441987 372 3 481988 372 3 481989 377 3 481990 478 3 611991 532 4 681992 551 4 711993 576 5 741994 862 8 1121995 835 9 1081996 831 8 1081997 829 7 1071998 828 6 1071999 828 7 1072000 828 8 1062001 828 7 1062002 828 7 1062003 828 7 1062004 828 8 1062005 819 7 1052006 797 7 1032007 760 6 972008 695 7 892009 683 7 882010 677 8 87
Source: China statistical yearbook 2011.Note: 1. RMB is the official currency. The primary unit of RMB is the yuan.
Resources, Energy and Tourism • China Review • June 2012 63

Table 4: Fixed-base price indices (index for 1990=100), 1990–2010Year Consumer price
IndexUrban household Rural household Retail price
index1990 100 100 100 1001991 103 105 102 1031992 110 114 107 1081993 126 133 122 1231994 157 166 150 1491995 183 194 176 1711996 199 211 190 1821997 204 217 195 1831998 203 216 193 1791999 200 213 190 1732000 201 215 190 1712001 202 216 192 1692002 200 214 191 1672003 203 216 194 1672004 211 223 203 1722005 214 227 208 1732006 218 230 211 1752007 228 240 222 1812008 242 254 237 1922009 240 252 236 1902010 248 260 244 196
Source: China statistical yearbook 2011.
Resources, Energy and Tourism • China Review • June 2012 64

Table 5: Imports and exports, total value (current US$billion), 1978–2010
Year Imports and exports
Total exports Total imports Balance
1978 21 10 11 -11980 38 18 20 -21985 70 27 42 -151990 115 62 53 91991 136 72 64 81992 166 85 81 41993 196 92 104 -121994 237 121 116 51995 281 149 132 171996 290 151 139 121997 325 183 142 401998 324 184 140 431999 361 195 166 292000 474 249 225 242001 510 266 244 232002 621 326 295 302003 851 438 413 252004 1,155 593 561 322005 1,422 762 660 1022006 1,760 969 791 1782007 2,177 1,220 956 2642008 2,563 1,431 1,133 2982009 2,208 1,202 1,006 1962010 2,974 1,578 1,396 182
Source: China statistical yearbook 2011.Note: A negative balance indicates a trade deficit (i.e. imports surpassing exports).
Resources, Energy and Tourism • China Review • June 2012 65

Table 6: Investment funds, sources (current yuan billion), 1981–2010
Year State1 budgetDomestic2
loansForeign3
investment
Self-raised4,5
funds and others Total
1981 27 12 4 53 961982 28 18 6 71 1231983 34 18 7 85 1431984 42 26 7 108 1831985 41 51 9 153 2541986 46 66 14 187 3121987 50 87 18 224 3791988 43 98 28 297 4651989 37 76 29 299 4411990 39 89 28 295 4521991 38 131 32 358 5591992 35 221 47 505 8081993 48 307 95 856 1,3071994 53 400 177 1,153 1,7831995 62 420 230 1,341 2,0521996 63 458 275 1,547 2,3421997 70 478 268 1,710 2,5261998 120 554 262 1,936 2,8721999 185 573 201 2,017 2,9752000 211 673 170 2,258 3,3112001 255 724 173 2,647 3,7992002 316 886 208 3,094 4,5052003 269 1,204 260 4,128 5,8622004 325 1,379 329 5,424 7,4562005 415 1,632 398 7,014 9,4592006 467 1,959 433 9,036 11,8962007 586 2,304 513 11,677 15,0802008 795 2,644 531 14,320 18,2922009 1,269 3,930 462 19,362 25,0232010 1,468 4,726 499 24,404 31,096
Source: China statistical yearbook 2011.Note: 1. Funds from the state budget consist of budgetary appropriation and loans. 2. ‘Domestic loans’ refers to loans of various forms from banks and non-bank financial institutions during the reference period for the purpose of investment in fixed assets.3. ‘Foreign investment’ refers to overseas funds received during the reference period for the construction and purchase of investment in fixed assets (covering equipment, materials and technology). 4. ‘Self-raised funds’ refers to extra-budgetary funds for investment in fixed assets received during the reference period by investing units from central government ministries, local governments, enterprises and institutions. 5. ‘Others’ refers to funds for investment in fixed assets received from sources other than those listed above, including capital raised by enterprises or financial institutions, funds raised from individuals and through donations, and funds
Resources, Energy and Tourism • China Review • June 2012 66

transferred from other units.
Table 7: Investments, composition of funds (per cent), 1981–2010
YearState
budget Domestic loans Foreign investmentSelf-raised funds and
others1981 28 13 4 551982 23 14 5 581983 24 12 5 591984 23 14 4 591985 16 20 4 601986 15 21 4 601987 13 23 5 591988 9 21 6 641989 8 17 7 681990 9 20 6 651991 7 24 6 641992 4 27 6 631993 4 24 7 661994 3 22 10 651995 3 21 11 651996 3 20 12 661997 3 19 11 681998 4 19 9 671999 6 19 7 682000 6 20 5 682001 7 19 5 702002 7 20 5 692003 5 21 4 712004 4 19 4 732005 4 17 4 742006 4 16 4 762007 4 15 3 772008 4 14 3 782009 5 16 2 772010 5 15 2 78
Source: China statistical yearbook 2011.
Resources, Energy and Tourism • China Review • June 2012 67

Table 8: Foreign capital investment utilised1 (current US$billion), 1979–2010
Year Total Foreign loans
Direct foreign investments
Other foreign investments2
1979–1984
18 13 4 1
1985 5 3 2 01986 8 5 2 01987 8 6 2 01988 10 6 3 11989 10 6 3 01990 10 7 3 01991 12 7 4 01992 19 8 11 01993 39 11 28 01994 43 9 34 01995 48 10 38 01996 55 13 42 01997 64 12 45 71998 59 11 45 21999 53 10 40 22000 59 10 41 92001 50 0 47 32002 55 0 53 22003 56 0 54 32004 64 0 61 32005 64 0 60 32006 67 0 63 42007 78 0 75 42008 95 0 92 32009 92 0 90 22010 109 0 106 3
Source: China statistical yearbook 2011.Notes:1. Utilisation of foreign capital refers to remittance, equipment and technology financed from abroad by loans, foreign direct investment and other measures undertaken by Chinese governments at all levels, by various departments, enterprises and other economic units.2. ‘Other foreign investments’ refers to all forms of foreign capital other than foreign borrowings and foreign direct investment. It includes the total value of shares in foreign currencies issued by enterprises at domestic or foreign stock exchanges; rent payable for equipment through international leasing arrangements; and the cost of imported equipment, technology and materials provided by foreign counterparts in compensation trade and in processing and assembly trade.
Resources, Energy and Tourism • China Review • June 2012 68

Table 9: Employment, total and composition by industry, 1978–2010
Year Total Employed Persons (‘0000)
Primary industry (%)
Secondary industry (%)
Tertiary industry (%)
1978 40,152 71 17 121979 41,024 70 18 131980 42,361 69 18 131981 43,725 68 18 141982 45,295 68 18 141983 46,436 67 19 141984 48,197 64 20 161985 49,873 62 21 171986 51,282 61 22 171987 52,783 60 22 181988 54,334 59 22 181989 55,329 60 22 181990 64,749 60 21 191991 65,491 60 21 191992 66,152 59 22 201993 66,808 56 22 211994 67,455 54 23 231995 68,065 52 23 251996 68,950 51 24 261997 69,820 50 24 261998 70,637 50 24 271999 71,394 50 23 272000 72,085 50 23 282001 72,797 50 22 282002 73,280 50 21 292003 73,736 49 22 292004 74,264 47 23 312005 74,647 45 24 312006 74,978 43 25 322007 75,321 41 27 322008 75,564 40 27 332009 75,828 38 28 342010 76,105 37 29 35
Source: China statistical yearbook 2011.
Resources, Energy and Tourism • China Review • June 2012 69

Table 10: Population, total and age composition (per cent), 1982–2010
Year
Total populatio
n (year-end)
(‘0000)
Population aged 0–
14 (‘0000)
Proportion (%)
Population aged 15–64
(‘0000)Proportio
n (%)
Population aged 65
and over (‘0000)
Proportion (%)
1982 101,654 34,146 34 62,517 62 4,991 51987 109,300 31,347 29 71,985 66 5,968 51990 114,333 31,659 28 76,306 67 6,368 61995 121,121 32,218 27 81,393 67 7,510 61996 122,389 32,311 26 82,245 67 7,833 61997 123,626 32,093 26 83,448 68 8,085 71998 124,761 32,064 26 84,338 68 8,359 71999 125,786 31,950 25 85,157 68 8,679 72000 126,743 29,012 23 88,910 70 8,821 72001 127,627 28,716 23 89,849 70 9,062 72002 128,453 28,774 22 90,302 70 9,377 72003 129,227 28,559 22 90,976 70 9,692 82004 129,988 27,947 22 92,184 71 9,857 82005 130,756 26,504 20 94,197 72 10,055 82006 131,448 25,961 20 95,068 72 10,419 82007 132,129 25,660 19 95,833 73 10,636 82008 132,802 25,166 19 96,680 73 10,956 82009 133,450 24,659 19 97,484 73 11,307 92010 134,091 22,259 17 99,938 75 11,894 9
Source: China statistical yearbook 2011.
Resources, Energy and Tourism • China Review • June 2012 70

Table 11: Population, dependency ratio, 1982–2010
Year Gross1 dependency ratio (%)
Children (0–14)2
dependency ratio (%)Old (65 and over)3
dependency ratio (%)1982 63 55 81987 52 44 81990 50 41 81995 49 40 91996 49 39 101997 48 38 101998 48 38 101999 48 38 102000 43 33 102001 42 32 102002 42 32 102003 42 31 112004 41 30 112005 39 28 112006 38 27 112007 38 27 112008 37 26 112009 37 25 122010 34 22 12
Source: China statistical yearbook 2011.Notes:1. ‘Gross dependency ratio’ refers to the ratio of the non–working age population (aged 0–14 and 65+) to the working-age population (aged 15–64), expressed as a percentage. 2. ‘Children dependency ratio’ refers to the ratio of the child population to the working-age population, expressed as a percentage. ‘3. Old dependency ratio’ refers to the ratio of the elderly population to the working-age population, expressed as a percentage.
Resources, Energy and Tourism • China Review • June 2012 71

Table 12: Per capita annual income, urban and rural households (current yuan), 1978–2010
Year
Annual disposable
income of urban households
(yuan)Inde
x
Annual net income1 of
rural households
(yuan) Index
Engel’s2
coefficient of urban
households (%)
Engel’s coefficient of
rural households
(%)1978 343 100 134 100 58 681980 478 127 191 139 57 621985 739 160 398 269 53 581990 1,510 198 686 311 54 591991 1,701 212 709 317 54 581992 2,027 233 784 336 53 581993 2,577 255 922 347 50 581994 3,496 277 1,221 364 50 591995 4,283 290 1,578 384 50 591996 4,839 302 1,926 418 49 561997 5,160 312 2,090 437 47 551998 5,425 330 2,162 456 45 531999 5,854 361 2,210 474 42 532000 6,280 384 2,253 483 39 492001 6,860 416 2,366 504 38 482002 7,703 472 2,476 528 38 462003 8,472 515 2,622 551 37 462004 9,422 554 2,936 588 38 472005 10,493 607 3,255 625 37 462006 11,760 671 3,587 671 36 432007 13,786 753 4,140 734 36 432008 15,781 816 4,761 793 38 442009 17,175 895 5,153 861 37 412010 19,109 965 5,919 954 36 41
Source: China statistical yearbook 2011.Notes:1. Net income refers to the total income of rural households from all sources minus all corresponding expenses. It is mainly used as input for reinvestment in production and as consumption expenditure for the year, and also for savings and non-compulsory expenses of various forms.2. Engel’s coefficient refers to the percentage of household expenditures on food as a proportion of total living expenses.
Resources, Energy and Tourism • China Review • June 2012 72

Box 3: China’s urbanisationWhen economic reform began in China in 1978, about 18 per cent of the Chinese population was living in urban areas. The rapid rate of economic growth in China over recent decades has encouraged the movement of labour from rural areas to urban areas. The proportion of China’s population living in cities was almost 50 per cent, or 670 million people, in 2010.
Percentage of the Chinese population living in urban areas
Source: China statistical yearbook 2011.The UN’s projection is that the urbanisation rate in China will be 68 per cent by 2040, which is equivalent to the projected urbanisation rate for Japan in 2015. By 2050, the urbanisation rate in China is expected to be 73 per cent: equivalent to the projected urbanisation rate for Europe in 2015.
UN’s projections for urbanisation rate (per cent), 2015–50, selected countries and regions
China India Japan US Europe
2015 51 32 68 84 742020 55 34 69 85 752025 59 37 71 86 772030 62 40 73 87 782035 65 43 75 88 802040 68 47 77 89 822045 71 51 78 90 832050 73 54 80 90 84
Source: World urbanisation prospects, UN.
Resources, Energy and Tourism • China Review • June 2012 73

Part 2: Chinese trends: resources and energy activitiesTable 13: Energy, total production and its composition, 1978–2010
Year
Total energy production
(million tons of SCE)1 Coal (%)
Crude oil (%)
Natural gas (%)
Hydropower, nuclear power, wind power
(%)1978 628 70 24 3 31980 637 69 24 3 41985 855 73 21 2 41990 1,039 74 19 2 51991 1,048 74 19 2 51992 1,073 74 19 2 51993 1,111 74 19 2 51994 1,187 75 18 2 61995 1,290 75 17 2 61996 1,330 75 17 2 61997 1,335 74 17 2 71998 1,298 73 18 2 71999 1,319 74 17 3 62000 1,350 73 17 3 72001 1,439 73 16 3 82002 1,507 74 16 3 82003 1,719 76 14 3 72004 1,966 77 13 3 72005 2,162 78 12 3 72006 2,322 78 11 3 82007 2,473 78 11 4 82008 2,606 77 11 4 92009 2,746 77 10 4 92010 2,969 77 10 4 9
Source: China statistical yearbook 2011.Notes:1. The coefficient for converting electric power into SCE (standard coal equivalent) is calculated on the basis of average coal consumption in generating electric power.
Resources, Energy and Tourism • China Review • June 2012 74

Table 14: Energy, total consumption and its composition, 1978–2010
Year
Total energy consumption
(million tons of SCE)1 Coal (%)
Crude oil (%)
Natural gas (%)
Hydropower, nuclear power, wind power
(%)1978 571 71 23 3 31980 603 72 21 3 41985 767 76 17 2 51990 987 76 17 2 51991 1,038 76 17 2 51992 1,092 76 18 2 51993 1,160 75 18 2 51994 1,227 75 17 2 61995 1,312 75 18 2 61996 1,352 74 19 2 61997 1,359 71 20 2 61998 1,362 71 21 2 71999 1,406 71 22 2 62000 1,455 69 22 2 62001 1,504 68 22 2 82002 1,594 68 22 2 72003 1,838 70 21 3 72004 2,135 70 21 3 72005 2,360 71 20 3 72006 2,587 71 19 3 72007 2,805 71 19 3 72008 2,914 70 18 4 82009 3,066 70 18 4 82010 3,249 68 19 4 9
Source: China statistical yearbook 2011.Notes:1. The coefficient for converting electric power into SCE (standard coal equivalent) is calculated on the basis of average coal consumption in generating electric power.
Resources, Energy and Tourism • China Review • June 2012 75

Table 15: Energy production and consumption per capita1, 1980–2010
Year Production ConsumptionTotal
energy (kgce)
Raw coal (kg)
Crude oil (kg)
Electricity (kWh)
Total energy (kgce)
Coal (kg)
Oil (kg)
Electricity (kWh)
1980 650 632 108 306 614 622 89 3061981 636 625 102 311 598 610 94 3111982 662 661 101 325 615 636 81 3251983 696 698 104 343 645 671 82 3441984 751 761 111 364 684 723 83 3641985 814 830 119 391 730 776 87 3921986 826 838 123 421 758 806 91 4221987 842 856 124 459 799 856 95 4601988 870 889 124 495 844 902 101 4961989 909 942 123 523 867 925 104 5241990 915 951 122 547 869 930 101 5491991 911 945 123 589 902 960 108 5911992 921 958 122 647 937 979 115 6511993 942 976 123 711 984 1,026 125 7151994 996 1,040 123 779 1,030 1,078 125 7771995 1,071 1,129 125 836 1,089 1,143 133 8321996 1,093 1,147 129 887 1,110 1,150 145 8841997 1,085 1,128 131 923 1,105 1,120 157 9171998 1,045 1,073 130 939 1,097 1,087 160 9341999 1,053 1,089 128 989 1,122 1,112 168 9822000 1,070 1,096 129 1,074 1,153 1,117 178 1,0672001 1,131 1,157 129 1,164 1,183 1,136 180 1,1582002 1,177 1,211 130 1,292 1,245 1,189 194 1,2862003 1,334 1,424 132 1,483 1,427 1,402 211 1,4772004 1,517 1,638 136 1,700 1,647 1,601 245 1,6952005 1,658 1,802 139 1,918 1,810 1,778 250 1,9132006 1,771 1,929 141 2,181 1,973 1,946 266 2,1812007 1,876 2,042 141 2,482 2,128 2,070 278 2,4822008 1,967 2,115 144 2,608 2,200 2,122 282 2,6082009 2,063 2,233 142 2,782 2,303 2,222 288 2,7822010 2,220 2,418 152 3,145 2,429 2,334 323 3,135
Source: China energy statistical yearbook 2011.Notes:1. This table is calculated by annual average population.
Resources, Energy and Tourism • China Review • June 2012 76

Table 16: Residential energy consumption per capita, 1980–2010
Year
Total average
(kgce)Coal (kg)
Electricity (kWh)
LPG (kg)
Natural gas (cu.m)
Gas (cu.m)
Urban (kgce)
Rural (kgce)
1980 112 118 11 0 0 1 332 601981 101 122 12 0 0 1 290 551982 102 124 12 0 0 1 281 561983 107 128 13 1 0 1 283 591984 113 135 15 1 0 2 288 631985 127 149 21 1 0 1 307 721986 127 148 23 1 1 1 306 711987 132 152 26 1 1 2 300 761988 141 159 31 1 1 2 307 841989 139 152 35 1 2 2 297 841990 139 147 42 1 2 3 298 831991 139 143 47 2 2 3 292 831992 134 127 55 2 2 4 267 851993 133 123 63 3 1 5 258 861994 129 109 73 3 2 6 238 861995 131 112 83 4 2 5 242 861996 121 83 88 6 2 6 238 711997 119 77 99 6 2 9 226 711998 119 73 104 7 2 10 218 711999 122 70 109 7 2 9 213 752000 124 67 115 7 3 10 210 762001 127 66 127 7 3 9 207 802002 134 66 138 8 4 10 210 872003 153 70 160 9 4 10 232 1022004 176 75 184 10 5 11 256 1192005 194 77 221 10 6 11 279 1322006 212 77 256 11 8 13 298 1452007 234 74 308 12 11 20 320 1632008 241 69 332 11 13 20 319 1732009 254 69 366 11 13 23 325 1902010 258 68 383 11 17 26 315 204
Source: China energy statistical yearbook 2011.
Resources, Energy and Tourism • China Review • June 2012 77

Box 4: Residential electricity consumption per capita: China vs Australia
From a low base of 11 kilowatt-hours (kWh) in 1980—compared to 1971 kWh in Australia in the same year—residential electricity consumption per capita in China has increased at an average annual growth rate of 13 per cent over the period 1980–2010. By contrast, electricity consumption per capita in Australia increased at an average annual growth rate of 1 per cent. In 2010, electricity consumption per capita in China reached 383 kWh, which was seven times less than electricity consumption per capita in Australia. Source: China energy statistical yearbook 2011; BREE, Energy in Australia 2012.
Resources, Energy and Tourism • China Review • June 2012 78

Table 17: Imports of major energy products, 1991–2010
Year
Coal (104
tn)
Coke (104
tn)
Crude oil
(104
tn)
Gasoline (104
tn)
Diesel oil (104
tn)
Kerosene (104
tn)
Fuel oil
(104
tn)
LPG (104
tn)
Other petro
products (104 tn)
Natural gas (108
cu.m)
Electricity (108
kWh)1991
137 0 597 11 320 3 126 0 12 0 31
1992
123 0 1,136 33 501 16 169 2 11 0 50
1993
143 0 1,567 218 940 54 456 68 71 0 45
1994
121 0 235 105 624 27 398 97 139 0 18
1995
164 0 3,401 16 612 76 659 233 96 0 6
1996
322 0 2,262 8 465 66 943 355 107 0 1
1997
201 0 3,547 8 743 138 1,371
358 176 0 1
1998
159 0 2,732 1 311 129 1,627
477 191 0 0
1999
167 0 3,661 0 31 211 1,757
322 208 0 4
2000
212 0 7,027 0 26 255 1,480
482 161 0 15
2001
249 0 6,026 0 27 202 1,824
489 201 0 18
2002
1,081
0 6,941 0 48 215 1,660
626 384 0 23
2003
1,110
0 9,102 0 85 210 2,395
637 432 0 30
2004
1,861
1 12,272
0 275 282 3,059
641 384 0 34
2005
2,617
1 12,682
0 53 328 2,609
617 443 0 50
2006
3,811
0 14,517
6 71 561 2,799
536 443 10 54
2007
5,102
0 16,317
23 162 524 2,417
405 689 40 43
2008
4,034
0 17,889
199 624 648 2,186
259 666 46 38
2009
12,583
16 20,379
4 184 612 2,407
408 1,153 76 60
2010
16,478
0 23,931
133 180 487 2,299
327 0 129 0
Source: China energy statistical yearbook 2011.
Resources, Energy and Tourism • China Review • June 2012 79

Table 18: Exports of major energy products, 1991–2010
Year
Coal (104
tn)
Coke1 (104
tn)
Crude Oil
(104
tn)
Gasoline (104
tn)
Diesel oil (104
tn)
Kerosene (104
tn)
Fuel oil
(104
tn)
LPG (104
tn)
Other petro
products (104
tn)
Natural gas (108
cu.m)
Electricity (108
kWh)1991
2,000 108 2,260 250 121 32 70 1 149 0 3
1992
1,966 135 2,151 270 148 18 63 1 66 0 0
1993
1,981 261 1,943 185 129 7 32 1 108 0 1
1994
2,419 404 1,849 210 122 11 6 1 89 0 39
1995
2,862 886 1,823 186 131 37 28 7 131 0 60
1996
3,648 769 2,040 131 157 74 37 33 117 0 37
1997
3,073 1,058 1,983 178 232 72 52 39 156 0 72
1998
3,230 1,146 1,560 182 98 92 57 50 203 0 72
1999
3,744 997 717 414 60 125 25 8 221 0 91
2000
5,505 1,520 1,031 455 55 199 33 2 280 0 99
2001
9,012 1,385 755 572 26 182 44 2 325 0 102
2002
8,384 1,357 766 612 124 170 64 6 246 0 97
2003
9,403 1,472 813 754 224 202 76 2 262 0 103
2004
8,666 1,501 549 541 64 205 182 3 361 24 95
2005
7,172 1,276 807 560 148 269 230 3 473 30 112
2006
6,327 1,447 634 351 78 371 258 15 473 29 123
2007
5,317 1,530 389 464 66 448 380 34 416 26 146
2008
4,543 1,221 424 203 63 536 732 68 419 32 166
2009
2,240 54 507 492 451 594 862 85 305 32 174
2010
1,903 335 303 517 464 605 990 93 0 0 191
Source: China energy statistical yearbook 2011.Note: 1. Includes semi-coke.
Resources, Energy and Tourism • China Review • June 2012 80

Resources, Energy and Tourism • China Review • June 2012 81

Table 19: Crude steel production, consumption, exports and imports, China vs rest of world (RoW), 1978–2010
Year Production Consumption Exports ImportsChina
(Mt)RoW (Mt)
China (Mt)
RoW (Mt)
China (Mt)
RoW (Mt)
China (Mt)
RoW (Mt)
1978 32 685 40 677 0 139 9 1311979 34 712 43 706 0 143 8 1371980 37 678 42 675 0 140 5 1371981 36 671 38 668 1 142 3 1381982 37 608 40 606 1 134 4 1321983 40 623 49 611 0 145 10 1331984 43 667 57 653 0 159 13 1451985 47 672 66 646 0 171 20 1441986 52 662 69 642 0 162 17 1421987 56 679 68 662 0 162 12 1441988 59 721 67 710 1 170 9 1601989 62 724 69 717 1 170 8 1631990 66 704 68 698 3 168 4 1631991 71 663 70 654 4 173 4 1651992 81 639 85 619 4 192 8 1721993 90 638 125 595 1 221 37 1781994 93 632 116 605 3 236 26 2081995 95 657 99 643 11 236 15 2221996 101 649 111 625 7 238 16 2151997 109 690 114 667 9 259 13 2361998 115 663 122 642 5 264 13 2431999 124 665 136 638 6 275 17 2492000 129 720 138 704 11 295 21 2782001 152 699 170 674 7 293 26 2672002 182 722 205 693 7 312 29 2842003 222 748 257 712 8 325 43 2892004 283 788 296 772 20 346 33 3292005 353 791 353 783 27 344 27 3362006 419 828 387 852 52 367 19 3902007 489 857 440 888 66 377 17 4082008 500 829 460 857 56 380 16 4082009 574 659 572 656 24 302 22 3002010 627 791 602 806 42 345 17 361
Source: Steel statistical yearbook, various years.
Resources, Energy and Tourism • China Review • June 2012 82

Box 5: Commodity consumption per capita and GDP per capita: crude steel, aluminium, copper and zinc, selected countriesThe charts below show the relationship between per capita consumption of crude steel, aluminium, copper and zinc and real GDP per capita for selected countries. China’s steel consumption has increased sharply over recent decades from its low base in 1980. Steel intensity of use (measured by kilograms consumption per person) in China overtook that in the United States in 2009 and is approaching that of Japan. (a) Crude steel, 1980–2010 (b) Aluminium, 1988–2010
Source: BREE; Steel statistical yearbook ( years); World economic outlook database 2012.(c) Copper, 1980–2010 (d) Zinc, 1990–2010
Source: BREE; World economic outlook database 2012.
Resources, Energy and Tourism • China Review • June 2012 83

Box 6: Ownership of major durable consumer goods per 100 urban households in ChinaUrbanisation and rising incomes are expected to increase the demand for consumer durables such as refrigerators, colour televisions, air conditioners, computers and automobiles.In Chinese urban households, the ownership of a range of consumer durables increased substantially between 2000 and 2010. Virtually all urban households in China now own a refrigerator as well as a colour television, and a growing number own air conditioners.Car ownership has increased from one car per 100 urban households in 2000 to three cars per 100 households in 2005 and 13 cars per 100 households in 2010.
Source: China statistical yearbook 2011.
Resources, Energy and Tourism • China Review • June 2012 84

Table 20: Iron ore production, consumption, exports and imports, China vs rest of world (RoW), 1978–2010
Year Production Consumption Exports ImportsChina
(Mt)RoW (Mt)
China (Mt)
RoW (Mt)
China (Mt)
RoW (Mt)
China (Mt)
RoW (Mt)
1978 55 773 62 757 0 350 6 3341979 56 828 62 814 0 397 6 3831980 53 804 59 789 0 384 6 3681981 49 788 51 764 0 372 2 3491982 50 707 54 693 0 328 3 3141983 53 664 57 641 0 314 4 2911984 57 756 63 732 0 372 6 3481985 65 778 75 755 0 376 10 3531986 67 778 81 748 0 370 14 3401987 72 778 84 749 0 368 12 3391988 73 812 83 785 0 401 10 3731989 76 830 89 795 0 424 13 3891990 84 806 99 782 0 395 14 3711991 82 767 101 733 0 397 19 3641992 92 717 117 699 0 364 25 3471993 111 706 144 667 0 396 33 3571994 113 724 150 686 0 422 37 3831995 124 773 165 724 0 459 41 4091996 119 769 163 722 0 444 44 3971997 125 798 181 742 0 482 55 4261998 116 790 168 735 0 463 52 4081999 111 773 167 713 0 446 55 3872000 105 854 175 779 0 507 70 4322001 102 832 194 729 0 504 92 4012002 109 881 220 753 0 544 112 4162003 208 956 356 794 0 595 148 4322004 204 1,040 412 843 0 646 208 4492005 266 1,113 541 844 0 718 275 4482006 328 1,221 654 903 0 764 326 4462007 369 1,303 752 933 0 824 383 4542008 301 1,380 745 944 0 890 444 4532009 223 1,331 853 683 0 961 630 3132010 315 1,513 934 872 0 1,071 619 429
Source: UNCTAD 2011.Notes:1. 1.0 Mt = one million tonnes.
Resources, Energy and Tourism • China Review • June 2012 85

Table 21: Thermal coal production, consumption, exports and imports, China vs rest of world (RoW), 1978–2010
Year Production Consumption Exports ImportsChina
(Mt)RoW (Mt)
China (Mt)
RoW (Mt)
China (Mt)
RoW (Mt)
China (Mt)
RoW (Mt)
1978 565 1,514 565 1,514 3 84 2 831979 581 1,602 579 1,607 4 96 2 1011980 552 1,676 549 1,675 5 114 2 1131981 561 1,676 558 1,675 5 122 2 1211982 604 1,754 601 1,761 5 123 2 1311983 648 1,742 646 1,748 4 125 2 1311984 717 1,806 715 1,812 5 147 2 1531985 735 1,874 732 1,874 5 173 2 1741986 754 1,932 749 1,933 7 176 2 1771987 783 1,984 775 1,992 10 170 2 1781988 829 1,994 819 2,001 12 184 2 1911989 895 1,993 885 2,005 12 185 2 1961990 920 1,920 908 1,958 14 280 2 3181991 926 1,892 910 1,939 16 271 1 3181992 949 1,878 931 1,926 20 257 1 3051993 985 1,804 971 1,850 16 232 1 2781994 1,065 1,861 1,047 1,918 19 229 1 2861995 1,145 1,885 1,125 1,929 22 267 2 3111996 1,198 1,909 1,172 1,945 29 282 3 3191997 1,154 1,956 1,125 2,000 31 303 2 3471998 1,124 1,981 1,098 2,017 27 324 1 3591999 1,064 1,974 1,034 2,025 32 318 1 3692000 1,055 1,994 1,008 2,059 49 365 2 4302001 1,090 2,118 1,014 2,219 79 378 2 4782002 1,195 2,093 1,135 2,186 71 386 11 4792003 1,422 2,141 1,350 2,241 81 426 8 5262004 1,642 2,239 1,573 2,348 81 452 12 5612005 1,786 2,336 1,738 2,415 66 498 19 5762006 1,880 2,457 1,855 2,525 59 557 33 6252007 1,974 2,485 1,968 2,546 51 588 45 6502008 2,230 2,551 2,221 2,634 42 583 33 6652009 2,347 2,507 2,417 2,496 22 632 91 6212010 2,564 2,565 2,673 2,564 19 665 129 663
Source: IEA database 2011.Notes:1. 1.0 Mt = one million tonnes.
Resources, Energy and Tourism • China Review • June 2012 86

Table 22: Metallurgical coal production, consumption, exports and imports, China vs rest of world (RoW), 1978–2010
Year Production Consumption Exports ImportsChina
(Mt)RoW (Mt)
China (Mt)
RoW (Mt)
China (Mt)
RoW (Mt)
China (Mt)
RoW (Mt)
1978 52.6 468.6 52.3 462.8 0.3 119.8 0.0 114.01979 54.4 503.5 53.7 497.8 0.7 139.5 0.0 133.81980 68.2 492.1 66.8 492.0 1.4 141.7 0.0 141.61981 60.6 487.6 59.1 483.3 1.5 147.1 0.0 142.81982 62.6 476.8 60.8 474.3 1.8 144.4 0.0 141.91983 66.2 454.5 63.9 448.7 2.3 142.2 0.0 136.31984 72.0 467.9 69.6 461.4 2.4 163.7 0.0 157.21985 68.4 470.9 66.1 469.1 2.5 168.6 0.2 166.81986 69.9 474.6 67.4 470.1 3.0 163.6 0.5 159.11987 72.8 476.6 69.4 469.9 3.6 170.7 0.2 164.01988 75.3 491.7 72.1 482.3 3.2 188.0 0.1 178.61989 81.3 489.0 78.7 477.2 2.9 189.0 0.3 177.21990 85.7 512.9 82.4 478.6 3.5 205.3 0.3 170.91991 87.2 471.9 83.7 442.9 3.8 197.7 0.4 168.71992 89.5 449.8 86.2 417.2 3.7 198.5 0.4 165.91993 96.6 420.8 92.3 404.2 4.3 180.2 0.0 163.71994 103.7 395.8 98.8 380.3 4.9 189.5 0.0 174.01995 147.8 397.5 141.1 389.9 6.7 187.2 0.0 179.61996 132.0 383.4 124.5 379.7 7.5 184.8 0.0 181.21997 135.4 389.7 131.2 381.4 4.6 191.2 0.4 183.01998 131.6 363.6 126.8 362.3 4.9 178.3 0.1 177.01999 123.0 357.2 118.0 353.0 5.2 172.6 0.3 168.42000 123.7 352.7 117.6 351.5 6.5 179.3 0.3 178.12001 128.8 345.7 117.6 334.8 11.4 182.3 0.3 171.52002 148.8 333.7 135.8 341.2 13.3 167.8 0.3 175.32003 165.8 342.3 155.2 345.0 13.1 171.0 2.6 173.82004 225.7 357.7 226.8 366.8 5.8 182.4 6.8 191.52005 280.6 363.5 282.6 350.6 5.3 200.1 7.2 187.32006 339.0 356.3 339.3 352.1 4.3 195.5 4.7 191.32007 379.1 383.5 382.8 372.5 2.5 212.4 6.2 201.52008 385.0 381.8 388.4 352.3 3.5 231.8 6.9 202.42009 416.5 365.3 450.2 322.9 0.6 210.9 34.4 168.52010 454.8 436.3 502.7 373.7 0.6 270.4 48.4 207.8
Source: IEA database 2011.1. 1.0 Mt = one million tonnes.
Resources, Energy and Tourism • China Review • June 2012 87

Box 7: China’s dependence on imports of iron ore, thermal coal and metallurgical coalIn 2010, China’s dependence on imports (measured by imports as a percentage of consumption) of iron ore was around seven times higher than it was in 1978. Its dependence on imports of metallurgical coal was more than 30 times higher than it was in 1978. While China remains the world’s largest producer of thermal coal, its import dependence increased from 0.4 per cent in 1978 to 4.6 per cent in 2010.
Source: IEA database 2011; UNCTAD 2011.
Resources, Energy and Tourism • China Review • June 2012 88

Box 8: China’s thermal and metallurgical coal: production, consumption, export and importOver the past three decades (1978 to 2010) China’s production of thermal coal increased 4.5-fold, from 565 million tonnes (Mt) in 1978 to 2,564 Mt in 2010. Its consumption increased 4.7-fold, from around 565 Mt in 1978 to 2,673 Mt in 2010. Since 2009 consumption has surpassed production and China’s imports of thermal coal are now greater than its exports.Over the same period, China’s production of metallurgical coal increased 8.6-fold, from 52.6 Mt in 1978 to 454.8 Mt in 2010. Its consumption increased 9.6-fold, from 52.3 Mt in 1978 to 502.7 Mt in 2010. Since 2004 consumption has surpassed production and China’s imports of thermal coal are now greater than its exports.Despite the rapid increase in production of thermal and metallurgical coal, Chinese coal consumption has risen at an even faster rate, on average, over the period. As a result, its exports of both thermal coal and metallurgical coal have fallen dramatically since 2009 and 2004, while its imports have increased at a very fast rate. (a) Thermal coal (b) Metallurgical coal
Source: IEA database 2011.
Resources, Energy and Tourism • China Review • June 2012 89

Box 9: Volume share of China’s coal imports from key suppliers Jan. 2008 to Feb. 2012Over the past 50 months, the biggest foreign supplier of coal to China was Indonesia, which contributed around one-third of China’s total coal imports, based on an annual average, over the period. Australia was the second most important supplier, with a 22 per cent share of China’s total imports of coal. Vietnam’s share of China’s coal imports has declined over the period, while Mongolia’s and South Africa’s shares have risen.
Note: Data is based on a 12-month moving average.Source: CEIC database 2012.
Box 10: Volume share of China’s imports of iron ore: key suppliersOver the past decade Australia’s volume share of China’s iron ore imports was around 40 per cent, a proportion roughly equivalent to Brazil’s and India’s combined share.
Source: Iron ore statistics, United Nations Conference on Trade and Development 2011.
Resources, Energy and Tourism • China Review • June 2012 90

Box 11: China’s imports of LNG from key marketsOver the period 2006–10, China’s total imports of LNG increased around 13-fold, from 1.0 billion cubic metres (bcm) to 12.8 bcm.China’s imports of LNG (bcm)
Australia Indonesia Malaysia Qatar Others Total2006 1.0 0 0 0 1.0 1.02007 3.3 0 0 0 0.6 3.92008 3.6 0 0 0 0.8 4.42009 4.7 0.7 0.9 0.5 0.7 7.62010 5.2 2.5 1.7 1.6 1.9 12.8
Source: BP Statistical Review of World Energy 2011.In 2010 China imported 5.2 bcm of LNG from Australia, compared to 1.0 bcm in 2006. Australian exports of LNG accounted for around 41 per cent of China’s total imports of LNG in 2010.China’s imports of LNG from Australia and other economies
Source: BP Statistical Review of World Energy 2011.
Resources, Energy and Tourism • China Review • June 2012 91

Part 3: Australian exports to and imports from China Table 23: Australian exports to China and rest of world (RoW) (2010–11 A$billion)
Year Mineral Resources1 Merchandised Goods2 Goods and Services3
China RoW China RoW All countries1989–90 0.2 23.3 1.2 47.9 89.01990–91 0.3 27.2 1.3 51.1 99.01991–92 0.5 27.1 1.5 53.6 108.31992–93 0.8 28.6 2.3 58.4 116.41993–94 0.6 28.8 2.6 62.0 127.41994–95 0.7 29.1 3.0 64.1 133.01995–96 1.0 32.7 3.8 72.2 146.21996–97 1.2 32.4 3.6 75.3 162.11997–98 1.5 38.0 3.9 83.9 169.71998–99 1.6 36.7 3.9 82.0 173.01999–00 2.0 41.2 5.0 92.3 189.82000–01 2.8 52.3 6.8 112.7 205.42001–02 3.0 51.2 7.8 113.3 204.02002–03 3.6 48.6 8.8 106.7 204.32003–04 4.5 43.9 9.9 99.1 206.82004–05 6.8 56.2 13.0 113.8 214.02005–06 11.0 75.6 18.1 134.4 219.72006–07 13.2 86.8 22.8 145.3 228.42007–08 19.6 92.8 27.0 153.8 237.02008–09 33.2 126.4 39.3 191.5 241.12009–10 36.8 98.2 46.5 154.2 253.82010–11 49.9 na 64.9 180.9 254.4
Sources: BREE; ABS cat. nos 5368.0, 5302.0, 5465.0.a Not based on balance of payments; b FOB value; c Chain value.Notes:1. Not based on balance of payments.2. FOB value; 3. Chain value calculation
Resources, Energy and Tourism • China Review • June 2012 92

Box 12: Australian exports to ChinaOver the past 20 years the real value of Australian exports of mineral resources to China has increased from A$0.2 billion in 1989–90 to A$49.9 billion in 2010–11. The value of Australian total merchandised exports to China increased from A$1.2 billion to A$64.9 billion over the same period.Value of Australian exports of mineral resources and merchandised exports to China (2010–11 A$billion)
Note: Merchandised goods have subcategories of ‘rural’ and ‘non-rural’. There are also subcategories for non-rural: metal ores and minerals; coal, coke and briquettes; other mineral fuels and metals (excluding non-monetary gold); machinery and transport equipment; other manufactures and other non-rural.Sources: BREE; ABS cat. nos 5368.0 and 5302.0.In volume terms, China accounted for around 69 per cent of Australian total exports of iron ore in 2010–11, compared to around 6 per cent in 1989–90. Over the period 1989–90 to 2010–11, China’s share of Australian total exports of metallurgical coal increased from 1 per cent to around 11 per cent, while its share of Australian total exports of thermal coal increased from 0.1 per cent to around 12 per cent.Volume share of Australian exports to China: metallurgical coal, thermal coal and iron ore
Sources: BREE; ABS cat. no. 5465.0.
Resources, Energy and Tourism • China Review • June 2012 93

Box 13: Growth in China’s imports and exports of merchandised goodsFrom 1990–91 to 2010–11, the total value of China’s imports of merchandised goods from Australia increased 55-fold, at an average growth rate of around 22 per cent per annum. The value of merchandised goods the rest of the world (RoW) imported from Australia increased around a fourfold over the period 1990–91 to 2010–11, at an average growth rate of around 7 per cent per annum.(a) Annual growth in China’s imports (b) Annual growth in RoW imports from Australia from Australia
Source: ABS cat. 5302.0 and 5439.0.From 1990–91 to 2010–11, the total value of China’s exports of merchandised goods to Australia increased 33-fold, an average growth rate of 18 per cent per annum. The value of merchandised goods the rest of the world (RoW) exported to Australia increased around a fourfold, an average growth rate of around 6 per cent per annum. (c) Annual growth in China’s exports to Australia (d) Annual growth in RoW exports to Australia
Note: RoW refers rest of the world.Source: ABS cat. 5302.0 And 5439.0.
Resources, Energy and Tourism • China Review • June 2012 94

Table 24: Metallurgical coal, thermal coal and iron ore, Australian exports to China and rest of world (Row), 1989–2011
Year Metallurgical coal1 Thermal coal Iron ore2
China (Mt) RoW (Mt) China (Mt) RoW (Mt) China (Mt) RoW (Mt)1989–90 0.5 42.6 0.0 43.9 5.5 93.01990–91 0.3 43.3 0.0 51.5 8.1 96.01991–92 0.3 47.4 0.0 58.2 14.6 91.91992–93 0.5 50.0 0.1 59.6 15.2 92.41993–94 0.5 47.7 0.0 59.1 16.7 97.71994–95 0.2 48.2 1.1 61.8 20.4 108.41995–96 0.1 49.7 1.4 59.7 23.3 102.91996–97 0.3 49.0 1.5 65.6 26.8 110.71997–98 0.3 56.7 1.5 77.0 29.9 112.31998–99 1.3 54.7 1.7 82.5 24.5 110.71999–00 1.4 61.4 0.9 78.1 30.4 119.02000–01 0.4 61.5 0.6 87.4 35.5 121.82001–02 0.0 65.4 2.9 89.1 39.1 117.02002–03 0.7 65.8 4.0 96.0 53.5 128.0Part 2:2003–04
3.1 64.5 2.5 104.2 66.1 128.7
2004–05 3.7 77.0 1.7 104.6 99.6 128.82005–06 2.2 75.3 4.0 106.8 123.5 115.92006–07 2.4 80.4 3.2 108.4 135.3 122.12007–08 1.4 82.3 1.5 113.6 167.6 126.72008–09 9.8 69.8 8.4 128.0 223.2 100.32009–10 15.5 82.2 13.9 121.1 265.6 124.32010–11 9.6 82.0 16.7 126.6 279.4 127.5
Sources: BREE; ABS cat. no. 5465.0.Note: 1. High quality metallurgical coal. 2. Lump and run of mine.3. 1.0 Mt = one million tonnes.
Resources, Energy and Tourism • China Review • June 2012 95

Table 25: Aluminium, copper, lead and zinc, Australian exports to China and rest of world (RoW), 1990–2010
Year Aluminium Copper Lead ZincChina
(Kt) RoW (Kt)
China (Kt)
RoW (Kt)
China (Kt)
RoW (Kt)
China (Kt)
RoW (Kt)
1990 3 934 7 226 0 72 0 5941991 6 948 30 182 0 86 0 7241992 25 905 41 230 0 106 0 7751993 14 1,042 0 397 0 118 0 7181994 2 946 52 383 0 88 13 6981995 11 946 121 270 2 80 19 6751996 12 1,056 191 597 19 65 70 6761997 11 1,145 168 812 29 74 57 6831998 5 1,305 317 917 26 205 16 7601999 18 1,363 226 810 35 222 0 8162000 19 1,383 285 730 70 215 5 8852001 20 1,469 453 792 74 230 94 9302002 46 1,480 371 784 42 222 63 9532003 72 1,456 362 1,005 64 199 116 8912004 75 1,458 216 966 83 181 131 8642005 60 1,525 571 1,035 138 193 103 8282006 37 1,581 540 1,019 127 153 104 7822007 29 1,623 412 1,129 67 168 300 7022008 16 1,663 602 1,204 60 162 352 6442009 139 1,535 643 1,158 111 156 615 4172010 40 1,652 564 1,313 166 135 532 633
a Aluminium, copper, Lead and Zinc export quantities are based on gross weight of ore and concentrates.Sources: BREE; ABS cat. no. 5465.0.
Resources, Energy and Tourism • China Review • June 2012 96

Table 26: Merchandised goods, Australian imports, top five economies and rest of world (RoW), current custom value (A$billion), 1989–2011
Year China US Japan Singapore Germany RoW1989–90 1.2 12.4 9.9 1.2 3.4 23.21990–91 1.5 11.5 8.8 1.3 3.1 22.71991–92 2.0 11.7 9.3 1.3 3.0 23.71992–93 2.6 13.0 11.1 1.5 3.4 28.01993–94 3.1 14.0 11.7 1.8 3.8 30.11994–95 3.6 16.0 12.8 2.2 4.9 35.01995–96 4.0 17.5 10.8 2.6 4.9 37.91996–97 4.2 17.6 10.2 2.6 4.6 39.71997–98 5.3 19.8 12.7 2.6 5.2 45.01998–99 6.1 20.9 13.6 2.9 6.1 48.01999–00 7.5 23.1 14.1 4.4 5.8 55.22000–01 9.9 22.4 15.4 3.9 6.2 60.62001–02 11.3 21.5 15.5 4.0 6.7 60.72002–03 13.8 22.5 16.3 4.4 8.0 68.22003–04 15.3 19.9 16.1 5.1 8.0 66.52004–05 19.8 21.3 17.2 7.2 8.6 75.32005–06 23.2 22.8 17.3 10.5 8.7 85.02006–07 27.1 24.9 17.4 10.1 9.3 92.02007–08 31.0 24.3 19.7 13.7 10.6 103.12008–09 37.0 25.3 17.8 13.4 11.1 114.72009–10 36.4 21.9 17.8 10.9 10.7 106.02010–11 41.1 23.2 16.7 11.4 10.2 111.4
Sources: BREE; ABS cat. no. 5439.0.
Resources, Energy and Tourism • China Review • June 2012 97

Box 14A: China’s share of export/import-value to/from Australia/rest of world of its total exports and importsThe share of exports by value to Australia as a proportion of China’s total exports was around 2 per cent while its share of exports by value to the rest of world was around 98 per cent in 2011.The share of imports by value from Australia as a proportion of China’s total imports was around 5 per cent while its share of imports by value from the rest of world was around 95 per cent in 2011.(a) China’s export share to: (b) China’s import share from: Australia vs rest of world Australia vs rest of world
Note: Exports and imports of total goods.Source: CEIC 2012.
Box 14B: Australia’s share of export/import-value to/from China/rest of world of its total exports and imports The share of exports by value to China as a proportion of Australian total exports was around 26 per cent while its share of exports by value to the rest of world was around 74 per cent in 2010–11.The share of imports by value from China as a proportion of Australian total imports was around 19 per cent while its share of imports by value from the rest of world was around 81 per cent in 2010–11.(c) Australia’s export share to: (d) Australia’s import share from: China vs rest of world China vs rest of world
Note: Exports and imports of total merchandised goods.Source: ABS cat. nos. 5368.0 and 5439.0.
Resources, Energy and Tourism • China Review • June 2012 98


![esp - · PDF fileesp pop edx Datum pop ecx ret add eax,[edx] push edi ret mov [edx], ecx ret pop edi ret ret pop edx ret Bachelorstudiengang Informatik/IT-Sicherheit](https://img.dokumen.tips/doc/110x75/5a9d34507f8b9a032a8c9609/esp-pop-edx-datum-pop-ecx-ret-add-eaxedx-push-edi-ret-mov-edx-ecx-ret-pop.jpg)