Embed Size (px)
Citation preview

Resveratrol reduces the inflammatoryresponse in adipose tissue and improvesadipose insulin signaling in high-fatdiet-fed mice
Shibin Ding1,2, Jinjin Jiang3, Zhe Wang1, Guofu Zhang1, Jianli Yin1,Xiaoya Wang1, Sui Wang1 and Zengli Yu1
1 School of Public Health, Xinxiang Medical University, Xinxiang, Henan, PR China2 Henan Collaborative Innovation Center of Molecular Diagnosis and Laboratory Medicine,
Xinxiang Medical University, Xinxiang, Henan, PR China3 School of Public Health, Capital Medical University, Beijing, PR China
ABSTRACTBackground: Obesity-induced glucose metabolism disorder is associated with
chronic, low-grade, systemic inflammation and is considered a risk factor for
diabetes and metabolic syndrome. Resveratrol (RES), a natural anti-inflammatory
compound, is observed to improve glucose tolerance and insulin sensitivity in obese
rodents and humans. This study aimed to test the effects of RES administration on
insulin signaling and the inflammatory response in visceral white adipose tissue
(WAT) caused by a high-fat diet (HFD) in mice.
Methods: A total of 40 wild-type C57BL/6 male mice were divided into four groups
(10 in each group): the standard chow diet (STD) group was fed a STD; the HFD
group was fed a HFD; and the HFD-RES/L and HFD-RES/H groups were fed a HFD
plus RES (200 and 400 mg/kg/day, respectively). The L and H in RES/L and RES/H
stand for low and high, respectively. Glucose tolerance, insulin sensitivity, circulating
inflammatory biomarkers and lipid profile were determined. Quantitative PCR and
Western blot were used to determine the expression of CC-chemokine receptor 2
(CCR2), other inflammation markers, glucose transporter 4 (GLUT4), insulin
receptor substrate 1 (IRS-1) and pAkt/Akt and to assess targets of interest involving
glucose metabolism and inflammation in visceral WAT.
Results: HFD increased the levels of total cholesterol, triglycerides, low-density
lipoprotein cholesterol and proinflammatory cytokines in serum, decreased the
high-density lipoprotein cholesterol level in serum, and induced insulin resistance
and WAT inflammation in mice. However, RES treatment alleviated insulin
resistance, increased the expressions of pAkt, GLUT4 and IRS-1 in WAT, and
decreased serum proinflammatory cytokine levels, macrophage infiltration and
CCR2 expression in WAT.
Conclusion: Our results indicated that WAT CCR2 may play a vital role in
macrophage infiltration and the inflammatory response during the development of
insulin resistance in HFD-induced obesity. These data suggested that administration
of RES offers protection against abnormal glucose metabolism and inflammatory
adaptations in visceral WAT in mice with HFD-induced obesity.
How to cite this article Ding et al. (2018), Resveratrol reduces the inflammatory response in adipose tissue and improves adipose insulin
signaling in high-fat diet-fed mice. PeerJ 6:e5173; DOI 10.7717/peerj.5173
Submitted 3 March 2018Accepted 16 June 2018Published 29 June 2018
Corresponding authorsShibin Ding, [email protected]
Zengli Yu, [email protected]
Academic editorDaniela Foti
Additional Information andDeclarations can be found onpage 14
DOI 10.7717/peerj.5173
Copyright2018 Ding et al.
Distributed underCreative Commons CC-BY 4.0

Subjects Diabetes and Endocrinology, Immunology, Nutrition, Metabolic Sciences
Keywords Resveratrol, High-fat diet, Inflammation, Insulin resistance, Adipose tissue
INTRODUCTIONThe global prevalence of obesity has increased rapidly in recent years, and the number
of overweight or obese adults worldwide is expected to reach 3.3 billion by 2030
(Kelly et al., 2008). The rapid increase in obesity worldwide will lead to an increasing
in related health complications, including insulin resistance, type 2 diabetes mellitus
(T2DM), nonalcoholic fatty liver disease and cardiovascular disorders. Accumulating
animal and human research evidence implicates obesity and related metabolic
disturbances as the major risk factors for the development of insulin resistance and T2DM
(Qatanani & Lazar, 2007). Obesity is a chronic, low-grade inflammation that increases
various inflammatory reactions related to body fat (Pradhan, 2007). White adipose
tissue (WAT), a very important endocrine organ, consists mainly of subcutaneous adipose
tissue (SAT) and internal adipose tissue. Internal adipose tissue makes up approximately
20% of the total body fat mass and mainly consists of visceral adipose tissue (VAT).
In obesity, inflammation can occur due to increased levels of chemokines (such as CCL2
and CXCL1) and inflammatory cytokines (such as tumor necrosis factor a (TNF-a)and interleukin-6 (IL-6)) secreted from accumulated fat in hepatocytes and
adipocytes, causing insulin resistance (Kim et al., 2017; Xu et al., 2003). In obesity,
macrophage infiltration in adipose tissue was observed in both rodents and humans
(Fjeldborg et al., 2014; Harford et al., 2011; Michaud et al., 2012). Macrophages are
important immune cells, and the activation of macrophages could release various
cytokines that promote the development of insulin resistance (Park et al., 2016;
Zheng et al., 2015). The above studies indicate that reducing the levels of chemokines,
secreted inflammatory cytokines and macrophage infiltration in VATmay alleviate
obesity-induced insulin resistance and its progression.
CC-chemokine receptor 2 (CCR2), a receptor for monocyte chemoattractant proteins
(MCPs), plays a pivotal role in the entry of innate immune cells into tissue and
influences systemic insulin resistance and adipose tissue inflammation associated with
obesity in high-fat-fed murine models (Weisberg et al., 2006). Studies have demonstrated
that CCR2 deficiency could reduce the migration of macrophages in adipose tissue
(Bolus et al., 2015). Pharmacological inhibition of CCR2 can reduce inflammation in
adipose tissue, alter hepatic metabolism and ameliorate multiple diabetic parameters
in mouse models of T2DM and high-fat diet (HFD)-fed mice (Kim et al., 2015;
Sullivan et al., 2013). Moreover, deficiency of CCR2 in macrophages alleviates
inflammation of adipose tissue and the associated metabolic syndrome (abnormal
glucose tolerance, insulin sensitivity profiles and hepatic steatosis) in obese mice
(Kim et al., 2016). Resveratrol (RES, 3,4′,5-trihydroxystilbene) is a polyphenol mainly
found in grapes, mulberries and red wine, and it provides many health benefits including
cardioprotective and anti-inflammatory effects. RES inhibits monocyte CCR2 binding
activity and expression in a NO-, MAPK- and PI3K-dependent manner in THP-1
monocytes (Cullen et al., 2007). Furthermore, RES metabolites showed anti-inflammatory
Ding et al. (2018), PeerJ, DOI 10.7717/peerj.5173 2/18
properties via regulating chemokines in a lipopolysaccharide-activated U-937
macrophage model (Schueller, Pignitter & Somoza, 2015). Recent studies demonstrated
that RES ameliorates inflammation and insulin resistance in murine models of obesity
induced by a HFD (Cote et al., 2015; Pan et al., 2015; Zhao et al., 2016). However, whether
RES treatment could inhibit macrophage infiltration and regulate insulin signaling in
insulin-sensitive WAT in obesity is still unknown.
Considering the key role of the innate immune system in obesity-induced
inflammation, the regulatory function of CCR2 on inflammation and the recruitment
of macrophages to insulin-sensitive tissues in response to HFD-induced obesity,
we investigated the role of CCR2 in abnormal glucose disorder and inflammation of
adipose tissue induced by HFD. We also determined whether RES administration would
alleviate inflammation and the effects of disordered glucose metabolism induced by HFD
treatment by inhibiting CCR2 expression and enhancing insulin sensitivity in VAT and
SAT in obese mice.
MATERIALS AND METHODSChemicals and reagentsResveratrol (3,4,5-trihydroxy-trans-stilbene) was obtained from Sigma-Aldrich
(St. Louis, MO, USA). Total cholesterol (TC), triglycerides (TG), high-density lipoprotein
cholesterol (HDL) and low-density lipoprotein cholesterol (LDL) assay kits for estimation
of TG, cholesterol, HDL and LDL in serum were purchased from BIOSINO
Bio-technology and Science Inc. (Beijing, China). An insulin ELISA kit was obtained from
Bai Wo (Shanghai, China). TRIzol and the oligonucleotides for PCR were obtained
from Invitrogen, Inc. (Carlsbad, CA, USA), and a real-time quantitative PCR kit was
purchased from TAKARA Bio, Inc. (cat. RR037A and RR420A; Otsu, Shiga, Japan).
Mouse anti-b-actin antibody (cat. A5441) was obtained from Sigma-Aldrich (St. Louis,
MO, USA), rabbit anti-Akt (protein kinase B) (cat. 4691T), rabbit anti-phosphorylated
(p)-Akt (phosphorylated at Ser473) (cat. 4058T), rabbit anti-insulin receptor substrate 1
(IRS-1) (cat. 2390S) and rabbit anti-glucose transporter 4 (GLUT4) (cat. 2213S)
antibodies were purchased from Cell Signaling Technology (Billerica, MA, USA).
Rabbit anti-CCR2 antibody (cat. DF2711) and goat anti-rabbit IgG (H+L)-HRP (cat. S0001,
dilution, 1:5,000) and goat anti-mouse IgG (H+L)-HRP (cat. S0002, dilution, 1:5,000)
secondary antibodies were purchased from Affinity Biosciences, Inc. (Cincinnati, OH,
USA). All other chemicals were of the highest grade commercially available.
Animals and animal careA total of 40 6-week-old male C57BL/6 mice (19–25 g) were purchased from the Vital
River Laboratory Animal Technology Co., Ltd. (Beijing, China). All animals were
maintained at 21 �C on a 12 h light/12 h dark cycle and were allowed access to food
and water ad libitum. The protocols and the use of animals were approved by and in
accordance with the Xinxiang Medical University Animal Care and Use Committee
(XXMU-2016-0007). The animals were treated humanely and with regard for alleviation
of suffering.
Ding et al. (2018), PeerJ, DOI 10.7717/peerj.5173 3/18

Experimental designAfter one week of acclimation, all mice were randomly divided into four groups (n = 10)
and treated for 18 weeks as follows: (1) the standard chow diet (STD) group was fed a
STD; (2) the HFD group was fed a HFD (41.26% of calories from fat); (3) the HFD-RES/L
group was fed a HFD and treated with RES (200 mg/kg/day); and (4) the HFD-RES/H
group was fed a HFD and treated with RES (400 mg/kg/day). The L and H in RES/L
and RES/H stand for low and high, respectively. The doses of RES treatment (200 and
400 mg/kg/day) are based on those used in previous studies (Ding et al., 2017;
Lagouge et al., 2006). The HFD intervention and RES treatment were started
simultaneously. RES was dissolved in 0.1 mL deionized water and administered to the
treatment groups daily (9:00 a.m.) by oral gavage, and the mice in the STD group and
HFD group were administered with 0.1 mL deionized water by oral gavage at the
same time. The RES and deionized water were administered seven consecutive days
per week for 18 weeks. The macronutrient contents of the STD and the HFD are shown
in Table 1, and the ingredient composition of the HFD was as follows (w/w): standard
chow, 60%; custard powder, 8%; lard, 12%; sugar, 12%; peanut powder, 6%; and milk, 1%
(Ding et al., 2014). The mice were weighed each week.
After 18 weeks of treatment, mice were sacrificed by intravenous pentobarbital
injection (20 mg/kg). Abdominal SAT and VAT (perirenal) were collected, weighed,
immediately frozen in liquid nitrogen and stored at -80 �C for future experiments.
The remaining SAT and VAT were fixed in a formaldehyde solution for histology and
immunohistochemistry. The SAT coefficient and VAT coefficient were calculated (SAT
weight and VAT weight � 100/body weight, respectively).
Blood glucose homeostasis and insulin resistanceAfter 17 weeks of treatment, the intraperitoneal glucose tolerance test (IPGTT) was
conducted in the mice as previously described (Marmugi et al., 2012). Briefly, mice
were fasted for 10 h, and glucose (1 mg/g body weight) was injected intraperitoneally
for IPGTT. Blood samples were collected from the tail vein and blood glucose
measurement was conducted with a commercial hand-held glucometer (Accu-Chek
Active; Roche, Shanghai, China) at the indicated time points (0, 15, 30, 60, and 120 min).
Additionally, the area under the curve (AUC), an index of glucose tolerance, was
calculated. The homeostasis model assessment for insulin resistance index (HOMA-IR)
was calculated using the formula HOMA-IR = (fasting serum insulin concentration) �(fasting serum glucose concentration)/22.5 (Ding et al., 2014), and the insulin sensitivity
Table 1 The energy supply for the standard chow diet (STD) and the high-fat diet (HFD).
Fat (%) Carbohydrates (%) Protein (%) Total energy (kcal/g)
STD 13.68 64.44 21.88 3.29
HFD 41.26 39.61 19.13 4.59
Note:STD, standard chow diet; HFD, high-fat diet.
Ding et al. (2018), PeerJ, DOI 10.7717/peerj.5173 4/18

index (ISI) was calculated as follows: 1/ln (fasting serum insulin concentration � fasting
serum glucose concentration) (Wang et al., 2013).
Analysis of metabolic parametersAt the end of the treatment (18 weeks), blood was collected from mice that had been
fasted for 12 h. Serum was obtained after centrifugation (1,000�g for 10 min at 4 �C)(Eppendorf 5810R, Hamburg, Germany). The levels of TG, TC, HDL and LDL in serum
were assayed using enzymatic colorimetric assays (BIOSINO Bio-technology and Science,
Inc., Beijing, China) according to the manufacturer’s instructions.
Measurement of serum cytokines, leptin, adiponectin and insulinby ELISASerum insulin was determined using a commercial mouse ELISA kit (Bai Wo
Bio-technology, Shanghai, China). TNF-a, MCP-1 and IL-6 levels in serum were
measured by mouse ELISA kits (R&D Systems, Billerica, MA, USA) according to the
manufacturer’s protocols.
ImmunohistochemistrySubcutaneous adipose tissue and VAT were fixed overnight at room temperature in
formaldehyde solution (4%), dehydrated, and embedded in paraffin.
Immunohistochemistry for macrophage marker F4/80 in adipose tissue was performed
as described by the manufacturer’s instructions. Sections (5 mm) were incubated
overnight at 4 �C with rat anti-F4/80 antibody (cat. Ab16911, diluted 1:1,000; Abcam,
Cambridge, UK) and incubated for 1 h with the appropriate secondary antibody. Image-
Pro Plus version 6.0 software (Media Cybernetics, Silver Spring, MD, USA) was used to
perform the analysis.
Quantitative real-time PCRReal-time PCR was performed using RNA extracted from SAT and VAT of the
experimental mice. RNA was isolated using TRIzol reagent (cat. 15596026; Invitrogen,
Carlsbad, CA, USA) according to the manufacturer’s instructions. Total RNA was then
converted into cDNA using a cDNA reverse transcription kit (TAKARA Bio Inc., Otsu,
Shiga, Japan). Real-time PCR was performed using the SYBR Green detection system
on an ABI PRISM 7900 machine (Applied Biosystems, Foster City, CA, USA) under the
same conditions: one cycle of 95 �C, 5 s; 40 cycles of 95 �C, 10 s and 57 �C, 30 s. Gene
expression levels were calculated using the 2-▵▵CT method, and b-actin was used as an
endogenous control gene. The sequences are listed in Table 2.
Western blot analysisSubcutaneous adipose tissue and VAT were homogenized with RIPA protein extraction
reagent (cat. P0013B; Beyotime, Jiangsu, China) on ice. Equal quantities of protein
were loaded and separated on a 10% and 7.5% SDS–PAGE gels. After electrophoresis,
proteins were transferred to immobilon-P polyvinylidene difluoride membranes and
blocked with 5% nonfat milk. Then, the membranes were immunoblotted with different
Ding et al. (2018), PeerJ, DOI 10.7717/peerj.5173 5/18

primary antibodies: CCR2 (dilution, 1:2,000), IRS-1 (diluted 1:1,000), GLUT4 (diluted
1:1,000), Akt (diluted 1:1,000), pAkt (phosphorylated at Ser473) (diluted 1:2,000) and
b-actin (diluted 1:10,000; Sigma-Aldrich, St. Louis, MO, USA). After the membranes were
washed, the immunoblots were incubated with a secondary antibody conjugated with
horseradish peroxidase, visualized with an ECL detection system (Syngen, Cambridge,
UK) and analyzed using ChemiDoc Quantity One software (Bio-Rad Laboratories,
Milan, Italy). b-actin was used as a loading control for CCR2, and pAkt was normalized
to Akt.
Statistical analysesThe data are shown as the mean ± SD. All statistical analyses were conducted using
SPSS13.0 (SPSS, Chicago, IL, USA). Repeated measures ANOVA, with time (week)
and diet (STD or HFD) as repeated measures were used to analyze body weight.
The Greenhouse–Geisser test was used to revise degrees of freedom when Mauchly’s test
of sphericity showed P < 0.05. The body weight gain, SAT coefficient, VAT coefficient,
serum TG, serum TC, serum HDL, serum LDL, serumMCP-1, serum TNF-a, serum IL-6,
AUC, ISI, HOMA-IR, and serum glucose at different time points in the IPGTT, as well as
mRNA and protein expression levels were analyzed for statistical significance by
one-way ANOVA followed by post hoc analysis (Bonferroni post-test). A value of P < 0.05
was considered significant.
RESULTSEffects of RES treatment on body weight curve, body weight gain andSAT/VAT coefficientAs shown in Fig. 1, after 18 weeks of treatment, the HFD-fed mice had significantly
increased body weight compared to that of the STD-fed mice (P < 0.01), and there was
no significant difference in body weight gain between the HFD group and the RES-treated
groups (P > 0.05). The SAT coefficient and VAT coefficient in the HFD-fed groups
were significantly higher than those in the STD-fed group (P < 0.01). RES treatment
Table 2 Primer sequences used for real-time PCR.
Gene Forward primer (5′–3′) Reverse primer (5′–3′)
CCR2 TCATCCACGGCATACTATCAACA GTGGCCCCTTCATCAAGCT
MCP-1 CCACTCACCTGCTGCTACTCA TGGTGACCTCTTGTAGCTCTCC
TNF-a CCCAGACCCTCACACTCAGATC GCCACTCCAGCTGCTCCTC
IL-6 CTGCAAGAGACTTCCATCCAGTT AGGGAAGGCCGTGGTTGT
F4/80 CTTTGGCTATGGGCTTCCAGTC GCAAGGAGGACAGAGTTTATCGTG
GLUT4 CCCTGTTACCTCCAGGTTG CCTTGCCCTGTCAGGTATGT
IRS-1 GCCAATCTTCATCCAGTTGC CATCGTGAAGAAGGCATAGG
b-actin TTCGTTGCCGGTCCACACCC GCTTTGCACATGCCGGAGCC
Note:CCR2, CC-chemokine receptor 2; MCP-1, monocyte chemo-attractant protein 1; TNF-a, tumor necrosis factor a; IL-6,interleukin-6; GLUT4, glucose transporter 4; IRS-1, insulin receptor substrate.
Ding et al. (2018), PeerJ, DOI 10.7717/peerj.5173 6/18

significantly decreased the SAT coefficient in the HFD-fed mice (P < 0.05). However,
RES treatment did not affect the VAT coefficient in the HFD-fed mice (P > 0.05).
Effects of RES treatment on glucose homeostasis in miceTo assess the effects of RES treatment on glucose tolerance in HFD-fed mice,
we measured blood glucose levels at different time points during the IPGTT after the
17-week treatment. As shown in Fig. 2, the blood glucose levels of the HFD group
displayed a marked increase compared with those of the STD group at all time points
and compared with those of the HFD-RES/L group and HFD-RES/H group at 0, 15
and 30 min (P < 0.01). The AUC was significantly increased in the HFD groups vs. that
in the STD group (P < 0.01). Moreover, the AUC was significantly decreased in the
RES-treated groups when compared to that in the HFD group (P < 0.01 or P < 0.05).
Compared to those in the STD group, significantly increased HOMA-IR values
(P < 0.01) and significantly decreased insulin sensitivity were observed in the HFD-fed
groups (P < 0.01). Furthermore, compared to those in the HFD group, significantly
decreased HOMA-IR values (P < 0.05) and increased ISI were observed in the HFD-
RES/H group (P < 0.05).
Figure 1 Effects of RES treatment on body weight curve, body weight gain and subcutaneous/
visceral adipose coefficients of mice in response to resveratrol treatment. (A) Body weight curve;
(B) Body weight gain; (C) SAT coefficient; (D) VAT coefficient. aa, P < 0.01 vs. the STD group; b, P < 0.05
vs. the HFD group. Time�� indicates exposure duration. Diet�� indicates the variety of diet. Time �diet�� indicates the interaction effect between treatment duration and variety of diet. Data are expressed
as the mean ± SD. Full-size DOI: 10.7717/peerj.5173/fig-1
Ding et al. (2018), PeerJ, DOI 10.7717/peerj.5173 7/18

Effects of RES treatment on serum metabolic parametersFigure 3 shows the serum metabolic parameters and hepatic lipid levels after HFD
treatment and RES administration. The TG, TC and LDL levels in serum of the HFD-fed
groups were significantly higher than those in the STD group (P < 0.01). Furthermore,
decreased serum HDL was observed in the HFD-fed groups compared to that in the STD
group (P < 0.01). In addition, RES (400 mg/kg/day) treatment significantly decreased the
TG and TC levels in serum of the HFD-fed mice (P < 0.01 or P < 0.05). Compared to those
in the HFD group, significantly increased serum HDL levels and decreased LDL levels
were observed in the RES-treated groups (P < 0.01 or P < 0.05). No significant differences
in TG, TC, HDL and LDL levels in the serum were observed between the HFD-RES/L
group and HFD-RES/H group (P > 0.05).
Effects of RES treatment on serum cytokinesAs shown in Fig. 4, the levels of serum MCP-1, TNF-a and IL-6 in the HFD-fed
groups were markedly increased compared to those in the STD group (P < 0.01).
RES (400 mg/kg/day) treatment decreased the serum MCP-1, TNF-a and IL-6 levels
in the HFD groups (P < 0.05 or P < 0.01). However, the low dose of RES
(200 mg/kg/day) treatment only decreased the serum MCP-1 level in HFD-fed
mice (P < 0.05).
Figure 2 Effects of resveratrol treatment on glucose homeostasis in mice. (A) Blood glucose during
IPGTT after 17-week treatment; (B) AUC of IPGTT; (C) HOMA-IR; (D) Insulin sensitivity index.
Full-size DOI: 10.7717/peerj.5173/fig-2
Ding et al. (2018), PeerJ, DOI 10.7717/peerj.5173 8/18

Effects of RES treatment on mRNA and protein expression of amacrophage marker in SAT and VATWe used immunohistochemistry and real-time PCR with the macrophage marker F4/80
to assess the infiltration of total macrophages in SAT and VAT (See Fig. 5). Significantly
increased F4/80 mRNA and protein expression in SAT and VAT were observed in the
HFD groups when compared to that in the STD group (P < 0.01). Compared to that in the
HFD group, the mRNA and protein expression of F4/80 was significantly decreased in
RES-treated mice (P < 0.05).
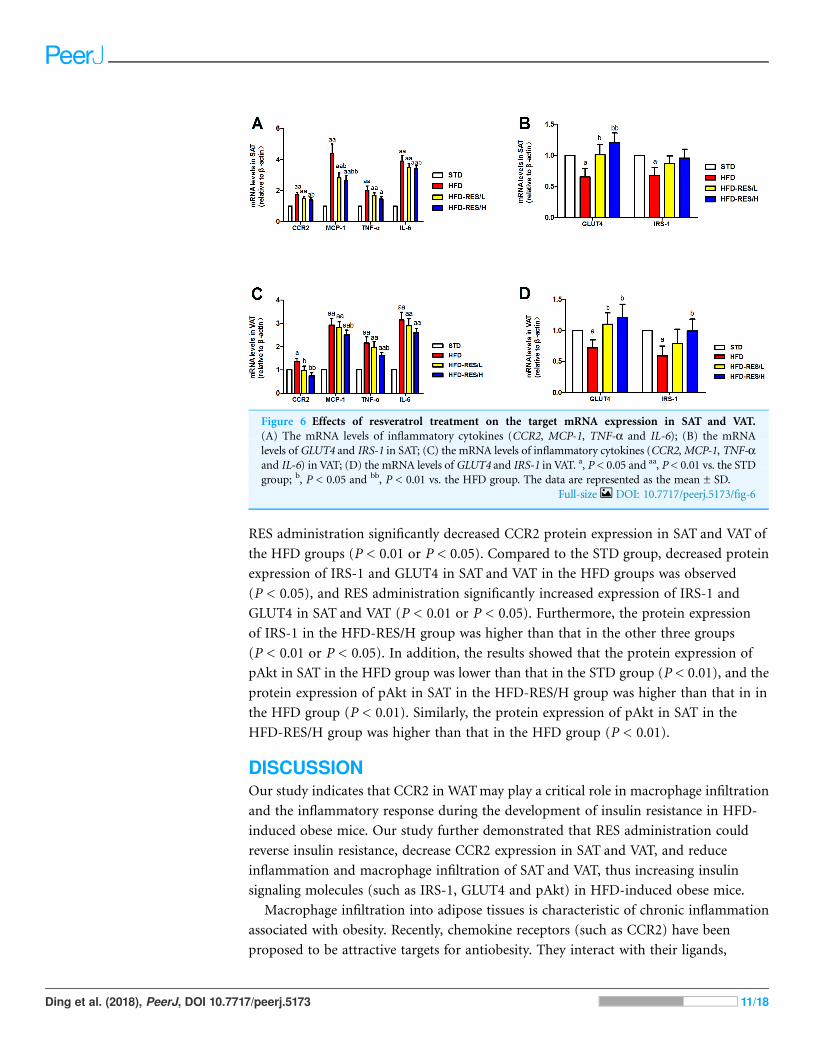
Effects of RES treatment on mRNA expression in SAT and VATof miceAs shown in Fig. 6, we determined the effect of RES administration on the mRNA
expression of inflammatory cytokines (CCR2, MCP-1, TNF-a and IL-6), GLUT4 and
IRS-1 in SAT and VAT. Levels of CCR2, MCP-1, TNF-a and IL-6 in SAT and VAT were
significantly increased in the HFD groups compared to those in the STD group (P < 0.01).
RES administration significantly decreased the mRNA levels of CCR2, MCP-1 and IL-6
in SAT in the HFD mice compared to that in the HFD mice (P < 0.01 or P < 0.05).
Moreover, RES administration significantly decreased the mRNA levels of CCR2, MCP-1
and TNF-a in VAT in the HFD mice (P < 0.01 or P < 0.05). In contrast, the mRNA
Figure 3 Effects of resveratrol treatment on serum metabolic parameters. (A) Serum TG; (B) Serum
TC; (C) Serum HDL; (D) Serum LDL. aa, P < 0.01 vs. the STD group; b, P < 0.05 and bb, P < 0.01 vs. the
HFD group. The data are represented as the mean ± SD. Full-size DOI: 10.7717/peerj.5173/fig-3
Ding et al. (2018), PeerJ, DOI 10.7717/peerj.5173 9/18

expression levels of GLUT4 and IRS-1 in SAT and VAT were markedly decreased in the
HFD groups compared to those in the STD group (P < 0.05). The mRNA expression
of GLUT4 in SATwas significantly increased by RES administration (P < 0.01 or P < 0.05).
Furthermore, the mRNA expression of GLUT4 and IRS-1 in VAT was also markedly
increased by RES administration (P < 0.05).
Effects of RES treatment on protein expression levels in SAT and VATin miceChanges in protein expression of CCR2, GLUT4, IRS-1 and pAkt were measured using
Western blot analysis (see Fig. 7). CCR2 protein expression was markedly increased in
SAT and VAT in the HFD group compared to that in the STD group (P < 0.05).
Figure 4 Effects of resveratrol treatment on serum cytokines. (A)MCP-1; (B) TNF-a; (C) IL-6. a, P< 0.05
and aa, P < 0.01 vs. the STD group; b, P < 0.05 and bb, P < 0.01 vs. the HFD group. The data are represented as
the mean ± SD. Full-size DOI: 10.7717/peerj.5173/fig-4
Figure 5 Effects of resveratrol treatment on mRNA and protein expression levels of a macrophage
marker in SATand VAT. (A) Immunohistochemistry staining of F4/80 (total macrophages) in SAT and
VAT; (B) quantitative expression of F4/80 (total macrophages) is shown as relative density in SAT and
VAT; (C) the mRNA expression of F4/80 in SAT and VAT. Original magnification is �200 (scale bar =
100 mm). aa, P < 0.01 vs. the STD group; b, P < 0.05 vs. the HFD group. The data are represented as the
mean ± SD. Full-size DOI: 10.7717/peerj.5173/fig-5
Ding et al. (2018), PeerJ, DOI 10.7717/peerj.5173 10/18
RES administration significantly decreased CCR2 protein expression in SAT and VAT of
the HFD groups (P < 0.01 or P < 0.05). Compared to the STD group, decreased protein
expression of IRS-1 and GLUT4 in SAT and VAT in the HFD groups was observed
(P < 0.05), and RES administration significantly increased expression of IRS-1 and
GLUT4 in SAT and VAT (P < 0.01 or P < 0.05). Furthermore, the protein expression
of IRS-1 in the HFD-RES/H group was higher than that in the other three groups
(P < 0.01 or P < 0.05). In addition, the results showed that the protein expression of
pAkt in SAT in the HFD group was lower than that in the STD group (P < 0.01), and the
protein expression of pAkt in SAT in the HFD-RES/H group was higher than that in in
the HFD group (P < 0.01). Similarly, the protein expression of pAkt in SAT in the
HFD-RES/H group was higher than that in the HFD group (P < 0.01).
DISCUSSIONOur study indicates that CCR2 in WATmay play a critical role in macrophage infiltration
and the inflammatory response during the development of insulin resistance in HFD-
induced obese mice. Our study further demonstrated that RES administration could
reverse insulin resistance, decrease CCR2 expression in SAT and VAT, and reduce
inflammation and macrophage infiltration of SAT and VAT, thus increasing insulin
signaling molecules (such as IRS-1, GLUT4 and pAkt) in HFD-induced obese mice.
Macrophage infiltration into adipose tissues is characteristic of chronic inflammation
associated with obesity. Recently, chemokine receptors (such as CCR2) have been
proposed to be attractive targets for antiobesity. They interact with their ligands,
Figure 6 Effects of resveratrol treatment on the target mRNA expression in SAT and VAT.
(A) The mRNA levels of inflammatory cytokines (CCR2, MCP-1, TNF-a and IL-6); (B) the mRNA
levels of GLUT4 and IRS-1 in SAT; (C) the mRNA levels of inflammatory cytokines (CCR2,MCP-1, TNF-aand IL-6) in VAT; (D) the mRNA levels of GLUT4 and IRS-1 in VAT. a, P < 0.05 and aa, P < 0.01 vs. the STD
group; b, P < 0.05 and bb, P < 0.01 vs. the HFD group. The data are represented as the mean ± SD.
Full-size DOI: 10.7717/peerj.5173/fig-6
Ding et al. (2018), PeerJ, DOI 10.7717/peerj.5173 11/18

increasing inflammatory cells in adipose tissue, and further contribute to chronic
inflammation and insulin resistance in obesity (Ota, 2013). Increasing evidence has shown
that CCR2 could promote the macrophage recruitment and infiltration of tissue in the
pathogenesis of insulin resistance (Huh et al., 2017; Kanda et al., 2006). Thus, we studied
the role of CCR2 in SAT and VAT during the development of insulin resistance related
to obesity. Consistent with the increased expression of serum inflammatory cytokines
(such as MCP-1, TNF-a and IL-6) in obese mice, we demonstrated that the expression
of CCR2 and macrophage infiltration in SAT and VAT were significantly increased in
diet-induced obese mice. This was also observed in other studies of WAT in diet-induced
obese rodent models (Kim et al., 2017; Weisberg et al., 2006). In vitro, RES inhibited the
mRNA and protein expression in CCR2 of THP-1 monocytes (Cullen et al., 2007). Here,
we found that concomitant with a decrease in CCR2 expression and total macrophage
F4/80 in SAT and VAT, proinflammatory cytokines in serum and mRNA levels of
Figure 7 Effects of resveratrol treatment on the protein expression of CCR2, IRS-1, pAkt (phosphorylation at Ser 473) and GLUT4 in SATand
VAT. (A) Western blots of CCR2 and insulin signaling molecules in SAT; (B) Western blots of CCR2 and insulin signaling molecules in VAT; (C–F)
CCR2, IRS-1, pAkt and GLUT4 protein expression levels in SAT; (G–J) CCR2, IRS-1, pAkt and GLUT4 protein expression levels in VAT. a, P < 0.05
and aa, P < 0.01 vs. the STD group; b, P < 0.05 and bb, P < 0.01 vs. the HFD group; c, P < 0.05 vs. the HFD-RES/L group. The data are represented as
the mean ± SD. Full-size DOI: 10.7717/peerj.5173/fig-7
Ding et al. (2018), PeerJ, DOI 10.7717/peerj.5173 12/18

inflammatory cytokines in WAT were significantly reduced in RES-treated obese mice.
These results suggest that CCR2 expression decreased by RES treatment may play a
vital role in the reduced migration of total macrophages and subsequent inflammation
in adipose tissues.
In population experiments, whether RES administration could improve glucose
metabolism disorder is inconclusive. Studies performed in patients with T2DM (Bhatt,
Thomas & Nanjan, 2012) and healthy obese men (Timmers et al., 2011) observed the
beneficial effects of RES administration for three months and four weeks, respectively,
on systemic insulin sensitivity. However, another study conducted in normal-weight,
healthy individuals did not demonstrate improved glucose metabolism after RES
administration for six weeks (Ghanim et al., 2010). These contradictory results indicate
that RES treatment may have a beneficial effect on glucose metabolism disorders in obese
individuals rather than normal-weight individuals, and excess adipose tissues may be
the target for RES for alleviating disordered glucose mechanisms in individuals. In our
study, we observed that RES administration significantly reduced the AUC, improved
HOMA-IR and increased insulin sensitivity in HFD-induced obese mice, which suggests
that RES improved glucose intolerance and glucose homeostasis. In corroboration with
our findings, some rodent studies have also reported that RES treatment ameliorated
insulin resistance in HFD animals for eight weeks (Chen et al., 2011; Haohao et al., 2015).
Long-term IL-6 or TNF-a treatment inhibits the expression of GLUT4 and IRS-1 in
adipose tissue (Hotamisligil et al., 1996; Rotter, Nagaev & Smith, 2003), and in obese
patients with T2DM, lower levels of GLUT4 and IRS-1 in VAT were observed
(Georgescu et al., 2011; Lancha et al., 2015). In addition, glucose disposal in WAT is
affected by misleading insulin signaling via a reduction in the PI3K/pAkt signaling
pathway (Muthusamy et al., 2010). The above results indicate that inflammatory cytokines
contribute substantially to driving the abnormal insulin signaling cascade of WAT in
obesity, leading to a worsening of whole-body insulin resistance and glucose intolerance.
Our results demonstrated that long-term RES administration alleviated abnormal
insulin signaling cascades in WATof HFD-induced obese mice by increasing the levels of
IRS-1 and GLUT4 and enhancing the phosphorylation level of the Akt protein. In line
with our findings, Jimenez-Gomez et al. (2013) also found that chronic administration
of RES exerts an anti-inflammatory effect and improves adipose insulin signaling in
adipose tissue of high-fat, high-sugar diet-fed rhesus monkeys. Moreover, improved
insulin resistance via inhibition of TNF-a and TNF-a-mediated inflammation by RES
treatment were observed in 3T3-L1 adipocytes (Zhang, Du & Meng, 2013) and in primary
human adipocytes (Chuang et al., 2010). In this paper, we showed that RES administration
for 18 weeks markedly decreased the SAT coefficient and prevented dyslipidemia in
HFD-fed mice. In agreement with our study, Chen et al. (2017) also reported that RES
(400 mg/kg/day) treatment for three months provided protection against diet-induced
dyslipidemia in C57BL/6 mice. Studies have demonstrated that RES treatment has fat
mobilization and antiobesity effects in rodents (Baile et al., 2011), and also significantly
reduced the body weight gain of female Wistar rats and ovariectomized female Wistar
rats (Sharma, Sharma & Thungapathra, 2017). In this study, we observed that the RES
Ding et al. (2018), PeerJ, DOI 10.7717/peerj.5173 13/18

intervention did not significantly reduce the body weight of mice; however, we
detected a trend of reduced body weight in mice treated with RES.
CONCLUSIONIn conclusion, our results indicate that RES administration could increase CCR2
expression in WAT, alleviate inflammation and macrophage infiltration to improve the
expression of classical markers of the insulin signaling cascade in SAT and VAT, and
maintain glucose metabolic homeostasis in diet-induced obese mice. Thus, the current
study highlights the potential clinical utility of RES administration in attenuating
macrophage-induced inflammation in adipose tissue and preventing obesity-related
metabolic diseases.
ACKNOWLEDGEMENTSWe thank all the members in our academic group for helping us complete the
experiments.
ADDITIONAL INFORMATION AND DECLARATIONS
FundingThis work was supported by the Key Scientific Research Project of Universities in Henan
Province (No.16A330002) and the Scientific Research Fund of Xinxiang Medical
University (No.2014QN107). The funders had no role in study design, data collection and
analysis, decision to publish, or preparation of the manuscript.
Grant DisclosuresThe following grant information was disclosed by the authors:
Key Scientific Research Project of Universities in Henan Province: No.16A330002.
Scientific Research Fund of Xinxiang Medical University: No.2014QN107.
Competing InterestsThe authors declare that they have no competing interests.
Author Contributions� Shibin Ding conceived and designed the experiments, performed the experiments,
contributed reagents/materials/analysis tools, prepared figures and/or tables, authored
or reviewed drafts of the paper, approved the final draft.
� Jinjin Jiang conceived and designed the experiments, contributed reagents/materials/
analysis tools, prepared figures and/or tables, authored or reviewed drafts of the paper,
approved the final draft.
� Zhe Wang performed the experiments, approved the final draft.
� Guofu Zhang analyzed the data, approved the final draft.
� Jianli Yin performed the experiments, approved the final draft.
� Xiaoya Wang performed the experiments, approved the final draft.
� Sui Wang performed the experiments, approved the final draft.
Ding et al. (2018), PeerJ, DOI 10.7717/peerj.5173 14/18

� Zengli Yu conceived and designed the experiments, contributed reagents/materials/
analysis tools, authored or reviewed drafts of the paper, approved the final draft.
Field Study PermissionsThe following information was supplied relating to field study approvals (i.e., approving
body and any reference numbers):
Field experiments were approved by the Xinxiang Medical University Animal Care and
Use Committee (XXMU-2016-0007).
Data AvailabilityThe following information was supplied regarding data availability:
The raw data are provided in the Supplemental Files.
Supplemental InformationSupplemental information for this article can be found online at http://dx.doi.org/
10.7717/peerj.5173#supplemental-information.
REFERENCESBaile CA, Yang JY, Rayalam S, Hartzell DL, Lai CY, Andersen C, Della-Fera MA. 2011. Effect of
resveratrol on fat mobilization. Annals of the New York Academy of Sciences 1215(1):40–47
DOI 10.1111/j.1749-6632.2010.05845.x.
Bhatt JK, Thomas S, Nanjan MJ. 2012. Resveratrol supplementation improves glycemic control in
type 2 diabetes mellitus. Nutrition Research 32(7):537–541 DOI 10.1016/j.nutres.2012.06.003.
BolusWR, Gutierrez DA, Kennedy AJ, Anderson-Baucum EK, Hasty AH. 2015. CCR2 deficiency
leads to increased eosinophils, alternative macrophage activation, and type 2 cytokine
expression in adipose tissue. Journal of Leukocyte Biology 98(4):467–477
DOI 10.1189/jlb.3HI0115-018R.
Chen L, Wang T, Chen G, Wang N, Gui L, Dai F, Fang Z, Zhang Q, Lu Y. 2017. Influence of
resveratrol on endoplasmic reticulum stress and expression of adipokines in adipose tissues/
adipocytes induced by high-calorie diet or palmitic acid. Endocrine 55(3):773–785
DOI 10.1007/s12020-016-1212-2.
Chen LL, Zhang HH, Zheng J, Hu X, Kong W, Hu D, Wang SX, Zhang P. 2011. Resveratrol
attenuates high-fat diet-induced insulin resistance by influencing skeletal muscle lipid transport
and subsarcolemmal mitochondrial b-oxidation. Metabolism 60(11):1598–1609
DOI 10.1016/j.metabol.2011.04.002.
Chuang CC, Martinez K, Xie G, Kennedy A, Bumrungpert A, Overman A, Jia W, McIntosh MK.
2010. Quercetin is equally or more effective than resveratrol in attenuating tumor necrosis
factor-a–mediated inflammation and insulin resistance in primary human adipocytes.
American Journal of Clinical Nutrition 92(6):1511–1521 DOI 10.3945/ajcn.2010.29807.
Cullen JP, Morrow D, Jin Y, von Offenberg Sweeney N, Sitzmann JV, Cahill PA, Redmond EM.
2007. Resveratrol inhibits expression and binding activity of the monocyte chemotactic
protein-1 receptor, CCR2, on THP-1 monocytes. Atherosclerosis 195(1):e125–e133
DOI 10.1016/j.atherosclerosis.2007.03.039.
Cote CD, Rasmussen BA, Duca FA, Zadeh-Tahmasebi M, Baur JA, Daljeet M, Breen DM,
Filippi BM, Lam TKT. 2015. Resveratrol activates duodenal Sirt1 to reverse insulin resistance in
rats through a neuronal network. Natural Medicines 21(5):498–505 DOI 10.1038/nm.3821.
Ding et al. (2018), PeerJ, DOI 10.7717/peerj.5173 15/18

Ding S, Fan Y, Zhao N, Yang H, Ye X, He D, Jin X, Liu J, Tian C, Li H, Xu S, Ying C. 2014.
High-fat diet aggravates glucose homeostasis disorder caused by chronic exposure to
bisphenol A. Journal of Endocrinology 221(1):167–179 DOI 10.1530/JOE-13-0386.
Ding S, Jiang J, Zhang G, Bu Y, Zhang G, Zhao X. 2017. Resveratrol and caloric restriction
prevent hepatic steatosis by regulating SIRT1-autophagy pathway and alleviating endoplasmic
reticulum stress in high-fat diet-fed rats. PLOS ONE 12(8):e0183541
DOI 10.1371/journal.pone.0183541.
Fjeldborg K, Pedersen SB, Moller HJ, Christiansen T, Bennetzen M, Richelsen B. 2014.
Human adipose tissue macrophages are enhanced but changed to an anti-inflammatory profile
in obesity. Journal of Immunology Research 2014:1–10 DOI 10.1155/2014/309548.
Georgescu A, Popov D, Constantin A, Nemecz M, Alexandru N, Cochior D, Tudor A. 2011.
Dysfunction of human subcutaneous fat arterioles in obesity alone or obesity associated with
Type 2 diabetes. Clinical Science 120(10):463–472 DOI 10.1042/CS20100355.
Ghanim H, Sia CL, Abuaysheh S, Korzeniewski K, Patnaik P, Marumganti A, Chaudhuri A,
Dandona P. 2010. An antiinflammatory and reactive oxygen species suppressive effects of an
extract of Polygonum cuspidatum containing resveratrol. Journal of Clinical Endocrinology and
Metabolism 95(9):E1–E8 DOI 10.1210/jc.2010-0482.
Haohao Z, Guijun Q, Juan Z, Wen K, Lulu C. 2015. Resveratrol improves high-fat diet
induced insulin resistance by rebalancing subsarcolemmal mitochondrial oxidation
and antioxidantion. Journal of Physiology and Biochemistry 71(1):121–131
DOI 10.1007/s13105-015-0392-1.
Harford KA, Reynolds CM, McGillicuddy FC, Roche HM. 2011. Fats, inflammation and insulin
resistance: insights to the role of macrophage and T-cell accumulation in adipose tissue.
Proceedings of the Nutrition Society 70(4):408–417 DOI 10.1017/S0029665111000565.
Hotamisligil GS, Peraldi P, Budavari A, Ellis R, White MF, Spiegelman BM. 1996. IRS-1-
mediated inhibition of insulin receptor tyrosine kinase activity in TNF-a-and obesity-induced
insulin resistance. Science 271(5249):665–670 DOI 10.1126/science.271.5249.665.
Huh JH, Kim HM, Lee ES, Kwon MH, Lee BR, Ko HJ, Chung CH. 2017. Dual CCR2/5 antagonist
attenuates obesity-induced insulin resistance by regulating macrophage recruitment and M1/
M2 status. Obesity 26(2):378–386 DOI 10.1002/oby.22103.
Jimenez-Gomez Y, Mattison JA, Pearson KJ, Martin-Montalvo A, Palacios HH, Sossong AM,
Ward TM, Younts CM, Lewis K, Allard JS, Longo DL, Belman JP, Malagon MM, Navas P,
Sanghvi M, Moaddel R, Tilmont EM, Herbert RL, Morrell CH, Egan JM, Baur JA, Ferrucci L,
Bogan JS, Bernier M, de Cabo R. 2013. Resveratrol improves adipose insulin signaling and
reduces the inflammatory response in adipose tissue of rhesus monkeys on high-fat, high-sugar
diet. Cell Metabolism 18(4):533–545 DOI 10.1016/j.cmet.2013.09.004.
Kanda H, Tateya S, Tamori Y, Kotani K, Hiasa K, Kitazawa R, Kitazawa S, Miyachi H, Maeda S,
Egashira K, Kasuga M. 2006. MCP-1 contributes to macrophage infiltration into adipose
tissue, insulin resistance, and hepatic steatosis in obesity. Journal of Clinical Investigation
116(6):1494–1505 DOI 10.1172/JCI26498.
Kelly T, Yang W, Chen CS, Reynolds K, He J. 2008. Global burden of obesity in 2005 and
projections to 2030. International Journal of Obesity 32(9):1431–1437
DOI 10.1038/ijo.2008.102.
Kim J, Chung K, Choi C, Beloor J, Ullah I, Kim N, Lee KY, Lee SK, Kumar P. 2016. Silencing
CCR2 in macrophages alleviates adipose tissue inflammation and the associated metabolic
syndrome in dietary obese mice. Molecular Therapy—Nucleic Acids 5:e280
DOI 10.1038/mtna.2015.51.
Ding et al. (2018), PeerJ, DOI 10.7717/peerj.5173 16/18

Kim HM, Kim YM, Huh JH, Lee ES, Kwon MH, Lee BR, Ko HJ, Chung CH. 2017. a-Mangostin
ameliorates hepatic steatosis and insulin resistance by inhibition C-C chemokine receptor 2.
PLOS ONE 12(6):e0179204 DOI 10.1371/journal.pone.0179204.
Kim HM, Lee ES, Lee BR, Yadav D, Kim YM, Ko HJ, Park KS, Lee EY, Chung CH. 2015.
C-C chemokine receptor 2 inhibitor ameliorates hepatic steatosis by improving ER stress
and inflammation in a type 2 diabetic mouse model. PLOS ONE 10(3):e0120711
DOI 10.1371/journal.pone.0120711.
Lagouge M, Argmann C, Gerhart-Hines Z, Meziane H, Lerin C, Daussin F, Messadeq N, Milne J,
Lambert P, Elliott P, Geny B, Laakso M, Puigserver P, Auwerx J. 2006. Resveratrol improves
mitochondrial function and protects against metabolic disease by activating SIRT1 and
PGC-1a. Cell 127(6):1109–1122 DOI 10.1016/j.cell.2006.11.013.
Lancha A, Lopez-Garrido S, Rodriguez A, Catalan V, Ramirez B, Valenti V, Moncada R, Silva C,
Gil MJ, Salvador J, Fruhbeck G, Gomez-Ambrosi J. 2015. Expression of syntaxin 8 in visceral
adipose tissue is increased in obese patients with type 2 diabetes and related to markers of
insulin resistance and inflammation. Archives of Medical Research 46(1):47–53
DOI 10.1016/j.arcmed.2014.12.003.
Marmugi A, Ducheix S, Lasserre F, Polizzi A, Paris A, Priymenko N, Bertrand-Michel J,
Pineau T, Guillou H, Martin PGP, Mselli-Lakhal L. 2012. Low doses of bisphenol A induce
gene expression related to lipid synthesis and trigger triglyceride accumulation in adult mouse
liver. Hepatology 55(2):395–407 DOI 10.1002/hep.24685.
Michaud A, Drolet R, Noel S, Paris G, Tchernof A. 2012. Visceral fat accumulation is an indicator
of adipose tissue macrophage infiltration in women. Metabolism 61(5):689–698
DOI 10.1016/j.metabol.2011.10.004.
Muthusamy VS, Saravanababu C, Ramanathan M, Bharathi Raja R, Sudhagar S, Anand S,
Lakshmi BS. 2010. Inhibition of protein tyrosine phosphatase 1B and regulation of insulin
signalling markers by caffeoyl derivatives of chicory (Cichorium intybus) salad leaves.
British Journal of Nutrition 104(6):813–823 DOI 10.1017/S0007114510001480.
Ota T. 2013. Chemokine systems link obesity to insulin resistance. Diabetes & Metabolism Journal
37(3):165–172 DOI 10.4093/dmj.2013.37.3.165.
Pan QR, Ren YL, Liu WX, Hu YJ, Zheng JS, Xu Y, Wang G. 2015. Resveratrol prevents hepatic
steatosis and endoplasmic reticulum stress and regulates the expression of genes involved in
lipid metabolism, insulin resistance, and inflammation in rats. Nutrition Research
35(7):576–584 DOI 10.1016/j.nutres.2015.05.006.
Park S, Park HL, Lee SY, Nam JH. 2016. Characteristics of adipose tissue macrophages and
macrophage-derived insulin-like growth factor-1 in virus-induced obesity. International Journal
of Obesity 40(3):460–470 DOI 10.1038/ijo.2015.194.
Pradhan A. 2007.Obesity, metabolic syndrome, and type 2 diabetes: inflammatory basis of glucose
metabolic disorders.Nutrition Reviews 65:S152–S156 DOI 10.1111/j.1753-4887.2007.tb00354.x.
Qatanani M, Lazar MA. 2007. Mechanisms of obesity-associated insulin resistance: many choices
on the menu. Genes & Development 21(12):1443–1455 DOI 10.1101/gad.1550907.
Rotter V, Nagaev I, Smith U. 2003. Interleukin-6 (IL-6) induces insulin resistance in 3T3-L1
adipocytes and is, like IL-8 and tumor necrosis factor-a, overexpressed in human fat cells from
insulin-resistant subjects. Journal of Biological Chemistry 278(46):45777–45784
DOI 10.1074/jbc.M301977200.
Schueller K, Pignitter M, Somoza V. 2015. Sulfated and glucuronated trans-resveratrol
metabolites regulate chemokines and sirtuin-1 expression in U-937 macrophages. Journal of
Agricultural and Food Chemistry 63(29):6535–6545 DOI 10.1021/acs.jafc.5b01830.
Ding et al. (2018), PeerJ, DOI 10.7717/peerj.5173 17/18

Sharma R, Sharma NK, Thungapathra M. 2017. Resveratrol regulates body weight in healthy and
ovariectomized rats. Nutrition and Metabolism 14(1):30 DOI 10.1186/s12986-017-0183-5.
Sullivan TJ, Miao Z, Zhao BN, Ertl LS, Wang Y, Krasinski A, Walters MJ, Powers JP,
Dairaghi DJ, Baumgart T, Seitz LC, Berahovich RD, Schall TJ, Jaen JC. 2013. Experimental
evidence for the use of CCR2 antagonists in the treatment of type 2 diabetes. Metabolism
62(11):1623–1632 DOI 10.1016/j.metabol.2013.06.008.
Timmers S, Konings E, Bilet L, Houtkooper RH, van de Weijer T, Goossens GH, Hoeks J,
van der Krieken S, Ryu D, Kersten S, Moonen-Kornips E, Hesselink MKC, Kunz I,
Schrauwen-Hinderling VB, Blaak E, Auwerx J, Schrauwen P. 2011. Calorie restriction-like
effects of 30 days of resveratrol supplementation on energy metabolism and metabolic profile
in obese humans. Cell Metabolism 14(5):612–622 DOI 10.1016/j.cmet.2011.10.002.
Wang M, Gao XJ, Zhao WW, Zhao WJ, Jiang CH, Huang F, Kou JP, Liu BL, Liu K. 2013.
Opposite effects of genistein on the regulation of insulin-mediated glucose homeostasis in
adipose tissue. British Journal of Pharmacology 170(2):328–340 DOI 10.1111/bph.12276.
Weisberg SP, Hunter D, Huber R, Lemieux J, Slaymaker S, Vaddi K, Charo I, Leibel RL,
Ferrante AW Jr. 2006. CCR2 modulates inflammatory and metabolic effects of high-fat feeding.
Journal of Clinical Investigation 116(1):115–124 DOI 10.1172/JCI24335.
Xu H, Barnes GT, Yang Q, Tan G, Yang D, Chou CJ, Sole J, Nichols A, Ross JS, Tartaglia LA,
Chen H. 2003. Chronic inflammation in fat plays a crucial role in the development of
obesity-related insulin resistance. Journal of Clinical Investigation 112(12):1821–1830
DOI 10.1172/JCI19451.
Zhang HY, Du ZX, Meng X. 2013. Resveratrol prevents TNFa-induced suppression of
adiponectin expression via PPAR� activation in 3T3-L1 adipocytes. Clinical and Experimental
Medicine 13(3):193–199 DOI 10.1007/s10238-012-0189-2.
ZhaoW, Li A, Feng X, Hou T, Liu K, Liu B, Zhang N. 2016.Metformin and resveratrol ameliorate
muscle insulin resistance through preventing lipolysis and inflammation in hypoxic adipose
tissue. Cellular Signalling 28(9):1401–1411 DOI 10.1016/j.cellsig.2016.06.018.
Zheng C, Yang Q, Xu C, Shou P, Cao J, Jiang M, Chen Q, Cao G, Han Y, Li F, Cao W, Zhang L,
Shi Y, Wang Y. 2015. CD11b regulates obesity-induced insulin resistance via limiting alternative
activation and proliferation of adipose tissue macrophages. Proceedings of the National Academy
of Sciences of the United States of America 112:E7239–E7248 DOI 10.1073/pnas.1500396113.
Ding et al. (2018), PeerJ, DOI 10.7717/peerj.5173 18/18