Embed Size (px)
Citation preview

®
®
Win-Partners Co., Ltd. (3183)
Results Presentation 2Q FY March 2020

2Q results ending September 2019

Consolidated results summary
(¥mil)2Q to Sep 2018 Sep 2019 YoY RE(Aug9)
Sales 31,863 33,144 +4.0% 32,500
Operating profit 1,276 1,458 +14.3% 1,310
Recurring profit 1,273 1,455 +14.3% 1,310
Net profit 896 1,047 +16.8% 950
31.22 36.48
621.01 685.41 BPS (yen)
EPS (yen)
3

31,863
33,144
2Q to Sep 2018 2Q to Sep 2019
Like-for-like sales +0.2% (excluding MCI consolidated last December)
Sales to a major customer dropped significantly from June (particularly PCI, CRS, CVS)
Achieved revised estimate except PCI segment
Highlights
(¥mil)
Sales + 4 % YoY
vs. RE
+2%
4

Sales breakdown by segment Sales(¥mil) Volume Value (%) Change (pt)
9,849 -5.2 -3.5 29.7 -2.3
8,944 -3.0 +2.7 27.0 -0.3
4,669 -2.2 +0.6 14.1 -0.5
1,789 +6.6 +10.9 5.4 +0.3
1,322 +11.6 +13.6 4.0 +0.3
1,060 - +25.1 3.2 +0.5
1,996 - +30.5 6.0 +1.2
3,513 - +11.3 10.6 +0.7
33,144 - +4.0 100.0
Brain surgery
Diabetes mellitus segment (DMS)
Large-sized medical equipment
Others
TOTAL
Percutaneous coronary intervention (PCI)
Cardiac rhythm segment (CRS)
Cardiac vascular segment (CVS)
Percutaneous peripheral intervention (PPI)
YoY growth (%) % of sales
5

PCI
Segment review
suffered from a major customer’s drop although number of cases stopped falling at existing customer basis Drug eluting balloon (DEB) increased while DES decreased
CRS
CVS
PPI
enjoyed increased number of projects
posted higher sales of pacemakers EP Ablation related products decreased slightly suffered from a major customer’s drop
posted higher sales of TAVI related products Stent graft decreased suffered from a major customer’s drop
posted higher sales of drug coating balloon (DCB) and drug eluting stent (DES)
[vs. RE]
6
posted higher sales of smaller equipment and accessories

1,276
1,458
2Q to Sep 2018 2Q to Sep 2019
Highlights
(¥mil)
Gross profit margin 12.7% (+0.2pp YoY) - Contribution from MCI - Cost reduction through bulk purchasing - Improvement of large equipment’s margin
SG&A +2% YoY
- Labor cost (+5.5%)
- Number of employees:527 → 548
OP exceeded revised estimate due to higher sales & lower than expected SG&A
(Sep 2018) (Sep 2019)
+14.3% Operating
profit YoY
vs. RE
+11%
7

896
1,047
2Q to Sep 2018 2Q to Sep 2019
Extraordinary profit boosted net profit - ¥82mil income from silent partnership investment (MCI)
(¥mil)
Highlights
Net profit YoY
vs. RE
+10% +16.8%
8

Consolidated income statements (¥mil) (%) (¥mil) (%)
Sales 31,863 100.0 33,144 100.0
Cost of sales 27,890 87.5 28,934 87.3
Gross profit 3,973 12.5 4,210 12.7
SG&A expenses 2,696 8.5 2,751 8.3
Operating profit 1,276 4.0 1,458 4.4
Non-operating profit 2 0.0 6 0.0
Non-operating expenses 5 0.0 8 0.0
Recurring profit 1,273 4.0 1,455 4.4
Extraordinary profit 0 0.0 82 0.2
Extraordinary loss 1 0.0 0 0.0
Pretax profit 1,272 4.0 1,538 4.6
Taxes 376 1.2 491 1.5
Net profit 896 2.8 1,047 3.2
2Q to Sep 2018 Sep 2019
9

Consolidated balance sheet Change
(¥mil) (%) (¥mil) (%) (¥mil)
Current assets 36,754 92.1 34,587 91.8 -2,166
Cash and deposits 15,289 38.3 16,499 43.8 1,209 Accounts receivable 18,361 46.0 15,147 40.2 -3,214 Inventory 2,335 5.9 2,218 5.9 -116 Other current assets 767 1.9 722 1.9 -44
Fixed assets 3,156 7.9 3,084 8.2 -71
Total assets 39,910 100.0 37,672 100.0 -2,238
Current liabilities 19,439 48.7 17,027 45.2 -2,411
Accounts payable 18,168 45.5 15,885 42.2 -2,282 Taxes payable 484 1.2 530 1.4 45 Other current liabilities 786 2.0 611 1.6 -174
Fixed liabilities 924 2.3 967 2.6 43
Total liabilities 20,363 51.0 17,995 47.8 -2,368
Net assets 19,547 49.0 19,676 52.2 129Total liabilities,
net assets39,910 100.0 37,672 100.0 -2,238
Mar 2019 Sep 2019
10
Major
customer’s
drop

Consolidated cashflow statements
Sep 2018 Sep 2019
Cash flows from operating activities 1,327 2,144Net profit before taxes 1,272 1,538Depreciation 115 94Notes and accounts receivable 1,468 3,214Inventories -512 129Notes and accounts payable -151 -2,282Tax paid -490 -513Other -373 -37
Cash flows from investing activities -59 -16Purchase of tangible assets -53 -65Other -5 49
Cash flows from financing activities -832 -918Cash dividends paid -832 -918Other 0 -
Net increase in cash and cash equivalents 435 1,209
Cash and cash equivalents at beginning of FY 13,317 10,289
Cash and cash equivalents at the end of 2Q 13,752 11,499
(¥mil) 2Q to
11

Outlook

Measures for earnings recovery
① New customer acquisition Opened Yamato branch office in Kanagawa pref. (July)
Develop in Shizuoka, Sapporo, Akita and new regions (Organic & M&A)
② Customer share expansion Explore replacement demand for large equipment
③ Gross margin improvement Expand items for bulk purchasing
④ Tighter SG&A control Freeze new hire [No. of employees] initial E 584 → 560 (Mar 2020E)
⑤ Appeal of our role and value to customers Promote our services to secure safety and quality at clinical sites
and increase the value of hospital
13

Stent made by CompanyB
Guiding catheter made by E
Yconnector made by G
Guidewire made by D
PTCA balloon catheter made by Company A
Indeflator made by I
IVUS catheter made by C
Sheath made by F
PCI not completed with one company’s products
Procurement of optimal devices from wide variety, delivery and inventory control
Our role
14
Modality made by H

PTCA Balloon Catheter
Our value-added service
Confirm operation plan
Select optimal devices depending on clinical cases
Explain how to use devices properly, determine spec, and deliver
Stand by in case of emergency
Collect and return unused devices
Invoice, replenish and control inventory
[Pre operation] [During operation] [Post operation]
Support to use devices properly
15

Proposal for efficient operations
Proposal for cost reductions
Proposal of the latest technology and products
Proposal of capital spending for advanced care
Support to recruit medical professionals
Research of catchment area
Proposal of target areas and fields
Proposal of measures to gather and increase patients
[Functional upgrading] [Marketing] [Profitability
improvement]
Our value-added service
Support to increase hospital value
16

Consolidated Forecasts to March 2020
(¥mil) YoY (%) (%)
Sales 64,000 -8.3 100.0
Operating profit 2,590 -20.6 4.8
Recurring profit 2,590 -20.7 4.8
Net profit 1,820 -31.1 3.4
EPS (yen) 63.40
DPS (yen) 33.00
17
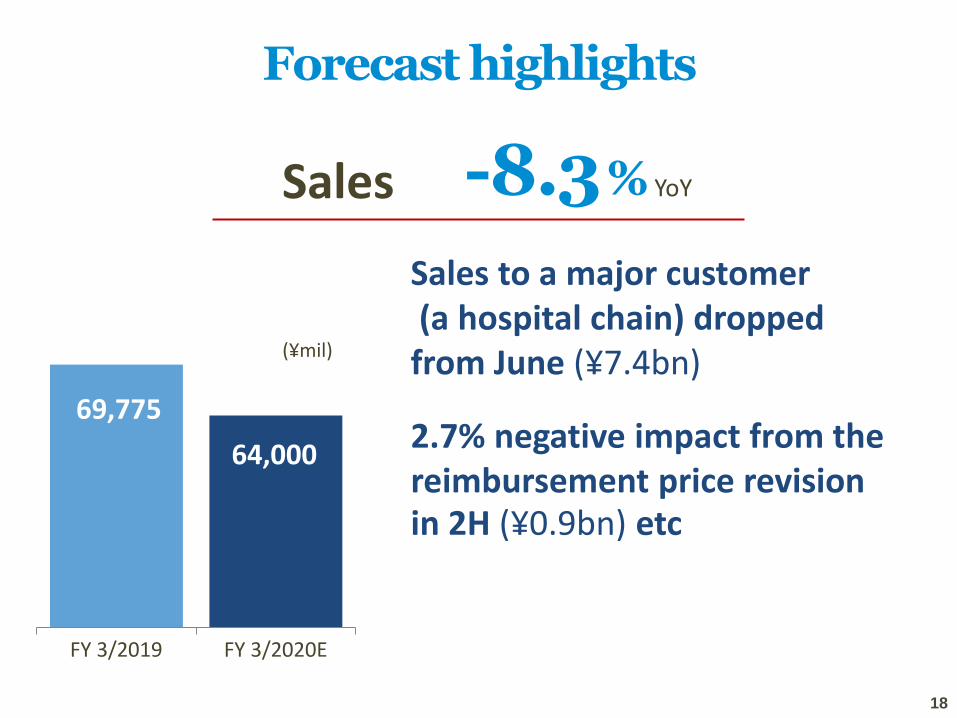
69,775
64,000
FY 3/2019 FY 3/2020E
Sales -8.3 % YoY
(¥mil)
Forecast highlights
Sales to a major customer (a hospital chain) dropped from June (¥7.4bn)
2.7% negative impact from the reimbursement price revision in 2H (¥0.9bn) etc
18

Sales impact by the reimbursement price revision
Percutaneous Coronary Intervention (PCI) -6.1
Cardiac Rhythm Segment (CRS) -3.3
Cardiac Vascular Segment (CVS) -0.4
Percutaneous Peripheral Intervension (PPI) -4.1
Brain Surgery -0.4
Others -0.2
Total -2.7
Assumed
impact(%)Segment
Note: Calculated based on reimbursement prices, sales volume and product mix on 2H to FY 3/2019 19

2018(Apr) 2018(Oct)PTCA Ballon Catheter 45 38 - 14.3
DES (Drug Eluting Stent) 193 173 - 10.4
IVUS (Intravascular Ultrasound Catheter) 89 84 - 5.9
Pacemaker 831 763 - 8.2
ICD (Implantable Cardioveter Defibrillator) 3,040 2,950 - 3.0
CRTD (Cardiac Resychronization Therapy Difibrillator) 4,140 3,990 - 3.6
Subcutaneous Implantable Defibrillator (S-ICD) 3,060 3,120 2.0
Ablation Catheter 133 126 - 5.3
Cardiac CryoAblation Catheter 637 649 1.9Stent graft (abdomen) 1,300 1,320 1.5
Open Stent graft 1,090 1,110 1.8Heart va lve for Transcatheter Aortic Valve Implantation
(TAVI) (Ba l loon-expandable)4,430 4,510 1.8
Heart valve for TAVI (self-expanding) 3,670 3,740 1.9
PTA Ballon Catheter 60 56 - 7.3
Peripheral Vascular Stent 179 175 - 2.2
Peripheral DES (Drug Eluting Stent) 229 233 1.7
PPI
ItemsSegment Change (%)
PCI
CRS
CVS
Reimbursement prices (¥000)
Outline of the reimbursement price revision
20

Sales breakdown by segment
FY 3/2020 (¥mil) YoY(%) % of sales
Percutaneous coronary intervention (PCI) 19,750 -7.4 30.9%
Cardiac rhythm segment (CRS) 17,180 -2.5 26.8%
Cardiac vascular segment (CVS) 8,990 -8.0 14.0%
Percutaneous peripheral intervension (PPI) 3,380 -2.4 5.3%
Brain surgery 2,390 -3.9 3.7%
Diabetes mellitus segment (DMS) 2,090 +14.7 3.3%
Large-sized medical equipment 4,380 -34.5 6.8%
Others 5,840 -11.4 9.1%
TOTAL 64,000 -8.3 100.0%
21

3,261
2,590
FY 3/2019 FY 3/2020E
(¥mil)
-20.6% YoY
Operating profit
Forecast highlights
Gross profit margin 12.8% +0.4pp YoY
- Price negotiation in proportion to new reimbursement prices - Cost reduction by bulk purchasing
SG&A ¥5.59bn +4.5% YoY - Total number of employees 536 → 560 (Mar 2019) (Mar 2020E)
22

2,640
1,820
FY 3/2019 FY 3/2020E
(¥mil)
-31.1% YoY
Net profit
Capex ¥130 mil vs. ¥143mil for FY 3/2019
Depreciation ¥220 mil vs. ¥237mil for FY 3/2019
Forecast highlights
Absence of negative goodwill (¥278mil to FY3/2019)
23
Income from silent partnership investment (¥82mil)

33yen
FY ending March 2020 Initial estimate unchanged
Dividends
payout ratio 52% ( )
24
32
33
34.8
FY 3/2019 FY 3/2020E
dividend per share (¥)
payout ratio (%)
52.0

Boston Scientific ‘WATCHMAN™’
Left atrial appendage closure device
Device to prevent migration of blood clots, reducing the risk of stroke and systemic embolism
Feb 2019:Approval
Sep 2019:Launch with reimbursement price
Left atrial appendage
© 2019 Boston Scientific Corporation. All rights reserved.
New product
25
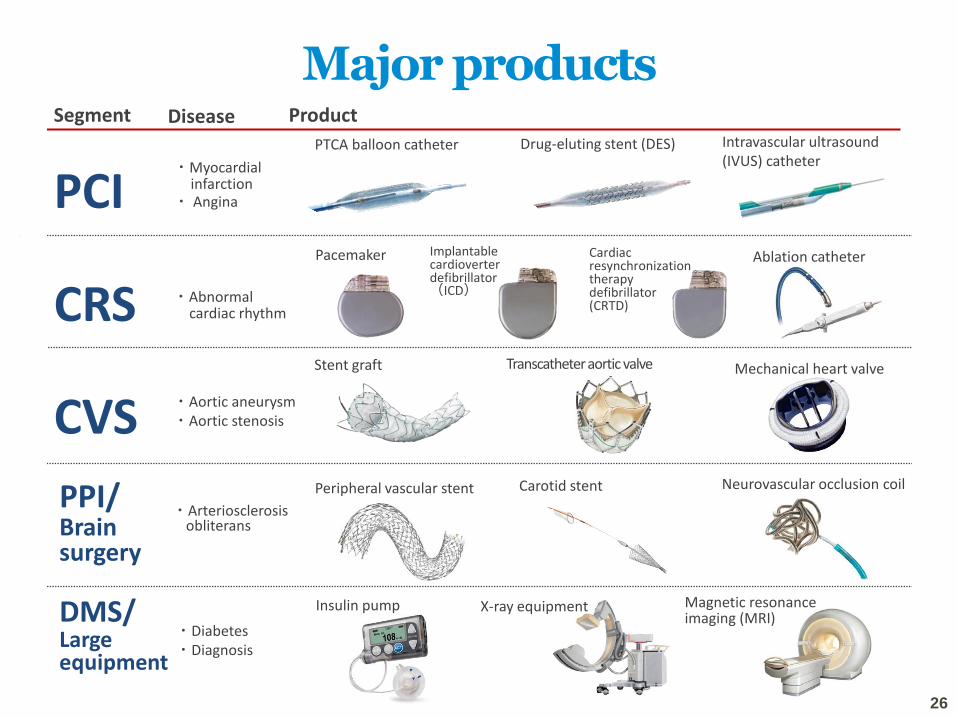
Segment Product
PCI
CRS
CVS
・Myocardial infarction
・ Angina
・Abnormal cardiac rhythm
・Aortic aneurysm ・Aortic stenosis
PPI/ Brain surgery
・Arteriosclerosis obliterans
DMS/ Large equipment
・Diabetes ・Diagnosis
PTCA balloon catheter Drug-eluting stent (DES) Intravascular ultrasound (IVUS) catheter
Pacemaker Implantable cardioverter defibrillator (ICD)
Ablation catheter
Stent graft Transcatheter aortic valve Mechanical heart valve
Peripheral vascular stent Neurovascular occlusion coil
X-ray equipment Magnetic resonance imaging (MRI)
Insulin pump
Carotid stent
Disease
Cardiac resynchronization therapy defibrillator (CRTD)
Major products
26

Track record of quarterly results
Sales/Operating profit (quarterly)
Operating profit Sales
Sales: ¥mil
Operating profit: ¥mil
= Year of reimbursement price revisions
10,822 11,407
13,223
14,370
11,630 11,957
13,059 13,908
12,582 13,288
13,862 14,412
13,690 14,023
14,499 15,547
14,571 15,182
16,874 16,204
15,875 15,988
18,776 19,135
17,076 16,067
505 545 688 739
446
647 722 783 595
681 806 881
696 739 788 833 794 703
805 842
564 712
922 1,062
757 700
0
500
1,000
1,500
2,000
5,000
10,000
15,000
20,000
1Q 2Q 3Q 4Q 1Q 2Q 3Q 4Q 1Q 2Q 3Q 4Q 1Q 2Q 3Q 4Q 1Q 2Q 3Q 4Q 1Q 2Q 3Q 4Q 1Q 2Q
FY 2014/3 FY 2015/3 FY 2016/3 FY 2017/3 FY 2018/3 FY 2019/3 FY 2020/3
27

400
700
1,000
1,300
1,600
1,900
9 10 11 12 1 2 3 4 5 6 7 8 9 10 11 12 1 2 3 4 5 6 7 8 9 10 11 12 1 2 3 4 5 6 7 8 9 10 11 12 1 2 3 4 5 6 7 8 9 10 11 12 1 2 3 4 5 6 7 8 9 10 11 12 1 2 3 4 5 6 7 8 9 10 11 2013 2014 2015 2016 2017 2018 2019
Dec 2013
360,000 Share selling
May 2014
TSE 2nd section
Sep 2014
TSE 1st section
Mar 2015
1 mil share selling
(Yen)
Share price
Effective on January 1st, 2017
Stock split 1 : 2
株式売出 目論見書
28

Disclaimer This material was prepared based on information available and views held at the time it was made. Statements in this material that are not historical facts, including, without limitation, plans, forecasts and strategies are “forward-looking statements”. Forward-looking statements are by their nature subject to various risks and uncertainties, including, without limitation, a decline in general economic conditions, general market conditions, technological developments, changes in customer demand for products and services, increased competition, and other important factors, each of which may cause actual results and future developments to differ materially from those expressed or implied in any forward-looking statement. With the passage of time, information in this material (including, without limitation, forward-looking statements) could be superseded or cease to be accurate. WIN-Partners Co., Ltd. disclaims any obligation or responsibility to update, revise or supplement any forward-looking statement or other information in any material or generally to any extent. Use of or reliance on the information in this material is at your own risk.
Contact WIN-Partners Co., Ltd.
Investor Relations TEL: +81-3-3548-0790
http://www.win-partners.co.jp