Embed Size (px)
Citation preview
CSIRO PUBLISHING
www.publish.csiro.au/journals/ijwf International Journal of Wildland Fire 2008, 17, 463–475
Assessing the differenced Normalized Burn Ratio’s abilityto map burn severity in the boreal forest and tundraecosystems of Alaska’s national parks
Jennifer L. AllenA,C and Brian SorbelB
ANational Park Service, Fairbanks Administrative Office, 4175 Geist Road, Fairbanks,AK 99709, USA.
BNational Park Service, Alaska Regional Office, 240 W 5th Avenue, Anchorage,AK 99501, USA.
CCorresponding author. Email: [email protected]
Abstract. Burn severity strongly influences post-fire vegetation succession, soil erosion, and wildlife populations inthe fire-adapted boreal forest and tundra ecosystems of Alaska. Therefore, satellite-derived maps of burn severity in theremote Alaskan landscape are a useful tool in both fire and resource management practices. To assess satellite-derivedmeasures of burn severity in Alaska we calculated the Normalized Burn Ratio (NBR) from pre- and post-fire LandsatTM/ETM+ data. We established 289 composite burn index (CBI) plots in or near four national park areas between 2001and 2003 in order to compare ground-based measurements of burn severity with satellite-derived values of burn severity.Within the diverse vegetation types measured, a strong linear relationship between a differenced Normalized Burn Ratio(dNBR) and CBI for eight out of the nine fire assessments was found; R2 values ranged from 0.45 to 0.88. The variationsin severity among four pre-fire vegetation types were examined and a significant difference in the average dNBR andaverage CBI values among the vegetation types was found. Black spruce forests overall had the strongest relationship withdNBR, while the high severity white spruce forests had the poorest fit with dNBR. Deciduous forests and tall shrub plotshad the lowest average remotely sensed burn severity (dNBR), but not the lowest ground severity among the vegetationtypes sampled. The tundra vegetation sampled had the lowest ground severity. Finally, a significant difference was detectedbetween initial and extended assessments of dNBR in tundra vegetation types. The results indicated that the dNBR canbe used as an effective means to map burn severity in boreal forest and tundra ecosystems for the climatic conditions andfire types that occurred in our study sites.
Additional keywords: dNBR, Landsat, Picea, remote sensing, wildland fire.
Introduction
Wildland fires are an integral part of the boreal forest and tun-dra ecosystems of Alaska; at least 20 million hectares (ha) haveburned in the past 55 years (Kasischke et al. 2002; Bureau ofLand Management 2006). Alaskan wildland fires burned morethan 5.6 million ha between 2001 and 2006, which accountedfor 34% of the total area burned by wildland fire throughoutthe United States (National Interagency Coordination Center2007). The total area burned annually in Alaska varies greatly(Kasischke et al. 2002) but in nearly all years some area ofAlaskais affected by large wildland fires. For instance, during everyAlaskan fire season since 1999 at least one fire has grown largerthan 45 000 ha (Bureau of Land Management 2006).
Climate, terrain and vegetation strongly influence the occur-rence, extent and severity of fires in Alaska. On heterogeneouslandscapes fires nearly always burn in a non-uniform manner.As fires burn under varying weather conditions across land-scapes characterised by varying topography and fuel types, theirbehaviour and effects also dramatically change (Johnson 1992;Johnson and Miyanishi 2001). Thus, within any given fire, someareas are radically changed as a result of intense scorching or
sustained burning of surface organic layers, while other areasremain untouched. This heterogeneous pattern or ‘fire mosaic’is the result of varying burn severity on the landscape. Althoughnumerous definitions of burn severity exist in the literature(Lentile et al. 2006), we define burn severity as a measure ofthe ecological impacts of fire, in terms of plant survivorshipor mortality, depth of the burn in organic layers, or amount ofbiomass consumed.
Burn severity can shape vegetation succession and the patchmosaics on the landscape (Johnstone and Chapin 2006). Thepatchy dynamics of burn severity can result in substantial hetero-geneity at both a local and landscape level. Studies have shownthat burn severity can impact both tree seedling establishment(Zasada 1986; Johnstone and Kasischke 2005; Johnstone andChapin 2006) and understorey regeneration strategies (Zasada1986) in boreal forests. These variations at the local level can bescaled up to impact landscape scale patch dynamics (Johnstoneand Chapin 2006).
Conversely, vegetation can also influence fire behaviour andresulting severity. For instance, it is commonly thought thatin boreal forests deciduous stands are less flammable than
© IAWF 2008 10.1071/WF08034 1049-8001/08/040463

464 Int. J. Wildland Fire J. L. Allen and B. Sorbel
DenaliNP/Pr
Yukon-Charley Rivers NPr
Noatak NPr
Bering Land Bridge NPr
Fairbanks
Anchorage
Nome
Arctic Circle
B248B242 B260
A288A303
A274B288
A520B001
A526
0 50 100 150Kilometres
Alaska
Yukon T
erritory
A l a s k a
N
Fig. 1. Location of 10 fires (�) assessed for burn severity within and near Alaska Region National Park Service units.
mature spruce stands (Johnson 1992). Yet very few studies havedocumented the variation in burn severity (or fire behaviour)within some vegetation types in Alaska, such as tussock tundra,deciduous forests, and white spruce forests.
Information about burn severity has several practical appli-cations for fire and resource managers. For example, the UnitedStates Interagency Burned Area Emergency Response teams(BAER) often create and use burn severity maps to direct man-agement responses to minimise the potentially harmful effects ofexcessive erosion in the aftermath of a wildland fire (Miller andYool 2002). Furthermore, useful predictive models of wildlandfire effects on vegetation communities and wildlife populationscan be generated from burn severity products. Effective resourceand fire management practices require an accurate, inexpen-sive and timely means to map the burn severity of wildlandfires.
Several approaches to mapping burn severity of wildland fireshave been evaluated recently (Epting et al. 2005; Lentile et al.2006; Roy et al. 2006; French et al. 2008). The Normalized BurnRatio (NBR) has emerged as one means to map burn severityusing remote sensing technology (Key and Benson 2006). TheNBR utilises the differing responses of Landsat bands 4 (nearinfrared, 0.76–0.90 µm) and 7 (mid infrared, 2.08–2.35 µm) to
generate a scaled index of burn severity. A differenced Normal-ized Burn Ratio (dNBR) dataset compares the NBR of pre- andpost-fire Landsat imagery to isolate the change brought about bywildland fire. The application of the dNBR to Landsat imageryhas shown to be an effective method to map burn severity withintemperate forests (van Wagtendonk et al. 2004; Cocke et al.2005) and boreal forests (Epting et al. 2005), although otherstudies have suggested that the inconsistent response of the bandsused in dNBR make it an unreliable method (Roy et al. 2006).Two types of burn severity assessments can be produced: initialassessments or extended assessments (Key and Benson 2006),however no studies have compared the differences between theseassessment types within boreal forest or tundra ecosystems.
In this study, we evaluated the ability of the dNBR to accu-rately map the burn severity of wildland fires within boreal forestand tundra ecosystems in Alaska by comparing remotely senseddNBR burn severity values with ground-based burn severitymeasurements. We assessed the burn severity of 10 fires thatoccurred between 1999 and 2002 in or near four National ParkService (NPS) units in Alaska: Yukon–Charley Rivers NationalPreserve (YUCH), Denali National Park and Preserve (DENA),Noatak National Preserve (NOAT) and Bering Land BridgeNational Preserve (Seward Peninsula) (Fig. 1, Table 1). These
Boreal forest and tundra burn severity Int. J. Wildland Fire 465
Table 1. Fires assessed for burn severity within the Alaska Region ofthe National Park Service
NPS unit Fire name Fire Fire Fire size Fieldnumber year (ha) plots
YUCH Witch B242 1999 19 002 32YUCH Jessica B260 1999 15 448 47YUCH Beverly B248 1999 8160 40DENA Otter Creek A288 2000 4685 10DENA Chitsia A303 2000 3776 25DENA Foraker A274 2000 7267 24DENA Herron River B288 2001 2524 25NOAT Cottonwood Bar A520 2002 5486 19NOAT Uyon Lakes B001 2002 174 18Seward peninsula Milepost 85 A526 2002 8720 49
fires occurred over a wide geographic area of Alaska, andprovided the ability to evaluate the dNBR and ground-basedseverity in both the boreal forest types of Interior Alaska, aswell as the tussock-shrub tundra communities of north-westernAlaska, thus extending the previous research of Epting et al.(2005). We were interested in determining whether dNBR val-ues had the same meaning among different vegetation typesand between assessment types. We compared the relationshipof ground and remotely sensed burn severity among vegetationtypes and dNBR assessment types. While the results from threeYUCH fires have been previously presented by Epting et al.(2005), we include these data to provide a comprehensive com-parison among all fires and vegetation types assessed on nationalpark lands in Alaska.
MethodsStudy areasYukon–Charley Rivers National Preserve is a 1.02 million hapreserve located along the Canadian border in central Alaska(Fig. 1). Elevations range from 150 to 1950 m. The Preserveincludes ∼200 km of the Yukon River and the entire CharleyRiver drainage. It is characterised by boreal forests that transitionfrom river floodplains through steep mountain slopes to alpinetundra. Black spruce (Picea mariana (P. Mill.) B.S.P.) forestsgenerally occupy north-facing, low lying, or poorly drainedsites. Well drained upland forests are dominated by white spruce(Picea glauca (Moench) Voss) and mixed forests of white spruceand paper birch (Betula papyrifera Marsh.) or quaking aspen(Populous tremuloides Michx.). White spruce and balsam poplar(Populus balsamifera L.) are common along streams and floodplains. The Yukon–Charley area is characterised by one of thehighest lightning strike densities in Alaska (Dissing and Verbyla2003). Vegetative and climatic factors at Yukon–Charley enablewildland fires to ignite and burn; over 40% of the preserve hasburned within the past 50 years. Fires B242, B248 and B260occurred in Yukon–Charley Rivers NP in the summer of 1999.All three fires occurred in mountainous terrain at elevations rang-ing from 200 to 1200 m, with the majority of the fire areas belowthe tree line (∼900 m).
Denali National Park and Preserve covers 2.43 million hain central Interior Alaska. Elevations range from 60 m in thesouthern portion of the park to 6194 m at the summit of Mt.McKinley. Wildland fire activity in Denali primarily occurs inthe north-western portion of the park where lightning-causedfires predominate, and along the road corridor in the easternportions of the park where human-caused fires predominate.The north-west region of Denali lies within the interior light-ening belt of Alaska with lightning strike densities only slightlylower than those in Yukon–Charley (Dissing and Verbyla 2003).The lowland black spruce forests that are common throughoutthe north-west region of the park experience large natural firesalmost yearly. Over the past 50 years nearly 220 000 ha haveburned within the park boundary. Fires A274, A288 and A303occurred in Denali in 2000. Fire B288 occurred in 2001. All fourfires occurred in the north-west region of the park and rangedover elevations from 200 to 500 m. The primary pre-fire veg-etation in this area was woodland/stunted black spruce, shrubtussock tundra and some white spruce forests in flood plainsand riparian zones.
Noatak National Preserve encompasses 2.66 million ha innorth-western Alaska. Elevations in the preserve range fromroughly sea-level to 1900 m. Fires generally occur in the low-lands of the park, below 500-m elevation. The Noatak River isone of the major river systems of Arctic Alaska and containsa broad range of lowland and alpine tundra, including tussocktundra, shrub tundra and tree-line habitats. Fires A520 and B001occurred in the central portion of the preserve along the NoatakRiver in 2002. The pre-fire vegetation in the areas burned bythese two fires was dominated by tussock-shrub tundra, birch-ericaceous shrub tundra and willow shrublands. The two firesburned at elevations that ranged from 180 to 430 m.
Bering Land Bridge National Preserve is a 1.13 million hapreserve located in north-western Alaska on the Seward Penin-sula. In 2002, fire A526 burned near the western edge of thepreserve in areas representative of the tussock-shrub tundra com-munities within the preserve. Portions of the fire had previouslyburned in 1997. Fire A526 burned at elevations ranging from 50to 340 m. The Seward Peninsula has one of the lowest lightningstrike densities in Interior Alaska (Dissing and Verbyla 2003).Fire suppression activities did not impact the natural progressionof any of the fires in this study.
Image processingBurn severity GIS data layers were developed for all 10 fires byapplying the NBR to pre- and post-fire Landsat imagery based onthe Landscape Assessment methods developed by Key and Ben-son (2006). All image processing for the 10 fires was conductedby the USGS EROS Data Center as part of the NPS-USGS BurnSeverity Mapping Project. For each fire, suitable cloud-free pre-fire and post-fire scenes were selected from nearly the same timeof year to minimise differences in vegetation phenology betweenscenes. The selected images were georeferenced to the terraincorrection level (Level 1T) using ground control points and aDigital Elevation Model for topographic accuracy, and processedto units of at satellite reflectance. Neither an atmospheric correc-tion nor scene-to-scene radiometric normalisation was appliedto the Landsat images used in this analysis. A NBR dataset was

466 Int. J. Wildland Fire J. L. Allen and B. Sorbel
Table 2. Fires and satellite imagery used to develop differenced normalised burn severity products
Fire number Fire year Pre-fire sceneA Post-fire scene Assessment type
B242, B260 1999 L5 (p66/r14) 16 September 1995 L7 (p65/r14) 12 September 1999 InitialB248 1999 L5 (p66/r15) 16 September 1995 L7 (p67/r14) 10 September 1999 InitialA288, A303 2000 L5 (p70/r15) 1 July 1986 L7 (p70/r15) 16 June 2001 ExtendedA274 2000 L5 (p71/r15) 21 July 1985 L7 (p71/r15) 23 June 2001 ExtendedB288 2001 L7 (p71/r16) 28 August 1999 L7 (p71/r16) 26 August 2001 InitialB288 2001 L7 (p72/r15) 23 June 2001 L7 (p72/r15) 17 June 2002 ExtendedB001 2002 L7 (p78/r12) 8 July 2001 L7 (p78/r12) 29 July 2002 InitialA520 2002 L7 (p80/r12 8 August 2001 L7 (p79/r12) 8 August 2003 ExtendedA526 2002 L7 (p81/r14) 3 August 2002 L7 (p81/r14) 6 August 2003 Extended
AL5: Landsat 5, L7: Landsat 7.
generated for both the pre-fire and post-fire scene using Landsatbands 4 and 7 as follows:
NBR = 1000[(Band 4 − Band 7)/(Band 4 + Band 7)]A final dNBR dataset was derived as follows:
dNBR = NBRpre-fire − NBRpost-fire
The dNBR has a potential range of −2000 to +2000, butrarely exceeds a range of −500 to +1200 over burned surfaces(Key 2006; Key and Benson 2006). Unchanged areas typicallyhave values near zero, indicating no change, and burned areasgenerally have dNBR values greater than 100, although thisburned/unburned threshold often varies between burns in differ-ent regions. A national study of over 80 fires or fire complexesin the USA found the range of burned/unburned thresholds tobe between 80 and 130 (Zhu et al. 2006). The dNBR is hypothe-sised to generate a continuous index of severity, from unburnedto severely burned.
Key and Benson (2006) described two general types of burnseverity assessments: initial assessments and extended assess-ments. The assessment types differ in the timing of the Landsatimagery used with respect to the fire event.To generate the initialassessment dNBR, the post-fire Landsat scene is acquired imme-diately after fire activity has ceased or the fire has been declaredout. In contrast, with extended assessments the post-fire Land-sat scene is typically acquired one growing season after the fireevent. Both assessments then use a pre-fire scene acquired on ornear the anniversary date of the post-fire scene. Because of cloudand smoke issues with imagery, we were only able to obtain bothan initial and extended assessment for fire B288 in Denali. Forthe other nine fires, either initial or extended assessments werecompleted. Table 2 summarises the imagery used and assess-ment type for each of the 10 fires in the analysis. Ideally, thereshould only be one to two years separating the pre-fire and post-fire imagery to minimise the change detected in unburned areasthat was not the result of the subject fire. However, because ofscene limitations, it was sometimes necessary to have longerperiods of time between the two scenes (Table 2). In the case offire A274 in Denali, there was a difference of 16 years betweenthe pre-fire and post-fire scenes used in the analysis. We donot expect that this longer time span between images in Denalisignificantly impacted our results, because of the slow changes
in stand characteristics in late successional boreal forest types(Viereck 1983).
Composite burn index plotsWe used the composite burn index (CBI) to estimate burn sever-ity in the field (Key and Benson 2006). A total of 289 CBIplots were established within the 10 fires (Table 1). We collectedfield data from 119 burn severity plots within the three Yukon–Charley fires between June and July 2001 (two years after thefires occurred). In June 2002, we collected 84 burn severity plotswithin the four Denali fires (one and two years after the fire).While the CBI protocol generally calls for sampling plots duringthe first post-fire growing season (Key and Benson 2006), we donot feel that sampling two years post-fire negatively impactedour ability to determine burn severity in these predominantlyforested systems. In July 2003 (one year post-fire), we collected47 burn severity plots from fire A526 near Bering Land Bridgeand 36 plots from two fires in Noatak. Of the 47 plots from fireA526, 10 were in areas that had previously burned in 1997. Atthese plots, an attempt was made to separate the burn severityeffects of the 2002 burn from the effects of the 1997 burn. Plotlocations were pre-selected and stratified to ensure sampling ofthe full range of burn severity levels and vegetation types withinthe fires. In addition, plot locations were targeted for areas withlittle spatial heterogeneity in burn severity. This was done toreduce the potential for plots to be located on edges of burnseverity types or in areas with vastly divergent dNBR valuesfrom one cell to the next. To find areas with relatively similardNBR values in neighbouring cells, we used a neighbourhoodGIS function to determine the range of dNBR values in a 3 × 3matrix around each cell. Plot locations were targeted for thosecells in which the range of dNBR values in a 3 × 3 matrix aroundthe cell was less than 150. All CBI plots were located at least100 m away from each other. Landsat imagery was not availableat the time of field sampling for the Herron River fire; there-fore, plots were established based on aerial reconnaissance forhomogeneous burn severity areas.
Plots were circular with a 15-m radius in forested plots anda 10-m radius in shrub/tundra plots. For each plot we madeocular estimates of the degree of environmental change causedby fire within five strata defined as: (1) substrate layer, (2)low vegetation less than 1 m tall, (3) tall shrubs/sapling trees(1–2 m), (4) intermediate trees (2–8 m), and (5) large trees
Boreal forest and tundra burn severity Int. J. Wildland Fire 467
Table 3. Composite Burn Index strata and measures for 2001–2003
Strata 2001 variables 2002 variables 2003 variables
Substrate layer – Litter Litter/light fuel consumed– – DuffMossA MossA MossA
<1000-h fuels <1000-h fuels TussocksA
≥1000-h fuels ≥1000-h fuelsSoil cover/colour Soil cover/colour Soil cover/colour
Herbaceous/low shrub – Nonvascular plants % foliage alteredRegeneration % living/resprouting % living/resproutingNew serals New serals Colonizersδ richness/cover Species diversity Species composition –
relative abundance
Tall shrubs/sapling trees % consumed % foliage consumed % foliage altered– % conifers green % greenRe-gen shrub/trees % living/resprouting % living/resproutingNew serals New serals –δ richness/cover Species diversity Species composition –
relative abundance
Intermediate trees % green % green Not present in tundra plots% black % black% brown % brownChar height Char height% girdled –
Large trees % green % green Not present in tundra plots% black % black% brown % brownChar height Char height% girdled –
AVariables that used Alaska specific definitions or treatment.
(>8 m) (Table 3). Within each stratum four to five variableswere scored between 0.0 and 3.0 for a scale of burn severity(Key and Benson 2006). Between 2001 and 2003, the FIRE-MON Landscape Assessment CBI field form was revised on anannual basis. As a result, the specific variables scored variedslightly from year to year and are shown in Table 3. In addition,slight modifications were made to the CBI field form each yearto reflect specific Alaska vegetation conditions. If a particularcomponent was not present at a plot, no score was recorded.The individual factor scores were averaged to provide a contin-uous scale of severity between 0.0 and 3.0 for the five strataand overall CBI. Plot locations were established using GarminGPS units, and averaged at least 100 individual points. We usedthe plot location data to extract the dNBR values from the 30-mcell in which each plot fell. Digital photos and general vege-tation descriptions of the plots were taken. Using field notesand digital photographs, one of the following four vegetationclasses was assigned to each plot: (1) white spruce (included purewhite spruce, mixed spruce, and white spruce-deciduous stands),(2) black spruce (black spruce and black spruce-deciduous),(3) deciduous (deciduous trees and tall shrubs), and (4) tundra(tussock, shrub-tussock, and dwarf or low shrub). We gener-ally followed the vegetation classification definitions commonlyused in Alaska (Viereck et al. 1992). Plots were classified as for-est if there was greater than 10% canopy cover of tree species ortall shrubs in the plot area. Deciduous stands were differentiated
from mixed conifer–deciduous plots if greater than 75% of thetree canopy was dominated by deciduous species. Four plotswere excluded from the vegetation analyses because they wererocky, dry bluff communities, or alpine plant dominated and didnot conform to one of the four classes.
AnalysisIn order to assess the ability of dNBR to predict on the groundburn severity we utilised linear regression. We initially examinedeach fire individually, except in cases where fires occurred inthe same year and shared the same pre-fire and post-fire scenes.In those cases, data from the fires were combined for the pur-pose of analyses (see Table 2), which reduced the number offires from 10 to 8. For fire B288 which had both initial andextended assessments completed we used the initial assessmentdataset for all analyses unless otherwise noted. We used anal-ysis of covariance (ANCOVA) to determine whether the linearregression relationships varied among the eight fires. If therewas a significant difference, we ran a second ANCOVA to testthe significance of the interaction term between the two indepen-dent variables to determine if there was a significant differenceamong the slopes. Pearson correlation coefficients (R) were gen-erated to compare the five individual strata of CBI to dNBR todetermine if certain stratum had higher correlations to the dNBRvalues.
468 Int. J. Wildland Fire J. L. Allen and B. Sorbel
Table 4. Results of linear regressions for CBI as a factor of dNBR by fire and Landsat scene
Assessment type NPS unit Fire (by Landsat Slope Adjusted R2 F-statistic (d.f.) P valuescene)
Initial assessment NOAT B001 0.0016 0.784 62.68 (1.16) <0.0001YUCH B242_B260 0.0019 0.748 231.97 (1.77) <0.0001YUCH B248 0.0018 0.450 32.88 (1.38) <0.0001DENA B288 0.0024 0.875 169.72 (1.23) <0.0001
Extended assessment DENA B288A 0.0025 0.832 119.61 (1.23) <0.0001DENA A274 0.0024 0.752 70.62 (1.22) <0.0001DENA A288_A303 0.0019 0.789 127.94 (1.33) <0.0001NOAT A520 0.0025 0.777 63.86 (1.17) <0.0001SEWARD A526 0.0022 0.770 161.98 (1.47) <0.0001
AB288 fire had both initial and extended assessments completed, for all subsequent analyses the initial assessment datawas used, unless noted.
We examined the effects of pre-fire vegetation (white spruce,black spruce, deciduous, and tundra) on burn severity and thencompared the relationships between CBI and dNBR. Using theground plots, we compared the overall difference in ground(CBI) and remotely sensed burn severity (dNBR) among thepre-fire vegetation types using a general linear model, one-wayanalysis of variance (GLM ANOVA). We then compared therelationship between CBI and dNBR within each vegetationtype using linear regressions and looked for differences usingan ANCOVA. Since we were interested in detecting differencesin burn severity among vegetation types we chose not to applythe Relative dNBR which others have used to account for dif-ferences in vegetation cover, particularly in sparse vegetationcommunities (Zhu et al. 2006; Miller and Thode 2007).
In order to determine if there was an overall differencebecause of the dNBR assessment types, we pooled the data for allthe fires by assessment types (initial v. extended) and comparedthe regressions using an ANCOVA. Since we had both initialand extended assessments completed for fire B288, we analysedthese separately. Finally, we pooled the data by pre-fire vegeta-tion and assessment type and compared the resulting regressions.For this analysis, we only utilised black spruce and tundra plots,because of the low number of plots in the other vegetation typeswhen the data was split by assessment type. We used the SPSS13.0 statistical package for all analyses. The significance levelof statistical tests was set at P < 0.05.
Results
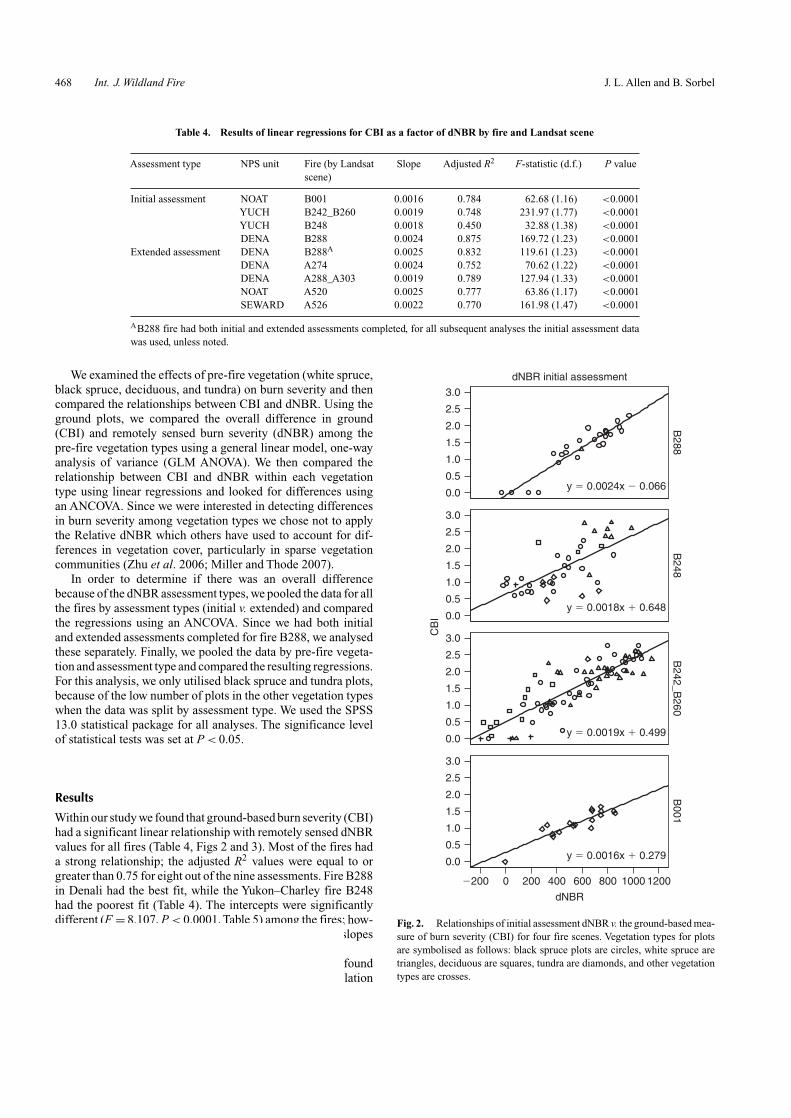
Within our study we found that ground-based burn severity (CBI)had a significant linear relationship with remotely sensed dNBRvalues for all fires (Table 4, Figs 2 and 3). Most of the fires hada strong relationship; the adjusted R2 values were equal to orgreater than 0.75 for eight out of the nine assessments. Fire B288in Denali had the best fit, while the Yukon–Charley fire B248had the poorest fit (Table 4). The intercepts were significantlydifferent (F = 8.107, P < 0.0001, Table 5) among the fires; how-ever, the interaction term (Fire × dNBR) indicated that the slopeswere not significantly different (F = 1.295, P = 0.253).
Comparing the five strata of CBI values (Table 6), we foundthat the intermediate tree strata had the strongest correlation
3.0
2.5
2.0
1.5
1.0
0.5
0.0
3.0
2.5
2.0
1.5
1.0
0.5
0.0
3.0
2.5
2.0
1.5
1.0
0.5
0.0
3.0
2.5
2.0
1.5
1.0
0.5
0.0
�200 0 200 400 600 800 1000 1200
dNBR
dNBR initial assessment
B288
B248
B242_B
260B
001
CB
I
y � 0.0024x � 0.066
y � 0.0018x � 0.648
y � 0.0019x � 0.499
y � 0.0016x � 0.279
Fig. 2. Relationships of initial assessment dNBR v. the ground-based mea-sure of burn severity (CBI) for four fire scenes. Vegetation types for plotsare symbolised as follows: black spruce plots are circles, white spruce aretriangles, deciduous are squares, tundra are diamonds, and other vegetationtypes are crosses.

Boreal forest and tundra burn severity Int. J. Wildland Fire 469
3.0
2.5
2.0
1.5
1.0
0.5
0.0
3.0
2.5
2.0
1.5
1.0
0.5
0.0
3.0
2.5
2.0
1.5
1.0
0.5
0.0
3.0
2.5
2.0
1.5
1.0
0.5
0.0
3.0
2.5
2.0
1.5
1.0
0.5
0.0
�200 0 200 400 600 800 1000 1200
dNBR
y � 0.0024x � 0.202
y � 0.0019x � 0.256
y � 0.0025x � 0.339
y � 0.0022x � 0.512
y � 0.0025x � 0.027
dNBR extended assessment
B288
A526
A520C
BI
A288_A
303A
274
Fig. 3. Relationships of extended assessment dNBR v. the ground-basedburn severity (CBI) for five fires, including B288 extended assessment. SeeFig. 2 for symbol legend.
to dNBR (r = 0.832, pooled for all fires), followed by the sub-strate layer (r = 0.741). Total CBI (all strata averaged) had onlya slightly stronger relationship (r = 0.833 for pooled data) thanthe intermediate tree strata.
The pre-fire vegetation varied among the parks and fires. InDenali 91% of the 84 plots were woodland (10–25% canopy)and open (25–60% canopy) black spruce, the remaining plots
Table 5. ANCOVA results comparing dNBR as a continuous factor ofCBI grouped by fires
Source Sum of squares d.f. Mean square F P(Type III)
Corrected model 110.134A 8 13.767 102.642 <0.0001Intercept 9.064 1 9.064 67.582 <0.0001dNBR (covariate) 98.474 1 98.474 734.200 <0.0001Fire (fixed) 7.611 7 1.087 8.107 <0.0001Error 37.555 280 0.134Total 695.908 289Corrected total 147.689 288
AAdjusted R2 = 0.738.
were 8% white spruce and 1% deciduous (trees and tall shrubs).All of the 86 plots from Noatak and the Seward Peninsula wereclassified as tundra, although this class encompassed a widevariety of tundra types including tussock-shrub, low shrub, dryacidic lichen-shrub, and graminoid-dominated tundra. Yukon–Charley had the most diverse vegetation sampled. Of the 119plots 49% were black spruce, 31% white spruce, 11% deciduous,6% tundra and 3% other vegetation.
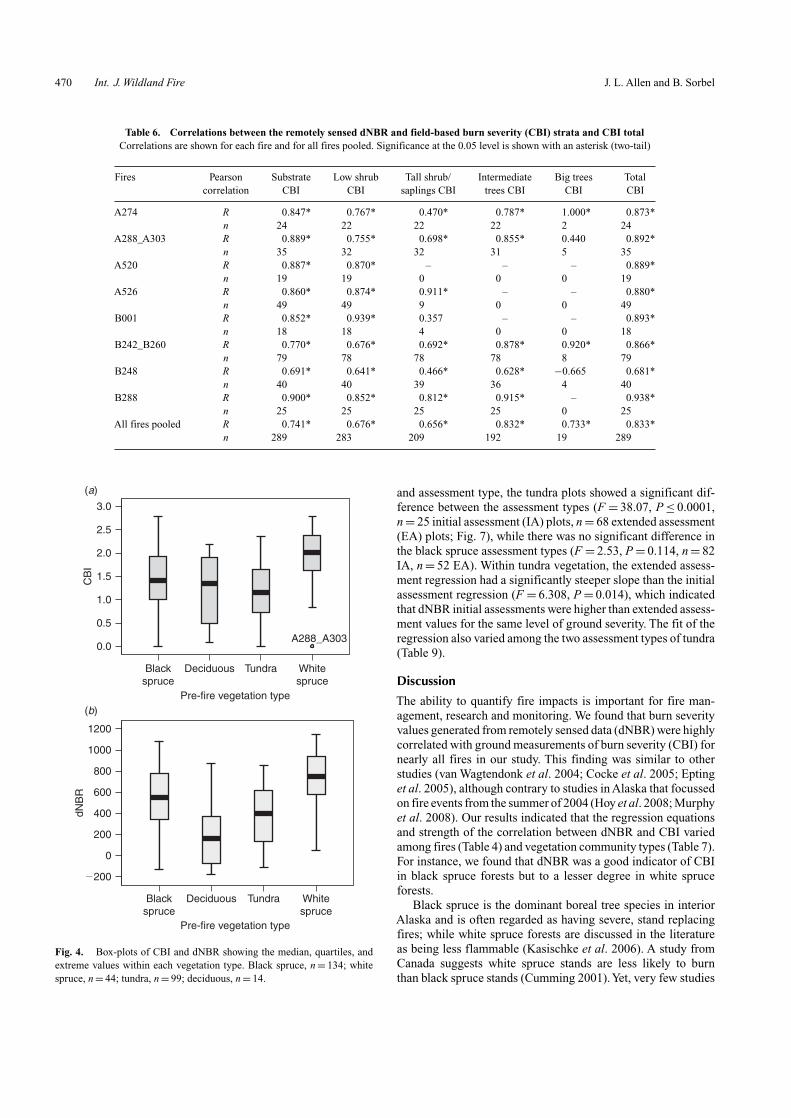
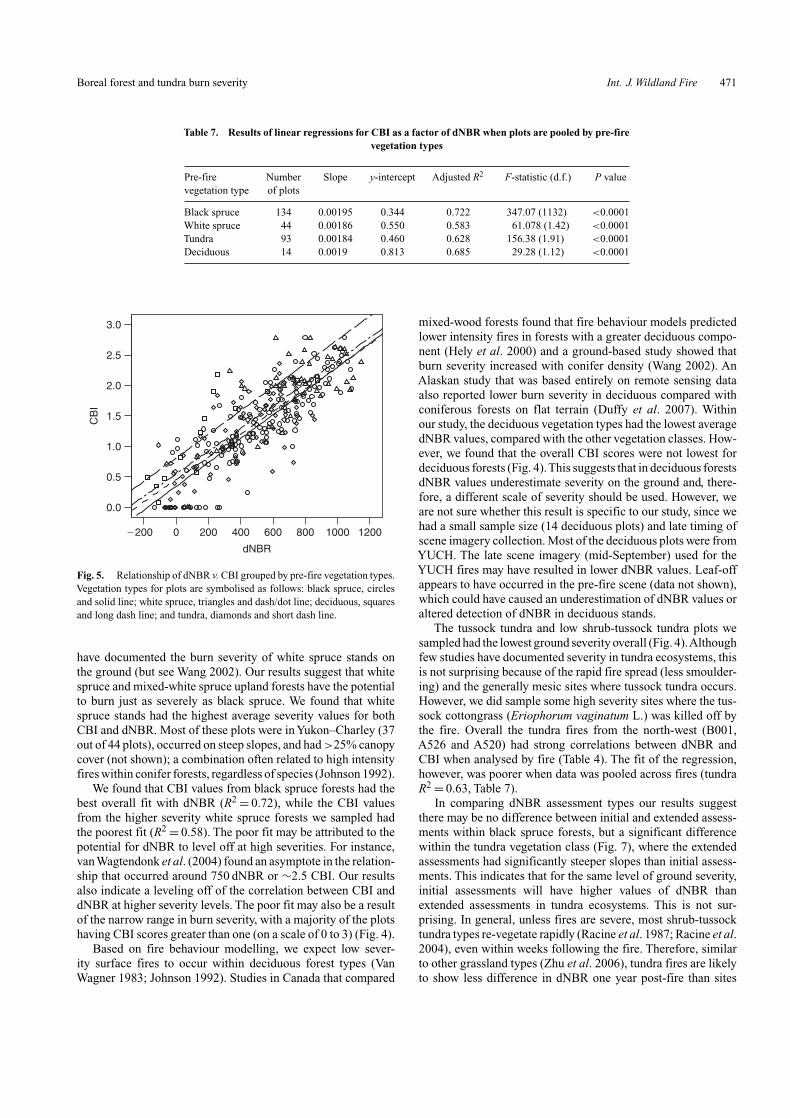
Pooling the plots into pre-fire vegetation types, we founda significant difference in the average dNBR (F = 18.69,P < 0.0001) and average CBI values among the vegetationtypes (F = 11.27, P < 0.0001) (Fig. 4). The ground-based sever-ity continued to hold a linear relationship with dNBR whenseparated by pre-fire vegetation (Table 7, Fig. 5). The linearregression relationships varied by vegetation. We found a signif-icant difference among the intercepts (F = 6.413, P < 0.0001)(Table 8), but the interaction term (Veg × dNBR) indicatedthat the slopes were not significantly different (F = 0.138,P = 0.937). Overall, black spruce plots had the strongest rela-tionship between dNBR and CBI (R2 = 0.72). Overall whitespruce stands had the highest average dNBR and CBI values ofthe plots sampled, and also the poorest fit with CBI (R2 = 0.58).Deciduous forest and tall shrub types (deciduous), although notabundantly represented (n = 14), had the lowest average dNBR(217.1, s.e. 86.9), followed by tundra with an average dNBRof 378.1 (s.e. 28.4). However, tundra plots had lower averageCBI values (average 1.15, s.e. 0.07) than deciduous plots (1.23,s.e. 0.20). We found that the deciduous and tundra plots, whenpooled by vegetation type, did not have as strong of correlationbetween dNBR and CBI as was found with black spruce plots(Table 7).
When we initially compared the data by dNBR assessmenttypes irrespective of fire or dominant pre-fire vegetation type,we found no significant difference in the relationship betweendNBR and CBI between initial and extended assessment types(F = 0.158, P = 0.652; Fig. 6). This was further assessed bycomparing fire B288 which had both an initial and extendedassessment completed. The R2 results were similar between theassessment types for B288, with an adjusted R2 of 0.88 for theinitial and 0.83 for the extended assessment (Table 4). There wasno significant difference between the relationships for the twoassessment types of fire B288 (F = 0.333, P = 0.567). However,we found that when we pooled the data by pre-fire vegetation
470 Int. J. Wildland Fire J. L. Allen and B. Sorbel
Table 6. Correlations between the remotely sensed dNBR and field-based burn severity (CBI) strata and CBI totalCorrelations are shown for each fire and for all fires pooled. Significance at the 0.05 level is shown with an asterisk (two-tail)
Fires Pearson Substrate Low shrub Tall shrub/ Intermediate Big trees Totalcorrelation CBI CBI saplings CBI trees CBI CBI CBI
A274 R 0.847* 0.767* 0.470* 0.787* 1.000* 0.873*n 24 22 22 22 2 24
A288_A303 R 0.889* 0.755* 0.698* 0.855* 0.440 0.892*n 35 32 32 31 5 35
A520 R 0.887* 0.870* – – – 0.889*n 19 19 0 0 0 19
A526 R 0.860* 0.874* 0.911* – – 0.880*n 49 49 9 0 0 49
B001 R 0.852* 0.939* 0.357 – – 0.893*n 18 18 4 0 0 18
B242_B260 R 0.770* 0.676* 0.692* 0.878* 0.920* 0.866*n 79 78 78 78 8 79
B248 R 0.691* 0.641* 0.466* 0.628* −0.665 0.681*n 40 40 39 36 4 40
B288 R 0.900* 0.852* 0.812* 0.915* – 0.938*n 25 25 25 25 0 25
All fires pooled R 0.741* 0.676* 0.656* 0.832* 0.733* 0.833*n 289 283 209 192 19 289
3.0
1200
1000
800
600
400
200
0
�200
2.5
2.0
1.5
1.0
0.5
0.0
Blackspruce
Deciduous Tundra
(a)
(b)
Whitespruce
A288_A303
Pre-fire vegetation type
Blackspruce
Deciduous Tundra Whitespruce
Pre-fire vegetation type
CB
IdN
BR
Fig. 4. Box-plots of CBI and dNBR showing the median, quartiles, andextreme values within each vegetation type. Black spruce, n = 134; whitespruce, n = 44; tundra, n = 99; deciduous, n = 14.
and assessment type, the tundra plots showed a significant dif-ference between the assessment types (F = 38.07, P ≤ 0.0001,n = 25 initial assessment (IA) plots, n = 68 extended assessment(EA) plots; Fig. 7), while there was no significant difference inthe black spruce assessment types (F = 2.53, P = 0.114, n = 82IA, n = 52 EA). Within tundra vegetation, the extended assess-ment regression had a significantly steeper slope than the initialassessment regression (F = 6.308, P = 0.014), which indicatedthat dNBR initial assessments were higher than extended assess-ment values for the same level of ground severity. The fit of theregression also varied among the two assessment types of tundra(Table 9).
Discussion
The ability to quantify fire impacts is important for fire man-agement, research and monitoring. We found that burn severityvalues generated from remotely sensed data (dNBR) were highlycorrelated with ground measurements of burn severity (CBI) fornearly all fires in our study. This finding was similar to otherstudies (van Wagtendonk et al. 2004; Cocke et al. 2005; Eptinget al. 2005), although contrary to studies in Alaska that focussedon fire events from the summer of 2004 (Hoy et al. 2008; Murphyet al. 2008). Our results indicated that the regression equationsand strength of the correlation between dNBR and CBI variedamong fires (Table 4) and vegetation community types (Table 7).For instance, we found that dNBR was a good indicator of CBIin black spruce forests but to a lesser degree in white spruceforests.
Black spruce is the dominant boreal tree species in interiorAlaska and is often regarded as having severe, stand replacingfires; while white spruce forests are discussed in the literatureas being less flammable (Kasischke et al. 2006). A study fromCanada suggests white spruce stands are less likely to burnthan black spruce stands (Cumming 2001).Yet, very few studies
Boreal forest and tundra burn severity Int. J. Wildland Fire 471
Table 7. Results of linear regressions for CBI as a factor of dNBR when plots are pooled by pre-firevegetation types
Pre-fire Number Slope y-intercept Adjusted R2 F-statistic (d.f.) P valuevegetation type of plots
Black spruce 134 0.00195 0.344 0.722 347.07 (1132) <0.0001White spruce 44 0.00186 0.550 0.583 61.078 (1.42) <0.0001Tundra 93 0.00184 0.460 0.628 156.38 (1.91) <0.0001Deciduous 14 0.0019 0.813 0.685 29.28 (1.12) <0.0001
3.0
2.5
2.0
1.5
1.0
0.5
0.0
CB
I
�200 0 200 400 600 800 1000 1200
dNBR
Fig. 5. Relationship of dNBR v. CBI grouped by pre-fire vegetation types.Vegetation types for plots are symbolised as follows: black spruce, circlesand solid line; white spruce, triangles and dash/dot line; deciduous, squaresand long dash line; and tundra, diamonds and short dash line.
have documented the burn severity of white spruce stands onthe ground (but see Wang 2002). Our results suggest that whitespruce and mixed-white spruce upland forests have the potentialto burn just as severely as black spruce. We found that whitespruce stands had the highest average severity values for bothCBI and dNBR. Most of these plots were in Yukon–Charley (37out of 44 plots), occurred on steep slopes, and had >25% canopycover (not shown); a combination often related to high intensityfires within conifer forests, regardless of species (Johnson 1992).
We found that CBI values from black spruce forests had thebest overall fit with dNBR (R2 = 0.72), while the CBI valuesfrom the higher severity white spruce forests we sampled hadthe poorest fit (R2 = 0.58). The poor fit may be attributed to thepotential for dNBR to level off at high severities. For instance,van Wagtendonk et al. (2004) found an asymptote in the relation-ship that occurred around 750 dNBR or ∼2.5 CBI. Our resultsalso indicate a leveling off of the correlation between CBI anddNBR at higher severity levels. The poor fit may also be a resultof the narrow range in burn severity, with a majority of the plotshaving CBI scores greater than one (on a scale of 0 to 3) (Fig. 4).
Based on fire behaviour modelling, we expect low sever-ity surface fires to occur within deciduous forest types (VanWagner 1983; Johnson 1992). Studies in Canada that compared
mixed-wood forests found that fire behaviour models predictedlower intensity fires in forests with a greater deciduous compo-nent (Hely et al. 2000) and a ground-based study showed thatburn severity increased with conifer density (Wang 2002). AnAlaskan study that was based entirely on remote sensing dataalso reported lower burn severity in deciduous compared withconiferous forests on flat terrain (Duffy et al. 2007). Withinour study, the deciduous vegetation types had the lowest averagedNBR values, compared with the other vegetation classes. How-ever, we found that the overall CBI scores were not lowest fordeciduous forests (Fig. 4).This suggests that in deciduous forestsdNBR values underestimate severity on the ground and, there-fore, a different scale of severity should be used. However, weare not sure whether this result is specific to our study, since wehad a small sample size (14 deciduous plots) and late timing ofscene imagery collection. Most of the deciduous plots were fromYUCH. The late scene imagery (mid-September) used for theYUCH fires may have resulted in lower dNBR values. Leaf-offappears to have occurred in the pre-fire scene (data not shown),which could have caused an underestimation of dNBR values oraltered detection of dNBR in deciduous stands.
The tussock tundra and low shrub-tussock tundra plots wesampled had the lowest ground severity overall (Fig. 4).Althoughfew studies have documented severity in tundra ecosystems, thisis not surprising because of the rapid fire spread (less smoulder-ing) and the generally mesic sites where tussock tundra occurs.However, we did sample some high severity sites where the tus-sock cottongrass (Eriophorum vaginatum L.) was killed off bythe fire. Overall the tundra fires from the north-west (B001,A526 and A520) had strong correlations between dNBR andCBI when analysed by fire (Table 4). The fit of the regression,however, was poorer when data was pooled across fires (tundraR2 = 0.63, Table 7).
In comparing dNBR assessment types our results suggestthere may be no difference between initial and extended assess-ments within black spruce forests, but a significant differencewithin the tundra vegetation class (Fig. 7), where the extendedassessments had significantly steeper slopes than initial assess-ments. This indicates that for the same level of ground severity,initial assessments will have higher values of dNBR thanextended assessments in tundra ecosystems. This is not sur-prising. In general, unless fires are severe, most shrub-tussocktundra types re-vegetate rapidly (Racine et al. 1987; Racine et al.2004), even within weeks following the fire. Therefore, similarto other grassland types (Zhu et al. 2006), tundra fires are likelyto show less difference in dNBR one year post-fire than sites

472 Int. J. Wildland Fire J. L. Allen and B. Sorbel
Table 8. ANCOVA comparing regressions of CBI and dNBR when grouped by pre-fire vegetationtypes
Source Sum of squares d.f. Mean square F-statistic P value(Type III)
Corrected model 100.524A 4 25.131 170.118 <0.0001Intercept 17.760 1 17.760 120.221 <0.0001dNBR (covariate) 85.285 1 85.285 577.316 <0.0001Vegetation type (fixed) 2.842 3 0.947 6.413 <0.0001Error 41.363 280 0.148Total 695.055 285Corrected total 147.887 284
AAdjusted R2 = 0.704.
3.0
2.5
2.0
1.5
1.0
0.5
0.0
CB
I
�200 0 200 400 600 800 1000 1200
dNBR
Fig. 6. Relationship of dNBR and CBI by type of assessment (initial orextended). The solid line shows the regression line for initial assessmentplots, the dashed line shows the regression for the extended assessment. Ini-tial assessment linear regression shown: CBI = 0.00185 × dNBR + 0.4539(F = 300.96, R2 = 0.65, P < 0.0001). Extended assessment linear regres-sion shown: CBI = 0.00192 × dNBR + 0.4394 (F = 366.44, R2 = 0.74,P < 0.0001). There was no significant difference between the two types ofassessments.
with large trees or major structural or vegetation changes in thesame amount of time.
When we pooled all the tundra plots together (irrespective offire) it appeared that the initial assessment of tundra plots hada lower R2 value than the extended assessment (0.44 v. 0.81).However, the poor fit in the initial assessment tundra plots waslargely driven by six plots from the Yukon–Charley B248 fire.When these six plots were removed, the R2 for the initial assess-ment of tundra plots improved to 0.78 (Fire B001, Table 4). Thesix low shrub/tussock tundra sites from B248 appeared to bethe outliers to the overall dNBR–CBI relationship within thisfire. For almost all of these plots, we had lower ground severityscores than expected for the dNBR values. Epting et al. (2005)discussed the B248 fire inYukon–Charley and attributed the poor
3.0
2.5
2.0
1.5
1.0
0.5
0.0
CB
I
�200 0 200 400 600 800 1000 1200
dNBR
3.0
2.5
2.0
1.5
1.0
0.5
0.0
CB
I
�200 0 200 400 600 800 1000 1200
dNBR
Tundra
Black spruce(a)
(b)
Fig. 7. The relationship between CBI and dNBR grouped by pre-fire veg-etation and assessment types. Black spruce plots are shown in the top graph,tundra plots in the bottom graph. Initial assessment plots are shown withcircles and the fit line is solid. Extended assessment plots are shown withsquares and the fit line is dashed. A significant difference in the slopes wasdetected among assessment types for tundra plots.

Boreal forest and tundra burn severity Int. J. Wildland Fire 473
Table 9. Results of linear regressions for CBI as a factor of dNBR when plots are pooled by pre-firevegetation types and assessment type
Assessment Pre-fire Slope y-intercept Adjusted R2 F-statistic (d.f.) P valuetype vegetation type
Initial Black spruce 0.0019 0.393 0.723 212.36 (1,80) <0.0001Extended Black spruce 0.0020 0.242 0.731 139.56 (1,50) <0.0001Initial Tundra 0.0014 0.349 0.429 19.02 (1,23) 0.0002Extended Tundra 0.0022 0.441 0.805 276.93 (1,66) <0.0001
fit to problems with mapping severity in sites with low shrub andherbaceous types, particularly in relation to the late scene datesof the imagery (mid-September). In addition, because we col-lected our ground data two years post-fire in Yukon–Charley, itmay have been more difficult to determine the impacts of fire inrapidly regenerating tundra sites.
Burn severity within northern regions is often addressedin terms of surface organic matter consumption, particularlywithin boreal forests (e.g. Viereck 1983; Kasischke and John-stone 2005; Johnstone and Chapin 2006). The reduction ofsoil organic materials influences plant reproductive capabilities(Zasada 1986; Johnstone and Kasischke 2005; Johnstone andChapin 2006), carbon emissions (Kasischke et al. 2000) and per-mafrost (Yoshikawa et al. 2002). We found that substrate severityscores were highly correlated with dNBR within our study. Thiswas surprising, since it has been suggested that remotely sensedimagery is more likely to detect fire effects on tree crowns thanon the ground (Hudak et al. 2004). The open-woodland canopiesof black spruce probably allowed for detection of ground impactsby the satellite sensor and in addition over one-third of our plotswere in treeless tundra. The utility of detecting organic materialconsumption using 30-m resolution Landsat imagery dependson the scale of application. The scale of dNBR values is likelyto be too coarse to predict regeneration strategies for plants orimpacts on permafrost at a plot level, particularly with regard tothe variability and patchiness of consumption within a given area(Dyrness and Norum 1983). However, it may be useful in pre-dicting broad scale vegetation patch mosaic changes, detectingpotential erosion areas or estimating carbon emissions.
Within our study, we detected a significant difference in theCBI–dNBR relationship among the fires. The variability can bepartially attributed to the differences in vegetation and possiblyassessment type, but overall we found that the data fit best whenanalysed by individual fire. This raises the question of whethera single equation can be used to define severity to allow forcomparisons of fires across time and space. We considered twonormalisation methods: the relative dNBR (RdNBR) and cali-brating the dNBR by subtracting the mean unburned bias (Zhuet al. 2006; Miller and Thode 2007). Miller and Thode (2007)assessed a technique called the RdNBR, which measures burnseverity relative to the amount of pre-fire vegetation available. Inareas of the Sierra Nevada with heterogeneous vegetation cover,Miller and Thode (2007) found that the RdNBR improved clas-sification accuracies of the high burn severity category. In aregional analysis of our data, the RdNBR transformation did notappear to improve our results in comparison with the dNBR (Zhu
et al. 2006). Although we had varying vegetation types, we didnot have the sparse vegetation types in which the advantages ofthe RdNBR approach are more apparent. We also assessed nor-malising the dNBR by subtracting the mean unburned bias. Wefound that subtracting the mean unburned bias in each assess-ment did not change the R2 values for the linear regressions byfire, but did alter the y-intercepts for each fire (J. L. Allen andB. Sorbel, unpubl. data). However, it did not appear to adequatelynormalise the data and significant differences were still detectedamong the fires. While there may be advantages to using theseapproaches for comparison of multiple assessments, we foundthat neither method removed the variability found amongst therelationships of the fires.
Conclusions
In our study, we found that burn severity mapping using Land-sat TM/ETM+ imagery captured the heterogeneous nature offire and offers a more complete description and quantificationof fire’s effect on the landscape. Currently, such burn severitymaps are used to refine and improve final fire perimeters by firemanagement. In addition, burn severity maps provide a meansto identify unburned islands within a burned area, which canbe used to determine whether study sites within a fire perimeterhave burned and to what degree of impact. In fire prone areas,burn severity data products provide a means to update fuels andvegetation GIS datasets that, without intervention, are made lessaccurate and relevant with each passing fire season. Severity datamay also be used as a key explanatory variable for vegetation,wildlife, water quality or permafrost monitoring or research.
Within our study we detected some interesting trends regard-ing the variation of burn severity among the four vegetationtypes sampled; however, we feel that further research is war-ranted in the area of burn severity and fire behaviour in whitespruce, deciduous forests, and tundra vegetation types. Our com-parisons of initial and extended assessments were largely basedon pooled data. Fire B288 was the only instance where bothassessment types could be compared directly on the same fire.Relying largely on pooled data for comparison of the assess-ment types may have masked differences among the assessmenttypes (Fig. 6). Although we feel there is a difference in tundrafires between initial and extended assessment, a more direct testwould be to compare fires mapped by both assessment types.
Our results indicated that dNBR values were strongly corre-lated with field measurements of burn severity using the CBI.However, this contrasts with recent findings in Alaskan boreal

474 Int. J. Wildland Fire J. L. Allen and B. Sorbel
forests (Hoy et al. 2008; Murphy et al. 2008). One differenceamong these studies is that we sampled over several years andover a wide range of severity, unlike the other studies that sam-pled mostly high severity sites from fires that burned during therecord breaking fire season of 2004. The dNBR may have prob-lems differentiating between severity levels at the high end of theburn severity range, as we found in our white spruce sites. Werecognise there are limitations to using dNBR, and the inabilityto distinguish high severity areas could be problematic. However,at this time there does not appear to be a clear explanation forthe overall discrepancy in results between studies of burn sever-ity in Alaska. Based upon our results, we feel that the dNBRapproach offers a prescription that can be used to meet many ofthe currently existing fire and resource management needs for areliable form of burn severity mapping in Alaska.
AcknowledgementsThanks to the staff of the National Park Service Eastern and Western AlaskaArea Fire Management Programs for their assistance in collecting burn sever-ity plot information. Special thanks go to Marsha Henderson, Larry Weddle,and Ken Adkisson for their valuable assistance with project planning andfield work logistics. We also thank the Doyon Native Corporation for grant-ing access to land within the boundary of Yukon–Charley Rivers NationalPreserve and the State of Alaska Department of Natural Resources for grant-ing access to land burned by the Milepost 85 fire. Thanks to Karen Murphywith the US Fish and Wildlife Service and Jennifer Hrobak with the Bureauof Land Management for their assistance in fieldwork on the Milepost 85fire. The authors thank the staff at the USGS EROS Data Center, particu-larly Stephen Howard, Don Ohlen, and Kari Pabst, for completing all sceneacquisition and image processing work. Also, thanks to Carl Key and NateBenson for all their assistance. Finally, the authors wish to recognise BradCella for his leadership, guidance and constant support.
ReferencesBureau of Land Management (2006) Alaska large fire history database
(AKFIREHIST). Available at http://agdc.usgs.gov/data/blm/fire/index.html [Verified 8 July 2008]
Cocke AE, Fulé PZ, Crouse JE (2005) Comparison of burn severity assess-ments using Differenced Normalized Burn Ratio and ground data. Inter-national Journal of Wildland Fire 14, 189–198. doi:10.1071/WF04010
Cumming SG (2001) Forest type and wildfire in the Alberta borealmixedwood: What do fires burn? Ecological Applications 11, 97–110.doi:10.1890/1051-0761(2001)011[0097:FTAWIT]2.0.CO;2
Dissing D, Verbyla D (2003) Spatial patterns of lightning strikes in interiorAlaska and other relations to elevation and vegetation. Canadian Journalof Forest Research 33, 770–782. doi:10.1139/X02-214
Duffy PA, Epting J, Graham JM, Rupp TS, McGuire AD (2007) Analysis ofAlaskan burn severity patterns using remotely sensed data. InternationalJournal of Wildland Fire 16, 277–284. doi:10.1071/WF06034
Dyrness CT, Norum RA (1983) The effects of experimental fires on blackspruce forest floors in interior Alaska. Canadian Journal of ForestResearch 13, 879–893. doi:10.1139/X83-118
Epting J, Verbyla D, Sorbel B (2005) Evaluation of remotely sensedindices for assessing burn severity in interior Alaska using Land-sat TM and ETM+. Remote Sensing of Environment 96, 328–339.doi:10.1016/J.RSE.2005.03.002
French NHF, Kasischke ES, Hall RJ, Murphy KA, Verbyla DL, Hoy EE,Allen JL (2008) Using Landsat data to assess fire and burn severityin the North American boreal forest region: an overview and sum-mary of results. International Journal of Wildland Fire 17, 443–462.doi:10.1071/WF08007
Hely C, Bergeron Y, Flannigan MD (2000) Effects of stand composition onfire hazard in mixed-wood Canadian boreal forest. Journal of VegetationScience 11, 813–824. doi:10.2307/3236551
Hoy EE, French NHF, Turetsky MR, Trigg SN, Kasischke ES (2008)Evaluating the potential of Landsat TM/ETM+ imagery for assessingfire severity in Alaskan black spruce forests. International Journal ofWildland Fire 17, 500–514. doi:10.1071/WF08107
Hudak AT, Robichaud PR, Evans JB, Clark J, Lannom K, Morgan P,Stone C (2004) Field validation of Burned Area Reflectance Classifi-cation (BARC) products for post fire assessment. In ‘Remote sensingfor field users: proceedings of the 10th Forest Service Remote SensingApplication Conference’, 5–9 April 2004, Salt Lake City, UT. On CD-ROM. (American Society for Photogrammetry and Remote Sensing:Bethesda, MD)
Johnson EA (1992) ‘Fire and vegetation dynamics: studies from NorthAmerican boreal forest.’ (Cambridge University Press: New York)
Johnson EA, Miyanishi K (Eds) (2001) ‘Forest fires behavior and ecologicaleffects.’ (Academic Press: San Diego, CA)
Johnstone JF, Chapin FS, III (2006) Effects of soil burn severity onpost-fire tree recruitment in boreal forest. Ecosystems 9, 14–31.doi:10.1007/S10021-004-0042-X
Johnstone JF, Kasischke ES (2005) Stand-levels effects of soil burn sever-ity on postfire regeneration in a recently burned black spruce forest.Canadian Journal of Forest Research 35, 2151–2161. doi:10.1139/X05-087
Kasischke ES, Johnstone JF (2005) Variation in postfire organic layer thick-ness in a black spruce forest complex in interior Alaska and its effectson soil temperature and moisture. Canadian Journal of Forest Research35, 2164–2177. doi:10.1139/X05-159
Kasischke ES, O’Neill KP, French NHF, Bourgeau-Chavez LL (2000)Controls on patterns of biomass burning in Alaskan boreal forest.In ‘Fire, climate change, and carbon cycling in the North Americanboreal forest’. (Eds ES Kasischke, BJ Stocks) pp. 173–196. (Springer:New York)
Kasischke ES, Williams D, Barry D (2002) Analysis of the patterns oflarge fires in the boreal forest region of Alaska. International Journal ofWildland Fire 11, 131–144. doi:10.1071/WF02023
Kasischke ES, Rupp TS, Verbyla DL (2006) Fire trends in theAlaskan borealforest. In ‘Alaska’s Changing Boreal Forest’. (Eds FS Chapin III, MWOswood, K Van Cleve, LA Viereck, DL Verbyla) pp. 285–301. (OxfordUniversity Press: New York)
Key CH (2006) Ecological and sampling constraints on defining land-scape fire severity. Fire Ecology 2(2), 34–59. Available at http://www.fireecology.net/pdfs/vol2iss2/Key.pdf [Verified 8 July 2008]
Key CH, Benson NC (2006) Landscape Assessment (LA). In ‘FIREMON:Fire Effects Monitoring and Inventory System’. (Eds DC Lutes, REKeane, JF Carati, CH Key, NC Benson, LJ Gangi) USDA Forest Ser-vice, Rocky Mountains Research Station General Technical ReportRMRS-GTR-164-CD. p. LA-1–55. (Fort Collins, CO)
Lentile LB, Holden ZA, Smith AMS, Falkowski MJ, Hudak AT, Morgan P,Lewis SA, Gessler PE, Benson NC (2006) Remote sensing techniquesto assess active fire characteristics and post-fire effects. InternationalJournal of Wildland Fire 15, 319–345. doi:10.1071/WF05097
Miller JD, Thode AE (2007) Quantifying burn severity in a heterogeneouslandscape with a relative version of delta Normalized Burn Ratio(dNBR). Remote Sensing of Environment 109, 66–80. doi:10.1016/J.RSE.2006.12.006
Miller JD, Yool SR (2002) Mapping forest post-fire canopy consumptionin several overstory types using multi-temporal Landsat TM and ETMdata. Remote Sensing of Environment 82, 481–496. doi:10.1016/S0034-4257(02)00071-8
Murphy KA, Reynolds JH, Koltun JM (2008) Evaluating the ability of thedifferenced Normalized Burn Ratio (dNBR) to predict ecologically sig-nificant burn severity in Alaskan boreal forests. International Journal ofWildland Fire 17, 490–499. doi:10.1071/WF08050
Boreal forest and tundra burn severity Int. J. Wildland Fire 475
National Interagency Coordination Center (2007) Fire Information – Wild-land Fire Statistics.Available at http://www.nifc.gov/fire_info/lightning_human_fires.html [Verified 8 July 2008]
Racine CH, Johnson LA, Viereck LA (1987) Patterns of vegetation recov-ery after tundra fires in northwestern Alaska, USA. Arctic and AlpineResearch 19, 461–469. doi:10.2307/1551412
Racine C, Jandt R, Meyers C, Dennis J (2004) Tundra fire and veg-etation change along a hillslope on the Seward Peninsula, Alaska,USA. Arctic and Alpine Research 36, 1–10. doi:10.1657/1523-0430(2004)036[0001:TFAVCA]2.0.CO;2
Roy DP, Boschetti L, Trigg SN (2006) Remote Sensing of Fire Severity:Assessing the Performance of the Normalized Burn Ratio. IEEEGeoscience and Remote Sensing Letters 3(1), 112–116. doi:10.1109/LGRS.2005.858485
Van Wagner CE (1983) Fire behavior in northern conifer forests and shrub-lands. In ‘The role of fire in northern circumpolar ecosystems’. (EdsRW Wein, DA MacLean) pp. 65–80. (Wiley: Chichester, UK)
van Wagtendonk JW, Root RR, Key CH (2004) Comparison of AVIRIS andLandsat ETM+ detection capabilities for burn severity. Remote Sensingof Environment 92, 397–408. doi:10.1016/J.RSE.2003.12.015
Viereck LA (1983) The effects of fire in a black spruce ecosystem ofAlaska and Northern Canada. In ‘The role of fire in northern circum-polar ecosystems’. (Eds RW Wein, DA MacLean) pp. 201–220. (Wiley:Chichester, UK)
http://www.publish.csiro.au/journals/ijwf
Viereck LA, Dyrness CT, Batten AR, Wenzlick KJ (1992) The Alaska vege-tation classification. USDA Forest Service, Pacific Northwest ResearchStation, General Technical Report PNW-GTR-286. (Portland, OR)
Wang GG (2002) Fire severity in relation to canopy composition withinburned boreal mixedwood stands. Forest Ecology and Management 163,85–92. doi:10.1016/S0378-1127(01)00529-1
Yoshikawa K, Bolton WR, Romanovsky VE, Fukuda M, Hinzman LD(2002) Impacts of wildfire on the permafrost in the boreal forests ofinterior Alaska. Journal of Geophysical Research 108(NO. D1), 8148.doi:10.1029/2001JD000438
Zasada J (1986) Natural regeneration of trees and tall shrubs on forest sitesin interior Alaska. In ‘Forest ecosystems in the Alaska taiga: a synthesisof structure and function’. (Eds K Van Cleve, FS Chapin, PW Flanagan,LA Viereck, CT Dyrness) pp. 44–73. (Springer Verlag: New York)
Zhu Z, Key C, Ohlen D, Benson N (2006) Evaluate Sensitivities ofBurn-Severity Mapping Algorithms for Different Ecosystems and FireHistories in the United States: Final Report to the Joint Fire Sci-ence Program. Available at http://jfsp.nifc.gov/projects/01-1-4-12/01-1-4-12_Final_Report.pdf [Verified 8 July 2008]
Manuscript received 26 February 2008, accepted 17 March 2008