Embed Size (px)
Citation preview
Results of the National Micronutrient Survey in
Malawi
18 June 2003

Overview of presentation
• Background and objectives• Methods• Demographics• Anthropometry• Morbidity• Food consumption• Iodine• Vitamin A• Anemia and iron deficiency• Summary findings

BACKGROUND AND OBJECTIVES
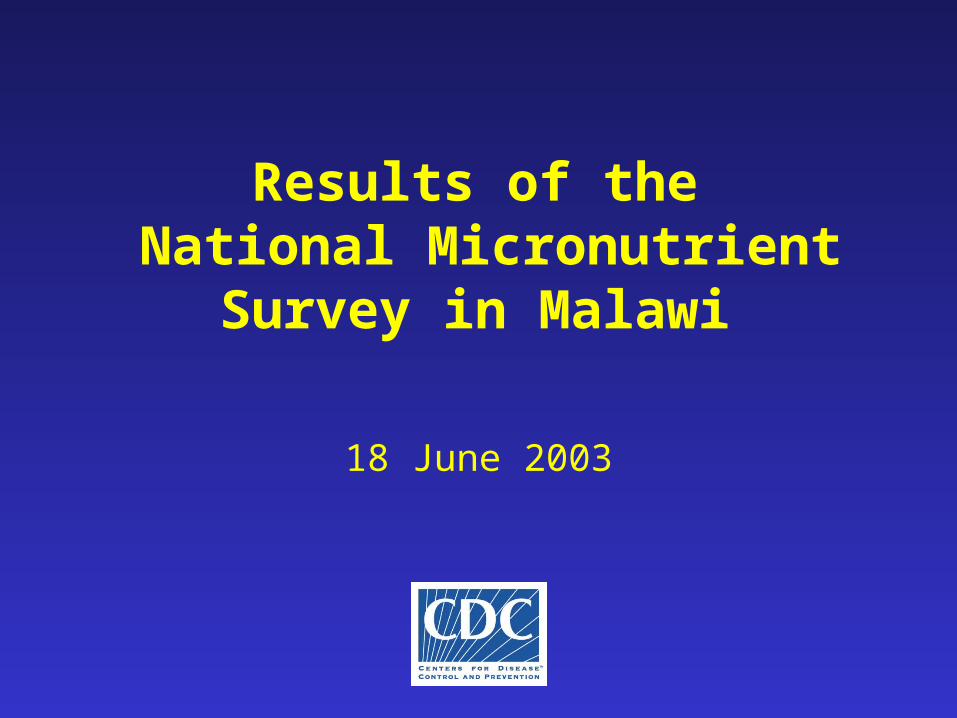
Purpose of National Survey
• Data for Advocacy– Existing data was clinical and localized– Government of Malawi in process of creating sector
investment programs and poverty reduction strategies– Need national data to make micronutrient interventions a
national priority
• Baseline for monitoring – Need information to support for future MN interventions,
especially for fortification
• Support future communication efforts
• Capacity building
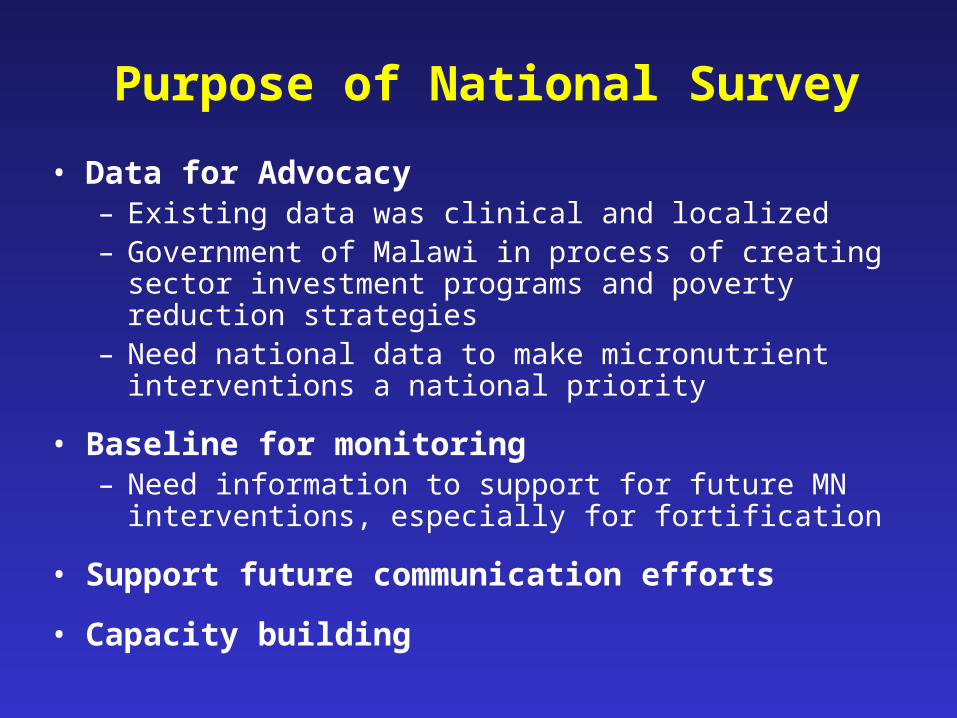
Survey Objectives
• To determine the prevalence of vitamin A deficiency as a public health problem in target groups
• To determine the prevalence and nature of anemia with respect to iron deficiency, parasites and infections as a public health problem in target groups
• To determine the magnitude of iodine deficiency among primary school aged children as a proxy for the total population
• Validate the identified food vehicles for fortification and estimate levels of consumption

METHODS
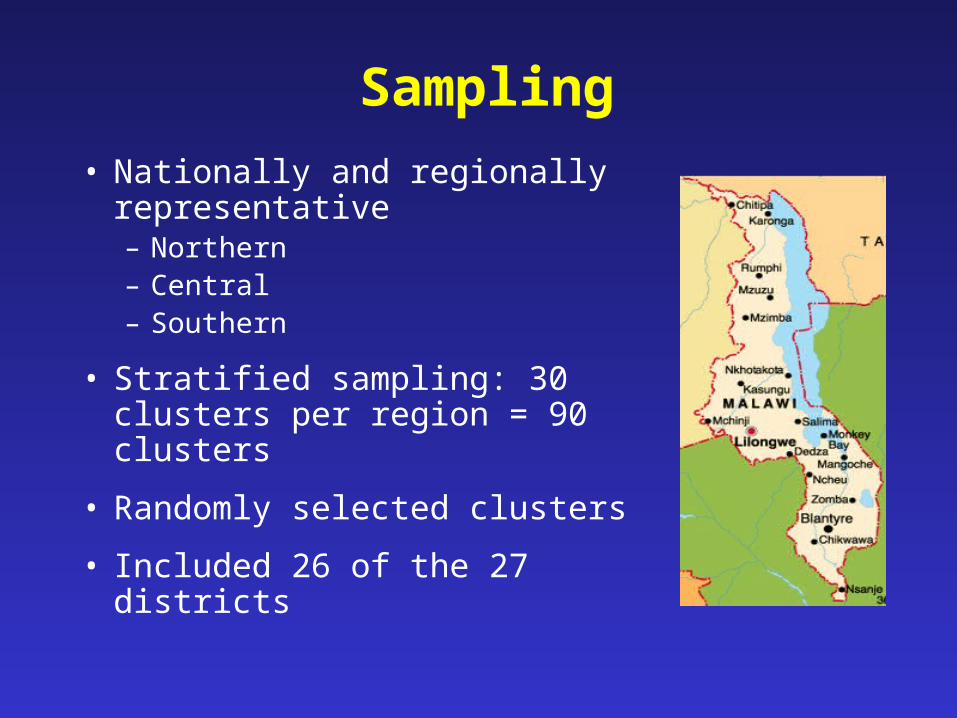
Sampling
• Nationally and regionally representative– Northern– Central – Southern
• Stratified sampling: 30 clusters per region = 90 clusters
• Randomly selected clusters
• Included 26 of the 27 districts
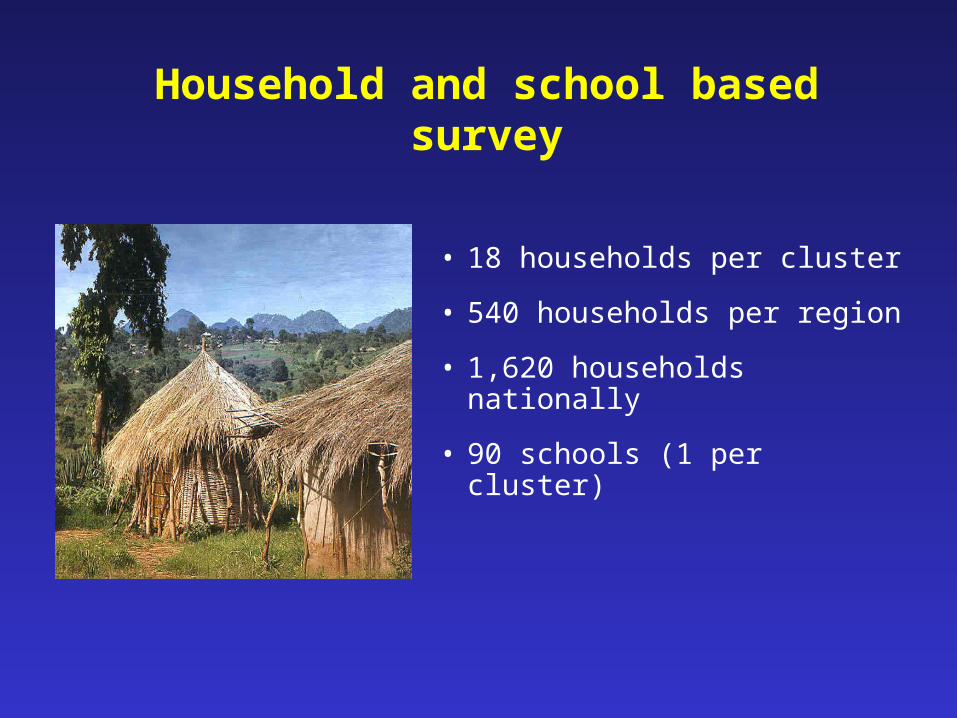
Household and school based survey
• 18 households per cluster
• 540 households per region
• 1,620 households nationally
• 90 schools (1 per cluster)

Target Groups
• Preschool children (6-36 months)
• School children (6-12 years)
• Women of childbearing age (15-45 years)
• Men (20-55 years)

Total sample by target group
Preschool children 548
School children 701
Women of childbearing age Non-pregnant 475Pregnant 57
Men 161

Vitamin A and Iodine Indicators
• Vitamin A– Serum retinol
• Iodine– Test household salt– Salt titration– Urinary iodine
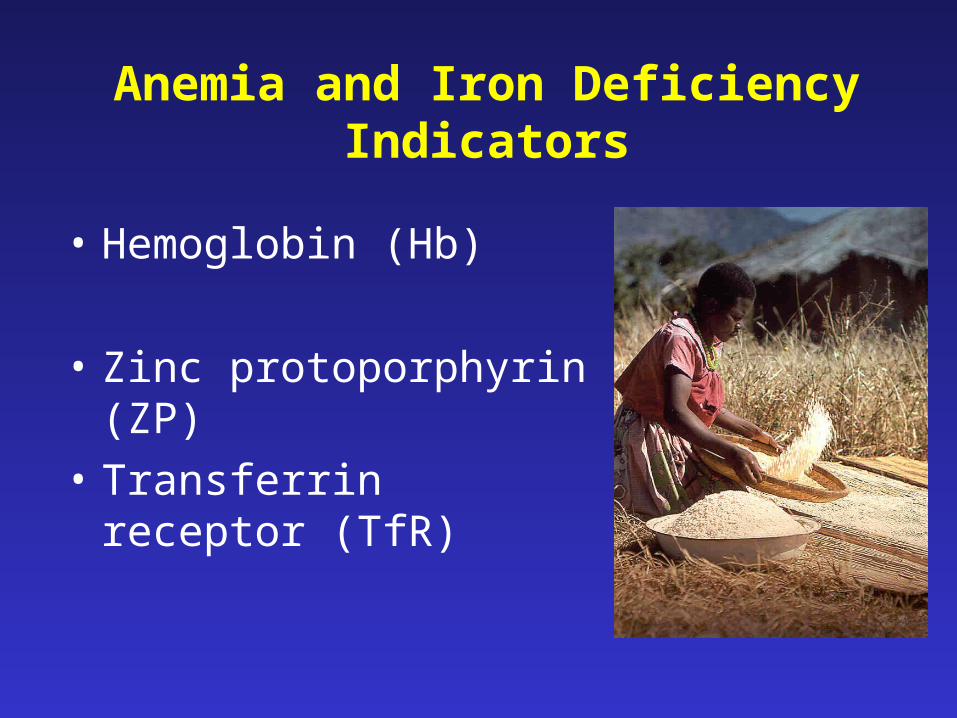
Anemia and Iron Deficiency Indicators
• Hemoglobin (Hb)
• Zinc protoporphyrin (ZP)
• Transferrin receptor (TfR)

Parasitic infection indicators
• Malaria• Urinary schistosomiasis• Intestinal parasites
–Hookworm–Roundworm–Schistosoma mansoni

General Household Questionnaire
• Demographics & socioeconomic status
• Knowledge of anemia, vitamin A and iodized salt
• Breastfeeding history
• Supplementation
• Health history
• Consumption of centrally processed foods
Fortification Rapid Assessment Tool (FRAT)
• National sample only• Targeted 24 hour dietary recall • Centrally processed staple foods
– Sugar– Oil– Maize flour – Complementary food
• Quantity consumed to set levels of fortification

Biological Sample Collection Procedures
• Malaria thick smears• Microtainers to collect capillary blood samples
– Hemoglobin with HemoCue– Whole blood for biochemical analysis – Dried blood spots– Spun down blood for serum
• Stool samples for intestinal parasites (school children only)
• Urine sample for iodine and urinary schistosomiasis (school children only)
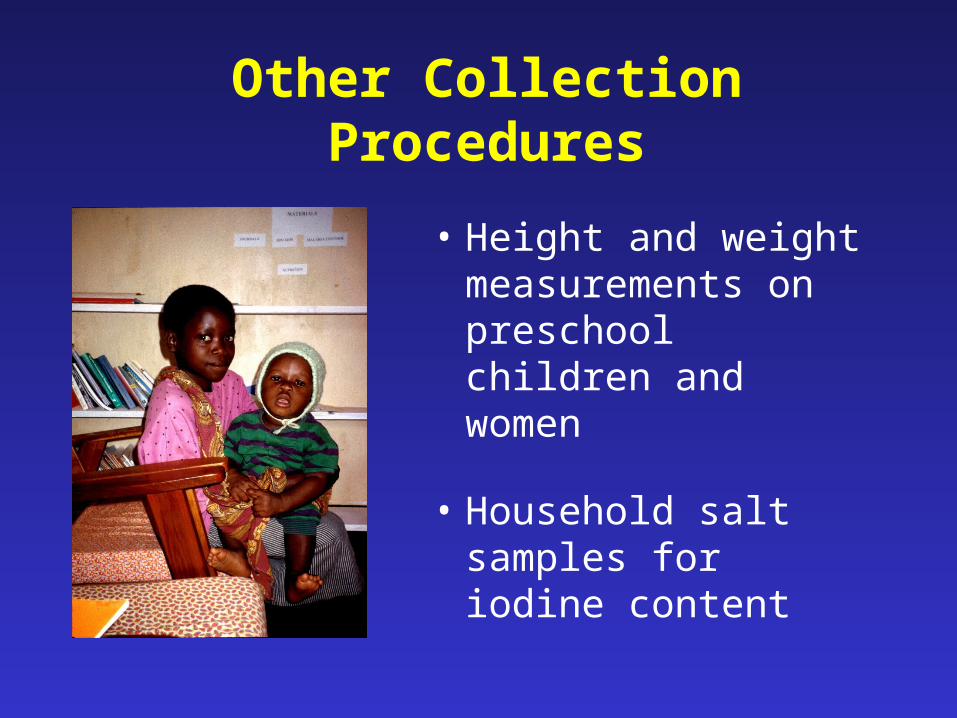
Other Collection Procedures
• Height and weight measurements on preschool children and women
• Household salt samples for iodine content
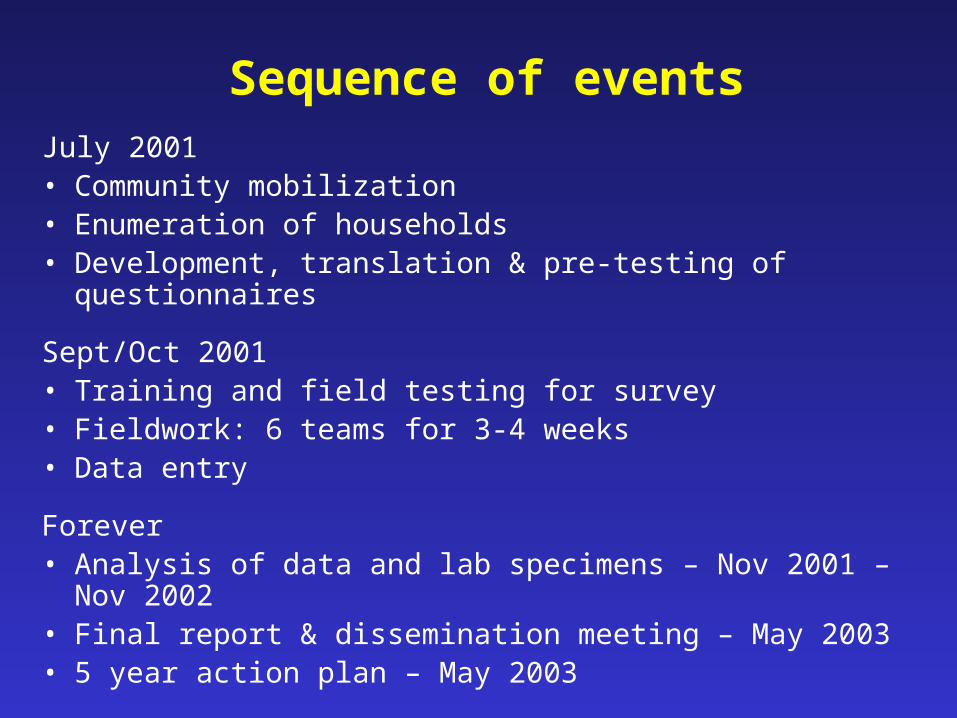
Sequence of eventsJuly 2001• Community mobilization• Enumeration of households• Development, translation & pre-testing of questionnaires
Sept/Oct 2001• Training and field testing for survey• Fieldwork: 6 teams for 3-4 weeks• Data entry
Forever• Analysis of data and lab specimens – Nov 2001 – Nov 2002• Final report & dissemination meeting – May 2003• 5 year action plan – May 2003

DEMOGRAPHICS
•Age and Sex
•Residence – urban and rural
•Formal Education
•Socioeconomic status index
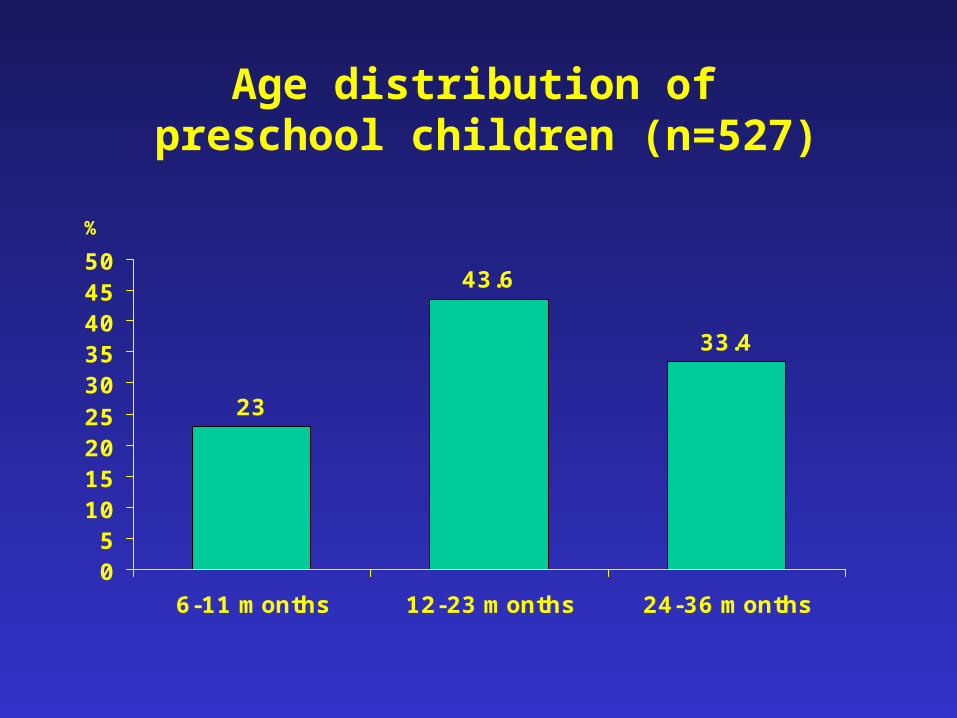
Age distribution of preschool children (n=527)
23
43.6
33.4
05
101520253035404550
6-11 months 12-23 months 24-36 months
%
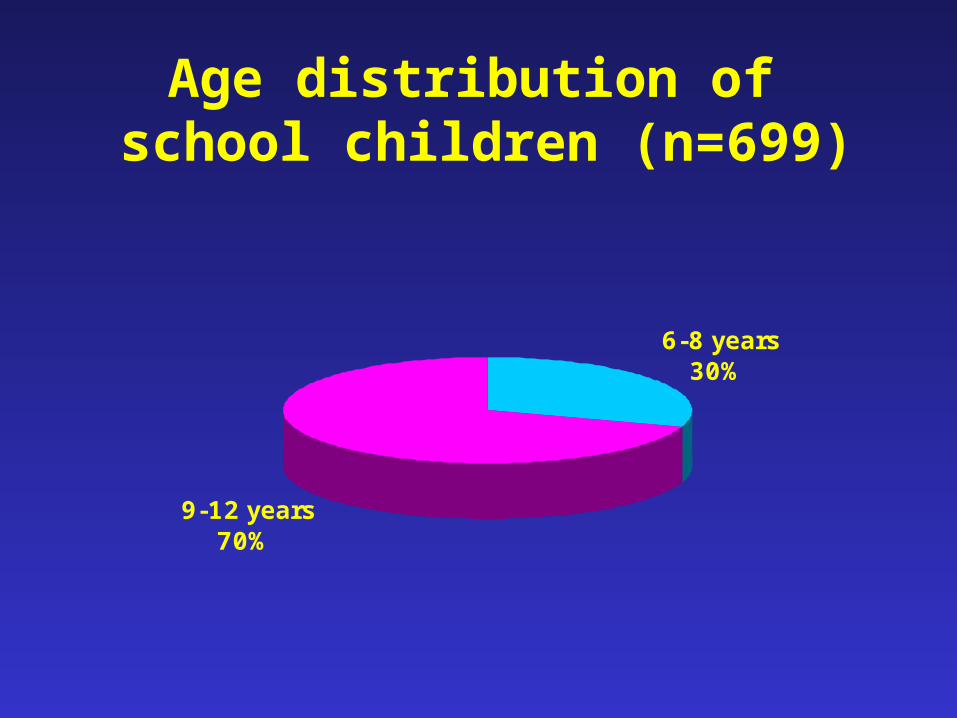
Age distribution of school children (n=699)
9-12 years70%
6-8 years30%
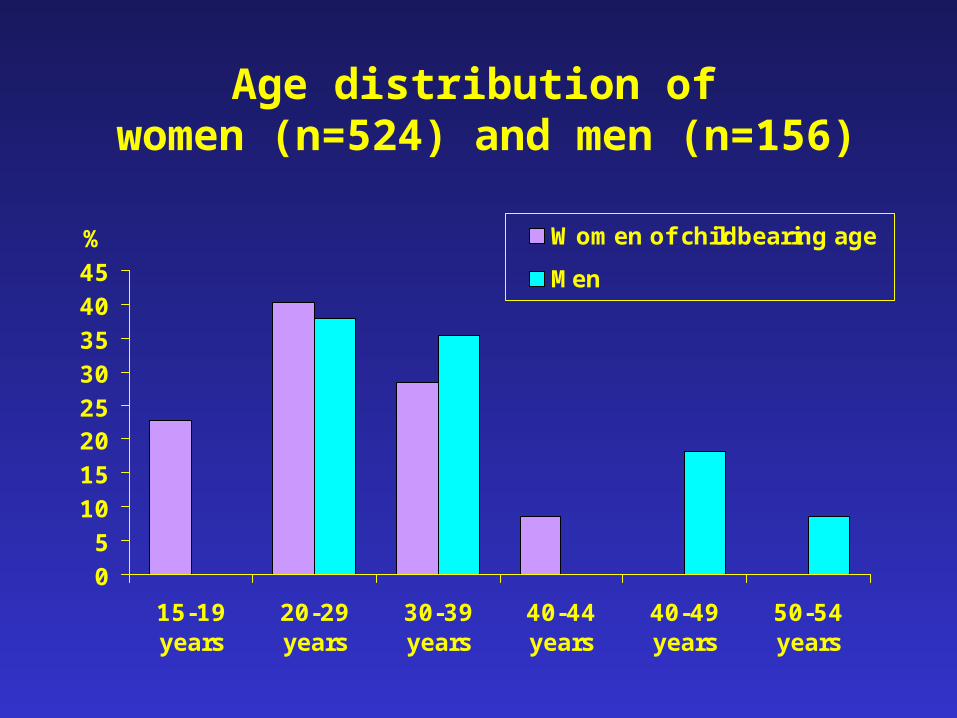
Age distribution of women (n=524) and men (n=156)
05
1015202530354045
15-19years
20-29years
30-39years
40-44years
40-49years
50-54years
Women of childbearing age
Men
%

Residence of respondents
88 87 87
12 13 13 10
90
Malawi Northern Central Southern
Rural Urban
Pe r
c en
t ag e

Education of respondents
24
38
25
11
3836
1414
No Education Up to Std 5 Std 6 - 8 Sec & above
Women Men
Per
cen
tage
of
wo m
en a
nd
me n

Socioeconomic status (SES) Index
• Composite index composed from household data on:– cooking fuel– water source– sanitary facilities– material of roof and floor– number of rooms – ownership of various assets
• Sufficient information was available for 90% of the sample.
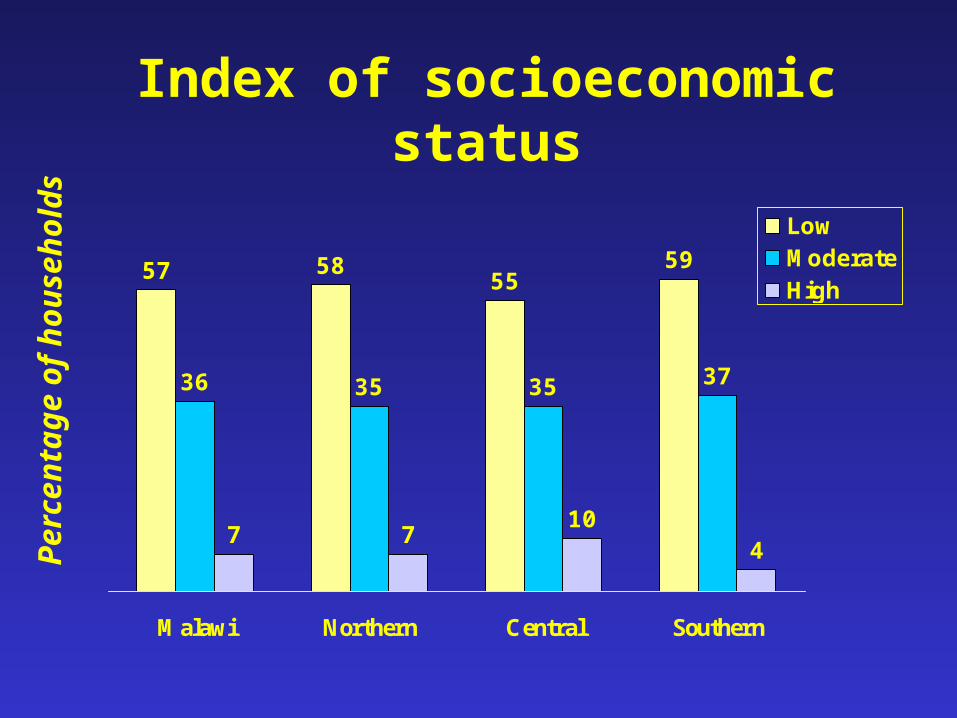
Index of socioeconomic status
57 5855
36 35 35 37
7 710
4
59
Malawi Northern Central Southern
LowModerateHigh
Pe r
c en
t ag e
of
hou
s eh
o ld s

ANTHROPOMETRY

National Height-for-age Z-score (HAZ)Distribution Curve
-6-5-4-3-2-1012345
z-Score
Reference
%
National data is weighted to account for survey design.
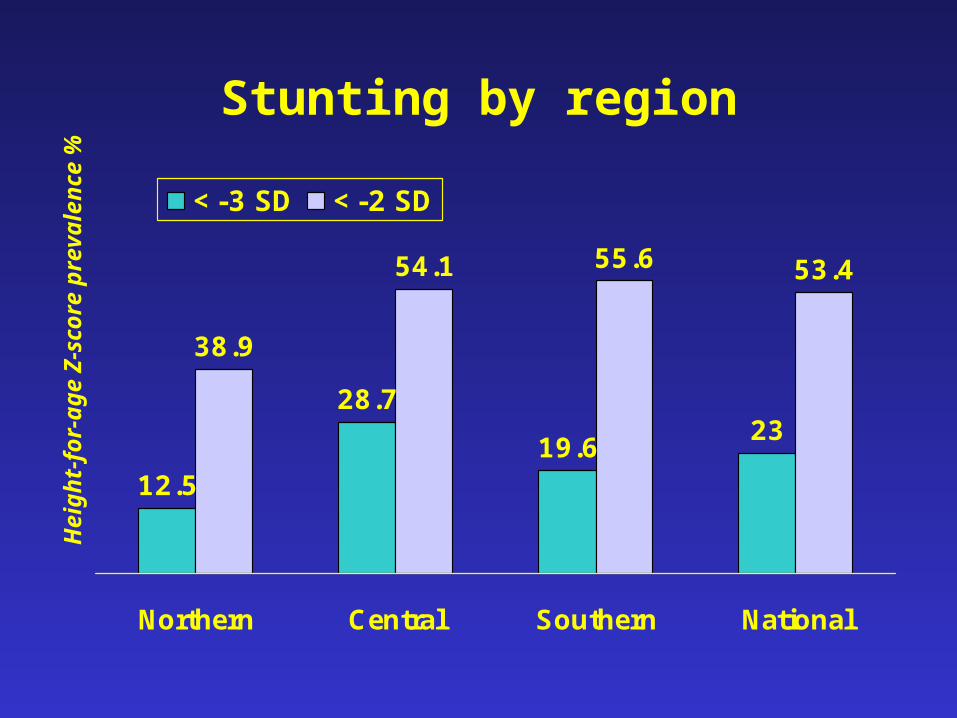
Stunting by region
12.5
28.7
19.623
38.9
54.1 55.6 53.4
Northern Central Southern National
<-3 SD <-2 SD
Hei
ght-
for-
age
Z-s
core
pre
vale
nce
%
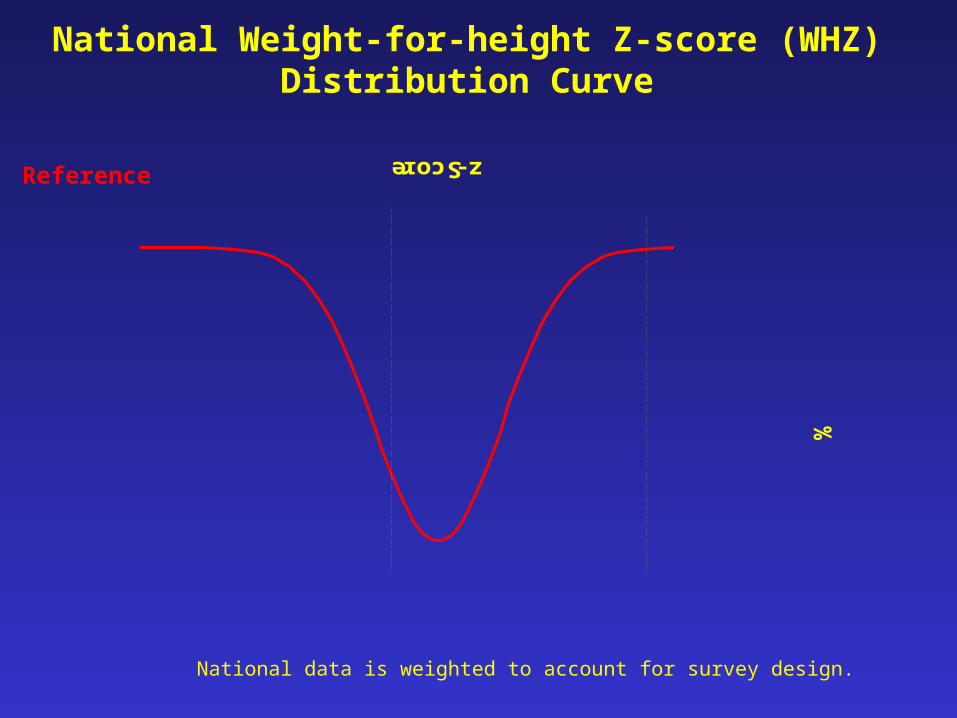
National Weight-for-height Z-score (WHZ) Distribution Curve
0
5
10
15
20
25
-5-4-3-2-1012345
z-Score
%
Reference
National data is weighted to account for survey design.
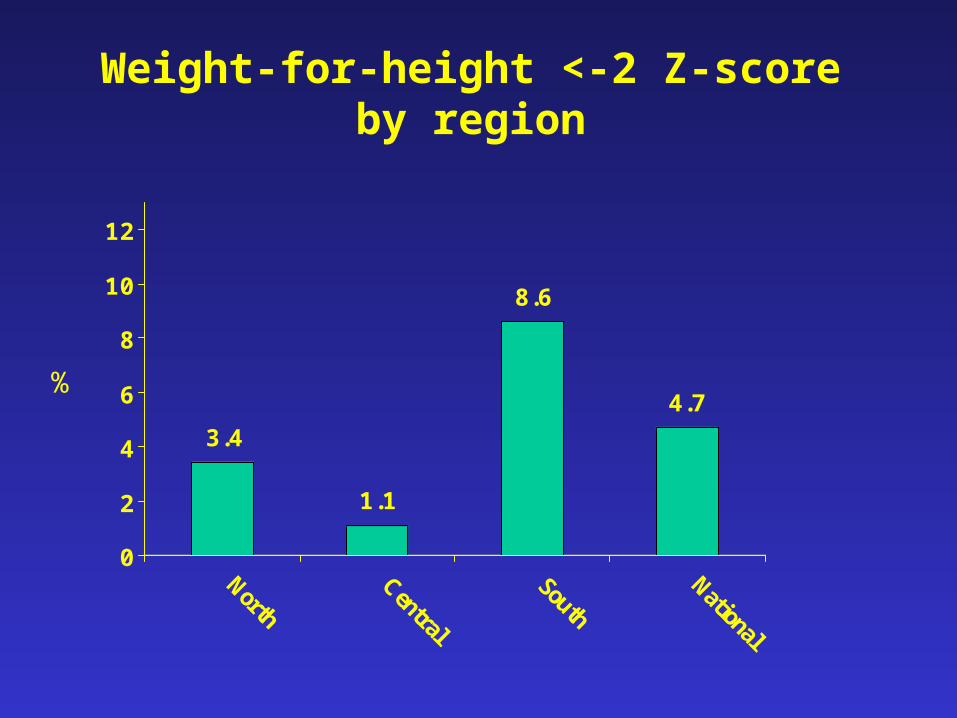
Weight-for-height <-2 Z-scoreby region
3.4
1.1
8.6
4.7
0
2
4
6
8
10
12
NorthCentral
South
National
%

Weight-for-age Z-score (WAZ) by Age
11.48.9
4.9
29.833.8
28.6
0
5
10
15
20
25
30
35
40
6-11 months 12 - 23 months 24 - 36 months
<-3 SD<-2 SD
%

Summary of anthropometry results for preschool children
23
8
0
53
31
5
STUNTING(HAZ)
UNDERWEIGHT(WAZ)
WASTING(WHZ)
<-2 SD
<-3 SD
Percentage of children 6-36 months

Body Mass Index for non-pregnant women of childbearing age
6.7
82.8
8.12.4
0
10
20
30
40
50
60
70
80
90
<18.5 18.5 - 24.9 25.0-29.9 >30.0
%
Body Mass Index

MORBIDITY
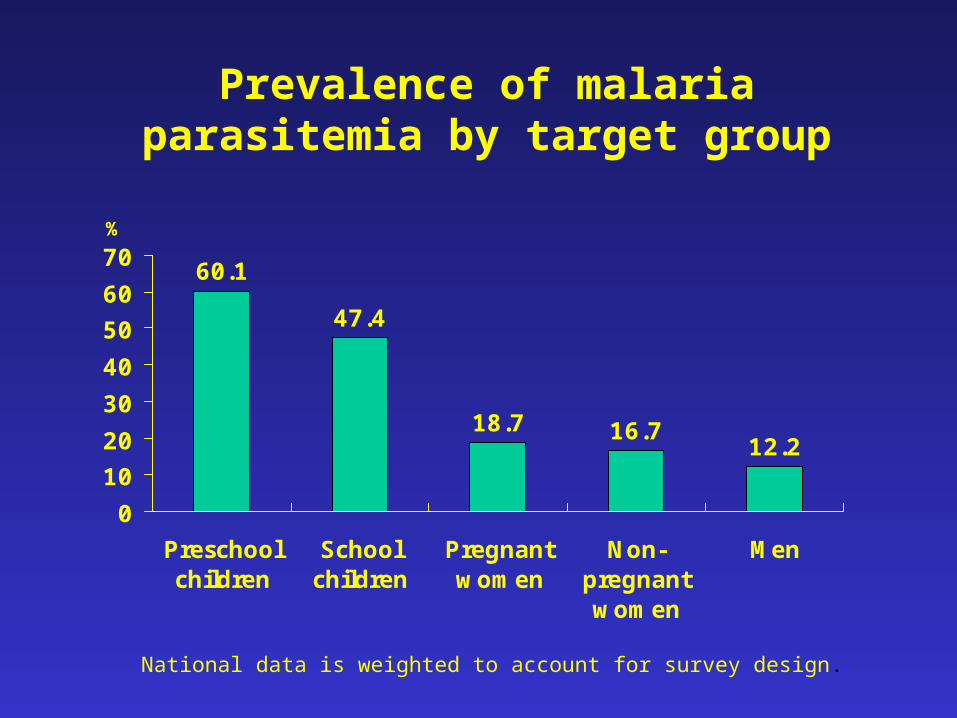
Prevalence of malaria parasitemia by target group
60.1
47.4
18.7 16.712.2
0
10
20
30
40
50
60
70
Preschoolchildren
Schoolchildren
Pregnantwomen
Non-pregnantwomen
Men
%
National data is weighted to account for survey design.
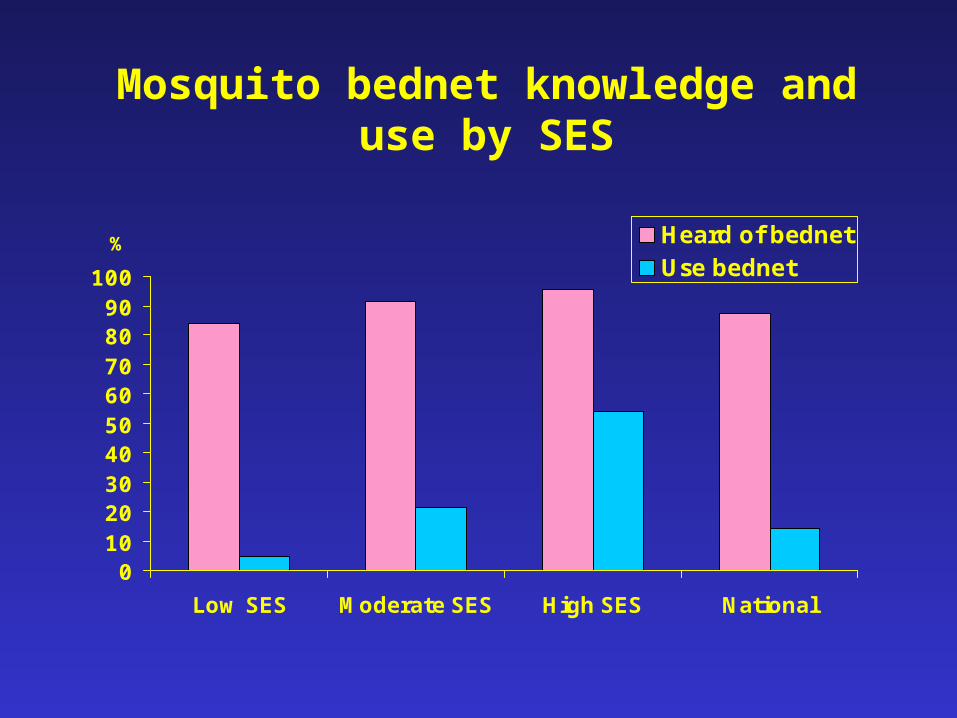
Mosquito bednet knowledge and use by SES
0102030405060708090
100
Low SES Moderate SES High SES National
Heard of bednetUse bednet
%
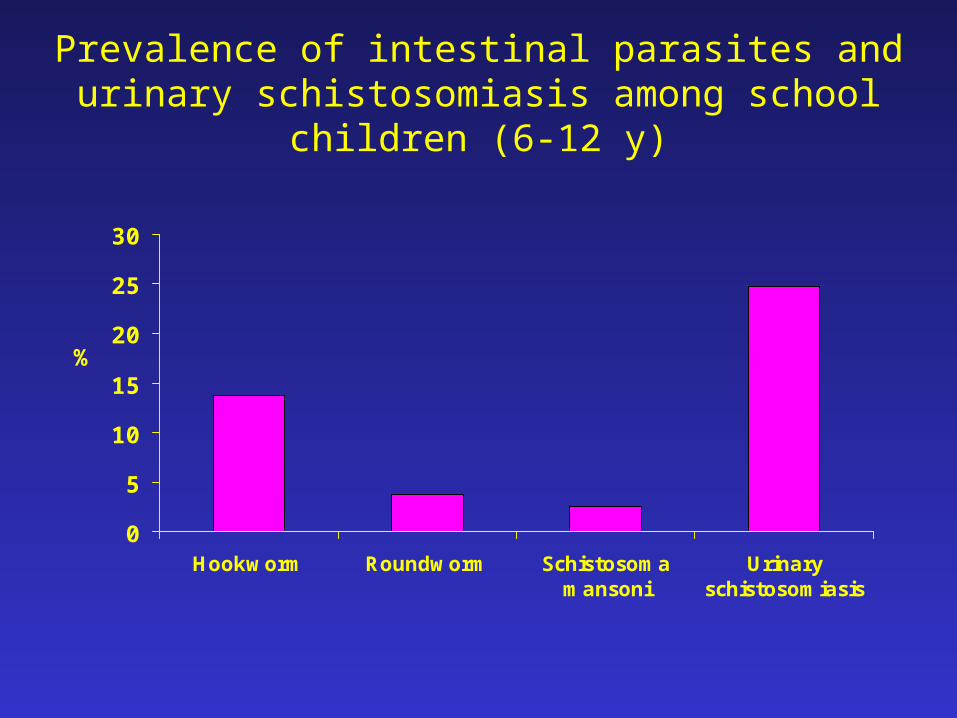
Prevalence of intestinal parasites and urinary schistosomiasis among school children (6-12 y)
0
5
10
15
20
25
30
Hookworm Roundworm Schistosomamansoni
Urinaryschistosomiasis
%
FOOD CONSUMPTIONRESULTS
• Breastfeeding results
• Fortification Rapid Assessment Tool (FRAT) - 24 hour dietary recall results

Breastfeedingfor preschool children >12 months
EXCLUSIVE BREASTFEEDING• Age when child given anything other than breastmilk
– Less than six months 53.1%– Greater or equal to 6 months 46.9%
DURATION OF BREASTFEEDING• Age when stopped breastfeeding
– Less than 12 months 4.3%– Greater or equal to 12 months 95.7%
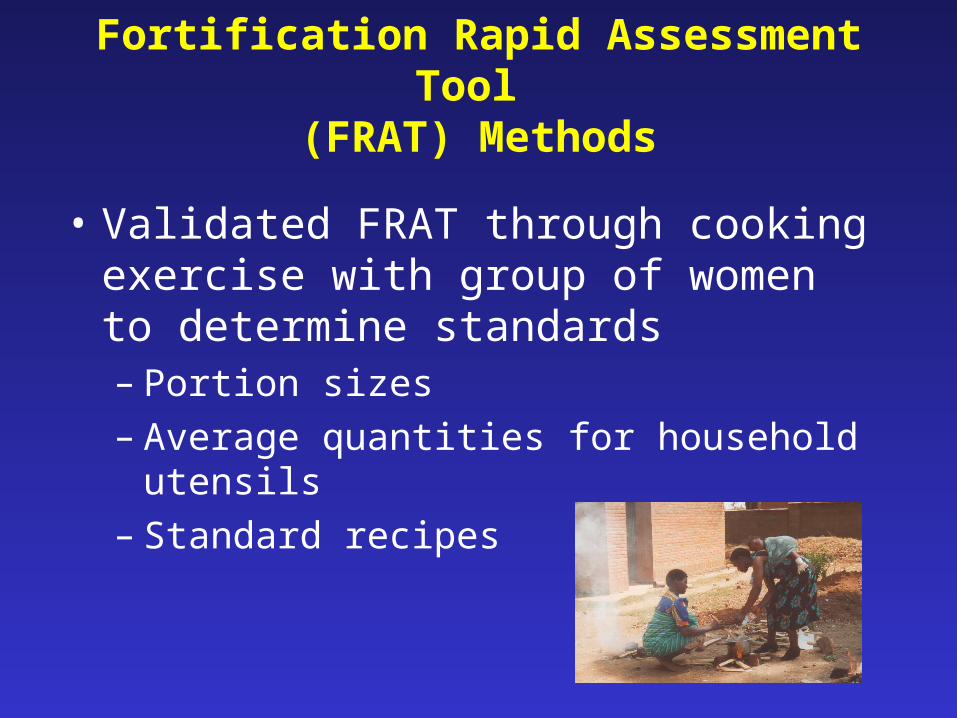
Fortification Rapid Assessment Tool (FRAT) Methods
• Validated FRAT through cooking exercise with group of women to determine standards– Portion sizes – Average quantities for household utensils– Standard recipes
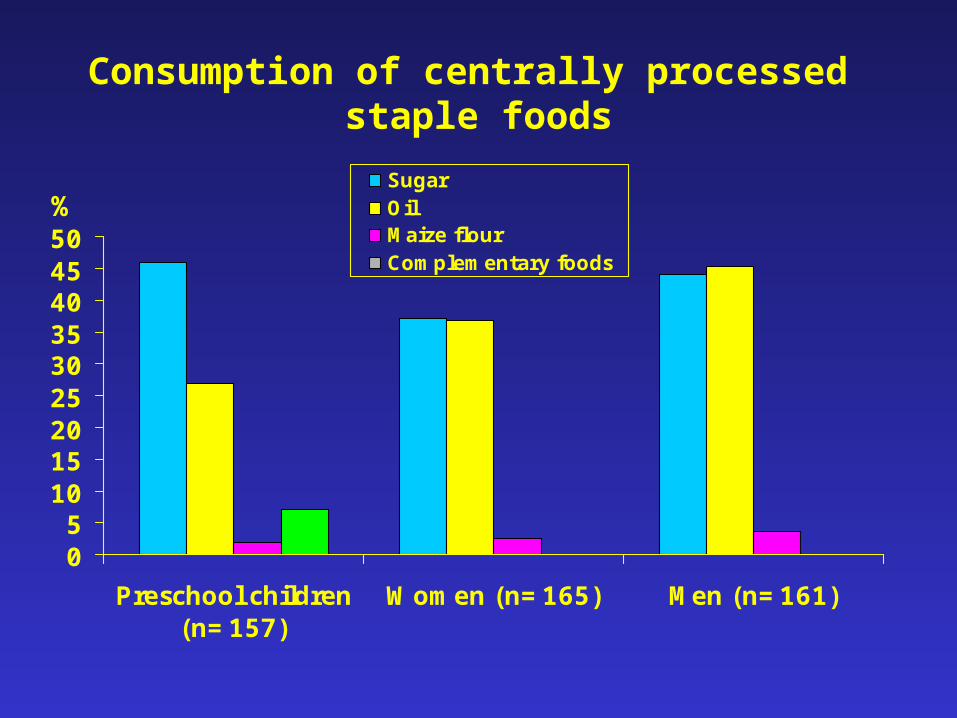
Consumption of centrally processed staple foods
05
101520253035404550
Preschool children(n=157)
Women (n=165) Men (n=161)
%SugarOilMaize flourComplementary foods
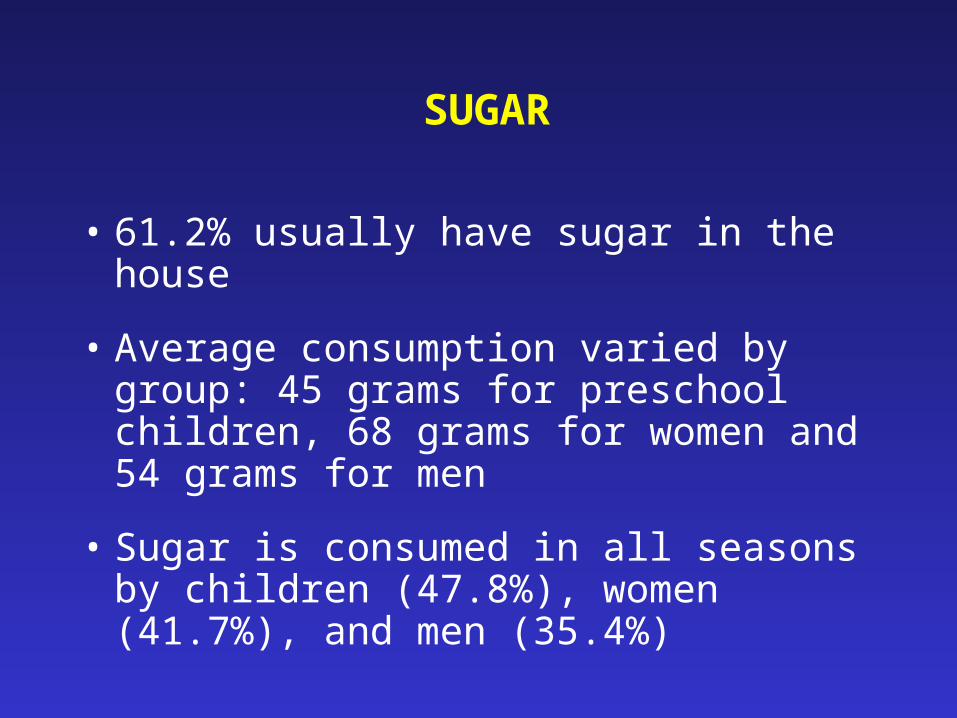
SUGAR
• 61.2% usually have sugar in the house
• Average consumption varied by group: 45 grams for preschool children, 68 grams for women and 54 grams for men
• Sugar is consumed in all seasons by children (47.8%), women (41.7%), and men (35.4%)
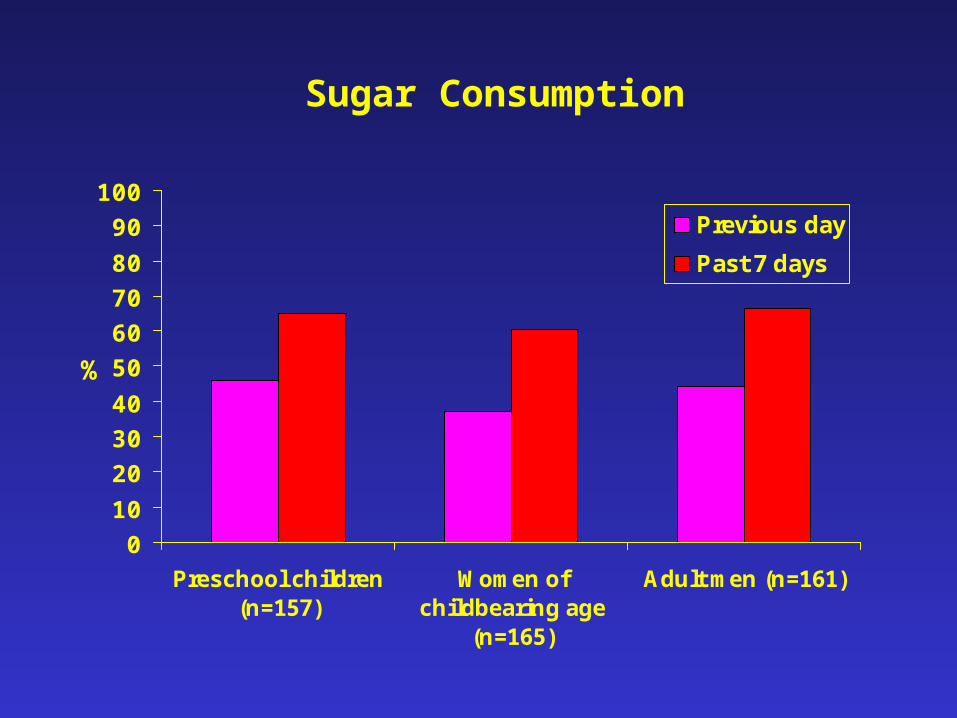
Sugar Consumption
0
10
20
30
40
50
60
70
80
90
100
Preschool children(n=157)
Women ofchildbearing age
(n=165)
Adult men (n=161)
%
Previous day
Past 7 days
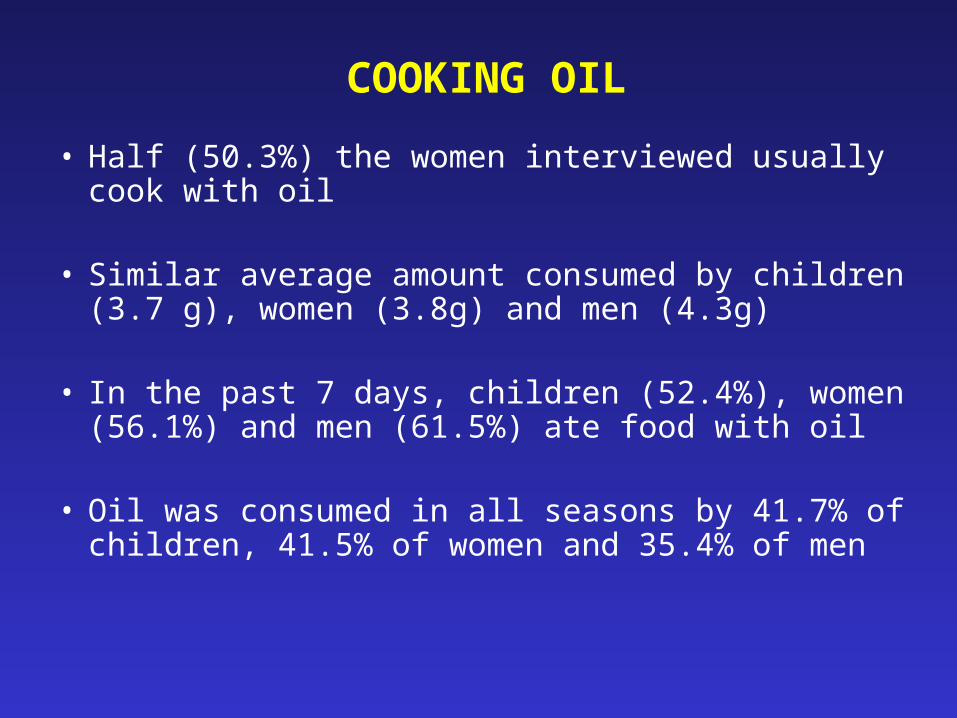
COOKING OIL
• Half (50.3%) the women interviewed usually cook with oil
• Similar average amount consumed by children (3.7 g), women (3.8g) and men (4.3g)
• In the past 7 days, children (52.4%), women (56.1%) and men (61.5%) ate food with oil
• Oil was consumed in all seasons by 41.7% of children, 41.5% of women and 35.4% of men
IODINE RESULTS
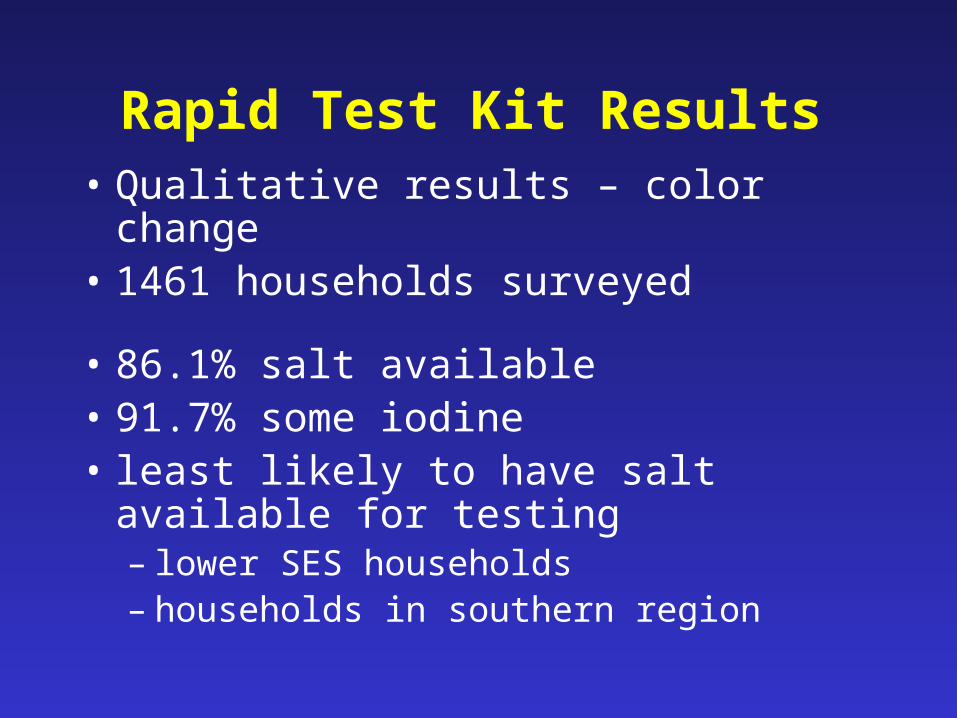
Rapid Test Kit Results • Qualitative results – color change• 1461 households surveyed
• 86.1% salt available • 91.7% some iodine• least likely to have salt available for
testing– lower SES households– households in southern region
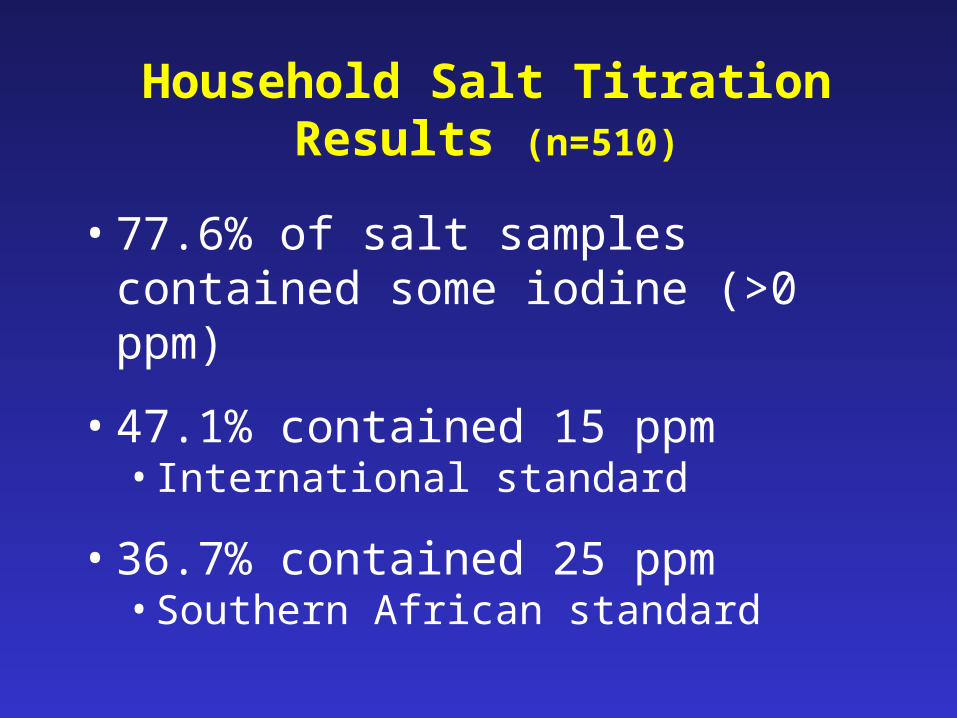
Household Salt Titration Results (n=510)
• 77.6% of salt samples contained some iodine (>0 ppm)
• 47.1% contained 15 ppm• International standard
• 36.7% contained 25 ppm• Southern African standard
VITAMIN A RESULTS
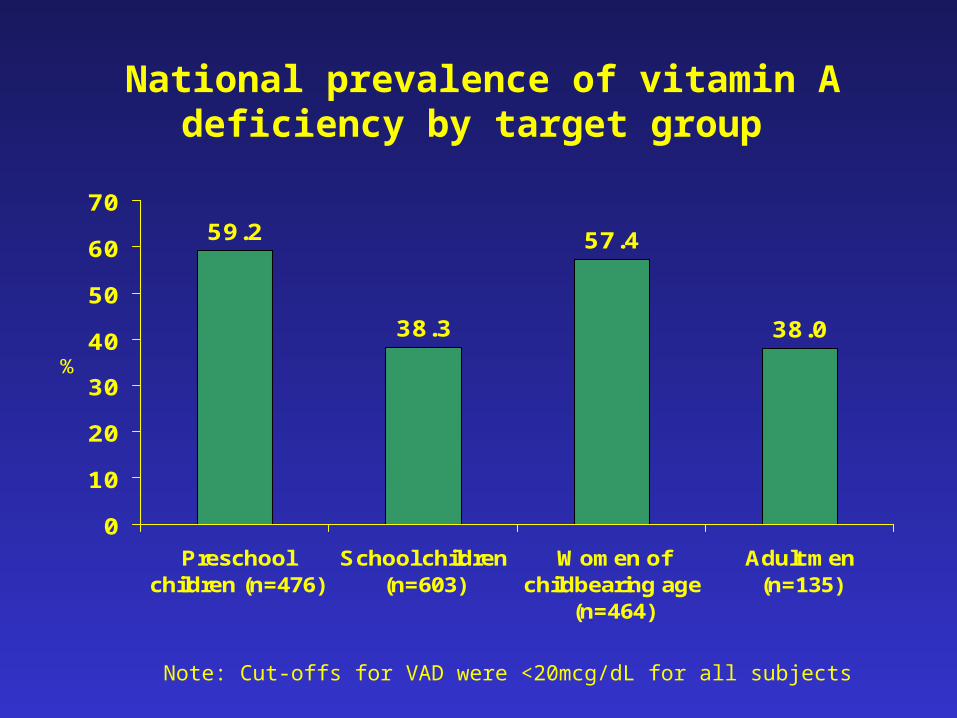
National prevalence of vitamin A deficiency by target group
59.2
38.3
57.4
38.0
0
10
20
30
40
50
60
70
Preschoolchildren (n=476)
School children(n=603)
Women ofchildbearing age
(n=464)
Adult men(n=135)
%
Note: Cut-offs for VAD were <20mcg/dL for all subjects
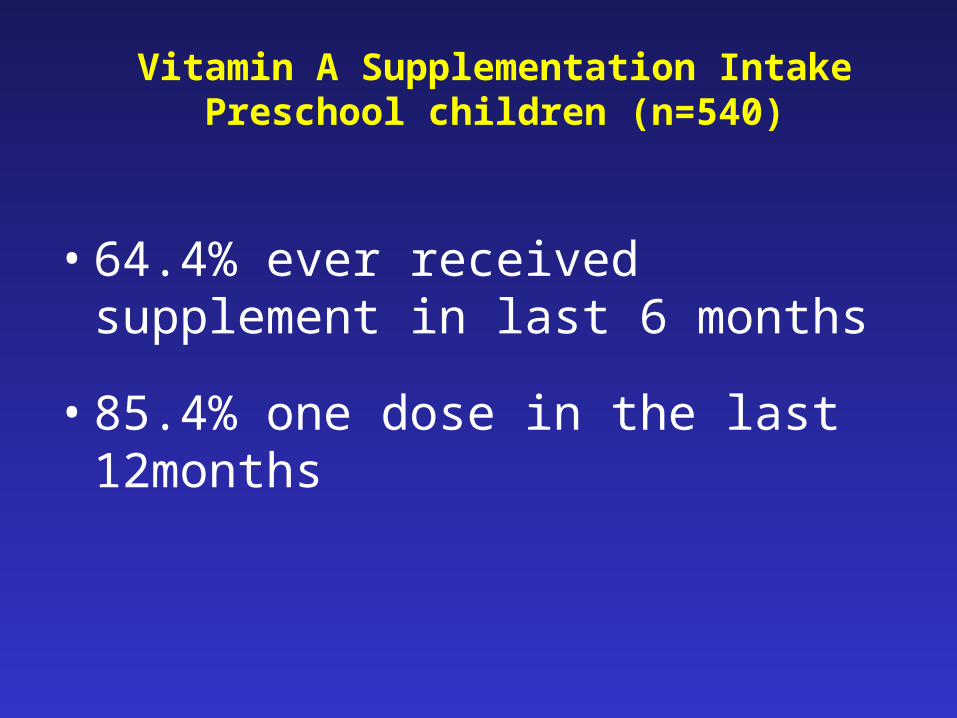
Vitamin A Supplementation IntakePreschool children (n=540)
• 64.4% ever received supplement in last 6 months
• 85.4% one dose in the last 12months

Months since last vitamin A supplement by age group*
0102030405060708090
100
6-11.9 mos 12-23.9 mos 24-35.9 mos
%
<= 6mos since last dose <=12 months since last dose
*Among children who received a vitamin A supplement at least once
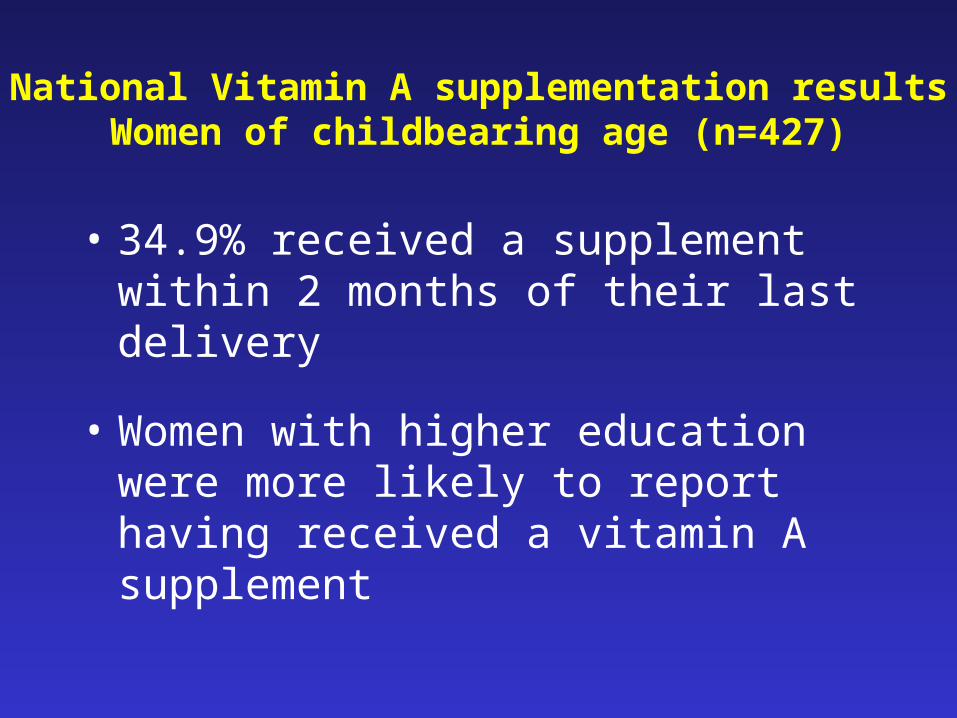
National Vitamin A supplementation resultsWomen of childbearing age (n=427)
• 34.9% received a supplement within 2 months of their last delivery
• Women with higher education were more likely to report having received a vitamin A supplement
ANEMIA AND IRON DEFICIENCY
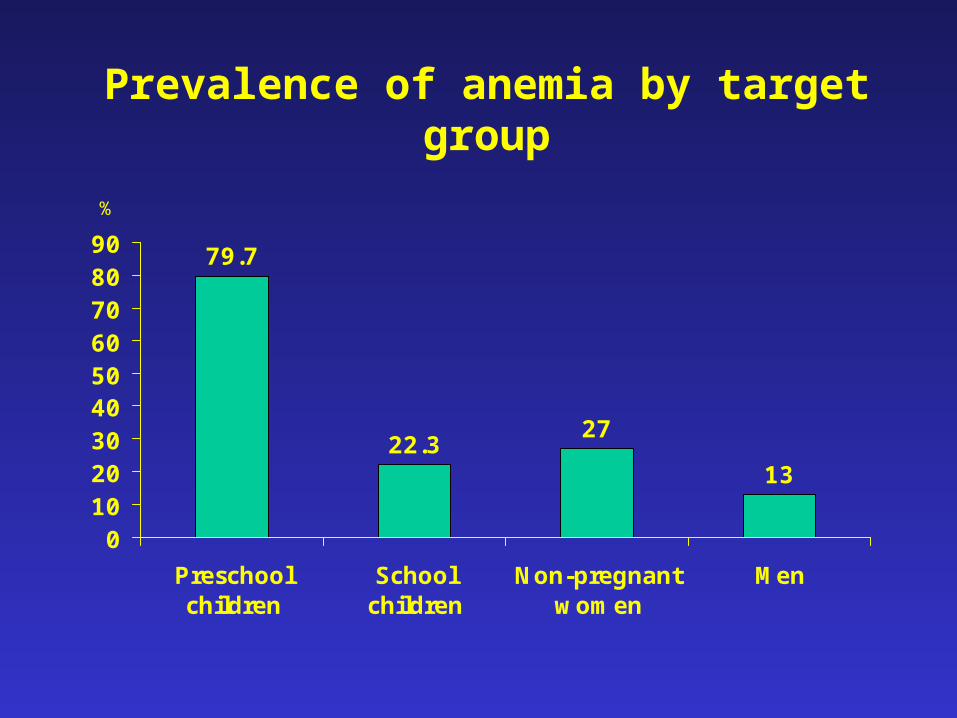
Prevalence of anemia by target group
79.7
22.327
13
0102030405060708090
Preschoolchildren
Schoolchildren
Non-pregnantwomen
Men
%
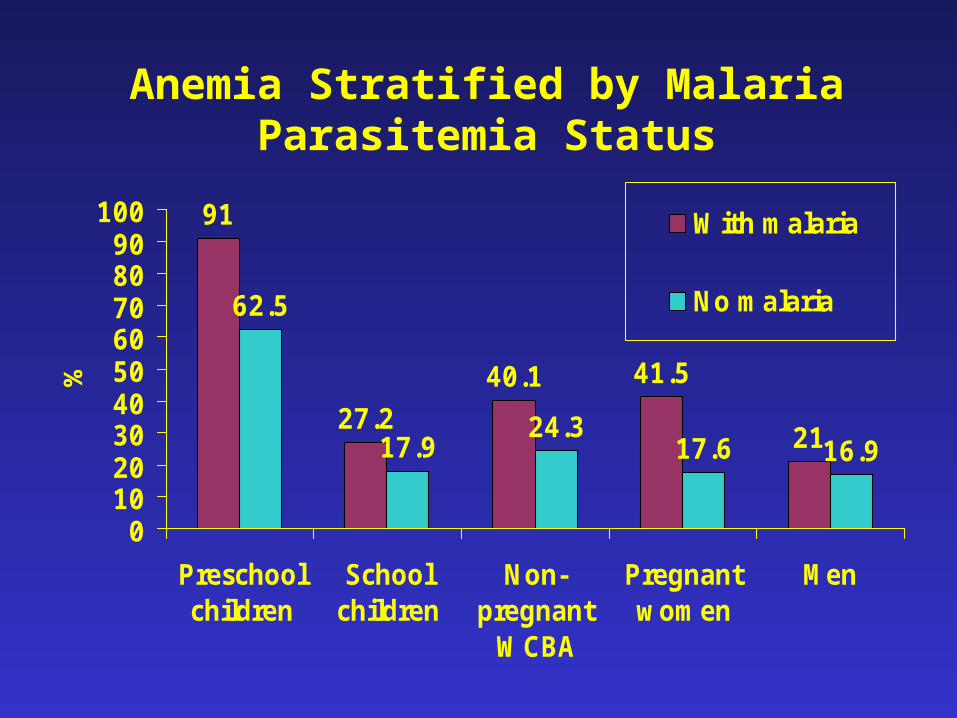
Anemia Stratified by Malaria Parasitemia Status
91
27.2
40.1 41.5
21
62.5
17.924.3
17.6 16.9
0102030405060708090
100
Preschoolchildren
Schoolchildren
Non-pregnant
WCBA
Pregnantwomen
Men
%
With malaria
No malaria
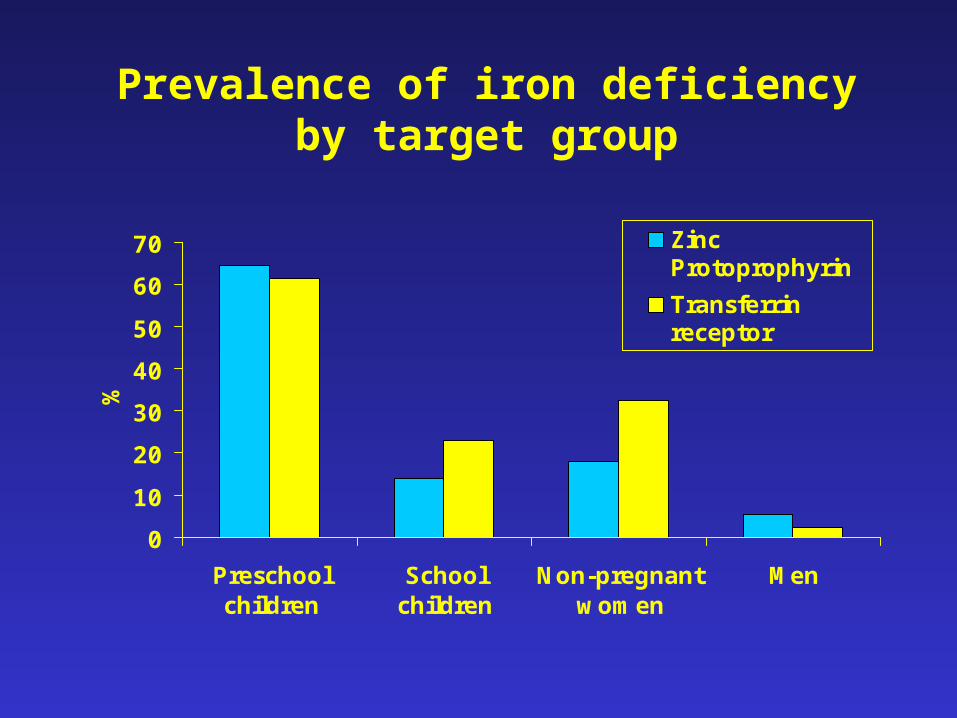
Prevalence of iron deficiency by target group
0
10
20
30
40
50
60
70
Preschoolchildren
Schoolchildren
Non-pregnantwomen
Men
%
ZincProtoprophyrin
Transferrinreceptor
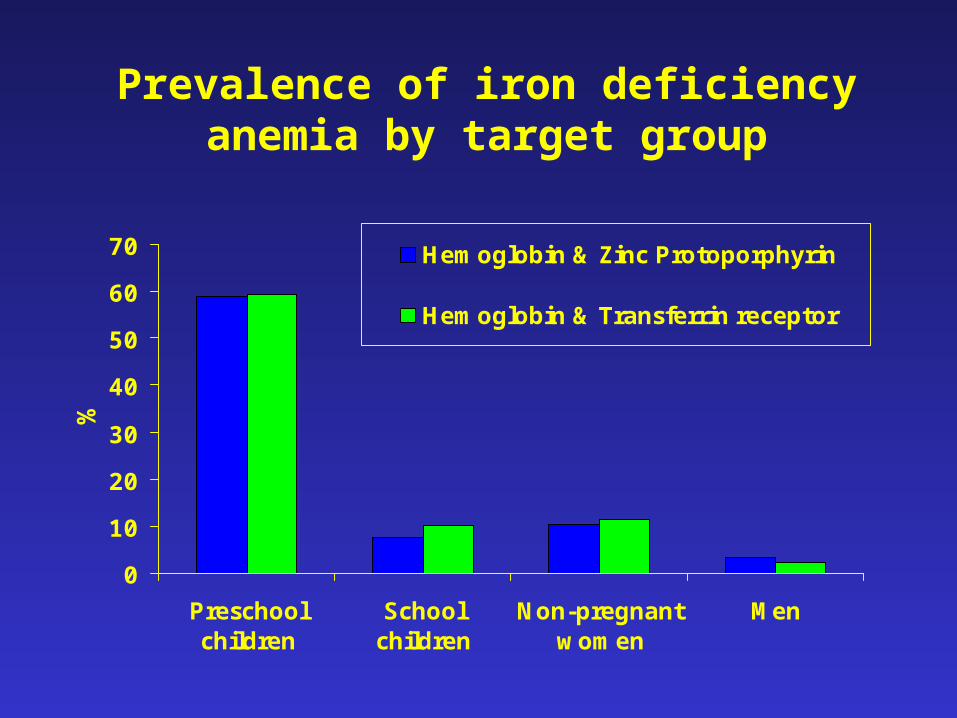
Prevalence of iron deficiency anemia by target group
0
10
20
30
40
50
60
70
Preschoolchildren
Schoolchildren
Non-pregnantwomen
Men
%
Hemoglobin & Zinc Protoporphyrin
Hemoglobin & Transferrin receptor

Use of iron supplements
• Pregnant women– 46.3% were taking iron supplements
• Non-pregnant women– 7.0% were taking iron supplements
• Frequency of taking iron supplements90.2% daily2.8% regularly1.5% weekly

SUMMARY OF FINDINGS

Summary of findings - Preschool children
0102030405060708090
100Infectious
illness
Micronutrient deficiencies
Anthropometry
%
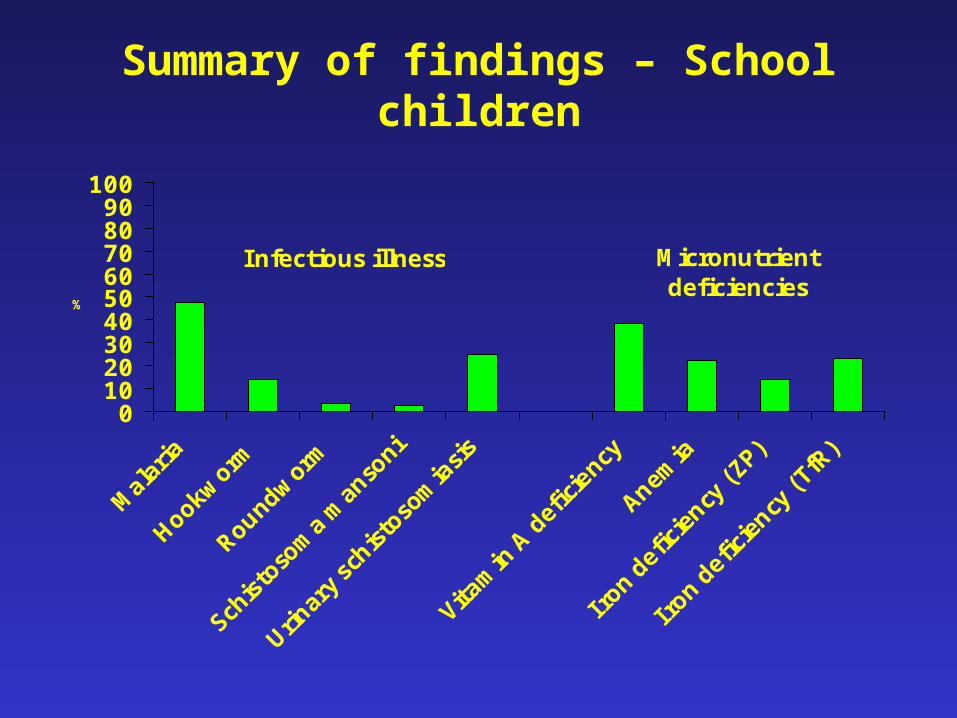
Summary of findings – School children
0102030405060708090
100
Malar
ia
Hookw
orm
Roun
dwor
m
Schistos
oma man
soni
Urinar
y sc
histos
omiasis
Vita
min A
defi
cienc
y
Anem
ia
Iron
defi
cien
cy (Z
P)
Iron
defi
cien
cy (T
fR)
Infectious illness Micronutrient deficiencies
%
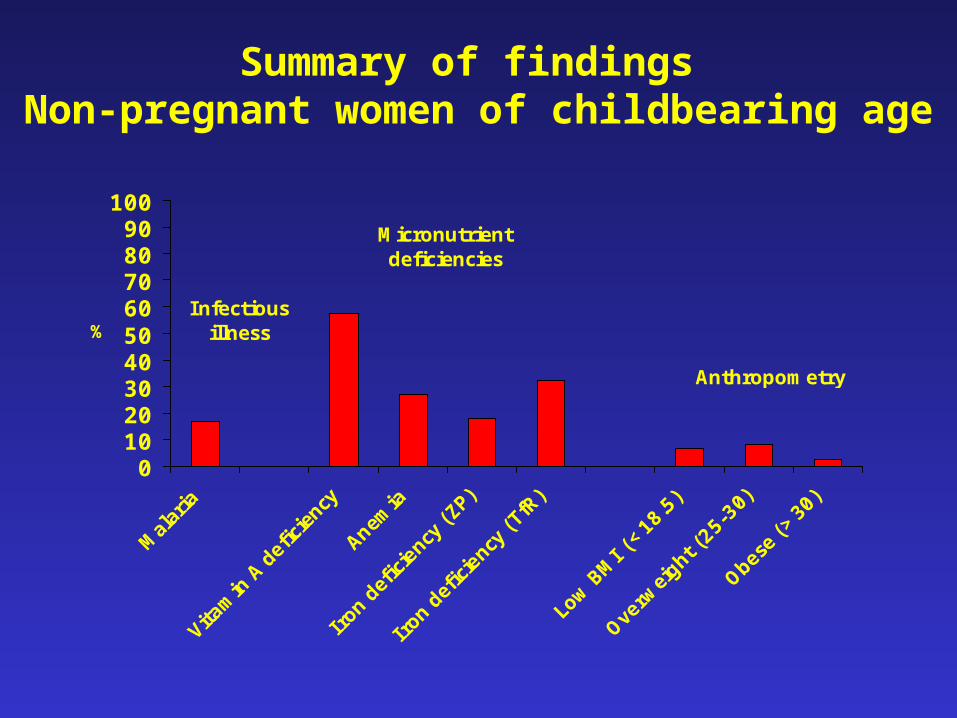
Summary of findings Non-pregnant women of childbearing age
0102030405060708090
100
Malar
ia
Vita
min A defi
cien
cy
Anem
ia
Iron
defi
cienc
y (Z
P)
Iron
defi
cienc
y (T
fR)
Low BMI (
<18.5)
Overw
eigh
t (25
-30)
Obese
(>30
)
Infectious illness
Micronutrient deficiencies
%
Anthropometry

Summary of findings - Men
0102030405060708090
100
Malar
ia
Vita
min A defi
cien
cy
Anem
ia
Iron
defi
cienc
y (Z
P)
Iron
defi
cienc
y (T
fR)
Infectious illness
Micronutrient deficiencies%

Zikomo kwambiri!!!


![Reporting from the ICRISAT Board Meeting Strategic ... · 05/04/2018 · [Malawi] and ICF. 2017. Malawi Demographic and Health Survey 2015-16. Zomba, Malawi, and Rockville, Maryland,](https://img.dokumen.tips/doc/110x75/5fbd2d7960214766547d1c9c/reporting-from-the-icrisat-board-meeting-strategic-05042018-malawi-and.jpg)