Embed Size (px)
Citation preview

Results of Operations for the First Half of the Fiscal Year Ending February 28, 2022
October 14, 2021
KANTSU CO., LTD. (Securities code: 9326)
Contents
2
I. Company Profile ………… 3
II. Our Services ………… 7
III. KANTSU’s Strengths ………… 16
IV. 1H FY2/22 Financial Summary ………… 22
V. FY2/22 Earnings Forecasts ………… 36
VI. Medium-term Business Plan ………… 41
Reference:Activities for the Sustainable Development Goals
………… 51
I. Company Profile
3

1. Company Profile
4
Company name KANTSU CO., LTD.
Offices Head office: 1-8-13 Nagata, Higashi Osaka city, OsakaOsaka Branch Office: LINKS UMEDA 8F WeWork LINKS UMEDA 1-1 Ofukacho, Kita-ku, Osaka city, Osaka
Tokyo System Development Division: Bunshodo Building 5F, 3-37-1 Kanda Sakuma-cho Chiyoda-ku, TokyoLogistics bases: 12 locations in Kansai area, 4 locations in Kanto area
Total area: 173,200m2 (As of August 31, 2021)
Established April 1986
Representative Hisahiro Tatsushiro, Representative Director and President
Capital 784 million yen (As of August 31, 2021)
Stock listing Tokyo Stock Exchange (Mothers)
Number of employees 299 (Regular employees as of August 31, 2021)
Business ◼ Logistics services business
EC/catalog logistics support services
Rakuten Super Logistics services
Outsourced order processing services
Logistics consulting services
◼ IT automation business
The Cloud Thomas warehouse management system
The Annie check list system
◼ Other businesses
KANTSU provides logistics services centered on the EC and catalog logistics sectors and IT automation services centered on the Cloud Thomas warehouse management system.
Kansai Primary Center
The 1st Tokyo Distribution Center
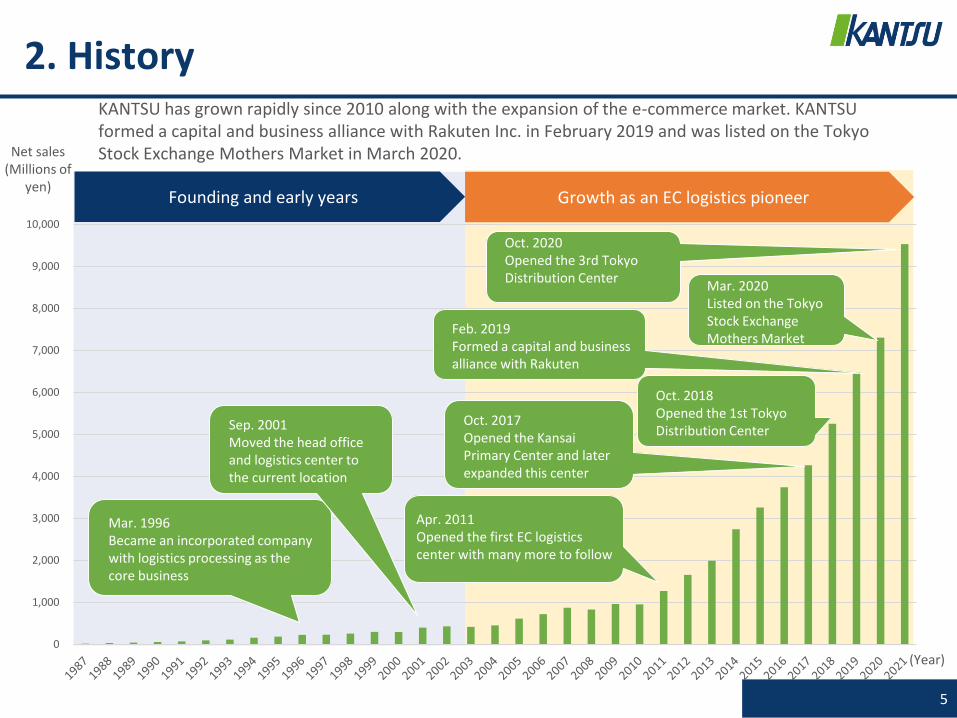
2. History
5
KANTSU has grown rapidly since 2010 along with the expansion of the e-commerce market. KANTSU formed a capital and business alliance with Rakuten Inc. in February 2019 and was listed on the Tokyo Stock Exchange Mothers Market in March 2020.
0
1,000
2,000
3,000
4,000
5,000
6,000
7,000
8,000
9,000
10,000
Apr. 2011Opened the first EC logistics center with many more to follow
Founding and early years Growth as an EC logistics pioneer
Net sales(Millions of
yen)
(Year)
Mar. 1996Became an incorporated company with logistics processing as the core business
Sep. 2001Moved the head office and logistics center to the current location
Oct. 2017Opened the Kansai Primary Center and later expanded this center
Oct. 2018Opened the 1st Tokyo Distribution Center
Mar. 2020Listed on the Tokyo Stock Exchange Mothers Market
Oct. 2020Opened the 3rd Tokyo Distribution Center
Feb. 2019Formed a capital and business alliance with Rakuten
3. Overview of KANTSU’s Services
6
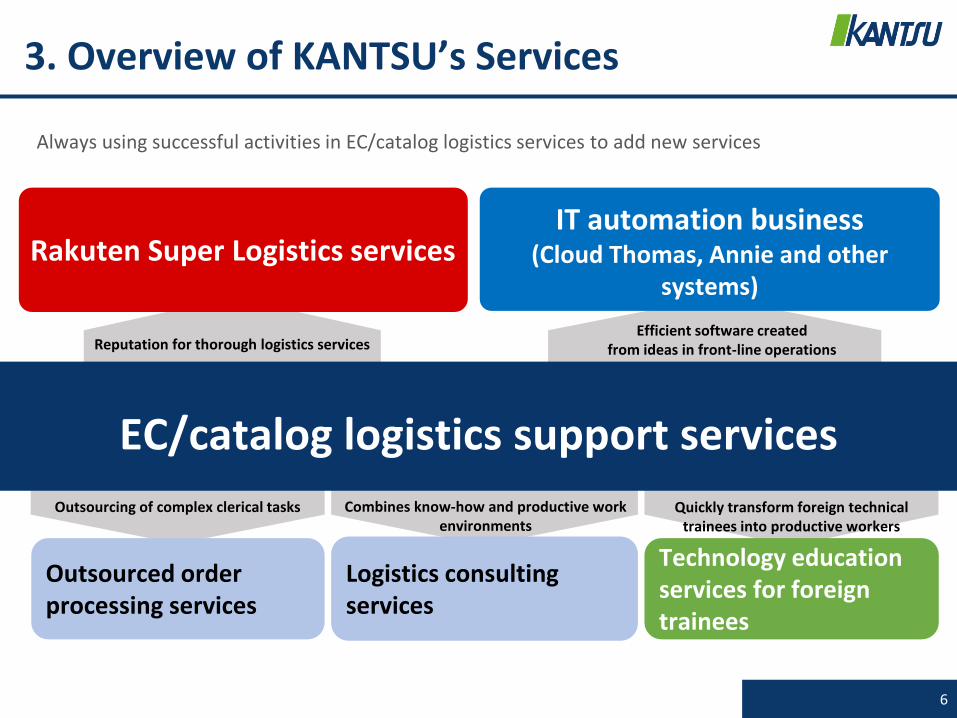
Always using successful activities in EC/catalog logistics services to add new services
Logistics consulting services
Combines know-how and productive work environments
Outsourced order processing services
Quickly transform foreign technical trainees into productive workers
Efficient software created from ideas in front-line operations
IT automation business(Cloud Thomas, Annie and other
systems)
Technology education services for foreign trainees
Reputation for thorough logistics services
Rakuten Super Logistics services
EC/catalog logistics support services
Outsourcing of complex clerical tasks

II. Our Services
7

1. Logistics Services Business
8
(Units) Monthly packages shipped
EC/catalog logistics support services
1,273,0751,213,941
1,026,843 1,077,770
915,463
821,254936,805
872,994830,546
859,406 845,142
754,382
877,050
940,000 957,519
1,125,923
960,727 973,906
600,000
700,000
800,000
900,000
1,000,000
1,100,000
1,200,000
1,300,000
1,400,000
3月 4月 5月 6月 7月 8月 9月 10月 11月 12月 1月 2月
2022/02期
2021/02期
Note: Due to an error in part of the method used to calculate the number of packages shipped, figures in prior months have been retrospectively revised.
The core business at the center of growth of KANTSU’s performance
KANTSU operates distribution centers for other companies by handling incoming/outgoing shipments, inventoriesand other operations for EC, catalog and other customers.Operations started around 2000 just as the internet retail sector was emerging. By handling a growing volume ofshipments, we have supported the growth of a large number of well-known retail companies. In FY2/21, we shippedabout 11 million packages.
Growth with customers
Use of the market domination strategy and exclusive warehouse management system (WMS) expertise allows efficiently handling a growing volume of shipments
Solutions to inventory management issues
Flexibility for changes in shipments
Timely increases and decreases in operations to match changes in the volume of shipments
Cloud Thomas, the exclusive KANTSU WMS, manages inventories efficiently
Logistics services designed to minimize errors in shipments
Improvements in shipment accuracy
Mar. Apr. May Jun. Jul. Aug. Sep. Oct. Nov. Dec. Jan. Feb.
FY2/22
FY2/21

9
1. Logistics Services Business
Rakuten Super Logistics services
KANTSU and Rakuten established a capital and business alliance in February 2019 based on the Rakuten’s One Delivery concept with the goal of ensuring the soundness of EC logistics. This partnership is the result of KANTSU’s reputation as a provider of order-made and thorough logistics services capable of meeting the requirements of every customer.About 27% of the Kansai Primary Center (Amagasaki, Hyogo prefecture), which has a total floor area of about 48,600 m2, is operated as the Rakuten Fulfillment Center Amagasaki. This center serves KANTSU customers newly added as before while also providing services to Rakuten’s customers who have signed up to use Rakuten Super Logistics. We can also directly provide services that not compatible with the Rakuten Super Logistics rules.
Strengthen cold chain logistics servicesWe plan to strengthen logistics for frozen and refrigerated food products, which is expected to be a growing component of the EC/catalog logistics support services sector. KANTSU’s cold chain logistics service is very unusual because the refrigerated/frozen warehouse allows picking individual items. This capability allows serving wholesale and other businesses as well as selling products directly to consumers. We can also package assorted products, which occurs frequently in the food logistics sector.
Support for foreign companies starting EC operations in Japan
KANTSU has added a service called ONCE for companies in China and other countries that want to start an EC business in Japan. ONCE encompasses every step from importing products and customs clearance to handling incoming and outgoing shipments and other logistics services. We can also process orders from customers and perform other EC tasks in Japan.
10
1. Logistics Services Business
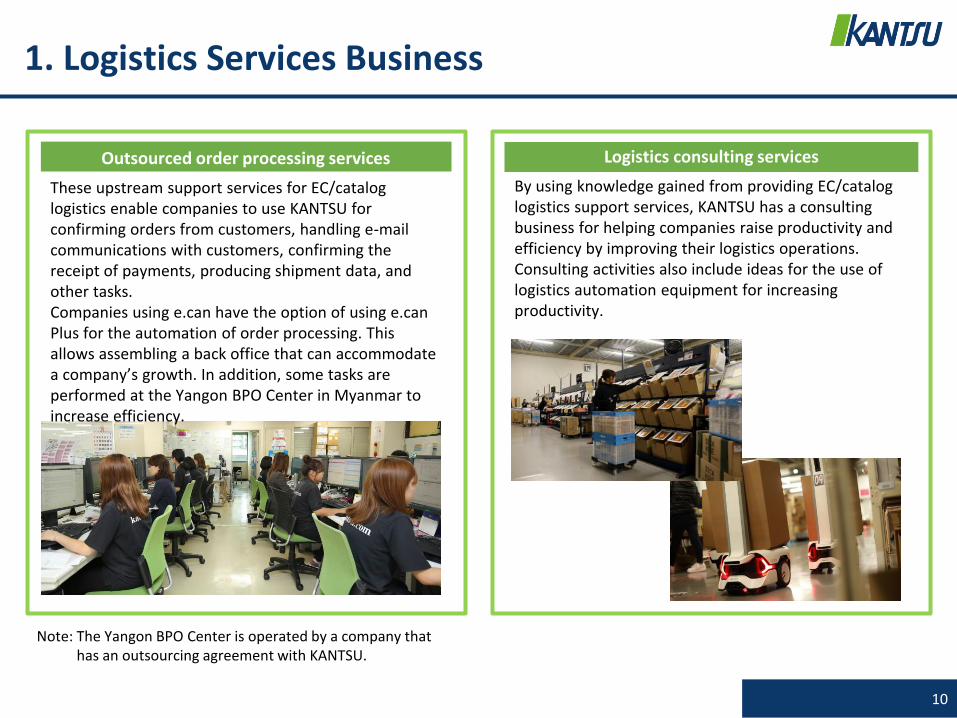
Outsourced order processing services
These upstream support services for EC/catalog logistics enable companies to use KANTSU for confirming orders from customers, handling e-mail communications with customers, confirming the receipt of payments, producing shipment data, and other tasks. Companies using e.can have the option of using e.can Plus for the automation of order processing. This allows assembling a back office that can accommodate a company’s growth. In addition, some tasks are performed at the Yangon BPO Center in Myanmar to increase efficiency.
Note: The Yangon BPO Center is operated by a company that has an outsourcing agreement with KANTSU.
Logistics consulting services
By using knowledge gained from providing EC/catalog logistics support services, KANTSU has a consulting business for helping companies raise productivity and efficiency by improving their logistics operations.Consulting activities also include ideas for the use of logistics automation equipment for increasing productivity.

11
663 663 679 713 716
735
805
861 874 881
937 947987
1,009 1,012
1,0651,070
1,091
71 71 75
80 82 87
92
103106
109 110113
119123 124
129 130135
60
70
80
90
100
110
120
130
140
600
700
800
900
1,000
1,100
1,200
契約アカウント数 契約社数
2. IT Automation BusinessThe software sales business is based on advances originating from our own logistics operations. Major products include theCloud Thomas warehouse management system for high-quality logistics and the Annie check list system that also startedfrom ideas in our front-line operations.
Cloud Thomas accurately keeps track of the number of items stored at a distribution center and improves the efficiency of warehouse tasks. This software uses bar codes and scanners for incoming and outgoing shipments, movements of merchandise within the warehouse, and other activities. This physical management of inventories facilitates the supervision of shipments and the locations of specific items. The result is accurate inventory management, the prevention of errors in outgoing shipments, the standardization of warehouse tasks and an overall improvement in efficiency.
Cloud-based warehouse management system Cloud Thomas
Number of Cloud Thomas Contracts and IDs(No. of IDs)
(No. of companies)
Mar. 2020
Apr. May Jun. Jul. Aug. Sep. Oct. Dec. Jan. Feb. Mar.2021
Apr. MayNov. Jun. Jul. Aug.
No. of cloud Thomas contract accounts (IDs)
No. of Cloud Thomas contracts (companies)
12
「アニー」
2. IT Automation Business
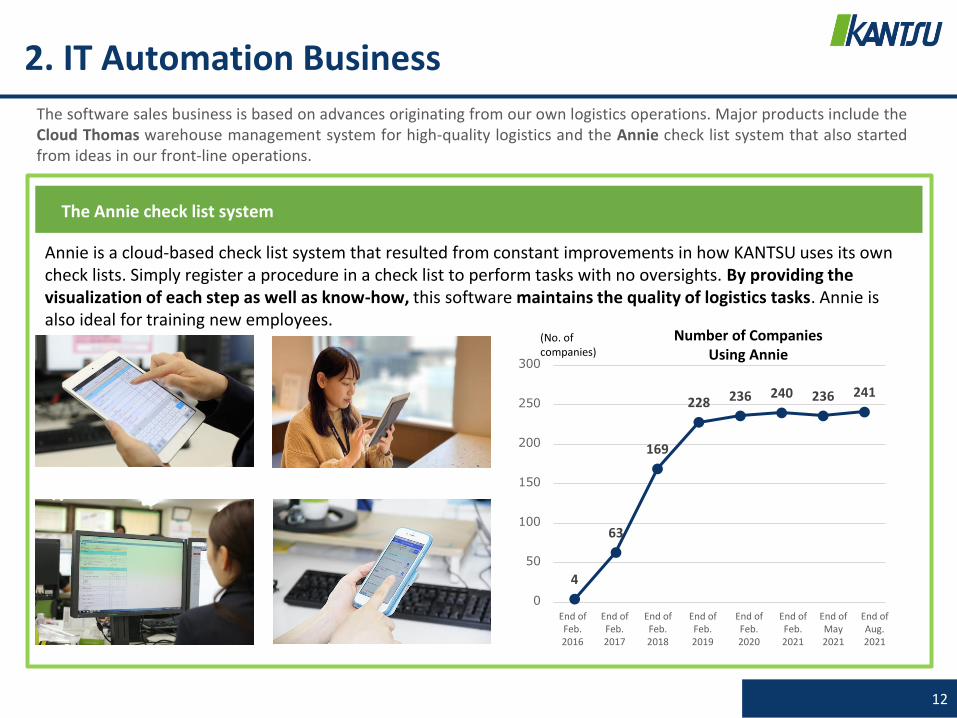
The software sales business is based on advances originating from our own logistics operations. Major products include theCloud Thomas warehouse management system for high-quality logistics and the Annie check list system that also startedfrom ideas in our front-line operations.
Annie is a cloud-based check list system that resulted from constant improvements in how KANTSU uses its own check lists. Simply register a procedure in a check list to perform tasks with no oversights. By providing the visualization of each step as well as know-how, this software maintains the quality of logistics tasks. Annie is also ideal for training new employees.
The Annie check list system
Number of Companies Using Annie
(No. of companies)
4
63
169
228 236 240 236 241
0
50
100
150
200
250
300
End of Feb. 2016
End of Feb. 2017
End of Feb. 2018
End of Feb. 2019
End of Feb. 2020
End of Feb. 2021
End of May 2021
End of Aug. 2021
13
2. IT Automation Business
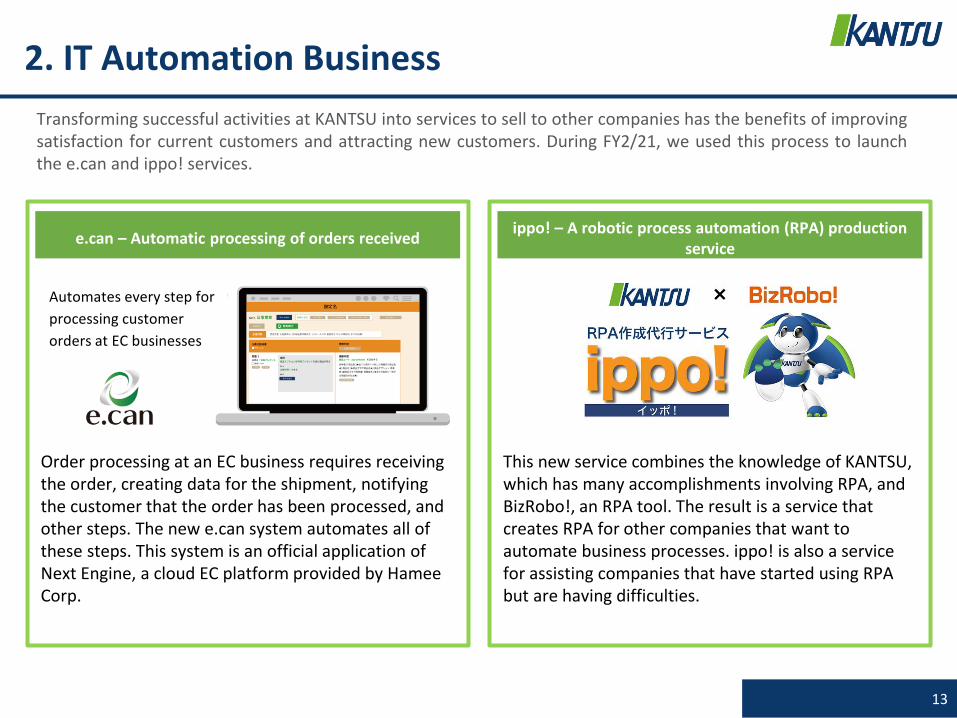
Transforming successful activities at KANTSU into services to sell to other companies has the benefits of improvingsatisfaction for current customers and attracting new customers. During FY2/21, we used this process to launchthe e.can and ippo! services.
Order processing at an EC business requires receiving the order, creating data for the shipment, notifying the customer that the order has been processed, and other steps. The new e.can system automates all ofthese steps. This system is an official application of Next Engine, a cloud EC platform provided by Hamee Corp.
e.can – Automatic processing of orders received
This new service combines the knowledge of KANTSU, which has many accomplishments involving RPA, and BizRobo!, an RPA tool. The result is a service that creates RPA for other companies that want to automate business processes. ippo! is also a service for assisting companies that have started using RPA but are having difficulties.
ippo! – A robotic process automation (RPA) production service
Automates every step for
processing customer
orders at EC businesses
14
3. Other Businesses
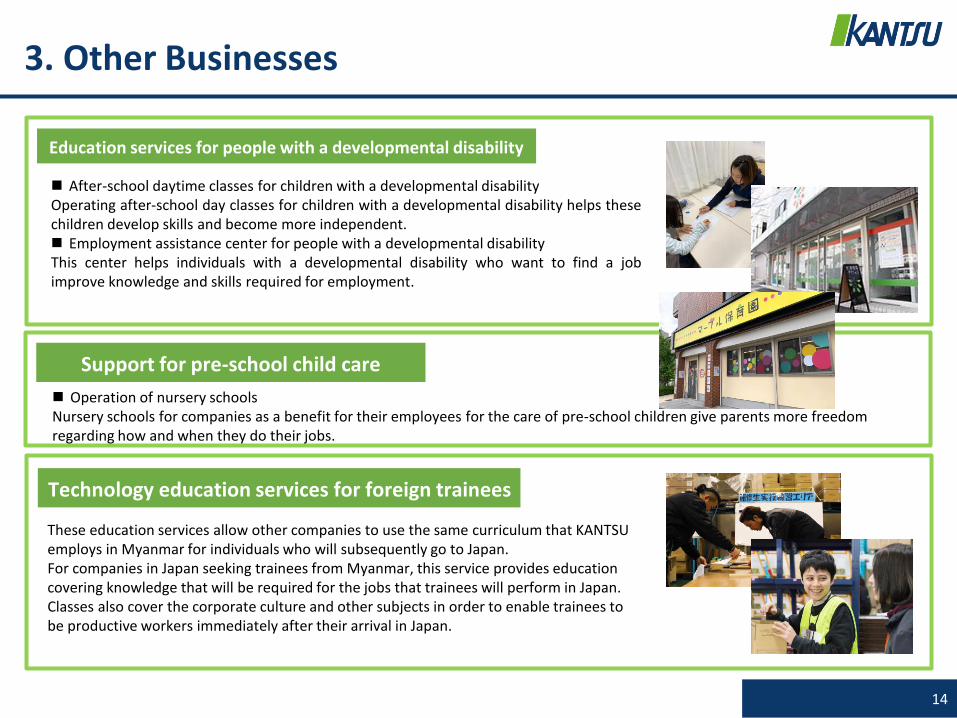
Technology education services for foreign trainees
Education services for people with a developmental disability
These education services allow other companies to use the same curriculum that KANTSU employs in Myanmar for individuals who will subsequently go to Japan. For companies in Japan seeking trainees from Myanmar, this service provides education covering knowledge that will be required for the jobs that trainees will perform in Japan. Classes also cover the corporate culture and other subjects in order to enable trainees to be productive workers immediately after their arrival in Japan.
◼ After-school daytime classes for children with a developmental disabilityOperating after-school day classes for children with a developmental disability helps thesechildren develop skills and become more independent.◼ Employment assistance center for people with a developmental disabilityThis center helps individuals with a developmental disability who want to find a jobimprove knowledge and skills required for employment.
Support for pre-school child care
◼ Operation of nursery schoolsNursery schools for companies as a benefit for their employees for the care of pre-school children give parents more freedom regarding how and when they do their jobs.
4. Recent Topics
15
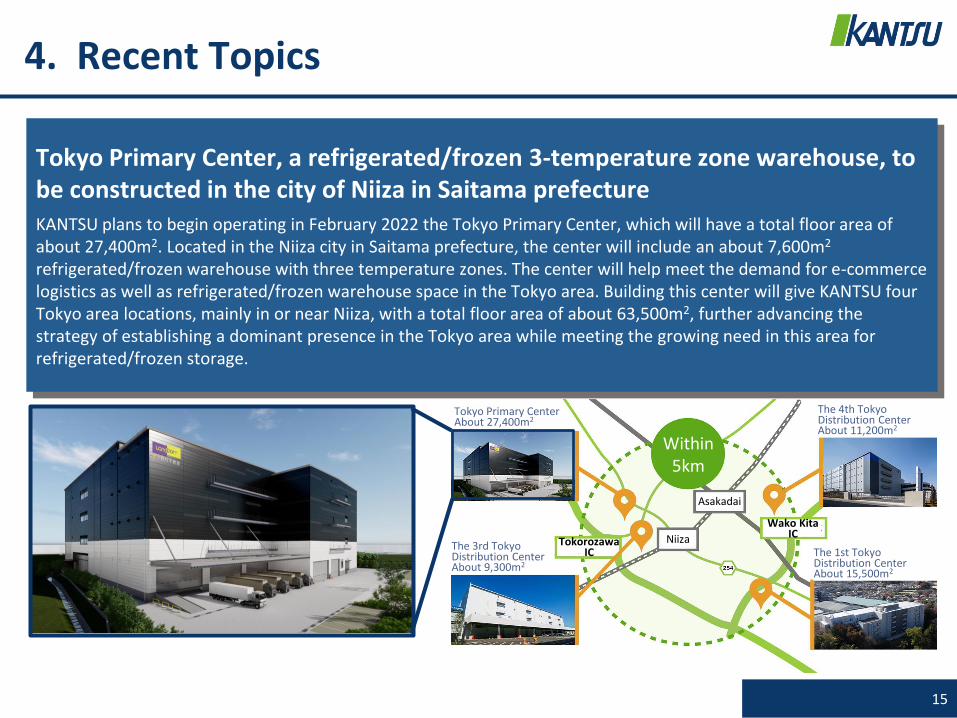
Tokyo Primary Center, a refrigerated/frozen 3-temperature zone warehouse, to be constructed in the city of Niiza in Saitama prefectureKANTSU plans to begin operating in February 2022 the Tokyo Primary Center, which will have a total floor area of about 27,400m2. Located in the Niiza city in Saitama prefecture, the center will include an about 7,600m2
refrigerated/frozen warehouse with three temperature zones. The center will help meet the demand for e-commerce logistics as well as refrigerated/frozen warehouse space in the Tokyo area. Building this center will give KANTSU four Tokyo area locations, mainly in or near Niiza, with a total floor area of about 63,500m2, further advancing the strategy of establishing a dominant presence in the Tokyo area while meeting the growing need in this area for refrigerated/frozen storage.
Within 5km
Niiza
Asakadai
Tokorozawa IC
Wako Kita IC
Tokyo Primary CenterAbout 27,400m2
The 3rd Tokyo Distribution CenterAbout 9,300m2
The 4th Tokyo Distribution Center About 11,200m2
The 1st Tokyo Distribution Center About 15,500m2

16
III. KANTSU’s Strengths
17
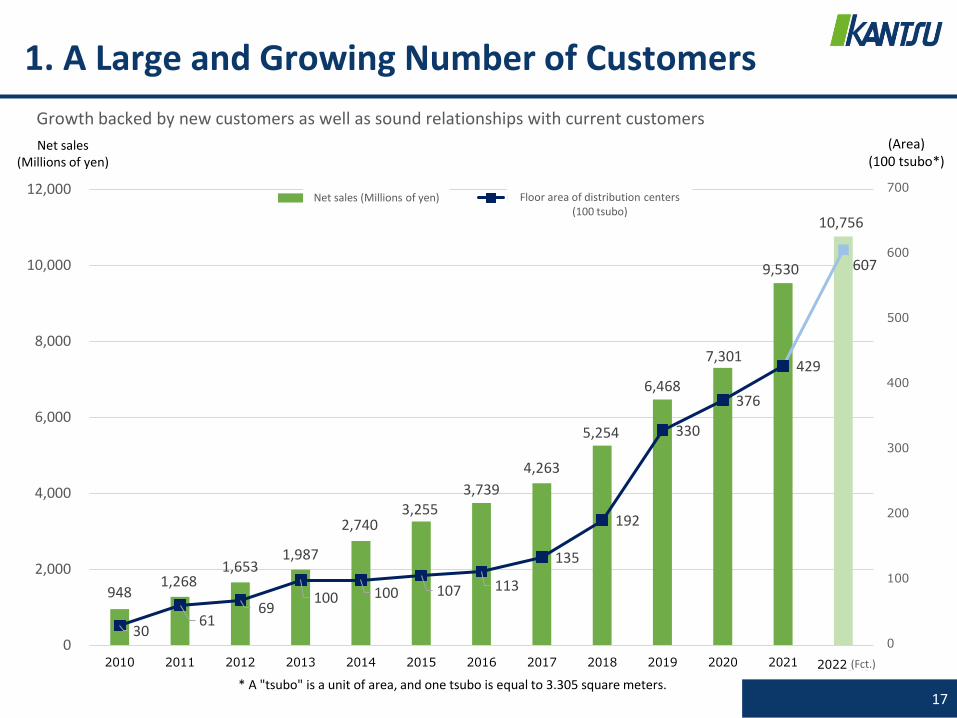
948 1,268
1,653 1,987
2,740 3,255
3,739
4,263
5,254
6,468
7,301
9,530
10,756
30 61
69 100 100 107 113
135
192
330
376
429
607
0
100
200
300
400
500
600
700
0
2,000
4,000
6,000
8,000
10,000
12,000
2010 2011 2012 2013 2014 2015 2016 2017 2018 2019 2020 2021 2022[予]
売上高(百万円) 物流拠点坪数(百坪)
1. A Large and Growing Number of Customers
Net sales(Millions of yen)
Growth backed by new customers as well as sound relationships with current customers
Net sales (Millions of yen) Floor area of distribution centers (100 tsubo)
(Area)(100 tsubo*)
(Fct.)
* A "tsubo" is a unit of area, and one tsubo is equal to 3.305 square meters.
18
社
社
社
社
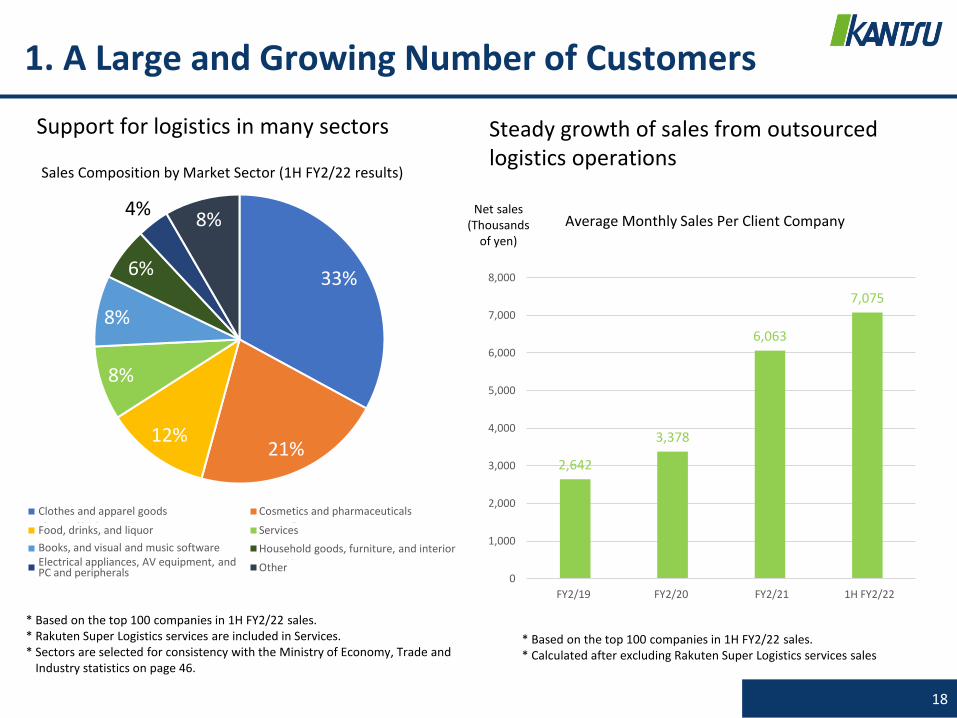
社33%
21%12%
8%
8%
6%
4%8%
衣類、服装雑貨等 化粧品、医薬品
食品、飲料、酒類 サービス
書籍、映像・音楽ソフト 生活雑貨、家具、インテリア
生活家電、AV機器、PC・周辺機器等 その他
Food, drinks, and liquor
2,642
3,378
6,063
7,075
0
1,000
2,000
3,000
4,000
5,000
6,000
7,000
8,000
2019年2月期 2020年2月期 2021年2月期 2022年2月期2Q
1. A Large and Growing Number of Customers
Support for logistics in many sectors
Sales Composition by Market Sector (1H FY2/22 results)
Clothes and apparel goods Cosmetics and pharmaceuticals
Services
Books, and visual and music software Household goods, furniture, and interior
OtherElectrical appliances, AV equipment, and PC and peripherals
* Based on the top 100 companies in 1H FY2/22 sales.* Calculated after excluding Rakuten Super Logistics services sales
* Based on the top 100 companies in 1H FY2/22 sales.* Rakuten Super Logistics services are included in Services.* Sectors are selected for consistency with the Ministry of Economy, Trade and
Industry statistics on page 46.
Net sales(Thousands
of yen)
Average Monthly Sales Per Client Company
FY2/19 FY2/20 FY2/21 1H FY2/22
Steady growth of sales from outsourced logistics operations
19
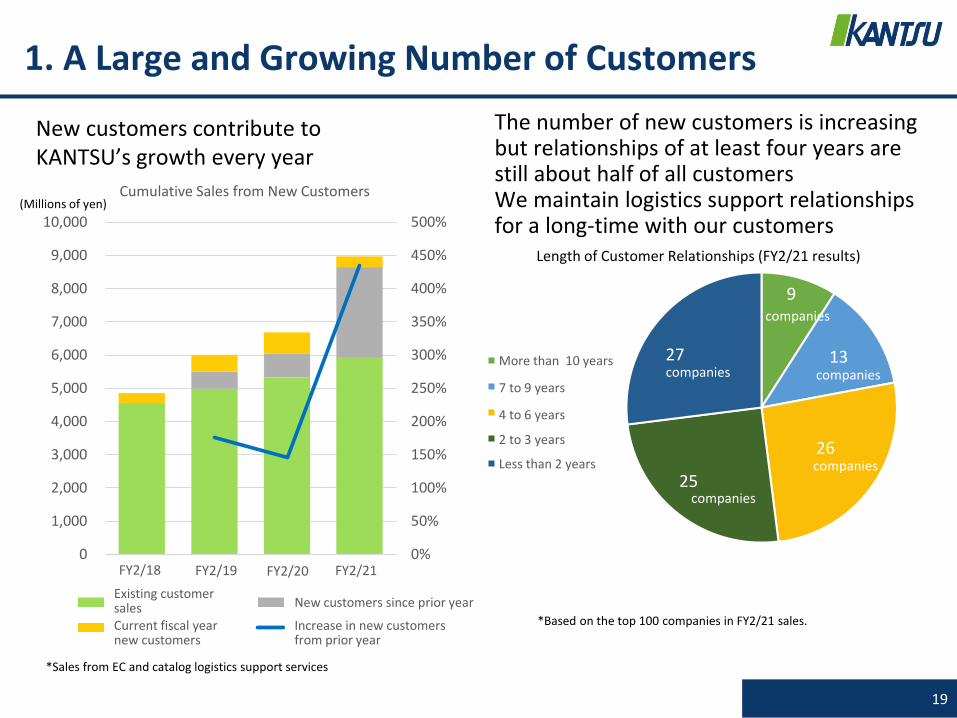
*Based on the top 100 companies in FY2/21 sales.
The number of new customers is increasing but relationships of at least four years are still about half of all customersWe maintain logistics support relationships for a long-time with our customers
0%
50%
100%
150%
200%
250%
300%
350%
400%
450%
500%
0
1,000
2,000
3,000
4,000
5,000
6,000
7,000
8,000
9,000
10,000
2018/2期 2019/2期 2020/2期 2021/2期
Cumulative Sales from New Customers
既存顧客売上 前期新規顧客売上
当期新規顧客売上 前期新規顧客成長率
*Sales from EC and catalog logistics support services
(Millions of yen)
New customers contribute to KANTSU’s growth every year
Length of Customer Relationships (FY2/21 results)
9
13
26
25
2710年超
7年以上10年未満
4年以上7年未満
2年以上4年未満
0年超2年未満
companies
companies
companies
companies
companies
More than 10 years
Less than 2 years
7 to 9 years
4 to 6 years
2 to 3 years
Existing customer sales
FY2/19 FY2/20 FY2/21FY2/18
1. A Large and Growing Number of Customers
New customers since prior year
Current fiscal year new customers
Increase in new customers from prior year
2. Ability to Attract New Customers
20
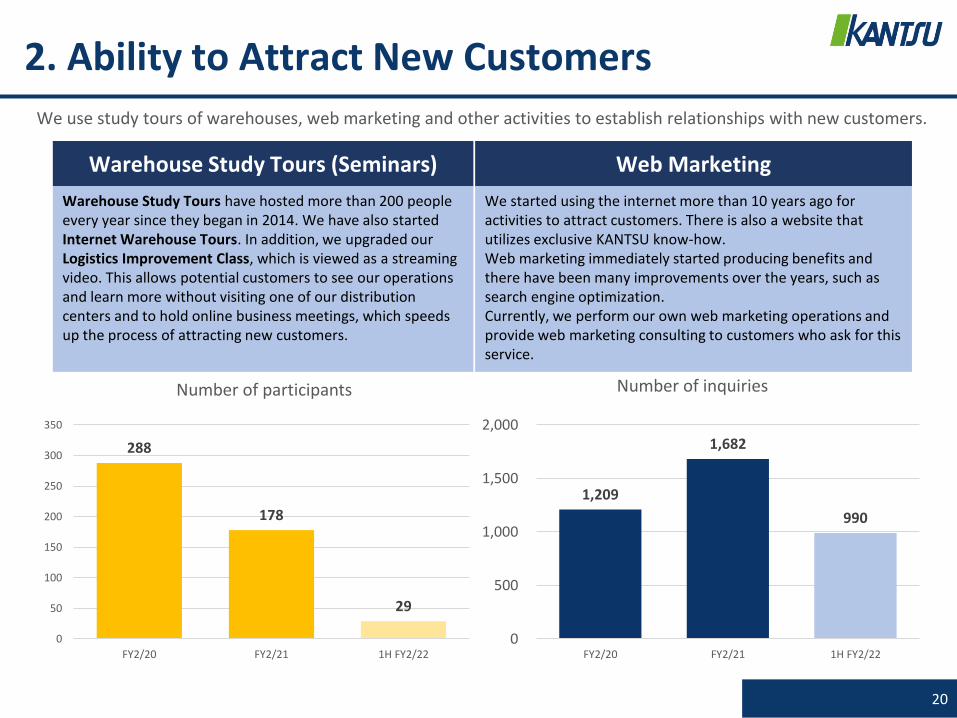
Warehouse Study Tours (Seminars)
Warehouse Study Tours have hosted more than 200 people every year since they began in 2014. We have also started Internet Warehouse Tours. In addition, we upgraded our Logistics Improvement Class, which is viewed as a streaming video. This allows potential customers to see our operations and learn more without visiting one of our distribution centers and to hold online business meetings, which speeds up the process of attracting new customers.
Web Marketing
We started using the internet more than 10 years ago for activities to attract customers. There is also a website that utilizes exclusive KANTSU know-how.Web marketing immediately started producing benefits and there have been many improvements over the years, such as search engine optimization. Currently, we perform our own web marketing operations and provide web marketing consulting to customers who ask for this service.
288
178
29
0
50
100
150
200
250
300
350
FY2/20 FY2/21 1H FY2/22
Number of participants
1,209
1,682
990
0
500
1,000
1,500
2,000
FY2/20 FY2/21 1H FY2/22
Number of inquiries
We use study tours of warehouses, web marketing and other activities to establish relationships with new customers.
3. Recruiting, Training and Productivity
21
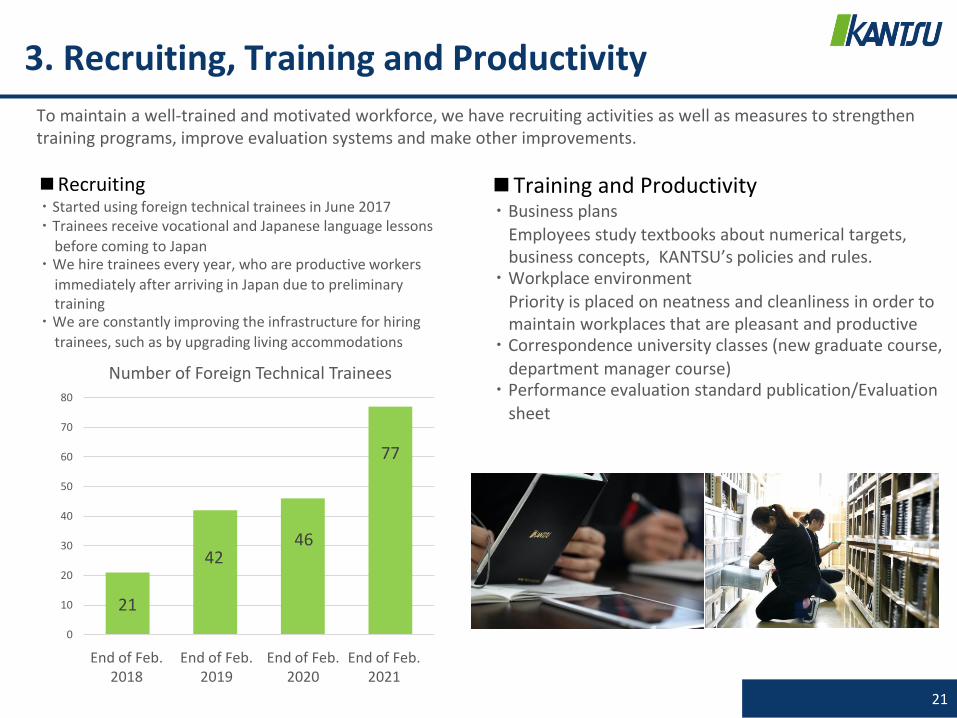
■Recruiting・Started using foreign technical trainees in June 2017・Trainees receive vocational and Japanese language lessons
before coming to Japan ・We hire trainees every year, who are productive workers
immediately after arriving in Japan due to preliminary training
・We are constantly improving the infrastructure for hiring
trainees, such as by upgrading living accommodations
■Training and Productivity・Business plans
Employees study textbooks about numerical targets, business concepts, KANTSU’s policies and rules.
・Workplace environment
Priority is placed on neatness and cleanliness in order to maintain workplaces that are pleasant and productive
・Correspondence university classes (new graduate course,
department manager course)・Performance evaluation standard publication/Evaluation
sheet
To maintain a well-trained and motivated workforce, we have recruiting activities as well as measures to strengthen training programs, improve evaluation systems and make other improvements.
21
4246
77
0
10
20
30
40
50
60
70
80
2018年
2月期末
2019年
2月期末
2020年
2月期末
2021年
2月期末
Number of Foreign Technical Trainees
End of Feb. 2018
End of Feb. 2019
End of Feb. 2020
End of Feb. 2021

22
IV. 1H FY2/22 Financial Summary

2,179 2,727
Plan
10,756
2,177 2,384
2,422
2,751
0
2,000
4,000
6,000
8,000
10,000
12,000
2021/02期 2022/02期
1Q 2Q 2Q 4Q
9,530
(Millions of yen)
43
184
Plan
670
86
171
80
207
0
100
200
300
400
500
600
700
2021/02期 2022/02期
1Q 2Q 2Q 4Q
418
(Millions of yen)
1. 1H FY2/22 Financial Highlights
23
Net sales Operating profit
Net sales 5,111 million yen (Up 17.3 % YoY)
Operating profit 356 million yen (Up 174.5 % YoY)
・Operating profit was 175% higher than one year earlier.In April 2021, the new EC/Catalog Distribution Center (about 15,900m2) reached full capacity.
In June 2021, the utilization rate of the new D-to-C Distribution Center (about 17,200m2) was
about 70%.
5,111
356
4,356129
FY2/21 FY2/22 FY2/21 FY2/22
3Q 3Q

24
* IT automation is a new reportable segment beginning with 1Q FY2/22. Due to a reexamination of software development depreciation expenses and other reasons associated with this new segment, 10 million yen of depreciation that was in SG&A expenses in 1H FY2/21 has been reclassified as cost of sales.
* KANTSU conducted a 3-for-1 stock split on September 1, 2021. EPS has been calculated as if this stock split had taken place at the beginning of FY2/21.
1H FY2/21 1H FY2/22 YoY change
Results% to net
salesResults
% to net sales
Amount %
Net sales 4,356 100.0 5,111 100.0 754 17.3
Gross profit 468 10.7 769 15.0 301 64.3
SG&A expenses 338 7.8 412 8.1 74 22.0
Operating profit 129 3.0 356 7.0 226 174.5
Ordinary profit 110 2.5 334 6.5 223 202.1
Profit 78 1.8 230 4.5 151 193.5
EPS (Yen) 9.07 - 22.91 - - -
2. 1H FY2/22 Results Summary
Sales and earnings increased due to strong growth of sales in the logistics services business and IT automation business.
(Millions of yen, %)

3. Quarterly Results Summary
25
FY2/21 FY2/22
1Q 2Q 3Q 4Q 1Q 2Q 1H Vs. 1H plan Vs. FY plan FY plan
Net sales 2,179 2,177 2,422 2,751 2,727 2,384 5,111 96.8 47.5 10,756
Gross profit 212 255 264 393 397 371 769 101.9 47.8 1,608
SG&A expenses 168 169 183 186 213 199 412 94.7 44.0 937
Operating profit 43 86 80 207 184 171 356 111.6 53.1 670
Ordinary profit 32 78 74 198 171 163 334 112.6 52.7 635
Profit 23 55 55 148 117 112 230 113.4 53.7 428
EPS (Yen) 2.78 6.12 6.14 15.86 11.92 10.95 22.91 - - 42.27
First half performance was in line with the fiscal year plan. Sales were 47.5% of the plan
and operating profit was 53.1% of the plan.
* IT automation is a new reportable segment beginning with 1Q FY2/22. Due to a reexamination of software development depreciation expenses and other reasons associated with this new segment, 10 million yen of depreciation that was in SG&A expenses in 2Q FY2/21 has been reclassified as cost of sales.
* KANTSU conducted a 3-for-1 stock split on September 1, 2021. EPS has been calculated as if this stock split had taken place at the beginning of FY2/21.
(Millions of yen, %)

3. Quarterly Results Summary
26
(Millions of yen)
Steady year-on-year growth of quarterly sales
1,7501,723
1,8451,981
2,1792,177 2,422
2,751 2,727 2,384
0
500
1,000
1,500
2,000
2,500
3,000
3,500
2020/2期
1Q
2020/2期
2Q
2020/2期
3Q
2020/2期
4Q
2021/2期
1Q
2021/2期
2Q
2021/2期
3Q
2021/2期
4Q
2022/2期
1Q
2022/2期
2Q
2022/2期
3Q[予]
2022/2期
4Q[予]
Quarterly Sales
1Q FY2/20
2Q FY2/20
3Q FY2/20
4Q FY2/20
1Q FY2/21
2Q FY2/21
3Q FY2/21
4Q FY2/21
1Q FY2/22
2Q FY2/22
3Q FY2/22 (plan)
4Q FY2/22 (plan)
*The yellow line is a moving average using the average of sales in the four-quarter period ending in each quarter.

27
1H FY2/21Net sales
4,356million yen
1H FY2/22Net sales
5,111million yen
Up 754 million
yen YoY
(2)
(1)
(3)(4)
4. Analysis of Change in Net Sales
(1) Higher sales of EC/catalog logistics support services
Switch of cargo transport rate contracts for some customers reduced sales but sales were higher because of sales from new customers in FY2/21 and 1Q FY2/22
+651 million yen YoY
(2) Growth in the IT automation businessThe number of contracts is increasing and there were strong sales of logistics automation hardware associated with new Cloud Thomas users in 1Q
+112 million yen YoY
(3) Lower sales of other logistics servicesSales decreased mainly because of cancelations of warehouse study tours mainly because of the COVID-19 pandemic
-7 million yen YoY
(4) Lower sales of other businessesSales of technology education services for foreign trainees decreased mainly due to the COVID-19 pandemic
-1 million yen YoY

5. Analysis of Change in Operating Profit
28
1H FY2/21Operating
profit129
million yen
1H FY2/22Operating
profit356
million yen
Up 226 million
yen YoY
(1)
(2)
(4)
(1) Higher gross profit in the logistics services business
Mainly due to higher sales in the EC/catalog logistics support services category
+261 million yen YoY
(2) Higher gross profit in the IT automation business
Higher earnings as the contribution of sales growth outweighed expenses for more people and other measures to upgrade maintenance operations
+39 million yen YoY
(3) Lower gross profit in the other businessesAlthough the performance of existing services is strong, there was a small decrease because of higher expenses due to the employment assistance service for people with developmental disabilities that was started in December 2020.
-0 million yen YoY
(4) Higher SG&A expenses (negative)Attributable mainly to expenses for strengthening administrative functions and advertising and marketing activities
-74 million yen YoY
(3)
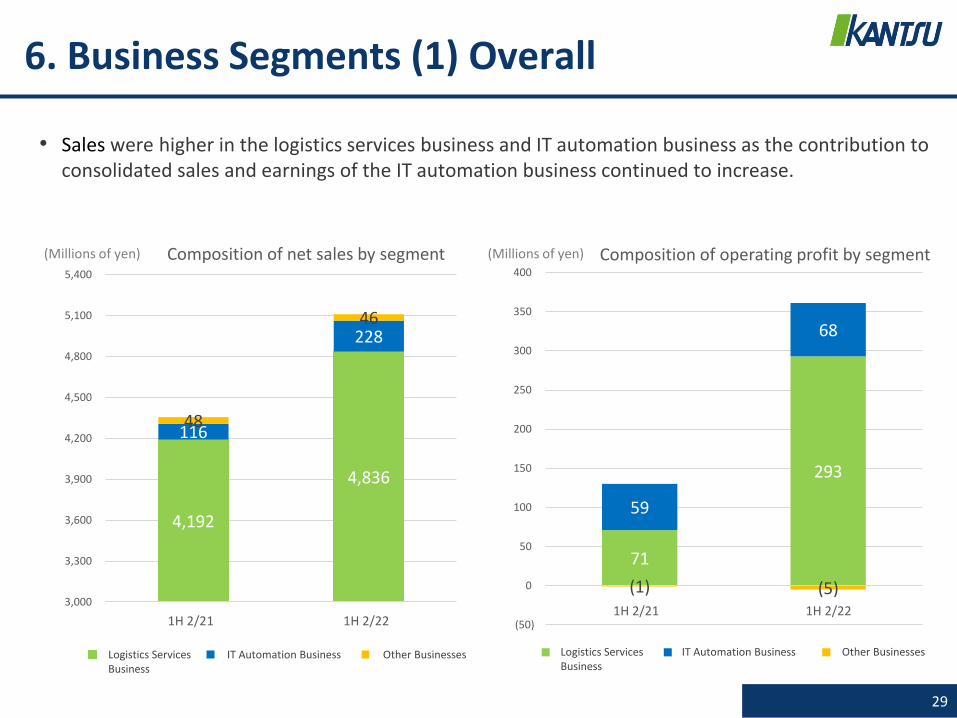
4,192
4,836
116
228
48
46
3,000
3,300
3,600
3,900
4,200
4,500
4,800
5,100
5,400
2021/2期2Q 2022/2期2Q
Composition of net sales by segment
物流サービス事業 ITオートメーション事業 その他の事業
6. Business Segments (1) Overall
• Sales were higher in the logistics services business and IT automation business as the contribution to consolidated sales and earnings of the IT automation business continued to increase.
29
(Millions of yen) (Millions of yen)
71
293
59
68
(1) (5)
(50)
0
50
100
150
200
250
300
350
400
2021/2期2Q 2022/2期2Q
Composition of operating profit by segment
物流サービス事業 ITオートメーション事業 その他の事業
1H 2/21 1H 2/221H 2/21 1H 2/22
IT Automation BusinessLogistics Services Business
Other Businesses IT Automation BusinessLogistics Services Business
Other Businesses
30
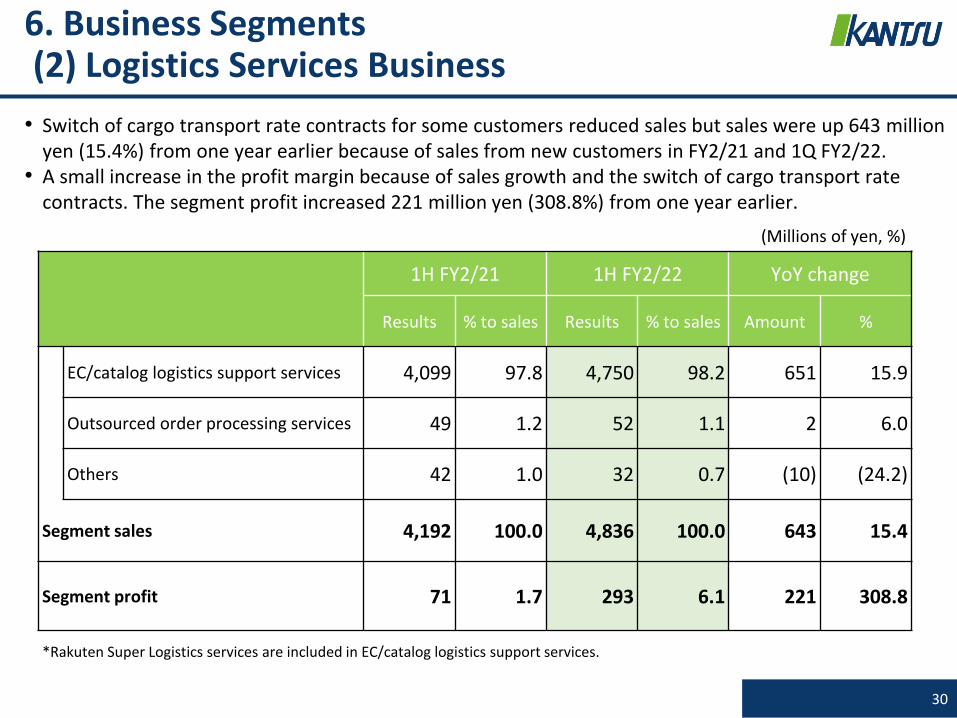
1H FY2/21 1H FY2/22 YoY change
Results % to sales Results % to sales Amount %
EC/catalog logistics support services 4,099 97.8 4,750 98.2 651 15.9
Outsourced order processing services 49 1.2 52 1.1 2 6.0
Others 42 1.0 32 0.7 (10) (24.2)
Segment sales 4,192 100.0 4,836 100.0 643 15.4
Segment profit 71 1.7 293 6.1 221 308.8
• Switch of cargo transport rate contracts for some customers reduced sales but sales were up 643 million yen (15.4%) from one year earlier because of sales from new customers in FY2/21 and 1Q FY2/22.
• A small increase in the profit margin because of sales growth and the switch of cargo transport rate contracts. The segment profit increased 221 million yen (308.8%) from one year earlier.
6. Business Segments(2) Logistics Services Business
*Rakuten Super Logistics services are included in EC/catalog logistics support services.
(Millions of yen, %)

31
1H FY2/21 1H FY2/22 YoY change
Results % to sales Results % to sales Amount %
Cloud Thomas 68 58.8 174 76.4 106 155.0
Other 48 41.2 53 23.6 5 12.1
Segment sales 116 100.0 228 100.0 112 96.2
Segment profit 59 50.8 68 30.1 9 16.2
6. Business Segments(3) IT Automation Business• Segment sales increased 112 million yen (96.2%) primarily because of the increasing number of Cloud
Thomas contracts and higher sales of logistics automation hardware as the number of Cloud Thomas users increased in 1Q.
• Segment profit increased 9 million yen (16.2%). Logistics automation hardware sales raised cost of sales ratio and there were expenses associated with the 2020 release of Thomas Pro and for strengthening support operations. (Millions of yen, %)
6. Business Segments(4) Other Businesses
32
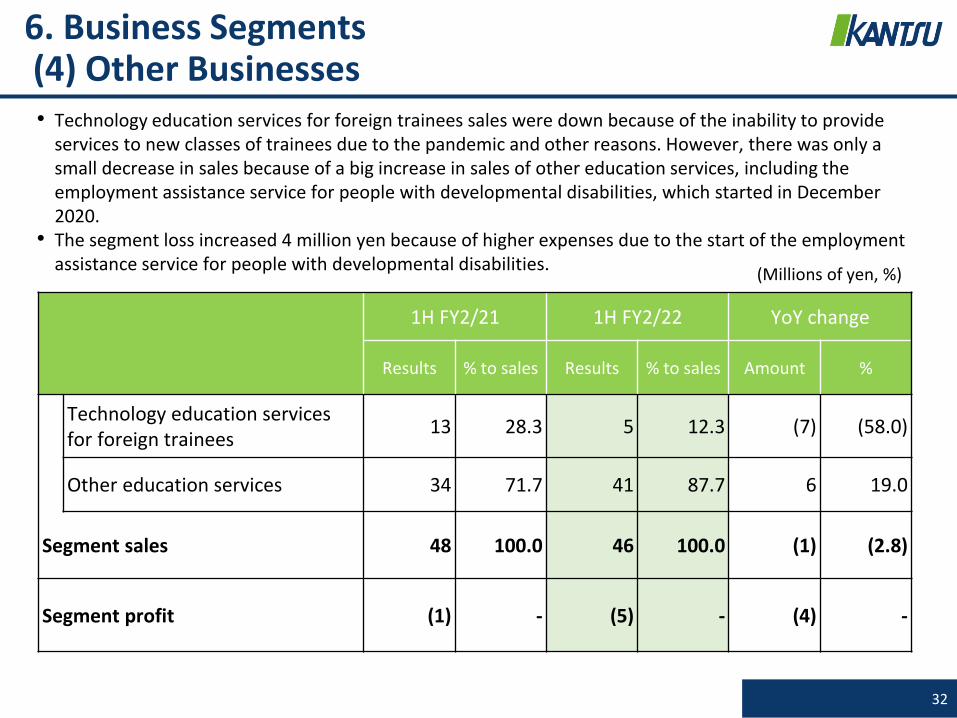
1H FY2/21 1H FY2/22 YoY change
Results % to sales Results % to sales Amount %
Technology education services for foreign trainees
13 28.3 5 12.3 (7) (58.0)
Other education services 34 71.7 41 87.7 6 19.0
Segment sales 48 100.0 46 100.0 (1) (2.8)
Segment profit (1) - (5) - (4) -
• Technology education services for foreign trainees sales were down because of the inability to provide services to new classes of trainees due to the pandemic and other reasons. However, there was only a small decrease in sales because of a big increase in sales of other education services, including the employment assistance service for people with developmental disabilities, which started in December 2020.
• The segment loss increased 4 million yen because of higher expenses due to the start of the employment assistance service for people with developmental disabilities.
(Millions of yen, %)
33
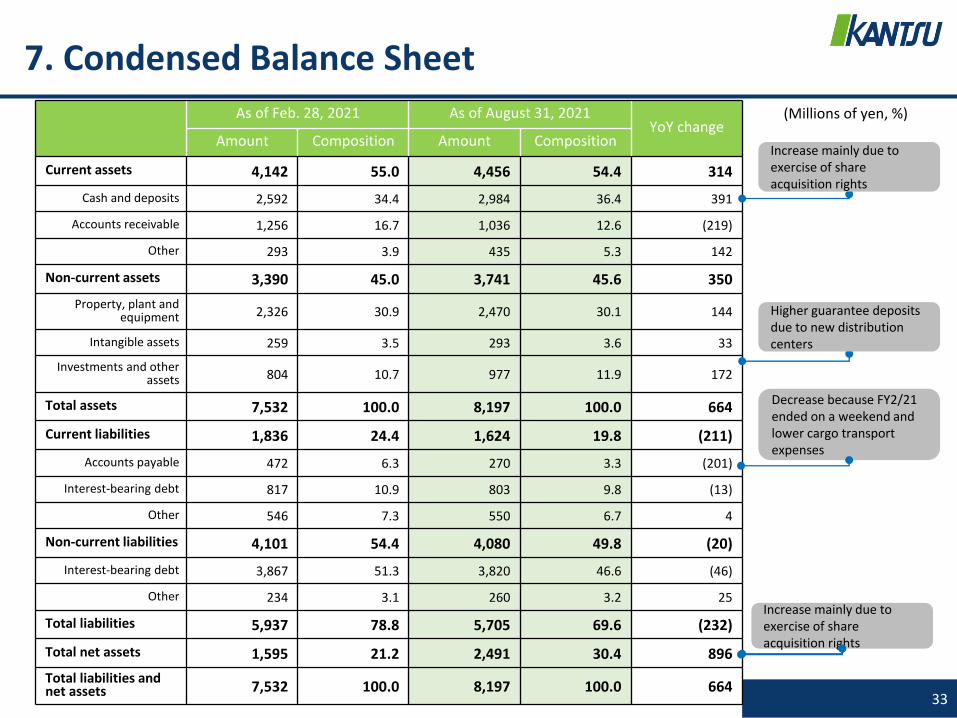
As of Feb. 28, 2021 As of August 31, 2021YoY change
Amount Composition Amount Composition
Current assets 4,142 55.0 4,456 54.4 314
Cash and deposits 2,592 34.4 2,984 36.4 391
Accounts receivable 1,256 16.7 1,036 12.6 (219)
Other 293 3.9 435 5.3 142
Non-current assets 3,390 45.0 3,741 45.6 350
Property, plant and equipment 2,326 30.9 2,470 30.1 144
Intangible assets 259 3.5 293 3.6 33
Investments and other assets 804 10.7 977 11.9 172
Total assets 7,532 100.0 8,197 100.0 664
Current liabilities 1,836 24.4 1,624 19.8 (211)
Accounts payable 472 6.3 270 3.3 (201)
Interest-bearing debt 817 10.9 803 9.8 (13)
Other 546 7.3 550 6.7 4
Non-current liabilities 4,101 54.4 4,080 49.8 (20)
Interest-bearing debt 3,867 51.3 3,820 46.6 (46)
Other 234 3.1 260 3.2 25
Total liabilities 5,937 78.8 5,705 69.6 (232)
Total net assets 1,595 21.2 2,491 30.4 896
Total liabilities and net assets 7,532 100.0 8,197 100.0 664
Decrease because FY2/21 ended on a weekend and lower cargo transport expenses
Increase mainly due to exercise of share acquisition rights
7. Condensed Balance Sheet
(Millions of yen, %)
Increase mainly due to exercise of share acquisition rights
Higher guarantee deposits due to new distribution centers
34
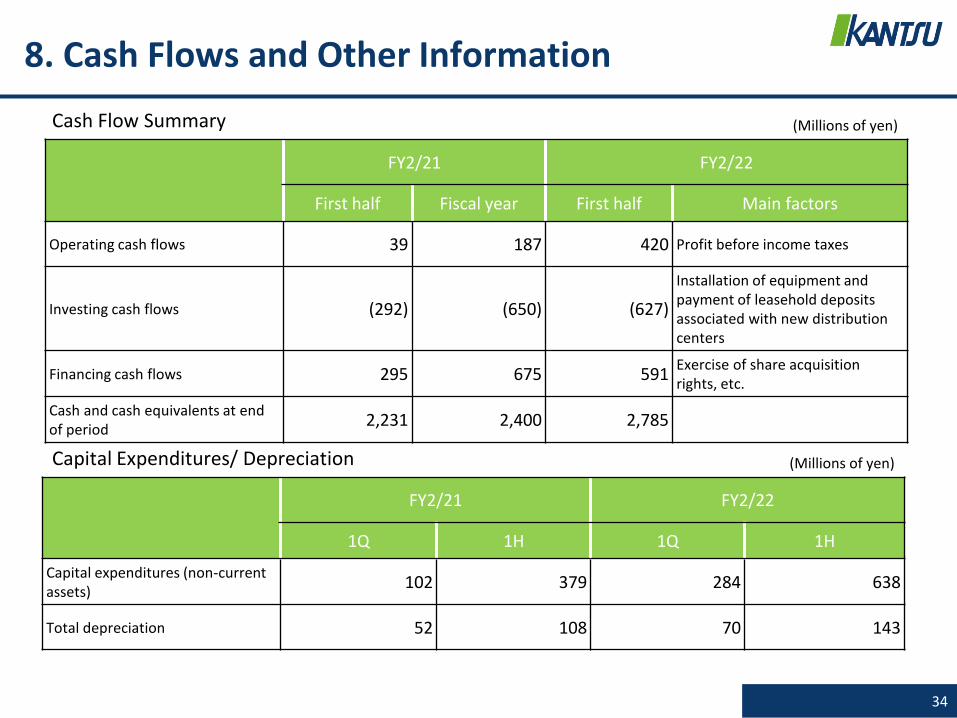
(Millions of yen)Cash Flow Summary
FY2/21 FY2/22
First half Fiscal year First half Main factors
Operating cash flows 39 187 420 Profit before income taxes
Investing cash flows (292) (650) (627)
Installation of equipment and payment of leasehold deposits associated with new distribution centers
Financing cash flows 295 675 591Exercise of share acquisition rights, etc.
Cash and cash equivalents at end of period
2,231 2,400 2,785
FY2/21 FY2/22
1Q 1H 1Q 1H
Capital expenditures (non-current assets)
102 379 284 638
Total depreciation 52 108 70 143
(Millions of yen)Capital Expenditures/ Depreciation
8. Cash Flows and Other Information
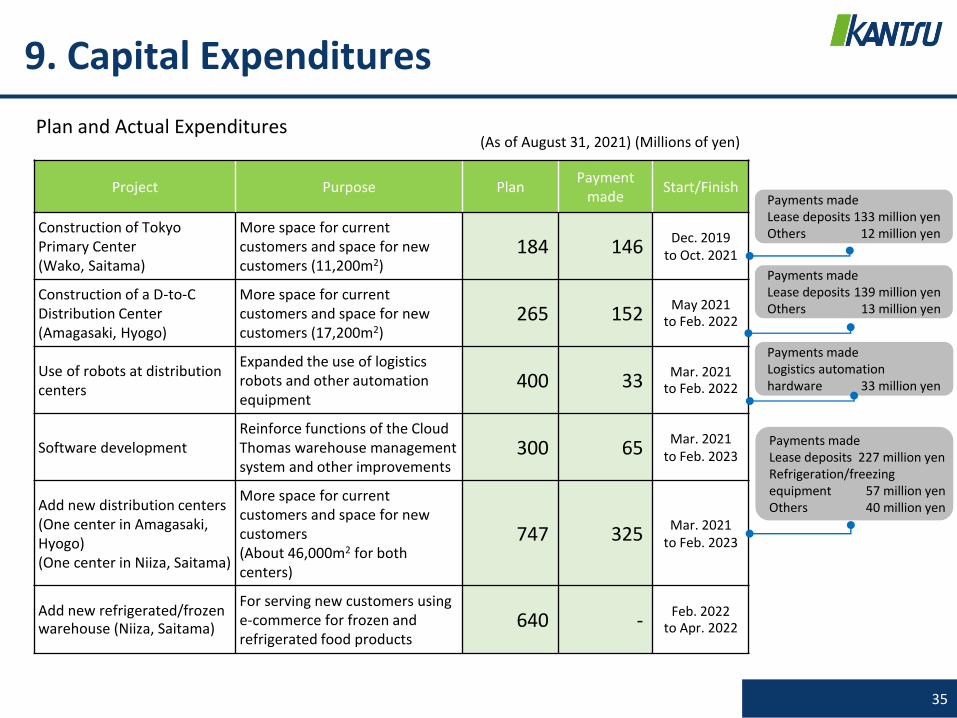
35
Project Purpose PlanPayment
madeStart/Finish
Construction of Tokyo Primary Center(Wako, Saitama)
More space for current customers and space for new customers (11,200m2)
184 146Dec. 2019
to Oct. 2021
Construction of a D-to-C Distribution Center (Amagasaki, Hyogo)
More space for current customers and space for new customers (17,200m2)
265 152May 2021
to Feb. 2022
Use of robots at distribution centers
Expanded the use of logistics robots and other automation equipment
400 33Mar. 2021
to Feb. 2022
Software developmentReinforce functions of the Cloud Thomas warehouse management system and other improvements
300 65Mar. 2021
to Feb. 2023
Add new distribution centers(One center in Amagasaki, Hyogo)(One center in Niiza, Saitama)
More space for current customers and space for new customers (About 46,000m2 for both centers)
747 325Mar. 2021
to Feb. 2023
Add new refrigerated/frozen warehouse (Niiza, Saitama)
For serving new customers using e-commerce for frozen and refrigerated food products
640 -Feb. 2022
to Apr. 2022
Plan and Actual Expenditures
Payments made Logistics automation hardware 33 million yen
9. Capital Expenditures
(As of August 31, 2021) (Millions of yen)
Payments made Lease deposits 133 million yenOthers 12 million yen
Payments made Lease deposits 139 million yenOthers 13 million yen
Payments made Lease deposits 227 million yenRefrigeration/freezingequipment 57 million yenOthers 40 million yen

36
V. FY2/22 Earnings Forecasts
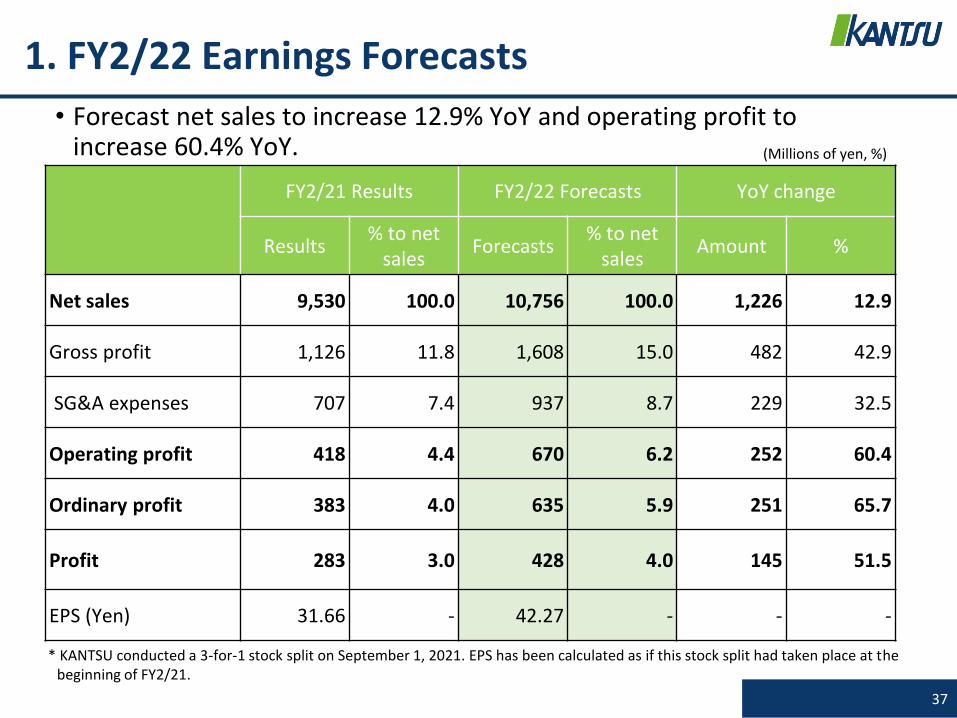
37
FY2/21 Results FY2/22 Forecasts YoY change
Results% to net
salesForecasts
% to net sales
Amount %
Net sales 9,530 100.0 10,756 100.0 1,226 12.9
Gross profit 1,126 11.8 1,608 15.0 482 42.9
SG&A expenses 707 7.4 937 8.7 229 32.5
Operating profit 418 4.4 670 6.2 252 60.4
Ordinary profit 383 4.0 635 5.9 251 65.7
Profit 283 3.0 428 4.0 145 51.5
EPS (Yen) 31.66 - 42.27 - - -
* KANTSU conducted a 3-for-1 stock split on September 1, 2021. EPS has been calculated as if this stock split had taken place at the beginning of FY2/21.
1. FY2/22 Earnings Forecasts
• Forecast net sales to increase 12.9% YoY and operating profit to increase 60.4% YoY. (Millions of yen, %)
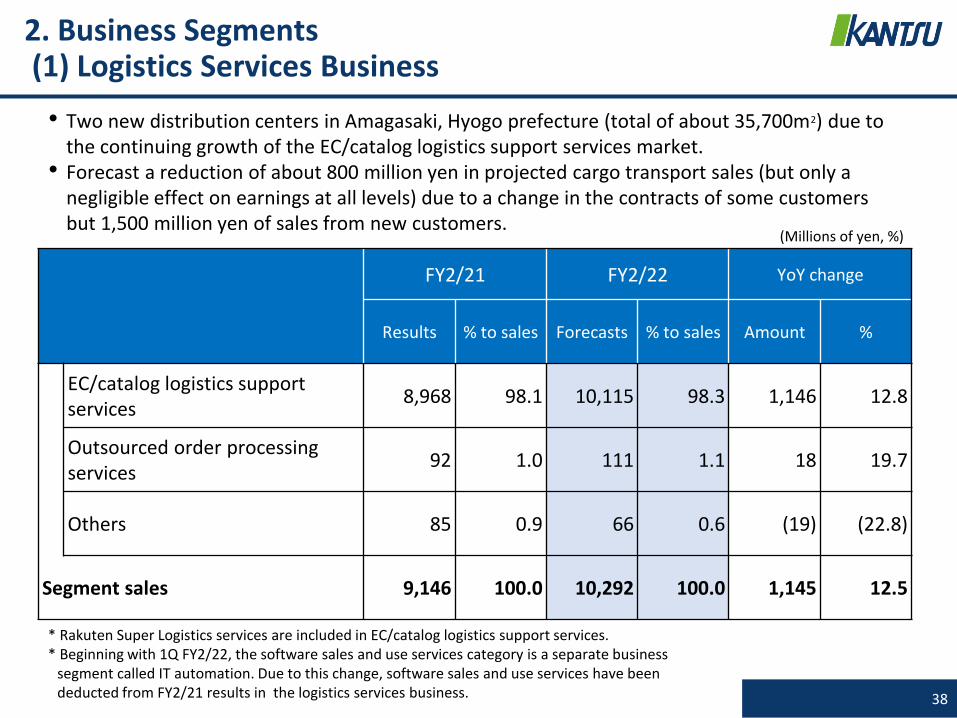
2. Business Segments(1) Logistics Services Business
38
FY2/21 FY2/22 YoY change
Results % to sales Forecasts % to sales Amount %
EC/catalog logistics support services
8,968 98.1 10,115 98.3 1,146 12.8
Outsourced order processing services
92 1.0 111 1.1 18 19.7
Others 85 0.9 66 0.6 (19) (22.8)
Segment sales 9,146 100.0 10,292 100.0 1,145 12.5
* Rakuten Super Logistics services are included in EC/catalog logistics support services.* Beginning with 1Q FY2/22, the software sales and use services category is a separate business
segment called IT automation. Due to this change, software sales and use services have been deducted from FY2/21 results in the logistics services business.
• Two new distribution centers in Amagasaki, Hyogo prefecture (total of about 35,700m2) due to the continuing growth of the EC/catalog logistics support services market.
• Forecast a reduction of about 800 million yen in projected cargo transport sales (but only a negligible effect on earnings at all levels) due to a change in the contracts of some customers but 1,500 million yen of sales from new customers.
(Millions of yen, %)

39
FY2/21 FY2/22 YoY change
Results % to sales Forecasts % to sales Amount %
Cloud Thomas 202 68.2 244 70.1 42 20.8
Others 94 31.8 104 29.9 10 10.6
Segment sales 297 100.0 349 100.0 52 17.6
2. Business Segments (2) IT Automation Business
• In addition to the Cloud Thomas warehouse management system, we are adding Cloud Thomas Pro, which can be customized to match each customer’s requirements and scale of operations, to serve a broader range of customers.
• Cloud Thomas sales are forecast to increase 42 million yen (20.8%) which is a conservative outlook that does not include any Cloud Thomas Pro sales.
* Figures for FY2/21 results in the IT automation business use actual figures from software sales and use services in the logistics services business.
(Millions of yen, %)
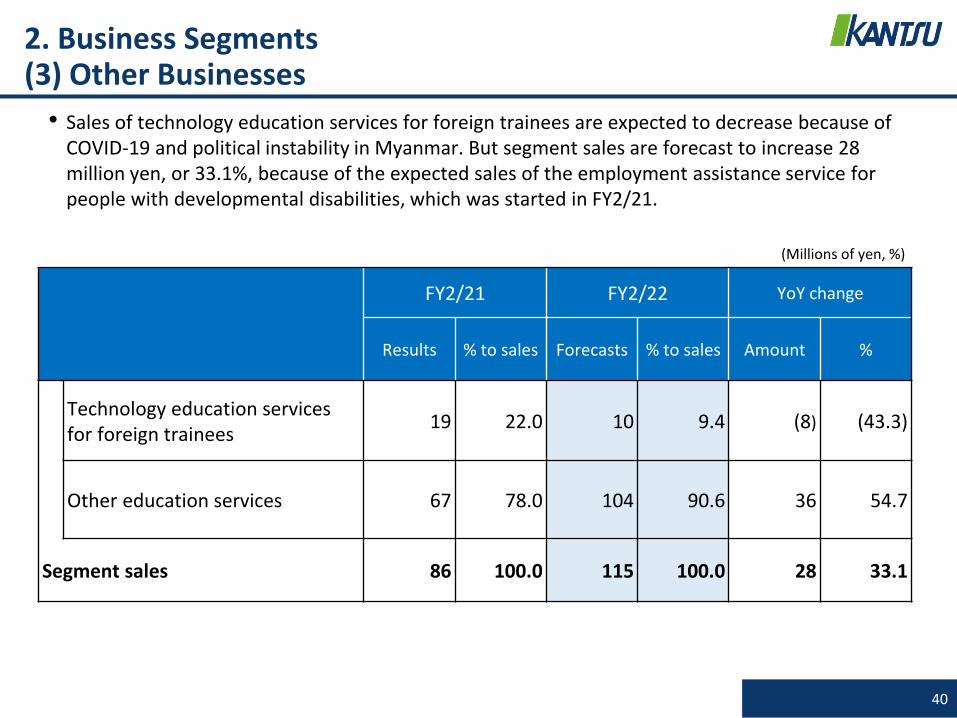
40
FY2/21 FY2/22 YoY change
Results % to sales Forecasts % to sales Amount %
Technology education services for foreign trainees
19 22.0 10 9.4 (8) (43.3)
Other education services 67 78.0 104 90.6 36 54.7
Segment sales 86 100.0 115 100.0 28 33.1
2. Business Segments (3) Other Businesses
• Sales of technology education services for foreign trainees are expected to decrease because of COVID-19 and political instability in Myanmar. But segment sales are forecast to increase 28 million yen, or 33.1%, because of the expected sales of the employment assistance service for people with developmental disabilities, which was started in FY2/21.
(Millions of yen, %)
41
VI. Medium-term Business Plan-2024-

1. Medium-term Business Plan Overview
42
FY2/22 FY2/23 FY2/24
Plan% to net
sales
YoY change
(%)Plan
% to net sales
YoY change
(%)Plan
% to net sales
YoY change
(%)
Net sales 10,756 100.0 12.9 13,105 100.0 21.8 15,370 100.0 17.3
Gross profit 1,608 15.0 42.9 1,833 14.0 14.0 2,280 14.8 24.4
SG&A expenses 937 8.7 32.5 1,036 7.9 10.5 1,184 7.7 14.3
Operating profit 670 6.2 60.4 796 6.1 18.8 1,095 7.1 37.6
Ordinary profit 635 5.9 65.7 750 5.7 18.1 1,050 6.8 40.0
Profit 428 4.0 51.5 506 3.9 18.1 708 4.6 40.0
(Millions of yen, %)
• The goal is net sales of 15.3 billion yen and operating profit of 1.0 billion yen in FY2/24 by achieving growth that outpaces the e-commerce market’s expansion.
ROE At least 15.0% - At least 15.0% - At least 15.0% -

2. Medium-term Plan for Business Segments
43
FY2/22 FY2/23 FY2/24
Plan% to net
sales
YoY change
(%)Plan
% to net sales
YoY change
(%)Plan
% to net sales
YoY change
(%)
Logistics services business
10,292 95.7 12.5 12,178 92.9 18.3 14,215 92.5 16.7
IT automation business
349 3.2 17.6 800 6.1 129.1 1,000 6.5 25.0
Other businesses 115 1.1 33.1 126 1.0 10.1 155 1.0 22.5
Net sales 10,756 100.0 12.9 13,105 100.0 21.8 15,370 100.0 17.3
Gross profit 1,608 15.0 42.9 1,833 14.0 14.0 2,280 14.8 24.4
• In the logistics services business, the goal is to use capital expenditures for distribution center expansion and robots and other automated logistics equipment in order to grow faster than the e-commerce market.
• In the IT automation business, the goal is to become recognized as an IT vendor by making software investments, mainly for Cloud Thomas, and using alliances and other measures to strengthen sales activities. (Millions of yen, %)
44
9,146
10,292
12,178
14,215
297
349
800
1,000
86
115
126
155
8,000
9,000
10,000
11,000
12,000
13,000
14,000
15,000
16,000
2021/2期実績 2022/2期計画 2023/2期計画 2024/2期計画
Logistics services business IT automation business Other businesses
(Millions of yen)
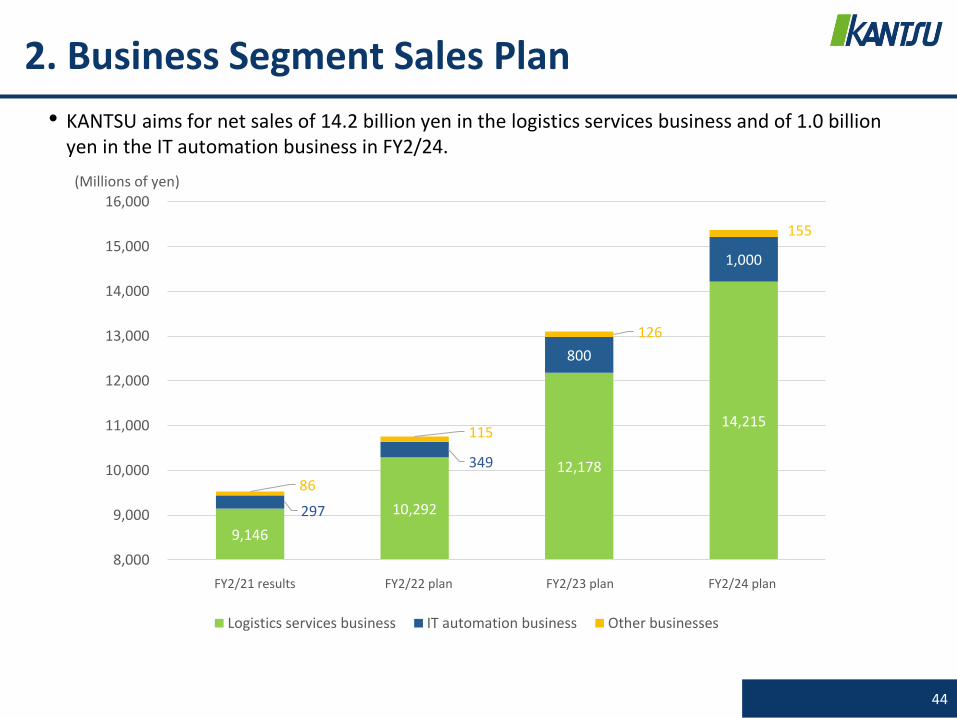
2. Business Segment Sales Plan
• KANTSU aims for net sales of 14.2 billion yen in the logistics services business and of 1.0 billion yen in the IT automation business in FY2/24.
FY2/21 results FY2/22 plan FY2/23 plan FY2/24 plan
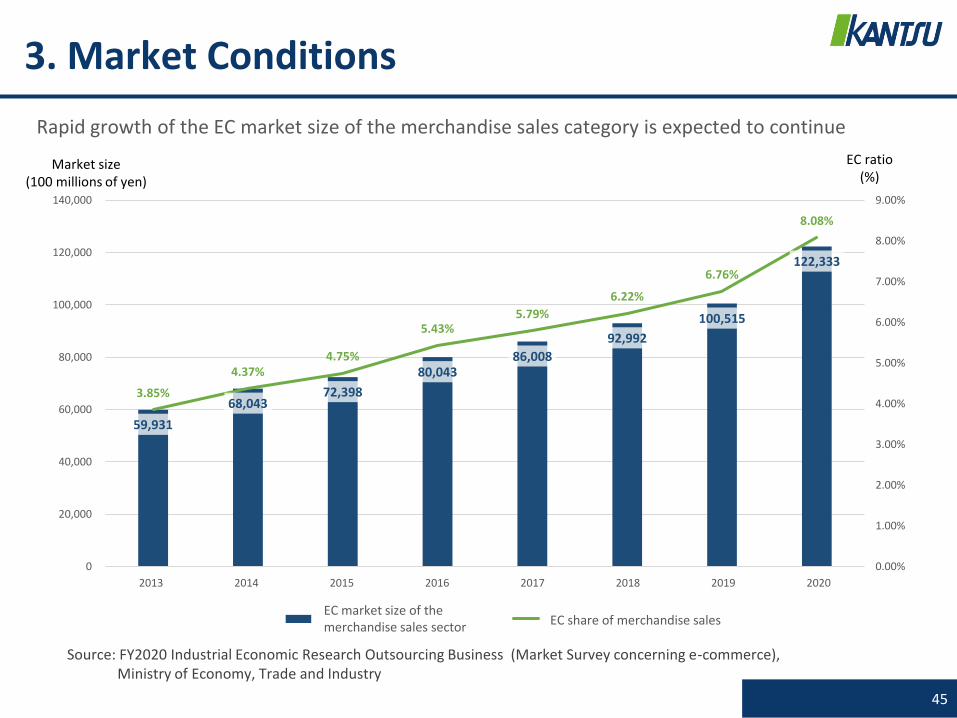
3. Market Conditions
45
Rapid growth of the EC market size of the merchandise sales category is expected to continue
Source: FY2020 Industrial Economic Research Outsourcing Business (Market Survey concerning e-commerce), Ministry of Economy, Trade and Industry
59,931
68,043 72,398
80,043 86,008
92,992
100,515
122,333
3.85%
4.37%4.75%
5.43%5.79%
6.22%
6.76%
8.08%
0.00%
1.00%
2.00%
3.00%
4.00%
5.00%
6.00%
7.00%
8.00%
9.00%
0
20,000
40,000
60,000
80,000
100,000
120,000
140,000
2013年 2014年 2015年 2016年 2017年 2018年 2019年 2020年
物販系分野EC市場規模(億円) 物販系分野EC化率(%)
Market size(100 millions of yen)
EC ratio (%)
2013 2014 2015 2016 2017 2018 2019 2020
EC market size of the merchandise sales sector EC share of merchandise sales
46
Source: FY2020 Industrial Economic Research Outsourcing Business (Market Survey concerning e-commerce), Ministry of Economy, Trade and Industry
Classification
2019 2020
Market size(¥ billion)
*Lower column: vs. 2018
EC ratio (%)
Market size(¥ billion)
*Lower column: vs. 2019
EC ratio (%)
1 Food, drinks, and liquor1,823.3(7.77%)
2.89%2,208.6
(21.13%)3.31%
2Electrical appliances, AV equipment, and PC and peripherals
1,823.9(10.76%)
32.75%2,348.9
(28.79%)37.45%
3Books, and visual and music software
1,301.5(7.83%)
34.18%1,623.8
(24.77%)42.97%
4 Cosmetics and pharmaceuticals661.1
(7.75%)6.00%
778.7(17.79%)
6.72%
5Household goods, furniture, and interior
1,742.8(8.36%)
23.32%2,132.2
(22.35%)26.03%
6 Clothes and apparel goods1,910.0(7.74%)
13.87%2,220,3
(16.25%)19.44%
7Automobiles, motorcycles, and parts
239.6(2.04%)
2.88%278.4
(16.17%)3.23%
9 Other549.2
(4.79%) 1.54%
642,3(16.95%)
1.85%
Total1,0051.5(8.09%)
6.76%12,233.3(21.71%)
8.08%
Reference: KANTSU Market Category Sales Composition (1H FY2/22 results)
33%
21%12%
8%
8%
6%
4%8%衣類、服装雑貨等
化粧品、医薬品
食品、飲料、酒類
サービス
書籍、映像・音楽ソフト
生活雑貨、家具、インテリア
生活家電、AV機器、PC・周辺機
器等
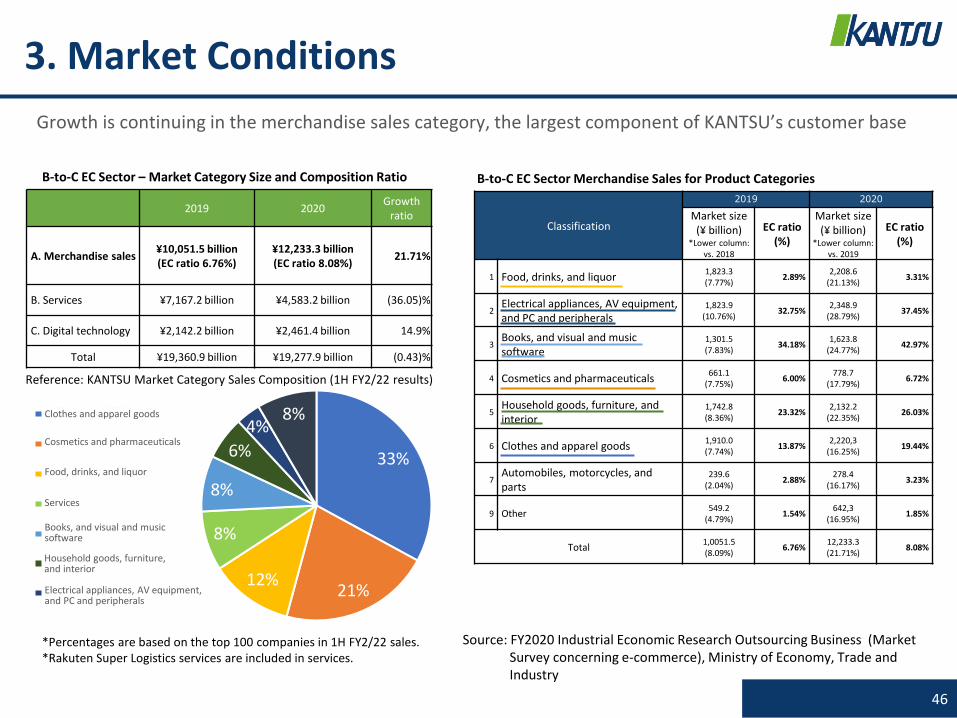
3. Market Conditions
Growth is continuing in the merchandise sales category, the largest component of KANTSU’s customer base
B-to-C EC Sector – Market Category Size and Composition Ratio B-to-C EC Sector Merchandise Sales for Product Categories
2019 2020Growth
ratio
A. Merchandise sales¥10,051.5 billion(EC ratio 6.76%)
¥12,233.3 billion(EC ratio 8.08%)
21.71%
B. Services ¥7,167.2 billion ¥4,583.2 billion (36.05)%
C. Digital technology ¥2,142.2 billion ¥2,461.4 billion 14.9%
Total ¥19,360.9 billion ¥19,277.9 billion (0.43)%
Clothes and apparel goods
Cosmetics and pharmaceuticals
Food, drinks, and liquor
Services
Books, and visual and music software
Electrical appliances, AV equipment, and PC and peripherals
Household goods, furniture, and interior
*Percentages are based on the top 100 companies in 1H FY2/22 sales.*Rakuten Super Logistics services are included in services.

47
• Supply an upgraded version of the Cloud Thomas warehouse management system to strengthen its functionsStarted selling Cloud Thomas Pro in FY2/21 and currently upgrading customization capabilities for the use of this software in midsize and large-scale applications
• Use alliances for sales activities
January 2022 (planned) Automated warehouse with 1,050 pallets for frozen merchandise (1,323 ambient temperature pallets)EC/Catalog Distribution Center (Amagasaki, Hyogo)
April 2022 (planned) Kanto New Distribution Center (tentative name) in Niiza, Saitama prefecture (about 7,600m2)
• Build an infrastructure for services that solve last-mile issues
3 Start providing services for the last mile
2 Grow rapidly as an IT vendor
1 New large refrigerated and frozen warehouses
4. Growth Strategy
• Strengthen logistics sales services for refrigerated/frozen food EC, a category expected to continue growing
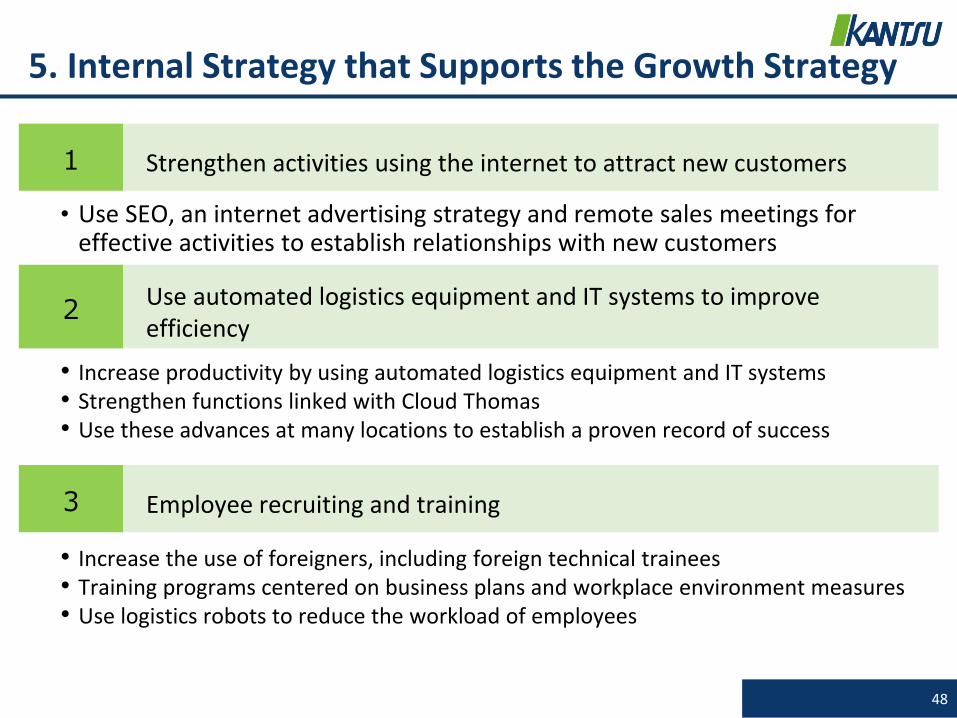
5. Internal Strategy that Supports the Growth Strategy
48
• Use SEO, an internet advertising strategy and remote sales meetings for effective activities to establish relationships with new customers
1 Strengthen activities using the internet to attract new customers
• Increase productivity by using automated logistics equipment and IT systems• Strengthen functions linked with Cloud Thomas • Use these advances at many locations to establish a proven record of success
2Use automated logistics equipment and IT systems to improve efficiency
• Increase the use of foreigners, including foreign technical trainees• Training programs centered on business plans and workplace environment measures• Use logistics robots to reduce the workload of employees
3 Employee recruiting and training

6. KPI Number of New Customers
49
113
230
590
830
0
100
200
300
400
500
600
700
800
900
2021/2期[実] 2022/2期[予] 2023/2期[予] 2024/2期[予]
(Plan) Contracts at End of Fiscal YearCloud Thomas
期末契約社数
2,740
642
817
1,821
321
408
910
1,165
3,000
5,000
7,000
9,000
11,000
13,000
15,000
2021/2期[実] 2022/3期[予] 2023/3期[予] 2024/3期[予]
(Plan) Sales from New CustomersEC/catalog logistics support services
既存顧客売上 前期新規顧客売上
当期新規顧客売上
Net sales(Millions of yen)
FY2/21 (Result) FY2/22 (Plan) FY2/23 (Plan) FY2/24 (Plan)FY2/21 (Result) FY2/22 (Plan) FY2/23 (Plan) FY2/24 (Plan)
Existing customer sales
New customers since prior year
Current fiscal year new customers
*Sales from EC and catalog logistics support services
Companies
Contracts at end of fiscal year
90.2
77.1
84.3
91.4
0
50
100
150
200
250
65.0
70.0
75.0
80.0
85.0
90.0
95.0
2021/2期[実] 2022/2期[予] 2023/2期[予] 2024/2期[予]
(Plan) Year-end Utilization Rate and Sales per Tsubo
1坪当たり売上高(千円) 期末稼働率(%)
50
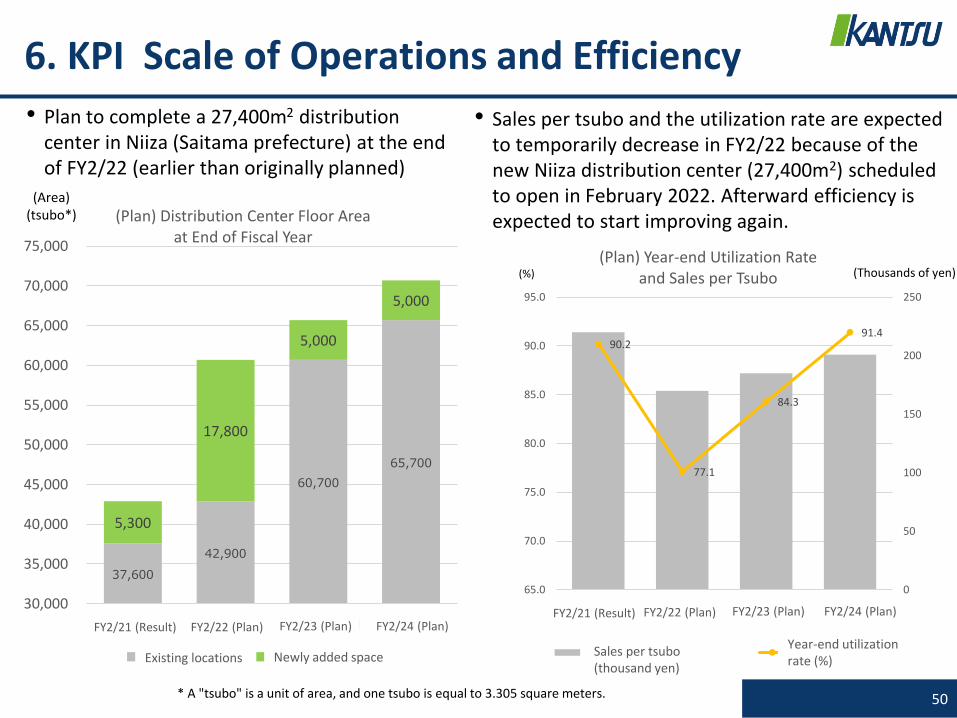
6. KPI Scale of Operations and Efficiency
37,600
42,900
60,700
65,700
5,300
17,800
5,000
5,000
30,000
35,000
40,000
45,000
50,000
55,000
60,000
65,000
70,000
75,000
2021/02期[実] 2022/02期[予] 2023/02期[予] 2024/02期[予]
(Plan) Distribution Center Floor Area at End of Fiscal Year
既存倉庫面積 増床倉庫面積
(%)
• Plan to complete a 27,400m2 distribution center in Niiza (Saitama prefecture) at the end of FY2/22 (earlier than originally planned)
• Sales per tsubo and the utilization rate are expected to temporarily decrease in FY2/22 because of the new Niiza distribution center (27,400m2) scheduled to open in February 2022. Afterward efficiency is expected to start improving again.
FY2/21 (Result) FY2/22 (Plan) FY2/23 (Plan) FY2/24 (Plan)FY2/21 (Result) FY2/22 (Plan) FY2/23 (Plan) FY2/24 (Plan)
(Area)(tsubo*)
* A "tsubo" is a unit of area, and one tsubo is equal to 3.305 square meters.
(Thousands of yen)
Newly added spaceExisting locations Sales per tsubo (thousand yen)
Year-end utilization rate (%)

Reference:Activities for the Sustainable Development Goals
51

Reference: Activities for the Sustainable Development Goals
52
Category Activities Examples
Digital Transformation
Hire young people in Japan and other countries with a desire to learn ICT skills for logistics to become software developers or engineers for the use of ICT at logistics facilities. Give these people skills concerning new logistics facility management methods and ICT by placing them in jobs where they use management processes utilizing logistics facility ICT, develop software and are involved with other related tasks. In addition, use business-academic partnerships and other measures for logistics system and software R&D programs.
⚫ Use of logistics robots and robotic process automation
⚫ Collaboration with the Department of Industrial and Management Systems, Engineering School of Creative Science and Engineering, Waseda University
⚫ Collaboration with the Malaysia-Japan International Institute of Technology
⚫ The KANTSU career advancement program
The environment
Recycle materials used for logistics, reduce the use of paper by using the Cloud Thomas warehouse management system, and increase the use of paperless formats for invoices and contracts. Implement measures for sustainability, such as the use of LED lights at distribution centers to use less energy. Establish a framework for making environmental activities the foundation for the sustained growth of KANTSU.
⚫ Recycle packaging materials⚫ Install LED lights⚫ Paperless invoices⚫ Paperless contracts
Associated SDGs
53
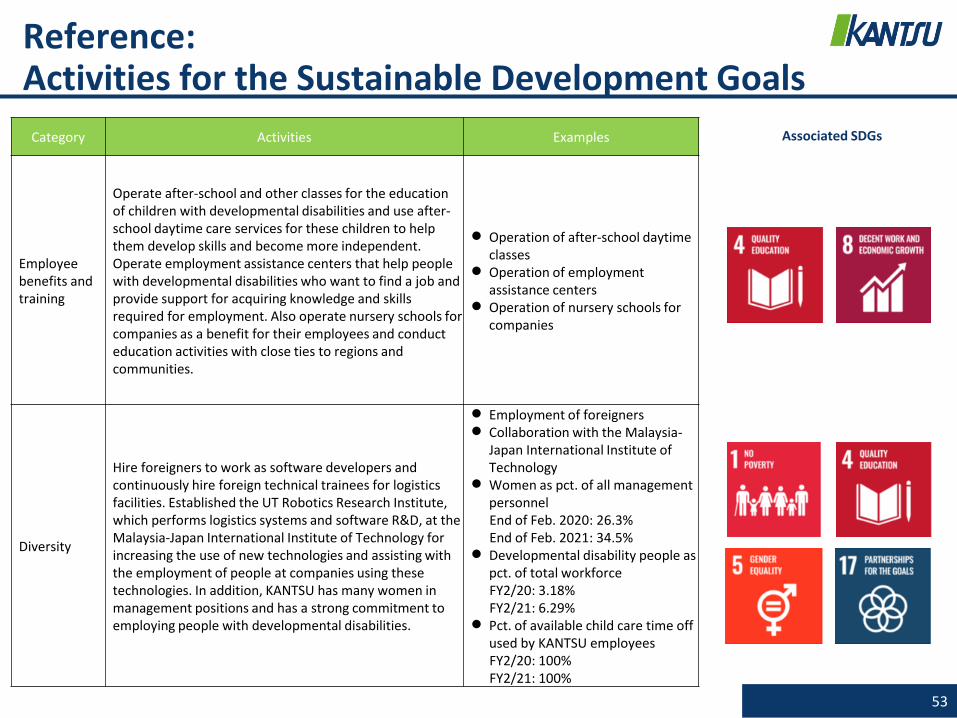
Category Activities Examples
Employee benefits and training
Operate after-school and other classes for the education of children with developmental disabilities and use after-school daytime care services for these children to help them develop skills and become more independent. Operate employment assistance centers that help people with developmental disabilities who want to find a job and provide support for acquiring knowledge and skills required for employment. Also operate nursery schools for companies as a benefit for their employees and conduct education activities with close ties to regions and communities.
⚫ Operation of after-school daytime classes
⚫ Operation of employment assistance centers
⚫ Operation of nursery schools for companies
Diversity
Hire foreigners to work as software developers and continuously hire foreign technical trainees for logistics facilities. Established the UT Robotics Research Institute, which performs logistics systems and software R&D, at the Malaysia-Japan International Institute of Technology for increasing the use of new technologies and assisting with the employment of people at companies using these technologies. In addition, KANTSU has many women in management positions and has a strong commitment to employing people with developmental disabilities.
⚫ Employment of foreigners⚫ Collaboration with the Malaysia-
Japan International Institute of Technology
⚫ Women as pct. of all management personnelEnd of Feb. 2020: 26.3%End of Feb. 2021: 34.5%
⚫ Developmental disability people as pct. of total workforceFY2/20: 3.18%FY2/21: 6.29%
⚫ Pct. of available child care time off used by KANTSU employeesFY2/20: 100%FY2/21: 100%
Reference: Activities for the Sustainable Development Goals
Associated SDGs
54
Disclaimer
■ Information in this presentation and associated materials contains forward-looking statements. These statements are based on the current outlook and forecasts as well as on assumptions that incorporate risk. All forward-looking statements include uncertainties that may result in actual performance that differs from these statements.
■ Risk factors and uncertainties include the condition of industries and markets, interest rate and foreign exchange rate movements, and other factors involving the condition of the Japanese and global economies.
■ Although this presentation and other materials were prepared carefully in order to ensure accuracy, KANTSU does not guarantee that these materials are accurate or complete.
■ The information provided in these materials may be modified or updated if there is a substantial change in the contents.
Disclaimer and Precautions Concerning Forward-looking Statements
Inquiries
KANTSU CO., LTD. IR Representative
Please use the designated form for IR inquiries.
URL: https://www.kantsu.com/
IR Inquiries Form