Embed Size (px)
Citation preview

STONYHURST COLLEGE
OBSERV ATORY. Lat. 53° 50' 38·5" N. Long. 9m 52'··88 W.
Height of the Barometer above the Sea, 381 feet.
(FOUNDED 1838.)
lReslllts of (Seopb~sical an~
Solar ~bser\1atiot1st 1930.
------ -.----- ----
With Report and Notes of the Director, Rev. E. D. O'CONNOR, S.]., M.A., F.R.A.S., F.R.Met.Soc.
=========- .. --~-
BLACKBURN: THOMAS BRIGGS (Blackburn) LTD,. PRINTERS. 73. NORTHGATE.


OONTENTS_
Report and Notes of the Director
Meteorological
Synoptic Meteorology
Magnetical
Astronomical Time Service ...
Astrominical
Solar Observations
Seismological '"
Maximum Gusts for each Day of the Year, 1930
Monthly Meteorological Tables
Yearly Meteorological Summary
Extreme Readings during 83 Years
Dates of Occasional Phenomena
Monthly Totals of Recorded Sunshme for each hour
Total amount of Sunshine recorded on each day
Summary of Sunshine
Summary of Sunshine: Monthly extremes during 50 years
Magnetic Report :
1. Horizontal Direction and Force deduced from da.ily curves
2. Absolute Measures-Summary
3. Magnetic Disturbances, 1930
Dates of Solar Observations and Disc Areas of Spots from the Drawings, 1930 .
Sun-Spot Statistics, 1930
v.
v.
XII.
XII.
XVllI.
XVIII.
XIX.
XXII.
XXV.
25
27
29
30
:31
33
34
35
38
39
41


v.
REPORT AND NOTES.
GENERAL.-In August we lost the services of Mr. D. R. Ward, who is now engaged on his Theological studies. Mr. T. Corbishley, B.A., one of the Masters at the College, assists in the Weather Forecasting Department. The rest of the Staff remains unchanged.
A considerable amount of shelf-room has been added to that already available for the I.../ibrary. Father Macklin has been engaged in entirely rearranging and cataloguing the books and various publications.
Father Rowland attended the Meeting of the British Association held at Bristol. He was nominated a member of the Committee of Section A.
The Director gave a number of Lectures to various Societies.
As in previous years, the boys at the School and visitors have been shown over the Observatory, and as opportunity served, interesting celestial objects were viewed through the 15-inch Equatorial.
METEOROLOGICAL.-The meteorological continuous records have been uninterrupted during the year, the results being forwarded, as usual, to the Meteorological Office, London, at the end of each week and of each month.
The outstanding features of the year's weather were an abnormally dry February, heavy rains in July, August, October, November, and, with the exception

VI.
of June, a general prevalence of clouds. The rainfall in February was only 0·410 in., more than half of which fell on the 14th. The mean February rainfall for the last 83 years is 3·516 in. The total fall for the year was 4·656 in. in excess of the mean. The days on which one or more inches of rain fell were May 8th, July 22nd, August 6th, October 29th, and November 18th. Precipitation took place on 222 days. The driest months were February, March and April, the wettest, January, August, October and November.
Sunshine was above the average in seven months of the year, but the total number of hours for the whole year waq 6·5 hours below the average. This was due to a considerable deficit in April, July and December. SlIDshine was recorded on 276 days.
Fine day lJeriod8 oJ.five days or nwre occurred as follow8 .
Feb. 7-13 ApI. 27 -May 4
Feb. 15-24 June 1-8 Dec. 1-5.
Feb. 26-Mal'. 3 Sept. 28-0ct. 2
A total of seven periods, with an average of 7·3 days each, as against eleven periods of 7·3 days each in 1929.
Bright sunshine for ten hours or more were recorded on :--
April 22, 29, 30; May I, 2, 12, 14, 25, 27, 28, 29 ; June 5, 6, 7, 8, 15, 26; JuJy 5, 9, 1l ; Augu~t 3, 16, 24, 26, 27, 28; September 2, 3, 15. A total of 29 days, with an average of II· 8 each, as against 41 days, with
. an average of 12· I each in 1929.
VII.
Day8 on which notable continuous 8un8hine OCCU"ed were :
January 15; February 16; April 22, 29; May 1 ; June 6, 7, 8,; July 5.
A total of nine days, as against 29 days in 1929.
The adopted mean temperature wa.~ 47°·3, 0°·4 above the normal. The highest shade temperature was 86°·0, on August 27th, 4°·8 above the normal; the lowest 21°'0, on March 20th, 4°·5 above the normal. June, July and August were the warmest months; February, March and December the coldest.
Six gales of 37 mi1es pew hour or over were recorded : Two in January. one in September, one in November, and two in December. The greatest mean velocity of the wind, 48 miles per hour in direction S~. was on January 10th. The highest gust, 69 miles per hour, occurred on January 2nd.
Synopsi8 of the Monthly Weather.' --
Jan'lU:£ru.--Wet, but comparatively mild and sunny.
Rainfall, 137·8% of the average. Wettest period. the first fortnight, diRtributed fairly evenly.
Sunshine 140·0% of the average. Evenly distributed on 19 days.
Adopted mean temperature, 20 .6 ab01Je the normal. Ground frost on only eight days, the last week of the month being the coldest.
Total wind mileage, 107% of the ave'l'age. The strongest gale of the year, 48 m.p.h., from the S., on the 10th.

VIII.
February:-Sunny, exceptionally dry, calm, rather cold.
Rainfall, 1l·5% of the average, on six days.
Sunshine, 122·9% of the average, on 18 days. Dull on the first four days; sunniest period, 15th--18th. Almost 50% of the total amount occurred on these four days.
Adopted mean temperature, 2°.6 below the normal. Coldest period, 17th-21st.
Total wind mileage, 62·20/0 of the average. Gale force never reached.
March.-Comparatively dry, otherwise normal.
Rainfall, 85·80/0 of the average on 16 days, most of which fell between 4th-21st; driest period, 22nd-30th, with only 0·070 in.
Sunshine, 98·2% of the average on 24 days. A sunny period, 22nd-24th, with an average of 8·2 hours each day. The first nine days were the dullest.
Adopted mean temperature 0°·4 below the normal; ground frost on 12 days; cold period 13th-20th, with ground frost each day.
Total wind mileage, 89·4% of the average. Gale force never reached.
April.-Comparatively warm and dry, but dull.
Rainfall, 84·7% of the average, evenly distributed on 18 days. Wettest period, 1st-14th; no rain fell after t.he 26th.
IX.
Sunshine, 69·4% of the a.verage on 26 days. First 10 days, very dull; sunniest period, 16th-22nd. Last two days, very sunny.
Adopted mean temperature, 0°.8 above the normal.
Wind mileage, 96·2 % of the average. Gale force never reached.
May.-Wet during the middle of the month, but otherwise normal.
Rainfall, 121· 7% of the average. Heavy fall of 1·056 in. on the 8th.
Sunshine, 105·7% of the average. A sunny period, 25th-29th, with an average of 10·2 hours each day. Only two days, the 13th and 19th, were sunless.
June.-Calm, very dry, sunny and warm at first, t,hen wet· and mild.
Rainfall, very slightly below normal, approximately 60% of which fell after the 18th. Over one inch fell on the 9th and lOth.
Sunshine, 112·3% of the average, on 25 days. Specially sunny periods, 3rd to 8th, and 24th-30th.
Adopted mean temperature, 2°.0 above the normal.
July.-Tfirst half dry, normally sunny and warm; remainder, wet, very dull and mild.
Rainfall, 148·70/0 of the average. Rain fell every day after the 12th, with a heavy fall of 1·126 in. on the 22nd.

x.
Sunshine, 80·1 % of the average, on 28 days, 62% of which was registered on the first 12 daye. A very dull period, 13th-23rd, with an average of only 0·8 of an hour each day.
August.-Normally warm and sunny, but very wet.
Rainfall, 146% of the average. :First half of the month the wettest period, the last 7 days the driest. On the 6th a heavy fall of 1·055 in.
Sunshine, 107·9% of the average. fairly evenly distributed, except for a sunny period during the last week.
September.~Dry, but rather dull.
Rainfall, 81· 30/0 of the average; two rainy periods 6th-11th, and 17th -22nd. Driest period, 23rd-30th, with approximately 170/0 of the total amount.
Sunshine, 92·4% of the average. The first three days bright., with 10 hours of sunshine each.
October.-Rather sunny and mild, but very wet and windy.
Rainfall, 162·8% of the average. A very rainy period began on the 3rd, 2·600 in. being registered for the next four days. Another heavy fall of I· 628 m. occurred on the 29th.
Sunshine; 113·5~1o of the average; sunniest period, 16th-26th. The first four days and last five days of the month, very dull.

xl.
Adopted mean tempera,ture, 10 .7 above the average. Gl'ound frost on the 27th.
Total wind mileage, 132% of the average, but greatest velodty just short of gale for'e.
Novembtr.--Wet, but comparatively sunny, mild.
Rainfall, 134,4% of the average, on 20 days. Two fairly dry periods, 3rd-6th, and llth-17th. The last part of the month wet, commencing with a heavy fall of ] ·200 in. on the 18th.
Sunshine, 120·0% of the average, but on only 17 days. The first eight days were responsible for over 50% of the total amount. During the last 20 days there was a daily average of just less than one hour.
Adopted mean temperature and total wind mileage both slightly above normal. A gale of 40 m.p.h. was recorded on the 24th, in direction E.S.E.
December.-Calm and dry, but very dull.
Rainfall, 76·0% of the average; first week dry,
Sunshine, 64·8 % of the average, on only 12 days.
Total wind mileage, only 65·9% of the average, in spite of gales of 40 m.p.h. on the 27th, and 39 m.p.h. on the 28th.
A Table showing the maximum gusts for each day, as recorded by the Dines Tube Anemometer, will be found at the end of these Notes. The maximum for each month is printed in heavy type.

XII.
SYNOPTIC METEOROLOGY.-The service has been continued throughout the year. A daily chart-for 0700 G.M.T.-was posted up at the College, and a daily forecast of local weather supplied to the Lancashire Daily Post.
MAGNETICAL.-Father Rowland reports :-Absolute measures of Horizontal Magnetic Force have been made once each month by the method of Vibration and Deflection. The constants of the magnetometer needles were described in our 1921 Annual Report (p. vii). The Inclination is also measured, once each month, by two needles, with Dover's Circle, No. 159. The Declination is observed each week, and usually at about 16 hours. The Differential Instruments, or Photo-Magnetographs, which have been in practically continuous action since the year 1866, are of the Kew Observatory pattern, except that the radial distances between the centres of the magnets and the surfaces of the respective cylinders are somewhat shorter, being 152·4 Crus. The time-scale is provided by cutting off the light every two hours, by means of an electromagnet actuated from thi Synchronome Clock. The scale values of the instruments are as follows :-
For the Unifilar 11 ·28' per Om. of Ordinate.
" Bifilar . 000496 C.G.S." "
Owing to the cumulative effect of secular variation in Declination, it has become impossible to maintain the Vertical Force Balance in the Magnetic Meridian, and accordingly the instrument was dismounted on June lIth, and has since remained out of action.

:xure
Four daily readings are measured on the curves, the highest, the lowest" and those at the hours 4 and 16. The Base-line values are determined from the measures of the curve ordinates at the times of the absolute observations, the adopted value for each month being, in the case of Declination, the mean of the four or five observations of the month, and in the case of the Horizontal Force, the single value obtained from the observation about the middle of the month.
In the Tabular Summary on p. 37 the Absolute Measures of Horizontal Direction and Force are corrected by the difference between the curve ordinate at the time of observation and the monthly mean of the four daily readings on the five quietest days of the month, according to the rule stated on page xii of our Report for 1908.
The Vertical and Total Forces are deduced from the measures of the Horizontal Force, and the angle of Inclination or Dip.
In the Table of Magnetic Disturbances (page 38) the intention is that a calm (c) shall mean a smooth curve ; 8mall (s) a disturbance noteworthy only as opposed to a calm; moderate (m) a disturbance not to be neglected for any comparison with other phenomena, solar or terrestrial; greater (g) a marked disturbance; and very great (v.g.) a decided storm.
The rule followed in assigning these letters to denote the magnetic character of a day is as follows:-
From the measured ranges of D and H in minutes of arc on the five quietest days of a month a mean value is obtained of D and H combined. Similarly for each

XIV.
day of the month a mean value in minutes of arc of the range of D and H combined is set down. The excess of this mean daily range over the mean for the five quietest days gives the magnetic character of the day. Till the year 1927, inclusive, the following values of the excess were adopted for the table of magnetic disturbances :o to 2 calm, 3 to 7 small, 8 to 15 moderate, 16 to 20 great, above 20 very great.
It has, however, been felt for some time (cJ. Report 1925, p. xxiv) that the ranges assigned for the higher character letters were too low, and accordingly a change was made in 1928 and the following scale adopted: (c) 0-2, (s) 3-7, (m) 8-20, (g) 2~-65, (v.g.) over 65.
It follows from the nature of the process that these indications are not absolute, but relative to the mean amount of disturbance on the quiet days.
Corresponding tabulations are sent quarterly to the Meteorological Institute at De Bilt (Holland), for the International Committee on Terrestrial Magnetism. In these the significant notes are restricted to threeo (quiet), I (moderately disturbed), and 2 (highly disturbed). The character figures are assigned according to the scheme detailed in the Annuaire for 1918 of the Royal Dutch Meteorological Institute. The civil day is used for both the international figures and for our own characteristic letters.
There was only one magnetic disturbance during the year ranking as" very great" in our scale of characters, viz., that on December 3rd, with a range of 61' in Declination and 343'1 in Horizontal Force. The storm was heralded by a wen marked" sudden commencement" at I h. 9 m., on the 3rd, but there were no further important movementB of the magnets till about 14 h. 20 m., J

xv.
'when the disturbance entered on its principal phase. The most remarkable feature of the storm was a very large oscillation of H between 15 h. 0 m. and 15 h. 30 m., covering the whole range of the storm. The details of this oscillation consisted of a sharp rise of 255')1 in six minutes, minor oscillations about the maximum for three minutes, and a rapid fall of 343')1 to the minimum in three stages occupying 21 minutes.
The year as a whole was remarkable for the very large number of disturbances classed as "moderate" or "greater," the number of days with these characters being respectively 138 and 48, as compared with 96 and 25 in t.he previous yea,r. These disturbances for the most part fall into two groups of sequences centred respectively at approximately 27 days interval, which have retained their integrity throughout the year, as shewn in the chart of diurnal ranges on p. xvi. In this chart the year has been divided into periods of 27 days, successive periods being placed in vertical sequence, and the ordinates of the curves are taken from the figures of diurnal range which determine our character letters as explained on p.p. xiii, xiv. The mean synodic period of Solar rotation being 27·275 days, the recurrence of these periods of more pronounced magnetic disturbance at approximately this interval, points to the continued greater activity of two regions of the solar surface of considerable extent in longitude: separated by regions of less activity. There is an indication of one of these active regions dividing into two with increasing separation of centres and becoming less active, as shewn by the dividing of the second magnetic sequence into two after the notable disturbance of September 19th. The storm of December

DAY OF PERIOD.
It) H 1
II. I~ 14 IS" II '7 t8 If I." 1.1 l.I, ltl 1.1/ .If' 16 2'J J I
40-
lo-~ o =-=-=:>.~
l#- ~ ~
10
D~~!,-411-
:~ 21r
10-
$' 10 IS'
~~ .. ~ 10 IS,;.,.. S" 10
lD-
40-
14-
'0 IOe"'. $' III
-10
rl 0
_40
L~-!: 10 16" 1<1
_J,D
I~
_40
o ...." IS ~.(q31 1930. DAILY MAGNETIC CHARACTER IN 27-DAY PERIODS.
XVII.
3rd may be .either an isolated disturbance, or it may belong to the preceding branch of the divided sequence referred to above. It is noteworthy that these magnetic disturbances were not generally associated with the occurrence of conspicuous spotted areas near the central meridian, but the storm of December 3rd occurred about one and a half days after a quite insignificant group had crossed the central meridian.
The disturbance of December 20th was accompanied by an Aurora, which afforded an opportunity for an observation of exceptional interest, details of which were published in a letter to Nature (1931, .January 17), and communicated to the Royal Astronomical Society at the meeting on January 9th. The substance of this observance was that the Aurora, which was observed during a period of rapid fall in the value of the Declination, faded out at the moment when that fall ceased, and it was suggested that this could be explained by assigning a negative charge to the stream of electrified particles to which both the Aurora and the magnetic deflection may be attributed.
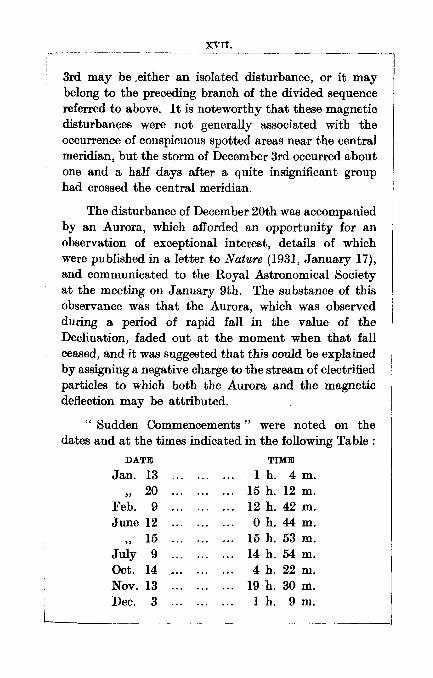
"Sudden Com.mencements" were noted on the dates and at the times indicated in the following Table:
DATE TIME
Jan. 13 1 h. 4 m.
" 20 15 h. 12 m.
Feb. 9 12 h. 42 m. June 12 o h. 44 m.
" 15 15 h. 53 m.
July 9 14 h. 54 m. Oct. 14 4 h. 22 m. Nov. 13 19 h. 30 m. Dec. 3 1 h. 9 m.

XVIU.
The s.c. on January 13th was not followed by any notable disturbance, and that on February 9th was followed by three days" calm," and then by the second greatest disturbance of the year. That on December 3rd was followed after an interval of about 13 hours by the storm already described.
ASTRONOMICAL TIME SERVIcE.-The rhythmic time signals from Rugby at 1000 G.M.T. have been regularly taken throughout the year, and the errors and rates of the s:klereal and mean time clocks and chronometers determined from them.' On occasion, supplementary time signals have also been received. Time marks are made by the Synchronome Clock every minute on the Milne-Shaw Seismograph, and every two hours on the Magnetographs.
ASTRONOMICAL.-Of the 82 Lunar Occultations listed in the Nautical Almanac as visible at Greenwich, 72 were unobservable owing to rain or clouds. Eight were successfully observed, five disappearances and three reappearances, .and the results sent to Dr. Comrie.
Twenty-six of the 52 Herschel "Nebulosity" Fields were examined with the 15-in. Refractor, each three or four times. The results were not very satisfactory, owing to the very few occasions when" seeing" was really good. On the best nights the appearance was not unlike the visual appearance of the Milky Way without optical aid, but with patches of more uniform density~ something like patches of grey cloud. The Milky Way appearance was particula,rly noticeable in Fields 35 and 36, near a Ursre Majoris, on the night of April 30th:-May 1st. This was a particularly clear night.

XIX.
A start has been made to attempt to photograph the Fields, using a 6-in. Dalmeyer Portrait Lens at F/4, with a Wratten Filter No. 16-so far without success.
SOLAR OBSERVATIONs.-Observations of the Sola:r Surface were made on 266 days, the same number of days as in 1929, and include 264 drawings, as against 272 the previous year. Of the drawings 235 are complete and show all spots and faculre; of the remaining 29, 11 are complete for the spots.
Sun-spot statistics have been sent regularly to Professor Brunner, of Zurich, for the preparation of the "Sun-Spot Numbers" published in the quarterly Bulletin under the auspices of the I.A. U.
Through the kindness of Professor Brunner an interchange of copies of the Zurich and Stonyhllrst drawings has been arranged to supplement, as far as possible, any gaps that may occur in our respective observations. The scales of the drawings are not quite the same. The diameter of the Zurich Disc is 25 em., of the Stonyhurst Disc 10·5 in. = 26·67 cm. But each Observatory supplies the co-ordinates of the various spot-nuclei obtained from its own drawings.
Professor Favaro, of Catania, also very kindly places the Catania drawings at our disposal, sending all the Catania observations to Stonyhurst. These are duly returned, after examination, and copies taken of any drawings of particular interest, or of such as enable us further to fill in any gaps in our own observations. The practice at Catania i~ to draw the groups separately, not necessarily in their relative positions to one another. The whole disc is not shown, the scale of the drawing,
xx.
58 cm. to the diameter of the disc, being too large. The position angle, however, and distance from the limb of the various groups are indicated, if not too far away from the limb.
Tables have been formed whereby the projected areas of the spots, both in the case of the Zurich and Catania drawings, can be estimated.
The observation days and daily projected areas in units 1/5000 of the disc, are recorded on pages 39 and 40. The horizontal lines on those pages indicate the commencement of a new solar rotation. For the first four months of the year copies were not made of the Catania drawings if they did not exhibit some special feature; hence the blanks that occur in the entries of the projected areas.
There were no spots on June 23rd, August 5th, December 8th and 31st.
The mean daily disc area of the spots, in units 1/5000 of the disc, works out at 2·44. From the Stonyhurst drawings alone it is slightly less, 2·26, as compared with 6 ·19 in 1929, and 7 ·19 in 1928.
The Sun-Spot Statistics B,re given on pp. 41-49. The groups are numbered in the order of their appearance in the Stonyhurst drawings. Spots special to the Zurich or Catania drawings receive the same number with a ' as the Stonyhurst group which is nearest to them. Thus, Group 22 has co-ordinates, latitude + 18° ·1, longitude 36°.9. The spotlet 22' which was on the Zurich drawing for February 4th has co-ordinates, latitude + Ip·9, longitude 34°·2.

XXI.
It was impossible to determine the co-ordinates of
the spots special to the Catania drawings, as they usually
appeared near the central portion of the disc, and no
indications were given of their actual positions. The
only exception waf' grouplet 86', which appeared near
the preceding limb on June 13th, and apparently coin.
cided with a small patch of faculre which was noted on
the Stonyhurst drawing for tTune 14th, although there
was no sign of the grouplet on that day. It will be
observed that an the spots not found on the Stony hurst
drawings were quite small, area 0·1, or less, with the one
exception of grouplet 86', and generally were only on
the disc for one day.
Finally a few of the values of maximum area were
obtained from the Zurich or Catania drawings. These
have been duly indicated.
The following Table shows the distribution of spot
groups in the Northern and Southern Hemispheres at
each rotation, with their maximum projected areas. The
last column but one gives t.he sum of the maximum
projected a·reas of all the groups on the Sun during the
rotation in question. The rotations are numbered in
accordance with the Greenwich convention.

XXII.
-----~--~------.-------------;---------.------;----
I I III I Northern Southern
Hemisphere Hemisphere I '------1 Sum. of Daily
Rotation I Max'm Mean No. of Max'm I No. of Max'm Areas Areas Groups Areas Groups Areas I Beginning
--------1-------,1---1----1-----I 1020. Dec. 15·42 16 37·1 i 6 12·4 49·5 12·23 1021. Jan. 11·74 13 18·0 I 10 9·4 27·4 5'76; ! 1022. Feb. 8·08 6 4·5 I 6 14·4 18·9 3·00 1023. Mar. 7·42 11 6·7 i 6 8·1 14·8 3·15 1024. April 3·72 13 8·4 i 8 4·2 12·6 2·38 I 1025. April 30·98 7 9·4 I 5 3·5 12·9 2·47 I
1026. May 28·20 7 7·1 i 6 2·6 9·7 1·715 I 1027. June 24·40 10 3·4 II 6 2·1 5·5 I 0'75) 1028. July 21·61 4 1·6 6 3·6 5·2 i 1·19 I 1029. Aug. 17·83 9 8·4 I 8 2·3 10·7 I 1·93 I 1030. Sept. }4.·08 4 12·0 5 2·0 14·0! 2.64) 1031. Oct. 11·36 3 1· 8 4 5·4 7·2 I 2'621' 1032. Nov. 7·66 9 I 6·1 4 9·1 15·2 i 3·38 1033. Dec. 4·97 9 i 3·0 2 1 . 8 ~ . 8 ! 0 . 80 I
I i I
I I 1--1'--1 121 127·5 I 82 80·9 208·4 2' 84 1
I TOTALS .•
SEISMOLOGY.-Father Rowland reports .-The total number of earthquakes definitely recorded during the year was 97, as against 129 laet year) distributed as follows :-
Jan Feb. Mar. April May June July Aug. Sept. Oct. Nov. Dec. Total
1 3 3 8 16 9 13 7 7 13 7 10 97
During February a temporary modification was made to the motor clock to give a more open time scale, WIth a view to determining the velocity of transmission of surface waves from certain projected heavy explosions in connection "ith canal works at a distance of about seventeen miles from the Observatory, but no certain indications of tremors due to these explosions were discernible on the records. Wnilst the instrument was
xxnr.
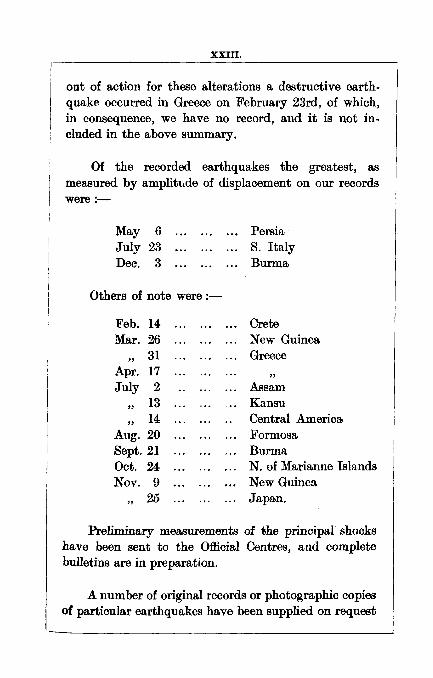
out of action for these alterations a destructive earthquake occurred in Greece on February 23rd, of which, in consequence, we have no record, and it is not included in the above summary.
Of the recorded earthquakes the greatest, as measured by amplitude of displacement on our records were :-
May 6 July 23 Dec. 3
Others of note were :--
'Feb. 14-Mar. 26
" 31
Apr. 17 July 2
" 13
" 14
Aug. 20 Sept. 21 Oct. 24 Nov. 9
" 25
...
Persia S. Italy Burma
Crete New Guinea Greece
" Assam Kansu Central America Formosa Burma N. of Marianne Islands New Guinea Japan.
Preliminary measurements of the principal' shocks have been sent to the Official Centres, and complete bulletins are in preparation.
A number of original records or photographic copies of particular earthqtlakes have been supplied on request

XXIV.
for special investigation, and the whole of our January
records were loaned to the Superintendent of Kew
Observatory for a special study of microseisms.
Our grateful thanks are tendered to the Govern
ments, Institutions, Observatories and individuals who
have kindly contributed presentations to the Library
during the year.

xxv.
MAXIMUM GUSTS FOR EACH DAY OF THE YEAR, 1930.
RECORDED BY THE DINES TUBE ANEMOGRAPH.
1930 § .0 ~ ;.::::
~ al
~. 2 .p
~ ~ ~ 1930 '"' § ~
al ~ al (;) 0 Q;)
~ ~ ~ < )i ~ 00 0 Z A --------------I-------------DAY DAY
1 54 37 31 41 29 21 28 20 26 29 21 23 1 2 69 32 43 45 20 23 27 36 17 20 40 /31 2 3 34 21 34 47 22 19 36 20 15 12 42 20 3
4 46 25 30 56 22 14 29 31 16 38 29 14 4 5 47 30 19 30 30 14 22 24 18 42 27 10 5
! 6 36 36 27 31 30 25 34 37 23 51' 17 16 6 7 46 43 27 23 39 32 35 33 31 38 43 13 7 8 36 30 27 32 38 24 33 28 27 59 48 29 8 9 42 25 29 16 32 35 30 26 13 31 45 11 9
10 68 17 32 8 22 32 31 20 14 42 48 20 10 11 48 13 22 26 23 30 27 31 29 34 42 39 II 12 55 26 30 34 26 15 27 39 29 39 35 36 12 13 47 22 26 34 32 18 19 33 28 31 41 44 13 14 44 36 26 24 31 21 21 54 35 41 38 27 14 15 21 42 38 32 28 23 22 46 31 38 44 13 15 16 23 32 36 29 31 23 26 35 12 46 24 24 16 17 35 17 22 45 41 I 17 29 15 37 46 13 12 17 18 33 33 24 45 48 20 28 32 60 40 37 29 18
i, 19 41 30 18 61 40 21 26 51 48 42 24 29 19
i 20 34 15 54 39 28 33 23 37 38 31 34 31 20
I 21 32 20 44 24 15 34 41 49 44 36 41 24 21
i 22 28 24 34 28 28 33 28 45 13 35 39 14 22
! 23 19 41 28 29 22 35 27 31 38 27 39 28 23 ;
24 45 39 20 18 29 40 24 34 45 43 50 18 24
I 25 18 25 44 20 21 31 15 24 46 45 47 16 25 26 41 23 28 24 13 19 37 20 44 24 34 40 26
I 27 39 20 19 28 23 22 33 27 40 7 16 52 27
I 28 18 19 37 41 33 43 28 14 30 34 30 53 28
29 20 51 46 26 23 30 28 27 41 34 41 29 I
I
30 17 32 27 33 40 26 - 29 46 14 36 30 I 31 50 47 32 25 21 17 36 31
\

, 1
METEOROLOGICAL REPORT. :
JANUARY, 1930. 1
! Mea.n for
Results of Oblenations ta.ken during the Month. the la.st 83 yea.rs.
Mean Reading of the Barometer ..... . . .. inches 29·194 29·481 Highest " " on the 16th ... ... " 29·787 30·122 Lowest " " on the 31st .. . ... " 28·389 28·597 Range of Barometer Readings ........... . " 1·398 1·525 Highest Reading of a Max. Therm. on the 19th .. . 54·9 51·4 Lowest Reading of a Min. Therm. on the 16th .. . 28·1 22·0 Range of Thermometer Rea.dings .................... . 26·8 29·4 Mean of Highest Daily Readings ................... .. 45·2 42·6 i
Mean of Lowest Daily Readings .................... . Mean Daily Range ...................................... . Deduced Mean Temp. (from mean of Max. and Min.) Mean Temperature from Dry Bulb ................. . Adopted Mean Temperature ......................... .. Mean Temperature of Evaporation '" '" ........... . Mean Tempera.ture of Dew Point .................... . Mean elastic force of Vapour ............... inches Mean weight of Vapour in a cub. ft. of air, grains Mean additional weight required for saturation" Mean degree of Humidity (saturation 100) ......... Mean weight of a cubic foot of air ......... grains Mean amount of Cloud (0-10) ....................... . Fall of Rain .... .. ... ... ... ...... . .. ... .... . . . .. inches Greatest Rainfall in one day (14th)... ...... " No. of days on which ·005 in. or more Rain fell ... Wind:-Direation............... N NE E SE s
35·4 9·8
40·1 40·8 40·5 39·2 37·2
0·221 2·6 0·4
86 540·4
7 5 6·060 0·658
26 sw
33·3 : 9·3
37·7 38·0 37·9 ,36·6 34·5
0·202 2·4 0·4
87 549·1
7·8 4·419 O· 824
19·7
W NW
No. of days.................. ...... 1 2 2 1 10 10 5 o ------------1---------- ------MeanVelocityinmiJespel'hl' 8·3 4·610·55·311·214·214·5 0 ------------1----------------
Total No. of miles ............... 198 221 503 127 26823400 1744 0 Mean*
Total No. of miles registered ................. ; ........ . 8875 8305·9 Greatest hourly velocity (10th, at 0230 G.M.T.,
Dir. S ................................................ . 48 41·3
* For the la8t 63 years.
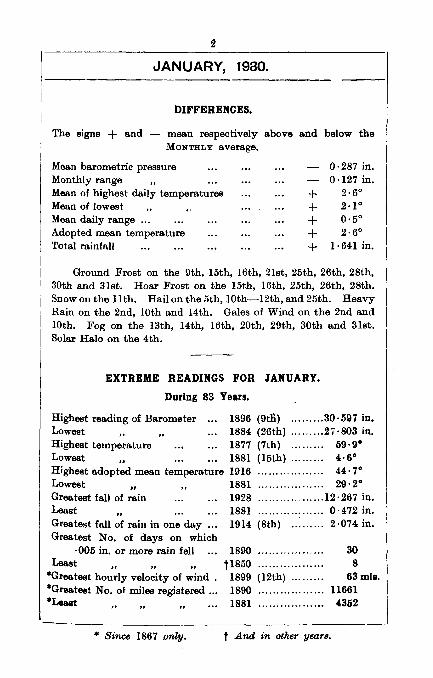
JANUARY, 1980.
DIFFERENCES.
The signs + and - mean respectively above and below the MONTHLY average.
Mean barometric pressure Monthly range Mean of highest daily temperatures Mean of lowest Mean daily range ... Adopted mean temperature Total rainfall
0·287 in. 0·127 in.
+ 2.60
+ 2.1 0
+ 0.50
+ 2.60
+ 1·641 in.
Ground Frost on the 9th, 15th, 16th, 21st, 25th, 26th, 28th, 30th and 31st. Hoar Frost on the 15th, 16th, 25th, 26th, 28th. Snow on the lIth. Hail on the 5th, lOth-12th, and 25th. Heavy Rain on the 2nd, 10th and 14th. Gales of Wind on the 2nd and 10th. Fog on the 13th, 14th, 16th, 20th, 29th, 30th and 31st. Solar Halo on the 4th.
EXTREME READINGS FOR JANUARY.
During 83 Years.
Highest reading of Barometer 1896 (9tH.) ......... 30 . 597 in. Lowest 1884 (26th) ......... 27·803 in. Highest temperature 1877 (7th) ... ... ... 59· 9° Lowest.. 1881 (15th) ......... 4· 6° Highest adopted mean temperature 1916 ...... '" ... '" ... 44·7° Lowest., 1881 .. , ............. ,. 29·2° Greatest fall of rain 1928 .................. 12·267 in. Least" 1881 ...... '" ......... 0·472 in. GreateRt fall of rain in one day 1914 (8th) ......... 2·074 in. Greatest No. of days on which
. 005 in. or more rain fell Least
" " " ·Greatest hourly velocity of wind . *Grea.test No. of miles registered ... ·Least
* Since 1867 only.
1890 .................. 30 t1850 .................. 8
1899 (12th) ... ... ... 63 mis. 1890 ................ ,. 11661 1881 ............ '" ... 4:352
t And in other year8.

FEBRUARY, 1930. Mean for
Results of Observations taken during the Month. the last 83 years. I
Mean Reading of the Barometer ......... inches 29·716 29·492 Highest " " on the 9th ... " 30·337 30 ·106 : Lowest ." " on the 1st ... " 28·474 28·647 i
Range of Barometer Readings ............ " 1· 863 I ·457 1 Highest Reading of a Max. Therm. on the 28th ... 52·0 52· 1 1
I
Lowest Reading of a Min. Therm. on the 21st ... 25·222·6 I
Range of Thermometer Readings ..................... 26· 8 29·5 I
Mean of Highest Daily Readings ..................... 40·0 43· 8 II
Mean of Lowest Daily Readings ... ... ... ... ... ... ... 31·6 33·6 Mean Daily Range ...... ... ... ... ... ... ... ... ... ... ... ... 8·4 10·2 I
Deduced Mean Temp. (from mean of Max. and Min.) 35·4 38·2 ! Mean Temperature from Dry Bulb .................. 36·2 38·5 l
Adopted Mean Temperature ........................... 35·8 38.4
1
1
Mean Temperature of Evaporation .................. 34·1 36·8 Mean Temperature of Dew Point .................. ... 31· 0 34·6 I
Mean elastic force of Vapour ............... inches O· 175 O· 196 Mean weight of Vapour in a cub. ft. of air, grains 2·0 2·4 Mean additional weight required for saturation " 0·5 0·4 Mean degree of Humidity (saturation 100) ... ... ... 79 86 Mean weight of a cubic foot of air ......... grains 555·7 548·6 Mean amount of Cloud (0':"""10) ........................ 7·0 7·5 Fall of Rain ... •.. . .. . . . ... .. . . .. ... ... .. . . .. ... inches 0 . 410 3 ·516 Greatest Rainfall in one day (l4th) ...... ..." 0·240 0·758 No. of days on which ·005 in. or more Rain fell... 6 16·7 I
W" d D" t" • v W I NW I III :- trec IOn...... .•• ... ••. N l'iE E SE S S\ -__________ --1------
No. of days .................. ~.. ... 3 15 8 1 0 0 1 0 ---------------- -- ----------------
o 4·8 0 Mean Velocity in miles per hr. 9·15·9 8·1 7·1 0 --------------1-- -- -------- ------
Total No. of miles ............... 658 2117 ] 549 171 0 o 116 0
I Mean*J
Totnl No. of miles registered .......................... . Greatest hourly velocity (15th, at 1030 G.M.T.,
Dir. N.W.) ............................................ . 1
-7386.71
24 40~J
4611
• For the last 63 years.

4
1 _______ F_E_B._R_U_A_R_Y __ ,_19_3_0_" _______ 1
I DIFFERENCES.
I The signs + and - mean respectively above and below the MONTHLY average.
Mean barometric pressure Mon thly range Mean of highest daily temperatures Mean of lowest Mean daily range ... Adopted mean temperature Total rainfall
+ 0·224 in. + 0·406 in.
3.80
2.00
1.80
2.60
3·106 in.
Ground Frost on the 6th-12th, 14th, 16th-21st, 23rd, 25th and 26tb. Hoar Frost on the 10th, 14th, 16th-18th, 20th and 21st. Snow on the 6th, 7th, 9th, 24th and 25th. Hail on the 6th. Fog on the 3rd, 14th, 20th, 25th, 26th and 28th.
EXTREME READINGS FOR FEBRUARY,
During 88 Years.
Highest readjng oj Barometer Lowest " Highest temperature Lowest .. .. ............ . Highest adopted mean temperature Lowest
" Greatest fall of rain Least ,. . ............. . Greatest fall of rain in one day .. . Grea.test No. of days on which
·005 or more rain fell ........ . Least " .. " .. .
"'Greatest hourly velocity of wind .. "'Greatest No. of miles registered ... "'Least
1902 (1st) ......... 30·476 in. 1900 (19th) ......... 27· 870 in. 1877 (8th) ......... 58.30
1902 (11th) ......... 5.00
1869 .................. 44.00
1855 1848
28'6° 8·882 in.
1858 .................. 0·306 in. 1909 (3rd) ......... 2·000 in.
1910 ................. . 1855 ................. . 1903 (27th) ........ . 1868 ................. . 1917 ................. .
27 4
60 mis. 12577
3160
'" Since 1867 only.

6
MARCH, 1930.
Results of Observa.tions ta.ken during the Month.
Mean Reading of the Barometer ... ... ... inches Highest .. .. on the 1st ... .. Lowest .. .. on the 16th ... .. Range of Barometer Readings ............ " Highest Reading of a Max. Therm. on the 31st .. . Lowest Reading of a Min. Therm. on the 20th .. . Range of Thermometer Readings ................... . Mean of Highest Daily Readings ................... .. Mean of Lowest Daily Readings .................... . Mean Daily Range ............ '" ... '" ... '" ........... . Deduced Mean Temp. (from mean of Max. and Min.) Mean Temperature from Dry Bulb ................. . Adopted Mean Temperature .......................... . Mean Temperature of Evaporation ................. . Mean Temperature of Dew Point ................... .. Mea.n elastic force of Vapour ............... inches Mean weight of Vapour in a cub. ft. of air, grains Mean additional weight required for saturation " Mean degree of Humidity (saturation 100) ......... Mean weight of a cubio foot of air ......... grains Mean amount of Cloud (0-10) ....................... . Fall of Rain ............................. , .... " inches Greatest Rainfall in one day (7th) ......... .. No. of days on which ·005 in. or more Rain fell ...
Mea.n for the la.st 83 years.
29·375 29·454 30·135 30·045 28·735 28·654
1·400 1·391 54·1 56·9 21·0 23·5 33·1 33·4 45·0 47·0 34·9 34·5 10·1 12·5 39·0 39·8 40·3 40·4 39·7 40·1 38·0 38·3 35·0 35·9
0·204 0·210 2·4 2·4 0·6 O·t)
79 85 544·5 546·1
7·9 7·5 2·855 3·319
0·490 0·756 16 16·7
W · d D' t' I W NW In :- usc lon ........ , .... ,. ~ NE E .~_s_ SW
No. of Days ... .................. 4 5 2 2 3 6 9 0 ------------1·--1---1-- ----------
Mean Velocity in miles per hr. 6·210·4 6·5 7.81
14.810.69.3 0 -------------1·--1---1-----------
Total No. of miles ............... 592 1245 312 374 106515282008 0
Total No. of miles registered ......................... ..
Mean· 7424 8287·4
Greatest hourly velocity (31st, at 1200 G.M.T., Dir, S.S.E ...................... " .......... " _ .. _,, __ ,,_ .. _ ... ___ 3_4 .-!--_3-9-' 6_
• For 1M last 63 YWH8.

6
MARCH, 1930. -----------------------------
DIPFEREBCES.
The signs + and - mean respectively above and below the MONTHLY average.
Mean barometric pressure Mon thly range Mean of highest daily temperatures Mean of loweat Mean daily range ... Adopted mean temperature Total rainfall
+
+
0·079 in. 0·009 in.
2.00
0.40
2.40
0.40
0·464 in.
Ground Frost on the 1st, 11th-14th, 17th, 18th, 19th, 20th, 22nd-24th. Hoar Frost on the 1st and 13th. Snow on the llth, 13th, 15th, 16th, 18th, 19th, 20th, and 21st. Hail on the 12th, 13th, 20th and 21st. Fog on the 3rd, 4th, 7th, 8th, 12th, 20th and 24th. Lunar Halo on the 11th.
EXTREME READIBGS FOR MARCH,
During 83 Yea".
Highest reading of Barometer ... 1854 (4th) ......... 30·452 in. Lowest "" 1876 (10th) ......... 28·100 in. Highest temperature ............... 1871 (25th) ......... 68.00
Lowest II ......... ...... 1874 (10th) ......... 11.1 0
Highest adopted mean temperature 1920 .................. 44.20
Lowest" 1883 ...... ............ 34.4 0
Greatest fall of rain ......... ...... 1912 .................. 7·205 in. Lealllt •. ............... 1852 .................. 0·352 in. Greatest fall of rain in one day... 1898 (17th) ......... 1·540 in. Greatest No. of daYI!I on which
·005 in. or more rain fell Least
-Greatest hOl;;ly velo~ity of ~ind'" -Greatest No. of milea regi'lftered ... -Least
t1861 ................. . 1852 ................. . 1905 (15th) ....... .. 1903 ................. .
28 3
57 mIs. 12773
1929 .................. 4437
-------------------_._------------_._._-
• Since 1867 only. t And 1914.

7
APRIL, 1930.
Results of Observations taken during the Month.
Mean Reading of the Barometer ........ . inches Highest " " on the 7th .. . Lowest on the 13th ... Range of Barometer Readings ............ " Highest Reading of a Max. Therm. on the 24th .. . Lowest Reading of a Min. Therm. on the 6th .. . Range of Thermometer Readings .................... . Mean of Highest Daily Readings .................... . Mean of Lowest Daily Readings .................... . Mean Daily Range ...................................... . Deduced Mean Temp. (from mean of Max. and Min.) Mean Temperature from Dry Bulb ................ .. Adopted Mean Temperature .......................... . Mean Temperature of Evaporation ................ .. Mean Temperature of Dew Point ................... .. Mean elastic force of Vapour ............... inches Mean weight of Vapour in a cub. ft. of air, grains Mean additional weight required for saturation" Mean degree of Humidity (saturation 100) ......... Mean weight of a cubic foot of air ......... grains Mean amount of Cloud (0-10) ....................... . Fall of Rain ............ . .. ... ... ... ... ... . . . .. . inches Greatest Rainfall in one day (9th) ......... .. No. of days on which ·005 in. or more Rain fell...
Mean for the last
8.'3 years.
29·396 29·482 29·812 29·954 28·958 28· 802 0·854 1·152
60·1 64·3 32·3 28·2 27·8 36·1 51·3 54·1 40·6 37·9 10·7 16·2 44·5 43·9 45·7 44·7 45·1 44·3 42·6 41·6 39·1 38·2
0·239 0·234 2·8 2·7 0·8 0·7
76 80 538·8 542·0
7·7 6·8 2·169 2·555 0·350 0·597
18 14·9
Wind :-Direction ............... 1 N NE lESE S SW W NW 1--_________ ------
No. of days... ... ... ...... ... ... ... 6 6 5 5 6 o -----------------------------
Mean Velocity in miIeR per hr. 9·5 10'8!12'7 4·9 21·06·4 9·2 0 --------------1------------ ----
Total No. of miles ............... 1373 15541521 117 503 765 1325 0
Mean·
Total No. of miles registered .......................... . 7158 7"440-0 Greatest hourly velocity (1st, at 1200 G.M. T., Dir.
S. by E.; 4th, at 1100 G.M.T., Dir. E.) ...... 30 35·9
* For the last 63 years.

8
APRIL, 1930.
DIFFERENCES.
The signs + and - mean rek'pectively above and below the MONTHLY average.
Mean barometric pressure Monthly range Mean of highest daily temperatures Mean of lowest Mean daily range ... Adopted mean temperature Total rainfall
0·086 in. 0·298 in.
2.80
+ 2.70
5.50
+ 0.80
0·386 in.
Ground Frost on the 6th, 22nd and 23rd. Hoar Frost on the 6th. Snow on the 4th. Thunder on the 2nd, 14th and 25th. Lightning on the 2nd and 25th.
EXTREME READINGS FOR APRIL,
During 83 Years.
Highest reading of Barometer ... Lowest Highest temperature ... '" ........ . Lowest II .............. .
Highest adopted mean temperature Lowest
" Greatest fall of rain Least Greatest fall of rain in one day.:. Greatest No. of days on which
·005 in. or more rain fell ...... Least
" " II ••••••
*Greatest hourly velocity of wind .. *Greatest No. of miles registered ... *Least
1906 (8th) ........ ~30·317 in. 1919 (14th) ......... 28·250 in. 1852 (14th) ......... 74.1 0
1917 (2nd) ... ... ... 13.60
1865 .................. 48'5° 1917 1867
39·8° 5·672 in.
1852 .................. 0·478 in. 1923 (12th) ......... 1· 260 in.
1920 1852 ................. . 1911 (19th) ........ . 1904 ................. . 1884
27 4
53mls. 11016
5047
• Since 1867 only.

9
I MAY, 1930.
--"---__ ~~I Mea.nfor
Results of Observa.tions taken durin, the Month.
Mean Reading of the Barometer ........ . inches Highest .. " on the 23rd '" Lowest " " on the 11th ... Range of Barometer Readings ............ " Highest Reading of a Max. Therm. on the 26th .. . Lowest Reading of a Min. Therm. on the 10th .. . Range of Thermometer Readings .................... . Mean of Highest Daily Readings .................... . Mean of Lowest Daily Readings ................. , .. , Mean Daily Range ..................... '" '" ........... , Deduced Mean Temp. (from mean of Max. and Min.) Mean Temperature from Dry Bulb ................. . Adopted Mean Temperature ......................... .. Mean Temperature of Evaporation ................. . Mean Temperature of Dew Point .................... . Mean elastic force of Vapour ............... inches Mean weight ot Vapour in a cub. ft. of air, grains Mean additional weight required for saturation .. Mean degree of Humidity (saturation 100) ......... Mean weight of a cubic foot of air ......... grains Mean amount. of Cloud (0-10) ....................... . Fall of Rain ............ '" '" ..... , .. , ... ... ... inches Greatest Rainfall in one day (8th) ......... " No. of days on which ·005 in. or more Rain fell ...
29·529 29· 823 28·928 0·895 66·8 31·8 35·0 57·3 43·0 14·3 48·5 50·5 49·5 46·8 42·9
0·277 3·2 1·0
74 535·9
7·3 2·981 1·056
15
the lut 83 yea.rs.
29·538 29·983 28·943
1·040 71·7 32·0 39·7 59·3 42·6 16·7 49·2 50·1 49·7 46·5 43·0
0·280 3·2 0·8
77 536·9
7·0 2·456 0·650
14·7
I Wind:-Direction............... N NE E SE s sw w NW
I
I-N-O-.-O-f _d_ay_s_,,_ .. _ .. _,,_ .. _,,_,,_ .. _ .. _,,_ .. _ .. ,~~I=I-l-1- -_-1==1= =2= -1- _-1~3 __ 1_-
Mean Velocity in miles pel' hr. 12·3 7·3 7·5 2'8 9·2 8·7 9·7 7·5 -------------1---1--------------II I Tota1 No. of miles ............... 296 1920 181 66 442 209 3013 181 I ----"
Total No of mHos registered ..................... ...... 6308 Greatest hourly velocity (17th, at 2130 G.M.T.,
Dir. S.S.W.) ...... ". "............................... 26
• For the last 63 yea,. •.
Mean· 6868·4
32·2

10
MAY, 1930.
DIFFERENCES.
The signs + and - mean respectively above and below the MONTHLY average.
Mean barometric pressure Monthly range Mean of highest daily temperatures Mean of lowest Mean daily range '" Adopted mean temperature Total rainfall
0·009 in. 0·145 in.
2.00
+ 0.40
2.40
0.20
+ 0·525 in.
Ground Frost on the 8th and 10th. Hail on the 26th. Heavy Rain on the 8th. Fog on the 10th, 13th and 15th. Thunder on the 5th and 26th.
EXTREME READINGS FOR MAY,
During 83 Years.
Highest reading of Barometer ... 1881 (10th) ......... 30·332 in. Lowest 1887 (28th) ......... 28·559 in. Highest temperature ............... 1864 (19th) ......... 82.50
Lowest ...... ......... 1855 (4th) ......... 23.50
Highest adopted mean temperature 1848 ......... ......... 55.1 0
Lowest 1855 .................. 45.00
Greatest fall of rain Least Greatest fall of rain in one day ... Greatest No. of days on which
. 005 in. or more rain fell Least
·Greatest hourly velocity or wind ... *Greatest No. of miles registered ... *Least
* Since 1867 on1ly.
1924 1859 .................. . 1881 (5th)
t1860 ................. . t 1848 ................ .. 1888 (2nd) ........ . 1888 ................. .
, 1918 ................. ..
6· 765 in. 0·249 in. 1·647 in.
22 4
49 mls. 964-8 5113
t And in other years.

11
JUNE, 1930.
Results of Observations taken during the Month.
Mean Reading of the Barometer ........ . inches Highest " " on the 15th .. . Lowest " " on the 24th '" Range of Barometer Readings ............ " Highest Reading of a Max. Therm. on the 30th Lowest Reading of a Min. Therm. on the 12th ... Range of Thermometer Readings .................... . Mean of Highest Daily Readings .................... . Mean of Lowest Daily Readings .................... . Mean Daily Range ........................... '" ...... '" Deduced Mean Temp. (from mean of Max. and Min.) Mean Temperature from Dry Bulb ............ '" .. . Adopted Mean Temperature .......................... . Mean Temperature of Evaporation ................ .. Mean Temperature of Dew Point .................... . Mean elastic force of Vapour ............... inches Mean weight of Vapour in a cub. ft. of air, grains Mean additional weight required for saturation " Mean degree of Humidity (saturation 100) ., ...... . Mean weight of a cubic foot of air ......... grains Mean amount of Cloud (0-1O) ...................... .. Fall of Rain .... .. ... .. . ... .. . . .. ... . . . ... ... .. . inches Greatest Rainfall in one day (18th}......... .. No. of days on which ·005 in. or more Rain fell ...
Mean for the last 83 years.
29·560 29·560 29·941 29·937 29·205 29·046 0·736 O· 891
77·3 76·5 42·0 39·2 35·3 37·3 65·8 64·9 50·1 48·1 15·7 16·8 56·2 54·7 57·7 55·3 57·0 55·0 53·4 51·7 49·5 48·2
0·354 0·345 4·0 3·8 1·4 1-0
74 78 528·5 531·4
6·0 7·2 3·148 3·289 0·708 0·795
14 15· ]
Wind:-Direction ............... ~ NE ~ ~~i_s_ sw ~ ~
No. of days........................ 2 8 2 1 1 7 9 o --------------1-- --------------Mean Velocity in miles per hr. 7·0 4· 8 7·7 11· 8' 9· 2 9·0 7·5 0 _·_------------1-- ____ --1---- ___ _
Total No. of miles ............. .. 336 925 369 2821220 15161610 0
Total No. of miles registered ......................... .. Greatest hourly velocity (30th, at 1300 G.M.T.,
Dir., S.S.E.) ......................................... .
* For the la8t 63 year8.
Mean· 5258 6189·3
25 29·2

12
JUNE, 1930.
DIFFERENCES.
The signs + and mean respective1y above and below the MONTHLY average.
Mean barometric pressure Monthly range Mean of higheet daily temperatures Mean of lowegt Mean daily range ... Adopted mean temperature Total rainfall
0·000 in. 0·155 in.
+ 0.90
+ 2.00
1.10
+ 2.00
0·141 in.
Hail on the 24th. Heavy Rain on the 9th and 18th. Thunder on the 18th and 23rd. Lightning on the 18th, 23rd and 30th. Solar Halo on the 15th.
EXTREME READINGS FOR JUNE,
During 83 Years.
Highest reading of Barometer ... Lowest Highest temperature .............. . Lowest ............. .. Highest adopted mean temperature Lowest " Greatest fall of rain .............. . Least " .............. . Greatest fall of rain in one dav ... Greatest No. of days on ~hich
. 005 in. or more rain fell
Least " " " *Greatest hourly velocity of wind .. . *Greatest No. of miles registered .. . *Least
* Since 1867 only.
1874 (15th) ......... 30·219 in. 1862 (12th) ......... 28·632 in. 1893 (18th) ... ...... 88· 7" 1902 (9th) ......... 32·0° 1896 ... ............... 59·3° 1907 .................. 51·5° 1907 .................. 8· 705 in. 1925 .................. 0·282 in. 1857 (8th) ......... 2·093 in.
t 1907 ................ .. 1887 ................. . 1897 (16th) ........ . 1877 ................. . 1915 ................. .
t And 1912.
27 4
45mls. 8384 3967

13
I JULY, 1930.
1--- Results of Observations taken during the Month,
I Mean Reading of the Barometer ........ , inches Highest on the 9th .. . Lowest on the 18th .. . Range of Barometer Readings ........... . Highest Reading of a Max. Therm, on the 1st .. . Lowest Reading of a Min. Therm. on the 11th .. . Range of Thermometer Readings .................... . Mean of Highest Daily Readings .................... . Mean of Lowest Daily Readings ................... .. Mean Daily Range ................................ , '" .. . Deduced Mean Temp. (from mean of Max. and Min.) Mean Temperature from Dry Bulb ........... , ..... . Adopted Mean Temperature ......................... .. Mean Temperature of Evaporation ............ '" ." Mean Temperature of Dew Point .................... . Mean elastic force of Vapour ............... inches Mean weight of Vapour in a cub. ft. of air, grains Mean additional weight required for saturation " Mean degree of Humidity (saturation 100) ......... Mean weight of a cubic foot of air ......... grains Mean amount of Cloud (0-10) ....... " .... " ........ . Fall of Rain ............ '" ......... '" .. , ... ... inches Greatest Rainfall in one day (22nd) ...... " No, of days on which ·005 in. or more Rain fell..,
29·394 29· 8'47 28·816
1·031 72·1 46·6 25·5 63·1 52·8 10·3 56·1 57·6 56·9 54·1 50:9
0·373 4·2 1·2 78
525·3 7·9
5·989 1·126
21
Mean for I the last 83 years, ,
' 29'5251
29·904 I 29.001 i
0·903 78·2 • 42·9 35·3 67·2 i
51·3 15·9 57·6 58·0 57·9 54·8 52·0
0·388 4·4 r'l
81 527·5
7·4 4·051 0·887
16·6
I Willd :-Direction............... N NE E' SE S ,I sw W NW
I ---- l-
I No. of days ................... ,' .,' 5 0 0 0 4: I 7 12 3
i Meanvelo~itYinmileSperhr, 7·8 _0_ 0 1 0 9.512.~ 6·810·9
I Total No. of Miles .•••.•.•.•.•••. 931 1 0 0 I 0 008 13111964 788
Total No. of miles registered ......................... .. Greatest hourly veloclty (21st, at 1930 G.M.T.,
Mean· 5902 6306·5
21 28·1 i ____ D_IT_._N __ ._by __ W __ ,_i_2_6t_h_,_a_t_1_2_3_0_G_._M_,T __ .,_D_IT_._S_._) ______ ~ __ ----
* For the la8t 63 years.

14
JULY, 1930.
DIFFERENCES.
The signs + and mean respectively above and below the MONTHLY average.
Mean barometric pressure Monthly range Mean of highest daily temperatures Mean of lowest Mean daily range ... Adopted mean temperature Total rainfall
0·131 in. + 0·128 in.
4.1 0
+ 1.50
5.60
.1.00
+ 1·938 in.
Heavy Rain on the 16th, 17th, 20th, 22nd and 28th. Thunder on the 3rd, 4th and 14th. Lightning on the 3rd.
EXTREMB READINGS FOR JULY,
During 83 Years.
Highest reading ot Barometer ... 1911 (10th) ......... 30·203 in Lowest " " 1922 (6th) ......... 28·493 in. Highest temperature .............. . 1901 (20th) ......... 89·0° Lowest I' .....•..•.....• 1857 (1st) 36·0° Highestadopted mean temperature 1901 .................. 63·2° LoweElt " 1922 .................. 54·0° Greatest fall of rain .............. . 1888 .................. 8·475 in. Least " .............. . 1868 .................. O· 669 in. Greatest fall of rain in one day .. . 1888 (2nd) ... ...... 2·482 ill. Greatest No. of days on which
·005 in. or more rain fell t1920 ................. . 28 Least ), II II t1863 ................. .
-Greatest hourly velocity of wind •. 1892 (8th) ....•..•. -Greatest No. of miles registered ... 1879 .............••... -Least 1913 ................. .
8 44:mls.
8288 4577
* Since 1867 only. t And in o,her year8.

15
AUGUST, 1930.
Results ot Observa.tions taken durinc the Month.
Mean Reading of the Barometer ...... '" inches Highest " " on the 31st .. . Lowest " " on the 21st .. . Range of Barometer Readings ............ " Highest Reading of a Max. Therm. on the 27th ... Lowest Reading of a Min. Therm. on the 1 ~t & 6th Range of Thermometer Readings .................... . Mean of Highest Daily Readings .................... . Mean of Lowest Ddily Readings .................... . Mean Daily Range ...................................... . Deduced Mean Temp. (from mean of Max. and Min.) Mean Temperature from Dry Bulb ................. . Adopted Mean Temperature .......................... . Mean Temperature of Evaporation ................. . Mean Temperature of Dew Point ................... .. Mean elastic force of Vapour ............... inches Mean weight of Vapour in a cub. ft. of air, grains Mean additional weight required for saturation .. Mean degree of Humidity (saturation 100) ........ . Mean weight of a cubic foot of air ......... grains Mean amount of Cloud (O-1O) ...................... .. Fall of Rain .... .. ... ... ... .. .... ... .. .. .. .. .. .. inches Greatest Rainfall in one day (6th) '" ... ... .. No. of days on which ·005 in. or more Rain fell. ..
Mean for the la.st 83 years.
29·411 29·490 29·'901 29·892 28·856 28·944
1·045 0·948 86·0 76·0 45·0 42·0 41·0 34·0 64·6 66·2 52·6 50·9 12·0 15·3 56·9 56·9 . 58·5 57·7 57·7 57·3 55·5 54·5 52·8 51·8
0·400 0·387 4·5 4·3 1·1 0·9
82 82 524·7 527·3
7·5 7·3 7·428 5·187 1·055 1·084
26 18·8
Wind ;-Direction ............... N NE E SE S SW W NW
.No. of days... ...... ...... .......... 0 1 2 3 4 4 17 0 ------------·1---,-·1---, ------------
. Mean Velocity in miles perhr, 0 5·0 6·9 7,4 6·8 9·0 10·3 0 -------------·1----------------
Total No, of .miles................ 0 119 332 532 651 862 4220 0
Mean· . Total No. of miles registered .......................... . 6716 .' 63:23-6
i Greatest hourly velocity (14th, at 1200 G.M.T., I_D_ir_.,_yv_. b_y_N_. _; _2_1s_t_, a_t_2_4_0_0_G_.M_.T_._, _D_ir_._W_.S_.W~. ___ 2_8 __ 3_0_'~
... For the last 63 years.

16
AUGUST, 1930.
DIFFERENCES.
The signs + and mean respectively above and below the MONTHLY average.
Mean barometric pressure 0·079 in. Monthly range + 0·097 in. Mean of highest daily temperatures 1.60
Mean of lowest + 1.70
Mean daily range '" 3.30
Adopted mean temperature + 0.40
Total rainfall + 2·241 in.
Heavy Rain on the 2nd, 6th, 13th, 21st and 29th. Fog on the 27th-30th. Thunder on the 25th and 27th. Lightning on the 5th, 18th, 19th, 27th and 28tll.
EXTREME READINGS FOR AUGUST,
During 83 Years.
Highest .mding of Barometer ... Lowest Highest temperature .............. . Lowest .............. . Highest adopted mean temperature Lowest ,. Greatest faU of rain Least " .............. . Greatest fall of rain in orie da.y .. . Greatest No. of days on which
. 005 in. or more raln fell Least " II ,,~ ..
*Greatest hourly velocity of wind ... *Greatest No. of miles registered ... *Least
1874 (21st) ......... 30 ·114 in. 1917 (28th) ......... 28 ·156 in. 1868 (2nd) ......... 88.0° 1887 (13th) ......... 33 '4° 1911 .................. 62·1° 1848 1891
52'5° 9·869 in.
1871 .................. 2·085 in. 1929 (23rd) ......... 2·350 in.
,1891 ................ : .. 1880 ................ .. 1903 (31st) ....... .. 1903 ................ .. 1915 ................. .
27 6
45m!s. 8486 3918
... Since 1867 OnlYL

17 -~.----------------------
--~-~I SEPTEMBER, 1980.
--~~~-----.-----~----------------~
Mean for R •• uha of Observa.tions ta.ken during the Month.
Mean Reading of the Ba.rometer ....... ,. inches Highest " " on the 2nd .. . LowAst " " on the 20th .. . Range of Barometer Readings ............ " Highest Reading of a Max. Therm. on the 3rd ... I.ow<3st Reading of a Min. Therm. on the 2nd .. Range of Thermometer Readings .................... . Mean of Highest Daily Readings .................... . Mean of Lowest Daily Readings ................... .. Mean Daily Range ................................. '" .. . Deduced Mean Temp. (from mean of Max.' and Min.) Mean Temperature from Dry Bulb ................ .. Adopted Mean Temperature ......................... .. Mean Temperature of Evaporation ................. . Mean Temperature of Dew Point ................... .. Mean elastic force of Vapour ............... inches Mean weight of Vapour in a cub. ft. of air, grains Mean additional weight required for saturation " Mean degree of Humidity (saturation 100) ......... Mean weight of a cubic foot of air ......... grains Mean amonnt of Cloud (0-10) ....................... . Fsll of Rain ....................... , ... ... ... ... inches Greatest Rainfall in one day (6th) ......... " No. of days on which ·005 in. or more Rain fell ...
29·488 29·954 28·420
1·534 69·3 42·4 26·9 60·7 50·0 10·7 54·1 55·3 54·7 52·4 '49·6
0·355 3·8 1·0
81 529·6
7·4 3·530 0·562
17
the last 83 years.
29·543 30·004 28· 888 1·116
I 71·7 36·8 34·9 61·7 47·4 14·3 53·3 54·3 53·8 51·0 48·3
0·339 3·9 0·8
82 532·5
6·7 4·330 0·966
16·5
Wind :-Direction .... ; ......... ~~~~~_s_~~I_~ NW
No. of da.ys... ............ ......... 3 7 4 1 1 4 8 2 \------------,---- ------ ------
Mean Velocity in miles per hr. 10·15·6 5·313·316·07·7 11·37·3 I-------·--·----I--------------~--~--I
Total No. of miles ............... 727 951 507 319 384 738 2174 348
---~-~--~------ ---------------------1
Total No. of miles registered .......................... . Greatest hourly velocity (18th, at 0530 G.M.T.,
Du-., W.S.W.) ......................................... .
Mean· 6148 6()34-2
37 31·6

1S
SEPTEMBER, 1930.
DIFFERENCES.
The signs + and - mean respectively above and below the MONTHLY average.
Mean barometric pressure Monthly r~nge Mean of highest daily temperatures Mean of lowest Mean daily range ... Adopted mean temperature Total rainfall
0·055 in. + 0·418 in.
1.00
+ 2.60
3.60
+ 0.90
O· 800 in.
Heavy Rain on the 6th. Fog on the 2nd, 16th and 22nd. Thunder on the 10th, 19th and 24th. Lightning on the 11th, 19th and 24th.
EXTREME READINGS FOR SEPTEMBER,
During 83 Years.
Highest reading of Barometer ... 1851 (15th) ......... 30·247 in. Lowest 1918 (23rd) ......... 28·210 in. Highest temperature ............... 1868 (6th) ., .... '" 85.00
Lowest ............... f1885 (25th) ......... 29.80
Highest adopted mean temperature 1865 ......... ... ... ... 59.1 0
Lowest e " 1863 .................. 50.90
Greatest fall of rain ... ...... ... ... 1918 .................. 12·620 in. Least " ...... ... ... ... 1910 .................. 0·652 in. GreateRt fall of rain in one day... 1889 (26th) ......... 2 ·060 in. Greatest No. of days on which
. 005 in. or more rain fell 1918 .................. 29
Least " " " f1851 .................. 6 -Greatest hourly velocity of wind .. 1875 (26th) ... ... ... 53 mIa. -Greatest No. of miJes registered ... 1869 .................. 9053 -Least 1888 .................. 3261
- Since 1867 0""1/. f And in other 1/ear8.

I OCTOBER, ,1930;
Meanfor I Re5lults of Observations take.n daring the Month.
Mean Reading of the Barometer ..... . ... inches Highest " " on the 2nd ... " Lowest " ., on thE' 8th... " Range of Barometer Readinge- ..... , . . . . . . •• Highest Reading of a Max. Therm. on the 15th .. Lowest Reading of a Min. Thertn. on the 27th .. . Range of Thermometer Readings .................... . Mean of Highest Daily Readings ................... .. Mean of Lowest Daily Readings .................... . Mean Daily Range ..................................... .. Deduced Mean Temp. (from mean of Max. and Min.) Mean Temperature from Dry Bulb ........ , ........ . Adopted Mean Temperature .......................... . Mean Temperature of Evaporotion ................ .. Mean Temperature of Dew Point .................... . Mean elastic force of Vapour ............... inohes Mean weight of Vapour in a cub. ft. of air. grains Mean additional weight required for saturation If
Mean degree of Humidity (saturation 100) ........ . Mean weight of a cubic foot of air ......... grains Mean amount of Cloud (0-10) ....................... . Fall of Rain .............. . ... ... ... ... .. . .. . ... inches Greatest Rainfall in one day (29th)......... " No. of days on which ·005 in. 01" more Rain fell ...
29·320 30 ·042 . 28·591
1·451 63·i 33·6 29·5 54·9 44·7 10;2 48·8 49·9 49·4
.47·2 44·3
0·292 3·4 0·7
81 532·7
7·3 8·003 1·628
23
the last 83 yearR.
29·44,1'> 30·021 28·684 1·337 64·0 29·9 34·1 54·4 42·2 12·2 47·3 48·0 47·8 45·5 43·1
0·279 3·2 '0·6
84 537·3
7·? 4·953 0·977
18·9
Wind :·-Direction ............... N NE E SE S, I sww NW -'1:-No. of days... ...... ...... ......... 1 0 2 0, 8 7 11 2
Mean Velocity in miles per hr. 7·3 0 7·8 0 15.7!1O.411.413.5
Total No. of mil ................. 127 0 375 0 3010[:: 3016 6'8
Mean· Total No. of miles registered, ....................... .. 8930 ~ Greatesthou-'ly velocity (17th, at 2000 G.M.T.,
Dir., S.) ............................................... . 35 36·8
• For the last 63 yearll.
20
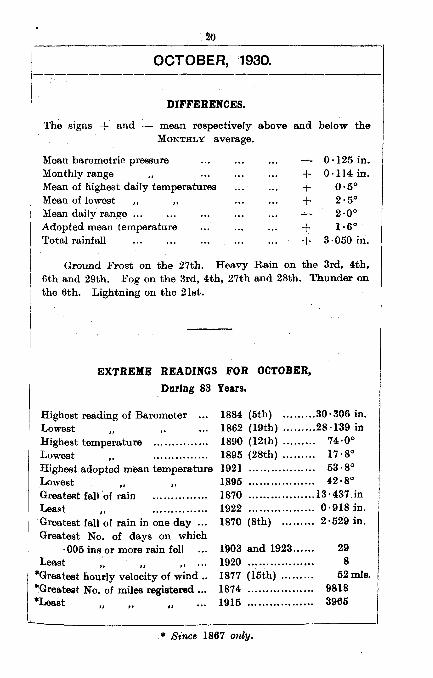
OCTOBER, 1930.
DIFFERENCES.
The signs + a.nd - mea.n respectively above and below the MONTHLY average.
Mean bar0metric pressure Monthly range Mean of nighest daily temperatures Mean of lowest Mean daily range ... Adopted mean temperature Total rainfall
0·125 in. + 0·114 in. + 0.50
+ 2.50
2.0 0
+ 1.60
+ 3·050 in.
Ground Frost on the 27th. Heavy Rain on the 3rd, 4th, 6th and 29th. Fog on the 3rd, 4th, 27th and 28th. Thunder on the 6th. Lightning on the 21st.
EXTREME READINGS FOR OCTOBER,
During 83 Years.
Highest reading of Barometer ... Lowest Highest temperature ............. .. Lowest .. .. ........... .. Highest adopted mean temperature Lowest .. GreateRt fall 'of rain .............. . Least " .............. . Greatest fall of rain in one day ... Greatest No. of days on which
·005 ins or more rain fell Least .. " ..
*Greatest hourly velocity ot wind .. *Greatest No. of miles registered ... *Least
1884 (5th) ......... 30·306 in. 1862 (19th) ......... 28·139 in 1890 (12th) ... ...... 74.00
1895 (28th) ......... 17·8° 1921 .................. 53·8° 1895 .................. 42.80
1870 .................. 13·437in 1922 .................. 0·918 in. 1870 (8th) ......... 2·529 in.
1903 and 1923 .... .. 1920 ................. . 1877 (15th) ........ . 1874· ................. . 1915 ................. .
29 8
52mIs. 9818 3965
* Since 1867 only.

NOVEMBER, 1930.
Results of Observations ta.ken during the Month.
Mean Reading of the Barometer ......... inches Highest on the 12th ... Lowest on the 2nd .. . Range of Barometer Readings ........... . Highest Reading of a Max. Thenn. on the 8th .. . Lowest Reading of a Min. Therm. on the 17th .. . Range of Thermometer Readings .................... . Mean of Highest Daily Readings .................... . Mean of Lowest Daily Readings .................. '" Mean Daily Range ............ '" ................. , .. , .. . Deduced Mean Temp. (from mean of Max. and Min.) Mean Temperature from Dry Bulb .................. . Adopted Mean Temperature .......................... . Mean Temperature of Evaporation ................. . Mean Temperature of Dew Point .................... . Mean elastic force of Vapour ............... inches Mean weight of Vapour in a cub. ft. of air, grains Mean additional weight required for saturation" Mean degree of Humidity (saturation 100) ........ . Mean weight of a cubic foot of air ......... grains Mean amount of Cloud (0-10) ........................ Fall of Rain .................................... inches Greatest Rainfall in one day (18th) .........
" No. of days on which ·005 in. or more Rain fell ...
I Mean for I the la.st
83 yeaTs. I
29·365 29·458 30·211 30·067 28·363 28·569
1· 848 .1·498 55·5 55·8 23·4 25·5 32·1 30·3 47·8 47·1 37·1 36·8 10·7 10·3 42·1 41·6 42·7 42·0 42·4 41·8 40·5. 39·8 37·9 38·1
0·228 0·231 2·6 2·8 0·5 6·4
81 87 541·5 544·4
6·8 7·4 6·021 4·477 1·200 1·008
20 B·2
- Wincf:-DlreCtlOn ............... N NE E SE S SW'~~I -_._------No. of days... ...... ............... 7 3 1 0 2 _7 __ ~_3_1
Mean Velocity in miles per hr. 6'2 8·4 24·9 0 12·4 11·3 14'7 8·9 ---~ --. --
Total No. of miles ............... 10491602 597 0 596 1893 2465 643
M~·
Total No. of miles registered ........................... 7845 7121·4 Greatest hourly velocity (24th, at 1200 G.M.T.,
Dir., E.S.E.) ......................................... " 40 40·9
... For the laat 63 year8.

22
NOVEMBER, 1980.
DIFFERENCES.
The signs + and - mean respectively above snd below the MONTHLY Rverage.
Mean barometric pressure Monthly range Mean of highest daily temperatures Mean of lowest Mean daily range ... Adopted mean temperature Total rainfall
0·093 in. + 0·350 in.
+ + + + +
0.60
1·624 in.
Ground Frost on the 4th-7th, 12th, 16th-18th, and 28th. Hoar Frost on the 5th and 6th. Heavy Rain on the 1st, 7th, 18th, 21st and 22nd. Gale of Wind on the 24th. Fog on the 1st and 28th. Solar Halo on the 17th.
EXTREME READINGS FOR NOVEMBER,
During 83 Years.
Highest reading of Barometer ... 1922 (15th) ......... 30·375 in. Lowest 1891 (11th) ......... 27·938 in Highest temperature ............... 1900 (1st) 62·4° Lowest " .............. 1901 (15th) ......... 17'5° Highest adopted mean temperature t1881 ... ............... 47 ·0° Lowest " " 1915 ............ ...... 36·3° Greatest fall of rain .................. 1866 .................. 9·026 in. Least ......... ...... 1855 .................. 1·158 in. Greatestfall of rain in one day... 1866 (16th) ......... 3·700 in. Greatest No. of days on which
·005 in. or more rain fell 1913 ................ .. 28 Least I' I' I' .' .• 1848 .................. 6
*Greatest hourly velocity of wind .. . 1887 (lst) 62 mIs. *Greatest No. of miles registered .. .. 1888 .................. 12813 ~Lea.st .. 1915 .................. 4893
* Since 1867 only. t And in other years.

23
DECEMBER, 1930.
Results of Observations taken during the Month
Mean Reading of the Barometer ........ , . inc'h~ Highest " " on the 21st .. , " Lowest " " on the 30th .. , " Range of Barometer Readings ............ " Highest Reading of a Max., Therm. on the 27th .. . Lowest Reading of a Min. Therm. on the 10th ..... . Range of Thermometer Readings ................... .. Mean of Highest Daily Readings .................... . Mean of Lowest Daily Readings ........ ~ .......... .. Mean Daily Range ...................................... . Deduced Mean Temp. (from mean of Ma.x. and Min.) Mean Temperature from Dry Bulb ................. . Adopted Mean Temperature ........................... . Mean Temperature of Evaporation ................. . Mean Temperature of Dew Point ............. ; ..... .. Mean elastic force of Vapour ............... inches Mean weight of Vapour in a cub. ft. of air, grains Mean additional weight required for ~aturation " Mea.n degree of Humidity (saturation 100) ......... Mean weight of a cubic foot of air ......... grains, Mean amount of Cloud (0-10) ....................... . Fall of Rain ................. . .. ............... ' inches Greatest Rainfall in one day (28th) ......... .. "NQ. of days on which ·005 in. or more Rain fell. ..
Wind :-Direction ............... N NE E SE
No. of days........................ 1 9 1 1
Mean for the last
83 years.
29·393 29·431 30'·125 30·068 28·529 28·536 1·596 1·532 49·8 52·7 26·3 21·7 23·5 31·0 42·9 43·4 34·9 33·9 8·0 9·5
38·9 38·6 39~7 39·2 39·3 39·0 38·3 37·4 36·5 35·4
u·216 0·209 2·5 2·4 0·4 O~4
87 87 545·3 546·9
8-0 7·7 3·577 4·691
0·470 I O' 837 20 20·2
s sw W NW
1 6 12 0 ----------------1--11--11--11---------
Mean Velocity in miles per lir. 8·7 3·2 7·3 10· 5 4·5 14·7 5·6 0
Tota.l No. of miles ............... 209 694 176 252 107 21121624 0
Total No. of miles registered .......................... . Greatest hourly velocity (~7th, at 0800 G.M.T.,
Dir. S. by E.} ......................................... .
* 11'01" the last 63 year8.
*Mean 5174 7814·3
40 41·9
I

24
DECEMBER, ~1930.
DIFFERENCES.
The signs + and - mean respectively .above, and below the MONTHLY average.
Mean barometric pressure Monthly range Mean .of highest daily temperature Mean of lowest " Mean daily range ... Adopted mean temperature Total rainfall
0'·038 in. + 0·064 in.,
0'5° + 1·0°
1'5° + . 0'3°'
1·1l4in.
Ground Frost on the 1st, 6th, 8th-11th, 15th and 18th. Hoar Frost on the 5th, 8th, 9th and 10th. Hail on the 14th. Gales of Wind on the 27th and 28th. Aurora Borealis on the 20th.
EXTREME READINGS FOR DECEMBER.
DUring 83 Years.
Highest reading of Barometer ... 1905 (12th) ......... 30·484 in. Lowest 1886 (8th)· ......... 27 ·350 in. Highest temperature ............... 1876 (9th) ......... 58.1 0
Lowest ...... ......... 1860 (24th) ......... 6· 70
Highest adopted mean temperature 1857 .................. 44.6° Lowest : 1878 .................. 30·3" Greatest fall of rain................ 1918 .................. 10·597 in. Least ............... 1890 .................. 0·550' in. Greatest fall of rain in one day... 1870 (19th) ......... 1· 962 in.' Greatest No. of days on which
, . 005 in. or more rain fell
Least " " *Greatost hourly velocity of wind .. . *Greatest No. of miles registered .. . *Least
* Since 1867 only.
1918 .......... : ...... . t 1853 ................. .
1894 (22nd} ........ . 1929 ................. .
30 8
72mls. 11493
1916 ............ ...... 4517
t And in other years.

25
Sumntar\? of ~b5er"ations, 1930.
Results of Observation. takeu during the Year.
Reading8 oj Barometer in inche8.
Mean of the Year ......................................... . Highest Monthly Mean (February) ................. . Lowest " " (October) .... , .......... '" Highest Reading (February 9th) .................... . Lowest " (November 2nd) ..... , ........... . Range ....................................................... .
Thermometer, Fahrenheit.
Highest Monthly Mean Temperature (August) .. . Lowest" " " (February) .. . Highest Reading of a Max. Therm. (August 27th) Lowest " Min. " (March 20th) .. Range of Thermometer Readings .................... . Mean of Highest Daily " .................... , Mean of Lowest Daily " .................... , Mean Daily Range ......................... '" ............ , Deduced Mean Temp. (from Mean of Max. and Min.) Mean Temperature from Dry Bulb .................... , Adopted Mean Temperature of the Year ........... . Mean Temperature of Evaporation ................. . Mean Temperature of Dew Point .................... .
Mean elastic force of Vapour ............... '" inches Mean weight of Vapour in a cub. ft. of air ... gnls. Mean additional weight required for saturation " Mean degree of Humidity (saturation 100) ........ . Mean weight of a cubic foot of air ............ grns. Mean amount of Cloud (0-1O) ....................... . Total faU of Rain .............................. inches Greatest Monthly Rainfall (October) .............. . Least " " (February) ............. .. Greatest Rainfall in one day (October 29th) .... .. No. of days per Month on which ·005 inch or more
Rain fell ...... · ........................................ .
29·428 29·716 29·320 30·337 28·363 1·974
57·7 35·8
.86·0 21·0 65·0 53·4 42·3 ll·1 46·7 47·9 47-3 45-2 42-2
0·278 3-2 0-8
80 536·9
7-4 52·171
8-003 0·410 1-628
18·5
Mean for the la.st
83 Years.
I 29·492 I 29·774 29·224 30·294 28·219 2·075
58·6 35·7 81·2 16·6 64·6 !
54.3 1
4Fl 13·2 46·7 47·2 47·0 44-7 42-1
0-275 3·2 0-7
84 539·0
7·3 47·570
7·640 1·247 1·661
I
19·1
I

26
I
1 ___________ S __ U~M-M-A-R,Y---O~F--W~IN-D-,~19-3-0~.--_.--_.---
I I i I
i
I I
I
Pre.vailing Direction N NE E SE s SW W NW
No. of days for each 34 67 30 12 37 64 11<1 11 --_._---- -------_._-----------Mean Velocity in
miles per hour... 8·0 6·4 8· 9 7 . 8 11 . 9 10·5 9· 6 9·9
Total No. of miles for each Direction 6496 10348 6422 2240 105681608825279 2608
Mean for the last
63 years.
Total No. of miles registered ....................... . 80049 84988'0 Greatest Monthly Total (October) ................. . 8930 9942·2 Least .. .. (February) ................ .. 4611 4913·8. Greatest recorded hourly velocity (January 10) .. 48 50·4-Prevailing Direction of Wind .......................... . W.
I
W.
DIFFERENCES, 1930.
The signs + and - mean respectively above and below the
YEARLY average.
Mean barometric pressure ... ... ... - 0·064 in. Yearly range ., ... ... ... - 0·101 in. Mean of highest daily temperatures ... ... - 0.90
Mean of lowest .. " ... ... + 1.20
Mean daily range .... ... ... ... ... - 2.1 0
Adopted mean temperature ... ... ... + 0.30
Total rainfall ... ... . .. ... ... + 4·601 in

27
ABSOLUTE EXTREMES
FOR THE LAST 83 YEARS.
Readings oj Barometer. in ~·nches.
Highest monthly mean Lowest Highest yearly Lowest Greatest monthly range Least Highest reading Lowest
1891 (Feb.) ............ 29·997 1868 (Dec.) ............ 28 '.984 1921 ..................... 29·615 1872 ..................... 29·319 1886 (Dec.) ...... ...... 2·795 1852 (July) ... ......... 0·505 1896 (Jan. 9th) ...... 30·597 1886 (Dec. 8th) '",''' 27·350-
Extreme range......................................................... 3·247
Thermometer, Fahrenheit.
Highest monthly mean temperature ... Lowest
1901 (July) 1855 (Feb.)
63·2 28·6 49·4 44·1
Highest yearly Lowest Highest reading Lowest
1921 .............. . 1879 .............. . 1901 (July 20th) 1881 (Jan. 15th)
Weight oj V apourin a cubic JOOI oj air (gr~ins). , .
-89·0 4·6
Greatest monthly mean .:; ............ 1852 a.nd 1927 (July) .. 5·1 Least ......... : ..... tI855.(~eb.)............. 1·4
t A nd on o,her dates.

ABSOLUTE EXTREMES
i' ·FOR· THE· LAST 83 YEARS-Oontinued.
Rainfall. in inches.
Greatest Rainfall in one day ........... . Greatest month Least· Greatest Least
yea.r
1866 (Nov. 16).. 3·700 1870 (Oct.) ...... 13·437 1859 (May) ....... 0·249' 1923 ............... 63·558 1887 ............... 31·250
Da.ys on which ·005 in. or more Ra.in f~ll : Greatest No. in one month A.. ..• ... .•• 1890 (Ja.n.) ... ~ .. ) 30
and 1918 (Dec.) ...... r Least ...... ...... 1852 (Mar.) ... '" 3
: Greatest year ......... ... 1872 ... ... ... ...... 281-Least
• Wind.
Greatest hourly velocity. inmiIes ...... Greatest No. of miles registered in a
mOI).th ............ .-. .................. . Least Greatest Mean N().· " Least Gre~test No. Least
" year .•
1855 .............. . 135
1894 (Dec. 22) ... 72
1888 (Nov.) ... '" 12813: 1917 (Feb.) .~ .... - 3160' March ........... . September .... .. 1868 .............. . 1915: ............. ..
'8301 6032
102395 70623
... Record dotu from 1867 only.

DA
TE
S
OF
O
CC
AS
ION
AL
P
HE
NO
ME
NA
. 19
30
Fro
..
I H
oar
Fro
st
1 S
now
I
Han
I
Hea
.TY
Rai
n
Jan
uary
.
9, 1
5, 1
6, 2
1,2
5,2
6,2
8,3
0,3
1
...
15,
16
,25
,26
,28
.. ,
'"
11
... ,
5,1
0,U
,12
,25
...
2,
10
,4
I Feb
rua.
ry .
. " 6
-12,
14,
16
-21
,23
, 25
, 26
..
10,
14,
16-1
8, 2
0, 2
1 I'"
. 6,
7, 9
, 24
, 25
.,
'" 6
'" M
arch
"'
11
' 11
-14,
17,
18,
19,
20
,22
-24
1,
13
...
11,1
3,15
,16,
18,1
9,20
,21
12
,13
,20
,21
" ..
A
pri
l ..•
...
6,
22,
23
... \
.. .
May
....
..
8,1
0
....
..
Jun
e
....
..
...
.. ..
. .
July
A
ug
ust
S
epte
m b
er
j .. .
Oct
ob
er .
....
. N
ov
emb
er ..
. .
Dec
emb
er ..
. .
27
4-7,
12,
16-
18 2
8
1, 6
, 8-
11,
15,
18
6 .,
..
. 4
5; 6
5,
8,
9,
10
26
""I""'
8 2
4
....
..
9,1
8
'" 1
6, 1
7,2
0, 2
2,28
..
, 2,
6,
13,
21,
29
6
.. r' 3, 4
, 6,
29
.. ,
...
1, 7
, 18
, 21
, 22
14
...
...
...
''',:g
,
1930
G
ales
of
Win
d
Fo
g
Th
un
der
L
igh
tnin
g
Lun
a.r
I Sol
ar H
alo
_I :o~~~Ws
Jan
uary
"\
',.
Feb
ruary
.. "
Mar
ch
Apr
il
!ria
, Ju
ne
July
A
ugus
t S
epte
mb
er
Oct
ober
...
No
vem
ber
l"
Dec
emb
er
..
2, 1
0 "'
113,
14,
16,
20,
29,
30
,31
\ ...
..
. ..
. 3, 1
4,2
0,2
5,
26,
28 ..
. '"
.. ,
3, 4
, 7,
8,
12,
20,
24
'" 2
,14
,25
2
,25
1
0,1
3,1
5,
... 1
...
5,2
6
18,
23
....
..
18,
23,
30 .
.. 1 .
..
3, 4
, 1
4
3 27
, 28
, 29
, 30
..
....
25
, 27
..
. 5
,18
,19
,27
, 2
8, .
. .
2, 1
6, 2
2 ..
. '"
10,
19
,24
...
...
11,
19
,24
...
.. .
3, 4
, 27
. 28
..
. ..
. 6
...
...
21
'"1'''
24
..
. ..
. 1,
28
...
...
...
...
...
.~.
.. ..
. .
27,
28
..
. 1 ..
. 3-
10,
15,
18-2
2, 2
4..
....
....
...
...
...
.. ..
.. H
alo
4 ...1
...
11
15
17
20

I 1
MO
NT
HL
Y
TO
TA
LS
FOR
E
AC
H
HO
UR
O
F R
EC
OR
DE
D
SUN
SHIN
E.
I
1930
. L
ocal
9-
101 1
0-l
l I
appa
rent
tim
e 4
-5
5-6
6-
7 7-
8 8-
9 11
-12
12-·1
1-
2 2-
3 3
-4
4-5
5-
6 6-
7 7-
8 8-
9 --------------
-------------------
Jan
uar
y
...
... '"
...
... . ..
6·1
1
0·4
8·
6 7
·8
6·4
5
·4
0·7
...
... . ..
. .. . ..
Feb
ruar
y ..
. ...
. .. '"
1
·3
6·3
9
·1
9·3
9
·7
10·3
1
0·8
8
·4
5.4
1
1·4
...
'"
...
. ..
I
Mar
ch
...
...
...
0·9
5
·6
8·7
1
1·9
1
2·5
10
·7
12·2
12
'7-
ll·1
7
·8
5·9
1
·2
0·1
...
.. .
A
pril
...
... 1
·6
7·0
7
·8
8·4
8·
1 6
·6
7·3
8·
7 1
1·8
9
·1
9·4
8·
6 5
·0
2·5
...
.. .
M
ay
0·1
6
·9
11·1
1
6·9
1
5·6
1
5·0
1
5·0
16
·4
14
·5
16
·5
16
·8
12·8
14
·7
13
·4
7·6
0
·9
! ...
...
Jun
e ...
3
·6
U·6
1
3·8
1
5·4
14
·1
16·0
12
·7
14·2
1
3·8
13
·6
16·4
. 1
5·8
16
·6 .
14·3
12
·4
4·6
...
~
July
...
1·4
4
·8
7·0
9
·0
9·8
ll
·1
10·5
7
·7
9·0
9
·4
lU·3
10
·5
9 8
ll·6
9
·6
4·0
...
Aug
ust
...
... 3
·0
7·9
10
·1
13
·4
12·7
1
1·6
13
'1
13·2
15
·5
14
·4
14·5
13
2
10·8
4
'3
0·3
...
Sep
tem
ber
.. ...
. ..
1·8
5
·8
10
·3
10·7
11
·0
11
·6
13·0
1
2·8
1
3·6
10
·8
7·9
5
·0
0·4
...
.. .
Oot
ober
...
...
...
...
4·5
1
1·8
12
·4
14·3
1
2·2
1
0·9
10
·7
9·3
9
·1
2'6
1
...
. .. ...
.. .
Nov
embe
r ...
... ...
... 0
·4
4·4
8
·8
11·0
9
·8 -
7·7
7
·0
6·0
1
·6
0·1
..
. . ..
... .. .
D
ecem
ber .
..
... ...
... . ..
...
2·2
3
·7
4·3
3
·9
1· 9
1
·6
0·1
...
...
. .. ...
.. .
--------------------------
Sum
s •.
. 5
·1
27
·9
49
·5
76
·8 1
02·8
124
·1 1
28·6
125
'6/1
25.0
?29'
1 1122.
4 9
8·5
SO
'8
61·3
3
6'9
9
·8
...
I 1
----
--_
.. _
------

TO
TA
L
AM
OU
NT
O
F
SU
NS
HIN
E
RE
CO
RD
ED
O
N
EA
CH
D
AY
.
1930
1~1_
2 _3
1_~J
_5 I~
J_7 1
_8 1_
9 1~:
1:1:
~' 13
I 14
I 15 I
16 I 1
7 Ja
nu
ary
..
i I
0·8
.,
. 1
1'5
1
·6
4·4
3
·2
0·1
3
·1
0·7
0
.11
5·9
Feb
ruar
y .
. I
... I
... I
2 . 8
0
. 1
4 ·4
2
. 7
6· 8
1
. 7
1 . 1
2
. 1
5 . 2
8
· 3
6 . 2
Mar
ch
.. i
4 . 0
I 5
. 7
0 . 4
0
. 5
3 .,5
1
O· 8
0 . 9
8
·0
6 . 1
3
. 2
5 . 6
1
. 3
8· 3
Apr
il
.. I
'" 1
· 5
0 . 6
0
·2
0 . 1
0
·5
1· 1
0
. 5
4 . 5
6
·4
3·7
3
·6
3· 1
8
·4
6· 5
May
..
11
3' 6
I 1
2·6
6
·6
6 5
2·8
1
· 7
5·0
7
·4
3·2
7
·4
0·7
1
0·7
H
·1
3·9
6
·0
1· 6
I ~
Jun
e
0·7
1
9·2
i 9
·21
11
·21
14
·81
15
·21
14
·91
4
·1
5·9
1
4·6
9
·71
13
·7/
8·7
July
Au
gu
st
6·9
/8·6
17
:01
6·4
11
2·2
15
·01
8·1
12
·11
11
·01
5·4
11
1·9
19
·51
1
·31
0·1
10
·11
0·1
14
·0
... ,
1'7
13
·81
11
·11
0
·11
9'6
13
·01
7·1
11
·11
6·2
3
'81
1
·91
0
·6\
9·]
5
·5/
10
· 51
1·6
1·0
1
·51
3
·61
7
·3
8·2
1
·5
3'0
11
0·2
S
epte
mb
er "1
8
'11
11'1
110
'6
Oo
tob
er
...
0·1
0
·5
0·4.
1·0
6·0
1
·71
3
·3/
0·9
/ 9
·01
5
·4
2·3
6
·61
0
·81
0
·1
8'61
0·6
6·1
1
0·7
N
ov
emb
er ..
..
3·0
1
1'0
1
7·8
\ 7
·01
5
·81
2
'3/
3·0
2
·3\
6·3
Dec
emb
er ..
. ,
0·7
/ 0
·1
0·7
1
1·6
1
1·0
1
3·8
, ..
.

TO
TA
L
AM
OU
NT
O
F SU
NSH
INE
1930
18
]9
20
21
22
23
24
------------
Jan
uar
y
...
4·5
3
·3
2·5
1
·5
. .. ...
0
·4
Feb
ruar
y .
..
6·4
4
·1
... 0
,7
... 8
·0
0·1
I
Mar
ch
.. 4
·7
4·5
0
·1
... 8
·6
8·4
7
·6
Apr
il
...
7·2
0
.8j
2·8
3
·1
11
·6
2·1
0
·7
\
May
...
8
·8
'"
5·1
3
·9
7·5
6
·1
5·0
Jun~
... 1
·7
7·3
'"
1
·4
6·3
6
·9
7·7
July
'"
...
0·4
0
·8
2·0
...
... 2
·6
Au
gu
st
... 2
·6
9·2
1
·6
3·8
8
·6
0·2
1
1·3
Sep
tem
ber
..
2·9
2
·0
1·2
8·
·2
... 2
·2
7·6
Oct
ob
er
... 6
·6
7·5
7
·0
1 ·1
lS
·O
2·4
4
·1
No
vem
ber
...
... 1
·5
... ...
.. .
1·7
...
Dec
emb
er .
. ...
...
... 4
'7
. .. 0
·2
...
RE
CO
RD
ED
O
N
25
26
27
28
-------
---
4·9
...
...
3·3
4·3
'"
...
7·0
... 7
·9
'"
1·2
3·2
1
1 ...
4·1
11
·9
5·4
1
2·4
1
0·4
9·4
11
·1
5·5
8
·7
1·0
3
'5
7·2
2
·2
0·3
1
0·8
1
1·0
1
0·6
6·1
1
·2
4·6
4
·0
7·4
8
·7
'"
... 2
·2
3·5
0
·6
... 0
·2
... 2
·8
1·8
--
EA
CH
D
AY
-( co
nti
nu
ed).
29
30
3]
MO
N'l
'HL
Y
To
tal
Per
cen.
----
----
1·7
1
·9
.. .
45·4
1
8·3
. .. ...
...
72
·0
26
·5
4·9
4
'5
0·6
10
1·3
27·7
13·2
11
·3
.. .
101·
9 2
4·3
11·3
3
·4
2·2
19
4·2
39
·4
9·6
6
·4
. .. 20
8·9
41·1
3·7
4
·2
8·2
13
5·5
26
·6
6·4
0
·3
4·6
15
8·0
34
·6
...
7·6
'"
114·
7 3
0·3
... . ..
1·7
9
7·8
3
0·0
... 1
·7
.. .
56
·8
22
·2
...
. .. 0
·1
17
·7
7·7
I
~
t-.:I

33
SUMMARY OF SUNSHINE.
BRIGHT SUNSHINE RECORDED
1930 Mean for the last 50 yea.rs
Number of Percentage Number of Percentage of of
nay, I Possible Possible I
Hours Sunshine Days Hours Sunshine
--------I
January ... 19 45·4 18·3 14·7 32·6 13·1
February ... 18 72·0 26·5 17·6 56·2 20·5
March ... 24 101·3 27·7 24·4 103·1 28·2
April ... 26 101·9 24·3 26·5 145·9 34·8
May ... 29 194·2 39·4 27·9 184·0 37·"3
June ... 25 208·9 41·1 28·0 186·5 36·8
July ... 28 135·5 26·6 28·4 168·5 33·2
August ... 30
I 158·0 34·6 27·6 146·7 32·1
September •. 23 114· 7 30·3 25·6 124·3 32·7
October ... 25 97'S 30·0 23·7 86·4 26·5
November .. 17 56·8 22·2 18·0 47·6 18·6
December .. , 12 17·7 7·7 13·8 27·1 11·7
-------
Year ... , 276 1304·2 29·2 275·8 1310·7 29·3

-
SUMMARY OF SU NSH I N E-Continued.
EXTREMES FOR THE LAST 60 YEARS.
Number of Days I Number of Hours I Percentage
iII of E- on which Sunshine was recorded Possible Sunshine z 0
~
Greatest Least Greatest Least Greatest Least ----
Jan. 21 1881 8 1898 64·2 1881 12·3 1913 25·9 1881 5·0 1913
Feb. 24 1895 11 1882 89·3 1887 29·6 1882 32·8 1887 10·9 1882
Mar. 30 1929 17 1904 ]78·9 1929 56·8 1912 48·9 1929 15·5 1912
April 30 *1909 22 1920 223·7 1893 80'7 1920 53·4 1893 19·3 1920
May 31 1929 22 1886 266·6 1881 79·7 1906 54·1 1881 16·2 1906
June 30 *1896 24 *1888 272·5 1887 85·2 1912 53·6 1887 16·8 1912
I Ju]y 31 *1882 24 1920 263·4 1911 98·0 1888 51·7 1911 19·3 1888
Aug. 3! *1886 23 1894 235·2 1899 74·1 1912 51·5 1899 16·2 1912
Sept. 30 1914 21 1897 176·5 1914 62·9 1896 46·6 1914 16·6 1896
Oct. 28 *1891 17 1889 134·9 1899 50·0 1889 41·4 1899 15·3 188g
Nov. 24 1925 9 1897 89·9 1925 18'5 1891 33·8 1915 7·2 189]
Dec. 20 *1917 6 1882 60·1 1886 7·4 1912 20·0 1886 3·2 1912
- .. _-Year 300 1905 251 1903 1613·7 1887 927·6 1912 36·1 1887 20·7 1912
- * A nd in othM ~oea,s.

HO
RIZ
ON
TA
L
MA
GN
ET
IC
DIR
EC
TIO
N.
Ho
rizo
nta
l M
agne
tic
Dir
ecti
on
, W
est
of N
ort
h (
fro
m d
aily
mea
sure
s of
th
e co
nti
nu
ou
s cu
rves
).
1930
.
Jan
uary
F
ebru
ary
M
arch
...
A
pri
l M
ay
Jun
e
July
A
ug
ust
S
epte
mb
er .
..
Oct
ob
er
No
vem
ber
D
ecem
ber
'"
Mea
ns
...
Hig
hes
t re
a.di
ngs
57
·7
59
·5
59
'7
60
·3
58
·3
56
·6
55
·2
55
·6
53
·4
51
·6
49
·0
46
·0
55
·2
ME
AN
S
OF
*
Lo
wes
t re
adin
gs
4 a.
m.
read
ing
s
13°
+
52
·1
54
·3
50
·3
53
·9
5~'5
54
·9
48
'7
53
·3
47
·1
52
'1
46
'8
50
·4
45
·8
48
·4
44
·0
47
·6
43
·6
45
·8
43· 8
4
6·4
4
3·8
4
5·2
4
3·4
4
4·4
4 p.
m.
read
ing
s
Mea
n
for
the
mo
nth
*
56
'5
55
·2
55
'9
54
·9
56
·5
55
·9
56
·7
54
·8
55
·7
53
·3
53
· 6
51
· 9
52
· 6
50· 5
5
2·8
5
0·0
4
9·0
4
8·0
4
8·2
4
7·5
4
6·8
4
6·2
4
5·6
4
5·1
Mea
n d
aily
ra
ng
e t
14
·6
16
·6
16
· ]
19
·4
19
·0
16
·6
14
'9
19
·0
19
·8
19
·9
13
·8
13
·5
.----.----
46
·8
49
·7
52
·5
51
·1
16
·9
Mea
n f
or
the
yea
r ..
. 13
° 5
1"1
W.
Hig
hes
t re
adin
g o
f th
e m
on
th
14° +
Lo
wes
t re
adin
g o
f th
e
mo
nth
13°
+
Mo
nth
ly
ran
ge
13
·7
31
·7
42
·0
11
·7
19
·7
52
·0
7·7
3
4·7
3
1·0
1
5·7
3
0·7
4
5·0
11
. 7
26· 7
45
. 0
18
· 8
35
· 8
43
. 0
3·8
2
8·8
3
5·0
7
·8
19·.8
I
48
·0
17
·8
20
·8
I 5
7·0
6
·8
25
·8
I 4
1·0
10
. 8
29· 8
41
· 0
19
·8
14
·8
I 6
5·0
------------
]2·2
2
6·6
: 4
5·4
* F
or t
he 5
qu
.iet
est.
dU
U3
. t
Inclu
.des
all
da
Y3
.
~
Of

---~--------
HO
RIZ
ON
TA
L
MA
GN
ET
IC
FO
RC
E.
Ho
rizo
nta
l M
agn
etic
F
orc
e in
C
. G
. S
. U
nit
s (f
rom
d
aily
m
easu
res
of
the
con
tin
uo
us
curv
es).
.
-5
T
he
figu
res
in t
he c
olu
mn
s ar
e en
tere
d t
o t
he
un
it 1
0 C
.G.S
.
ME
AN
S
OF
*
Mea
n
Hig
hes
t L
ow
est
for
Mea
n d
aily
re
adin
g o
f re
adin
g o
f M
on
thly
19
30
Hig
hes
t L
ow
est
4a.m
. 4
pm
. th
e
ran
ge
the
the
ran
ge
read
ing
s re
adin
gs
read
ing
s re
adin
gs
mo
nth
m
on
th
mo
nth
•
t
17
00
0 +
17
000
+
I !
Jan
uary
...
201
I 17
6 19
1 19
0 lU
O
55
'0
286
97
189
Feb
ruar
y
'"
220
184
208
202
204
73
-0
258
34
224
Mar
ch
... 21
2 18
2 20
7 19
9 20
0 8
7'1
27
1 60
21
1 A
pri
l ...
'"
224
158
19
8
198
195
11
7'6
29
3 3
8
255
May
...
... 21
2 15
6 1
78
18
3 18
2 1
18
·0
328
29
299
Jun
e
... '"
21
7 16
6 19
7 19
3 19
3 1
20
'1
302
16
286
July
...
'"
210
166
185
18
8
187
10
0' ~
30
2 91
21
1 A
ug
ust
...
209
151
178
189
182
10
3·8
30
6 47
25
9 S
epte
mb
er .
..
195
145
17
8
174·
17
3 9
1'1
26
2 29
23
3 O
cto
ber
...
189
157
17
8
179
176
85
·8
>2
49
11
>
23
8
No
vem
ber
'"
201
180
192
195
192
59
·4
267
69
198
Dec
emb
er
'" 20
8 lu
3
200
205
202
52
·8
403
60
343
l I-~
----
Mea
ns
...
... 2
08
1
68
19
1 19
1 19
0 29
4 48
24
6 ----
Mea
n f
or
the y
ear
•..
... ·1
71
90
C
. G
. S
. U
nit
s.
----~
_._
-
• F
or t
he
5 qu
iete
st d
ays.
t
Incl
udes
all
day
s.
w ~

ABSOLUTE MEASURES-SU M MARY.
DIRECTION FORCE.
1930 Declination Inclination Horizontal I Vertical I Total Corrected
0 I 0 I C. G. S. UNITS.
13 + 68 + O· 17000 + 10' 44000 + \0, 47000 + Ja.nua.ry ... 56·0 46·4 200. 284 507
February .. ' 55·2 46·5 205 302 5251
March ... 55·4 46·1 192 319 473
April ... ... 54·4 47·8 192 318 536
May ... ... 53·2 48·6 190 342 558 ..
June ... ... 51·8 49·4 203 336 631
Ju1y ... ... 50·3 47·9 179 288 504
August .. 50·0 47·0 173 239 455
September ... 47·5 49·2 173 320 531
j I
October ... 47·0 52·2 187 469 675
November .. 47·1 45·9 197 256 480
December .. 45·5 46·2 194 262 483
0 , 0 I
Means .. 13 51·1 68 47·8 0·17190 0·44311 0·47530 W.

38
DATES OF MAGNETIC DISTURBANCES.
The disturbances are divided genera.lly into three classes, small, moderate, and greater; these are indicated by the initial letters of the classes, and the letter c denotes calm. Very great disturbances are marked v.g . The days are civil da.ys.
...c 1 1930 d .!5 8 ~ I ~ I 0
>. tc ~ ~ :;: ~ 1930 ~ Po. ~ ~ '3 ::: Po. ~ 0 0) I:il 0) 0) r-;, ~ ~ < ~ ~ ~ < 00 0 Z A ------ ------------------'--
D. D. 1 m m m 5 c g 5 C m m 5 5 1 2 c m g c c g m c m m m c 2 3 m m m c c m m c g g m v.g. 3 4 g 5 5 C m g m c m m m g 4 5 g c c c g s m 5 m m m m 5 6 g c c m m s s g m m c s 6 7 m c c g g m 5 g 5 5 5 5 7 8 m c c g m m c g s m m c 8 I
1 9 c c c m m 5 m m 5 5 m s 9 10 s c c m s s g m (m) s s s 10 11 c c m m s c m m (s) c s c 11 12 c g g m m g g g m 5 c m 12 13 s g g m m m g m c c 5 m 13 14 c g g 5 5 5 m g 5 g g s 14 15 s m III m s 5 S S C 5 m 5 15 16 5 m m m g g m s c C 5 c 16 17 m 5 m 5 g m 5 5 S g 5 c 17 18 5 m m s m (m) c 5 g S 5 c 18 19 m 5 m m m (s) s m m m e- m 19 20 m 5 m g s m c c c m c g 20 21 m s 5 m m m c m m s c g 21 22 5 C m g m c c m c s c m 22 23 s s s m m c c m s c m m 23 24 c 5 m m c c m m m c g m 24 25 c m In S m c g C 5 m g s 25 26 c 5 m 5 c c m 5 c g m 5 26
I 27 c 5 m 5 c m 5 s C g ill 5 27 28 c m m 5 c m 5 c m m In c 28
I 29 5 m m s m TIl s g m m m 29 30 ill m m m m c 5 g m 5 5 30 31 m 5 g 5 S m c 31 - ----------------------------
~ {: 10 8 6 4 7 6 7 7 7 5 6 8 St} 8 9 4 8 6 7 9 10 8 8 9 11 97 ~ ~ m 10 8 17 14 13 12 11 9 11 13 12 8 138 ~
[-< g 3 3 4 4 5 5 4 5 4 5 3 3 48 f-vg - - - - - - - - - - - 1 1
Note :-Oharacter letters in brackets, indicates incomplete records.

DA
TE
S
OF
S
OL
AR
O
BS
ER
VA
TIO
NS
A
ND
D
ISC
A
RE
AS
O
F
SP
OT
S.
Th
e u
nit
is
s-J-
ooth
of
the
Dis
c.
n-N
ote
wit
ho
ut
a co
mp
lete
dra
win
g a
t S
ton
yh
urs
t.
Z-A
rea f
rom
co
py
of
Zu
rich
Dra
win
g.
C-A
rea f
rom
Co
py
of
Cat
ania
dra
win
g,
or
Cat
ania
dra
win
g e
xam
ined
. *
Are
a o
bta
ined
fro
m S
ton
yh
urs
t an
d C
atan
ia d
raw
ing
s co
mb
ined
.
1930
-' tTa
~~ 1
Feb
. M
arch
I Ap
ril
May
Ju
ne
July
A
ug
. S
ept.
~:
~I No:
~ D
ec.
1930
--------
-------
DA
Y
DA
Y
1 4
'3
Z4
'8
4'5
Z
2'5
0
'6
0'2
0
·9
C2
'5
C 3
'7
C 2
'9
1 2
2'7
Z
4'3
5
'6
5·4
3
'1
1'9
0
'3
0·1
1
'1
2'7
3
'8
1'5
2
3 C
n
C 3
'9*
6
'2
nC
5'4
1
'8
2'2
0
'6
0'0
3
1'1
2
'1
2'1
1
'0
3 I
4 2
'8
Z 5
·9
C 5
·6
nC
3·4
1
'5
2'1
0
'5
C 0
·1
nZ
2'4
C
1'7
0
'9
0·6
4
5 3
·4
6·4
Z
9'3
C
5'0
1
'8
1'8
0
'3
0'0
3
'8
3'6
0
·4 ---
5 6
5'5
C
C
C
4·5
3
'8
2'2
0
·4 I
0
'9
4'5
n
C 6
'7
0'5
C
0'1
6
7 7
·1
7·0
Z
5'4
5
'8
4'5
0
'31
1
'4
4·6
7
'1
0.5
Z
0·1
7
---
4'4
8
9·0
6
·2
5·8
n
Z 4
·2
5'8
0
·3
1'6
4
'3
nC
8'0
0
'5
C 0
'0
8 9
5·1
5
'1
4'1
3
'3
0'9
2
'4
C 3
·6
9'8
C
0'4
0
'3
9 10
1
1'8
4
'4
C 3
·0
3'7
n
C 1
'6
1·5
Z
3·7
3
·0
10
·1
0'1
C
0'6
10
---
11
n.
4'5
3
'1
3'9
2
'6
1'8
1
·1
Z 3
'0
nC
2'3
7
'7
0'1
Z
0·4
11
12
Z
9'6
C
1
'5
3·9
2
'3
2'7
0
·2
3·3
2
'5
5'7
Z
0'4
0
·6
12
13
Z 9
'8
nZ
2·6
1
'1
nC
C
1'5
n
C 2
'7
0·4
Z
3-1
4
'3
0'7
13
14
C
1
·2
0'5
1
·6
0·9
1'&
nZ
0-9
2
;8
1'1
Z
3'4
Z
0'4
0
'9
14
-~---" ---.---------~~--
I I
C»
C
>

DA
TE
S
OF
S
OL
AR
O
BS
ER
VA
TIO
NS
&
D
ISC
A
RE
AS
O
F
SP
OT
S-C
oN
TD
.
1930
'J
an
. F
eb.
Mar
ch I
Apr
il
May
Ju
ne I J
uly
A
ug.
Sep
t.
Oct
. N
ov
. D
ec.
11
93
0
----------~.----------------------------------
~
I ~
15
13
·3'
1·3
Z
0'7
0
'7
0'8
1
'3
nZ
1·6
2
'1
0'6
Z
1'2
0
'7
15
I I
16
n.
I 0
'6
Z 2
'9 I
0
'5
0·9
0
·8
Z 1
'8
2·1
C
0'1
I
0'5
"'
1'7
C
0'5
16
17
Z
I0·4
' 0
'8
5'0
1 0
·3
1·1
1
'5
0·9
Z
O'l
iCO
'5
ZI·
6
0·3
17
18
8
'7
1'5
4
'7
1 0
·2
1·5
0
·1
Z 1
·1
0'4
0
·1
0·4
Z
1'6
Z
1'2
18
19
6
·6
0'8
2
'3
0'2
Z
1'9
0
'1
nZ
0'7
0
'5
0·1
0
'8
3'5
Z
2'2
19
20
5
. 1
0 . 8
Z
2' 0
n
C 0
. 2
2 ·3
0
. 6
1 . 1
0
. 1
0 . 5
Z
4 .
/j
Z 2
· 5
I 20
21
3
·9
0 . 9
Z
1· 7
0
·6
2 . 9
0
-04
0 ·4
1
·2
0 -1
C
O-
1 C
4 -
9 1
. 7
21
I ~
22
Z 3
-1 I
Z 0
·7
0-9
0
-6
2-8
0
·1
Z 0
'3
1-4
0
-2
C 7
'3
22
23
. n_
1 -4
0
-5
nZ
0 -
9 2
. 7
0 -0
Z
0 -
3 C
O· 8
0
-2
1 -0
n
Z 1
1 -2
1
-3
23
24
In
_ 0
-9
1-6
1
-9
0·1
0
-3
1-2
0
-3
2'2
C
6-6
24
25
I
2-3
2
-0
2-1
1
-6
0·2
0
-5
nC
O-8
0
-6
2-6
8
-0
1-6
I
25
26
C_
1
-3
2-3
1
-6
0-1
0
-5
0-8
1
'8
4·3
7
-5
26
27
Z 1
-4
Z 2
-1
C_
C 2
-7
1·6
0
-6
0-7
0
-9
1-9
Z
6-2
6
-1
0-9
27
2
8
2-1
2
·6
2-5
3
-4
1-4
1
-2
1-0
1
·5
2·2
C
5·3
Z
6-0
0
-8
28
29
2
-7
3-5
3
-5
2·0
0
-9
0-6
2
-1
C 2
-3
C 3
-7
Z 4
'3
C 0
·4
29
30
3
-9
4 -5
4
-9
2 -6
0
. 8
0 -5
i
Z 1
-8
2 -8
Z
4 -
3 4
-(J
Z 0
-6
30
31
..
4-3
--.-
. -l-
e 0
'4!
1-5
..
5
-2
..
0-0
31
Mea
n)
5-9
1 1~
3.~\
~69"
~-I-
-~;-
o.;-
-I--
~I-l
--n3
.~-~
;;-O
:~~-
-

41
SUN-SPOT STATISTICS, 1930.
Any area less than 0 ·05 is entered as 0 ·0. The points for which the co-ordinates were measured are indicated as follows:s-centre of chief spot, g-centre of group, p-centre of preceding, f-centre of following spot. In the last column is entered the day and decimal thereof on which the centre of the spot or group actually passed the central meridian, or would have done so if on the Solar Surface on the day in question. The" Types are " :-
I.-One or more small spots. II.-A double spot or group of some magnitude.
III.-A train of spots of some magnitude. IV.-A single large spot with or without small companions.
V.-Irregular group of ~arger spots. Groups in Italics were not observed at Stonyhurst, but are taken
from the Zurich or Catania drawings.
No. of Group Date I Mean Mean
Latitude Longitude Max. o 0 Area
Mean Type
Central Meridian
----1--------1--- ------ ----- ----1 2 3
4 t4' 5
6
7 S 9
10
11
12 13
Jan. 2-10 2-14 2-13
5-10 13 6-lS
6-lS
11-17 13-15 13-lS 12-22
13-20
14-22 15-17
... + S'4
... + 3·9
... - 5·7 - 6·7 - 5·9 - 7·7
... - 9·5 '" - 1·3 '" + 5·2
+ 9·7 ... - 3·4
60'6 46·S 44'7 50'0 48'0 35'8 6·5 8·9
352·7 338·7 347·0
-5·4 351'9 - 3·1
... +17·0
... - 7·2
... -13·6
... +13·0 +14'5 +12·9
... -14'5 -14·1
... +12'7
... -11·4
348'2 335'5 300·8 296·3 274·3 279·8 272 ·7 261·8 263·2 250·0 238·8
0·3 1·3 2·3
0·3 0·0 4·5
4·8
to'5 0·1 0'7
t5·4
0·8
0·2 0·0
t Zurich Drawing.
I. s . 1. s.
III, I. g. 8 1
82
8 3
I. 8.
I. g. IV. s.
fg.
Jan. 7·1 , 8·2
8·4 1"'9
" 8·1 " 9·0 " 11·3 " 11·1 " 12·3 " 13·4
III, II. g. " 12·7 8 t
8 2
I. g. I. g. I. g. V. g .
p. fg.
I. g. s.
I. 8.
1.8.
" 12·4 " 12·6
13·6 " 16·2 " 16·6
18·3 " 17·8 " 18·4 " 19·2 " 19·1 " 20·1 " 21·0

42
I SUN-SPOT STATISTICS, 19aO-Conid.
Mean I Mean NO,Ofl Date Latitude Longitude Max. I Mean Central Group 0 0 Area Type Meridian
-----------------14 Jaa. 17-20 ... -17·4 320·9 0·3 I. g. Jan. 14·7 15
" 17---;-27 ... +1l·5 205·2 1·1 I. g. "
23·5
+ 8·6 215·8 8 1 " 22'7
+13·0 212·2 8 2 " 23·0
+12·8 205·9 8 3 " 23·4
+14·2 195·0 8 4 " 24·3
16 "
21 '" ... +15·4 223'5 0'1 I. s. " 22'1
17 " 21-31 ... +1l'0 147·6 1'9 IV, I. g. "
27'9
+ 9·9 154·4 p. " 27·4
18 " 27-Feb. 4 +15·4 123·7 1·8 I, III. p. "
29'7 +15·7 116'7 f. "
30·3 19
" 28-Feb. 8 + 5·9 62·8 tl'O IV. 8. Feb. 3·3
p9' " 31 ... ... 0'0 ? 1.
20 "
29-31 ... + 4·2 97·0 I 0·2 1. g. Jan. 31'7 21
" 30-31 ... + 3·3 167·6 0·2 1. g. "
26·4 22
" 30-Feb. 9 +18·1 36·9 1·1 IV. 8. Feb. 5·3
t22' Feb. 4 ... ... +11'9 34·2 0'0 I. 8. " 5·5
23 " 2- 5 .. , - 5·5 70·8 0·1 1. g.
" 2'7
123
'1 " 2 ... .. , -17·8 109·8 0'0 1.8. Jan. 30·8 24
" 2-12 ... - 6·7 4·9 1·0 I. g. Feb. 7'7
- 7·7 12·2 p. " 7·2
- 8·2 6·5 £1 " 7·6
- 4·5 354·9 £2 8·5 25
" 2-14 ... + 7·2 353·3 1'5 V, 1. g. "
8'6 26
" 4- 9 ... -13·4 50·3 1·6 I. g. "
4·3 -1l·4 53·4 p. "
4·0 27
" 3-14 '" -16·9 345·8 3·3 III. g. " 9·2
-18·8 357·3 SlP· " 8·3
-18·5 352·5 8 1£, "
8'7 "-18·9 345·6 8 2 "
9·2 -14·4 340'0 8S "
9·6 -13·2 332·9 s-' "
10·1 28
" 9 ... ... +12·2 321·3 0·2 I. g. " 11·0
29 " 9-16 ... +10'8 283·5 1·3 I. p. "
13·9 t29'
" 15 ... ... 0'0 ? I. 30
" 11-15 ... - 3·6 326·6 0·2 1. g. " 10·6
t30' " 12 ... ... 0'0 ? 1.
t Zurich Drawing. t Catania Drawing.

43
SUN-SPOT STATISTICS, 1 930-Contd.
No. off Mean Mean
Date. Latitude Longitude Max. Mean Central Group 0 0 Area Type Meridian
-- ------31 Feb. 14-23 ... +11·6 205·4 1·5 I, IV. g. Feb. 19 ·8
+10·4 209·2 p. "
19·5 32
" 17-18 ... - 9·3 239·0 0·0 1. s.
" 17·3
33 "
18 .,. ... + 9·0 231·5 0·0 I. s. "
17·8 34
" 23-Mar. 6 - 6·3 84·0 2 ·1 IV. s.
" 28·5
35 "
28--Mar.13 -17·3 357·3 t8·8 IV, III. g. Mar. 7·6 -16·0 5·7 8
" 7·0
-17'7 355·5 ~ " 7·8
-17·9 353·7 83 " 7·9
-19·0 347·7 8 4 " 8·3
-21·3 344·6 SiS " 8·6
36 Mar. 7 ... .. , + 7·0 68·9 0·0 I. g. "
2·2
37 "
7- 9 .. , +18·9 332·2 0·1 I. g. "
9·5 38
" 9 ... ... - 7·0 14·0 0·0 I. s.
" 6·4
39 " 10 ... .. , -17·7 314·9 0·0 1. g .
" 10 ·8
40 "
11-22 .. , + 8·4 I 240·0 4·5 I, II. PI " 16·5
+ 7.9 I 236.2 P " If!.·8
+11·6 229·3 f. " 17·3
t 4O' " 16 .. , ... +10·7 242·3 0·1 1.8. "
16·4 41 "
13-17 '" +14·2 219·2 0·4 1. p. " 18·1
42 "
15-17 '" +20·8 228·3 0·1 1. 8. "
17·4
43 " 16-23 ... - 2·0 210·5 1·1 1. g.
" 18·8
- 1·4 213·6 p. " 18·5
- 2·3 208·3 f. "
18·9
44 " 17-21 ... + 5·9 191·2 0·1 I. s.
" 20·2
45 "
21-23 '" + 4·1 107 ·8 0·1 1. s. " 26·5
46 "
22-Apl. 2 + 8·9 85·1 0·8 IV, I. s. "
28·3
47 "
24 ... ... + 0·2 116·1 0·1 I. p. " 25·9
+ 1·2 114 ·1 f. "
26·1
48 "
24-Apl. 4 + 8·4 I 61·0 0·3 I. 8. "
30·1
+ 6.91 67·8 p. " 29·6
+ 6·3 61·9 f. " 30·0
49 "
26-Apl. 7 - 6·0 26·7 t 4 ·4 IV. s. ApI. 1·7 - 9·5 13·6 f.
" 2'7
t 49' Apl. 1 ... . .. -15·9 9·0 0·1 I. p. "
3·0
-17·1 0·2 f· " 3·2
t49" " 1 ... ... -18'41 3153 .5 0·1 1.8.
" 4·2
t Zurich Drawing.

44 .
SUN-SPOT STATISTICS, 1930--Contd. Mean Mean
No. of Date Latitude Longitude Max Mean Central Group 0 0 Area Type Meridian
50 Mar. 30 ... ... + 9·8 50'6 0·1 I. s. Mar.30·9 51
" 30-Apl. 2 -17·5 62·9 0·4 I. p.
" 30·0
-19·3 57'8 f. "
30·3 52 Ap1. 2-13 ... +11'7 309'6 t3'9 III, IV. p. ApI. 7·5
t52' "
7 ... ... + 7·2 288'6 0'0 1. g. "
9·1 t52"
" 3- 5 ... 0'1 I.
11·2 ! 53 "
6-13 ... +14·2 260'9 0·3 I. g. " §53'
" 5- 7 ... - 7·3 266·1 0'1 I. g.
" 10·8
54 "
10-15 ... - 6·9 237'5 0'5 I. pg. "
13·0 - 7·9 233·6 f.
" 13·3
54a "
12-19 ... -12·5 231·4 0·3 I. p. " 13·5
-13·2 227·4 f. " 13·8
55 "
10-17 ... +12'7 221·1 1·4 1. p. " 14·2
+14·6 214'7 f. "
14'7 56
" 13-22 ... +13·0 181·2 0'1 1. p. "
17·3 +14·2 177'6 f.
" 17·5
t56' " 23 ... ... + 7'9 155'5 0·1 1.8.
" 19·2
57 "
14 ... ... -12·5 284·0 0'1 I. p. "
9·5 58
" 14 ... ... +15'8 242·6 0·1 I. s.
" 12·6
59 " 17 ... ... - 4·3 200'4 0·0 1. s. "
15·8 60
" 18-23 ... +26'1 114'9 0·3 1. p. "
22·3 +26·8 H1·3 fg.
" 22·6
61 "
18-24 ... -13·2 95·3 0·2 1. g. "
23·8 t61'
" 25 ... ... I. 62
" 22 .. , ... +12,6 90·2 0'1 I. p. "
24·2 +10'2 87,9 f. "
24·3 63
" 22-May 4 - 8·0 30·2 2'9 IV. s. " 28·7
64 " 24- " 4 +11,3 22'7 2,1 1. g. "
29·3 +10'9 24·2 p. "
29·1 +11'5 20'5 f.
" 29·4
65 " 25 ... ... + 5'8 77,8 0·0 1. p.
" 25·1
+ 7·1 77·0 f. "
25·2 66
" 26 ... ... + 6·6 93'9 0·0 1. s. "
23·9 67
" 29-May 7 +10,8 344'6 1,1 1. g. May 2·1 + 8·8 348,9 p. "
1·8 68 [May 1-2,4 ... - 9·2 17'5
0·1 I 1. g. [API. 29·7 69 " 2 ... ... +19'7 315·2 0,1 1. p. May 4·4
t Zurich Drawing. t Catania Drawing. § Catania and Zurich Drawings.

45 I
SUN-SPOT STATISTICS, 1930 -Contd.
Mean Mean I No. of Date Latitude Longitud e Max. Mean Central Group 0 0 Area Type Meridian
---70 May 4-14 ... +16·2 276·3 5'8 I, II. g. May 7·3 .
I
+15·9 279·8 p. " 7'1 ,
+16·4 272·2 fg. "
7·6 I
71 " 11-17 ... + 2·4 207·6 n'3 1. g.
" 12'5
+ 2·0 204·9 f. "
12·7 72 "
14-17 ... +15·2 178·5 0·2 1. g. "
14'7 73 "
15--19 ... - 5·9 158·6 0·3 1. g. " 16·2
74 "
16-27 ." -10·2 80·3 2·4 I, IV. g. " 22'1
- 9·4 83·1 p. " 21'9
75 " 19-31 ." - 6·2 37·0 0·6 I. s.
" 25·4 !
76 " 23, 24 ." +26·3 104·4 0·2 I. g.
" 20·2 :
I
77 " 23-June 5 +12·4 349·1 0·6 I. P.' "
29·0 +12'7 345·8 Pli g. "
29·3 +12'5 339·0 fg. "
29·8
77a " 29 ... ... + 8·3 350·5 0·0 1. g. "
28·9
78 " 24,25 ." -11·3 1·5 0'1 I. g.
" 28·1
79 " 24-31 ." +26·0 35·5 0'7 I. 8 1 "
~5'5 ' +19'8 35'9 8 2 "
25'5 +19'5 28·0 8 a "
26·1: 80 "
27 ... . .. - 4·2 17·6 0'1 1. s. " 26·9 I
81 " 27 ... ... - 0·9 348·1 0·0 I. g. "
29·1
82 "
28-June 9 +17·0 279·3 2·0 IV. s. June 3·3 83 "
29-31 ." - 1·8 321·0 0·2 I. g. May 31·1
84 June 1- 7 ... +14'8 258·1 0·2 I. g. June 4·9
85 " 3-11 ... + 1·0 244·1 1·8 I,Il,IV.g "
6·0 + 0·4 246·9 p. "
5·8 - 0·4 243·3 f. "
6·0
86 "
5--14 ... -10·3 212·2 2·0 I, II. g. " 8·4
- 9·6 215·9 p. " 8·1
-10·6 208·6 f. " 8·6
t86' " 13 ... ... + 0·82 214'02 0·2 I. g. "
8·2
87 " 7 .. , ." -12·1 293·6 0·0 I. 8. " 2·2
88 " 7-11 ... - 5·5 178·2 0·3 I. g. "
10·9
89 " 7-18 ... +13·7 159·4 2·3 I, III. g. " 12·4
+13·0 162·8 81 " 12·1
+14·6 160 ·1 811 " 12·3
+15·9 159·8 83 " 12·3
~ Catania Drawing.

46
SUN-SPOT STATISTICS, 1930 -Conld.
Mean Mean No. of Date Latitude I,o:ugitude Max Mean Cehtral Group 0 0 Area Type Meridian -----_._-- ---.- ----------- -----
90 June 15 '" ... +10·6 58·1 0·0 I. s. Jne.20·0 91
" 16-19 .,. + 9·6 69·5 0·2 I. g.
" 19·1
92 "
21, 26 ... +11'5 345'8 0·0 I. g. "
25·5 93 OJ 22 '" ... - 7·1 54'9 0'1 I. g.
" 20·3
94 "
24--28 ... +14'7 337'5 0'1 I. g. " 26'1
95 "
25-30 ... +18'3 274'6 0'1 I. s. "
30·9 96
" . 27-July 3 +14'1 266·9 0·9 I. g. July 1'4
+13'3 265·2 s. "
1·6 97
" 27-
" 4 +14'4 243'8 0·3 I. p.
" 3·2
+15·2 238·6 fg. "
3·6 98 July 2- 9 ... - 5·4 193·3 0'2 1. p.
" 7·0 - 5·4 188·4 fg.
" 7·4
99 " 3-:- 9 ... + 8·7 176·4 0·4 I. g.
" 8·3
I 100 "
5 ... ... - 6·6 219'6 0·0 I. g. "
5·0 101
" 6 ... ... -10·0 208'5 0·2 I. s.
" 5·9 102
" 9-12 .. , + 4·2 206·4 1'5 II. p. "
6·0 + 5·1 200'9 f.
" 6·4
103 "
9, 10 .. , - 4·6 91'7 0·0 I. s. "
14·7 104
" 12 ... .. , + 0'7 93'8 0·0 I. s. "
14·5 105
" 12-21 .. , - 5·6 74'7 1 '8t I, IV. p. "
16·0 t 105' .. 16, 16 .., + 8·0 66·9 0·1 I. g. .. 16·6
1().6 "
13, 14 .. , - 7·9 153·3 0·0 I. f. "
10·0 107
" 17 ... .. , +12·4 44'7 0·0 I. s. "
18·2 lOS
" 21-23 .. , - 9'7 293·1 0·1 I. s. "
26·7 t108'
" 23 ... ... -12'5 270'0 0·1 I. s. "
28·4 109
" 21-29 .. , + 3'9 282'8 0·3 I. s. "
27·4 llO
" 25-Aug.2 + 2·2 239'5 0'8 1. s. "
30·7 lli
" 28, 29 ... +13'3 261·4 0·1 1. p. "
29·1 112
" 28, 29 ... -10,3 258'5 0'1 I. p. "
29·3 113
" 28 ... ... - 3'9 220·0 0'0 I. s. Aug. 1·2 114 .. 31-Aug.4 - 8·4 161·2 0·0 I. iii.
" 5·6
flU' Aug. 2 ... ... 0·1 I . 115
" 6-13 ... + 4·2 97·1 to'5 I. s. " 10·5
116 " 6-18 ... - 6'7 73·9 3·3 IV. s.
" 12·2
117 " 18-26 ... -11'4 274·3 0'5 I. s.
" 24·3
118 " 18-28 ... + 5·6 269·6 0·9 1. s. 24·7
" 119 " 19-21 ... +10'0 282·1 0·1 1. B. 23·7
" 1-
t Zurich Drawing. t Catania Drawing.

47 ----------------------
No.of Group
120 121 122
123 124 125
126 127 128 129 130 131 132 133 134 135 136 137 138 139 140 141 141' 141" 142
14:3
144 145
SUN-SPOT STATISTICS, 1930-Contd.
Mean Mean
Date Latitude Longitude Max M.ean Central 0 0 Area Type Meridian
f---
Aug. 24-27 ... + 7'5 290·0 0·2 I. 8. Aug.23·1
" 26-Sept.3 - 9·4 201·2 0'5 1. g. u 29·9
" 26-
" 2 + 7·6 189·3 1·6 II. p. H 30·8
+ 8·2 187' ] fg. H 30'9
" 27-"
7 + 9'8 148'5 0·6 I. s. Sep. 2·8
" 29-
" 4 -12·0 150 '7 0·2 1. s.
" 2·7
Sept. 1.3-9 ... + 5'7 130'9 2·0 It II, IV. g H 4·2 + 4'8 134·3 p.
" 3·9
+ 4'5 127·8 f. ., 4·4
" 1- 5 ... + 5·0 85·8 0·2 I. 8.
" 7·6
" 2-12 ... - 7'1 77·4 0·8 I. IV. s. H 8·2
" 4- 7 ... -16'6 60'8 0·2 I. g. H 9·5
" 4-16 ... +16'8 38·6 2·7 IV. s. H 11·2
" 6. 7 ... - 4'7 107·0 0·1 1. g. H 6·0
" 6- 8 ... + 6·0 83·0 0·1 1. g.
" 7·8
.. 7 ... ... - 9·6 121·3 0·0 1. g. " 4·9
" 11, 12 ... -10'2 330·9 0·0 1. g. "
14·8
" 14-18 ... -10'2 293·4 0·2 I. g •. H 19·1
" 15 .. , ... - 8·0 47'6 0'0 I. s. "
10·5
" 19 ... '" -19'0 288'4 0·1 I. g. H 19'5
" 20, 21 ... +17'1 270'1 0·1 I. g. "
21·0
" 23-28 ... +18'1 236'0 0'5 I. g. "
23·5
,. 24-0ct. 6 + 6·3 136·4 p·a IV. S. Oct. 1·0
" 26 ... ... -23'1 136'7 0·0 I. s. "
1'0
,. 26-0ct. 8 - 2'5 118'2 1'7 IV. S. "
2·4
Oct. 5 ... ... 0·1 1.
" 5 ... ... 0'1 1.
" 5--14 ... + 7·2 6'1 9·8 II. g. "
11·0
+ 7·4 12'0 p. " 10·5
+ 8·1 0·3 f. " 11·3
~. 10-21 ... +11'6 306'3 tl·e I, II. g. ", 10·4
+10·0 310'5 p. " io·l
+12'6 303'1 f. " 15,·7
II 1S-20 ... + 4·2 272·0 0'1 I. g. " 18·0
.~ 22, 23 ... -19·2 234·4 0'1 I. 8. " 20·9
-* Groups 126, un identical. t Ca.tania. DraWing.
t Zurich Drawing.

I SUN-SPOT STATISTICS, 1930-ColltJi.
Mean Mean I No.of Date Latitude Longitude Max Mean Central Group 0 o Area Type Meridian
I 146 Oct. 22--Nov.4 - 7·1 123·6 I 5·2 IV, III.g Oct. 29·3
- 5'8 132'8 I 8. "
28·6 - 6'7 127·6 I 8 1 "
29·0 - 8'7 124·4 I S:J "
29·2 - 5·0 119·5 • S
" 29'4
I - 7'9 130 ·1 S " 28'8
- 6'3 Ill'8 I f. "
30·2 §146'
" 2r~29 ... - 4'8 1.52·6 I 0'1 1. g. "
27·1 t 146" " 27 ... ... - 4'8 94'2 0'0 1. g.
" 31'0
tU6'" Nov. 1 ... ... 0'1 I. 147 Oct. 25--29 ... + 5'2 199·3 1'1 II. p.
" 23'5
+ 5·2 195-9 f. "
23'8 148
" 26 ... ... + 7·0 139·2 0'1 I. g. "
28·1 149 Nov. 3, 4 ... + 7'4 24·2 0'1 I. g. Nov. 5·8 150
" 3-12 '" +12'7 33"8 0'5 I. s. "
9·2 t 150'
" 12 ... ... + 3·0 31~'4 0·1 I. 8. " 11'0
151 " 14-25 ... + 4·6 203\'9 i 2'5 III. g.
" 19'5
+ 3'5 209·6 p. "
19·1 + 3·4 197'5 f.
" 20·0
152 " 19, 20 ... - 3·2 147.'3 0'1 I. s.
" 23'8
153 " 18-28 ... - 6'0 135"~ f3'4 IV. s.
" 24·7
154 " 21-Dec. 3 - 8'6 107'6 5·3 II. p.
" 26'8
- 8·3 101'~ f. "
27·2 155
" 21-30 ... + 6·2 104'2\ 0'9 IV, I. s. "
27·1 156
" 25, 26 ... -26·3 181'9 0'3 I. g. "
21·2 157
" 26-Dec. 4 +14'0 84·0 0'9 I. p. "
28·6 +15'4 76'1
}
f. " 29·2
158 " 26- " 1 + 8'1 61·6 If 0 '5 I. g.
" 30·3
+ 8·4 63·3 p. "
30·2
+ 8'7 60·3 i • f. "
30·4 159
" 27-29 ... +17'8 51'1 i 0'0 I. s. Dec. 1·1 160
" 27-Dec. 7 + 8·4 36·1 i 0·6 I. g. Nov.29·6
+ 8·2 39·1 i p. "
29·3 161 Dec. 9-19 ... + 5·2 224·0 I 0'7 I. p. Dec. 15·3 162
" 12 ... ... +1l'7 284·1 I 0·1 I. g. 10'7
I" 163 " ll, 12, 18-21 +10'6 224·0 If 0·7 I, IV. 15·3
" .-§ Catania. and Zurich Drawings.
t Zurich Drawing. t Catania Dra.wing.

49
SUN-SPOT STATISTICS, 1930-Contd. Mean Mean
No. of Date Latitude Longitude Max Mean Central
Group 0 0 Area Type Meridian -_.------------- ---- --------------_._-
164 Dec. 11, 12 .,. + 3'5 215·0 0·0 1. s. Dec.16·O 165
" 14-~6, 18-19 -13·2 240'7 0·3 I. p.
" 14·0
166 "
17-20 ." -11'3 125·0 0·2 I. p. "
22·8 -12'5 123'0 f.
" 23·0
167 "
18-25 ... - 8'3 112 '7 1·5 IV. s. "
23'7 168
" 18-23 ... + 9'2 118·5 0·1 1. g.
" 23·3
169 "
25 ... ... + 4'7 119·2 0·1 I. g. , . 23·2 170
" 20-30 ... +12'8 90·4 1·1 1. ll. "
25·4
+ 4'3 85·0 f. "
25·9 171
" 25-28,30' + 8·2 44'7 0·1 1. p.
" 28·9
+ 7·6 38·0 f. "
29·4 172
" 28 ... ... + 8·4 24·9 0·0 I. s. "
30·4
---------.- - - -------------- -