Embed Size (px)
Citation preview

Results from Exploratory Factor Analysis
May 18, 2011

2
Goal
• To explore – the associations between the variables under
consideration in terms of latent “factors” around which the potential variables group
– their relative contribution to those factors– the degree to which these variables describe
a single unmeasured underlying parameter (ie. underservice)

3
County-level Measures• Population to provider ratio (all provider types, age-adjusted)
• Average travel time to nearest primary care provider
• Population density
• Hispanic ethnicity
• Non-White race
• Non-White race or Hispanic ethnicity
• Limited English proficiency• Linguistically isolated• Standardized mortality ratio (SMR)• Infant mortality rate (IMR)• Low birthweight (LBW)
• Disability (age-adjusted)• Diabetes (age-adjusted)• Pap testing (age-adjusted)• Social deprivation index
(SDI)• High school drop outs• Poverty• Single mother households• Unemployed• Uninsured• Low income• Medicaid• ACSC hospitalizations• Fair/poor health• No usual provider (age-
adjusted)

4
County-level measures included in final EFA
• Population to provider ratio (all provider types, age-adjusted)
• Average travel time to nearest primary care provider
• Population density
• Non-White race
• Limited English proficiency
• Standardized mortality ratio (SMR)
• Low birthweight (LBW)
• Diabetes (age-adjusted)
• Social deprivation index (SDI)
o Comprised of high school dropouts, unemployment, single mother households, and poverty
• Uninsured
• ACSC hospitalizations

5
County-level measures also considered• Hispanic ethnicity
• Highly correlated with LEP, so didn’t include
• LEP vs. linguistic isolation
• Highly correlated - can’t include both. Run both ways – did not appreciably alter results; only showing results from LEP for the purposes of this presentation.
• LBW vs. IMR
• Run both ways – did not appreciably alter results; only showing results from LBW for the purposes of this presentation.
• Pap testing and disability measures from the BRFSS
• Large number of counties with missing data
• Low income and Medicaid - Highly correlated with SDI
• Components of SDI vs. the SDI itself
• Components highly correlated with other factors (ie, poverty)

6
Descriptives of Variables for Counties Included in EFA (n=2856)
N Range Mean Std. Dev
LBW 2915 (3.4-15.8) 8.0 1.9
Diabetes (adj) 3141 (0.03-0.18) 0.1 0.0
SMR 3141 (0.36-2.67) 1.1 0.2
ACSC hospitalizations 3069 (24.0-319.0) 90.6 36.1
Population density 3143 (0.0-71,505.7) 260.0 1,762.3
Average travel time 3140 (0.17-174.8) 12.4 13.0
Population-to-provider ratio 3074 (105.4-202,500.0) 2,059.7 4,634.5
Non-White 3137 (0.0-0.9) 0.2 0.2
Uninsured 3140 (0.07-0.5) 0.2 0.1
LEP 3137 (0.0-0.6) 0.0 0.1
SDI 3137 (1.3-10.4) 7.3 1.9
Single mother household 3140 (2.3-44.6) 14.9 5.8
Poverty 3140 (0.0-56.7) 13.7 6.3
High school dropouts 3140 (3.0-65.3) 22.6 8.8
Unemployment 3138 (2.4-28.2) 9.0 3.2

7
Three Factors Identified (n=2856 counties)
Total variance explained by three factors = 55%
Factor 1 Factor 2 Factor 3
Diabetes (age-adjusted) 0.83 0.08 -0.10
SMR 0.80 0.09 -0.06
SDI 0.75 0.17 0.28
LBW 0.72 -0.06 0.15
ACSC hospitalizations 0.56 0.24 -0.06
Population density 0.04 -0.74 0.03
Average population-weighted travel time 0.08 0.71 -0.03
Population-to-Provider ratio (all providers; age-adjusted)
0.16 0.42 -0.01
LEP -0.28 -0.22 0.74
Uninsured 0.13 0.36 0.64
Non-White race 0.42 -0.25 0.60
Variance explained post-extraction & rotation 28% 14% 13%

8
Rotated Factor Loadings of County-level Measures
-1.00
-0.80
-0.60
-0.40
-0.20
0.00
0.20
0.40
0.60
0.80
0.00 0.10 0.20 0.30 0.40 0.50 0.60 0.70 0.80 0.90
Factor 1 Factor 2
Travel Time
Pop Density
P2P ratio Diabetes
SDISMR
LBWACSC
-0.20
-0.10
0.00
0.10
0.20
0.30
0.40
0.50
0.60
0.70
0.80
-0.40 -0.20 0.00 0.20 0.40 0.60 0.80 1.00
Factor 1 Factor 3
LEP
UninsuredNon-White
Diabetes
SDI
SMR
LBW
ACSC
-1.00
-0.80
-0.60
-0.40
-0.20
0.00
0.20
0.40
0.60
0.80
-0.20 0.00 0.20 0.40 0.60 0.80
Factor 2 Factor 3
Travel Time
Pop Density
P2P ratio
LEP
Uninsured
Non-White

9
Health status/SDI Factor Independent vs. Included with other variables
Independent With other factors/
variables
Diabetes (age-adjusted) 0.81 0.83
SMR 0.82 0.80
SDI 0.77 0.75
LBW 0.67 0.72
ACSC hospitalizations 0.62 0.56
Variance explained post-extraction &/or rotation 55% 28%
In general, similar factor loadings for the health status/SDI factor whether looked at independently or with barriers and population-related variables.

10
Barriers FactorIndependent vs. Included with other variables
Independent With other factors/
variables
LEP 0.71 0.74
Non-White 0.55 0.64
Uninsured 0.50 0.60
Variance explained post-extraction &/or rotation 35% 13%
In general, similar factor loadings for the barriers factor whether looked at independently or with health status, SDI and population-related variables.

11
Population-related FactorIndependent vs. Included with other variables
Independent With other factors/
variables
Population density -0.74
Average travel time (population weighted) 0.71
Population-to-Provider ratio 0.42
Variance explained post-extraction &/or rotation 14%
Population-related factor is unreliable when looked at independently.

12
Discussion Points/Next Steps
• How to handle population-related variables (pop-to-provider, pop density, travel time)
• Other variables to include in EFA (e.g., linguistic isolation vs. LEP)
• How to apply for weighting

13
Methods• Exploratory Factor Analysis (EFA)
– The number of latent factors was unknown and had to be determined from the data
• Assumptions– Variables should be correlated, but not highly
correlated (rho>0.9)• Determinant was greater than 0 (0.012)
– Variables have a normal distribution • Natural log transformed LEP, non-White, SMR, ACSC, average
travel time, population density, and Pop-to-provider ratio
– Factor analysis is appropriate to use with these data • Kaiser-Meyer-Olkin Measure of Sampling Adequacy = 0.75
• Bartlett’s Test of Sphericity, p<0.0001
14
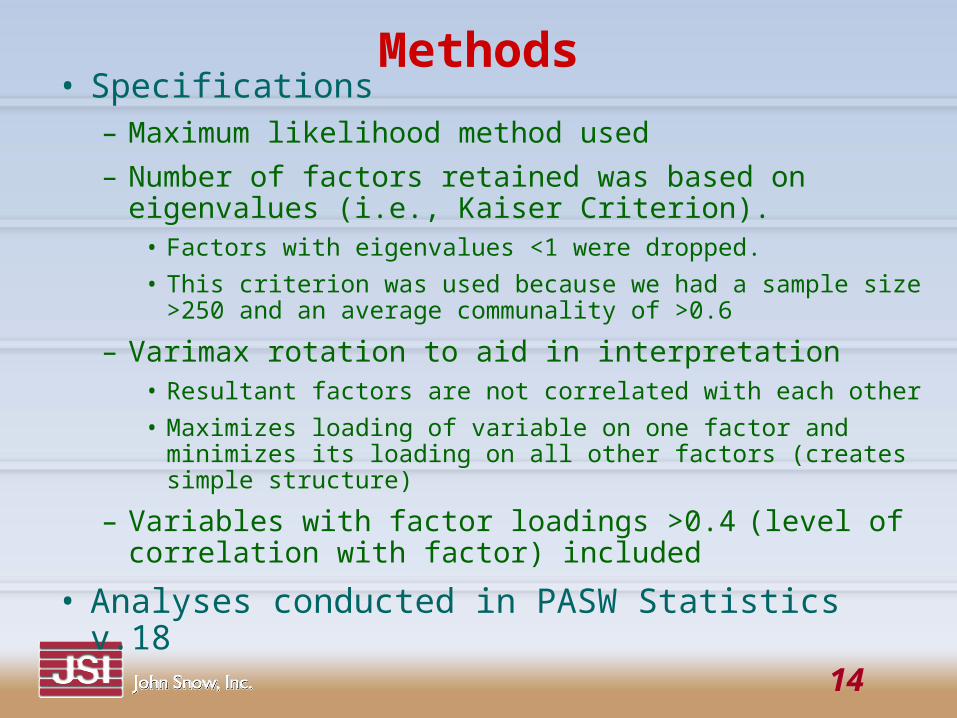
Methods• Specifications
– Maximum likelihood method used
– Number of factors retained was based on eigenvalues (i.e., Kaiser Criterion).
• Factors with eigenvalues <1 were dropped.
• This criterion was used because we had a sample size >250 and an average communality of >0.6
– Varimax rotation to aid in interpretation• Resultant factors are not correlated with each other
• Maximizes loading of variable on one factor and minimizes its loading on all other factors (creates simple structure)
– Variables with factor loadings >0.4 (level of correlation with factor) included
• Analyses conducted in PASW Statistics v.18

15

16
CommunalitiesProportion of variation in variable explained by the 3
factors
Extraction
Average population-weighted travel time 0.51
Population density 0.56
Diabetes 0.71
ACSC 0.38
SMR 0.65
Non-White 0.60
LBW 0.55
Population-to-Provider (all providers) 0.20
Uninsured 0.57
SDI 0.68
LEP 0.67

17
Regression coefficients(for scoring purposes)
Factor
Factor 1 Factor 2 Factor 3
Avg Pop weighted travel time -0.02 0.34 0.02
Pop Density 0.06 -0.40 -0.02
Diabetes 0.31 -0.03 -0.11
ACSC 0.09 0.06 -0.03
SMR 0.25 -0.01 -0.07
Non-White 0.11 -0.15 0.28
LBW 0.18 -0.07 0.04
Population to Provider ratio 0.01 0.12 0.01
Uninsured -0.02 0.22 0.33
SDI 0.23 0.07 0.15
LEP -0.11 -0.08 0.47