Embed Size (px)
Citation preview
Results for the year ended31 December 2016
Capita plc2 March 2017

Agenda
Introduction Ian Powell, Chairman
Capita repositioned Andy Parker, Chief Executive
Financial results Nick Greatorex, Group Finance Director
Business development Chris Sellers, Group Business Development Director
Summary & outlook Andy Parker, Chief Executive
2 | 2016 financialresults

Introduction
Ian PowellChairman
3 | 2016 financialresults

Capita repositioned
Andy ParkerChief Executive
4 | 2016 financialresults
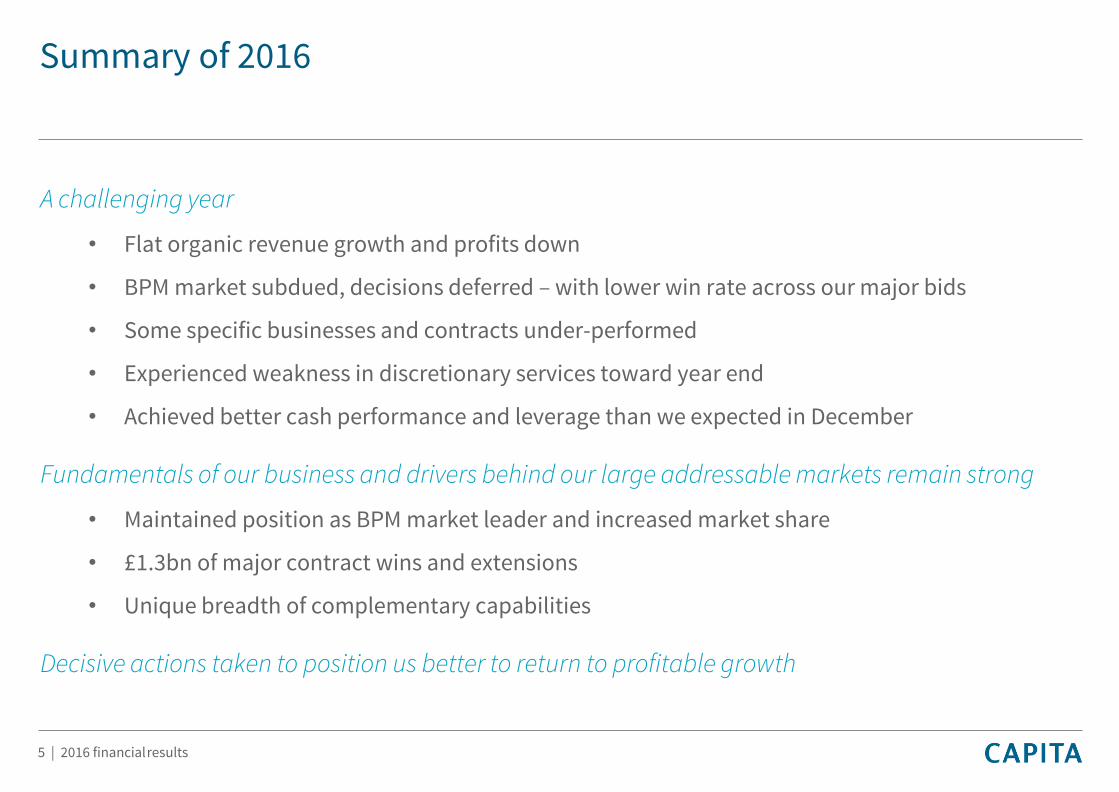
Summary of 2016
A challenging year
• Flat organic revenue growth and profits down
• BPM market subdued, decisions deferred – with lower win rate across our major bids
• Some specific businesses and contracts under-performed
• Experienced weakness in discretionary services toward year end
• Achieved better cash performance and leverage than we expected in December
Fundamentals of our business and drivers behind our large addressable markets remain strong
• Maintained position as BPM market leader and increased market share
• £1.3bn of major contract wins and extensions
• Unique breadth of complementary capabilities
Decisive actions taken to position us better to return to profitable growth
5 | 2016 financialresults
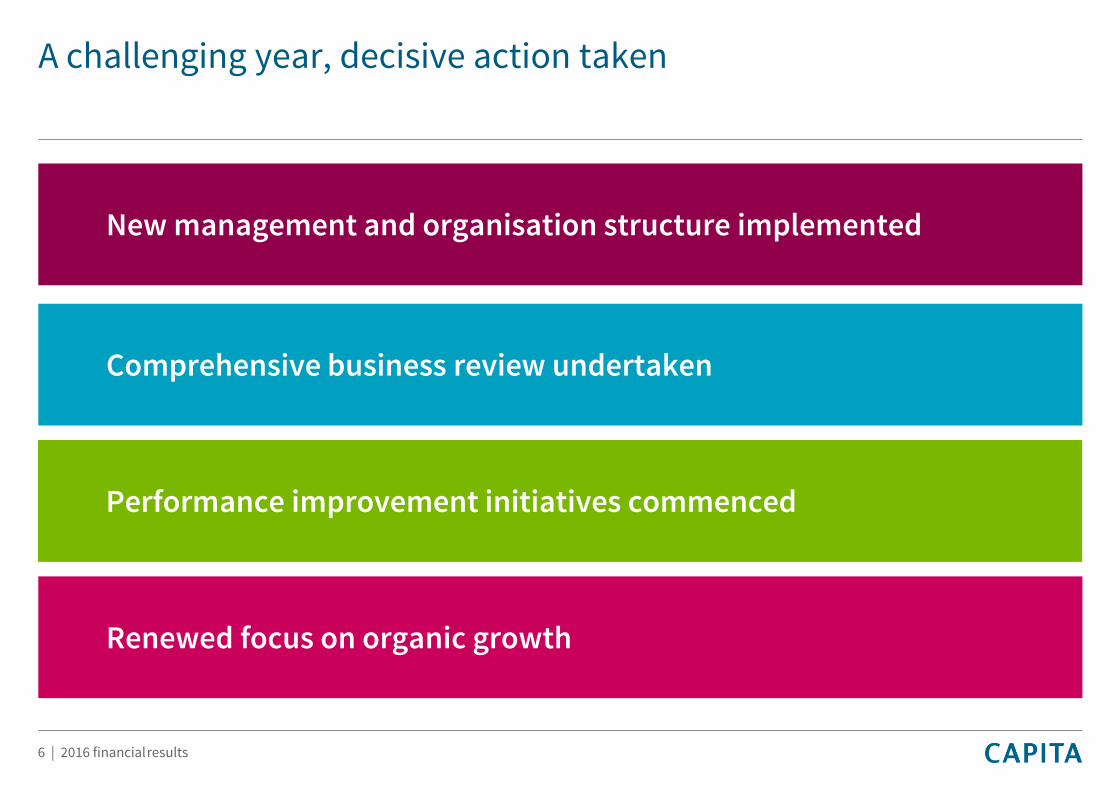
A challenging year, decisive action taken
New management and organisation structure implemented
Comprehensive business review undertaken
Renewed focus on organic growth
Performance improvement initiatives commenced
6 | 2016 financialresults

A challenging year, decisive action taken
New management and organisation structure implemented
Repositioned Executive Board: increased transparency and oversight, with renewed focus on consistent operational and customer service excellence
Clear and simple structure: 6 divisions, client facing, shorter reporting lines
7 | 2016 financialresults

Group Operations & Performance
Director
A robust management structure
Clear strategic leadership, greater transparency, shorter reporting lines, renewed focus on operations and customer service excellence and growth generation across the Group.
8 | 2016 financialresults
Business Sales Teams
Group Board
Chief Executive
Group Finance Director
Group Business Development
Director
Executive Officers
x6
Divisional Finance
Directorsx6
Major Business
Development Team
Reporting directly to Chief
Executive
Operational consistency,
customer service excellence and
employee advocacy
Focused and targeted on key
financial metrics
Sales directed and overseen
centrally to drive organic growth throughout the
Group

External facingExternal & internal facing External & internal facing
A simplified, focused business
PRIVATE SECTOR PARTNERSHIPSBusiness process and customer management services for corporates,
primarily across telecoms, retail, automotive, travel and insurance and retail banking sectors. Includes UK & European operations and near and
offshore centres
PUBLIC SERVICE PARTNERSHIPSBusiness process and customer management specialist services for
public sector organisations including defence, health and welfare benefit administration and real estate and property services
PROFESSIONAL SERVICESHigh growth commercial businesses and partnership models and
services to attract develop and retain workforces
ASSET SERVICESShareholder solutions, fund solutions, trust and corporate services and
debt and banking solutions
DIGITAL & SOFTWARE SOLUTIONSSector and task
specific software and services,
digital data and emerging
technology solutions
IT SERVICESSpecialist network
solutions, IT management and
infrastructure services and IT
equipment solutions
*
*Disposal in progress
9 | 2016 financialresults

A challenging year, decisive action taken
Comprehensive business review undertaken
Clear focus on core service offering: technology enabled business process management (BPM) and customer management services
Strategic disposals: Commenced disposal process - the majority of Capita Asset Services division and specialist recruitment businesses
10 | 2016 financialresults

A simplified, focused business
Strategic disposals in progress to re-focus business on core BPM
Majority of Capita Asset Services division
• Stand-alone, with little integration or synergies with other divisions, growing into areas at the edge of our risk appetite
• Disposing of shareholder, fund, debt and corporate, private client and trust services
• Retaining mortgage administration and retail banking
• Around £300m revenue and £60m operating profit in 2016
• Good initial interest, with potential buyers meetings commencing, disposal process on track and expected to complete in H2 2017, post regulatory approvals
Specialist recruitment
• Disposal process to exit our education, health and social care businesses
• Main brands are CER, Monarch, Team24 and Medicare First
• Well positioned businesses in their markets, received unsolicited approaches
• Around £160m revenue and £8m operating profit in 2016
• Expected to complete mid-year• Remain committed to our other workplace service
businesses
11 | 2016 financialresults

A challenging year, decisive action taken
Performance improvement initiatives commenced
Short and longer term initiatives to address our cost base
Cost action: c£60m identified and in progress
Addressing IT Services division: new management and turnaround plan
12 | 2016 financialresults

A challenging year, decisive action taken
Renewed focus on organic growth
Big addressable BPM and customer management markets remain
Group Business Development teams re-shaped to evolving needs of clients in their dynamically changing markets
Renewed focus on driving divisional growth across trading businesses
13 | 2016 financialresults

A challenging year, decisive action taken
Capita is repositioned to exploit our fundamental strengths and return to sustainable, profitable growth
• Repositioned Executive Board: increased transparency and oversight, with renewed focus on consistent operational and customer service excellence
• Clear and simple structure: 6 divisions, client facing, shorter reporting lines
• Clear focus on core service offering: technology enabled business process management (BPM) and customer management services
• Strategic disposals: Commenced disposal process - the majority of Capita Asset Services division and specialist recruitment businesses
• Big addressable BPM and customer management markets remain
• Group Business Development teams re-shaped to evolving needs of clients in their dynamically changing markets
• Renewed focus on driving divisional growth across trading businesses
• Short and longer term initiatives to address our cost base
• Cost action: c£60m identified and in progress
• Addressing IT services division: new management and turnaround plan
New management and organisation structure implemented
Comprehensive business review undertaken
Renewed focus on organic growth
Performance improvement initiatives commenced
14 | 2016 financialresults

15 | 2016 financialresults
Financial Results
Nick GreatorexGroup Finance Director

Underlying income statement
16 | 2016 financialresults
£mYear
endedDecember
2016*
£m Year
ended December
2015**
Change
Revenue 4,898 4,674 4.8%
Operating profit 541 639 (15.3)%
Interest (66) (53) 24.5%
Profit before tax 475 586 (18.9)%
Profit attributable to shareholders
377 468 (19.4)%
Basic eps (pence) 56.67 70.73 (19.9)%
Final dividend (pence) 20.60 21.20 (2.8)%
Total dividend (pence) 31.70 31.70 -
• Underlying revenue increased by 4.8%
• Underlying profit before tax of £475m
after accrued income write-down of £40m
• Final dividend 20.60p, total dividend in
line with 2015
*Excludes non-underlying items which include: intangible amortisation, impairments, net contingent consideration movements, other non-recurring items, non-cash mark to market finance costs**The 2015 comparatives include the results from businesses disposed in 2016 and exclude the results from a justice business which was held for sale in 2015 and moved back into underlying in 2016 following an incomplete sale process
Revenue
17 | 2016 financialresults
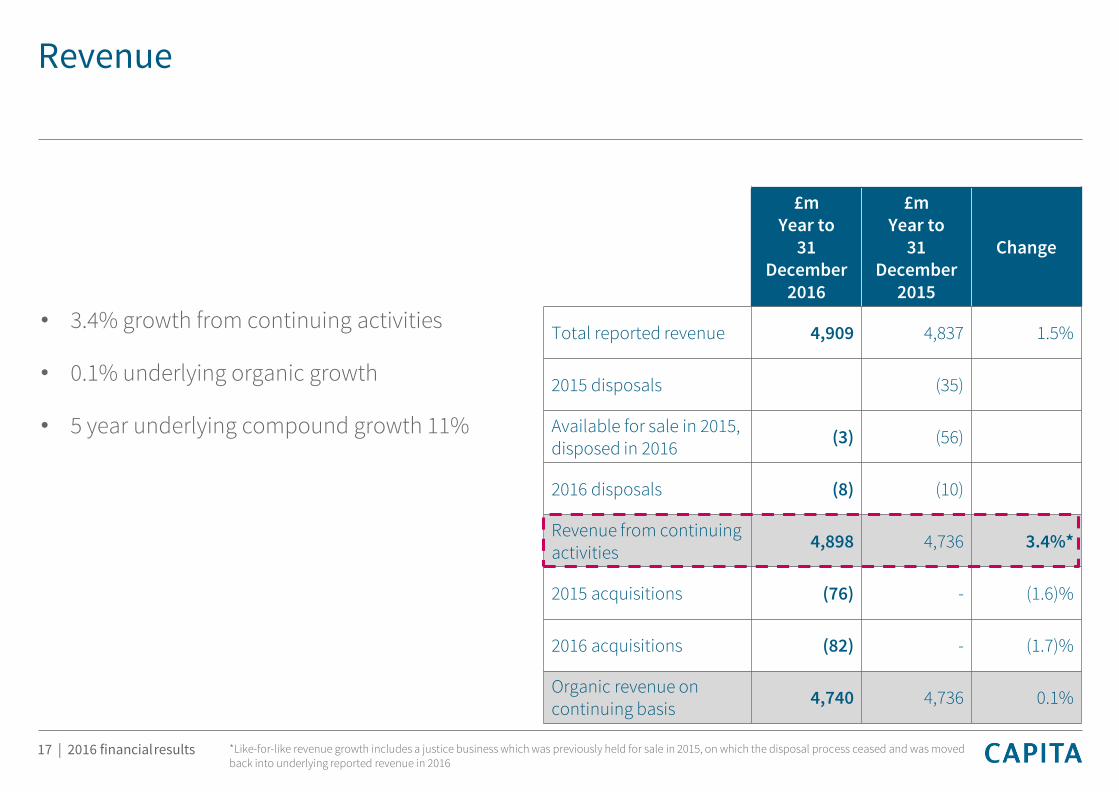
• 3.4% growth from continuing activities
• 0.1% underlying organic growth
• 5 year underlying compound growth 11%
£m Year to
31 December
2016
£m Year to
31 December
2015
Change
Total reported revenue 4,909 4,837 1.5%
2015 disposals (35)
Available for sale in 2015, disposed in 2016
(3) (56)
2016 disposals (8) (10)
Revenue from continuing activities
4,898 4,736 3.4%*
2015 acquisitions (76) - (1.6)%
2016 acquisitions (82) - (1.7)%
Organic revenue on continuing basis
4,740 4,736 0.1%
*Like-for-like revenue growth includes a justice business which was previously held for sale in 2015, on which the disposal process ceased and was moved back into underlying reported revenue in 2016

Revenue guidance H1 2016 v H2 2016
18 | 2016 financialresults
FY guidance at Interim H2 movement FY actual
Business Development 6.0% (1.2%) 4.8%
Attrition (3.4%) -% (3.4%)
Divisional Organic 1.4% (2.7%) (1.3%)
Organic growth 4.0% (3.9%) 0.1%
Acquisition 3.9% (0.6%) 3.3%
Total 7.9% (4.5%) 3.4%

Revenue 2015 bridge to 2016
19 | 2016 financialresults
H1: 2,401
H1: 2,205
4,740
(49)
(27)(22)
(67)
(24)
H2: 2,531
4824
3552
2015 Revenue Technology &
Enterprise
Solutions
Specialist
Recruitment
Property Services Customer
management
step-downs
Transport for
London
PCSE
transformation
Property
commercialisation
Group Business
Development
Other
(mainly Central
Government)
Europe £158m Acquired
Revenue
2016 Revenue
FY: 4,898
FY: 4,736158
H2: 2,497
34
£m
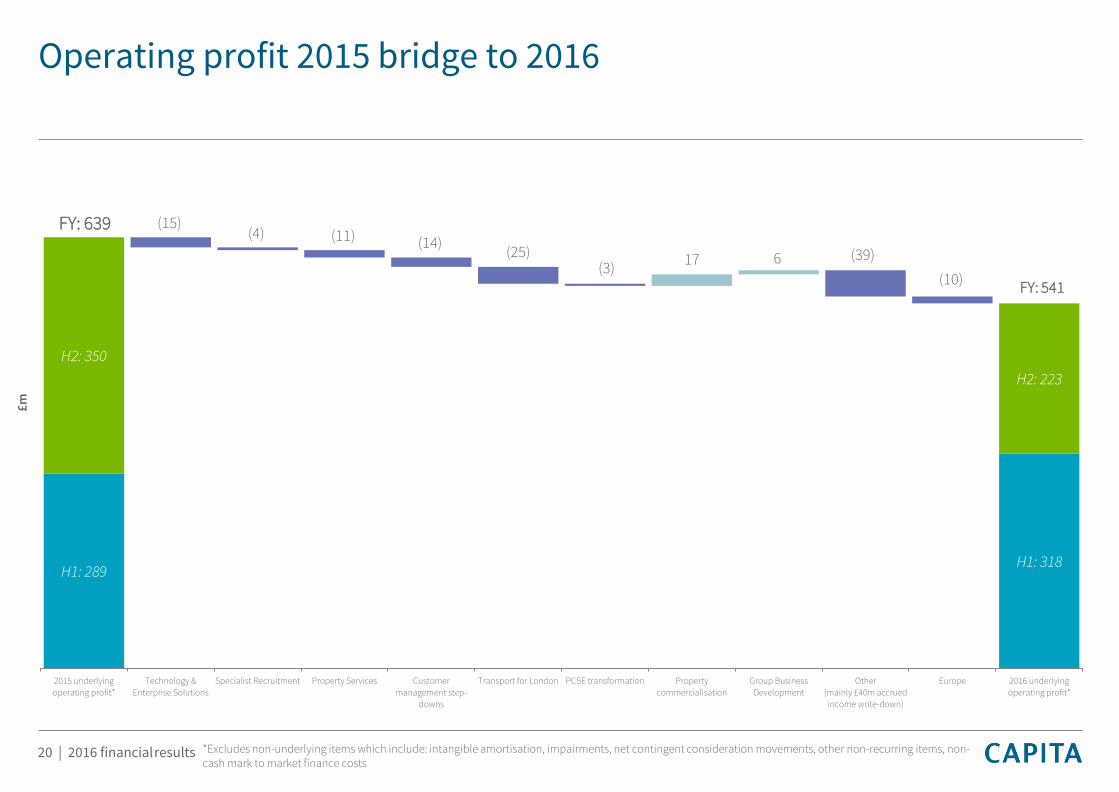
Operating profit 2015 bridge to 2016
20 | 2016 financialresults
H1: 289H1: 318
H2: 350
H2: 223
(15)(4) (11) (14)
(25)(3)
(39)17 6
(10)
2015 underlying
operating profit*
Technology &
Enterprise Solutions
Specialist Recruitment Property Services Customer
management step-
downs
Transport for London PCSE transformation Property
commercialisation
Group Business
Development
Other
(mainly £40m accrued
income write-down)
Europe 2016 underlying
operating profit*
FY: 541
FY: 639
*Excludes non-underlying items which include: intangible amortisation, impairments, net contingent consideration movements, other non-recurring items, non-cash mark to market finance costs
£m

Underlying operating profit bridge to reported operating profit
21 | 2016 financialresults
541
148
(59)
(58)
(81)
(18) (152)
(13)(9) 3 (6)
Underlying
operating profit
Exceptional
restructuringexpense
Contract asset
write-down
Impairments of
goodwill &acquired
intangibles
Co-op Amortisation Asset Services
settlementprovision
Acquisition
costs
Business exits Other Reported
operating profit
Non-cash itemsRecurring items
Exceptional items
£m
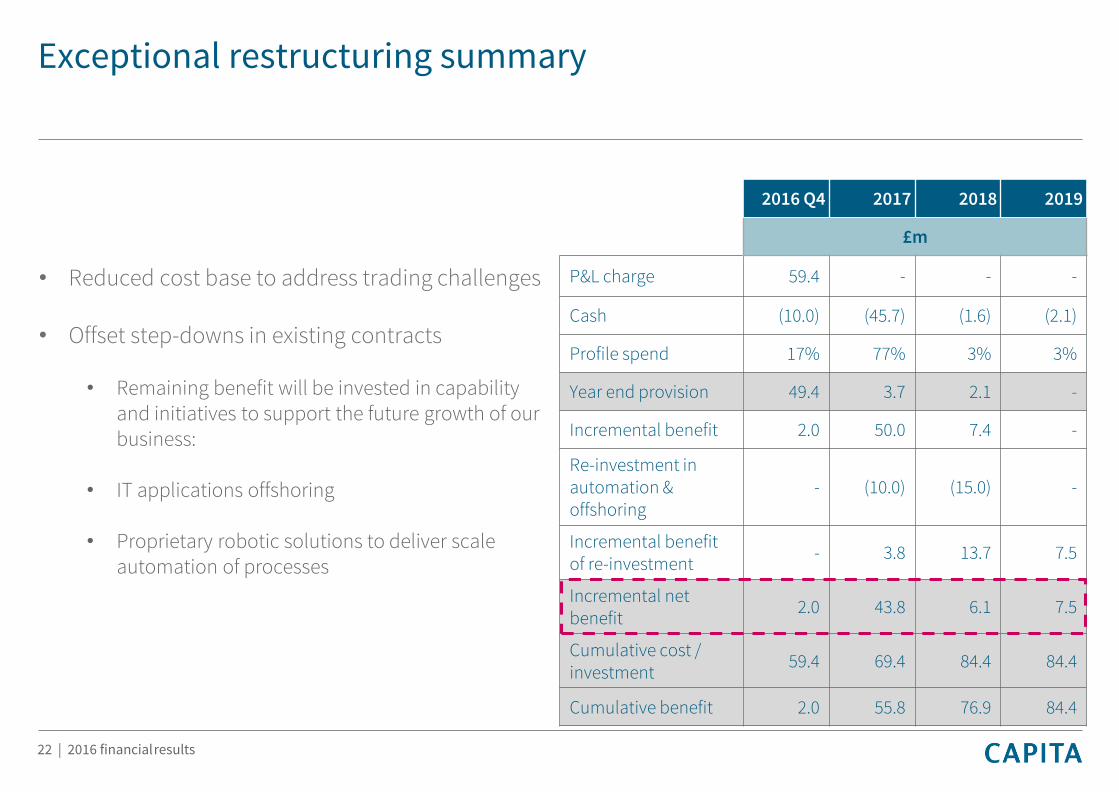
Exceptional restructuring summary
22 | 2016 financialresults
2016 Q4 2017 2018 2019
£m
P&L charge 59.4 - - -
Cash (10.0) (45.7) (1.6) (2.1)
Profile spend 17% 77% 3% 3%
Year end provision 49.4 3.7 2.1 -
Incremental benefit 2.0 50.0 7.4 -
Re-investment in automation & offshoring
- (10.0) (15.0) -
Incremental benefit of re-investment
- 3.8 13.7 7.5
Incremental net benefit
2.0 43.8 6.1 7.5
Cumulative cost / investment
59.4 69.4 84.4 84.4
Cumulative benefit 2.0 55.8 76.9 84.4
• Reduced cost base to address trading challenges
• Offset step-downs in existing contracts
• Remaining benefit will be invested in capability and initiatives to support the future growth of our business:
• IT applications offshoring
• Proprietary robotic solutions to deliver scale automation of processes

Underlying operating margin*
23 | 2016 financialresults
• £25m TfL penalty
• Step downs in O2 contract
• Historic accrued income write-down
• Worsening in 2016 H2 trading performance against H1
13.513.7**
11.1***
12.6
12.9
13.2***
11.9
2014 2015 2016
Op
era
tin
g m
arg
in %
Full year
Half year
FY16 excluding historic
accrued income write-down
*Excludes non-underlying items which include: intangible amortisation, impairments, net contingent consideration movements, other non-recurring items, non-cash mark to market finance costs**The 2015 FY comparative includes the results from businesses disposed in 2016 and excludes the results from a justice business which was held for sale in 2015 and moved back into underlying in 2016 following an incomplete sale process***The 2016 values are on a continuing basis i.e. excluding the businesses disposed of in 2016
0
100
200
300
400
500
600
700
Digital &
Software
Solutions
Integrated
Services
Commercial
Services
Strategic
Services
LGH&P Workplace
Services
IT Enterprise
Services
Asset Services Customer
Management
Capita Europe Insurance &
Benefits
Services
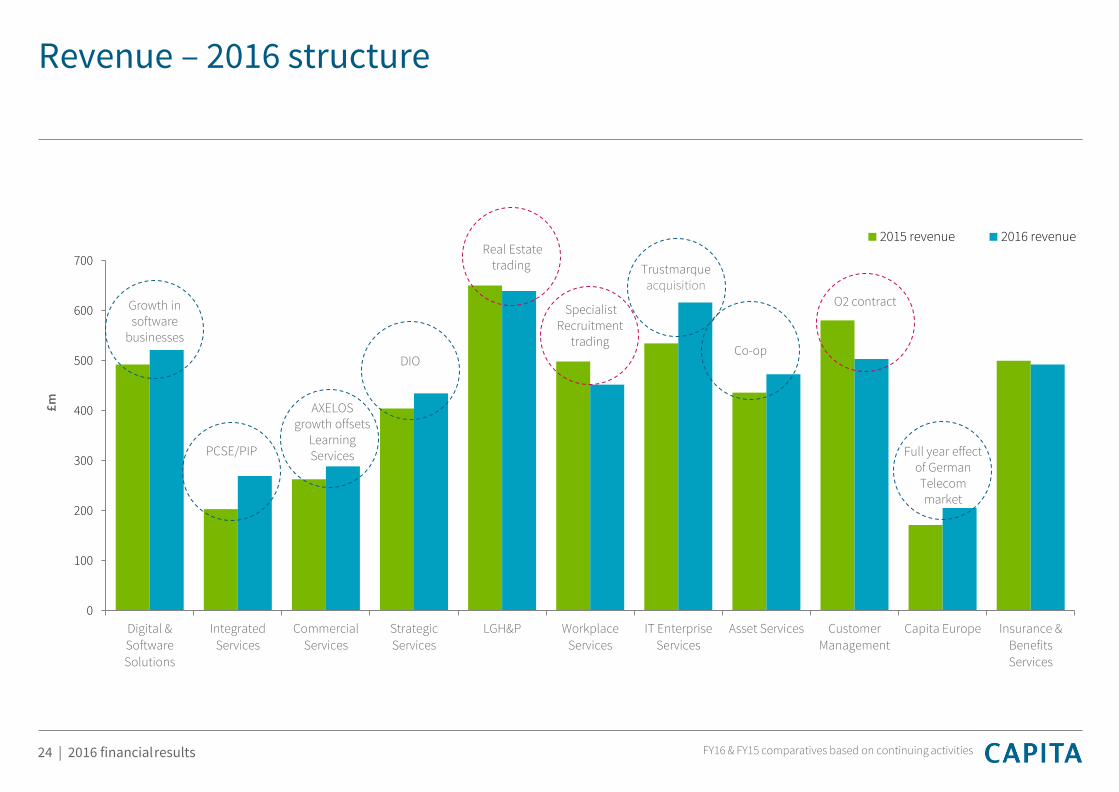
2015 revenue 2016 revenueReal Estate
trading
Specialist Recruitment
trading
DIO
Trustmarque acquisition
Revenue – 2016 structure
24 | 2016 financialresults
PCSE/PIP
Co-op
Full year effect of German Telecom market
AXELOSgrowth offsets
Learning Services
O2 contract
£m
Growth in software
businesses
FY16 & FY15 comparatives based on continuing activities

-10
10
30
50
70
90
110
130
150
Digital &
Software
Solutions
Integrated
Services
Commercial
Services
Strategic
Services
LGHP Workplace
Services
IT Enterprise
Services
Asset Services Customer
Management
Capita Europe Insurance &
Benefits
Services
£m
Profit 2015
Profit 2016
Technology & Enterprise
Solutions
Underlying operating profit – 2016 structure
25 | 2016 financialresults
TfL
Real Estate trading
Co-op
German Telecommarket
Specialist Recruitment
trading
O2 Contract
AXELOSgrowth offsets
Learning Services
DIO
Cost reduction
Growth in software
businesses
FY16 & FY15 comparatives based on continuing activities before the write-down of accrued income
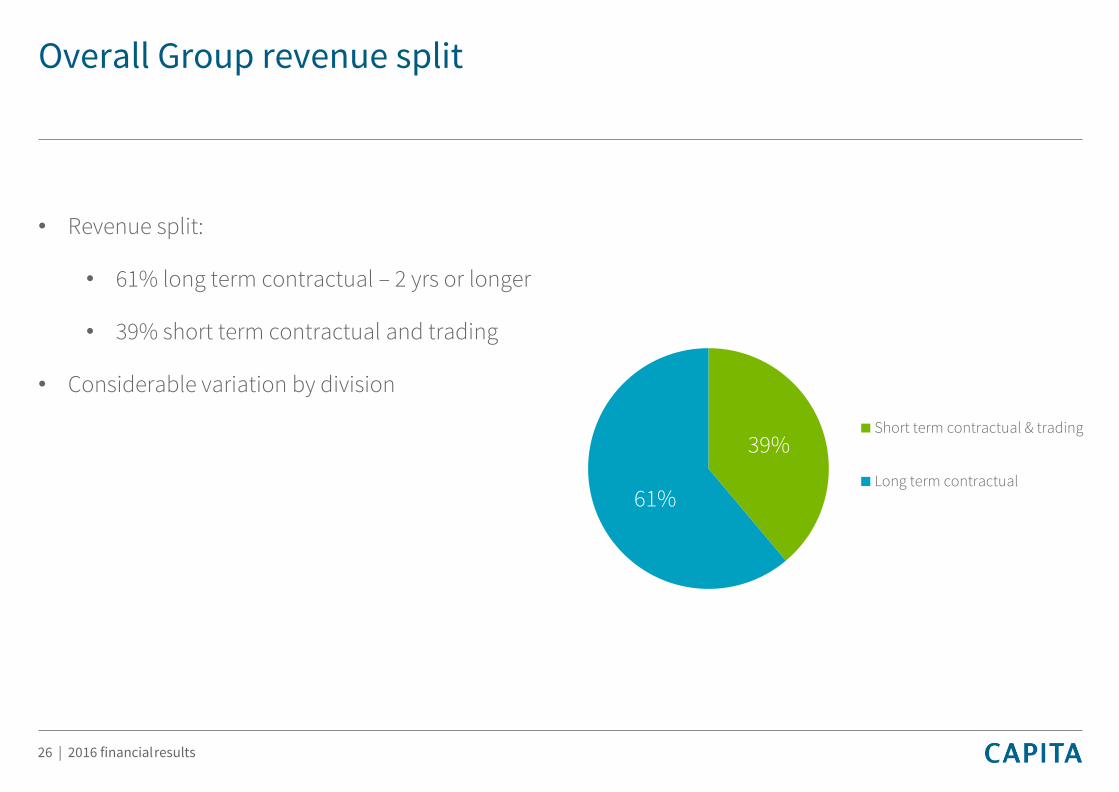
Overall Group revenue split
26 | 2016 financialresults
39%
61%
Short term contractual & trading
Long term contractual
• Revenue split:
• 61% long term contractual – 2 yrs or longer
• 39% short term contractual and trading
• Considerable variation by division

Private Sector Partnerships
27 | 2016 financialresults
• O2 step downs impacted revenue and profit
• Reduction in Europe profit
• Mobilcom-debitel contract win to commence in 2017
• Low ROCE driven by L&P and Europe
• Profitability should improve through automation and offshoring
13%
87%
Revenue split
Short term contractual & trading
Long term contractual
FY16 FY15 Movement
Revenue £1,492m £1,527m (2.3%)
Profit £138m £161m (14.3%)
Margin 9.2% 10.5% (1.3%)
ROCE 9.4% 10.3% (0.9%)
Customer Management Europe
Employee Benefits
FY16 & FY15 comparatives based on continuing activities before the write down of accrued income
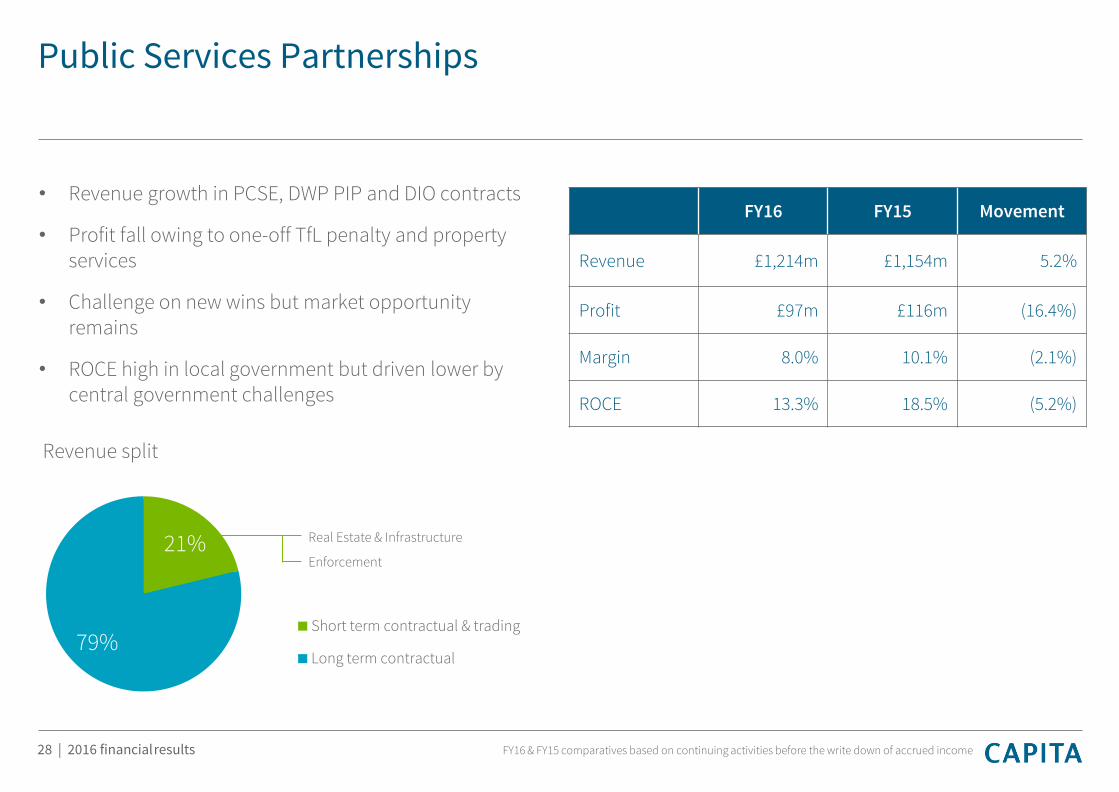
Public Services Partnerships
28 | 2016 financialresults
• Revenue growth in PCSE, DWP PIP and DIO contracts
• Profit fall owing to one-off TfL penalty and property services
• Challenge on new wins but market opportunity remains
• ROCE high in local government but driven lower by central government challenges
FY16 FY15 Movement
Revenue £1,214m £1,154m 5.2%
Profit £97m £116m (16.4%)
Margin 8.0% 10.1% (2.1%)
ROCE 13.3% 18.5% (5.2%)
17%
83%
Revenue split
Short term contractual & trading
Long term contractual
Real Estate & Infrastructure
Enforcement21%
79%
FY16 & FY15 comparatives based on continuing activities before the write down of accrued income

Professional Services
29 | 2016 financialresults
• Growth in AXELOS and Parking Services
• Profit decline in recruitment offset by property commercialisation
• Sale of Specialist Recruitment will remove £160m of trading revenue
• ROCE has benefitted from profit growth
FY16 FY15 Movement
Revenue £728m £739m (1.5%)
Profit £104m £97m 7.2%
Margin 14.3% 13.1% 1.2%
ROCE 13.6% 13.0% 0.6%
17%
83%
Revenue split
Short term contractual & trading
Long term contractual
Learning Services
Travel, Parking, Constructionline
Specialist Recruitment
76%
24%
FY16 & FY15 comparatives based on continuing activities before the write down of accrued income

Digital & Software Solutions
30 | 2016 financialresults
• Strong growth in Software Services
• Continued investment in market leading proprietary software solutions
• ROCE will lift as recent investments start to pay back
FY16 FY15 Movement
Revenue £419m £394m 6.3%
Profit £129m £122m 5.7%
Margin 30.8% 31.0% (0.2%)
ROCE 17.6% 18.9% (1.3%)
17%
83%
Revenue split
Short term contractual & trading
Long term contractual
Software
Applications Support
Evolvi Rail
63%
37%
FY16 & FY15 comparatives based on continuing activities before the write down of accrued income

IT Services
31 | 2016 financialresults
• Increased revenue due to June acquisition of Trustmarque
• Profit decrease attributable to adverse performance in Enterprise Services and Technology Solutions
• Significant restructuring of management team and operating model
• ROCE will recover driven by networks business
FY16 FY15 Movement
Revenue £753m £649m 16.0%
Profit £54m £66m (18.2%)
Margin 7.2% 10.2% (3.0%)
ROCE 8.7% 14.3% (5.6%)
17%
83%
Revenue split
Short term contractual & trading
Long term contractual
66%
34%
Trustmarque
Technology Solutions
Enterprise Services
FY16 & FY15 comparatives based on continuing activities before the write down of accrued income

Asset Services
32 | 2016 financialresults
• Revenue driven by Debt Solutions
• Lower profit in Debt Solutions and Shareholder Solutions
• Declining ROCE due to increased investment
• Disposal process expected to conclude in H2 2017
FY16 FY15 Movement
Revenue £292m £273m 7.0%
Profit £59m £72m (18.1%)
Margin 20.2% 26.4% (6.2%)
ROCE 10.1% 13.3% (3.2%)
17%
83%
Revenue split
Short term contractual & trading
Long term contractual
Registration
Treasury & Fund Solutions36%
64%
FY16 & FY15 comparatives based on continuing activities before the write down of accrued income

ROCE bridge*
33 | 2016 financialresults
• Organic decline in profit excludes accrued income write-down
15.0%
13.5%
12.7%
0.0%
(1.0)%
(0.3)%(0.2)%
(0.8)%
FY 2015 Organic decline Working capital Capex Acquisitions FY 2016 excluding
accrued income write-down
Accrued income
write-down
FY 2016
* Based on underlying profit

ROCE on acquisition activity since 2013
34 | 2016 financialresults
Division 2016 Return on
acquisitions
Private Sector Partnerships 4.7%
Public Service Partnerships 18.7%
Professional Services 11.7%
Digital & Software Solutions 12.9%
IT Services 13.3%
Asset Services 23.0%
Total 11.1%
Year acquired Total acquisition value
ROCE(2016)
2016 £95m Excluded < 1 year
2015 £373m 9.3%
2014 £349m 11.6%
2013 £284m 13.0%
Total £1,101m 11.1%
ROCE Split Capital employed ROCE(2016)
Acquired (2013-15) £1,006m 11.1%
Organic and pre-2013 £2,481m 13.3%
Total £3,487m 12.7%
• 11.1% return on £1.1bn spend over last 4 years
• Returns increasing over time
• Most divisions generate post tax return close to double Group cost of capital

Underlying cash flow from operating activities
35 | 2016 financialresults
£m Year to 31 December
2016
£m Year to 31 December
2015
Operating profit* 541*** 639**
Depreciation 99 95
Movements in underlying provisions
2 6
Movements in working capital 115 (61)
Other (7) 8
Cash flow from operations 750 687
Operating cash conversion 139% 108%
• Operating activities generated cash conversion of 139%
• Working capital decreased through reducing long term WIP and re-negotiating terms on certain contracts
*Excludes non-underlying items which include: intangible amortisation, impairments, net contingent consideration movements, other non-recurring items, non-cash mark to market finance costs**The 2015 comparatives include the results from businesses disposed in 2016 and exclude the results from a justice business which was held for sale in 2015 and moved back into underlying in 2016 following an incomplete sale process***The 2016 values are on a continuing basis i.e. excluding the businesses disposed of in 2016

Underlying cash flow statement
36 | 2016 financialresults
Cash Flow£m Year to
31 December2016
£m Year to 31 December
2015
Cash flow from operations 750 687
Net interest paid (59) (47)
Taxation paid (64) (94)
Capital expenditure (154) (198)
Underlying free cash flow 472 348
Non-underlying expenses (63) (43)
Free cash 409 305
Net acquisition of subsidiary undertakings and businesses
(96) (443)
Equity dividends paid (219) (201)
Other 10 3
Cash flow before financing 104 (336)
Financed by£m Year to
31 December2016
£m Year to 31 December
2015
Net Bond issues (includes USD & EURO issues)
(29) (400)
New term debt (350) -
Movement in cash and cash equivalents 468 57
Other 15 7
Movement in net debt 104 (336)
• Capital expenditure reduced by £44m to £154m
• Net debt decreased by £104m

Underlying free funds from operations (FFO) and free cash flows (FCF)
37 | 2016 financialresults
364
519546
644687
750
157
307 312
368348
472
2011 2012 2013 2014 2015 2016
£m
Operating cash
FCF
• Cash generation continues to be strong - £750m
• Free cash flow increased to £472m

Working capital
38 | 2016 financialresults
December 2016(£m)
December 2015(£m)
Working capital investment*
Private Sector Partnerships 131 186
Public Services Partnerships 107 133
Professional Services 117 112
Digital & Software Solutions (1) 21
IT Services 103 76
Asset Services 96 90
Total 553 618
*(Accrued income + gross amounts due from customers on construction contracts + trade receivables – deferred income)
• Solid progress made on driving down working capital
• High level of deferred income in software and local government
• Focus on accrued income and customer payment terms gave benefit of £90m
• This focus will continue as we strive to reduce the cost of working capital across the Group

Capital expenditure
39 | 2016 financialresults
36
71
91
198
4455 55
154
Discretionary Contractual Maintenance Total
2015
2016
£m
Disciplined approach to capital expenditure:
• Contain and refocus on value for money
• Must meet Group investment hurdle criteria
• Continued focus on software products
• Discretionary spend in 2016 major programmes:
• SIMS 8
• Constructionline
• Orbit
• ChooseCare
• 2017 broadly in line with 2016
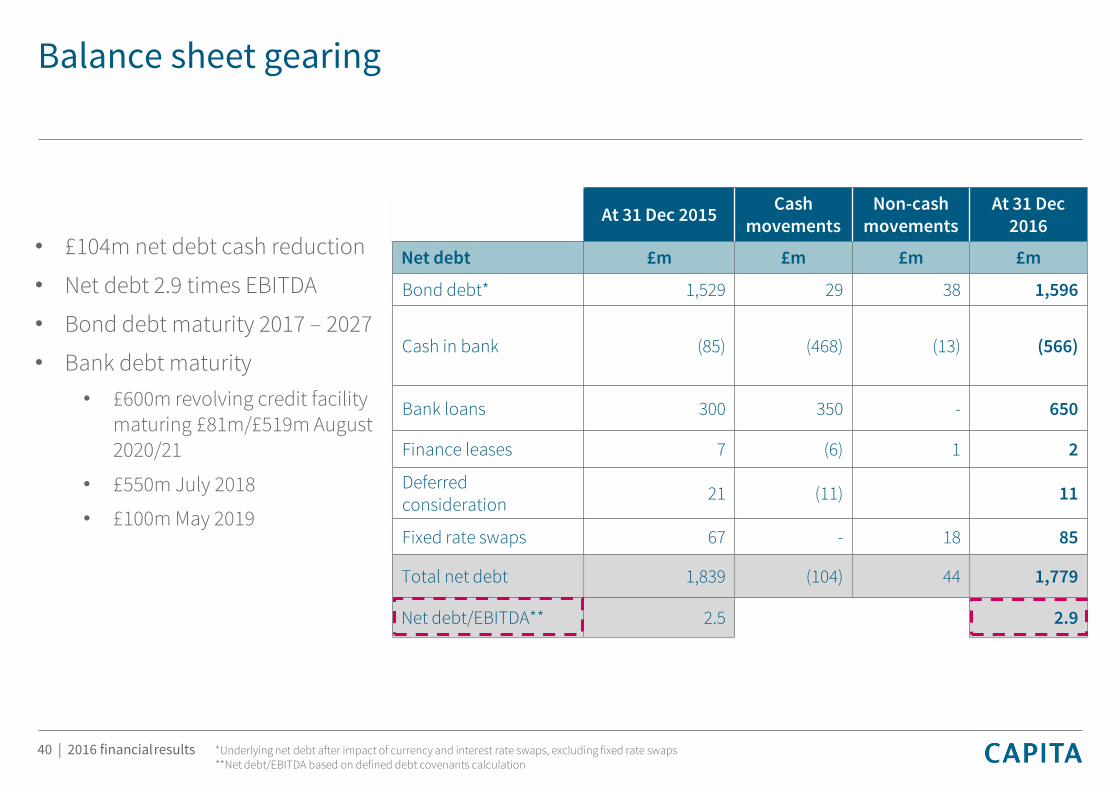
Balance sheet gearing
40 | 2016 financialresults
At 31 Dec 2015Cash
movementsNon-cash
movementsAt 31 Dec
2016
Net debt £m £m £m £m
Bond debt* 1,529 29 38 1,596
Cash in bank (85) (468) (13) (566)
Bank loans 300 350 - 650
Finance leases 7 (6) 1 2
Deferred consideration
21 (11) 11
Fixed rate swaps 67 - 18 85
Total net debt 1,839 (104) 44 1,779
Net debt/EBITDA** 2.5 2.9
• £104m net debt cash reduction
• Net debt 2.9 times EBITDA
• Bond debt maturity 2017 – 2027
• Bank debt maturity
• £600m revolving credit facility maturing £81m/£519m August 2020/21
• £550m July 2018
• £100m May 2019
*Underlying net debt after impact of currency and interest rate swaps, excluding fixed rate swaps**Net debt/EBITDA based on defined debt covenants calculation

Interest and debt profile
• Net debt benefitting from cash conversion
• Higher coupon € debt and fixed rate swaps leading to increased 2016 interest cost
• 2017 interest cost expectation is £70m-£75m, dependent on level of disposals and acquisitions
41 | 2016 financialresults
2014 2015 2016
Interest rate % 2.5 2.9 3.3
US$ PPN 1,122 1,312 1,340
€ PPN - 217 257
Term debt 300 300 650
Other (incl. cash) 69 10 (468)
Total net debt 1,491 1,839 1,779

Dividend
42 | 2016 financialresults
• Final dividend of 20.60p
• Results in total dividend of 31.70p
• 2017 dividend to be maintained
• Rebuild dividend cover in the medium term
• Dividend payments to be based on organic growth thereafter

IFRS 15 - Revenue from contracts with customers
43 | 2016 financialresults
• Anticipate early adoption of IFRS 15 in 2017, with comparative restatement
• Expect most significant impact on those major contracts with multiple components (e.g. transformation, transition and BAU)
• Ongoing detailed review of the Group’s contracts (engaged with Big 4 for technical advice and resource)
• Disclosure of order book and how the Group earns income from contracts it undertakes
• We will provide a reasonable estimate of the effect of IFRS 15 once detailed reviews completed

Pension liability
• Scheme liability of £1.5bn
• Deficit moved from £188m to £345m in 2016 owing to change in actuarial assumptions
• The income statement charge is expected to increase by £12m in 2017
• The next valuation date is April 2017, with expected increases in cash contributions from June 2018
44 | 2016 financialresults

Revenue booked in 2017
45 | 2016 financialresults
FY (£m) %
Acquisitions
2016 48 1.0%
2017 12 0.2%
Acquired total 60 1.2%
Organic
Attrition (217) (4.4%)
Growth 2016 102 2.1%
Growth 2017 42 0.8%
Organic total (73) (1.5%)
Total (13) (0.3%)
• 1.2% Growth from acquisitions
• Attrition on large contracts (4.4%)
• Attrition offset by 2.9% growth from contracts won
• Net organic attrition (1.5%)

2017 financial guidance
46 | 2016 financialresults
Revenue Current position – net organic attrition of (1.5%)
Trading performanceH1 expected to be slightly weaker than H2 2016, excluding write down of accrued incomeFY expected to be similar to 2016, before increased pension charge and disposals
Pension (IAS19) £12m increase in pension charges, including £2m finance costs
Net interest Expected to be in range of £70m to £75m
Tax rate Underlying rate expected to be 18.5%
Cash flowLower operating cash conversion
Capital expenditure broadly in line with 2016
Leverage H1: Around 2.9x
Disposals Businesses held for sale at the next reporting date to be excluded from underlying

Key finance initiatives
47 | 2016 financialresults
Cash & Working Capital
Continued push on long term and trading accrued income, with planned improvement to cash forecasting to reduce use of receivable funding
Capex
Reinforce controls and discipline
Contracts
Improved contract lifetime reviews ahead of IFRS 15 adoption
Finance Transformation
Building on improved month end process with longer term transformation
Procurement
Building on 2016 centralisation with new system development in 2017
Property
Centralised in 2016 – now working on long term consolidation plan

Summary
• De-leveraging plan progressing well
• Strong cash flow from operations
• Benefits in 2017 from restructuring costs
• Continued disciplined approach to capital allocation
48 | 2016 financialresults

49 | 2016 financialresults
Business Development
Chris SellersGroup Business Development Director

Organic growth generation
Group Business Development
• Team, evolved, increased, agile• Closely aligned to and feeding market facing divisions• Directing and supporting divisional sales teams
DIVISIONS
Additional Campaigns
• High value, replicable solutions• Work alongside model• Applies to new and existing clients
DIGITAL & SOFTWARE SOLUTIONS
Business Sales Teams
IT SERVICES
Business Sales Teams
PRIVATE SECTOR PARTNERSHIPS
Business Sales Teams
PUBLIC SERVICE PARTNERSHIPS
Business Sales Teams
PROFESSIONAL SERVICES
Business Sales Teams
Major Outsourcing Deals
• Technology enabled partnerships• JV or transfer to Capita • Public and Private sectors
50 | 2016 financial results
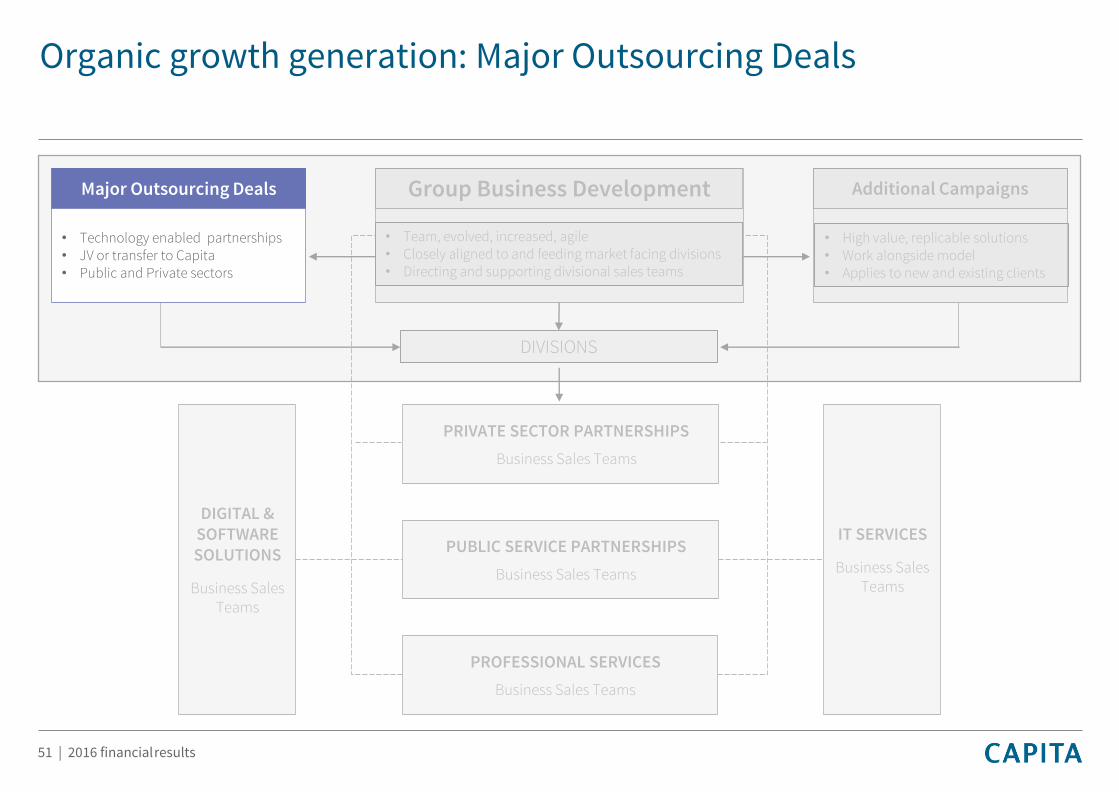
Organic growth generation: Major Outsourcing Deals
Group Business Development
• Team, evolved, increased, agile• Closely aligned to and feeding market facing divisions• Directing and supporting divisional sales teams
DIVISIONS
Additional Campaigns
• High value, replicable solutions• Work alongside model• Applies to new and existing clients
DIGITAL & SOFTWARE SOLUTIONS
Business Sales Teams
IT SERVICES
Business Sales Teams
PRIVATE SECTOR PARTNERSHIPS
Business Sales Teams
PUBLIC SERVICE PARTNERSHIPS
Business Sales Teams
PROFESSIONAL SERVICES
Business Sales Teams
Major Outsourcing Deals
• Technology enabled partnerships• JV or transfer to Capita • Public and Private sectors
51 | 2016 financialresults

Major Outsourcing Deals continue to drive growth
Today’s pipeline Visible bid decisions
• £3.8bn (26 deals)
• Average term: 7yrs
• 78% new 22% rebids/extensions
• 61% private 39% public
2017• H1: 25%• H2: 55%
2018• H1: 20%
£17bnPipeline & Prospects
2017
2016
• £3.8bn (37 deals) (Dec 16)
• Average term: 7yrs
• 15 deals won in 2016
£1.34bn (2015: £1.8bn)
46% new54% rebids/extensions
60% private 40% public
Win rate 1 in 3
52 | 2016 financialresults
£ (‘000,000)
Pipeline Prospect
Key
0 3000 6000 9000
Asset
Services
DSS
IT Services
Professional
Services
Public Services
Partnership
Private Sector
Partnerships

Organic growth generation: Additional Campaigns
Group Business Development
• Team, evolved, increased, agile• Closely aligned to and feeding market facing divisions• Directing and supporting divisional sales teams
DIVISIONS
Additional Campaigns
• High value, replicable solutions• Work alongside model• Applies to new and existing clients
DIGITAL & SOFTWARE SOLUTIONS
Business Sales Teams
IT SERVICES
Business Sales Teams
PRIVATE SECTOR PARTNERSHIPS
Business Sales Teams
PUBLIC SERVICE PARTNERSHIPS
Business Sales Teams
PROFESSIONAL SERVICES
Business Sales Teams
Major Outsourcing Deals
• Technology enabled partnerships• JV or transfer to Capita • Public and Private sectors
53 | 2016 financial results
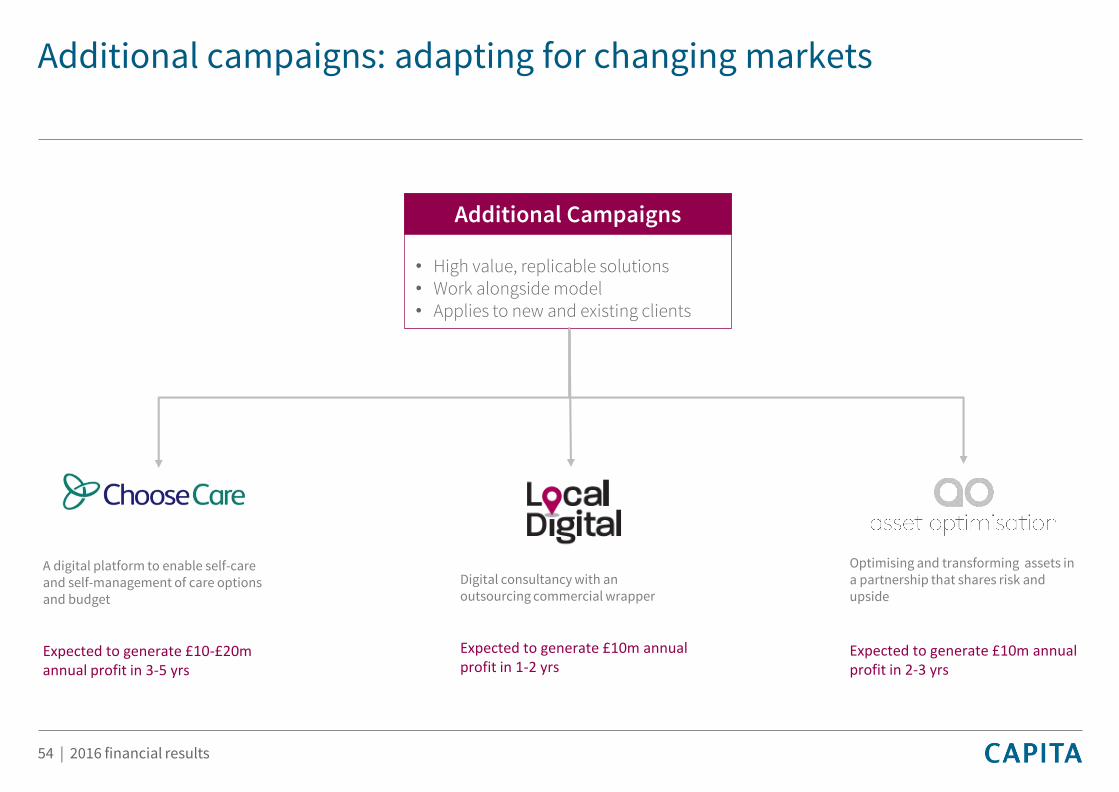
Additional campaigns: adapting for changing markets
A digital platform to enable self-care and self-management of care options and budget
Expected to generate £10-£20m annual profit in 3-5 yrs
Digital consultancy with an outsourcing commercial wrapper
Expected to generate £10m annual profit in 1-2 yrs
54 | 2016 financial results
Additional Campaigns
• High value, replicable solutions• Work alongside model• Applies to new and existing clients
Optimising and transforming assets in a partnership that shares risk and upside
Expected to generate £10m annual profit in 2-3 yrs

Future buying behaviours in sectors
Division Sector Major deals:propensity to buy
Campaigns:propensity to buy
Public Sector Partnerships
Local government
Public Sector Partnerships
Health
Public Sector Partnerships
Central government
Public Sector Partnerships
Defence
Private Sector Partnerships
Telco and media
Private Sector Partnerships
Financial services
Private Sector Partnerships
Germany
Professional Services
Science
55 | 2016 financial results
• Strong propensity to buy major deals in private sector
• Central government remains quiet
• Significant opportunities for campaigns in local government

A strong and flexible engine for growth
Group Business Development
• Team, evolved, increased, agile• Closely aligned to and feeding market facing divisions• Directing and supporting divisional sales teams
DIVISIONS
Additional Campaigns
• High value, replicable solutions• Work alongside model• Applies to new and existing clients
DIGITAL & SOFTWARE SOLUTIONS
Business Sales Teams
IT SERVICES
Business Sales Teams
PRIVATE SECTOR PARTNERSHIPS
Business Sales Teams
PUBLIC SERVICE PARTNERSHIPS
Business Sales Teams
PROFESSIONAL SERVICES
Business Sales Teams
Major Outsourcing Deals
• Technology enabled partnerships• JV or transfer to Capita • Public and Private sectors
56 | 2016 financial results

Summary and outlook
Andy ParkerChief Executive
57 | 2016 financialresults

Summary and outlook
2016 actions completed
• New organisation and management structure• Business review – BPM focus• Cost and performance improvement initiatives• Reshaped sales efforts
2017 actions in progress
• Focus on operational and service excellence• Complete disposals and cost actions• Deleveraging - robust balance sheet base to pursue growth
strategy• Rebuild confidence and trust
Capita repositioned
• A simpler business, a clear strategy focussed on BPM and renewed organic growth• Leading competitive positions in large addressable markets• Unique breadth of strong capabilities – creating major client solutions + fuelling growth in all divisional businesses• Deploying our talent and technology to make processes smarter, organisations more efficient and customer
experience better
58 | 2016 financialresults
2018 and beyond: return to profitable growth

59 | 2016 financialresults

60 | 2016 financialresults
Appendices

Revenue – 2017 structure
61 | 2016 financialresults
1,527
1,154
739
394
649
273
1,492
1,214
728
419
753
292
Private Sector
Partnerships
Public Service
Partnerships
Professional Services Digital & Software
Solutions
IT Services Asset Services
2015 revenue
2016 revenue
£m
FY16 & FY15 comparatives based on continuing activities

Underlying operating profit – 2017 structure
62 | 2016 financialresults
161
116
97
122
6672
138
97104
129
5459
Private Sector
Partnerships
Public Service
Partnerships
Professional Services Digital & Software
Solutions
IT Services Asset Services
£m
Profit 2015
Profit 2016
FY16 & FY15 comparatives based on continuing activities before the write-down of accrued income

2016 operating profit bridge – accrued income write downs
63 | 2016 financialresults
Underlying operating profit before accrued income
write downs (£m)
Accrued income writedowns (£m)
Underlying operating profit after accrued income write
downs (£m)
Private Sector Partnerships 138 (32) 106
Public Service Partnerships 97 (2) 95
Professional Services 104 - 104
Digital & Software Solutions 129 - 129
IT Services 54 (6) 48
Asset Services 59 - 59
Total 581 (40) 541

Net return on capital*
64 | 2016 financialresults
FY 2012 FY 2013 FY 2014 FY 2015 FY 2016
Operating profit (£m)
467 517 576 639** 541***
Average capital (£m) 2,348 2,701 3,180 3,461 3,487
Tax (%) 20.5 19.0 18.5 18.5 18.5
Return on capital employed (%)
15.8 15.5 14.8 15.0 12.7
Returns significantly in excess of cost of capital
15.8 15.514.8 15.0
12.7
7.07.7
7.2 7.2 7.11
2012 2013 2014 2015 2016
Underlying ROCE including disposed and held fordisposal assets
WACC
*Excludes non-underlying items which include: intangible amortisation, impairments, net contingent consideration movements, other non-recurring items, non-cash mark to market finance costs**The 2015 comparatives include the results from businesses disposed in 2016 and exclude the results from a justice business which was held for sale in 2015 and moved back into underlying in 2016 following an incomplete sale process***The 2016 values are on a continuing basis i.e. excluding the businesses disposed of in 2016
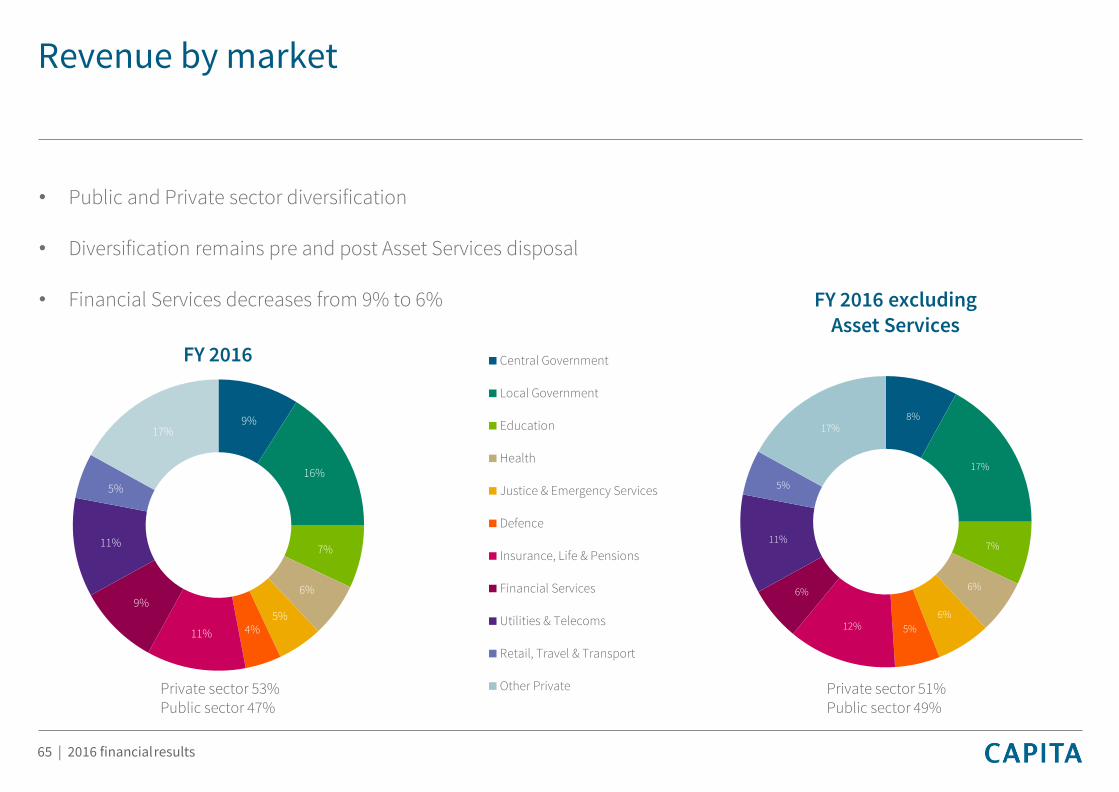
Revenue by market
65 | 2016 financialresults
• Public and Private sector diversification
• Diversification remains pre and post Asset Services disposal
• Financial Services decreases from 9% to 6%
9%
16%
7%
6%
5%4%11%
9%
11%
5%
17%
8%
17%
7%
6%
6%
5%12%
6%
11%
5%
17%
Central Government
Local Government
Education
Health
Justice & Emergency Services
Defence
Insurance, Life & Pensions
Financial Services
Utilities & Telecoms
Retail, Travel & Transport
Other Private
FY 2016 excluding Asset Services
FY 2016
Private sector 53%Public sector 47%
Private sector 51%Public sector 49%

2016 Major contracts
2016 major contracts >£25m Duration (Yrs) Value (£m)
Vale & South 5 LA Bid - 5 councils 9 139
Blackburn with Darwen Council 5 60
Volkswagen ext. 2 27
Life & Pensions ext. 9 25
Debenhams – Early renewal 7 72
Salford Urban Vision ext. 3 60
Financial Services ext. 3 75
DWP PIP ext. 2 210
Tesco Mobile 5 140
NHS BSA ext. 2 34
The Pensions Regulator ext. 3 37
Three 7 70
mobilcom-debitel 7 197
SSET 7 45
BBC TVL ext. 2 n/a
66 | 2016 financial results
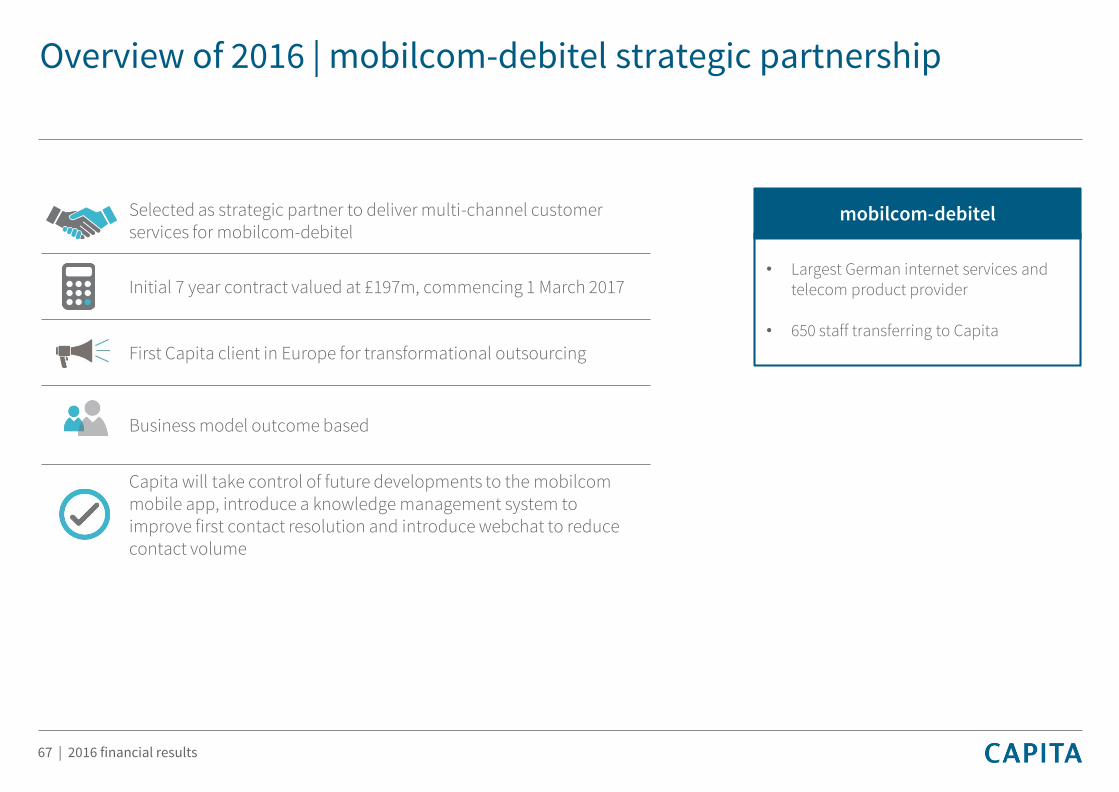
Selected as strategic partner to deliver multi-channel customer services for mobilcom-debitel
Initial 7 year contract valued at £197m, commencing 1 March 2017
First Capita client in Europe for transformational outsourcing
Business model outcome based
Capita will take control of future developments to the mobilcommobile app, introduce a knowledge management system to improve first contact resolution and introduce webchat to reduce contact volume
Overview of 2016 | mobilcom-debitel strategic partnership
mobilcom-debitel
• Largest German internet services and telecom product provider
• 650 staff transferring to Capita
67 | 2016 financial results
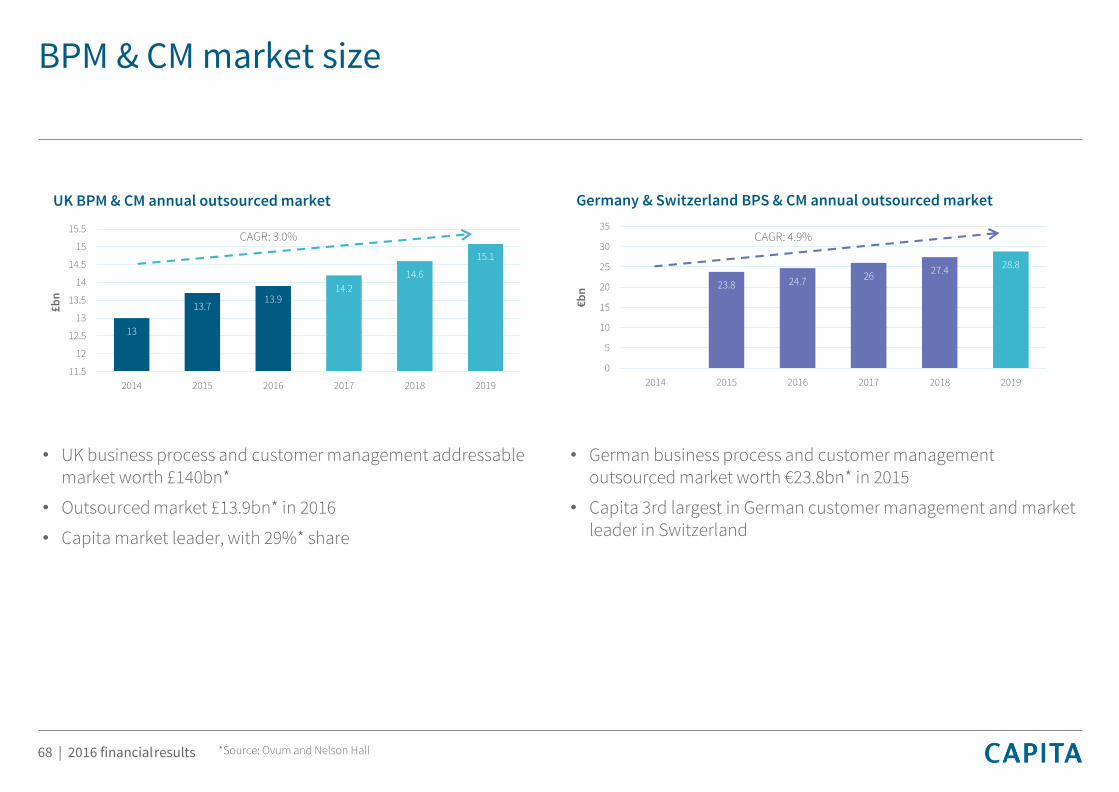
BPM & CM market size
68 | 2016 financialresults
13
13.713.9
14.2
14.6
15.1
11.5
12
12.5
13
13.5
14
14.5
15
15.5
2014 2015 2016 2017 2018 2019
£b
n
CAGR: 3.0%
UK BPM & CM annual outsourced market
23.8 24.7 2627.4
28.8
0
5
10
15
20
25
30
35
2014 2015 2016 2017 2018 2019
€b
n
CAGR: 4.9%
Germany & Switzerland BPS & CM annual outsourced market
• UK business process and customer management addressable market worth £140bn*
• Outsourced market £13.9bn* in 2016
• Capita market leader, with 29%* share
• German business process and customer management outsourced market worth €23.8bn* in 2015
• Capita 3rd largest in German customer management and market leader in Switzerland
*Source: Ovum and Nelson Hall

Competitive position and credentials
69 | 2016 financialresults
Private Sector Public Sector Digital & Software IT ServicesProfessional
Services
Market position
UK BPM Market leader
Share ~24%
Customer Management(CM)
UK market leaderGerman top 3
Swiss market leader
UK BPMMarket leader
Share ~41%
UK SoftwareTop 5
UK IT ServicesTop 10
Niche strengths in workplace services, business travel, best practice, science and
supply chain
Market size
UK BPM & CM£10bn
German CMEUR3bn
UK BPM£3.9bn
UK Enterprise software £10bn
UK IT Services £27bn
Credentials
Strong track record of transforming and managing major contracts, utilising technology, process re-engineering and wider capabilities100m customer contacts per annum21m life policies and 550 occupational pension schemes, with 4m members, administeredBenefits solution used by 0.5m client employeesManage £20bn of commercial property assets
Leading supplier of software, digital & IT solutions More than 22,000 schools use SIMS, our management information software155 local authorities use our revenues and benefits softwareLeading provider of control room, case management and mobile solutions to justice/emergency servicesLocal government IT solutions support 28.5 million residents
3m accommodation nights booked per annum FERA analyses over 90,000 samples a yearIT and project management methodologies used in >150 countries