Embed Size (px)
Citation preview

Bloomsbury Publishing Plc
RESULTS FOR THE YEAR ENDED 28 FEBRUARY 2017

BLOOMSBURY
2
Growth of Harry Potter
brand
Strong financial position
Growing academic digital
revenues
Editorial and design excellence
Innovative & entrepreneurial global publisher
Rich in intellectual
property
DIVIDEND GROWTH
2004 - 2017

BUSINESS HIGHLIGHTS
3
Financial performance:
• Excellent revenue growth of 15% (9% at
constant exchange rates) driven by
Children’s with Harry Potter and Sarah J. Maas
• Profit reflects Bloomsbury 2020 investment
and end of term of Qatar services
contract as previously announced
Bloomsbury 2020:
• Digital resource revenues grow 50%
• On track – four major new digital resources
launched
Excellent cash generation, with
£15.5 million cash at 28/2/17
Dividend increases by 5%

Notes: 1. The above results are Adjusted by excluding highlighted items, which are shown on slide 26 2. The effective tax rate is the adjusted rate used to calculate adjusted EPS. The reported rate in the period is 22.1% (2015/16: 6.3%) 3. CER is results at constant exchange rates calculated by applying average exchange rates for 2015/16 to 2016/17 results 4. Cash flow conversion is cash generated from operating activities less capex divided by reported operating profit
FINANCIAL HIGHLIGHTS
4
£m
2016/17
2015/16 Change
% Change CER
%
Revenue 142.6 123.7 15% 9%
Operating profit margin 8.4% 10.6%
Pre-tax profit 12.0 13.0 -8%* -14%*
Effective tax rate2 21.4% 12.2%
Diluted EPS 12.63p 15.24p -17%* -24%*
Net cash 15.5 5.2 200% 185%
Full year dividend
per share
6.7p 6.4p 5% 5%
Cash flow conversion 180% 56%
* Reflects £0.6m Bloomsbury 2020 investment and end of Qatar contract term in line with our market guidance in December 2015 and May 2016

RESULTS BY PUBLISHING DIVISION
5
60% 40%
Non-Consumer profits include Family Law acquisition, effect of end of Qatar contract and incremental Bloomsbury 2020 investment
£m Consumer Non-Consumer
Revenues 2016/17 85.4 57.2
Revenues 2015/16 66.4 57.3
Change % 28% -
Operating profit 2016/17 7.9 4.1
Operating profit 2015/16 6.0 7.1
Change % 33% -43%
Operating profit margin 2016/17 9% 7%
Revenues as % total:

REVENUE BY SUB-DIVISION
6
£m 2016/17 2015/16 Change %
Adult Trade 29.5 28.7 3%
Children’s Trade 55.9 37.7 48%
Total Consumer 85.4 66.4 28%
Academic & Professional 36.9 36.6 1%
Special Interest 18.4 17.5 5%
Content Services 1.9 3.2 (42%)
Total Non-Consumer 57.2 57.3 -
Total revenue 142.6 123.7 15%
Adult 21%
A&P 26%
Special Interest
13% 18.2
0.7 0.3
1.0
(1.4)
2015/16 Children's Adult A&P SpecialInterest
ContentServices
2016/17
123.7 142.6
Total revenue £m
Revenue growth in all sub-divisions except Content Services –
where revenues grew 9% excluding Qatar contract
Children’s
39%
Content
Services
1%
2017

REVENUE MIX
7
£m 2016/17 2015/16 Change %
Print 117.3 98.1 20%
E-books 12.1 12.4 (2%)
Digital resources 3.9 2.6 50%
Digital 16.0 15.0 7%
Total book sales 133.3 113.1 18%
Copyright licences 7.5 7.9 (4%)
Publishing services 1.0 2.0 (50%)
Other 0.8 0.7 15%
Rights and Services 9.3 10.6 (13%)
Total revenue 142.6 123.7 15%
Print books 88% of total book sales –
continued demand for print format
UK industry e-book sales down 11%
calendar 2016 (Source: UK PA)
Digital resources revenues grow ahead
of expectations
Qatar contract term ends £1.5m effect
year on year
82%
11%
7% Print
Digital
Rights &Services

GEOGRAPHIC REVENUES
8
New York
Revenues up
1%
London
Revenues up
11%
New Delhi
Revenues up
30%
Sydney
Revenues up
26%
Note: The above revenue increases are in local currency
Revenues increase 9% using constant exchange rates

STRONG BALANCE SHEET
9
£m 28.2.17 29.2.16
Goodwill & acquired intangibles 57.2 58.2
Internally generated intangibles 6.6 6.3
Property, plant & equipment 2.2 2.5
Net deferred tax assets 2.6 0.3
Working capital (ex tax) 57.0 60.6
Tax liabilities (2.6) 0.0
Retirement benefit obligations (0.2) (0.2)
Other 1.0 0.1
123.8 127.8
Net cash 15.5 5.2
Net assets 139.3 133.0
£2.6m asset recognised on
temporary difference on US
stock valuation (see tax
liabilities)
Includes £24.8m advances and
£28.6m stock.
£55.8m at CER. Stock reduces
£1.3m, 5% at CER
Incl. £2.6m liability over three
years, see net deferred tax
assets above
Working capital reduction has
contributed to strong cash
generation

CASH FLOW MOVEMENT
10
9,402
15,951
4,602
5,779 48
(2,895) (1,009)
Operating profit Non-cash items Working capital Capex Tax paid Net interestreceived
Free cash flow

CASH FLOW PRIORITIES
11
Free cash flow priorities
• Fund growth through:
o Organic development – Total capex
£2.9 million, is 2% of revenues
o Acquisitions
• Deliver a progressive and
sustainable dividend
• Maintain a strong balance sheet
– cash at year end £15.5 million
Dividend
• Full year dividend increasing by
5% with cover at 1.9 times earnings
• Dividend earnings cover will reduce while the
business invests in Bloomsbury 2020 and is
planned to return to at least 2x in the medium
term
• Excellent dividend cash cover of 3.9

3.00
3.60 3.66 4.00 4.22 4.43
5.00 5.20 5.50
5.82 6.10
6.40 6.70
31
Dec 0
4
31
Dec 0
5
31
Dec 0
6
31
Dec 0
7
31
Dec 0
8
31
Dec 0
9
14
mo
nth
s to
28
Feb 1
1**
29
Feb 1
2
28
Feb 1
3
28
Feb 1
4
28
Feb 1
5
29
Feb 1
6
28
-Fe
b-1
7
Pence p
er
share
EXCELLENT DIVIDEND GROWTH
Compound annual dividend growth of 7% over 12 years
12
Note: **Dividend for 14 months ended 28 February 2011 included 0.28 pence per share for the two months ended 28 February 2011
Year ended Year ended

CONSUMER DIVISION: CHILDREN’S TRADE
13
Excellent performance
• Revenue up
48% to £55.9m,
profit up 44% to £7.6m
• E-book sales up
19% to £3.4m
Strong growth from Harry Potter novels
• Illustrated Harry Potter and
the Chamber of Secrets
and new edition of
Fantastic Beasts and
Where to Find Them
• Sales of Harry Potter grew
by 88% year on year
Bloomsbury Children’s UK market share grows by
21% to 4%
(Nielsen BookScan)
Sarah J. Maas
• Sales of Sarah J. Maas
titles grew by 87% year
on year
• Bestsellers in year Empire
of Storms and A Court of
Mist and Fury (No.1
worldwide in May 2017)
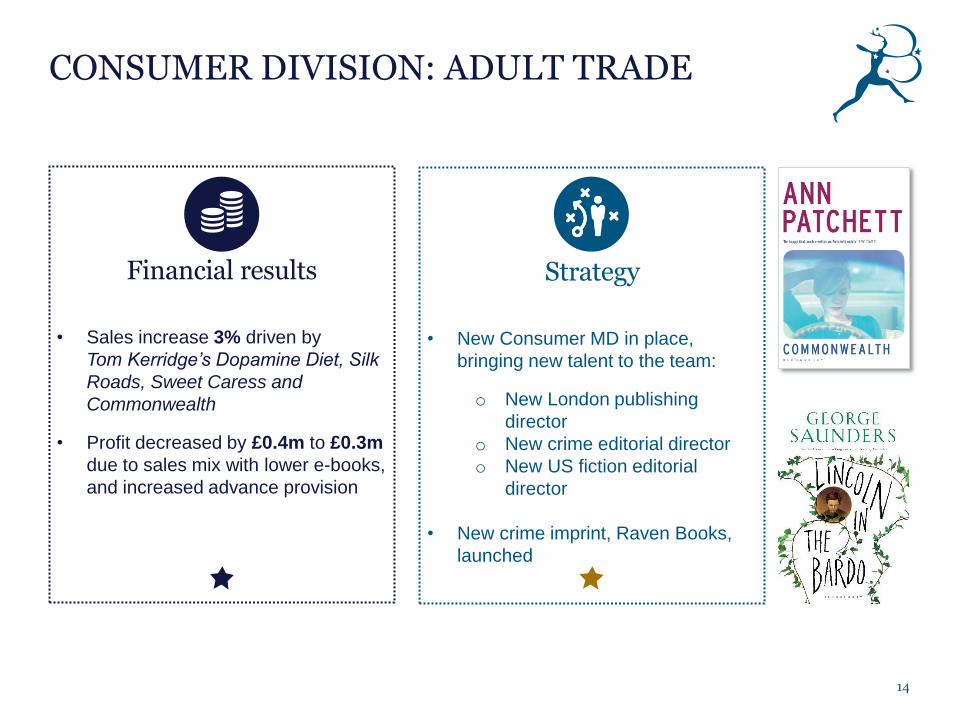
CONSUMER DIVISION: ADULT TRADE
14
Financial results
• Sales increase 3% driven by
Tom Kerridge’s Dopamine Diet, Silk
Roads, Sweet Caress and
Commonwealth
• Profit decreased by £0.4m to £0.3m
due to sales mix with lower e-books,
and increased advance provision
Strategy
• New Consumer MD in place,
bringing new talent to the team:
o New London publishing
director
o New crime editorial director
o New US fiction editorial
director
• New crime imprint, Raven Books,
launched
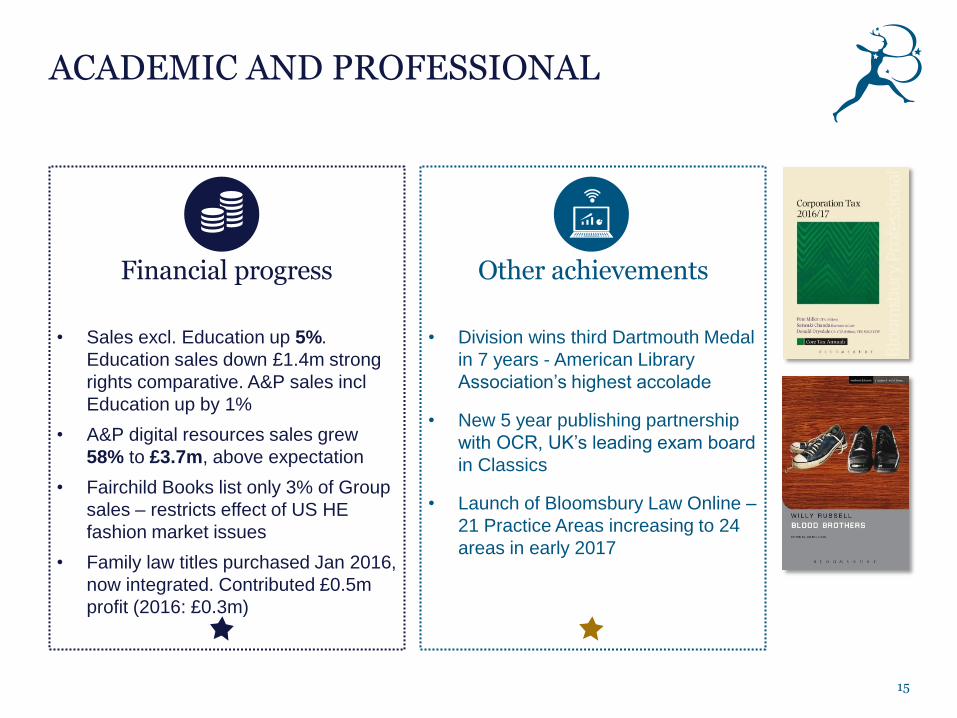
ACADEMIC AND PROFESSIONAL
15
Financial progress
• Sales excl. Education up 5%.
Education sales down £1.4m strong
rights comparative. A&P sales incl
Education up by 1%
• A&P digital resources sales grew
58% to £3.7m, above expectation
• Fairchild Books list only 3% of Group
sales – restricts effect of US HE
fashion market issues
• Family law titles purchased Jan 2016,
now integrated. Contributed £0.5m
profit (2016: £0.3m)
Other achievements
• Division wins third Dartmouth Medal
in 7 years - American Library
Association’s highest accolade
• New 5 year publishing partnership
with OCR, UK’s leading exam board
in Classics
• Launch of Bloomsbury Law Online –
21 Practice Areas increasing to 24
areas in early 2017

OTHER NON-CONSUMER
16
Special interest
• Key titles in the period include
Wisden Cricketers’ Almanack,
Reeds Nautical Almanac,
Who’s Who and Last Testament
• Launch of the Green Tree health
and wellness imprint in Feb 2017
• Osprey Games revenues up 5% to
£1.4m, successes include Escape
from Colditz
Content services
• Renewal of publishing services
contract with IZA World of Labor
for additional 18-month term from
Jan 2017
• New content marketing and
publishing services customers
including Royal Bank of Canada
and ICAEW
• Key titles in the period
include The 100-Year Life
and Age of Discovery
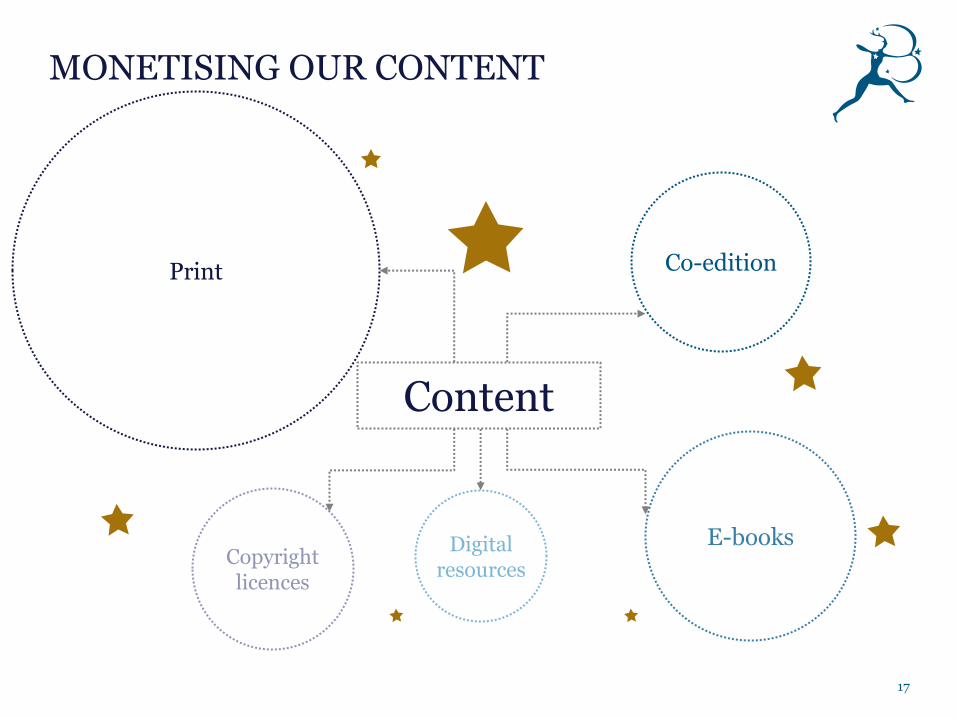
MONETISING OUR CONTENT
17
Print Co-edition
Copyright licences
E-books
Content
Digital resources

FOCUS ON BLOOMSBURY 2020 INVESTING TO GROW B2B DIGITAL SERVICES
18
Financials
Incremental net investment
2016/17 within guidance:
• P&L £0.6m
• Cash £1.5m incl. capex
Guidance for future years
unchanged: peak net
incremental investment P&L
£2m in 2017/18
2017/18
New resources pipeline strong:
launch of three new resources;
• The Bloomsbury Design
Library
• The Bloomsbury Food
Library
• Bloomsbury Cultural
History
Plus three new modules
to Drama Online
2016/17 achievements
Build of new digital resources
platform
Launch of four new major
digital resources;
• Fairchild Books Library
• The Fashion Photography
Archive
• Arcadian Library
• Bloomsbury Popular Music
the latter two on the new
platform.
Global sales and marketing
team established
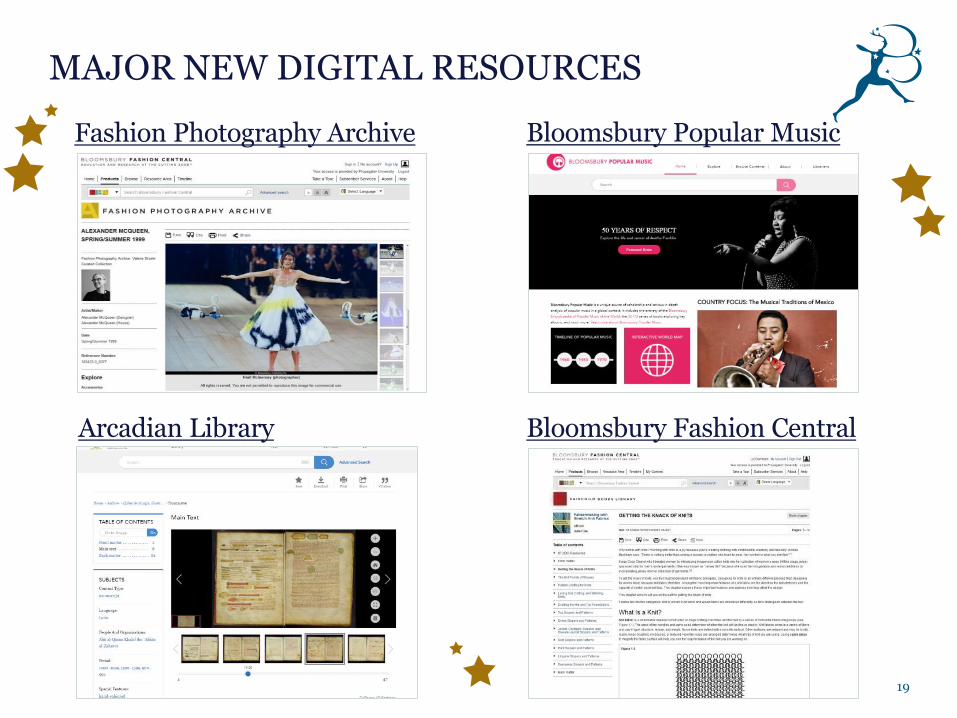
MAJOR NEW DIGITAL RESOURCES
19
Fashion Photography Archive Bloomsbury Popular Music
Arcadian Library Bloomsbury Fashion Central
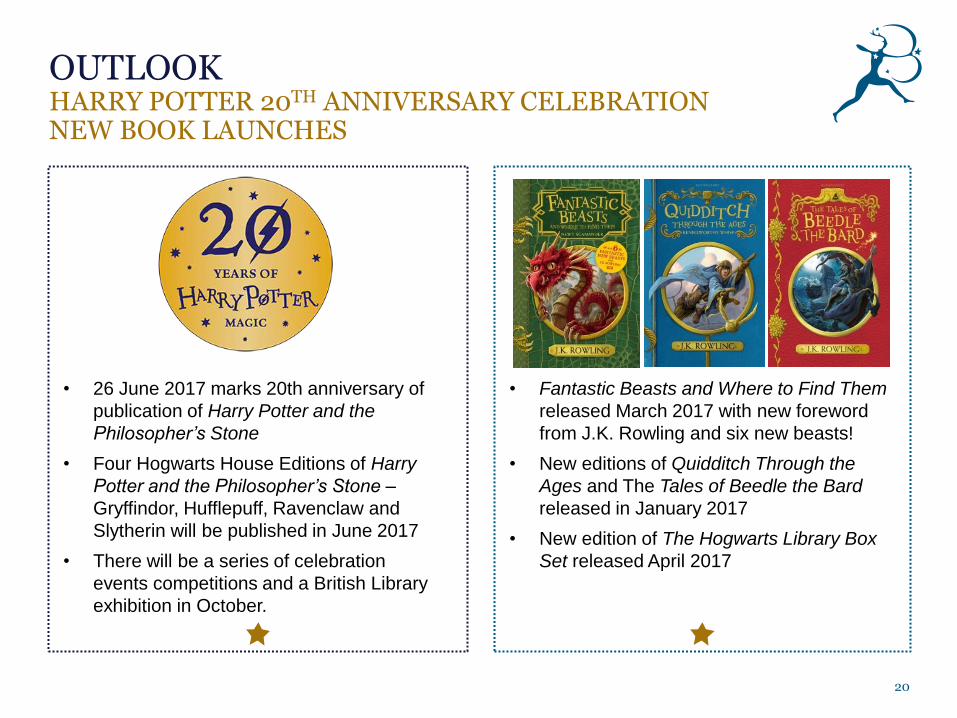
OUTLOOK HARRY POTTER 20TH ANNIVERSARY CELEBRATION NEW BOOK LAUNCHES
20
• 26 June 2017 marks 20th anniversary of
publication of Harry Potter and the
Philosopher’s Stone
• Four Hogwarts House Editions of Harry
Potter and the Philosopher’s Stone –
Gryffindor, Hufflepuff, Ravenclaw and
Slytherin will be published in June 2017
• There will be a series of celebration
events competitions and a British Library
exhibition in October.
• Fantastic Beasts and Where to Find Them
released March 2017 with new foreword
from J.K. Rowling and six new beasts!
• New editions of Quidditch Through the
Ages and The Tales of Beedle the Bard
released in January 2017
• New edition of The Hogwarts Library Box
Set released April 2017
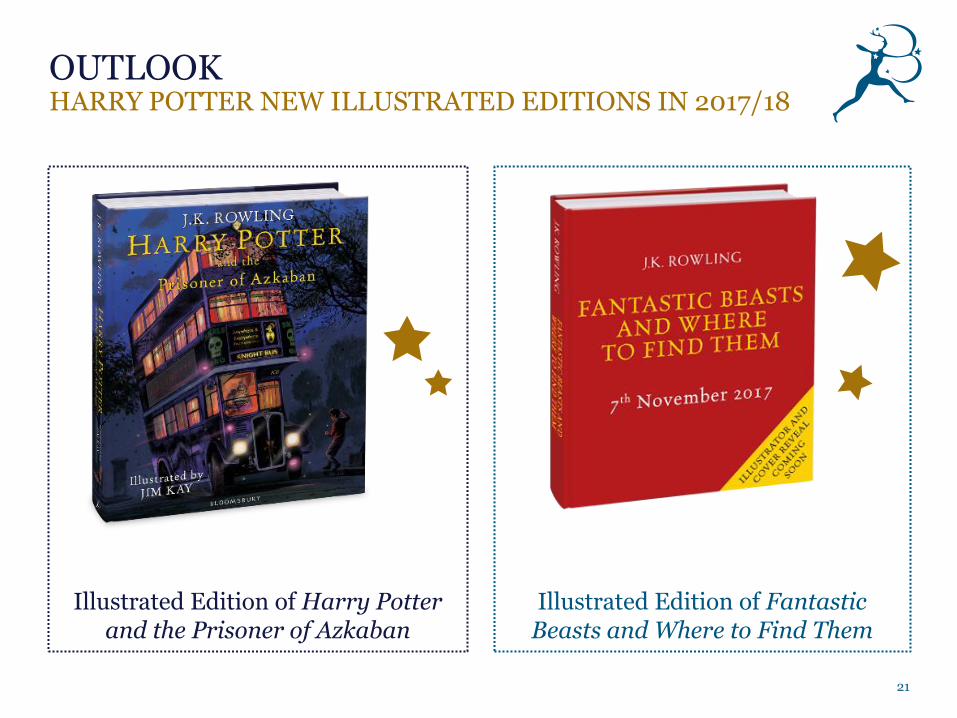
OUTLOOK HARRY POTTER NEW ILLUSTRATED EDITIONS IN 2017/18
21
Illustrated Edition of Harry Potter and the Prisoner of Azkaban
Illustrated Edition of Fantastic Beasts and Where to Find Them

Three new Sarah J. Maas titles
OUTLOOK
Trading in line with management’s expectations
22
Bloomsbury 2020 digital publishing: launch of three new major digital resources in 2017/18:
• The Bloomsbury Design Library
• The Bloomsbury Food Library
• Bloomsbury Cultural History
Strong new publishing list includes:

QUESTIONS
APPENDICES
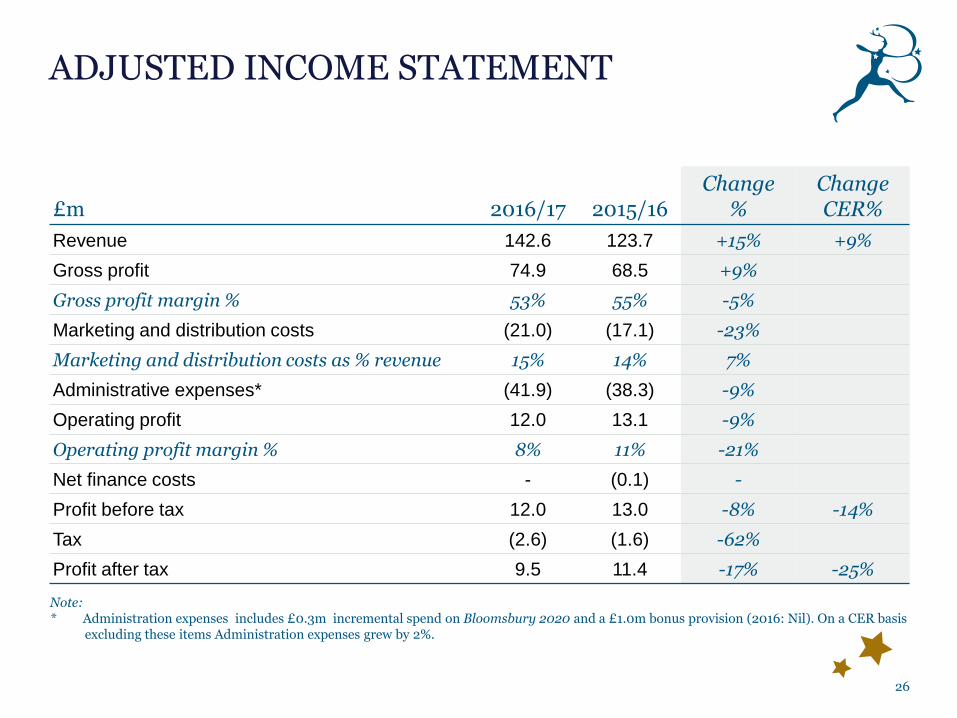
Note: * Administration expenses includes £0.3m incremental spend on Bloomsbury 2020 and a £1.0m bonus provision (2016: Nil). On a CER basis
excluding these items Administration expenses grew by 2%.
£m 2016/17 2015/16 Change
% Change CER%
Revenue 142.6 123.7 +15% +9%
Gross profit 74.9 68.5 +9%
Gross profit margin % 53% 55% -5%
Marketing and distribution costs (21.0) (17.1) -23%
Marketing and distribution costs as % revenue 15% 14% 7%
Administrative expenses* (41.9) (38.3) -9%
Operating profit 12.0 13.1 -9%
Operating profit margin % 8% 11% -21%
Net finance costs - (0.1) -
Profit before tax 12.0 13.0 -8% -14%
Tax (2.6) (1.6) -62%
Profit after tax 9.5 11.4 -17% -25%
ADJUSTED INCOME STATEMENT
26
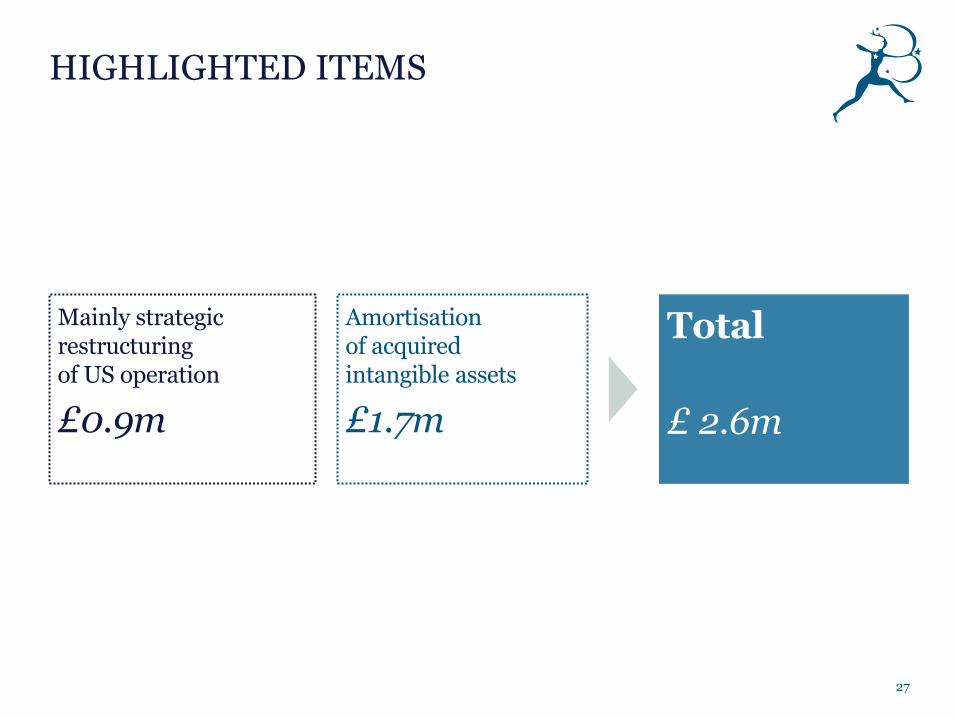
HIGHLIGHTED ITEMS
27
Total
£ 2.6m
Mainly strategic restructuring of US operation
£0.9m
Amortisation of acquired intangible assets
£1.7m
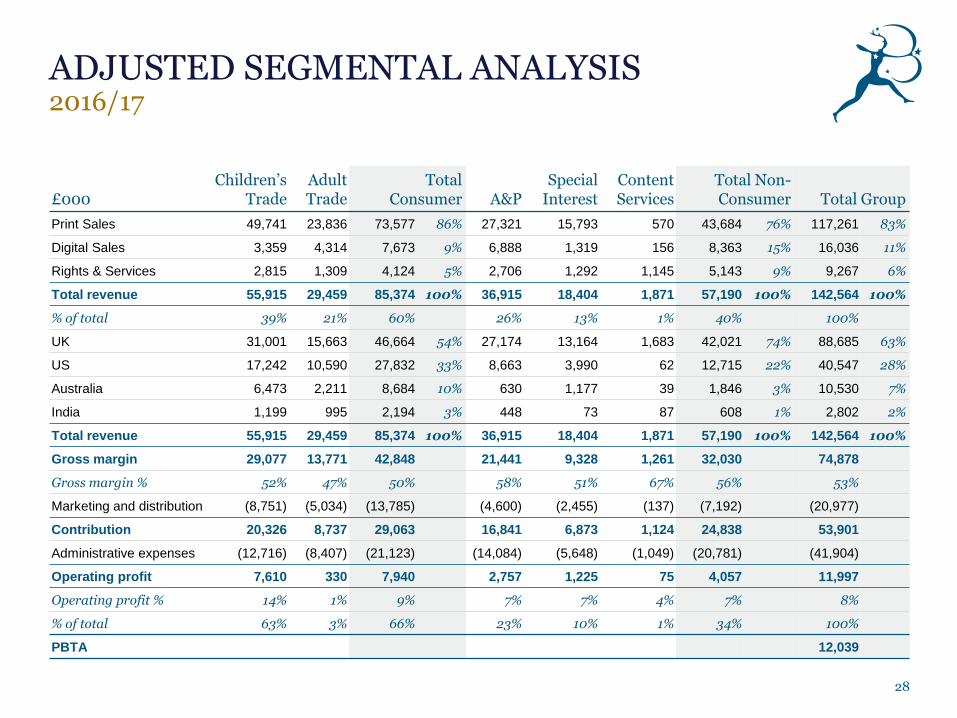
ADJUSTED SEGMENTAL ANALYSIS 2016/17
28
£000 Children’s
Trade Adult Trade
Total Consumer A&P
Special Interest
Content Services
Total Non-Consumer Total Group
Print Sales 49,741 23,836 73,577 86% 27,321 15,793 570 43,684 76% 117,261 83%
Digital Sales 3,359 4,314 7,673 9% 6,888 1,319 156 8,363 15% 16,036 11%
Rights & Services 2,815 1,309 4,124 5% 2,706 1,292 1,145 5,143 9% 9,267 6%
Total revenue 55,915 29,459 85,374 100% 36,915 18,404 1,871 57,190 100% 142,564 100%
% of total 39% 21% 60% 26% 13% 1% 40% 100%
UK 31,001 15,663 46,664 54% 27,174 13,164 1,683 42,021 74% 88,685 63%
US 17,242 10,590 27,832 33% 8,663 3,990 62 12,715 22% 40,547 28%
Australia 6,473 2,211 8,684 10% 630 1,177 39 1,846 3% 10,530 7%
India 1,199 995 2,194 3% 448 73 87 608 1% 2,802 2%
Total revenue 55,915 29,459 85,374 100% 36,915 18,404 1,871 57,190 100% 142,564 100%
Gross margin 29,077 13,771 42,848 21,441 9,328 1,261 32,030 74,878
Gross margin % 52% 47% 50% 58% 51% 67% 56% 53%
Marketing and distribution (8,751) (5,034) (13,785) (4,600) (2,455) (137) (7,192) (20,977)
Contribution 20,326 8,737 29,063 16,841 6,873 1,124 24,838 53,901
Administrative expenses (12,716) (8,407) (21,123) (14,084) (5,648) (1,049) (20,781) (41,904)
Operating profit 7,610 330 7,940 2,757 1,225 75 4,057 11,997
Operating profit % 14% 1% 9% 7% 7% 4% 7% 8%
% of total 63% 3% 66% 23% 10% 1% 34% 100%
PBTA 12,039
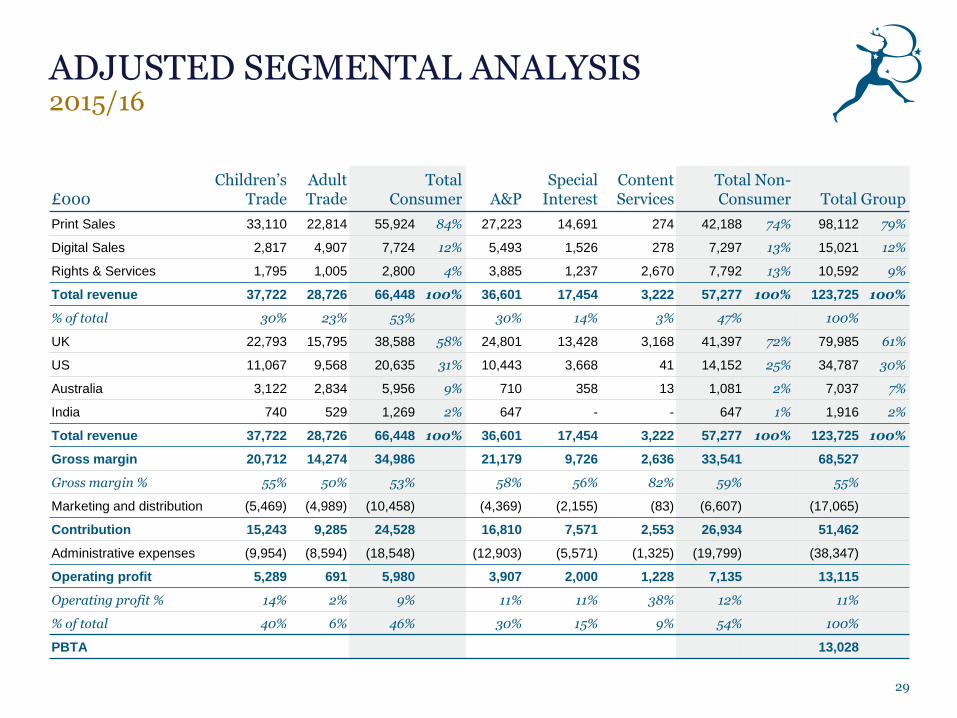
ADJUSTED SEGMENTAL ANALYSIS 2015/16
29
£000 Children’s
Trade Adult Trade
Total Consumer A&P
Special Interest
Content Services
Total Non-Consumer Total Group
Print Sales 33,110 22,814 55,924 84% 27,223 14,691 274 42,188 74% 98,112 79%
Digital Sales 2,817 4,907 7,724 12% 5,493 1,526 278 7,297 13% 15,021 12%
Rights & Services 1,795 1,005 2,800 4% 3,885 1,237 2,670 7,792 13% 10,592 9%
Total revenue 37,722 28,726 66,448 100% 36,601 17,454 3,222 57,277 100% 123,725 100%
% of total 30% 23% 53% 30% 14% 3% 47% 100%
UK 22,793 15,795 38,588 58% 24,801 13,428 3,168 41,397 72% 79,985 61%
US 11,067 9,568 20,635 31% 10,443 3,668 41 14,152 25% 34,787 30%
Australia 3,122 2,834 5,956 9% 710 358 13 1,081 2% 7,037 7%
India 740 529 1,269 2% 647 - - 647 1% 1,916 2%
Total revenue 37,722 28,726 66,448 100% 36,601 17,454 3,222 57,277 100% 123,725 100%
Gross margin 20,712 14,274 34,986 21,179 9,726 2,636 33,541 68,527
Gross margin % 55% 50% 53% 58% 56% 82% 59% 55%
Marketing and distribution (5,469) (4,989) (10,458) (4,369) (2,155) (83) (6,607) (17,065)
Contribution 15,243 9,285 24,528 16,810 7,571 2,553 26,934 51,462
Administrative expenses (9,954) (8,594) (18,548) (12,903) (5,571) (1,325) (19,799) (38,347)
Operating profit 5,289 691 5,980 3,907 2,000 1,228 7,135 13,115
Operating profit % 14% 2% 9% 11% 11% 38% 12% 11%
% of total 40% 6% 46% 30% 15% 9% 54% 100%
PBTA 13,028
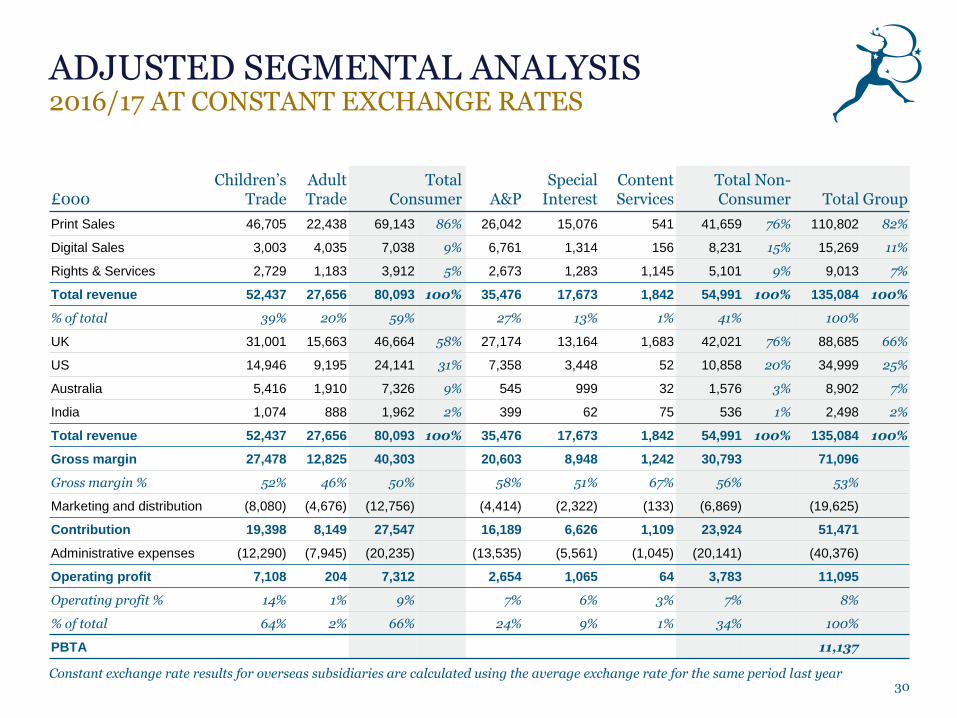
ADJUSTED SEGMENTAL ANALYSIS 2016/17 AT CONSTANT EXCHANGE RATES
30 Constant exchange rate results for overseas subsidiaries are calculated using the average exchange rate for the same period last year
£000 Children’s
Trade Adult Trade
Total Consumer A&P
Special Interest
Content Services
Total Non-Consumer Total Group
Print Sales 46,705 22,438 69,143 86% 26,042 15,076 541 41,659 76% 110,802 82%
Digital Sales 3,003 4,035 7,038 9% 6,761 1,314 156 8,231 15% 15,269 11%
Rights & Services 2,729 1,183 3,912 5% 2,673 1,283 1,145 5,101 9% 9,013 7%
Total revenue 52,437 27,656 80,093 100% 35,476 17,673 1,842 54,991 100% 135,084 100%
% of total 39% 20% 59% 27% 13% 1% 41% 100%
UK 31,001 15,663 46,664 58% 27,174 13,164 1,683 42,021 76% 88,685 66%
US 14,946 9,195 24,141 31% 7,358 3,448 52 10,858 20% 34,999 25%
Australia 5,416 1,910 7,326 9% 545 999 32 1,576 3% 8,902 7%
India 1,074 888 1,962 2% 399 62 75 536 1% 2,498 2%
Total revenue 52,437 27,656 80,093 100% 35,476 17,673 1,842 54,991 100% 135,084 100%
Gross margin 27,478 12,825 40,303 20,603 8,948 1,242 30,793 71,096
Gross margin % 52% 46% 50% 58% 51% 67% 56% 53%
Marketing and distribution (8,080) (4,676) (12,756) (4,414) (2,322) (133) (6,869) (19,625)
Contribution 19,398 8,149 27,547 16,189 6,626 1,109 23,924 51,471
Administrative expenses (12,290) (7,945) (20,235) (13,535) (5,561) (1,045) (20,141) (40,376)
Operating profit 7,108 204 7,312 2,654 1,065 64 3,783 11,095
Operating profit % 14% 1% 9% 7% 6% 3% 7% 8%
% of total 64% 2% 66% 24% 9% 1% 34% 100%
PBTA 11,137

ACTIVE DIGITAL RESOURCES
31
Product Market Model
Arcadian Library Institutional Perpetual Access
Berg Fashion Library Institutional Subscription
Bloomsbury Popular Music Institutional Subscription
Bloomsbury Professional Law & Tax Products B2B Subscription
Reeds Almanac Online B2C Subscription
Churchill Archive Institutional Perpetual Access and Subscription
Drama Online Institutional Perpetual Access and Subscription
Bloomsbury Collections Institutional Perpetual Access
Churchill Central B2C Sponsorship funded
Churchill for Schools Secondary Schools Sponsorship funded
Cooked.com B2C Joint Venture
Fairchild Books Fashion (textbook rental) B2C Purchase or Rental
Fairchild Books Library Institutional Subscription
IZA World of Labor Institutional Sponsorship Funded
Fashion Photography Archive Institutional Perpetual Access and Subscription

ADJUSTING ITEMS
32
All metrics and commentary in
this presentation are at reported
foreign exchange rates and
include Adjusting items unless
stated otherwise
Adjusting items are highlighted
items as shown on slide 26
Adjusted results are included in this
presentation as, in the opinion of the
Directors, it provides additional
understanding of the
ongoing performance of the Group
Certain financial data within this
presentation has been rounded

INVESTOR RELATIONS CONTACTS
33
Nigel Newton | Chief Executive Wendy Pallot | Group Finance Director
50 Bedford Square
London
WC1B 3DP
Tel: +44 (0)20 7631 5630
Daniel de Belder Bell Pottinger
Holborn Gate, 330 High Holborn
London
WC1V 7QD
Tel: +44 (0)20 3772 2500
www.bloomsbury.com
www.twitter.com/bloomsburybooks www.facebook.com/bloomsburypublishing
www.youtube.com/bloomsburypublishing www.instagram.com/bloomsburypublishing
DISCLAIMER
34
Statements contained in this presentation are based on the knowledge and information
available to the Company's directors at the date it was prepared and therefore the facts
stated and views expressed may change after that date. By their nature, the statements
concerning the risks and uncertainties facing the Company in this presentation involve
uncertainty since future events and circumstances can cause results and developments to
differ materially from those anticipated. To the extent that this presentation contains any
statement dealing with any time after the date of its preparation such statement is merely
predictive and speculative as it relates to events and circumstances which are yet to occur.
The Company undertakes no obligation to update these forward-looking statements. This
announcement does not constitute an invitation to underwrite, subscribe for or otherwise
acquire or dispose of any Bloomsbury Publishing Plc shares. Nothing in this announcement
should be construed as a profit forecast.