Embed Size (px)
Citation preview

012Results for 2012
FINANCIAL STATEMENT RELEASE 13 FEBRUARY 2013

Sampo Group’S reSultS for 2012 CONTENTS
2
Q4Summary 3FOurTh quarTEr 2012 iN briEF 4buSiNESS arEaS iN 2012 5 p&C insurance 5 associated company Nordea Bank ab 8 life insurance 10 Holding 12OThEr dEvElOpmENTS 13 administration 13 personnel 13 remuneration 13 Shares and share capital 13 Internal dividends 14 ratings 14 adoption of IaS 19r 14 Group solvency 15 Debt financing 16OuTlOOk 17 outlook for 2013 17 the major risks and uncertainties to the Group in the near term 17dividENd prOpOSal 18TablES 31 dECEmbEr 2012 20 Group financial review 20 Calculation of key figures 21 Group quarterly comprehensive income statement 23 Consolidated comprehensive income statement, IfrS 24 Consolidated balance sheet, IfrS 25 Statement of changes in equity, IfrS 26 Statement of cash flows, IfrS 27Notes 28 accounting policies 28 Comprehensive income statement by segment for twelve months ended 31 December 2012 29 Comprehensive income statement by segment for twelve months ended 31 December 2011 30 Consolidated balance sheet by segment at 31 December 2012 31 Consolidated balance sheet by segment at 31 December 2011 32Other notes 33 1 Insurance premiums 33 2 Net income from investments 34 3 Claims incurred 37 4 Staff costs 38 5 Intangible assets 39 6 financial assets 40 7 Derivative financial instruments 42 8 Investments related to unit-linked insurance 43 9 liabilities for insurance and investment contracts 44 10 liabilities from unit-linked insurance and investment contracts 45 11 financial liabilities 46 12 Contingent liabilities and commitments 47 13 result analysis of p&C insurance business 49 14 Sampo plc’s income statement and balance sheet (faS) 50
Contents

Sampo Group’S reSultS for 2012 Summary
3
A record year in many respects
The figures in this report are not audited. Income statement items are compared on a year-on-year basis and comparison figures for balance sheet items are from 31 December 2011 unless otherwise stated.
The average EUR-SEK exchange rate used for income statement items for full year 2012 is 8.7040 and the year-end exchange rate used for balance sheet items is 8.5820.
Sampo Group reported good results for 2012 in all of its businesses despite the challenging economic environment. P&C insurance achieved a better combined ratio than ever before, Nordea achieved an all-time high operating profit and the volume development in life insurance was exceptionally strong.
• Sampo Group’s profit before taxes for 2012 rose to eur 1,616 million (1,228). total comprehensive income for the period, taking changes in the market value of assets into account, increased to eur 1,855 million (686).• earnings per share amounted to eur 2.51 (1.85). mark-to-market earnings per share were eur 3.31 (1.22) and return on equity for the Group increased to 19.5 per cent for 2012 (7.7). • the Board proposes to the annual General meeting to be held on 18 april 2013 a dividend of eur 1.35 per share (1.20) and an authorization to repurchase a maximum of 50 million Sampo a shares.• Net asset value per share on 31 December 2012 was eur 17.55 (14.05). fair value reserve on the Group level amounted to eur 749 million (355).• profit before taxes in the p&C insurance segment increased 35 per cent to eur 858 million (636). Combined ratio was exceptionally strong both for the full year 2012 and the fourth quarter, 89.3 per cent (92.0) and 88.8 per cent (90.2), respectively. return on equity was 36.2 per cent (12.4) and fair value reserve increased to eur 364 million (139).• Sampo’s share of Nordea’s net profit in 2012 rose to eur 653 million (534). Nordea’s roe was 11.6 per cent (10.6) and core tier 1 ratio (excluding transition rules) rose to 13.1 per cent (11.2). In segment reporting the share of Nordea’s profit is included in the segment ‘Holding’.• In life insurance profit before taxes amounted to eur 136 million (137). the discount rate of 2.5 per cent will be used to discount the guaranteed rate portfolios in 2013 and 3.25 per cent in 2014. premiums grew 15 per cent to eur 977 million (849). fair value reserve increased to eur 391 million (214) as at 31 December 2012. return on equity increased to 28.5 per cent (-11.7).
Sampo plC fINaNCIal StatemeNt releaSe 13 february 2013
EURm 2012 2011 Change, % Q4/2012 Q4/2011 Change, %
Profit before taxes 1,616 1,228 32 444 322 38
P&C insurance 858 636 35 210 171 23
Associate (Nordea) 653 534 22 188 161 17
Life insurance 136 137 -1 38 30 25
Holding (excl. Nordea) -30 -77 -61 10 -40 -
Profit for the period 1,404 1,038 35 401 279 44
Change Change
Earnings per share, EUR 2.51 1.85 0.66 0.72 0.50 0.22
EPS (incl. change in FVR) EUR 3.31 1.22 2.09 0.73 0.94 -0.21
NAV per share, EUR *) 17.55 14.05 3.50 - - -
Average number of staff (FTE) 6,823 6,874 -51 - - -
Group solvency ratio, % *) 170.4 138.6 31.8 - - -
RoE, % 19.5 7.7 11.8 - - -
Key figures
Sampo Group’s results for 2012

Sampo Group’S reSultS for 2012 FOurTh quarTEr 2012 iN briEF
4
Fourth quarter 2012 in brief Sampo Group’s fourth quarter 2012 profit before taxes rose to eur 444 million (322). earnings per share amounted to eur 0.72 (0.50). mark-to-market earnings per share were eur 0.73 (0.94). Net asset value per share decreased eur 0.20 to eur 17.55 during the fourth quarter of 2012 as a result of the share price development of the associated company Nordea.
In the p&C insurance operation the combined ratio was excellent at 88.8 per cent (90.2). profit before taxes increased to eur 210 million (171). Share of the profits of the associated company topdanmark amounted to eur 14 million (4).
Sampo’s share of Nordea’s fourth quarter 2012 net profit amounted to eur 188 million (161). Nordea’s Group core tier 1 capital ratio, excluding transition rules, rose to 13.1 per cent at the end of the year 2012, a strengthening of 0.9 percentage points from the end of the previous quarter.
profit before taxes for the life insurance operations rose to eur 38 million (30). premiums written increased by 26 per cent from the corresponding quarter in 2011 and amounted to eur 299 million.

Sampo Group’S reSultS for 2012 buSiNESS arEaS iN 2012
5
Business areas in 2012 p&C insurance
If p&C is the leading property and casualty insurance group in the Nordic region, with insurance operations that also encompass the Baltic countries and russia. the p&C insurance group’s parent company, If p&C Insurance Holding ltd, is located in Sweden, and the If subsidiaries and branches provide insurance solutions and services in finland, Sweden, Norway, Denmark, the Baltic countries and russia. If’s operations are divided into four business areas: private, Commercial, Industrial and Baltic. Danish insurance company topdanmark is If’s associated company.
Business areas in 2011
EURm 2012 2011 Change, % Q4/2012 Q4/2011 Change, %
Premiums, net 4,441 4,201 6 941 881 7
Net income from investments 359 298 20 76 69 10
Other operating income 33 31 7 9 7 29
Claims incurred -2,876 -2,801 2 -734 -691 6
Change in insurance liabilities -78 -107 -27 180 165 9
Staff costs -527 -494 7 -111 -125 -11
Other operating expenses -521 -497 5 -160 -134 19
Finance costs -19 -2 1,147 -5 -4 24
Share of associates’ profit/loss 46 7 597 13 4 263
profit before taxes 858 636 35 210 171 23
Change Change
Combined ratio, % 89.3 92.0 -2.7 88.8 90.2 -1.4
Risk ratio, % 65.9 68.4 -2.5 65.5 66.2 -0.7
Cost ratio, % 23.3 23.5 -0.2 23.4 24.0 -0.6
Expense ratio, % 17.1 17.3 -0.2 17.3 17.6 -0.3
Return on equity, % 36.2 12.4 23.8 - - -
Average number of staff (FTE) 6,225 6,299 -74 - - -
profit before taxes for p&C insurance increased by 35 per cent to eur 858 million (636) in 2012 as a result of an excellent operating profitability during the year. Net income from investments also improved significantly compared to previous year, as the comparison period was burdened with impairment losses of eur 152 million related to equity assets. In 2012 the impairment losses amounted to eur 24 million.
Combined ratio for the year 2012 was 89.3 per cent (92.0), which is the best ever full year combined ratio in If p&C’s history. also risk ratio improved significantly in 2012 to 65.9 per cent (68.4). the excellent outcome was supported by better than average weather conditions particularly during the first half of the year. eur 133 million (135) was released from technical reserves relating to prior year claims.
technical result increased to eur 560 million (457) in 2012. technical result for private business area increased to eur 349 million (256) and for Commercial to eur 168 million (124). for business area
Results
Key figures
Sampo Group’S reSultS for 2012 buSiNESS arEaS iN 2012
6
Combined ratio,% Risk ratio,%
2012 2011 Change 2012 2011 ChangePrivate 88.1 91.9 -3.8 64.9 68.5 -3.6Commercial 89.0 92.8 -3.8 65.5 69.1 -3.6Industrial 95.8 91.8 4.0 73.9 71.5 2.4Baltic 87.1 84.5 2.6 54.7 48.0 6.7 Sweden 95.8 95.6 0.2 72.4 73.1 -0.7Norway 81.3 88.0 -6.7 59.1 65.9 -6.8Finland 89.5 94.0 -4.5 66.7 70.7 -4.0Denmark 99.4 93.4 6.0 71.7 63.9 7.8
Combined ratio,% Risk ratio,%
Q4/2012 Q4/2011 Change Q4/2012 Q4/2011 ChangePrivate 88.2 92.1 -3.9 64.5 67.1 -2.6Commercial 86.4 90.6 -4.2 63.2 67.4 -4.2Industrial 92.7 87.8 4.9 71.4 67.4 4.0Baltic 91.9 70.5 21.4 58.9 29.0 29.9 Sweden 94.7 86.8 7.9 71.8 62.6 9.2Norway 80.2 86.6 -6.4 57.8 65.0 -7.2Finland 94.7 112.8 -18.1 71.2 88.5 -17.3Denmark 84.1 75.5 8.6 56.5 44.2 12.3
Both combined ratio and risk ratio improved significantly during 2012 in business areas private and Commercial, to a large extent helped by the Norwegian operations, which reached an exceptionally good profitability in 2012 due to improved claims frequency, prior year claims result and benign weather conditions. Both combined and risk ratios decreased significantly also in finland, despite the effect of lowering the discount rate for annuities in the third quarter.
Swedish operations remained on a previous year’s level in 2012 on both combined and risk ratios, despite the significant single large claims in business area Industrial in the second quarter of 2012. Denmark was burdened by worse than average large claims outcome.
large claims in total ended up eur 50 million higher than average for the full year 2012. large claims development was favourable in business area Commercial but eur 59 million worse than normalized in the business area Industrial. Discount rate for annuities (real rate) in Sweden increased to 0.18 percent at the end of 2012 from 0.07 per cent at the end of September 2012, which had a minor positive impact on the result.
Industrial technical result decreased to eur 28 million (53), as large claims in the business area ended up worse than normalized mainly due to some significant single large claims in Sweden and Denmark in the second quarter of 2012. for Baltic operations technical result decreased to eur 17 million (22). Insurance margin (technical result in relation to net premiums earned) improved to 12.8 per cent (11.1).
return on equity (roe) increased to 36.2 per cent (12.4). fair value reserve for If p&C increased from the previous year to eur 364 million (139) at the end of December 2012.

Sampo Group’S reSultS for 2012 buSiNESS arEaS iN 2012
7
all business areas had strong growth in 2012. Gross written premiums increased 6.4 per cent to eur 4,698 million (4,414). adjusted for currency, premiums increased 3.5 per cent. In private gross written premiums adjusted for currency increased 3.3 per cent, in Commercial 2.6 per cent, in Industrial 3.7 per cent and in Baltic operations by one per cent.
Cost ratio improved from the previous year to 23.3 per cent (23.5) and expense ratio to 17.1 (17.3). adjusted for currency the nominal costs increased 4.2 per cent.
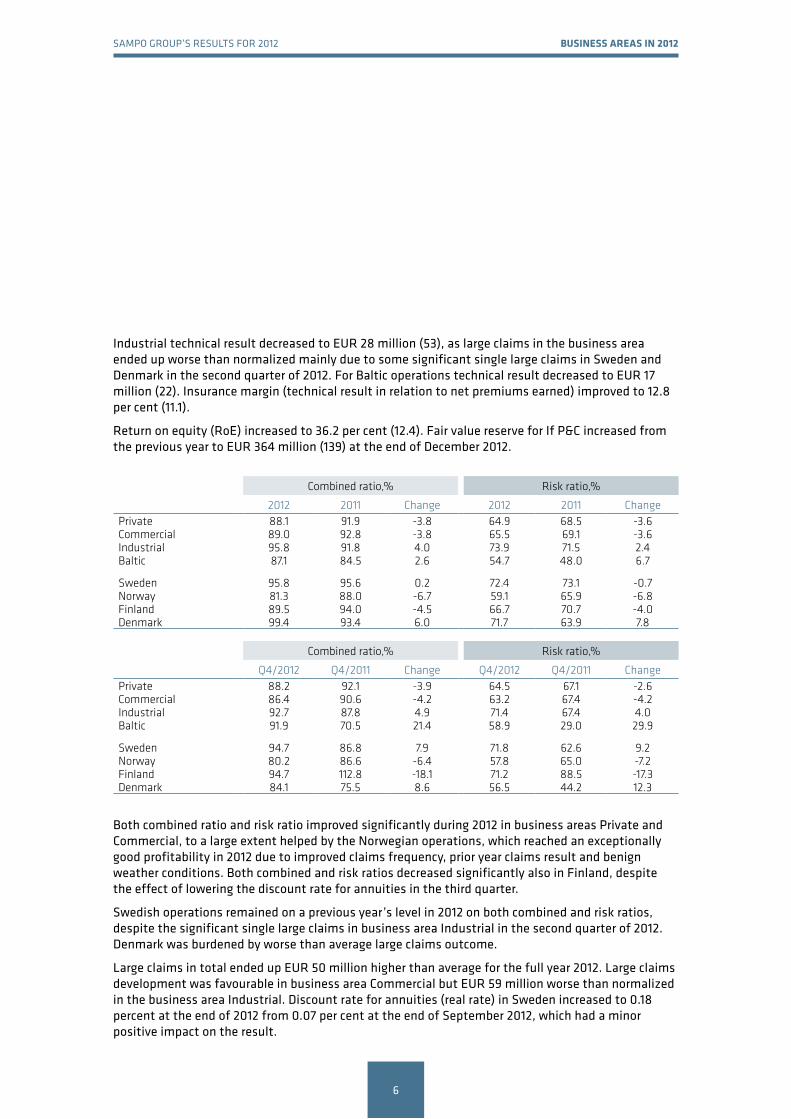
at the end of December 2012 the total investment assets of If p&C amounted to eur 11.7 billion (11.2).
Net income from investments increased to eur 359 million (298).
Investment return mark-to-market for the year 2012 was 6.1 per cent (1.8).
Duration for interest bearing assets was 1.1 year (1.2) and average maturity 2.3 years (2.5). fixed income running yield as at 31 December 2012 was 3.6 per cent (4.1).
If p&C’s solvency ratio as at 31 December 2012 (solvency capital in relation to net written premiums) was 77 per cent (72). Despite the dividend paid to Sampo plc in the fourth quarter, solvency capital increased from the previous year to eur 3,485 million (3,080). reserve ratios were 161 per cent (167) of net written premiums and 219 per cent (237) of claims paid.
If p&C holds 22.9 per cent of the total number of shares and 25.4 per cent of all shares excluding the shares held by topdanmark itself. In Sampo Group’s 2012 accounts the contribution of topdanmark’s net profit after the amortization of eur 8 million amounted to eur 50 million.
on 31 December 2012 If p&C held 3,147,692 topdanmark shares. the average acquisition price is DKK 780 and the book value in Sampo Group’s balance sheet on 31 December 2012 was eur 111.75 (DKK 831). the closing price at the end of trading year 2012 in the Copenhagen Stock exchange was DKK 1,213 (eur 163) per share.
If p&C Insurance Holding ltd entered into an agreement on 30 June 2012 to sell its russian subsidiary region. the transaction was closed on 29 November 2012.
Investment allocation, If P&C, total EUR 11.7 billion
Money Market 6%
Fixed Income 82%
Equities 11%
Real Estate 1%

Sampo Group’S reSultS for 2012 buSiNESS arEaS iN 2012
8
associated company Nordea Bank ab
In Sampo Group’s reporting Nordea is treated as an associated company and is included in the segment Holding. on 31 December 2012 Sampo plc held 860,440,497 Nordea shares corresponding to a holding of 21.2 per cent. the average price paid per share amounted to eur 6.46 and the book value in the Group accounts was eur 7.77 per share. the closing price as at 31 December 2012 was eur 7.24.
Nordea’s Board of Directors proposes to the aGm 2013 a dividend of eur 0.34 per share (0.26), corresponding to a payout ratio of 44 per cent of net profit in line with the dividend policy. If the aGm approves the Board’s dividend proposal, Sampo plc will receive a dividend of eur 293 million from Nordea in march 2013.
the following text is based on Nordea’s full year 2012 result release published on 30 January 2013.
In 2012, Nordea delivered on its financial plan from 2011. Costs remained flat, risk-weighted assets decreased and income increased to a record level. the outcome of that plan was a rapid increase in capital and an all-time high operating profit in the full year of 2012, and one of the best quarterly results ever. Nordea improved its return on equity (roe), which was 11.6 per cent in 2012, on a significantly larger capital base. the core tier 1 capital ratio was above 13 per cent at the end of the year.
total income increased in 2012 by 8 per cent compared to 2011. operating profit increased 16 per cent, due to higher total income, and stable costs. risk-adjusted profit increased by 20 per cent compared to the preceding year. the effect from currency fluctuations contributed to an increase in income and expenses of approx. 1.5 percentage points for 2012 compared to 2011.
Net interest income increased 5 per cent compared to 2011. lending volumes increased 3 per cent and corporate lending margins were higher, while deposit margins have decreased from 2011. Net fee and commission income increased 5 per cent and net result from items at fair value increased by 18 per cent compared to last year. Income under the equity method was eur 93 million and other income was eur 103 million.
total expenses increased 3 per cent compared to last year and staff costs increased 3 per cent, when excluding the restructuring costs last year. total expenses decreased 0.5 per cent compared to 2011 in local currencies when excluding the restructuring costs last year and excluding performance related salaries and profit-sharing, i.e. with the cost definition for the cost target in the New Normal plan.
EURm 2012 2011 Change, % Q4/2012 Q4/2011 Change, %
Net interest income 5,752 5,456 5 1,429 1,427 0
Total operating income 10,236 9,501 8 2,630 2,558 3
Profit before loan losses 5,050 4,282 18 1,303 1,292 1
Net loan losses -933 -735 27 -244 -263 -7
Loan loss ratio (ann.), bps 28 23 - 29 33 -
Operating profit 4,117 3,547 16 1,059 1,029 3
Risk-adjusted profit 3,245 2,714 20 846 815 4
Diluted EPS, EUR 0.78 0.65 - 0.21 0.19 -
Return on equity, % 11.6 10.6 - 12.1 12.3 -
Summary Key figures

Sampo Group’S reSultS for 2012 buSiNESS arEaS iN 2012
9
Net loan loss provisions increased to eur 933 million, corresponding to a loan loss ratio of 28 basis points (23 basis points last year excluding provisions related to the Danish deposit guarantee fund).
Net profit increased 19 per cent to eur 3,126 million, due to higher income and stable costs. risk-adjusted profit increased 20 per cent compared to last year to eur 3,245 million.
the Group’s core tier 1 capital ratio, excluding transition rules, was 13.1 per cent at the end of the fourth quarter, a strengthening by 0.9 percentage points from the end of the previous quarter. the total capital ratio excluding transition rules increased 0.9 percentage points to 16.2 per cent.
rWa were eur 167.9 billion excluding transition rules, down eur 11.1 billion, or 7 per cent, compared to the previous quarter. the core tier 1 ratio including transition rules under Basel II was 10.2 per cent. the capital base was eur 27.3 billion, the tier 1 capital was eur 24.0 billion and the core tier 1 capital was eur 22.0 billion.
Nordea has decided to establish a financial plan for increased return on equity (roe) and a new capital policy for the new regulatory environment. the plan is set in order to shape the future of Nordea for sustainable profitability and efficiency, closer customer relationships and a solid capital position and follows on the new normal plan, which has further strengthened Nordea’s platform in 2012.
the financial plan has an ambitious financial target of 15 per cent roe under normal market interest rate conditions and with a core tier 1 capital ratio of above 13 per cent. the capital policy states that, no later than 1 January 2015, the target for the core tier 1 capital ratio is to be above 13 per cent and for the total capital ratio to be above 17 per cent. the core tier 1 capital ratio is expected to stay above 13 per cent during 2013 and onwards, including the effects from regulatory changes and model rollouts. the dividend policy remains unchanged. excess capital is expected to be distributed to shareholders.
for more information on Nordea Bank ab and its result release for 2012, see www.nordea.com.
Sampo Group’S reSultS for 2012 buSiNESS arEaS iN 2012
10
profit before taxes in life insurance operations remained on previous year’s level and amounted to eur 136 million (137). the total comprehensive income for the period reflecting the changes in market values of assets was eur 286 million (-115) boosted by good investment performance. return on equity (roe) rose to 28.5 per cent (-11.7).
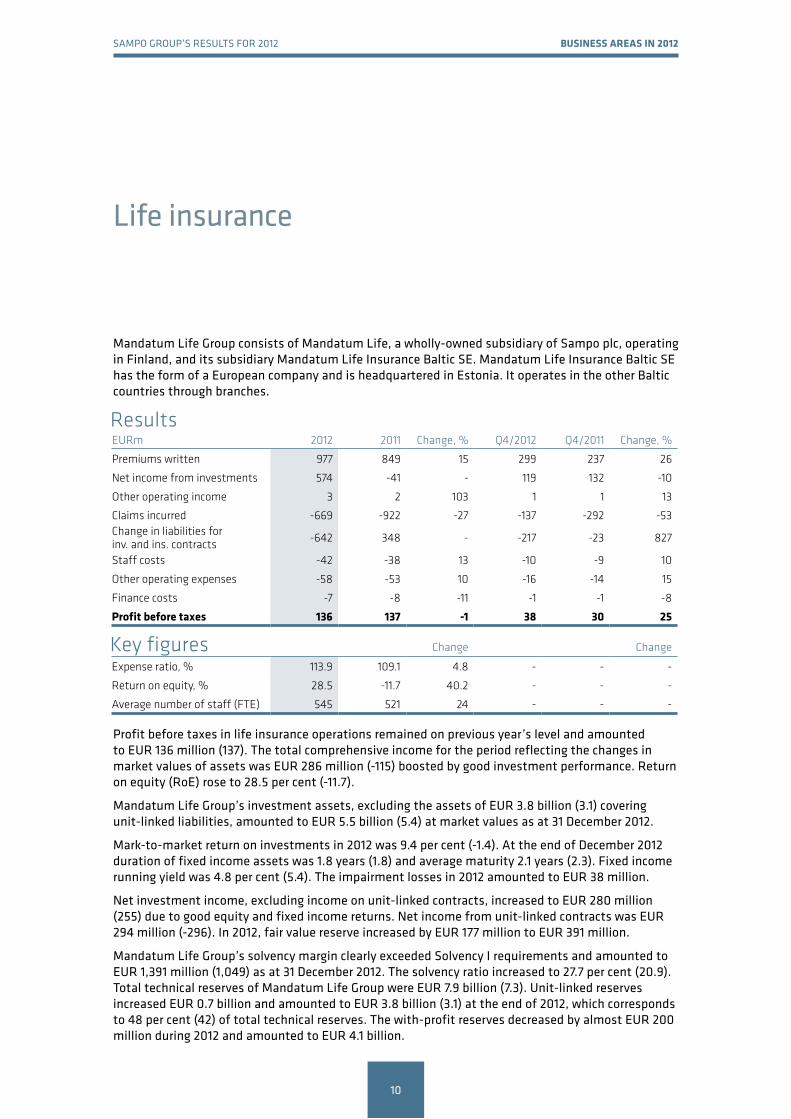
mandatum life Group’s investment assets, excluding the assets of eur 3.8 billion (3.1) covering unit-linked liabilities, amounted to eur 5.5 billion (5.4) at market values as at 31 December 2012.
mark-to-market return on investments in 2012 was 9.4 per cent (-1.4). at the end of December 2012 duration of fixed income assets was 1.8 years (1.8) and average maturity 2.1 years (2.3). fixed income running yield was 4.8 per cent (5.4). the impairment losses in 2012 amounted to eur 38 million.
Net investment income, excluding income on unit-linked contracts, increased to eur 280 million (255) due to good equity and fixed income returns. Net income from unit-linked contracts was eur 294 million (-296). In 2012, fair value reserve increased by eur 177 million to eur 391 million.
mandatum life Group’s solvency margin clearly exceeded Solvency I requirements and amounted to eur 1,391 million (1,049) as at 31 December 2012. the solvency ratio increased to 27.7 per cent (20.9). total technical reserves of mandatum life Group were eur 7.9 billion (7.3). unit-linked reserves increased eur 0.7 billion and amounted to eur 3.8 billion (3.1) at the end of 2012, which corresponds to 48 per cent (42) of total technical reserves. the with-profit reserves decreased by almost eur 200 million during 2012 and amounted to eur 4.1 billion.
life insurance
mandatum life Group consists of mandatum life, a wholly-owned subsidiary of Sampo plc, operating in finland, and its subsidiary mandatum life Insurance Baltic Se. mandatum life Insurance Baltic Se has the form of a european company and is headquartered in estonia. It operates in the other Baltic countries through branches.
EURm 2012 2011 Change, % Q4/2012 Q4/2011 Change, %
Premiums written 977 849 15 299 237 26
Net income from investments 574 -41 - 119 132 -10
Other operating income 3 2 103 1 1 13
Claims incurred -669 -922 -27 -137 -292 -53Change in liabilities for inv. and ins. contracts -642 348 - -217 -23 827
Staff costs -42 -38 13 -10 -9 10
Other operating expenses -58 -53 10 -16 -14 15
Finance costs -7 -8 -11 -1 -1 -8
profit before taxes 136 137 -1 38 30 25
Change Change
Expense ratio, % 113.9 109.1 4.8 - - -
Return on equity, % 28.5 -11.7 40.2 - - -
Average number of staff (FTE) 545 521 24 - - -
Results
Key figures

Sampo Group’S reSultS for 2012 buSiNESS arEaS iN 2012
11
Investment allocation,Mandatum Life, total EUR 5.5 billion
Money Market 10%
Fixed Income 48%
Equities 29%
Private Equity 5%
Real Estate 3%
Other 6%
majority of mandatum life’s traditional policies carry a guaranteed interest of 3.5 per cent. Individual policies sold in finland before 1999 carry a guaranteed interest of 4.5 per cent. the discount rate for these policies has been lowered to 3.5 per cent and subsequently technical reserves have been supplemented with eur 71 million (79). In addition, eur 47 million has been reserved to lower the interest rate of all with-profit liabilities to 2.5 per cent in 2013 and to 3.25 per cent in 2014. all in all, mandatum life has increased its technical reserves with eur 118 million (108) due to low level of interest rates.
risk result amounted to eur 19 million (25) in 2012. expense result for mandatum life Group decreased in 2012 to eur 6 million (10). especially the rise of sales commissions, due to good sales performance, and bonuses burdened the result. mandatum life does not defer acquisition costs, which burdens the result for the sales year.
mandatum life Group’s premium income on own account surged to eur 977 million (849). Increase in the sales through the Danske Bank distribution channel largely explained the positive development. premiums in the main focus area of unit-linked insurance increased to eur 810 million (649). premium income from the Baltic countries was eur 33 million (41). mandatum life’s unit-linked market share in finland was 26.2 per cent (26.8) and the overall market share was 24.5 per cent (24.9). market share in the Baltic countries decreased to 11 per cent (15).

Sampo Group’S reSultS for 2012 buSiNESS arEaS iN 2012
12
Holding
Sampo plc owns and controls its subsidiaries engaged in p&C and life insurance. In addition Sampo plc held on 31 December 2012 approximately 21.2 per cent of the share capital of Nordea, the largest bank in the Nordic countries. Nordea is an associated company to Sampo plc.
the segment’s profit before taxes amounted to eur 623 million (457), of which eur 653 million (534) relates to Sampo’s share of Nordea’s 2012 profit. Segment’s profit without Nordea was eur -30 million (-77). the improvement is explained by lower finance costs and positive movement in derivative valuations.
Sampo plc’s holding in Nordea Bank was booked in the consolidated balance sheet at eur 6.7 billion. the market value of the holding was eur 6.2 billion at 31 December 2012. In addition the assets on Sampo plc’s balance sheet included holdings in subsidiaries for eur 2.4 billion (2.4).
EURm 2012 2011 Change, % Q4/2012 Q4/2011 Change, %
Net investment income 51 18 178 16 1 1,189
Other operating income 15 15 -1 4 4 9
Staff costs -18 -11 61 -3 -3 23
Other operating expenses -13 -13 -2 -3 -3 2
Finance costs -65 -86 -25 -3 -39 -91
Share of associate’s profit 653 534 22 188 161 17
profit before taxes 623 457 36 197 121 64
Change Change
Average number of staff (FTE) 53 54 -1 - - -
Results

Sampo Group’S reSultS for 2012 OThEr dEvElOpmENTS
13
Other developments
administrationline Hestvik, member of Sampo’s Group executive Committee and Head of Business area private in If p&C, resigned on 27 November 2012. morten thorsrud was nominated as the new Head of Business area private as of 1 January 2013. He has been Head of Business area Industrial in If p&C since 2005. He continues as a member of the Group executive Committee in Sampo Group.
personnel the number of full-time equivalent staff increased to 6,820 employees (6,810) as at 31 December 2012. In p&C insurance, the number of staff increased in finland and Sweden and decreased in Norway, Denmark, the Baltic countries and russia. In life insurance, the number of staff increased both in finland and the Baltic countries.
During 2012, approximately 91 per cent of the staff worked in p&C insurance, 8 per cent in life insurance and 1 per cent in the Group’s parent company Sampo plc. Geographically, 32 per cent worked in finland, 27 per cent in Sweden, 22 per cent in Norway, 8 per cent in Denmark and 11 per cent in Baltic and other countries. the average number of employees during 2012 was 6,823, which compares to an average of 6,874 during 2011.
remuneration remuneration in Sampo Group is based on the remuneration principles which Sampo plc’s Board approved on 9 November 2012. the remuneration principles apply to all companies within the Sampo Group and are available at www.sampo.com/remuneration.
In 2012 eur 17 million (7), including social costs, was paid on the basis of the long-term incentive scheme 2009:1. eur 28 million (25), including social costs, was paid as short-term incentives during the same period. the outcome of the long-term incentive schemes is determined by Sampo’s share price development over a period of approximately three years starting from the issue of the respective program. the programs are subject to thresholds on share price development and company profitability, as well as ceilings for maximum payout. furthermore, the programs are subject to rules requiring part of the paid incentive reward to be used to acquire Sampo shares, which must in turn be held for a specified period of time. the terms of the long-term incentive schemes are available at www.sampo.com/remuneration.
Shares and share capitalas at 31 December 2012, Sampo plc had 560,000,000 shares, which were divided into 558,800,000 a shares and 1,200,000 B shares. total number of votes attached to the shares is 564,800,000. each a share entitles the holder to one vote and each B share entitles the holder to five votes at the General meeting of Shareholders.

Sampo Group’S reSultS for 2012 OThEr dEvElOpmENTS
14
the annual General meeting of 2012 authorized the Board to acquire in one or several lots a maximum of 50,000,000 Sampo a shares. Shares can be repurchased in other proportion than the shareholders’ proportional shareholdings (private repurchase). the share price will be no higher than the highest price paid for Sampo shares in public trading at the time of purchase. the authorization is valid until the close of the next annual General meeting, nevertheless not more than 18 months after aGm’s decision.
Sampo plc made no repurchases during 2012 and has not purchased its own shares after the end of the reporting period.
Internal dividendsSampo Group’s parent company Sampo plc received a total of eur 768 million in dividends from its subsidiaries and associated company Nordea Bank aB during 2012.
If p&C paid in December 2012 a dividend of eur 544 million (SeK 4,700 million) and Nordea on 3 april 2012 a dividend of eur 224 million to Sampo plc. mandatum life paid no dividend to the parent company in 2012.
ratingsall the ratings for Sampo Group companies remained unchanged in 2012. Rated company Moody’s Standard and Poor’s
rating Outlook rating Outlook Sampo plc Baa2 Stable Not rated -
If P&C Insurance Ltd (Sweden) A2 Stable A Stable
If P&C Insurance Company Ltd (Finland) A2 Stable A Stable
adoption of IaS 19rthe amendment to IaS 19 employee Benefits (effective for annual periods beginning on 1 January 2013 or after) mandates all actuarial gains and losses be recognized in other comprehensive income, thus the so-called corridor approach is eliminated and the benefit cost will be determined based on the net funding.
the change will have an impact on the employee benefits recognized in the If subgroup . In the transition phase, the accumulated unrecognized losses eur 157 million plus social security fees related to the corridor method at 31 December 2011, will reduce the opening equity for the comparison year 2012. the corresponding amount at 31 December 2012 is eur 113 million. the subsequent changes will be recognized in other comprehensive income. the effect has already been taken into account in the calculation of If subgroup’s capital base.

Sampo Group’S reSultS for 2012 OThEr dEvElOpmENTS
15
Group solvency With Nordea Bank aB (publ) as its associated company as of 31 December 2009 Sampo Group became a financial and insurance conglomerate according to the act on the Supervision of financial and Insurance Conglomerates (2004/699).
Group solvency has in 2012 been calculated according to Chapter 3 of the act on the Supervision of financial and Insurance Conglomerates (2004/699). the act is based on Directive 2002/87/eC of the european parliament and of the Council on the supplementary supervision of credit institutions, insurance undertakings and investment.
Sampo Group solvencyEURm 31 Dec 2012 31 Dec 2011
Group capital 10,113 8,920Sectoral items 1,285 1,091Intangibles and other deductibles -2,518 -2,545Dividends for the current period -756 -672Group's own funds, total 8,125 6,794
Minimum requirements for own funds, total 4,767 4,902
Group solvency 3,358 1,892
Group solvency ratio(Own funds % of minimum requirements) 170.4 138.6
Group solvency ratio (own funds in relation to minimum requirements for own funds) increased significantly during 2012 and amounted to 170.4 per cent (138.6) as at 31 December 2012. the increase was mainly caused by higher equity in Sampo Group and strong capital generation in Nordea. Changes in other items were relatively small.
In addition to the aforementioned conglomerate solvency considerations, Sampo Group’s solvency is assessed internally by comparing the capital required to the capital available. Capital requirement assessment is based on an economic capital framework, in which Group companies quantify the amount of capital required for measurable risks over a one year time horizon at 99.5 per cent’s confidence level. In addition to economic capital, companies assess their capital need related to non-measurable risks like risks in business environment.
Capital available or adjusted Solvency Capital include regulatory capital and in addition other loss absorbing items like the effect of discounting technical reserves and other reserves excluded from regulatory capital.
the economic capital tied up in Group’s operations on 31 December 2012 was eur 4,560 million (4,374) and adjusted solvency capital was eur 8,197 million (7,262).

Sampo Group’S reSultS for 2012 OThEr dEvElOpmENTS
16
Debt financingSampo plc’s debt financing at the end of 2012 amounted to eur 2,162 million and interest bearing assets including bank accounts to eur 1,048 million. During the year the net debt decreased to eur 1,113 million (1,208). at the end of 2012 gross debt to Sampo plc’s equity was 32 per cent (35).
the financial liabilities in Sampo plc’s balance sheet on 31 December 2012 consisted of issued senior bonds and notes of eur 1,710 million (1,677) and eur 451 million (652) of issued short-term Cps. the average interest on Sampo plc’s debt on 31 December 2012 was 2.33 per cent (3.73).
more information on Sampo Group’s outstanding debt issues is available at www.sampo.com/debtfinancing.

Sampo Group’S reSultS for 2012 OuTlOOk
17
Outlook
outlook for 2013 Sampo Group’s business areas are expected to report good operating results for 2013. However, the mark-to-market results are, particularly in life insurance, highly dependent on capital market developments. the low interest rate level also creates a challenging environment for reinvestment in fixed income instruments.
In light of the excellent combined ratio development in 2012, the p&C insurance operations are expected to reach their long-term combined ratio target of below 95 per cent in 2013 by a margin. Nordea’s contribution to the Group’s profit is expected to be significant.
the major risks and uncertainties to the Group in the near term In its day-to-day business activities Sampo Group is exposed to various risks. as a financial group the major sources of profitability and its variation for Sampo Group are market, credit and insurance risks. their contributions to the Group’s economic Capital - used as an internal basis for capital needs – currently represent normal levels of 40 per cent, 35 per cent and 13 per cent, respectively.
abrupt changes in the business environment or major unforeseen events may always impact the profitability of Sampo Group. adverse structural and macro economic developments, such as current crisis in europe, and slow growth are major sources of uncertainty which may escalate in ways that can affect the Group’s activities unfavorably. this is, however, mitigated by the fact that Sampo Group companies do not have direct exposures in sovereigns under pressure and have small exposure to banking sector outside the Nordic region.

Sampo Group’S reSultS for 2012 dividENd prOpOSal
18
according to Sampo plc’s dividend policy, total annual dividends paid shall be at least 50 per cent of Group’s net profit for the year (excluding extraordinary items). In addition, share buy-backs can be used to complement the cash dividend.
the parent company’s distributable capital and reserves totaled eur 6,694,652,272.86, of which profit for the financial year was eur 737,122,584.60.
the Board proposes to the annual General meeting a dividend of eur 1.35 per share to company’s 560,000,000 shares. the dividends to be paid are eur 756,000,000.00 in total. rest of funds are left in the equity capital.
the dividend will be paid to shareholders registered in the register of Shareholders held by euroclear finland ltd as at the record date of 23 april 2013. the Board proposes that the dividend be paid on 30 april 2013.
No significant changes have taken place in the company’s financial position since the end of the financial year. the company’s liquidity position is good and in the view of the Board, the proposed distribution does not jeopardize the company’s ability to fulfill its obligations.
SAMPO PLC Board of Directors
Dividend proposal

Sampo Group’S reSultS for 2012 iNFOrmaTiON
19
for more information, please contactpeter Johansson, Group Cfo, tel. +358 10 516 0010Jarmo Salonen, Head of Investor relations and Group Communications, tel. +358 10 516 0030Essi Nikitin, Ir manager, tel. +358 10 516 0066maria Silander, press officer, tel. +358 10 516 0031
press and telephone conferences Sampo will today arrange a finnish-language press conference (Savoy, eteläesplanadi 14, Helsinki), at 12.30 pm finnish time.
an english-language telephone conference for investors and analysts will be arranged at 4 pm finnish time (2 pm uK time).
please call +1 334 323 6203 or +44 (0)20 7162 0125. please be ready to state the ID number ‘928471’ and the password ‘Sampo’.
the telephone conference can also be followed live on the internet at www.sampo.com/result. a recorded version will later be available at the same address.
In addition a Supplementary financial Information package is available at www.sampo.com/result.
Sampo Group’s annual report 2012 will be published in week 11. at the same time Sampo Group’s Corporate Governance Statement and remuneration report will also be published.
Sampo will publish the first quarter 2013 Interim report on 8 may 2013.
DIStrIButIoN: NaSDaQ omX Helsinki the principal media financial Supervisory authority www.sampo.com

Sampo Group’S reSultS for 2012 TablES 31 dECEmbEr 2012
20
Group financial review
Financial highlights
Group 1–12/2012 1–12/2011
Profit before taxes EURm 1,616 1,228Return on equity (at fair value) % 19.5 7.7Return on assets (at fair value) % 9.1 3.7Equity/assets ratio % 31.6 29.7Group solvency ¹) EURm 3,358 1,892Group solvency ratio % 170.4 138.6Average number of staff 6,823 6,874
Property & casualty insurancePremiums written before reinsurers' share EURm 4,698 4,414Premiums earned EURm 4,363 4,094Profit before taxes EURm 858 636Return on equity (at current value) % 36.2 12.4Risk ratio ²) % 65.9 68.4Cost ratio ²) % 23.3 23.5Loss ratio, excl. unwinding of discounting ²) % 72.1 74.7Expense ratio ²) % 17.1 17.3Combined ratio, excl. unwinding of discounting % 89.3 92.0Average number of staff 6,225 6,299
Life insurancePremiums written before reinsurers' share EURm 983 854Profit before taxes EURm 136 137Return on equity (at current value) % 28.5 -11.7Expense ratio % 113.9 109.1Average number of staff 545 521
HoldingProfit before taxes EURm 623 456Average number of staff 53 54
Per share key figuresEarnings per share EUR 2.51 1.85Earnings per share, incl. other comprehensive income EUR 3.31 1.22Capital and reserves per share EUR 18.06 15.93Net asset value per share EUR 17.55 14.05Adjusted share price, high EUR 25.04 23.90Adjusted share price, low EUR 17.91 16.85Market capitalisation EURm 13,630 10,735
¹) The Group solvency is calculated according to the consolidation method defined in Chapter 3 of the Act on the Supervision of Financial and Insurance Conglomerates (2004/699).
²) The key figures for P&C Insurance are based on activity based costs and cannot, therefore, be calculated directly from the consolidated income statement. The result analysis of P&C insurance is presented in note 13.
The number of shares used at the balance sheet date and as the average number during the financial period was 560,000,000.
The valuation differences on investment property have been taken into account in calculating the return on assets, return on equity, equity/assets ratio and net asset value per share. The tax component includes the tax corresponding to the result for the period, and the deferred tax liability related to valuation differences on investment property.
The total comprehensive income has been used in the calculation of the return on assets and return on equity.
The key figures for the insurance business have been calculated in accordance with the decree issued by the Ministry of Finance and the specifying regulations and instructions of the Finance Supervisory Authority.

Sampo Group’S reSultS for 2012 TablES 31 dECEmbEr 2012
21
Calculation of key figures
Return on equity (fair values), % + total comprehensive income
valuation differences on investments less deferred tax x 100 %+ total equity
valuation differences on investments less deferred tax (average of values 1 Jan. and the end of reporting period)
Return on assets (at fair values), % + operating profit
other comprehensive income before taxes+ interest and other financial expense + calculated interest on technical provisions
change in valuation differences on investments x 100 %+ balance sheet, total – technical provisions relating to unit-linked insurance
valuation differences on investments (average of values on 1 Jan. and the end of the reporting period)
Equity/assets ratio (at fair values), % + total equity
valuation differences on investments after deduction of deferred tax x 100 %+ balance sheet total
valuation differences on investments
Risk ratio for P&C Insurance, % + claims incurred – claims settlement expenses x 100 % insurance premiums earned
Cost ratio for P&C Insurance, % + operating expenses + claims settlement expenses x 100 % insurance premiums earned
Loss ratio for P&C Insurance, % claims incurred x 100 % insurance premiums earned
Expense ratio for P&C Insurance, % operating expenses x 100 % insurance premiums earned
Combined ratio for P&C Insurance, % Loss ratio + expense ratio
Expense ratio for life insurance, % + operating expenses before change in deferred acquisition costs + claims settlement expenses x 100 % expense charges

Sampo Group’S reSultS for 2012 TablES 31 dECEmbEr 2012
22
Per share key figures
Earnings per share profit for the financial period attributable to the parent company’s equity holders adjusted average number of shares
Equity per share equity attributable to the parent company’s equity holders adjusted number of shares at the balance sheet date
Net asset value per share+ equity attributable to the parent company’s equity holders
valuation differences on listed associates in the Group valuation differences after the deduction of deferred taxes
adjusted number of shares at balance sheet date
Market capitalisation number of shares at the balance sheet date x closing share price at the balance sheet date

Sampo Group’S reSultS for 2012 TablES 31 dECEmbEr 2012
23
Group quarterly comprehensive income statement
EURm 10–12/2012 7–9/2012 4–6/2012 1–3/2012 10–12/2011
Insurance premiums written 1,240 1,092 1,236 1,845 1,117
Net income from investments 205 308 74 380 199
Other operating income 10 8 7 10 8
Claims incurred -872 -898 -831 -939 -984Change in liabilities for insurance and investment contracts -37 31 71 -785 141
Staff costs -124 -166 -144 -153 -136
Other operating expenses -174 -130 -138 -135 -147
Finance costs -4 -26 -16 -29 -41
Share of associates' profit/loss 201 148 181 169 164
profit for the period before taxes 444 368 440 363 322
Taxes -43 -54 -68 -47 -43
profit for the period 401 314 372 317 279
Other comprehensive income for the periodExchange differences on translating foreign operations -45 67 11 15 58
Available-for-sale financial assets 71 257 -227 407 177
Cash flow hedges 0 0 0 0 0Share of other comprehensive income of associates -17 11 -3 18 52
Income tax relating to components of other comprehensive income -3 -65 56 -103 -42
Other comprehensive income for the period, net of tax 7 270 -163 337 245
TOTal COmprEhENSivE iNCOmE FOr ThE pEriOd 408 584 209 654 524
profit attributable to Owners of the parent 401 314 372 317 279
Non-controlling interests - - 0 0 0
Total comprehensive income attributable to Owners of the parent 408 584 209 654 524
Non-controlling interests - - 0 0 0

Sampo Group’S reSultS for 2012 TablES 31 dECEmbEr 2012
24
Consolidated comprehensive income statement, IfrS
EURm Note 1–12/2012 1–12/2011
Insurance premiums written 1 5,413 5,050
Net income from investments 2 967 260
Other operating income 35 32
Claims incurred 3 -3,540 -3,723Change in liabilities for insurance and investment cont-racts -719 241
Staff costs 4 -588 -543
Other operating expenses -576 -548
Finance costs -75 -82
Share of associates' profit/loss 700 541
profit before taxes 1,616 1,228
Taxes -212 -189
profit for the period 1,404 1,038
Other comprehensive income for the periodExchange differences 48 6
Available-for-sale financial assets 509 -520
Cash flow hedges -1 -2
Share of other comprehensive income of associates 9 23Income tax relating to components of other comprehensive income -114 141
Other comprehensive income for the period, net of tax 451 -352
TOTal COmprEhENSivE iNCOmE FOr ThE pEriOd 1,855 686
profit attributable to Owners of the parent 1,404 1,038
Non-controlling interests - 0
Total comprehensive income attributable to Owners of the parent 1,855 686
Non-controlling interests - 0
basic earnings per share (eur) 2.51 1.85

Sampo Group’S reSultS for 2012 TablES 31 dECEmbEr 2012
25
Consolidated balance sheet, IfrS
EURm Note 12/2012 12/2011
assetsProperty, plant and equipment 26 26
Investment property 122 118
Intangible assets 5 771 745
Investments in associates 7,049 6,593
Financial assets 6, 7 16,857 16,745
Investments related to unit-linked insurance contracts 8 3,833 3,053
Tax assets 44 64
Reinsurers' share of insurance liabilities 580 532
Other assets 1,729 1,659
Cash and cash equivalents 1,034 572
Total assets 32,045 30,107
liabilitiesLiabilities for insurance and investment contracts 9 13,925 13,796Liabilities for unit-linked insurance and investment contracts 10 3,832 3,054
Financial liabilities 11 2,378 2,768
Tax liabilities 542 474
Provisions 56 37
Employee benefits 76 98
Other liabilities 1,123 960
Total liabilities 21,932 21,187
Equity
Share capital 98 98
Reserves 1,531 1,531
Retained earnings 7,587 6,844
Other components of equity 898 447
Equity attributable to owners of the parent 10,113 8,920
Non-controlling interests - 0
Total equity 10,113 8,920
Total equity and liabilities 32,045 30,107

Sampo Group’S reSultS for 2012 TablES 31 dECEmbEr 2012
26
Statement of changes in equity, IfrS
EURmShare
capital
Sharepremium
accountLegal
reserve
Invested un-
restricted equity
Retained earnings
Trans- lation
of foreignoperations
*)
Available-for-sale
financial assets **)
Cash flow
hedges ***) Total
Equity at 1 January 2011 98 0 4 1,527 6,459 62 734 3 8,886
Changes in equityRecognition of undrawn dividends 13 13
Dividends -645 -645
Acquistion of treasury shares -24 -24Share of associate’s other changes in equity 4 4
Total comprehensive income for the period 1,038 3 -379 24 686
Equity at 31 december 2011 98 0 4 1,527 6,844 91 354 1 8,920
Equity at 1 January 2012
Changes in equityRecognition of undrawn dividends 6 6
Dividends -672 -672Share of associate's other changes in equity -4 -4
Other changes in equity 9 9Total comprehensive income for the period 1,404 76 406 -30 1,855
Equity at 31 december 2012 98 0 4 1,527 7,587 167 760 -29 10,113
*) The total comprehensive income includes also the share of the associate Nordea’s other comprehensive income, in accordance with the Group’s share holding. Nordea’s other comprehensive income comprise, to a large extent, the currency hedging of net investments and exchange differences, and therefore the Group’s exchange differences include also Sampo’s share of these items totalling EURm 28 (23). Available-for-sale financial assets include the share of Nordea’s valuation differences EURm 11 (-) on these assets. Nordea’s share of cash flow hedges amounted to EURm -29 (26).
**) The amount recognised in equity from available-for-sale financial assets for the period totalled EURm 384 (-409). The amount transferred to p/l amounted to EURm 11 (30).
***) The amount recognised in equity from cash flow hedges for the period totalled EURm -1 (-2) .
The amount included in the translation, available-for-sale and cash flow hedge reserves represent other comprehensive income for each component, net of tax.
Sampo Group’S reSultS for 2012 TablES 31 dECEmbEr 2012
27
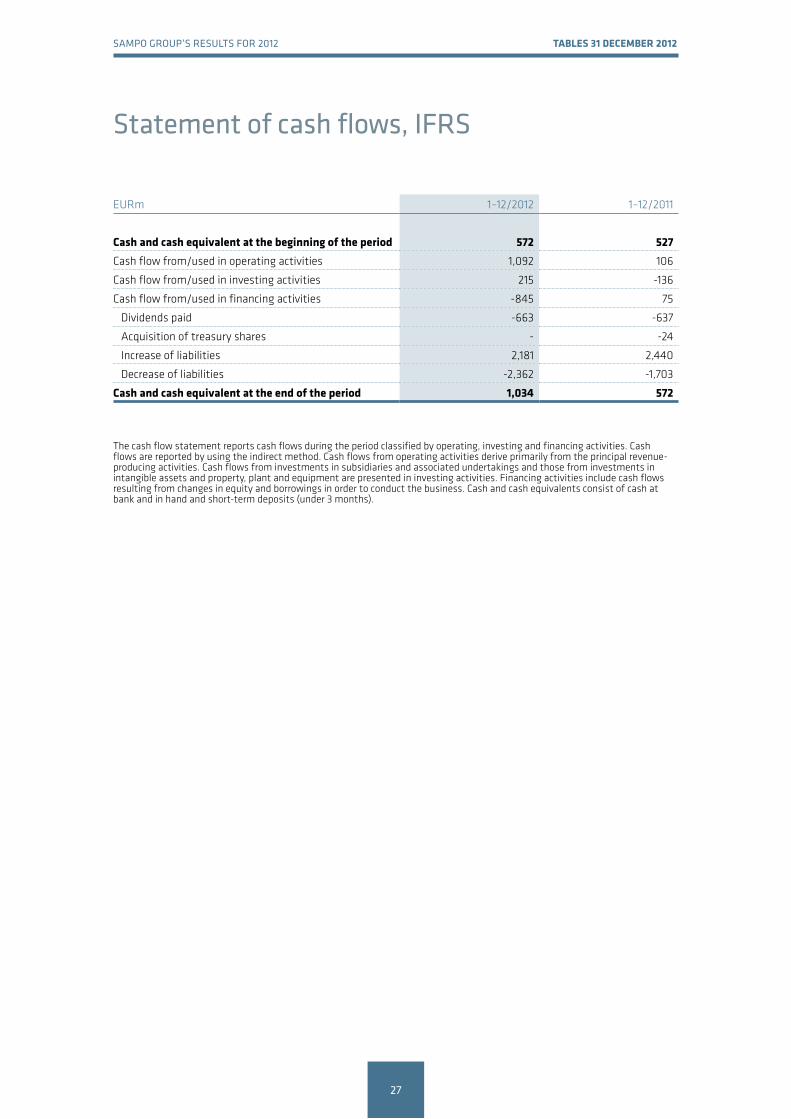
Statement of cash flows, IfrS
EURm 1–12/2012 1–12/2011
Cash and cash equivalent at the beginning of the period 572 527Cash flow from/used in operating activities 1,092 106
Cash flow from/used in investing activities 215 -136
Cash flow from/used in financing activities -845 75
Dividends paid -663 -637
Acquisition of treasury shares - -24
Increase of liabilities 2,181 2,440
Decrease of liabilities -2,362 -1,703
Cash and cash equivalent at the end of the period 1,034 572
The cash flow statement reports cash flows during the period classified by operating, investing and financing activities. Cash flows are reported by using the indirect method. Cash flows from operating activities derive primarily from the principal revenue-producing activities. Cash flows from investments in subsidiaries and associated undertakings and those from investments in intangible assets and property, plant and equipment are presented in investing activities. Financing activities include cash flows resulting from changes in equity and borrowings in order to conduct the business. Cash and cash equivalents consist of cash at bank and in hand and short-term deposits (under 3 months).

Sampo Group’S reSultS for 2012 TablES 31 dECEmbEr 2012
28
Notes
Accounting policies Sampo Group’s consolidated financial statements are prepared in accordance with the International financial reporting Standards (IfrS) adopted by the eu. the interim financial statements are presented in accordance with IaS 34 Interim Financial Reporting. In preparing the interim financial statements, the same accounting policies and methods of computation are applied as in the financial statements for 2011.
Sampo adopted various new or revised standards and interpretations at the beginning of the year 2012. these standards and interpretations are explained in Sampos accounting policies for the financial year 2011. the financial statements are available at www.sampo.com/annualreport.

Sampo Group’S reSultS for 2012 TablES 31 dECEmbEr 2012
29
Comprehensive income statement by segment for twelve months ended 31 December 2012
EURm P&C insurance Life insurance Holding Elimination Group
Insurance premius written 4,441 977 - -5 5,413
Net income from investments 359 574 51 -18 967
Other operating income 33 3 15 -16 35
Claims incurred -2,876 -669 - 4 -3,540Change in liabilities for insurance and investment contracts -78 -642 - 1 -719
Staff costs -527 -42 -18 0 -588
Other operating expenses -521 -58 -13 16 -576
Finance costs -19 -7 -65 16 -75
Share of associates' profit/loss 46 0 653 0 700
profit before taxes 858 136 623 -1 1,616
Taxes -185 -28 1 0 -212
profit for the period 673 108 624 -1 1,404
Other comprehensive income for the periodExchange differences 48 0 - - 48
Available-for-sale financial assets 281 236 -2 -6 509
Cash flow hedges - -1 - - -1Share of other comprehensive income of associates - - 9 - 9
Income tax relating to components of other comprehensive income -56 -58 0 0 -114
Other comprehensive income for the period, net of tax 272 177 8 -6 451
TOTal COmprEhENSivE iNCOmE FOr ThE pEriOd 945 286 631 -7 1,855
profit attributable to Owners of the parent 1,404
Non-controlling interests 0
Total comprehensive income attributable to Owners of the parent 1,855
Non-controlling interests 0

Sampo Group’S reSultS for 2012 TablES 31 dECEmbEr 2012
30
Comprehensive income statement by segment for twelve months ended 31 December 2011
EURm P&C insurance Life insurance Holding Elimination Group
Insurance premius written 4,201 849 - - 5,050
Net income from investments 298 -41 18 -16 260
Other operating income 31 2 15 -15 32
Claims incurred -2,801 -922 - - -3,723Change in liabilities for insurance and investment contracts -107 348 - - 241
Staff costs -494 -38 -11 - -543
Other operating expenses -497 -53 -13 15 -548
Finance costs -2 -8 -86 14 -82
Share of associates' profit/loss 7 0 534 - 541
profit before taxes 636 137 457 -3 1,228
Taxes -159 -30 -1 0 -189
profit for the period 478 107 456 -3 1,038
Other comprehensive income for the periodExchange differences 6 0 - - 6
Available-for-sale financial assets -239 -304 3 20 -520
Cash flow hedges - -2 - - -2Share of other comprehensive income of associates - - 23 - 23
Income tax relating to components of other comprehensive income 63 84 -1 -5 141
Other comprehensive income for the period, net of tax -170 -222 25 15 -352
TOTal COmprEhENSivE iNCOmE FOr ThE pEriOd 308 -115 481 12 686
profit attributable to Owners of the parent 1,038
Non-controlling interests 0
Total comprehensive income attri-butable to Owners of the parent 686
Non-controlling interests 0

Sampo Group’S reSultS for 2012 TablES 31 dECEmbEr 2012
31
Consolidated balance sheet by segment at 31 December 2012
EURm P&C insurance Life insurance Holding Elimination Group
assetsProperty, plant and equipment 16 5 4 - 26
Investment property 27 95 4 -4 122
Intangible assets 606 164 0 - 771
Investments in associates 362 0 6,687 - 7,049
Financial assets 11,200 5,269 3,028 -2,641 16,857Investments related to unit-linked insurance contracts - 3,834 - -1 3,833
Tax assets 31 0 18 -5 44Reinsurers' share of insurance liabilities 577 3 - - 580
Other assets 1,592 109 41 -13 1,729
Cash and cash equivalents 407 154 473 - 1,034
Total assets 14,818 9,635 10,256 -2,663 32,045
liabilitiesLiabilities for insurance and invest-ment contracts 9,854 4,071 - - 13,925
Liabilities for unit-linked insurance and investment contracts - 3,833 - -1 3,832
Financial liabilities 362 105 2,181 -270 2,378
Tax liabilities 389 153 - 0 542
Provisions 56 - - - 56
Employee benefits 76 - - - 76
Other liabilities 807 177 152 -13 1,123
Total liabilities 11,544 8,340 2,333 -284 21,932
EquityShare capital 98
Reserves 1,531
Retained earnings 7,587
Other components of equity 898Equity attributable to owners of the parent 10,113
Non-controlling interests -
Total equity 10,113
Total equity and liabilities 32,045

Sampo Group’S reSultS for 2012 TablES 31 dECEmbEr 2012
32
Consolidated balance sheet by segment at 31 December 2011
EURm P&C insurance Life insurance Holding Elimination Group
assetsProperty, plant and equipment 16 6 4 - 26
Investment property 26 92 4 -4 118
Intangible assets 580 165 0 - 745
Investments in associates 340 0 6,253 - 6,593
Financial assets 10,754 5,168 3,465 -2,642 16,745Investments related to unit-linked insurance contracts - 3,053 - - 3,053
Tax assets 52 - 17 -5 64Reinsurers' share of insurance liabilities 528 3 - - 532
Other assets 1,479 133 59 -12 1,659
Cash and cash equivalents 390 93 89 - 572
Total assets 14,165 8,713 9,891 -2,662 30,107
liabilitiesLiabilities for insurance and investment contracts 9,547 4,249 - - 13,796
Liabilities for unit-linked insurance and investment contracts - 3,054 - - 3,054
Financial liabilities 528 164 2,346 -269 2,768
Tax liabilities 388 85 - - 474
Provisions 37 - - - 37
Employee benefits 98 - - - 98
Other liabilities 695 151 126 -12 960
Total liabilities 11,294 7,703 2,472 -281 21,187
EquityShare capital 98
Reserves 1,531
Retained earnings 6,844
Other components of equity 447Equity attributable to owners of the parent 8,920
Non-controlling interests 0
Total equity 8,920
Total equity and liabilities 30,107

Sampo Group’S reSultS for 2012 TablES 31 dECEmbEr 2012
33
other notes, eurm
1 Insurance premiums
P&C insurance 1–12/2012 1–12/2011
premiums from insurance contractsPremiums written, direct insurance 4,590 4,324
Premiums written, assumed reinsurance 109 90
premiums written, gross 4,698 4,414Ceded reinsurance premiums written -258 -213
p&C insurance, total 4,441 4,201
Change in unearned premium provision -79 -106
Reinsurers' share 1 -1
premiums earned for p&C insurance, total 4,363 4,094
Life insurance 1–12/2012 1–12/2011
premiums from insurance contractsPremiums from contracts with discretionary participation feature 168 201
Premiums from unit-linked contracts 421 339
Premiums from other contracts 1 1
insurance contracts, total 591 541Assumed reinsurance 2 2
premiums from investment contractsPremiums from contracts with discretionary participation feature 0 1
Premiums from unit-linked contracts 389 310
investment contracts, total 389 311Reinsurers' shares -5 -5
life insurance, total 977 849
Single and regular premiums from direct insuranceRegular premiums, insurance contracts 381 360
Single premiums, insurance contracts 210 186
Single premiums, investment contracts 389 307
Total 981 852
Elimination items between segments -5 -
Group, total 5,413 5,050

Sampo Group’S reSultS for 2012 TablES 31 dECEmbEr 2012
34
P&C insurance 1–12/2012 1–12/2011
Financial assetsDerivative financial instruments -12 -18
Financial assets designated as at fair value through p/l
Debt securities 6 2
Equity securities 0 2
Total 7 4
Loans and receivables 18 21
Financial asset available-for-sale
Debt securities 393 416
Equity securities 25 -53
Total 418 363
Total financial assets 430 370
Income from other assets 0 0
Fee and commission expense -11 -9
Expense on other than financial liabilities -3 -7
Effect of discounting annuities -57 -56
p&C insurance, total 359 298
2 Net income from investments >

Sampo Group’S reSultS for 2012 TablES 31 dECEmbEr 2012
35
Life insurance 1–12/2012 1–12/2011
Financial assetsDerivative financial instruments 42 -14
Financial assets designated as at fair value through p/l
Debt securities 2 8
Equity securities 0 0
Total 3 8
Investments related to unit-linked contracts
Debt securities 71 9
Equity securities 248 -288
Loans and receivables 1 3
Other financial assets -26 -21
Total 294 -296
Loans and receivables 1 4
Financial asset available-for-sale
Debt securities 157 159
Equity securities 66 83
Total 224 242
Total income from financial assets 563 -56
Other assets 2 6
Fee and commission income, net 9 10
life insurance, total 574 -41
> 2 Net income from investments >

Sampo Group’S reSultS for 2012 TablES 31 dECEmbEr 2012
36
Holding 1–12/2012 1–12/2011
Financial assetsDerivative financial instruments 23 2
Loans and other receivables 0 -2
Financial assets available-for-sale
Debt securities 24 13
Equity securities 4 5
Total 28 18
Other assets 0 0
Fee income, net 0 0
holding, total 51 18
Elimination items between segments -18 -16
Group, total 967 260
> 2 Net income from investments
Sampo Group’S reSultS for 2012 TablES 31 dECEmbEr 2012
37
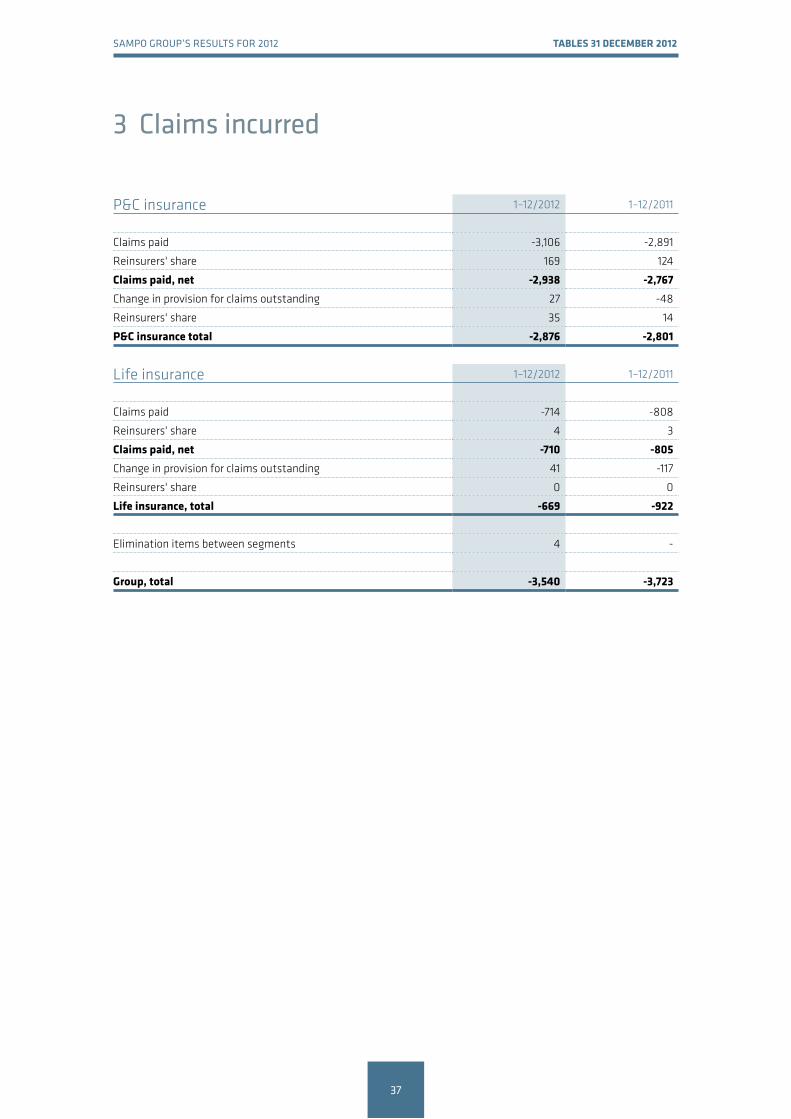
P&C insurance 1–12/2012 1–12/2011
Claims paid -3,106 -2,891
Reinsurers' share 169 124
Claims paid, net -2,938 -2,767Change in provision for claims outstanding 27 -48
Reinsurers' share 35 14
p&C insurance total -2,876 -2,801
Life insurance 1–12/2012 1–12/2011
Claims paid -714 -808
Reinsurers' share 4 3
Claims paid, net -710 -805Change in provision for claims outstanding 41 -117
Reinsurers' share 0 0
life insurance, total -669 -922
Elimination items between segments 4 -
Group, total -3,540 -3,723
3 Claims incurred

Sampo Group’S reSultS for 2012 TablES 31 dECEmbEr 2012
38
P&C insurance 1–12/2012 1–12/2011
Wages and salaries -381 -356
Granted cash-settled share options -16 -5
Pension costs -56 -65
Other social security costs -75 -68
p&C insurance, total -527 -494
Life insurance 1–12/2012 1–12/2011
Wages and salaries -31 -30
Granted cash-settled share options -3 -1
Pension costs -5 -5
Other social security costs -2 -2
life insurance, total -42 -38
Holding 1–12/2012 1–12/2011
Wages and salaries -8 -8
Granted cash-settled share options -7 -2
Pension costs -3 -1
Other social security costs -1 -1
holding, total -18 -11
Group, total -588 -543
4 Staff costs
Sampo Group’S reSultS for 2012 TablES 31 dECEmbEr 2012
39
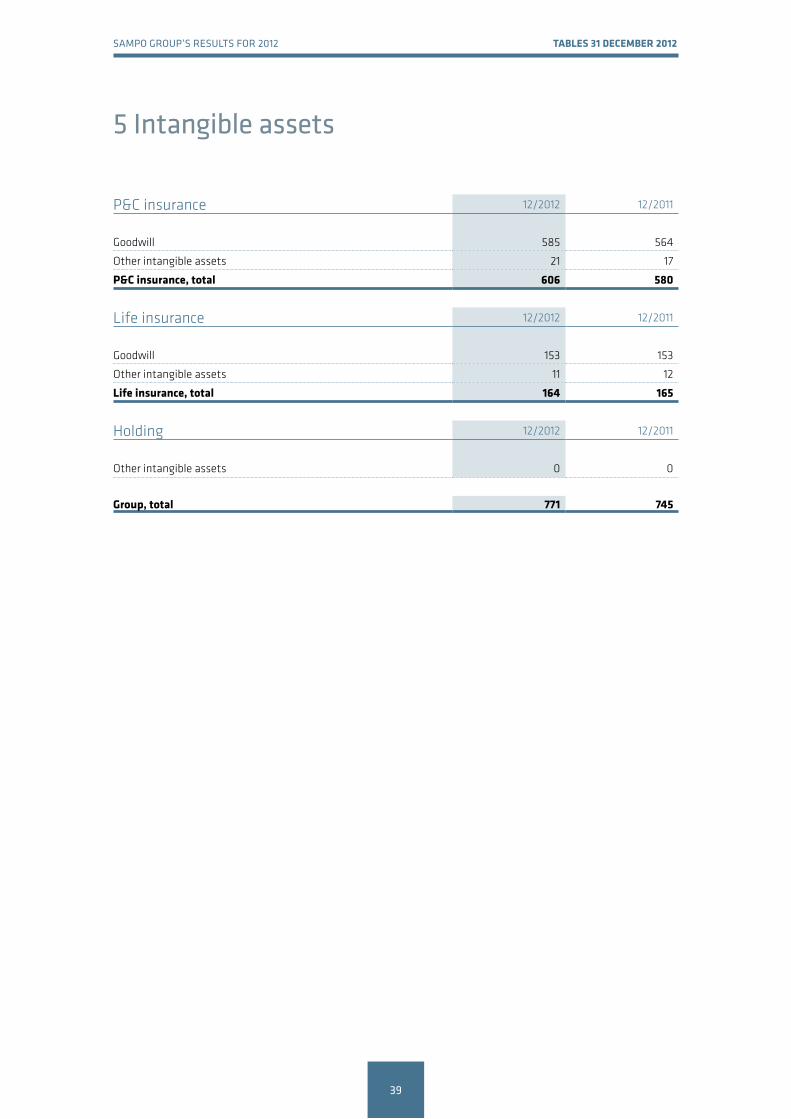
P&C insurance 12/2012 12/2011
Goodwill 585 564
Other intangible assets 21 17
p&C insurance, total 606 580
Life insurance 12/2012 12/2011
Goodwill 153 153
Other intangible assets 11 12
life insurance, total 164 165
Holding 12/2012 12/2011
Other intangible assets 0 0
Group, total 771 745
5 Intangible assets

Sampo Group’S reSultS for 2012 TablES 31 dECEmbEr 2012
40
P&C insurance 12/2012 12/2011
Derivative financial instruments (Note 7) 49 114
Financial assets designated as at fair value through p/l
Debt securities 19 155
Equity securities 2 2
Total 22 157
Loans and receivables
Loans 83 82
Deposits with ceding undertakings 1 1
Total 85 83
Financial assets available-for-sale
Debt securities 9,675 9,113
Equity securities 1,370 1,287
Total 11,045 10,400
p&C insurance, total 11,200 10,754
Life insurance 12/2012 12/2011
Derivative financial instruments (Note 7) 60 36
Financial assets designated as at fair value through p/l
Debt securities 47 50
Equity securities 1 1
Total 48 51
Loans and receivables
Loans 22 22
Deposits with ceding undertakings 1 1
Total 23 23
Financial assets available-for-sale
Debt securities 2,786 2,832
Equity securities *) 2,353 2,226
Total 5,138 5,058
life insurance, total 5,269 5,168
*) of which investments in fixed income funds 204 233
6 financial assets >

Sampo Group’S reSultS for 2012 TablES 31 dECEmbEr 2012
41
Holding 12/2012 12/2011
Derivative financial instruments (Note 7) 59 29
Loans and receivables
Deposits 1 1
Financial assets available-for-sale
Debt securities 575 1,032
Equity securities 24 34
Total 599 1,066
Investments in subsidiaries 2,370 2,370
holding, total 3,028 3,465
Elimination items between segments -2,641 -2,642
Group, total 16,857 16,745
> 6 financial assets

Sampo Group’S reSultS for 2012 TablES 31 dECEmbEr 2012
42
7 Derivative financial instruments
P&C insurance 12/2012 12/2011
Fair value Fair value Fair value Fair valueContract/
notional amount
Assets LiabilitiesContract/
notional amount
Assets Liabilities
derivatives held for tradingInterest rate derivatives 213 2 1 555 19 16
Foreign exchange derivatives 2,173 38 36 11,961 95 186
Equity derivatives 0 0 - 0 0 -
Total 2,386 40 37 12,516 114 202
derivatives held for hedgingFair value hedges 372 9 1 277 0 0
p&C insurance, total 2,759 49 38 12,793 114 202
Life insurance 12/2012 12/2011
Fair value Fair value Fair value Fair valueContract/
notional amount
Assets LiabilitiesContract/
notional amount
Assets Liabilities
derivatives held for tradingInterest rate derivatives 778 19 2 1,750 21 0
Credit risk derivatives 531 - 2 558 10 -
Foreign exchange derivatives 1,248 17 2 912 3 25
Equity derivatives - - - 29 0 0
Total 2,556 37 5 3,248 35 25
derivatives held for hedgingCash flow hedges 9 0 - 47 2 -
Fair value hedges 575 23 - 463 - 38
Total 584 23 - 510 2 38
life insurance, total 3,141 60 5 3,758 36 64
Holding 12/2012 12/2011
Fair value Fair value Fair value Fair valueContract/
notional amount
Assets LiabilitiesContract/
notional amount
Assets Liabilities
derivatives held for tradingInterest rate derivatives 800 42 - 1,050 16 -
Credit risk derivatives 20 1 - 20 0 -
Foreign exchange derivatives 5 - 0 - - -
Equity derivatives 90 16 19 80 13 17
Total 915 59 19 1,150 29 17

Sampo Group’S reSultS for 2012 TablES 31 dECEmbEr 2012
43
8 Investments related to unit-linked insurance
Life insurance 12/2012 12/2011
Financial assets as at fair value through p/lDebt securities 826 570
Equity securities 2,711 2,190
Loans and receivables 281 293
Derivatives 16 1
life insurance, total 3,834 3,053
Elimination items between segments -1 -
Group, total 3,833 3,053

Sampo Group’S reSultS for 2012 TablES 31 dECEmbEr 2012
44
9 liabilities for insurance and investment contracts >
P&C insurance 12/2012 12/2011
insurance contractsProvision for unearned premiums 2,107 1,972
Provision for claims outstanding 7,747 7,576
p&C insurance, total 9,854 9,547
reinsurers' shareProvision for unearned premiums 55 53
Provision for claims outstanding 522 476
p&C insurance, total 577 528
Life insurance 12/2012 12/2011
insurance contractsLiabilities for contracts with DPF
Provision for unearned premiums 2,090 2,219
Provision for claims outstanding 1,972 2,020
Total 4,062 4,239
Liabilities for contracts without DPF
Provision for unearned premiums 0 0
Provision for claims outstanding 1 0
Total 1 1
Total 4,063 4,240
Assumed reinsurance
Provision for unearned premiums 1 1
Provision for claims outstanding 1 1
Total 2 2
insurance contracts, totalProvision for unearned premiums 2,091 2,220
Provision for claims outstanding 1,975 2,022
Total 4,065 4,242
investment contractsLiabilities for contracts with DPF
Provision for unearned premiums 6 7

Sampo Group’S reSultS for 2012 TablES 31 dECEmbEr 2012
45
> 9 liabilities for insurance and investment contracts
liabilities for insurance and investment contracts, totalProvision for unearned premiums 2,096 2,227
Provision for claims outstanding 1,975 2,022
life insurance, total 4,071 4,249
recoverable from reinsurersProvision for unearned premiums 0 0
Provision for claims outstanding 3 3
life insurance, total 3 3
Investment contracts do not include a provision for claims outstanding.
liability adequacy test does not give rise to supplementary claims.
exemption allowed in IfrS 4 Insurance contracts has been applied to investment contracts with Dpf or contracts with a right to trade-off for an investment contract with Dpf.these investment contracts have been valued like insurance contracts.
Group, total 13,925 13,796
10 liabilities from unit-linked insurance and investment contracts
Life insurance 12/2012 12/2011
Unit-linked insurance contracts 2,665 2,216
Unit-linked investment contracts 1,168 838
life insurance, total 3,833 3,054
Elimination items between segments -1 -
Group, total 3,832 3,054
Sampo Group’S reSultS for 2012 TablES 31 dECEmbEr 2012
46
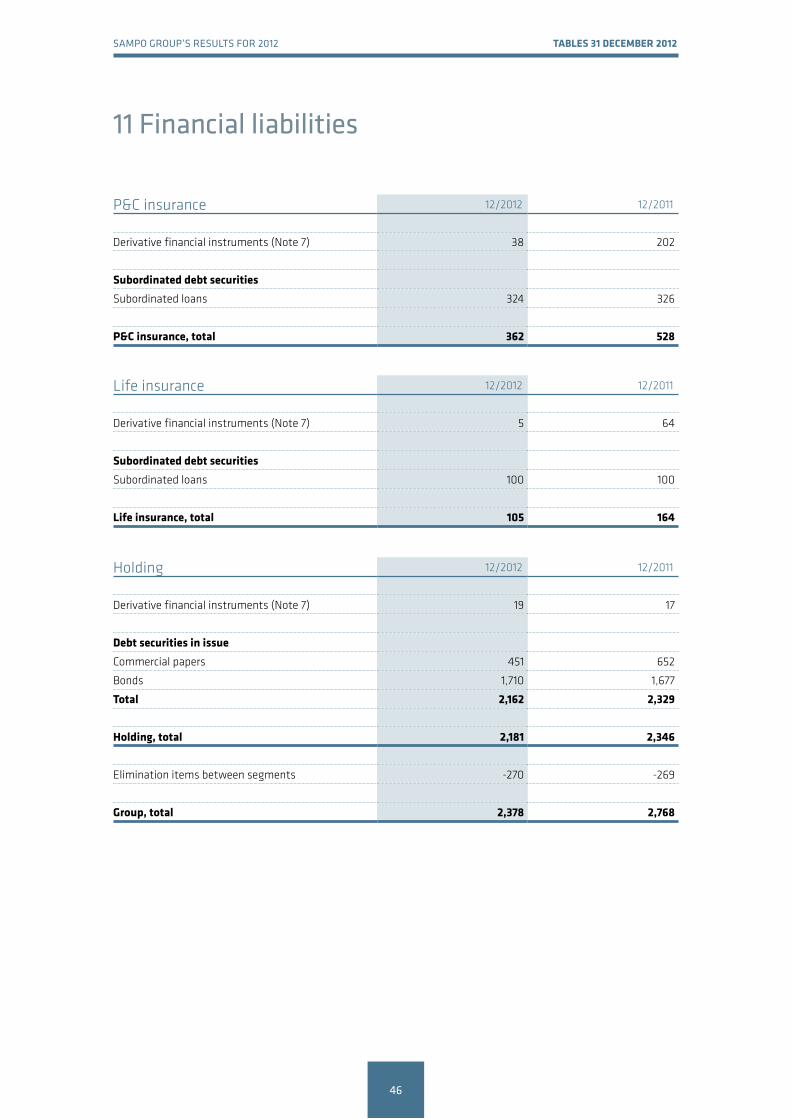
11 financial liabilities
P&C insurance 12/2012 12/2011
Derivative financial instruments (Note 7) 38 202
Subordinated debt securitiesSubordinated loans 324 326
p&C insurance, total 362 528
Life insurance 12/2012 12/2011
Derivative financial instruments (Note 7) 5 64
Subordinated debt securitiesSubordinated loans 100 100
life insurance, total 105 164
Holding 12/2012 12/2011
Derivative financial instruments (Note 7) 19 17
debt securities in issueCommercial papers 451 652
Bonds 1,710 1,677
Total 2,162 2,329
holding, total 2,181 2,346
Elimination items between segments -270 -269
Group, total 2,378 2,768

Sampo Group’S reSultS for 2012 TablES 31 dECEmbEr 2012
47
12 Contingent liabilities and commitments >
P&C insurance P&C insurance 12/2012 12/2011
Off-balance sheet itemsGuarantees 37 43
Other irrevocable commitments 6 11
Total 43 54
assets pledged as collateral for liabilities or contingent liabilities
12/2012 12/2012 12/2011 12/2011
assets pledged as collateralAssets
pledgedLiabilities/
commitmentsAssets
pledgedLiabilities/
commitments
Cash and cash equivalents 6 4 10 8
Investments
- Investment securities 285 153 142 114
Total 290 157 152 122
assets pledged as security for derivative contracts, carrying value Investment securities 40 40
The pledged assets are included in the balance sheet item Other assets.
Non-cancellable operating leases 12/2012 12/2011
Minimum lease payments
- not later than one year 37 41- later than one year and not later than five years 110 105
- later than five years 101 120
Total 248 266
Sampo Group’S reSultS for 2012 TablES 31 dECEmbEr 2012
48
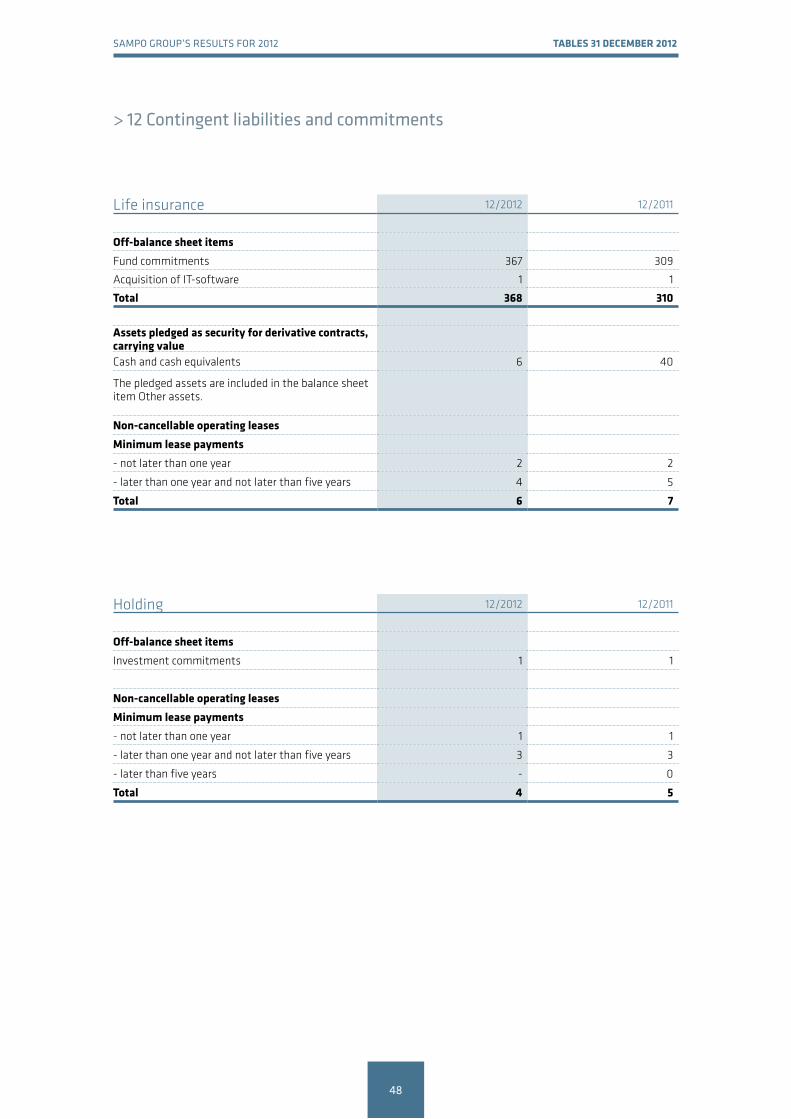
> 12 Contingent liabilities and commitments
Life insurance P&C insurance 12/2012 12/2011
Off-balance sheet itemsFund commitments 367 309
Acquisition of IT-software 1 1
Total 368 310
assets pledged as security for derivative contracts, carrying value Cash and cash equivalents 6 40
The pledged assets are included in the balance sheet item Other assets.
Non-cancellable operating leases minimum lease payments - not later than one year 2 2
- later than one year and not later than five years 4 5
Total 6 7
Holding P&C insurance 12/2012 12/2011
Off-balance sheet itemsInvestment commitments 1 1
Non-cancellable operating leases minimum lease payments - not later than one year 1 1
- later than one year and not later than five years 3 3
- later than five years - 0
Total 4 5

Sampo Group’S reSultS for 2012 TablES 31 dECEmbEr 2012
49
13 result analysis of p&C insurance business
P&C insurance 1–12/2012 1–12/2011
Premiums earned 4,363 4,094
Claims incurred -3,146 -3,058
Operating expenses -748 -707
Other technical income and expenses 3 4
Allocated investment return transferred from the non-technical account 89 124
Technical result 560 457Investment result 397 353
Allocated investment return transferred to the technical account -146 -181
Other income and expenses 46 7
Operating result 858 636

Sampo Group’S reSultS for 2012 TablES 31 dECEmbEr 2012
50
14 Sampo plc’s income statement and balance sheet (faS)
Income statement rance 1–12/2012 1–12/2011
Other operating income 15 15
Staff expenses -18 -11
Depreciation and impairment 0 0
Other operating expenses -13 -13
Operating profit -17 -10Finance income and expenses 753 693
profit before appropriations and income taxes 737 683Income taxes 1 -1
profit for the financial period 737 682
Balance sheet 12/2012 12/2011
aSSETSNon-current assets
Intangible assets 0 1
Property, plant and equipment 4 4
Investments
Shares in Group companies 2,370 2,370
Receivables from Group companies 225 223
Shares in participating undertakings 5,557 5,557
Receivables from participating undertakings - 325
Other shares and participations 28 38
Other receivables 350 484
Receivables 118 104
Cash and cash equivalents 473 89
TOTal aSSETS 9,126 9,195
liabiliTiESEquityShare capital 98 98
Fair value reserve 0 2
Invested unrestricted equity 1,527 1,527
Other reserves 273 273
Retained earnings 4,158 4,142
Profit for the year 737 682
Total equity 6,793 6,724
liabilitiesLong-term 1,710 1,677
Short-term 622 795
Total liabilities 2,333 2,472
TOTal liabiliTiES 9,126 9,195

Q3Sampo plc Fabianinkatu 2700100 Helsinki, FinlandTelephone +358 (0)10 516 0100Fax +358 (0)9 228 90 434 or +358 (0)10 516 0016
www.sampo.com