Embed Size (px)
Citation preview
TIM Group
May 17, 2018
Piergiorgio Peluso
Amos Genish

1
This presentation contains statements that constitute forward looking statements regarding the intent, belief or current expectations of future growth in the different business lines and the global business, financial results and other aspects of the activities and situation relating to the TIM Group.
Such forward looking statements are not guarantees of future performance and involve risks and uncertainties, and actual results may differ materially from those projected or implied in the forward looking statements as a result of various factors.
TIM Group financial results are prepared in accordance with the International Financial Reporting Standards issued by IASB and endorsed by the EU (IFRS). The accounting policies and consolidation principles adopted in the preparation of the 1Q18 financial results include the effects arising from the adoption of IFRS 9 Financial Instruments and IFRS 15 Revenues from Contracts with Customers.
As a result of this and for comparison purposes, the 1Q18 financial results are also presented in accordance with the prior IFRS on revenues (IAS 18, IAS 11 and related interpretations) and financial instruments (IAS 39).
1Q'18 Results

2
What CEO asked and what we did
Highlights and Main Trends
Financial Update
DigiTIM Transformation
Take-aways
1Q’18 Results
1Q'18 Results

3
Highlights
Gro
up
D
om
est
ic
Bra
zil
Organic data(1), figures in €mln, % YoY
4,260
4,393
1Q'17 1Q'18
Service Revenues
1,952
1,988
1Q'17 1Q'18
EBITDA
+3.1% +1.8%
3,331
3,399
1Q'17 1Q'18
1,642
1,628
1Q'17 1Q'18
+2.0% -0.9%
938 998
1Q'17 1Q'18
313 365
1Q'17 1Q'18
+6.4% +16.8%
Solid Group Organic growth in Revenues and Ebitda, accelerating to double-digit in Ebitda less Capex
Positive Domestic Service Revenues performance
Continued strong performance in Brazil, with impressive growth in first-level measure of OFCF
1,153
1,294
1Q'17 1Q'18
EBITDA-CAPEX
1,011
1,095
1Q'17 1Q'18
145 203
1Q'17 1Q'18
+40.1%
+8.3%
+12.2%
Organic Domestic Ebitda: slight and temporary impact by
personnel measures re-phasing net of one-offs(2), underlying
trend is +1.3% YoY deducting Capex, YoY growth
accelerates to high single-digit
(1) Excluding exchange rate impact and non-recurring items (2) Domestic Ebitda YoY one-offs: Roam-like-at-home -€10mln in 1Q’18, Change in modem sale terms -€5mln in 1Q’18, Vendor Rebates +€19mln in 1Q’17 (see annex
section)
On Reported figures, €95mln non-recurring operating expenses were mainly in relation to provisions covering the €74.3mln fine levied on May 8, 2018 for alleged infringement of the “Golden Power” rule, which TIM is contesting and will appeal against shortly.
1Q'18 Results Amos Genish

4
~50%
~31%
~11% ~8%
<1%
67%
33%
Fixed -0.2%
Mobile +4.7%
5%
95%
Fixed +11.1%
Mobile +4.5%
Domestic
Organic Performance(1), €mln, %YoY
Brazil
Consumer +1.7%
Business +3.6%
Nat. WHS +0.2%
Sparkle Group -4.3%
Inwit (+10.5%) & others
(1) Excluding exchange rate impact and non-recurring items (2) Net of eliminations
Total Mobile Revenues up mid-single digit
Total Fixed was slightly negative, slowed down by international wholesale and lower product sales (discontinuity in device policy)
Retail Fixed service revenues were up by 2.3% YoY
Positive top line contribution from all Business Units, except for Sparkle, impacted by relevant IRU May ‘17 partial renewal at lower rates.
Mobile Revenues supported by Portfolio innovation and increased 4G penetration
Consistent evolution of Fixed customer base due to the growth of TIM Live
TIM Group
Total Revs.(2)
4,742 +2.7%
o/w Domestic
3,709 +2.0%
o/w Brazil
1,037 +4.8%
1Q'18 Results Amos Genish

5
12,895 13,053
6,674 6,472
4Q'17 1Q'18
1,083 1,123
133 150
1Q'17 1Q'18
+3.7%
k, Rounded numbers, % and ∆ QoQ
(1) ARPU on Human lines (2) Includes M2M and Business–Segment Large Screens (for Inventory & Fleet Management etc.)
Broadband CB growth to above 13mln
Active customers penetration increase by 374k lines
LTE users at 10.1mln
Organic data, €mln, % YoY, ARPU €/month
Service
Total
Product
+4.7%
o/w BB Users
o/w Voice & Mess. Only
HUMAN
NOT HUMAN(2)
TOT. ACTIVE 26,992
TOT. CB 30,755 31,036 +0.9%
Revenues & ARPU Customer Base
Service Revenues performance sustained by continued increase in LTE penetration and data usage
+5.6%
19,525 -0.2%
+354
+158
-202
+12.6% 27,366 +1.4% ARPU Human(1)
15.8 €/month
+4.6% YoY
+110
-27 -230
+102 +50
+24
TIM 1Q’18 leadership in Mobile Number Portability
9,745 10,099
4Q'17 1Q'18
4G Users 77% of Mobile
BroadBand CB
Other operators
k, Rounded numbers
1Q'18 Results Amos Genish

6
2,413 2,419
172 160
1Q'17 1Q'18
1,619 1,656
Service
2,585 Total
Product
+0.2%
-0.2% 2,579
-6.9%
o/w Retail +2.3%
k, Rounded numbers, ∆ QoQ Organic data, €mln, % YoY, ARPU €/month
(1) TIM Vision fixed customers were 1,433k in 1Q’18 vs. 1,345k in 4Q’17 (2) Internal estimate of total BB accesses enabled by TIM, excluding Full
Infrastructured, Wi Max & Other non-TIM, net of market reconciliation.
(3) QoQ change on BB Accesses includes +18k Retail active and +131k Wholesale (4) Active, VoIP included
Revenues & ARPU Fixed Accesses
Key new convergent offer launched:
TIM 100%
Positive Retail Service Revenues performance, net of International Wholesale drag
ARPU Consumer
32.8 €/month
+2.7% YoY
ARPU BroadBand
25.5 €/month
+10.9% YoY
+87k TIM Vision customers on fixed
6.5% CB growth QoQ(1)
19,358 19,350
4Q'17 1Q'18
3,156 3,789
Total Accesses
BB Accesses(2)
+634
-8
o/w UBB
14,858 15,006 +149(3)
Retail(4) 11,407 11,285
Wholesale 7,951 8,065
Total Accesses 4Q’17 1Q’18
-123
+114
delta
986 1,306 +319
2,170 2,484 +314 Retail(4)
Wholesale
UBB Accesses 4Q’17 1Q’18 delta
1Q'18 Results Amos Genish

7
Organic Performance, R$mln, Rounded numbers
3.6 3.7
4.0
1Q'16 1Q'17 1Q'18
Net Service Revenues
0.4
0.6
0.8
1Q'16 1Q'17 1Q'18
EBITDA - Capex
MSR +6.2 %
YoY
Live Revs +42.7 %
YoY
EBITDA Margin
35.2 % (+3.6 p.p YoY)
EBITDA
+16.8% YoY
Mobile ARPU
+13.8% YoY
12M Postpaid Net Adds1
+3.0 Mln
Fixed UBB Arpu
(TIM Live) +12.5%
YoY
+3.5%
+6.4%
12M Fixed UBB Net
Adds +88k
700 Mhz cities +59
vs 4Q’17
FTTH2 HP +262 (000)
vs 4Q’17
Increased cash generation supported a new resolution to pay 230 mlnR$ of Interest on Capital (IoC) in August
+34.4% +40.1%
(1) Postpaid Net Adds Ex-M2M (2) Addressable households ready to sell
Highlights
Consistent Service Revenues Expansion
Solid Customer Base Growth on Mobile Postpaid and Fixed Broadband
Excellent Performance in Operating Profitability
Network Evolution Supporting Robust Operating Momentum
1Q'18 Results Amos Genish

8
What CEO asked and what we did
Highlights and Main Trends
Financial Update
DigiTIM Transformation
Take-aways
1Q’18 Results
1Q'18 Results

9
709 740 Commercial (1)
Industrial
G&A, IT and Labour
Other (2)
237 235
800 816
248 291
-3
+16
+43
Total
1Q17 1Q18
1,994 2,081 +87 (+4,4%)
+31
Addressable Opex Base 1,746 1,790
+44 (+2,5%)
EF
FIC
IEN
CY
AR
EA
(1) Including €3mln change in modem sale terms impact in 1Q’17 and 1Q’18 (2) Includes mainly Interconnection, among which there is €2mln of Roam-like-at-home impact in 1Q’18 . Also +€19mln Vendor rebates in 1Q’17 are included in «Other».
Strong OPEX discipline applied on the entire Addressable Base Commissioning and Customer Care YoY increase to: attract new customers consolidate the existing ones grow LTE penetration and fiber
adoption Industrial costs slightly down notwithstanding larger provisioning volumes on network Addressable Opex Base YoY growth shows major improvement in efficiency program
Highlights
Organic data, €mln, % YoY
1Q'18 Results Piergiorgio Peluso

10
5 7 83 50
58 37
177
123
199
190
109
127
1Q'17 1Q'18
IT
Mobile access
Fixed access
Capacity, run and maintain
CPE & success based
Total CAPEX 631
TIS
533
-33
-21
-54
-9
+17
-98 YoY -16%
Capital allocation based on updated strategic priorities and IRR evaluation Cash Flow Generation improved with continued focus on customer needs -€85 mln on Fixed and Mobile Network following a more selective and focused coverage plan -€33 mln on IT supported by careful streamlining of running costs
Highlights
Organic data, €mln, % YoY
1Q'18 Results Piergiorgio Peluso

11
25.308 25.537
25.158 (362) 379 (8) 335 24 (133) (6) 379
€mln; (-) = Cash generated, (+) = Cash absorbed
(*) No VAT Payment in 1Q’17
Cash Taxes
Total Financial Expenses
IAS 17 Leaseback
Op.FCF ex.
VAT Payment
VAT Payment *
(Split)
FY17 Disposal &
Financial Investments
1Q18 VAT Payment*
(Split)
1Q18 ex. VAT
Payment
Other Impacts
Ebitda (1.893)
Capex 694
D OWC 1.281
∆ Operating funds (65)
Operating FCF 17
+229
-150
1Q'18 Results Piergiorgio Peluso

12
What CEO asked and what we did
Highlights and Main Trends
DigiTIM Transformation
Financial Update
Take-aways
1Q’18 Results
1Q'18 Results

13
Agile organization, performance based and data driven culture
Best in class customer engagement through digital and agile customer journey redesign
Acceleration of cash-flow generation to strengthen balance sheet and increase total shareholder return
Leadership positioning by sustaining premium customer base and capturing new growth opportunities in and outside the core
1Q'18 Results Amos Genish
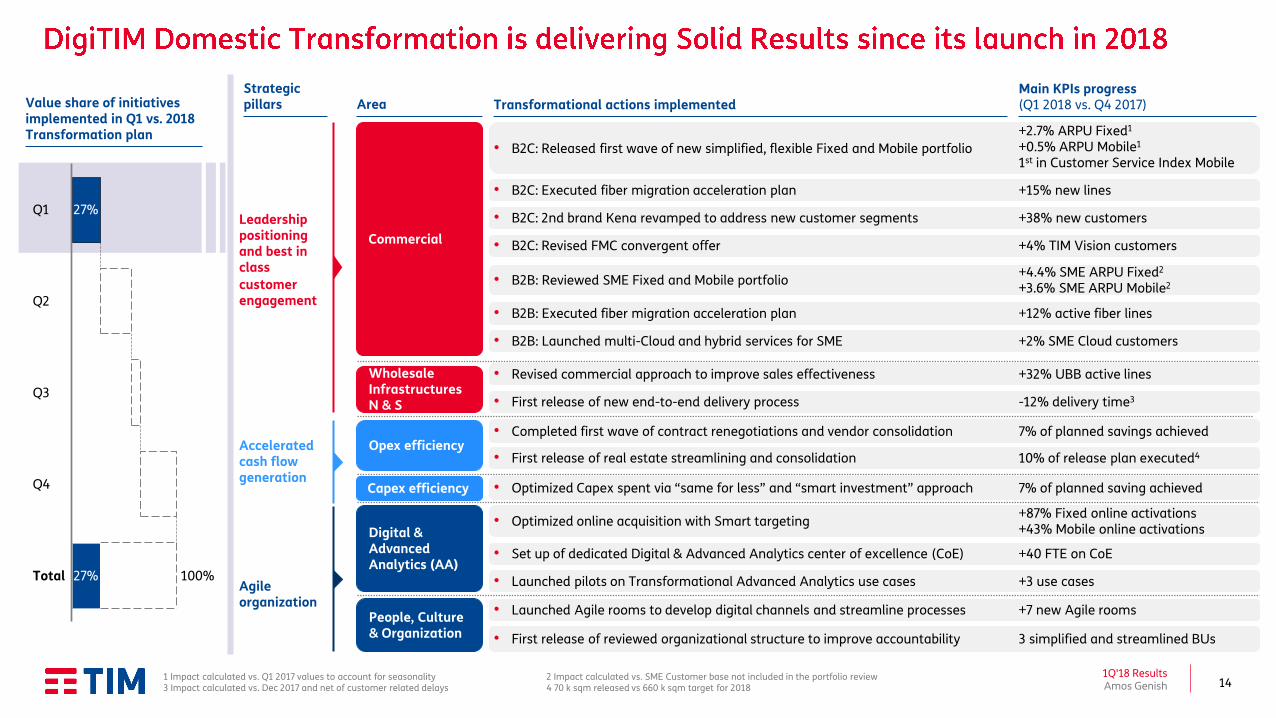
14
27%
100%
Q1
Q3
Q4
Total 27%
Q2
Value share of initiatives implemented in Q1 vs. 2018 Transformation plan
1 Impact calculated vs. Q1 2017 values to account for seasonality 2 Impact calculated vs. SME Customer base not included in the portfolio review 3 Impact calculated vs. Dec 2017 and net of customer related delays 4 70 k sqm released vs 660 k sqm target for 2018
Strategic pillars
Leadership positioning and best in class
customer engagement
Accelerated cash flow generation
Agile organization
Area
Opex efficiency
Capex efficiency
People, Culture & Organization
Digital & Advanced Analytics (AA)
Main KPIs progress (Q1 2018 vs. Q4 2017) Transformational actions implemented
+2.7% ARPU Fixed1
+0.5% ARPU Mobile1
1st in Customer Service Index Mobile • B2C: Released first wave of new simplified, flexible Fixed and Mobile portfolio
+15% new lines • B2C: Executed fiber migration acceleration plan
+38% new customers • B2C: 2nd brand Kena revamped to address new customer segments
+4% TIM Vision customers • B2C: Revised FMC convergent offer
+4.4% SME ARPU Fixed2 +3.6% SME ARPU Mobile2
• B2B: Reviewed SME Fixed and Mobile portfolio
+12% active fiber lines • B2B: Executed fiber migration acceleration plan
+2% SME Cloud customers • B2B: Launched multi-Cloud and hybrid services for SME
+32% UBB active lines • Revised commercial approach to improve sales effectiveness
-12% delivery time3 • First release of new end-to-end delivery process
10% of release plan executed4 • First release of real estate streamlining and consolidation
7% of planned savings achieved • Completed first wave of contract renegotiations and vendor consolidation
7% of planned saving achieved • Optimized Capex spent via “same for less” and “smart investment” approach
+87% Fixed online activations +43% Mobile online activations
• Optimized online acquisition with Smart targeting
+40 FTE on CoE • Set up of dedicated Digital & Advanced Analytics center of excellence (CoE)
+7 new Agile rooms • Launched Agile rooms to develop digital channels and streamline processes
• Launched pilots on Transformational Advanced Analytics use cases +3 use cases
• First release of reviewed organizational structure to improve accountability 3 simplified and streamlined BUs
Wholesale Infrastructures N & S
Commercial
1Q'18 Results Amos Genish

15
What CEO asked and what we did
Highlights and Main Trends
DigiTIM Transformation
Financial Update
Take-aways
1Q’18 Results
1Q'18 Results

16
Solid Quarterly results, driven by positive Domestic performance and strong growth in Brazil
DigiTIM Transformation underwrites Domestic Top Line and EBITDA performance for the Plan
1Q'18 Results Amos Genish

17
IR Webpage
www.telecomitalia.com/investors
+39 06 36882807 +39 02 85956807
Phone E-mail
Contact details for all IR representatives:
www.telecomitalia.com/ircontacts
Investor Relations Contact Details
TIM Slideshare
www.slideshare.net/telecomitaliacorporate
TIM Twitter
www.twitter.com/TIMNewsroom
1Q'18 Results

18
Annex
1Q'18 Results

19
• 111 k cabinets passed
• 281 k FTTH OTB installed
• 18.7 mln HH passed FTTC
in ~ 3,600 cities
speed up to 200 Mbit/s
• 2.3 mln HH connected FTTH in 30 main cities
speed up to 1Gbit/s
Fix
ed
M
ob
ile
% LTE Coverage
(1) FTTC Passed
FY17 % Total Fiber Coverage(1)
42%
~60% ~65% ~70%
72.5% 77% 78.3%
2015 2016 1Q'17 2Q'17 3Q'17 4Q'17 mar-18
1Q18
FY17
88%
>96% ~97% >97% >97% >98% >98%
2015 2016 1Q'17 2Q'17 3Q'17 4Q'17 mar-18
• ~113k cabinets passed
• ~19 mln HH passed FTTC
• FTTH: moving towards 20%
HH coverage by 2020
• >18.7k LTE nodes
• 1,437 cities 4Gplus
1Q18
• 18.6k LTE nodes
• ~7,300 cities covered in 4G
• ~1,400 cities 4Gplus
speed up to 300 Mbit/s
• 12 cities 4.5G
speed up to 700 Mbit/s
1Q'18 Results

20
I Quarter Actual 2018
Actual 2017
D abs D %
REVENUES 3,709 3,636 +73 +2.0
One-off items 3 16 (13) Roaming Like At Home (8) - (8) Change in modem sale terms 11 16 (5)
Net of One-off items 3,706 3,620 +86 +2.4
SERVICE REVENUES 3,399 3,331 +68 +2.0
One-off items (8) - (8) Roaming Like At Home (8) - (8)
Net of One-off items 3,407 3,331 +76 +2.3
EBITDA 1,628 1,642 -14 -0.9
One-off items (2) 33 (35) Roaming Like At Home (10) - (10) Change in modem sale terms 8 13 (5) Rebate - 19 (19)
Net of One-off items 1,630 1,609 +21 +1.3
Organic data, figures in €mln, ∆ YoY
1Q'18 Results

21
As from January 1, 2018, IFRS 9 (Financial Instruments) and IFRS 15 (Revenues from Contracts with Customers) have to be applied. In order to allow comparison of the results for the first quarter of 2018 with those for the same period of the previous year, financial statements data are also prepared under previous accounting principles.
IFRS 9
Impacts the determination of expected losses on trade receivables and other financial assets (change from the incurred loss model provided by IAS 39 to the expected credit loss model).
IFRS 15
Impacts the revenue recognition of fixed and mobile offerings as well as the recognition of relevant contractual costs, without any impacts on cash flows.
-9
-9
0
-67
-54
-12
Reported data, €mln, Rounded numbers
1Q'18 Results

22 1Q'18 Results

23
• Focus on value maximization via accelerated convergence and new services
• Drive digital and analytics as core differentiators (both cost and revenues)
• Look for growth in and outside the core (eg. Cloud, IoT, Mobile Advertising, Data Monetization)
• In Italy, TIM Fixed UBB lines (Retail + WHS) to grow to ~9 million by 2020 (3x 2017 figure)
DRIVERS
Sustain Top Line & Profitability
Relevant Step-up in
3-Years Cumulated Free Cash
Flow
Strong Deleverage and drop in
Capex Intensity
TARGETS / KPIs
• Group Adj. NFP/EBITDA ~2.7x in 2018, further
reducing both in 2019 and 2020 (3)
• Domestic Capex/Sales <20% by YE2019
• 2018-’20 Group Cumulated Equity Free Cash Flow
of ~ €4.5bn (4) excluding spectrum and pre-dividend
• Domestic Service Revenues : Broadly Stable
• Domestic EBITDA: Low single digit 2017-’20
CAGR (1) • Brazil & Inwit:
Continued Growth in Revenues and Ebitda (2)
• Enhanced cash generation, supported by operational and financial discipline, will lower our Group Net Debt/Ebitda ratio by end 2018
• Domestic Capex / Sales moving back to normal intensity, having now completed catch-up phase
• Selective growth investments to maximize ROI
• Lower capital intensity following network rollout
• Reduce costs while improving customer satisfaction through agile customer journey redesign
(1) On Organic basis (2) Specific Company guidance is in the Annex section
(3) Spectrum not included (4) Cumulative ’15-’17 Equity Free Cash Flow at €1.6bln, excl. M&A
Ov
er 2
01
8-2
02
0
Pla
n P
erio
d
20
18
an
d 2
01
9
20
20
GOALS
1Q'18 Results

24
• Further improve Mobile Service Revenue Share
• Expand Residential BB Revenues contribution
DRIVERS
• Zero Base approach on Traditional Efficiency
• Capture Digitalization initiatives potencial
Sustain Top Line Growth
Expand Cash Generation
Improve Profitability
LONG TERM TARGETS / KPIs
Service Revenues Growth:
Mid to High Single Digit CAGR ‘17-’20
EBITDA Margin:
≥40% in 2020
• Smart Capex “More with less” approach
• Optimize Tax Rate
• Optimize Debt and Shareholders’ Remuneration
Ebitda-Capex on Revenues:
≥20% in 2020
Capex: ~12B R$ in ‘18-’20
(~20% on Rev. in 2020)
SHORT TERM TARGETS / KPIs
Service Revenues Growth:
5-7% in 2018
EBITDA:
Double Digit growth in 2018
Ebitda-Capex on Revenues:
≥13% in 2018
GOALS
1Q'18 Results

25
• Maintain top-of-mind positioning on asset quality
• Additional tenants on existing towers
• Lead network densification phase
Maintain leadership
Improve cash-flow
generation
Revenues Growth:
Mid single Digit CAGR ‘17-’20
CAPEX:
300 mln € in 2018/20
• Reinforce leadership on small cell neutral host market
• Start sharing model on fiber backhauling
• Prepare for “5G driven” new services
Recurring FCF*:
Low Teens CAGR ‘17-’20
Tenancy Ratio:
1.9x tenants per site in 2018
EBITDA:
Low Teens CAGR ‘15-’18
Small Cells:
4k remote units in 2018
Tackle Potential Consolidation Opportunities: Business developments open to M&A opportunities, supported by INWIT strong balance sheet
Address next generation
infrastructures market
New Sites:
0,6k sites by 2018
• Win stake of demand from new players and FWA
• Take off of new businesses
• Keep up lease cost renegotiation effort and lean organization
* EBITDA – Recurring Capex – Change in Working capital – Cash Taxes – Cash Interests
DRIVERS LONG TERM
TARGETS / KPIs SHORT TERM
TARGETS / KPIs GOALS
1Q'18 Results

26
1,133
1,439
740 430
906
313
1,751
6,712 5.000
1,724
2,421
1,267 564
3,089
2,429
10,148
21,642
2,879
7,879
2,857
3,860
2,007 994
3,995
2,742
11.899 28,354
Liquidity margin Within 2018 FY 2019 FY 2020 FY 2021 FY 2022 FY 2023 Beyond 2023 Total M/L TermDebt
Covered until 2020
(1) € 28.354 mln is the nominal amount of outstanding medium-long term debt. By adding the balance of IAS adjustments and reverse fair value valuations (€ 612 mln) and current financial liabilities (€ 650 mln), the gross debt figure of € 29.616 mln is reached.
Liquidity Margin
€mln
(1)
1Q'18 Results
27
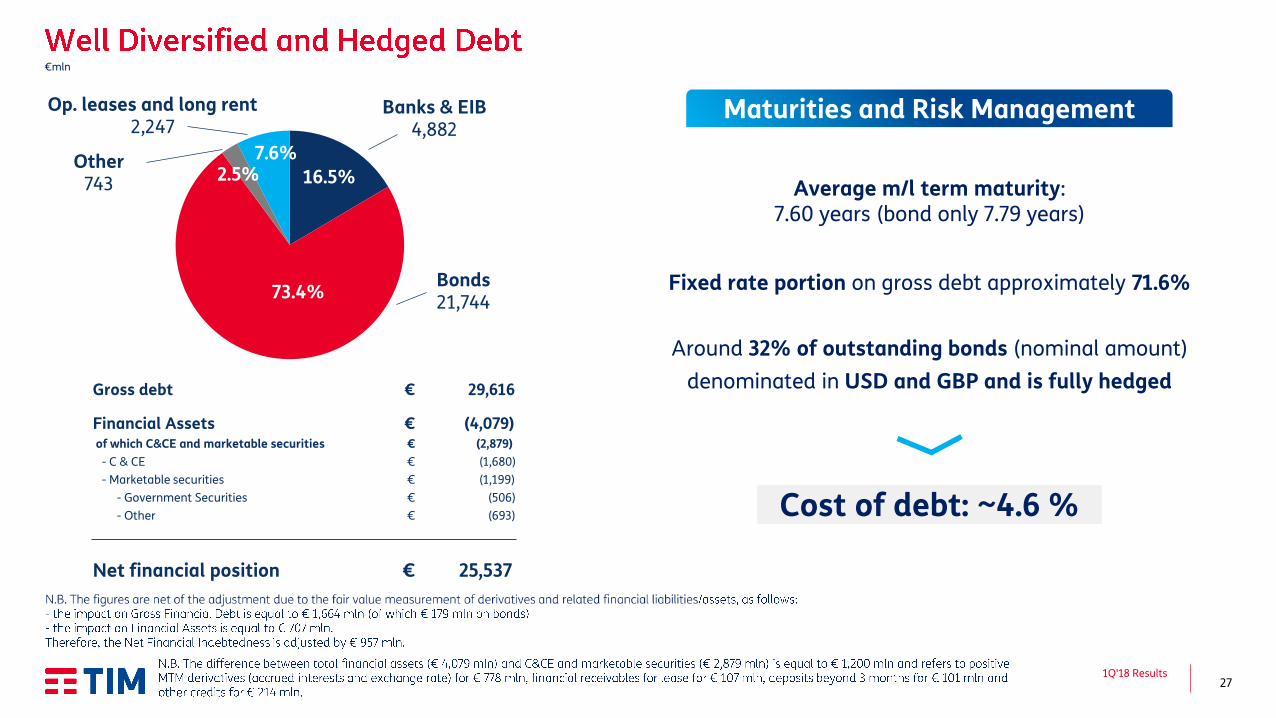
Average m/l term maturity: 7.60 years (bond only 7.79 years)
Fixed rate portion on gross debt approximately 71.6%
Around 32% of outstanding bonds (nominal amount)
denominated in USD and GBP and is fully hedged
Cost of debt: ~4.6 %
Gross debt € 29,616
Financial Assets € (4,079) of which C&CE and marketable securities € (2,879)
- C & CE € (1,680)
- Marketable securities € (1,199)
- Government Securities € (506)
- Other € (693)
Net financial position € 25,537
16.5%
73.4%
2.5% 7.6%
Maturities and Risk Management Banks & EIB 4,882
Other 743
Op. leases and long rent 2,247
€mln
Bonds 21,744
1Q'18 Results