Embed Size (px)
Citation preview

Restore Seabeach Amaranth: A Federally Threatened Species
Habitat Assessment and Restoration of (Amaranthus pumilus, Amaranthaceae)
Using Remote Sensing Data
2001 Natural Resource Preservation Program
RMP Project Statement Number: CAHA-N-018.000
Final Report
9/25/2004
Claudia L. Jolls*
Ph.D., Associate Professor of Biology
UNC Board of Governors Distinguished Professor for Teaching
(252) 328-6295
Jon D. Sellars**
M.S. in Biology, Research
Technician II
Sarah E. Johnson
M.S. in Biology Candidate, Graduate Research Assistant
Cass A. Wigent***
M.S. in Biology Candidate, Graduate Research Assistant
Department of Biology
East Carolina University
Greenville, NC 27858-4353
*author for correspondence
**current address: NOAA, SSMCIII 8218, 1315 East West Highway, Silver Spring, MD, 20910,
(301) 713-1428 ext. 165, [email protected]
***current address: Keep America Beautiful Coordinator, 1221 Thorpe Rd., Rocky Mount, NC
27804, (252) 972-1327, [email protected]
0057101

ABSTRACT
Remotely sensed data and geographic information systems (GIS) can be used to aid
management decisions about species of concern at local and landscape levels. Aerial
photography, light-detection and ranging data (LIDAR) and ground-truthing were used to
evaluate habitat for the federally threatened plant, seabeach amaranth (Amaranthus pumilus
Raf.), at Cape Hatteras (CAHA) and Cape Lookout National Seashores (CALO), North Carolina,
and Assateague Island National Seashore (ASIS), Maryland. Habitat was defined from field
work and remote sensing data, using variables readily extracted from LIDAR including
elevation, slope, aspect, surface complexity and reflectance as an index of vegetation, analyzed
using statistics and GIS.
Our model describes a narrow elevation range (0.77-2.00 m above MHW) with very
limited vegetation cover for highest survival and growth, particularly on south-southwest facing
beaches. LIDAR and GIS were used to analyze habitat availability at CAHA, CALO and ASIS.
North Carolina seashores with the most inlets and thus more area as south or south-west facing
island ends appear to provide more habitat and currently support larger plant populations.
We confirmed the viability of our model using transplants to experimental plots (below,
within or above the predicted elevation range) and for elevations below our predicted range (near
vs. far from shore, thus, high vs. low risk of overwash). Plants are highly tractable in culture,
reared from field-collected seed in lab and greenhouse, then planted at microsites selected from
the GIS. Three field seasons included testing of a habitat model using 1698 plants (360 in 2001,
690 in 2002 and 648 in 2003). Success of these transplants was monitored during each growing
season for at least 10 wk. Plant survival and reproduction is dependent on seed moist chilling,
light and high, alternating temperatures during germination. Size and date of outplanting also
affect plant success. Plants did best when transplanted to the field when at least 9 wk of age in
0057102

early June in North Carolina. Survival and growth of Amaranthus pumilus is very microsite
dependent. Plants at lower elevations are larger and will produce more seed, however, the risk of
mortality from overwash is increased on some beaches. Transplants higher than our predicted
elevation range can be more likely to survive at certain sites. Plants at higher elevations above
our predicted habitat, however, are between two to nearly five times smaller and more likely to
experience herbivory, particularly higher levels of grazing by insects, other invertebrates and
possibly vertebrates. Given the dynamic nature of this species‟ shoreline habitat, its life history
and dynamic population sizes, despite its tractability in culture, preservation and restoration is
critically dependent upon management of extant habitat and seed sources, even in the absence of
naturally occurring plants in any given year. This work can aid restoration of a federally
threatened plant species as well as habitat evaluation for associated protected taxa, such as
breeding shorebirds and sea turtles.
0057103

ACKNOWLEDGMENTS
We are grateful for support from the National Park Service and their Natural Resources
Recovery Program, from the North Carolina Plant Conservation Program nd from the ALACE
partners, NASA, NOAA and USGS. Particular thanks are extended to Keith Watson, for
originally encouraging and supporting this project, Jame Amoroso, Mike Aslaksen, Bernice
Bailes, Lawrence Belli, Marj Boyer, David Brenner, Mark Brinson, Beth Chester, Jeff Colby,
Arielle Cooley, Jeff Cordes, Mary Doll, Jim Ebert, Nikki Ernst, Karl Faser, Cecil Frost, Dave
Eslinger, Carol Goodwillie, Emma Hardison, Steve Harrison, Michael Hearn, Don Holbert, Mark
Jansen, Chris Lea, Marcia Lyons, Mark Keusenkothen, Melynda May, Anne McLendon, Loyal
Mehrhoff, Nora Murdock, Johnny Randall, Michael Rikard, Kristen Rosenfeld, Judy Ryan, Dale
Suiter, Karen Trueblood, Wendy Walsh, Jason Woolard, Steve Young. Student financial support
from the ECU Department of Biology Martha N. Jones Scholarship, the ECU Graduate Scholars
Program, and the North Carolina Botanical Garden is gratefully acknolwedged. We also thank
the Southeastern Plant Environment Laboratories and Drs. Carol Saravitz, Janet Shurtleff, Judy
Thomas, Thomas Wentworth at North Carolina State University for technical and logistical
assistance, and the citizenry of the Outer Banks of North Carolina for their support of our
Atlantic coast natural heritage.
0057104

i
TABLE OF CONTENTS
LIST OF FIGURES iii
LIST OF TABLES vii
PROBLEM STATEMENT 1
Objectives 3
DESCRIPTION OF ACTIVITY 4
Approach and Methods 4
Task 1: Application of GIS and LIDAR to Identify Critical Habitat:
Habitat Assessment, Modeling and Surveys for Naturally Occurring Plants 4
Methods: Modeling and GIS 5
Methods: Surveys for Naturally Occurring Amaranthus pumilus 8
Results: Habitat Assessment, GIS and Plant Occurrence Data on CD 9
Results: Habitat Assessment and Naturally Occurring Plants 11
Methods: Analysis of Total Suitable Habitat 11
Results: Analysis of Suitable Habitat 12
Task 2: Seed and Seedling Reintroduction and Success of Transplants 14
Plant Response to Elevation: Transplants 2001 14
Methods: Transplants 2001 14
Plant Response to Elevation 2001:
Stratification, Seed Source, Seed Germination and Propagation of Transplants 15
Plant Response to Elevation 2001:
Transplant Site Selection and Experimental Design 16
Plant Response to Elevation 2001: Transplant Census 17
Plant Response to Elevation: Transplants 2002 17
Methods: Transplants 2002 17
0057105

ii
Plant Response to Elevation 2002:
Stratification, Seed Source Seed Germination and Propagation of Transplants 17
Plant Response to Elevation 2002:
Transplant Site Selection and Experimental Design 18
Plant Response to Elevation 2002: Transplant Census 19
Plants Response to Elevation and Distance from Shoreline: Transplants 2003 20
Methods: Transplants 2003 20
Plant Response to Elevation and Distance from Shoreline 2003:
Seed Source, Stratification, Seed Germination and Propagation of Transplants 20
Plant Response to Elevation and Distance from Shoreline 2003:
Transplant Site Selection and Experimental Design 22
Plant Response to Elevation and Distance from Shoreline: Transplant Census 2003 23
Results: Plant Response to Elevation: Transplants 2001 25
Results: Plant Response to Elevation: Transplants 2002 25
Results: Plant Response to Elevation: Transplants 2003 26
Plant Success: Survival 2003 26
Plant Success: Phenology and Seed Set 2003 28
Plant Success: Size 2003 28
Herbivory 2003 29
CONCLUSIONS, APPLICATION AND SIGNIFICANCE 31
ORIGINAL PROPOSED SCHEDULE 40
LITERATURE CITED 43
APPENDIX A 108
0057106

iii
LIST OF FIGURES
Figure 1. LIDAR elevation data are recorded by measuring the time required for a laser to reach
the beach surface. Courtesy NOASS-Coastal Services Center ............................................ 49
Figure 2. Selection of transplant sites was facilitated using LIDAR data. Areas in green are
within the elevation range of 0.77 – 2.00 m above Mean High Water (MHW), are not
experiencing strong erosional trends and support low vegetation cover . Potential habitat
for year 2000 and plant occurrences from 2002 have been overlain on year 2000 passive-
LIDAR imagery for the east end of Shackleford. Areas of darker gray, landward of the
MHW line, are vegetated dune. ............................................................................................ 50
Figure 3. Shoreline change analyses (elevation by year and elevation change) is partitioned as a
series of four “tiles” at Assateague Island National Seashore (ASIS). ................................. 51
Figure 4. Natural plant occurrences for the years 2001-2003 on the Tile 1 section of Assateague
Island National Seashore overlain on the LIDAR Passive Reflectance image from 2000.
Areas in green are within the elevation range of 0.77 – 2.00 m above Mean High Water
(MHW), are not experiencing strong erosional trends and support low vegetation cover.
Areas of darker gray, landward of the MHW line, are vegetated dune. ............................... 53
Figure 5. Natural plant occurrences for the years 2001-2003 on the Tile 2 section of Assateague
Island National Seashore overlain on the LIDAR Passive Reflectance image from 2000.
Areas in green are within the elevation range of 0.77 – 2.00 m above Mean High Water
(MHW), are not experiencing strong erosional trends and support low vegetation cover.
Areas of darker gray, landward of the MHW line, are vegetated dune. ............................... 54
Figure 6. Natural plant occurrences for the years 2001-2003 on the Tile 3 section of Assateague
Island National Seashore overlain on the LIDAR Passive Reflectance image from 2000.
Areas in green are within the elevation range of 0.77 – 2.00 m above Mean High Water
(MHW), are not experiencing strong erosional trends and support low vegetation cover.
Areas of darker gray, landward of the MHW line, are vegetated dune. ............................... 55
Figure 7. Natural plant occurrences for the years 2001-2003 on the Tile 4 section of Assateague
Island National Seashore overlain on the LIDAR Passive Reflectance image from 2000.
Areas in green are within the elevation range of 0.77 – 2.00 m above Mean High Water
(MHW), and have a reflectance value above 170 on a scale from 0 to 255. Suitable habitat
areas are not experiencing strong erosional trends and support low vegetation cover. Areas
of darker gray, landward of the MHW line, are vegetated dune and marsh. ........................ 56
Figure 8. Natural plant occurrences at Hatteras Point (CAHA) for the years 2000 through 2003
overlain on the LIDAR Passive Reflectance image from 1999. Source: ECU and NPS GPS
survey data. Areas in green are within the elevation range of 0.77 – 2.00 m above Mean
High Water (MHW), and have a reflectance value above 170 on a scale from 0 to 255.
Suitable habitat areas are not experiencing strong erosional trends and support low
vegetation cover. Areas of darker gray, landward of the MHW line, are vegetated dune and
marsh. .................................................................................................................................... 57
Figure 9. Natural plant occurrences at Hatteras Inlet for the years 2000 through 2003 overlain
on the LIDAR Passive Reflectance image from 1999. Source: ECU and NPS GPS survey
data. Areas in green are within the elevation range of 0.77 – 2.00 m above Mean High
Water (MHW), and have a reflectance value above 170 on a scale from 0 to 255. Suitable
habitat areas are not experiencing strong erosional trends and support low vegetation cover.
Areas of darker gray, landward of the MHW line, are vegetated dune and marsh. .............. 58
0057107

iv
Figure 10. Natural plant occurrences on Ocracoke Island (CAHA) from 2002 and 2003 overlain
on the LIDAR Passive Reflectance image from 1999. Source: NPS GPS survey data.
Areas in green are within the elevation range of 0.77 – 2.00 m above Mean High Water
(MHW), and have a reflectance value above 170 on a scale from 0 to 255. Suitable habitat
areas are not experiencing strong erosional trends and support low vegetation cover. Areas
of darker gray, landward of the MHW line, are vegetated dune and marsh. ........................ 59
Figure 11. Natural plant occurrences at Cape Lookout Point overlain on the LIDAR Passive
Reflectance image from 2000. Areas in green are within the elevation range of 0.77 – 2.00
m above Mean High Water (MHW), and have a reflectance value above 170 on a scale from
0 to 255. Suitable habitat areas are not experiencing strong erosional trends and support
low vegetation cover. Areas of darker gray, landward of the MHW line, are vegetated dune
and marsh. ............................................................................................................................. 60
Figure 12. Natural plant occurrences at Cape Lookout Spit overlain on the LIDAR Passive
Reflectance image from 2000. Areas in green are within the elevation range of 0.77 – 2.00
m above Mean High Water (MHW), and have a reflectance value above 170 on a scale from
0 to 255. Suitable habitat areas are not experiencing strong erosional trends and support
low vegetation cover. Areas of darker gray, landward of the MHW line, are vegetated dune
and marsh. ............................................................................................................................. 61
Figure 13. Natural plant occurrences on the east end of Shackleford Banks (CALO) overlain on
the LIDAR Passive Reflectance image from 2000. Source: ECU and NPS GPS survey data.
Areas in green are within the elevation range of 0.77 – 2.00 m above Mean High Water
(MHW), and have a reflectance value above 170 on a scale from 0 to 255. Suitable habitat
areas are not experiencing strong erosional trends and support low vegetation cover. Areas
of darker gray, landward of the MHW line, are vegetated dune and marsh. ........................ 62
Figure 14. Natural plant occurrences on the west end of Shackleford Banks (CALO) overlain on
the LIDAR Passive Reflectance image from 2000. Source: ECU and NPS GPS survey data.
Areas in green are within the elevation range of 0.77 – 2.00 m above Mean High Water
(MHW), and have a reflectance value above 170 on a scale from 0 to 255. Suitable habitat
areas are not experiencing strong erosional trends and support low vegetation cover. Areas
of darker gray, landward of the MHW line, are vegetated dune and marsh. ........................ 63
Figure 15. Locations of outplanting sites (plots) at Cape Hatteras Point (CAHA) for the years
2000 through 2003. Areas in green are within the elevation range of 0.77 – 2.00 m above
Mean High Water (MHW), and have a reflectance value above 170 on a scale from 0 to
255. Suitable habitat areas are not experiencing strong erosional trends and support low
vegetation cover. Potential habitat for year 1999 and plot locations have been overlain on
1999 passive-LIDAR imagery for Cape Hatteras Point (CAHA). Areas of darker gray,
landward of the MHW line, are vegetated dune and marsh. ................................................. 64
Figure 16. Locations of outplanting sites (plots) at Hatteras Inlet (CAHA) for the year 2000
through 2003. Plots were established only during 2000 and 2001. Areas in green are within
the elevation range of 0.77 – 2.00 m above Mean High Water (MHW), and have a
reflectance value above 170 on a scale from 0 to 255. Suitable habitat areas are not
experiencing strong erosional trends and support low vegetation cover. Potential habitat for
year 1999 and plot locations have been overlain on 1999 passive-LIDAR imagery for
Hatteras Inlet. Areas of darker gray, landward of the MHW line, are vegetated dune and
marsh. .................................................................................................................................... 65
0057108

v
Figure 17. Locations of outplanting sites (plots) at Cape Lookout Lighthouse area for the year
2000 through 2003. Plots were only established at the Lighthouse area during 2003. Areas
in green are within the elevation range of 0.77 – 2.00 m above Mean High Water (MHW),
and have a reflectance value above 170 on a scale from 0 to 255. Suitable habitat areas are
not experiencing strong erosional trends and support low vegetation cover. Potential habitat
for year 2000 and plot locations have been overlain on year 2000 passive-LIDAR imagery
for the Cape Lookout Lighthouse area. Areas of darker gray, landward of the MHW line,
are vegetated dune and marsh. .............................................................................................. 66
Figure 18. Locations of outplanting sites (plots) at Cape Lookout Point for the year 2000
through 2003. Only during the year 2001 were plots established on the Point. .................. 67
Figure 19. Locations of outplanting sites (plots) at Cape Lookout Spit for the year 2000 through
2003. No plots were plots established on the Spit during 2000. Areas in green are within
the elevation range of 0.77 – 2.00 m above Mean High Water (MHW), and have a
reflectance value above 170 on a scale from 0 to 255. Suitable habitat areas are not
experiencing strong erosional trends and support low vegetation cover. Potential habitat for
year 2000 and plot locations have been overlain on year 2000 passive-LIDAR imagery for
Cape Lookout Spit. Areas of darker gray, landward of the MHW line, are vegetated dune
and marsh. ............................................................................................................................. 68
Figure 20. Directory structure on the accompanying compact disk (CD). ................................. 69
Figure 21. Survival of 2001 transplants of seabeach amaranth to Cape Hatteras (CAHA) and
Cape Lookout (CALO) National Seashores during approximately two months of the
growing season. P = Cape Hatteras Point (CAHA), I = Cape Hatteras Inlet (CAHA), O = N.
Ocracoke Island (CAHA), L – Cape Lookout Spit (CALO). IN and OUT denote sites
within or outside the predicted elevation range for success of transplants based on 1998
(CALO) and 1999 (CAHA) LIDAR. .................................................................................... 70
Figure 22. The proportional change in diameter of 2002 transplants from 2 wk to 10 wk
followed a significant negative trend. Transplants to lower elevations were larger than
plants in the next higher elevation group. The IN and HIGH groups contained 11
individuals each that had been decapitated and were withheld from the analysis. ............... 71
Figure 23. The proportion of Amaranthus pumilus surviving thorough 10 wk in 2002 was
significantly influenced by elevation group. Plants at lower elevations experienced more
frequent overwash and flooding............................................................................................ 72
Figure 24. Proportion of plants surviving at 10 wk in 2002 that had reached seed set during the
census period. ........................................................................................................................ 73
Figure 25. Box plots (median and interquartile range) of plant diameters (cm) for a sub-sample
of naturally occurring plants on Shackleford Banks (CALO) in 2002. Plants in the lowest
elevation range (< 0.77 m above Mean High Water) were significantly larger than plants at
higher elevations. .................................................................................................................. 74
Figure 26. Mean percent survival throughout 10 wk (02 June –20 August 2003) for Amaranthus
pumilus transplants growing above (HIGH) and within (IN) the predicted elevation range at
Cape Hatteras National Seashore. Bars represent the upper ends of 95% confidence
intervals (n = 6). .................................................................................................................... 75
Figure 27. Mean percent survival throughout 10 wk (11 June-15 August 2003) for Amaranthus
pumilus transplants growing above (HIGH) and within (IN) the predicted elevation range at
Cape Lookout National Seashore. Bars represent the upper ends of 95% confidence
intervals (n = 3). .................................................................................................................... 76
0057109

vi
Figure 28. Mean percent survival throughout 10 wk (11 June-15 August 2003) for Amaranthus
pumilus transplants growing two distances (NEAR and FAR) from shore at Cape Lookout
National Seashore. Bars represent the upper ends of 95% confidence intervals (n=3). ...... 77
Figure 29. Phenology of Amaranthus pumilus transplants represented as the percentage of plants
setting seed after 10 wk in research plots above (HIGH) and within (IN) the predicted
elevation range at Cape Hatteras (CAHA) and Cape Lookout (CALO) National Seashores.
Data were not collected for CALO during Week 6. The bars represent 95% confidence
intervals (for CAHA, n = 6 and for CALO, n = 3). .............................................................. 78
Figure 30. Potential application of GIS model of Amaranthus pumilus habitat to animal species
of concern. Habitat is delineated as 0.77-0.22 m above MHW. Locations of nesting
animals are overlain on seabeach amaranth habitat along with plant occurrences (in red):
Piping Plover (Charadius melodus)in brown, American Oystercatcher ( ) in orange) and sea
turtles (Caretta caretta) in blue. ........................................................................................... 79
0057110

vii
LIST OF TABLES
Table 1. Numbers of naturally occurring plants of Amaranthus pumilus at Cape Hatteras
(CAHA) and Cape Lookout (CALO) National Seashores since 1985. Empty cells represent
no data. Censuses were completed by a variety of personnel and agencies, typically July-
August. .................................................................................................................................. 80
Table 2. A comparison of available Amaranthus pumilus habitat at Cape Hatteras (CAHA) and
Cape Lookout (CALO) National Seashore for years with available LIDAR. Available
habitat was modeled as an elevation value between 0.77 and 2.00 meters above Mean High
Water and (2) had a reflectance value above 170. Comparisons used number of pixels (3x 3
m2 cells), area (ha), length of shoreline (km) and a index as a ratio of to total area of
available habitat relative to length of shoreline (km/ha). ..................................................... 81
Table 3. Survival of all 2001 Amaranthus pumilus transplants on Cape Hatteras and Cape
Lookout National Seashores. There were 90 transplants in three plots (30 per plot) at each
of the four sites...................................................................................................................... 82
Table 4. Survival of 2001 Amaranthus pumilus transplants by placement in or out of “good”
habitat for 12 plots as of 2 August 2001 at Cape Lookout and 14 August 2001 Cape
Hatteras National Seashores. ................................................................................................ 83
Table 5. Number and percent survival to 10 wk (01 June to 20 August 2003) of Amaranthus
pumilus transplants in research plots above (HIGH) and within (IN) the predicted elevation
range at Cape Hatteras National Seashore. Numbers in parentheses represent the expected
values used in Pearson‟s Chi-Square Analysis. .................................................................... 84
Table 6. Number and percent survival to 10 wk of Amaranthus pumilus transplants in research
plots above (HIGH) and within (IN) the predicted elevation range at Cape Lookout National
Seashore. Expected values are not presented for data analyzed using Fisher‟s Exact Test. 85
Table 7. Percent survival to 10 wk (01 June to 20 August 2003) of Amaranthus pumilus
transplants in research plots above (HIGH) and within (IN) the predicted elevation range at
Cape Hatteras National Seashore (CAHA). Plots are arranged from the most northern
(North 1) to most southern (South 3) beach position. ........................................................... 86
Table 8. Percent survival to 10 wk (11 June to 15 August 2003) of Amaranthus pumilus
transplants in research plots above (HIGH) and within (IN) the predicted elevation range at
Cape Lookout National Seashore (CALO). The six plots are arranged from the most
northern (North 1) to most southern (North 3) beach position. ............................................ 87
Table 9. Number and percent survival to 10 wk of Amaranthus pumilus transplants in research
plots two distances from shore (FAR and Near) at Cape Lookout National Seashore.
Numbers in parentheses represent the expected values used in Pearson Chi-Square Analysis.
............................................................................................................................................... 88
Table 10. Percent survival to 10 wk (11 June to 15 August 2003) of Amaranthus pumilus
transplants in research plots two distances from shore (NEAR and FAR) at Cape Lookout
National Seashore. Plots are arranged from the most northern (North 1) to the most
southern (North 3) beach position......................................................................................... 89
Table 11. Frequency and percent of Amaranthus pumilus transplants setting seed after 10 wk in
research plots above (HIGH) and within (IN) the predicted elevation range at Cape Hatteras
National Seashore. Expected values are not presented for data analyzed using Fisher‟s Exact
Test. ....................................................................................................................................... 90
0057111

viii
Table 12. Frequency and percent of Amaranthus pumilus transplants setting seed after 10 wk in
research plots above (HIGH) and within (IN) the predicted elevation range at Cape Lookout
National Seashore. Expected values are not presented for data analyzed using Fisher‟s
Exact Test.............................................................................................................................. 91
Table 13. Mean and 95% confidence intervals (CI) of the initial and final measured diameters
(cm) of Amaranthus pumilus transplants within research plots at Cape Hatteras (CAHA) and
Cape Lookout (CALO) National Seashores. ........................................................................ 92
Table 14. Mean and 95% confidence interval (CI) of the initial and final measured diameters
(cm) of Amaranthus pumilus transplants in research plots above (HIGH) and within (IN) the
predicted elevation range at Cape Hatteras National Seashore. ........................................... 93
Table 15. Mean and 95% confidence interval (CI) of the initial and final measured diameters
(cm) of Amaranthus pumilus transplants in research plots within above (HIGH) and (IN) the
predicted elevation range at Cape Lookout National Seashore. ........................................... 94
Table 16. Mean and 95% confidence interval (CI) of the initial and final measured diameters
(cm) of Amaranthus pumilus transplants in research plots two distances from shore (NEAR
vs. FAR) at Cape Lookout National Seashore. ..................................................................... 95
Table 17. 2 x 2 Chi-Square contingency table of the number of Amaranthus pumilus transplants
with or without observed herbivory during wk 10 at Cape Hatteras (CAHA) (n = 297) and
Cape Lookout (CALO) (n = 178) National Seashores. Expected values are shown within
parentheses. ........................................................................................................................... 96
Table 18. 2 x 3 Chi-Square contingency table of the number of Amaranthus pumilus transplants
exhibiting different degrees of herbivory during wk 10 at Cape Hatteras (CAHA) (n = 297)
and Cape Lookout (CALO) (n = 178) National Seashores. Expected values are shown
within parentheses. ................................................................................................................ 97
Table 19. 2 x 2 Chi-Square contingency table of the number of Amaranthus pumilus transplants
with or without observed herbivory during wk 10 in research plots above (HIGH) (n = 159)
and within (IN) (n = 138) the predicted elevation range at Cape Hatteras National Seashore
(CAHA). Expected values are shown within parentheses. .................................................. 98
Table 20. 2 x 3 Chi-Square contingency table of the number of Amaranthus pumilus transplants
exhibiting different degrees of herbivory during wk 10 in research plots above (HIGH) (n =
159) and within (IN) (n = 138) the predicted elevation range at Cape Hatteras National
Seashore (CAHA). Expected values are shown within parentheses. ................................... 99
Table 21. 2 x 2 Chi-Square contingency table of the number of Amaranthus pumilus transplants
with or without observed herbivory during wk 10 in research plots above (HIGH) (n = 74)
and within (IN) (n = 77) the predicted elevation range at Cape Lookout National Seashore
(CALO). Expected values are shown within parentheses. ................................................. 100
Table 22. 2 x 3 contingency table of the number of Amaranthus pumilus transplants exhibiting
different degrees of herbivory during wk 10 in research plots above (HIGH) (n = 74) and
within (IN) (n = 77) the predicted elevation range at Cape Lookout National Seashore
(CALO). Expected values are not presented for data analyzed using Fisher‟s Exact Test.
............................................................................................................................................. 101
Table 23. 2 x 2 Chi-Square contingency table of the number of Amaranthus pumilus transplants
with or without observed herbivory during wk 2 in research plots two distances from shore
(FAR (n = 62) and NEAR (n = 27)) at Cape Lookout National Seashore (CALO). Expected
values are shown within parentheses. ................................................................................. 102
0057112

ix
Table 24. 2 x 3 contingency table of the number of Amaranthus pumilus transplants exhibiting
different degrees of herbivory during wk 2 in research plots two distances from shore (FAR
(n = 62) and NEAR (n = 27)) at Cape Lookout National Seashore (CALO). .................... 103
Table 25. 2 x 2 Chi-Square contingency table of the number of Amaranthus pumilus transplants
with or without observed herbivory during wk 2 in research plots above (HIGH) (n = 74)
and within (IN) (n = 77) the predicted elevation range at Cape Lookout National Seashore
(CALO). Expected values are shown within parentheses. ................................................. 104
Table 26. 2 x 2 Chi-Square contingency table of the number of Amaranthus pumilus transplants
exhibiting different degrees of herbivory during wk 2 in research plots above (HIGH) (n =
74) and within (IN) (n = 77) the predicted elevation range at Cape Lookout National
Seashore (CALO). Expected values are shown within parentheses. ................................. 105
Table 27. 2 x 2 Chi-Square contingency table of the number of Amaranthus pumilus transplants
with or without observed herbivory during wk 2 in research plots above (HIGH) (n = 159)
and within (IN) (n = 138) the predicted elevation range at Cape Hatteras National Seashore
(CAHA). Expected values are shown within parentheses. ................................................ 106
Table 28. 2 x 2 Chi-Square contingency table of the number of Amaranthus pumilus transplants
exhibiting different degrees of herbivory during wk 2 in research plots above (HIGH) (n =
159) and within (IN) (n = 138) the predicted elevation range at Cape Hatteras National
Seashore (CAHA). Expected values are shown within parentheses. ................................. 107
Appendix. File listing of contents of CD (\cd_data) expanded from Figure 20……………….108
0057113
Final Report 2004: Restore Seabeach Amaranth
Jolls, Sellars, Johnson and Wigent
2001 Natural Resource Preservation Program
RMP Project Statement Number: CAHA-N-018.000, CALO-N-006.001, ASIS-N-016.005
1
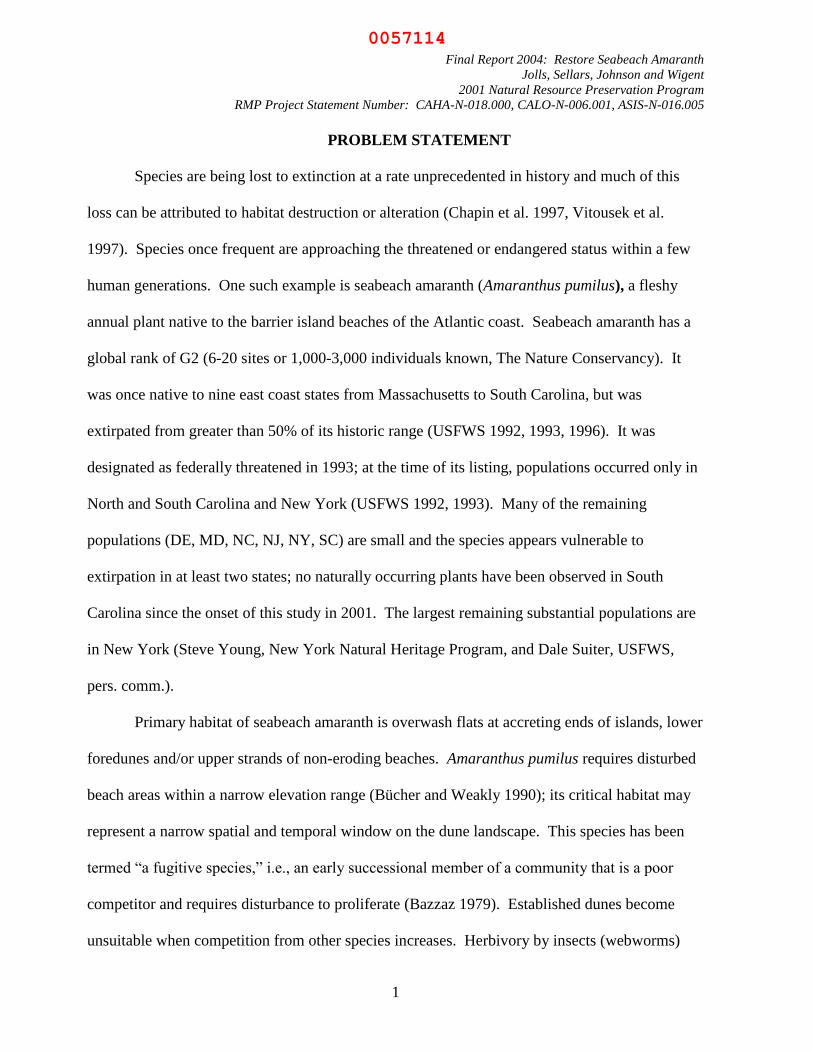
PROBLEM STATEMENT
Species are being lost to extinction at a rate unprecedented in history and much of this
loss can be attributed to habitat destruction or alteration (Chapin et al. 1997, Vitousek et al.
1997). Species once frequent are approaching the threatened or endangered status within a few
human generations. One such example is seabeach amaranth (Amaranthus pumilus), a fleshy
annual plant native to the barrier island beaches of the Atlantic coast. Seabeach amaranth has a
global rank of G2 (6-20 sites or 1,000-3,000 individuals known, The Nature Conservancy). It
was once native to nine east coast states from Massachusetts to South Carolina, but was
extirpated from greater than 50% of its historic range (USFWS 1992, 1993, 1996). It was
designated as federally threatened in 1993; at the time of its listing, populations occurred only in
North and South Carolina and New York (USFWS 1992, 1993). Many of the remaining
populations (DE, MD, NC, NJ, NY, SC) are small and the species appears vulnerable to
extirpation in at least two states; no naturally occurring plants have been observed in South
Carolina since the onset of this study in 2001. The largest remaining substantial populations are
in New York (Steve Young, New York Natural Heritage Program, and Dale Suiter, USFWS,
pers. comm.).
Primary habitat of seabeach amaranth is overwash flats at accreting ends of islands, lower
foredunes and/or upper strands of non-eroding beaches. Amaranthus pumilus requires disturbed
beach areas within a narrow elevation range (Bücher and Weakly 1990); its critical habitat may
represent a narrow spatial and temporal window on the dune landscape. This species has been
termed “a fugitive species,” i.e., an early successional member of a community that is a poor
competitor and requires disturbance to proliferate (Bazzaz 1979). Established dunes become
unsuitable when competition from other species increases. Herbivory by insects (webworms)
0057114
Final Report 2004: Restore Seabeach Amaranth
Jolls, Sellars, Johnson and Wigent
2001 Natural Resource Preservation Program
RMP Project Statement Number: CAHA-N-018.000, CALO-N-006.001, ASIS-N-016.005
2
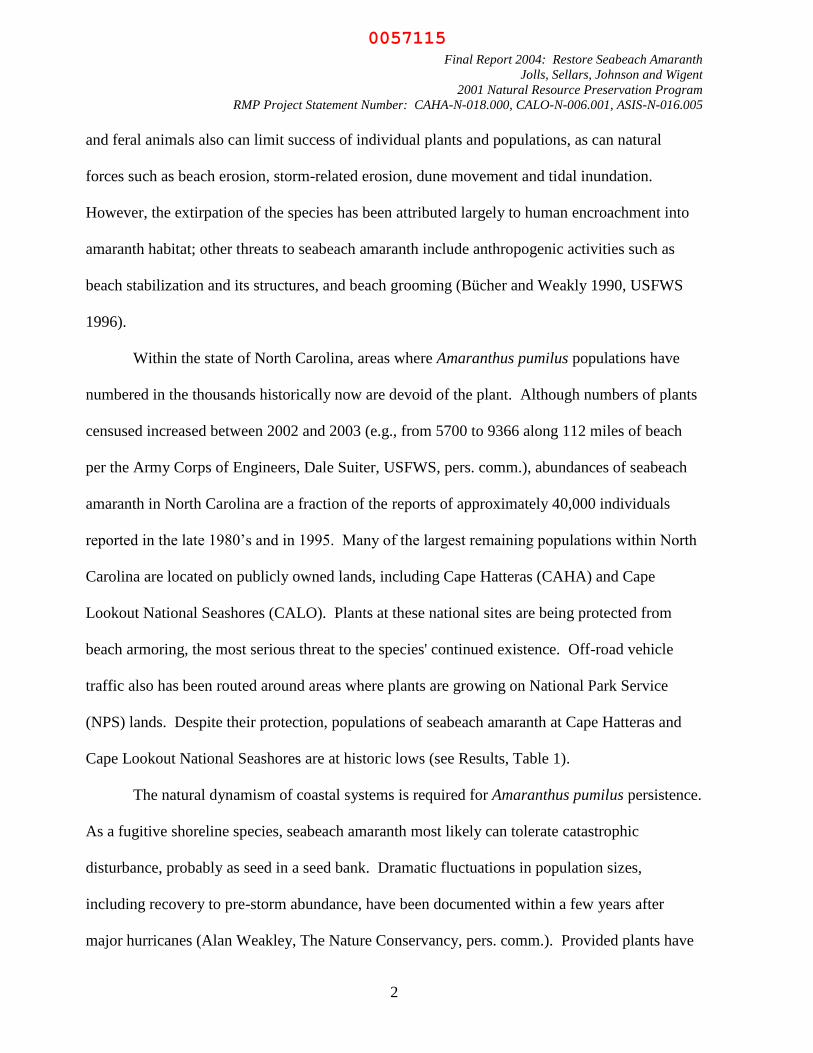
and feral animals also can limit success of individual plants and populations, as can natural
forces such as beach erosion, storm-related erosion, dune movement and tidal inundation.
However, the extirpation of the species has been attributed largely to human encroachment into
amaranth habitat; other threats to seabeach amaranth include anthropogenic activities such as
beach stabilization and its structures, and beach grooming (Bücher and Weakly 1990, USFWS
1996).
Within the state of North Carolina, areas where Amaranthus pumilus populations have
numbered in the thousands historically now are devoid of the plant. Although numbers of plants
censused increased between 2002 and 2003 (e.g., from 5700 to 9366 along 112 miles of beach
per the Army Corps of Engineers, Dale Suiter, USFWS, pers. comm.), abundances of seabeach
amaranth in North Carolina are a fraction of the reports of approximately 40,000 individuals
reported in the late 1980‟s and in 1995. Many of the largest remaining populations within North
Carolina are located on publicly owned lands, including Cape Hatteras (CAHA) and Cape
Lookout National Seashores (CALO). Plants at these national sites are being protected from
beach armoring, the most serious threat to the species' continued existence. Off-road vehicle
traffic also has been routed around areas where plants are growing on National Park Service
(NPS) lands. Despite their protection, populations of seabeach amaranth at Cape Hatteras and
Cape Lookout National Seashores are at historic lows (see Results, Table 1).
The natural dynamism of coastal systems is required for Amaranthus pumilus persistence.
As a fugitive shoreline species, seabeach amaranth most likely can tolerate catastrophic
disturbance, probably as seed in a seed bank. Dramatic fluctuations in population sizes,
including recovery to pre-storm abundance, have been documented within a few years after
major hurricanes (Alan Weakley, The Nature Conservancy, pers. comm.). Provided plants have
0057115

Final Report 2004: Restore Seabeach Amaranth
Jolls, Sellars, Johnson and Wigent
2001 Natural Resource Preservation Program
RMP Project Statement Number: CAHA-N-018.000, CALO-N-006.001, ASIS-N-016.005
3
matured and set seed, storms can disperse seed, and, in all likelihood, create a seed bank and
later expose seeds to light for germination. The recent re-occurrence of plants on Long Island,
NY, Assateague National Seashore, MD (ASIS), Delaware and New Jersey after decades of
absence may be recruitment from nearby deep inlets, disturbed dunes, or more southern seed
sources by major storm events and currents.
Research and management needs in general for seabeach amaranth throughout its range
have been articulated by USFWS (Endangered and Threatened Species of the Southeastern
United States FWS Region 4 (8/93). These needs include:
1) Monitor and protect existing populations
2) Conduct research on the biology of the species
3) Establish new populations or rehabilitate marginal populations to the point where
they are self-sustaining
4) Investigate and conduct necessary management activities at all key sites
Objectives
To address some of these management needs for seabeach amaranth requires 1)
designation of habitat, 2) identification of habitat that may be threatened from storm events
(erosional hotspots) or other forces, 3) greenhouse/laboratory propagation of plants for
restoration as well as 4) identification of sites suitable for restoration. In an effort to understand
the species‟ ecology and to provide information to NPS resource managers for restoration, we
developed guidelines for seabeach amaranth re-introduction to historic and/or extirpated sites
selected using remotely sensed data, GIS and a program of reintroduction from
greenhouse/laboratory-reared plants. The objectives of this study were to:
0057116

Final Report 2004: Restore Seabeach Amaranth
Jolls, Sellars, Johnson and Wigent
2001 Natural Resource Preservation Program
RMP Project Statement Number: CAHA-N-018.000, CALO-N-006.001, ASIS-N-016.005
4
1) develop methodologies to predict species occurrences from remotely sensed data
and topographically characterize seabeach amaranth habitat using remotely sensed
data in a geographic information system (GIS),
2) use remote sensing data to establish potential reintroduction sites, and
3) reintroduce seeds and seedlings of seabeach amaranth to historic and/or extirpated
sites within the Cape Hatteras and Cape Lookout National Seashores.
DESCRIPTION OF ACTIVITY
Approach and Methods
Task 1: Application of GIS and LIDAR to Identify Critical Habitat:
Habitat Assessment, Modeling and Surveys for Naturally Occurring Plants
Existing seabeach amaranth habitat needs to be marked for conservation and suitable
areas slated for species reintroduction. This requires incorporating spatial data from many
sources into one database, analyzing the data, and retrieval and display of the data. This can be
accomplished using geographic information systems (GIS) and remote sensing. GIS and remote
sensing aids conservation, management and restoration by integrating environmental features
and processes (topography, soil types, vegetation, species occurrences, and their changes in
space and time) with physical structures and human activities (roads, political boundaries, public
use patterns). Knowledge gained by scientists using GIS can then be passed on to policy makers
(Lambert and Carr 1998, Lopez 1998, Savitsky 1998). Remotely sensed and existing survey
data in a GIS has been used to predict endangered species occurrences, such as the California
Condor (Scepan and Blum 1987) and Harlequin ducks (Thibault et al. 1998).
0057117

Final Report 2004: Restore Seabeach Amaranth
Jolls, Sellars, Johnson and Wigent
2001 Natural Resource Preservation Program
RMP Project Statement Number: CAHA-N-018.000, CALO-N-006.001, ASIS-N-016.005
5
Methods: Modeling and GIS
We used remotely sensed data and GIS to develop a rapid assessment method for
selecting potential habitat and restoration sites for Amaranthus pumilus. A. pumilus tends to
occur in areas that are relatively homogeneous in terms of topography (Sellars 2001), i.e., areas
that have minimal changes in elevation and/or aspect over short distances (15 – 30 m). These
topographic characteristics can be extracted from digital elevation models (DEMs) (Sinton et al.
2000, Thompson et al. 2001).
The lack of high-resolution DEMs has been a limiting factor in dune studies (Brown and
Arbogast 1999); however, a recently developed technology, Light Detection And Ranging
(LIDAR), has provided a new source for generating these DEMs. LIDAR topographic data are
collected via laser emitted from a low flying aircraft (Fig. 1). Elevation data (+ 15 cm accuracy)
are determined by recording trip time for the laser to the ground and back to the laser altimeter
while horizontal data are recorded using a differentially corrected global positioning system
(DGPS). The elevation and horizontal data are then combined and made available through the
National Oceanic and Atmospheric Administration‟s Coastal Services Center (NOAA-CSC,
Charleston, SC).
LIDAR data have been collected for most of the United States maritime coast, including
North Carolina. LIDAR data were collected in North Carolina by the Airborne LIDAR
Assessment of Coastal Erosion (ALACE) partnership. The ALACE partnership is a
collaboration among NOAA, the National Aeronautic and Space Administration (NASA), and
the US Geologic Survey (USGS), and are available through an on-line Web-based application
from the NOAA-CSC, the LIDAR Data Retrieval Tool (LDART). The North Carolina missions
0057118
Final Report 2004: Restore Seabeach Amaranth
Jolls, Sellars, Johnson and Wigent
2001 Natural Resource Preservation Program
RMP Project Statement Number: CAHA-N-018.000, CALO-N-006.001, ASIS-N-016.005
6
have been flown for the years 1996-2000 in an effort to document shoreline change (Meredith et
al. 1999). However, LIDAR data are not available for all portions of the state for all years.
Two habitat variables known to influence the distribution of Amaranthus pumilus,
elevation and elevation change through time (Bücher and Weakley 1990, Weakley and Bucher
1992), are both obtainable from LIDAR data. Sellars (2001) combined these variables and
others (slope, standard deviation of elevation and of aspect as measures of topographic
heterogeneity) into a single model to predict seabeach amaranth occurrence and habitat using a
total of 164 plants from three sites in Carteret and Brunwick County, NC. The model was
constructed and evaluated using multiple statistical techniques, including regression and other
published model performance measures (Sellars and Jolls 2000, Sellars 2001, Sellars and Jolls
2001a, b, 2002 and in review). They found that elevation was the most limiting topographic
variable controlling the occurrence of A. pumilus.
In coastal systems, elevation is frequently expressed relative to shoreline, defined as the
upper limit of the last high tide (Stockdon et al. 2002). We expressed elevation relative to Mean
High Water (MHW). Mean high water is the average high water level defined from tidal gauge
stations, based on local sea level. However, mean high water is not comparable across sites.
Elevations that are comparable across sites are expressed relative to a vertical geodetic datum. A
datum is defined as a set of constants specifying the coordinate system used for geodetic control.
These systems may be historic, e.g. NGVD29 or more current, such as NAVD88. LIDAR data
are in NAVD88 and can be converted to local tidal benchmarks, e.g., Mean Lower Low Water,
Mean High Water, Mean Tide Level, etc. Our model used seabeach amaranth elevations relative
to mean high water, defined as the average high tide. We calculated Mean High Water (MHW
by using National Ocean Service tidal benchmark data. By subtracting the elevation above
0057119

Final Report 2004: Restore Seabeach Amaranth
Jolls, Sellars, Johnson and Wigent
2001 Natural Resource Preservation Program
RMP Project Statement Number: CAHA-N-018.000, CALO-N-006.001, ASIS-N-016.005
7
MHW from the elevation in NAVD88, the result is the elevation above MHW in NAVD88. For
our model, MHW was determined as the difference between the local tidal benchmark and
NAVD88 elevation. Elevations above MHW then were computed.
Additionally, we also used grayscale (passive) LIDAR data to assess the role of
vegetation cover in A. pumilus distribution (Sellars 2001, Sellars and Jolls in review). The
passive LIDAR images are grayscale-panchromatic “pictures” of the beach and can be used to
distinguish areas of different habitat type (Fig. 2). The occurrence of seabeach amaranth in
previous years also was factored into the models. The models using elevation and passive
LIDAR performed well, predicting 46-100% of the plant occurrences using as little as 2% of the
habitat. Our initial models stressed elevation in the designation of seabeach amaranth habitat. In
2003, however, statistical analyses of 2001 natural plant occurrences on Cape Lookout using a
stepwise discriminant function analysis of 2000 LIDAR data suggested that passive LIDAR and
distance from shore can be used to predict > 90% of plant occurrences (Sellars et al. 2003).
Model loadings showed that the passive data, an index of bare sand, is the more important of the
two variables. In addition, this model predicted that as little as 15% of the area would be suitable
habitat for seabeach amaranth. This suggests that one critical additional habitat variable is open
sand (Sellars et al. 2003).
In 2002-2004, we extended this work to other protected shorelines for which extensive
LIDAR data are available, e.g. Assateague Island National Seashore (ASIS), MD, and their
recent reintroduction program for seabeach amaranth (Lea and King 2002, Chris Lea and Mark
Duffy, NPS, pers. comm.). ASIS also houses protected taxa and has begun a reintroduction
program through the year 2002. In addition, individual GPS locations exist for seabeach
amaranth plants at the northern limit of its range in New York (Tom Hart, NY Coastal
0057120

Final Report 2004: Restore Seabeach Amaranth
Jolls, Sellars, Johnson and Wigent
2001 Natural Resource Preservation Program
RMP Project Statement Number: CAHA-N-018.000, CALO-N-006.001, ASIS-N-016.005
8
Resources; Jon Young and John Ozard, New York State Department of Environmental
Conservation. GIS/LIDAR analyses was compiled as a series of “tiles” for each seashore: four
for ASIS and six each for CAHA and CALO (Fig. 3).
Methods: Surveys for Naturally-Occurring Amaranthus pumilus
Naturally occurring plants were initially located by visiting sites known to have plants in
previous seasons by walking and use of ATVs. All Cape Hatteras and Cape Lookout beaches
were searched by ECU and/or NPS staff; locations of these plants relative to our model based on
elevation and vegetation cover are presented in Figs. 4-14. Groups typically consisted of two or
three plants but occasionally included clumps with dozens of plants. Estimates were made of the
number of plants in large clumps by counting the number of individuals in a smaller area,
counting the number of similar sized areas in the clump, and then multiplying. Similarly, to
estimate the large number of plants on the east end of Shackleford Banks during the 2003 season,
the density of plants per meter of beach was multiplied by the length of that section of beach.
Locations of plants at ASIS were obtained from NPS personnel; their methods are not
part of this report. GPS positions were recorded using a Garmin 12 handheld with a differential
beacon receiver (Garmin International Inc., Olathe, KS) with accuracy of 2 m. GPS positions
were recorded for individual plants and small groups of plants. GPS locations of naturally
occurring plants were compiled, analyzed and entered into GIS software, ArcView (ESRI,
Redlands, CA, Figs. 4-14). Some additional locations for single, remotely located plants were
provided by park service personnel.
Elevations were measured for many naturally occurring plants. In all cases, an electronic
laser level (Topcon
RL-50A, Paramus, NJ) was used to over-land survey to the plants from a
0057121

Final Report 2004: Restore Seabeach Amaranth
Jolls, Sellars, Johnson and Wigent
2001 Natural Resource Preservation Program
RMP Project Statement Number: CAHA-N-018.000, CALO-N-006.001, ASIS-N-016.005
9
known vertical elevation reference mark. The vertical reference marks were of two types: 1)
National Geodetic Survey (NGS) markers, and 2) benchmarks we established ourselves based on
NGS markers. We established our own benchmarks only when NGS markers were unavailable
or impractical for use as laser level references. Two Trimble GPS units, simultaneously
recording carrier phase data, were used to establish the elevations at our new remote
benchmarks. Those data then were downloaded using Pathfinder Office software (Trimble
Navigation, Ltd., Sunnyvale, CA), converted to RINEX format (RINEX version 1.9, Magellan
Corp., San Dimas, CA) and post-processed using Magellan
MSTAR software (Magellan
Systems Corp., San Dimas, CA). Estimated elevation accuracies at the new remote benchmarks
were 10 cm.
Results: Habitat Assessment, GIS and Plant Occurrence Data on CD
GIS/LIDAR analysis has been completed for the majority of the historic range of
seabeach amaranth on Assateague Island, Cape Hatteras and Cape Lookout National Seashores.
The results of the GIS are presented for each of the three national seashores as Figures 4-19 and
also digitally on a compact disk (CD), along with reports and an explanatory presentation as
guide for the CD (lidar.ppt) also are on the disk. The file structure of the CD is presented in Fig.
20,including analyses from ArcView. Mean High Water, shoreline, elevation change and
location of plants. The images are in GeoJPEG format (*.jpg). This format has the advantages
of small-sized files which are easily imported to GIS programs and viewed without GIS software
using any imaging software. Each *.jpg file has an associated *.jgw “World File”, a file which
tells ArcView where to draw the picture, and an associated metadata or explanatory text file
0057122

Final Report 2004: Restore Seabeach Amaranth
Jolls, Sellars, Johnson and Wigent
2001 Natural Resource Preservation Program
RMP Project Statement Number: CAHA-N-018.000, CALO-N-006.001, ASIS-N-016.005
10
(*.met). ArcView Extensions are needed to view the GeoJPEGs and also are included on the CD
(directory arc_ext:\ *.avx, *.dll files).
Elevation difference between the earliest and latest record for each site was calculated;
this provides an indication of erosion/deposition trends. Mean High Water shapefiles (directory
mhwshape) present the location of Mean High Water (MHW) as a contour line for each year for
each seashore, e.g., Assateague Island (subdirectory asis_mhw) and the associated *.dbf, *.met,
*.shp, *.sbn and *.sbx files. The GeoJPEG files depict location of shoreline; overlaying the
MHW line for several years provides insight to the migration of the shore. Elevation relative to
Mean High Water is color-coded with an embedded legend; elevations below MHW are blue.
Elevation change between years also is color-coded. Erosional areas are in shades of yellow,
orange and red; depositional areas are in greens.
The GeoJPEG files are presented as a series of tiles within each of the three national
seashores; again, four for ASIS and six each for both CAHA and CALO (Fig. 3). The files have
been given intuitive eight-character names. For the elevation tiles, the first four characters
indicate park (ASIS, CAHA, CALO), the fifth and sixth characters indicate tile number (1-4 or
1-6) and the final two characters indicate year (1996-2000). For the elevation change tiles, the
first two characters indicate park, the second two indicate tile number, and the last four
characters denote years of comparison, e.g., files cht19700.jpeg, cht19700.jgw and cht19700.met
contain the elevation change tile for Cape Hatteras, Tile 1, between 1997 and 2000, expressed as
a GeoJPEG with the associated metadata or explanatory text file (*.met).
The gps_data directory houses GPS data as *.dbf, *.met, *.shp, *.sbn and *.sbx files
which depict 1) locations of naturally occurring seabeach amaranth and 2) locations of our
transplant plots for Cape Hatteras (directory caha) and Cape Lookout (directory calo).
0057123
Final Report 2004: Restore Seabeach Amaranth
Jolls, Sellars, Johnson and Wigent
2001 Natural Resource Preservation Program
RMP Project Statement Number: CAHA-N-018.000, CALO-N-006.001, ASIS-N-016.005
11
Results: Habitat Assessment and Naturally-Occurring Plants
The plant location data are presented in Figs. 4-14. For each site, locations are overlain
on passive LIDAR imagery. Again, the passive LIDAR images are grayscale “pictures” of the
beach and can be used to distinguish areas of different vegetation cover and habitat type.
Numbers of naturally occurring plants of seabeach amaranth have declined dramatically
at the North Carolina national seashores since 1990 (Table 1). Historically, Cape Hatteras
National Seashore harbored significantly greater numbers of plants than did Cape Lookout, a
pattern that has reversed in the last decade. Natural population numbers demonstrate some
unknown pattern of highs and lows, possibly related to storm events or even anthropogenic
influences. Numbers have increased since a statewide low in 2000, particularly at CALO;
however, total numbers at the national seashores are well below the historic averages of 2614
1282 plants (mean standard error) at CAHA and CALO.
In 2003, a total of 49 GPS location points and 54 plants were recorded on all of Cape
Hatteras National Seashore (Figs. 8-10). Most of these plant locations were recorded on
Ocracoke Island by NPS personnel; the remaining plants occurred at sites on the west side of
Hatteras Point. A total of 526 points and 1560 plants were recorded at Cape Lookout National
Seashore (Figs. 11-14). Most of these plants were on the east end of Shackleford Banks. Many
of the other plants were on the west to west-central portions and the southwestern-facing side of
Shackleford, and Cape Lookout Spit of South Core Banks (Table 1, Figs. 11-14).
Methods: Analysis of Total Suitable Habitat
Total suitable habitat as predicted by our model was determined for each tile and each
year at each of the seashores. We asked whether the amount of suitable Amaranthus pumilus
0057124

Final Report 2004: Restore Seabeach Amaranth
Jolls, Sellars, Johnson and Wigent
2001 Natural Resource Preservation Program
RMP Project Statement Number: CAHA-N-018.000, CALO-N-006.001, ASIS-N-016.005
12
habitat differed between the North Carolina seashores or among years. Tiles 3-6 at CALO did
not have 2000 data available, so comparisons of 2000 data were excluded from the analysis.
Using ArcView GIS 3.2 (ESRI, Redlands, CA) software, a query was made from all the 3 by 3
m2 cells within each pair of grids (elevation and reflectance) for all the cells having both the
characteristics specified by our model. A single new grid was created with cells having either a
value of “0” or “1”. Grid cells that had 1) an elevation value between 0.77 and 2.00 meters
above Mean High Water and 2) had a reflectance value above 170 units were given a value of
“1”, denoting suitable habitat. All other cells were either too high, too low or too vegetated (low
reflectance); these cells were given a value of “0” denoting unsuitable habitat. The total number
of cells in each category was multiplied by 0.0009 (1 cell = 3 x 3 m2 and 1m
2 = 0.0001 ha) to
yield the total areas of suitable and unsuitable habitat in hectares (ha). We attempted to adjust
for differences in seashore size by expressing total suitable habitat area per length of shoreline
(ha/km).
Results: Analysis of Suitable Habitat
Variability in the precision of elevation and reflectance data limits the application of this
method of habitat analysis. The reflectance data are “passive” and rely on ambient light; thus,
different times of day, cloud covers and/or soil moistures result in variation in reflectance values.
LIDAR missions were flown on different days, even within the same year for the same seashore;
different conditions produced naturally variable reflectance data within a seashore for any given
year. Also, significant variation in elevation was seen among data sets for sites where elevation
is static and values should be invariant, such as parking lots or rooftops, making year-to-year
comparisons tenuous and cautionary. Either the data sets will have to be standardized or the
parameters of the model will have to be redefined before certain comparisons of suitable habitat
0057125

Final Report 2004: Restore Seabeach Amaranth
Jolls, Sellars, Johnson and Wigent
2001 Natural Resource Preservation Program
RMP Project Statement Number: CAHA-N-018.000, CALO-N-006.001, ASIS-N-016.005
13
can be made. This natural variability in the data as well as lack of concurrent or recent LIDAR
can under- or over-estimate the amount of available critical habitat for Amaranthus pumilus,
limiting comparisons between sites or among years. Nevertheless, some general statements
about total habitat area at Cape Lookout and Cape Hatteras can be made.
Total suitable habitat for CALO is nearly twice that at CAHA. An average of 532 and
254 ha of suitable habitat occurred at CALO and CAHA, respectively, based on our model, using
all years of available data. Suitable habitat per kilometer of shoreline averaged 6.0 ha/km (n = 2
yr) and 3.7 ha/km (n = 3 yr) at CALO and CAHA, respectively.
The reasons for these differences in total seabeach amaranth habitat between seashores
are as yet unclear, but may be related to 1) number of inlets per seashore and 2) beach aspect.
Inlet areas tend to have wider beaches and potentially more seabeach amaranth habitat. CALO
has six island ends; CAHA only has three. Plants historically have been found in greater
numbers on south-facing beaches. We attempted to compare availability of south-facing beaches
between seashores. Only a few kilometers of any beach actually face in any one direction, so we
estimated the “breaking points” (e.g., breaking points between beaches that faced south to
beaches that faced more east) subjectively. There were only a few sections of shoreline that
needed to be separated into one aspect category or another. We used the distance measurement
tool in ArcView to calculate linear extent of each beach by aspect then used the same methods
reported above to determine ha/km. Cape Lookout Point at CALO reaches further south and has
a longer western face than does Cape Hatteras Point at CAHA (Figs. 15 and 18). Cape Hatteras
Point is relatively short compared to Cape Lookout; almost immediately west of Cape Hatteras
Point, the beach turns south and then south-east facing. At CAHA, about 70% of the shore faces
southeast and only a small section on the west side of the point faces westward (Fig. 15-16). The
0057126

Final Report 2004: Restore Seabeach Amaranth
Jolls, Sellars, Johnson and Wigent
2001 Natural Resource Preservation Program
RMP Project Statement Number: CAHA-N-018.000, CALO-N-006.001, ASIS-N-016.005
14
only west-facing portion of CAHA is at Cape Hatteras Point, with the exception of the inlets.
Dune stabilization along NC Highway 12 and whether a beach is eroding or accreting may also
affect the amount of suitable habitat. Approximately 21% of the shore at CALO is south- and
somewhat west-facing, although the east-facing shores at Cape Lookout Point have more suitable
habitat: 6.3 and 5.4 ha/km for south- and east-facing beaches, respectively (Fig. 18).
Task 2: Seed and Seedling Reintroduction and Success of Transplants
Amaranthus pumilus is an annual with no vegetative reproduction; as a result,
populations must recruit annually from seed banks either in situ or from other source populations
dispersed by water, wind or from on or offshore sediments distributed by anthropogenic factors.
Seabeach amaranth seed are dormant and must be scarified (the seed coat broken by nicking or
abrasion, Hancock and Hosier 2001) or cold stratified (chilling for weeks) before germination of
any magnitude can occur (Baskin and Baskin 1998, Jolls et al. 2001).
Timing of establishment, as seed or juvenile, is critical to plant success. Moisture
availability in dune ecosystems has been found to affect seedling survivorship (Payne and Maun
1984) and tends to decrease through the growing season (de Jong 1979, Baldwin and Maun
1983). Seedling size (Gerry and Wilson 1995) and transplant date (Billington et al. 1990) also
have been found to affect plant survival. Date of planting and size of transplants influence
survival of greenhouse-reared Amaranthus pumilus (Sellars 2001). During three field seasons,
we asked how site of transplants affects success of seabeach amaranth. We used habitat
delineated by our GIS model based on LIDAR to select sites for transplant in the field. We
compared A. pumilus survival, growth and reproduction in and outside of this defined habitat.
Plant Response to Elevation: Transplants 2001
Methods: Transplants 2001
0057127

Final Report 2004: Restore Seabeach Amaranth
Jolls, Sellars, Johnson and Wigent
2001 Natural Resource Preservation Program
RMP Project Statement Number: CAHA-N-018.000, CALO-N-006.001, ASIS-N-016.005
15
Plant Response to Elevation 2001:
Stratification, Seed Source, Seed Germination and Propagation of Transplants
Transplants for field tests of our habitat model were reared from seed in controlled
environments. Stratification was accomplished by placing seeds into a moist medium (sand or
paper toweling) in Petri dishes at 5 C for three months (Baskin and Baskin 1998). Some seeds
were obtained through the Agricultural Research Service-Germplasm Resources Information
Network (ARS-GRIN) from David Brenner, Plant Introduction Station, Iowa State University
Ames, IA. These seeds represent genotypes reared from seeds originally collected at Cape
Hatteras in 1989. In addition, during fall 2000, seeds were collected from extant plants from
CALO and reared in the greenhouse for transplant to that national seashore.
The stratified seeds were germinated on moist sand in a Conviron® growth chamber
(Controlled Environments, Inc., Pembina, ND) at 18/6 light/dark photoperiod with a 30/20C
thermoperiod. Seedlings with a radicle at least 1 cm long were transplanted to a media of 50:50
(beach sand:top soil) in Cone-tainers® (Steuwe and Sons, Inc., Corvallis, OR). Seeds of
Amaranthus pumilus are highly germinable (Baskin and Baskin 1998, Hancock and Hosier
2003). We have obtained at least 60% germination from seeds stratified 8 wk; 12 wk
stratification reportedly yield higher germination, nearly 100% (Baskin and Baskin 1998).
Individuals transplanted in laboratory controlled conditions have exhibited no more than 24%
mortality using our laboratory protocol.
The juveniles were maintained in the growth chamber or under light banks until 2 wk
before transplanting when they were moved into a greenhouse under ambient light and
temperature conditions. This was done in an effort to harden off the seedlings prior to
transplanting. Leaf number and rosette diameter were recorded for all juveniles prior to
0057128

Final Report 2004: Restore Seabeach Amaranth
Jolls, Sellars, Johnson and Wigent
2001 Natural Resource Preservation Program
RMP Project Statement Number: CAHA-N-018.000, CALO-N-006.001, ASIS-N-016.005
16
transplant to select similar-sized plants for field trials and limit the confounding effects of initial
plant size on success, defined as aspects of survival, growth and reproduction.
Plant Response to Elevation 2001: Transplant Site Selection and Experimental Design
In summer 2001, 360 lab-reared juveniles were transplanted to sites at Cape Hatteras and
Cape Lookout National Seashores. Specific sites for reintroduction at Cape Hatteras National
Seashore (CAHA) and Cape Lookout National Seashore (CALO) were selected from historic
records of plant occurrences as well as results of the GIS/LIDAR analysis. Site selection and
monitoring was coordinated through the National Park Service (NPS) personnel.
LIDAR data were used to guide transplant site selection. “Good” habitat was considered
to be within the elevation range of 0.77 – 2.00 m above Mean High Water (MHW) and in areas
not experiencing strong erosional trends (Sellars 2001). For each of the transplant locations, an
attempt was made to place two plots in “good” habitat (IN plots) and the third outside of “good”
habitat (either above or below the elevation range for “good” habitat, OUT plots). However,
sites selected in the lab and final placement in the field did not always correspond. The lack of
current LIDAR data for all sites and the logistics of working around bird nesting locations
necessitated new site selection in some areas. For example, two sites selected at North Ocracoke
using what at the time was the most current data (1997 and 1998) were in areas that are now in
Hatteras Inlet. Two new sites were selected “by eye”. The new sites were checked against
“good” habitat in the lab. Upon returning to the site, shorebirds had nested in one of the new
sites. Final site selection for North Ocracoke led to the selection of two sites outside of “good”
habitat.
Plots (10 x 12 m2) were established at 12 sites: at CAHA (9 sites, Figs. 15 and 16) and
CALO (3 sites, Figs. 18-19). Some plots were predicted to be poor habitat (OUT), either above
0057129

Final Report 2004: Restore Seabeach Amaranth
Jolls, Sellars, Johnson and Wigent
2001 Natural Resource Preservation Program
RMP Project Statement Number: CAHA-N-018.000, CALO-N-006.001, ASIS-N-016.005
17
or below the elevational optimum for seabeach amaranth: P3, I3, O2, O3 and L3. Hatteras Point
(plots P1-P3) and Hatteras Inlet (plots I1-I3) were planted on 01 and 02 June 2001. North
Ocracoke (plots O1-O3) was planted on 11 June 2001 and Cape Lookout (plots L1-L3) was
planted on 18 June 2001.
For each plot, 30-2 x 2 m2 cells were delineated by center point within a 10 x 12 m
2 grid.
At each center point, a pre-labeled marker (wooden paint stick with a unique ID based on plot
and position within the plot) was driven into the ground. Transplants were placed approximately
25 cm in front of the marker. Juveniles were maintained in their Cone-tainers® under shade prior
to transplant. The transplants were soaked in a small tub immediately before transplant to
saturate the soil plugs. This facilitated extraction of the soil plugs containing each juvenile. The
Cone-tainers® were held inverted with the plant stem secured by two fingers and the edge of the
container tapped against the edge of a planting trowel until the soil plug with the plant exited.
The plants were then placed in a pre-excavated hole and planted to just below the main rosette.
Plant Response to Elevation 2001: Transplant Census
Monitoring of the cohorts took place twice during the growing season to evaluate
survivorship; each seashore was censused once. The Cape Lookout plots were censused on 2
August 2001; those at Hatteras Point, Hatteras Inlet and North Ocracoke plots were censused on
14 August 2001.
Plant Response to Elevation: Transplants 2002
Methods: Transplants 2002
Plant Response to Elevation 2002:
Stratification, Seed Source Seed Germination and Propagation of Transplants
0057130
Final Report 2004: Restore Seabeach Amaranth
Jolls, Sellars, Johnson and Wigent
2001 Natural Resource Preservation Program
RMP Project Statement Number: CAHA-N-018.000, CALO-N-006.001, ASIS-N-016.005
18
Seeds were chilled for germination using the methods developed in 2001. The majority
of 2002 transplants at CAHA were from 11 genotypes collected in 2001. There were 15 plants
generated from seeds obtained through the Agricultural Research Service-Germplasm Resources
Information Network (ARS-GRIN) from David Brenner, Plant Introduction Station, Iowa State
University Ames, IA. These seeds represent genotypes reared from seeds originally collected at
Cape Hatteras in 1989. In addition, during fall 2000, seeds were collected from 13 extant plants
from CALO and reared in the greenhouse for transplant to that seashore.
The stratified seeds were germinated using methods used in 2001, e.g., on moist sand in a
Conviron® growth chamber (Controlled Environments, Inc., Pembina, ND) at 18/6 light/dark
photoperiod with a 30/20C thermoperiod. Seedlings with a radicle at least 1 cm long were
transplanted to a media of 50:50 (beach sand:top soil) in Cone-tainers® (Steuwe and Sons, Inc.,
Corvallis, OR).
The juveniles were maintained in the growth chamber or under light banks until 2 wk
before transplanting. At this time, potential transplants were moved into a greenhouse under
ambient light and temperature conditions. This was done in an effort to harden off the seedlings
prior to transplanting. Leaf number was recorded for all juveniles prior to transplant.
Plant Response to Elevation 2002: Transplant Site Selection and Experimental Design
The 2002 study was designed to determine the influence of elevation on plant growth and
survival. Elevations in these plots ranged from 0.30 to 2.70 m above MHW. Plants were
grouped into one of three elevation treatments: below (< 0.77 m above MHW, group = LOW),
within (0.77 – 2.00 m above MHW, group = IN), or above (> 2.00 m above MHW, group =
HIGH) the range predicted by the habitat model. For further verification of the influence of
0057131

Final Report 2004: Restore Seabeach Amaranth
Jolls, Sellars, Johnson and Wigent
2001 Natural Resource Preservation Program
RMP Project Statement Number: CAHA-N-018.000, CALO-N-006.001, ASIS-N-016.005
19
elevation on plant size, we censused a sub-sample (n = 43/261) of the naturally-occurring plants
on Shackleford Banks (CALO) by laser level on 13 September 2002.
Preliminary site selection was completed using historic records as well as GIS/LIDAR
analysis. Appropriate habitat was considered to be within the elevation range of 0.77 – 2.00 m
above Mean High Water (MHW), in areas not experiencing strong erosional trends (Sellars
2001), and in areas of open sand. MHW for the two parks is not the same, therefore, we used
National Ocean Service (NOS) Tidal Benchmarks to calculate local MHW for each park.
LIDAR data were not available for the year 2001. We used traditional survey methods to
establish elevation control points (points of known elevation) at two sites each at CAHA and
CALO. This involved over landing from National Geodetic Survey (NGS) or National Park
Service (NPS) vertical benchmarks with a RL-50A laser level (Topcon™, Paramus, NJ). Final
site selection and monitoring was coordinated through NPS personnel.
In summer 2002, 690 lab-reared juveniles were transplanted to sites CAHA and CALO
(360 and 330, respectively). Plots (10 x 12 m2) were established at 12 sites ea in CAHA (Fig.
15) and CALO (Fig. 19). Transplants at CAHA were planted on 10-11 June 2002 and those at
CALO on 19 June 2002 using methods described for 2001. There were 30 plants per plot with
the exception of three plots on Cape Lookout that were in exceptionally high risk areas due to
low elevation and exposure to overwash; these plots received only 20 plants each
Plant Response to Elevation 2002: Transplant Census
Monitoring of the cohorts took place twice monthly through 10 wk of the growing season
and once monthly thereafter. During each census event, we measured growth (as maximum
diameter in cm), survivorship (presence/absence) and reproductive success (whether or not seeds
had set). Results are based on the last census (week 10).
0057132

Final Report 2004: Restore Seabeach Amaranth
Jolls, Sellars, Johnson and Wigent
2001 Natural Resource Preservation Program
RMP Project Statement Number: CAHA-N-018.000, CALO-N-006.001, ASIS-N-016.005
20
We also evaluated growth of transplants among treatments as relative change in diameter.
The proportional change in diameter ((diameter at wk 10 – diameter at wk 2)/ diameter at wk 2))
among the three groups was compared using an analysis of variance (ANOVA) with Tukey HSD
Post-Hoc Tests. Data were transformed (natural log(x +1)) to achieve homogeneity of variances.
There were 11 plants each from the IN and HIGH groups that were not used for growth analysis,
having been decapitated by either wind, ghost crabs or birds. These plants, however, were alive
and were included in the analyses of survival and seed set. Survival among the three groups and
seed set (Yes/No) for the surviving plants was compared using Pearson Chi-Square. Seed set
(Yes/No) was scored as “Yes” if the plant had set seed at any point during the census period.
Naturally-occurring plants were grouped by elevation as above, natural log transformed and
compared using ANOVA with Post-Hoc tests. All analyses were performed using SPSS™
11.0.1.
Plants Response to Elevation and Distance from Shoreline: Transplants 2003
Methods: Transplants 2003
In 2003, we again used seedlings reared in controlled environments outplanted to 12 plots
each at CAHA and CALO to ask how well our model could predict habitat and plant success of
seabeach amaranth. Greenhouse-reared plants were transplanted to experimental treatment plots
in a replicated paired design to test the effects of elevation (“LOW” vs. “HIGH”) at CAHA and
CALO and distance from shoreline (“NEAR” vs. “FAR”) at CALO.
Plant Response to Elevation and Distance from Shoreline 2003:
Seed Source, Stratification, Seed Germination and Propagation of Transplants
Seeds of Amaranthus pumilus again were artificially stratified on autoclaved moist sand
in Petri dishes in the drawer of a laboratory refrigerator at 5-10C for at least 12 wk. We chose
0057133
Final Report 2004: Restore Seabeach Amaranth
Jolls, Sellars, Johnson and Wigent
2001 Natural Resource Preservation Program
RMP Project Statement Number: CAHA-N-018.000, CALO-N-006.001, ASIS-N-016.005
21
to minimize the number of genotypes used in this study to insure consistency of replicates. Our
aim was to be able to conclude that differences in performance were due to treatments rather than
plant parentage. The majority of 2003 transplants at CAHA were from six different parent plants
genotypes collected in the field in July and December 2001. Transplants to CALO were from
three different parents from seed collected at CALO in September 2002, or the F1 progeny
obtained from selfings of these genotypes in greenhouse propagation.
The stratified seeds were germinated using methods similar to 2001 and 2002, e.g., on
autoclaved moist sand in a Conviron® growth chamber (Controlled Environments, Inc., Pembina,
ND) at 18/6 hr light/dark photoperiod with a 30/20C thermoperiod. Seedlings with a radicle at
least 1 cm long were transplanted to a medium of 100% autoclaved beach sand in Cone-tainers®
(Steuwe and Sons, Inc., Corvallis, OR). Sand was retained in the Cone-tainer using two layers of
landscaping cloth cut as disks and folded into cones.
In 2003, space limitations at ECU and the generosity of Dr. Thomas Wentworth and
others at the Department of Botany, North Carolina State University, provided an alternative
propagation environment. On 4 April 2003, transplants were moved to the Southeast Plant
Environment Laboratories (SEPEL) at North Carolina State University (NCSU Phytotron) and
maintained in a 26/22 C day/night controlled temperature greenhouse on long days. The plants
were subjected to long days using a 9/15 hr light/dark cycle with the dark period interrupted with
a 11-12 µmol s-1
m-2
from incandescent filament lamps. Plants received a standard nutrient
solution once per day. The composition is detailed in the NCSU Phytotron Procedural Manual
(Thomas et al. 2003, http://www.ncsu.edu/phytotron/manual.pdf).
0057134

Final Report 2004: Restore Seabeach Amaranth
Jolls, Sellars, Johnson and Wigent
2001 Natural Resource Preservation Program
RMP Project Statement Number: CAHA-N-018.000, CALO-N-006.001, ASIS-N-016.005
22
The juveniles were maintained at SEPEL until late May 2003. At this time, potential
transplants were moved into the greenhouse at East Carolina University under ambient light and
temperature conditions approximately 1 wk before transplanting at CAHA and CALO. This was
done in an effort to harden off the seedlings prior to transplanting. Leaf number and diameter in
cm were recorded for all juveniles prior to transplant.
In summer 2003, 648 lab-reared juveniles were transplanted to sites at Cape Hatteras and
Cape Lookout National Seashores (324 at each park). Plants were selected without bias based on
similarity of size determined from leaf numbers of diameters; in all but a few cases, plants were
not flowering. Plots for transplants (6 x 18 m2) were established at 12 sites each at CAHA and
CALO. Transplants at CAHA were planted on 1 June 2003 (Figs. 15-17) and those at CALO on
10 June 2003 (Figs. 17 and 19). For each plot, 27-2 x 2 m2 cells were delineated by center point
within the 8 x 16 m2 grid. There were 27 plants per plot. Juveniles were maintained in their
Cone-tainers® under shade prior to transplant. Greenhouse-reared plants were transplanted using
the methods of 2001 and 2002.
Plant Response to Elevation and Distance from Shoreline 2003:
Transplant Site Selection and Experimental Design
Preliminary site selection was completed using historic records as well as GIS/LIDAR
analysis. Again, appropriate habitat (IN) was considered to be within the elevation range of 0.77
– 2.00 m above Mean High Water (MHW), in areas not experiencing strong erosional trends and
in areas of open sand (Sellars 2001). MHW for the two parks is not the same; therefore, we used
National Ocean Service (NOS) tidal benchmarks to calculate local MHW for each park. LIDAR
data were not available for the year 2001, 2002 or 2003; as a result, we used traditional
surveying and GPS base station methods to establish elevation control points (points of known
0057135

Final Report 2004: Restore Seabeach Amaranth
Jolls, Sellars, Johnson and Wigent
2001 Natural Resource Preservation Program
RMP Project Statement Number: CAHA-N-018.000, CALO-N-006.001, ASIS-N-016.005
23
elevation) at several sites each on CAHA and CALO. Traditional surveying methods involved
over-landing from National Geodetic Survey (NGS) or National Park Service (NPS) vertical
benchmarks with a RL-50A laser level (Topcon™, Paramus, NJ). GPS base stations methods
involved using two Trimble GPS units. Final site selection and monitoring was coordinated
through NPS personnel.
This study was designed to determine first, the influence of elevation and second,
distance from shoreline on plant growth and survival. Elevations in these plots ranged from 0.30
to 2.00 m above MHW. Plants were grouped into one of two elevation treatments: within (IN),
or above (HIGH) the range predicted by the habitat model at CAHA and CALO (Figs. 15, 17 and
19). Six plots at the northern end of CALO Spit were below the predicted elevation range (0.77
– 2.00 m above MHW); these plots were arranged in pairs of NEAR and FAR from shore to test
the influence of risk of overwash on plant success (Fig. 19). Although not presented here, we
also recorded the locations and elevations of a sub-sample of the naturally-occurring plants on
CAHA and at CALO using a laser level from in July and August 2003 for later analyses of the
influence of elevation on plant performance.
Plant Response to Elevation and Distance from Shoreline: Transplant Census 2003
Monitoring of the cohorts took place twice monthly through wk 10 of the growing
season; logistical complications prevented the wk 6 census at CALO, however. During each
census event, we evaluated growth (as maximum diameter in cm), survivorship
(presence/absence), reproductive success (flowering, forming seeds, or seed set) and influence of
herbivores (insect or vertebrate, web worm presence; low, medium or high tissue removal).
Results are based on the last census (wk 10) with the exception of the NEAR vs. FAR plots at
0057136

Final Report 2004: Restore Seabeach Amaranth
Jolls, Sellars, Johnson and Wigent
2001 Natural Resource Preservation Program
RMP Project Statement Number: CAHA-N-018.000, CALO-N-006.001, ASIS-N-016.005
24
CALO (Fig. 19 . In this case, overwash events eliminated most plants by wk 2; as a result, the
earliest census at wk 2 also was used in the analyses of plant response.
Initial plant diameter was used as a covariate in an ANCOVA to control for any possible
effect of initial plant diameter on subsequent plant size. Data were natural log transformed to
meet the assumptions of analysis of covariance (ANCOVA), specifically, homogeneity of
variances and normality; the assumption of parallel lines also was met. Not all of the data were
normally distributed after the transformation, however, the ANCOVA is nevertheless robust to
slight departures in normality. The initial plant diameter data met all the assumptions of the
ANCOVA; hence, untransformed data were used in the analysis. The data for FAR and NEAR
distances from shore at Cape Lookout National Seashore were not included in the ANCOVA,
due to poor survival after an overwash event that occurred before wk 2. Categorical variables
such as survival and reproductive status were analyzed using Chi-Square or Fisher‟s Exact Test.
All analyses were conducted using SPSS 11.5.
0057137

Final Report 2004: Restore Seabeach Amaranth
Jolls, Sellars, Johnson and Wigent
2001 Natural Resource Preservation Program
RMP Project Statement Number: CAHA-N-018.000, CALO-N-006.001, ASIS-N-016.005
25
Results: Plant Response to Elevation: Transplants 2001
Survival of transplants was highly variable among sites (Fig. 21). Low survival on some
plots with what was originally determined as suitable habitat was probably related to use of older
LIDAR coverage data, i.e., those sites truly were not within the predicted elevation range. For
example, the Cape Hatteras Inlet (I1 IN, I2 IN, I3 OUT) and N. Ocracocke (O1 IN, O2 OUT, O3
OUT) plots were selected based on determination of shoreline elevations and erosional trends
using LIDAR data from 1998, more than two years old. At N. Ocracoke, two of the plots were
completely extirpated by overwash early after transplant. Similarly, lack of recent LIDAR
coverage may underestimate availability of “good” habitat for Amaranthus pumilus transplants.
Plants at Cape Hatteras Point P3 (OUT) plot all survived, despite 1999 data suggesting this site
was “too high”, i.e., above threshold elevations relative to MHW. At Cape Hatteras, based on
1998 LIDAR data, the OUT plot (I3) was completely below the acceptable elevation range for
seabeach amaranth habitat, yet 97% of the transplants survived. When the 1999 LIDAR became
available after transplant, however, half of this OUT plot turned out to be within the elevation
range of habitat for the plant, thus, survival of transplants was high, despite initial predictions.
L1-L3 plots (Cape Lookout) were selected from 2000 LIDAR and showed high survival for IN
plots (L1 IN and L2 IN), complemented by very high mortality as predicted by the design in the
OUT plot (L3 OUT).
Results: Plant Response to Elevation: Transplants 2002
Success of Amaranthus pumilus transplants again was affected by site, specifically,
within our predicted elevation range (0.77-2.0 above MHW, IN) or outside this range (LOW or
HIGH). Plant growth, expressed as the proportional change in diameter, differed among the
three elevation treatments (F(2, 360) = 44.41, p < 0.001, Fig. 22). After 10 wk of growth,
0057138

Final Report 2004: Restore Seabeach Amaranth
Jolls, Sellars, Johnson and Wigent
2001 Natural Resource Preservation Program
RMP Project Statement Number: CAHA-N-018.000, CALO-N-006.001, ASIS-N-016.005
26
transplants were largest at the LOW elevation sites and significant smaller within (IN) and above
(HIGH) our predicted elevation range (Tukey HSD, p < 0.001). Survival among plots also
differed. Plant survival in plots was lowest in LOW (10%), intermediate at IN (63%), and
highest at HIGH (94%) elevation groups (Pearson‟s Chi-Square = 192.422, df = 2, p < 0.001,
Fig. 23). Reproductive success also differed among plots (Pearson‟s Chi-Square = 5.578, df = 2,
p < 0.001, Fig. 24). Nearly 100% (82/85) of the surviving plants in the HIGH group had reached
seed set during the first 10 wk. Conversely, none (0/15) of the plants in the LOW group had
reproduced. It appears that those few plants that do survive at the lowest elevations may exhibit
greater growth, proportionally, and delayed seed set compared to transplants at higher elevations.
The sub-sample of naturally-occurring plants (n = 43/261) on Shackleford Banks
(CALO) was selected to compare sizes of plants within (IN) and outside of our predicted
elevation range (LOW or HIGH). Plants selected had a mean elevation of 1.47 ± 0.08 m (mean
± 1 SE) above Mean High Water. Plants below our predicted elevation range were significantly
larger (F(2, 40) = 21.267, p < 0.001, Fig. 25); however, the difference between plant size at IN and
HIGH elevations was not significant (Tukey HSD, p > 0.05). Interestingly, all of these naturally-
occurring plants in the LOW group were on the sound side of the island, more protected from
overwash than plants on the ocean side and more likely to have survived.
Results: Plant Response to Elevation: Transplants 2003
Plant Success: Survival 2003
Success of transplants of Amaranthus pumilus can be extremely high, dependent on
elevation and site or beach dynamics. There was a slight decrease in mean percent survival
throughout the 10 wk census period at both Cape Hatteras (CAHA) (2 June-20 August 2003) and
Cape Lookout (CALO) (11 June-15 August) National Seashores (Figs. 26 and 27). Mean
0057139

Final Report 2004: Restore Seabeach Amaranth
Jolls, Sellars, Johnson and Wigent
2001 Natural Resource Preservation Program
RMP Project Statement Number: CAHA-N-018.000, CALO-N-006.001, ASIS-N-016.005
27
percent survival of transplants overall at 10 wk was greater than 90% at CAHA (Table 5) and
greater than 85% among the three most northeasterly plots at CALO (Table 6). Survival of
Amaranthus pumilus transplants at wk 10 was significantly greater above (HIGH) than in plots
within (IN) the predicted elevation range at Cape Hatteras (X2 = 15.637, df = 1, p < 0.001, Table
5), however, at Cape Lookout, survival of A. pumilus transplants was equal between HIGH and
IN plots (p > 0.04, Fisher‟s Exact Test, Table 6).
Percent survival to 10 wk of Amaranthus pumilus transplants at CAHA was fairly
consistent among all of the northern plots (81-100%) and among the southern plots (five out of
six had 100% survival). The exception was the most southern plot, with only 33.3% survival due
to an early overwash event (Table 7).
Plant survival varied more among plots by beach at CALO than CAHA. Survival of
transplants at five out of the six most northern research plots at CALO ranged from 81-100%,
while one of the plots had 63% survival (Table 8).
Beach location and the associated shoreline dynamics also played a role in Amaranthus
pumilus transplant success at Cape Lookout. An early season overwash concurrent with
astronomical high tides resulted in significant mortality at the northern most plots at CALO;
these plants faced west on Cape Lookout Spit (Fig. 28). Mean percent survival of the A. pumilus
transplants was reduced to less than 35% in research plots farthest (FAR) from shore and less
than 45% in plots nearest (NEAR) to shore at the Cape Lookout Spit due to an overwash event
that took place before the second week of the census period (11 June-25 June 2003). Increased
distance from shore at these lower elevations increased plant survival (Fig. 28). A significantly
greater number of A. pumilus transplants survived to wk 10 among the FAR research plots than
survived in the NEAR research plots (X2 = 23.511, df = 1, p < 0.001, Table 9). There were only
0057140

Final Report 2004: Restore Seabeach Amaranth
Jolls, Sellars, Johnson and Wigent
2001 Natural Resource Preservation Program
RMP Project Statement Number: CAHA-N-018.000, CALO-N-006.001, ASIS-N-016.005
28
two plots that had surviving A. pumilus transplants, one plot each for the NEAR and FAR
treatment (Table 10).
Plant Success: Phenology and Seed Set 2003
Greater than 60% of the Amaranthus pumilus transplants were setting seed by wk 8 in
research plots above (HIGH) and within (IN) the predicted elevation range at Cape Hatteras
(CAHA) (2 June-28 July) and Cape Lookout (CALO) (11 June-31 July) National Seashores (Fig.
29). Plants were equally likely to have set seed in HIGH and IN plots at both CAHA (p = 1.0,
Fisher‟s Exact Test, Table 11) and CALO (p = 0.497, Fisher‟s Exact Test, Table 12) by wk 10
(11 June to 15 August 2003). Greater than 98% of all transplants were reproductive at some
point throughout 10 wk at both parks (Tables 11 and 12).
Plant Success: Size 2003
Means and 95% confidence intervals (CIs) were constructed for initial and wk 10
diameters of Amaranthus pumilus transplants at CAHA and CALO (Table 13), for HIGH and IN
elevations at CAHA (Tables 14) and CALO (Table 15), and for FAR and NEAR distances from
shore at CALO (Table 16). The mean diameters of Amaranthus pumilus transplants at wk 10
then were compared between treatments (HIGH vs. IN) at both seashores, factoring out any
possible influence of initial size of plants. There were no significant differences in initial plant
diameters of transplants used at the two seashores (Table 13) although significant differences
were observed due to treatment effects, i.e., location of transplants (HIGH vs. IN, Tables 14-15
and NEAR vs. FAR, Table 16). There were no significant differences in initial transplant
diameters on average between plots at HIGH and IN elevations at Cape Hatteras National
Seashore (F(1, 298) = 0.111, p = 0.739, Table 14), between plots in HIGH and IN elevations at
Cape Lookout National Seashore (F(1, 159) = 1.287, p = 0.258, Table 15) nor between plots at
0057141
Final Report 2004: Restore Seabeach Amaranth
Jolls, Sellars, Johnson and Wigent
2001 Natural Resource Preservation Program
RMP Project Statement Number: CAHA-N-018.000, CALO-N-006.001, ASIS-N-016.005
29
NEAR and FAR distances from shore at Cape Lookout National Seashore (Table 16, F(1, 160) =
0.945, p = 0.332). Sample sizes differ between sites and treatments due to missing data. Plant
sizes were sufficiently uniform at the onset that any differences by wk 10 could not be attributed
to the starting sizes of transplants.
Plants at higher elevations were significantly smaller than those within the predicted
elevation range of our model, both at CAHA and CALO. Mean diameters of Amaranthus
pumilus transplants at wk 10 (natural log transformed) were significantly different between plots
at HIGH and IN elevations at Cape Hatteras National Seashore (F(1, 272) = 490.240, p < 0.001,
Table 14) and among plots at HIGH and IN elevations at Cape Lookout National Seashore (F(1,
147) = 159.016, p < 0.001, Table 15) after factoring out initial plant diameter. There were too few
plants that survived to wk 10 in the NEAR vs. FAR plots at CALO to allow statistical
comparisons (Table 16).
Herbivory 2003
There was a significant difference in the frequency of herbivory on Amaranthus pumilus
transplants at wk 10 between Cape Hatteras (CAHA) (n = 297) and Cape Lookout (CALO) (n =
178) National Seashores (X2 = 13.94, df = 1, p < 0.001, Table 17). Plants at CALO were more
likely to have evidence of herbivory than those at CAHA (87.8 vs. 72.4%, respectively). There
was no significant difference in the distribution of herbivore intensity (low, moderate, or high)
on A. pumilus transplants at wk 10 between seashores, however (X2 = 2.83, df = 2, p > 0.200,
Table 18).
Transplants were more likely to experience noticeable damage by herbivores in the HIGH
plots (91%) than in the IN plots (51%) at CAHA (X2 = 60.542, df = 1, p < 0.001, Table 19).
There was a significant difference in the degree of herbivory (low, moderate, or high) of
0057142

Final Report 2004: Restore Seabeach Amaranth
Jolls, Sellars, Johnson and Wigent
2001 Natural Resource Preservation Program
RMP Project Statement Number: CAHA-N-018.000, CALO-N-006.001, ASIS-N-016.005
30
Amaranthus pumilus transplants at wk 10 between HIGH and IN research plots at CAHA (X2 =
39.55, df = 2, p < 0.001, Table 20). Plants within our predicted elevation range were less likely
to have been grazed, and if so, were more likely to have suffered only low herbivory per plant
than were those at higher elevations (92.9 vs. 49%, respectively).
At CALO, Amaranthus pumilus transplants also were more likely to experience
noticeable damage by herbivores in HIGH (98.7%) plots than in IN (71.4%) research plots (X2 =
21.65, df = 1, p < 0.001, Table 21). There also was a significant difference in the degree of
herbivory (low, moderate, or high) that transplants experienced in HIGH and IN research plots at
CALO (p < 0.0005, Fisher‟s Exact Test, Table 22). Again, plants within the elevation range
predicted by our model were less likely to suffer higher levels of herbivory than those above 2.0
m above MHW.
Low survival to wk 10 precluded analyses on herbivory of Amaranthus pumilus
transplants FAR and NEAR from shore at the CALO (Table 10). However, the Chi-Square
analyses were conducted on wk 2 census data for these FAR and NEAR research plots (Tables
23-24) and at this same census date within the study for all other plots at CALO (Tables 25-26)
and CAHA (Tables 27-28).
Herbivory was comparable, independent of distance from shoreline at CALO for young
plants. There was no significant difference in the number of Amaranthus pumilus transplants
exhibiting and not exhibiting noticeable herbivory at wk 2 between FAR and NEAR plots (X2 =
1.52, df = 1, p > 0.05, Table 23). Neither was there any significant difference in the degree of
herbivory (low, moderate, or high) (p > 0.57, Fisher‟s Exact Test, Table 24).
Similarly, early season herbivory did not differ between HIGH and IN plots at CALO nor
CAHA. There was no significant difference in whether transplants exhibited herbivory at wk 2
0057143

Final Report 2004: Restore Seabeach Amaranth
Jolls, Sellars, Johnson and Wigent
2001 Natural Resource Preservation Program
RMP Project Statement Number: CAHA-N-018.000, CALO-N-006.001, ASIS-N-016.005
31
nor in the distribution of intensity of herbivory (low vs. moderate) between HIGH and IN plots at
CALO (X2 = 0.51, df = 1, p > 0.25, Table 25, and p = 1.00, Fisher‟s Exact Test, Table 26,
respectively).
This limited effect of elevation treatment was observed to some extent at CAHA.
Frequency of herbivory at wk 2 did not differ between HIGH and IN research plots (X2 = 1.52,
df = 1, p > 0.200, Table 27). However, the degree of herbivory (low vs. moderate), was
significantly less for IN plants (X2 = 17.77, df = 1, p < 0.0005, Table 28). Transplants within our
predicted elevation range were more likely to experience low herbivory per plant than were those
at higher elevations (77/80 (96.2%) vs. 65/90 (72.2%), respectively).
Webworms (caterpillars from a variety of moth species), nutria (Myocastor coypus),
ghost crabs (Ocypode quadrata), and grasshoppers appeared to be the main taxa that caused
damage to Amaranthus pumilus transplants. Several plants were noticeably nipped off directly
above ground level; yet, new growth from these stems often was observed during a later census.
On many occasions, small spiders (species unknown) were seen on transplants covered with
webbing; it is not known what, if any, effect this may have on plant performance.
CONCLUSIONS, APPLICATION AND SIGNIFICANCE
GIS models of habitat, coupled with on the ground field testing and a sound knowledge
of species biology, are promising tools for rare species management and conservation. Our work
can provide the methodologies for analysis of seabeach amaranth habitat through its geographic
range and possibly linkages in time among these spatially disjunct populations, e.g., among
national seashores and other public lands. These methods can potentially be applied to other
taxa, given the predicted habitat for seabeach amaranth is utilized by other species of concern,
0057144

Final Report 2004: Restore Seabeach Amaranth
Jolls, Sellars, Johnson and Wigent
2001 Natural Resource Preservation Program
RMP Project Statement Number: CAHA-N-018.000, CALO-N-006.001, ASIS-N-016.005
32
notably animals (Fig. 30). We suggest that SBA can serve as an umbrella species, indicating
suitable habitat for other protected taxa of these dynamic coastal systems.
Our models of Amaranthus pumilus habitat based on natural occurrences of seabeach
amaranth plants relative to LIDAR data were extended to include elevation and passive LIDAR
data to indicate vegetation cover. These and some pilot analyses confirm that elevation,
vegetation cover and possibly distance from shore play a role in the germination, establishment
and maintenance of natural plants, including their survival during periods of overwash, as well as
maintenance of a seed source on site and ex situ for population viability. Although these models
performed well at two North Carolina national seashores, the application of these models to other
beaches remains to be tested. Our ability to use LIDAR for plant habitat assessment and
response can be limited by data availability, cost, processing and temporal lags in availability.
Nevertheless, remotely sensed data, specifically LIDAR, hold promise for the preservation and
restoration of Amaranthus pumilus as well as other species of concern. Preliminary analyses
suggest we can predict nearly 90% of the natural plant occurrences based on these variables
derived from remotely sensed data. Our work corroborates that seabeach amaranth thrives in a
narrow elevation range (Bücher and Weakley 1990), spatially and temporally, created and
removed by the dynamism of natural shoreline processes.
Numbers of naturally-occurring Amaranthus pumilus are variable in their trends between
parks. The numbers of plants at Cape Hatteras National Seashore have decreased since 2001
(133 to 54 in 2003) and are orders of magnitude below numbers prior to 1990. In contrast, plant
population sizes have increased in the same few years at Cape Lookout National Seashore (1560
in 2003 from 168 in 2001). Such abundances of seabeach amaranth have not been observed at
CALO since 1994, however, do not match historic highs in 1993. It is unknown whether these
0057145

Final Report 2004: Restore Seabeach Amaranth
Jolls, Sellars, Johnson and Wigent
2001 Natural Resource Preservation Program
RMP Project Statement Number: CAHA-N-018.000, CALO-N-006.001, ASIS-N-016.005
33
populations are viable long-term or how they might contribute to the recovery objectives for A.
pumilus (self-sustaining populations for 10 yr in six of the nine historic States, USFWS 1996),
particularly in the face of environmental unpredictability in these habitats (Ludwig 1999,
Matthies et al. 2004).
Plant abundances may be related, in part, to habitat availability. We have modeled
habitat using LIDAR and GIS, and demonstrated that suitable areas for seabeach amaranth vary
between parks and years. Preliminary analyses suggest greater amounts of habitat at CALO than
CAHA, possibly related to natural geomorphology (more inlets and south-to-southwest-facing
beaches) and anthropogenic factors (artificial dune construction and maintenance, vehicle
access); however, these patterns are suspect and the inferences speculative at this point. It is
unknown how available habitat relates to population sizes of Amaranthus pumilus. We used GIS
to ask how much landscape matches our predicted model of LIDAR elevation and passive data,
however, assessment of total habitat availability based on our model is limited. Significant
variation in reflectance values between parks, years and flights among days is related to
differences in passive values due to cloud cover, soil moisture and insolation differences. Even
without these data inconsistencies, the trend from our estimates of habitat availability at the two
NC parks among years does not support the trend in plant numbers. Specifically, although our
estimates suggest habitat availability increased at CAHA between 1997 and 1999, plant numbers
decreased from 81 to 56. In contrast, comparisons of LIDAR between 1997 and 1998 at CALO
supports a decrease in suitable plant habitat, yet numbers of naturally-occurring seabeach
amaranth increased, from 53 to 494. The caveat we offer, however, is these “trends” are based
on only two samples, i.e., two seashores and two years. Our collaboration with other agency
offices, including the USGS Center for Coastal and Regional Marine Studies, St. Petersburg, FL,
0057146

Final Report 2004: Restore Seabeach Amaranth
Jolls, Sellars, Johnson and Wigent
2001 Natural Resource Preservation Program
RMP Project Statement Number: CAHA-N-018.000, CALO-N-006.001, ASIS-N-016.005
34
attempted to access more extensive and more current LIDAR. At this time, differences in
processing methods make it difficult to use these more recent data. Clearly, LIDAR is not yet
sufficiently available, frequent nor standardized to allow comparisons through time among
coasts, yet, new sensors offer promising alternatives, e.g., NASA Experimental Airborne
Advanced Research Lidar (EAARL). LIDAR used in this study was NASA Airborne
Topographic Mapper (ATM) LIDAR which measures only the range to the leading edge of the
first laser reflection. In contrast, EAARL utilizes a hyperspectral scanner with LIDAR that can
record the full reflected laser pulse. EAARL is capable of documenting the vertical complexity
of the surface target "on the fly" during a given survey. This greatly reduces the volume of data
collected over bare terrain, yet enabling the collection of data over forests and shallow water.
EAARL is being used to survey sandy beaches, coastal vegetation and nearshore benthic
habitats, with possible applications including coral community mapping, studies of changes
along sandy coasts, the three-dimensional assessment of plant communities, and shallow
bathymetric sounding (USGS Sound Waves, April 2001, http://soundwaves.usgs.gov/2001/04/).
More to the point, this contrast between trends in habitat availability and plant
abundances confirm again that population dynamics of this rare species involve more factors
than simply availability of unvegetated beach within a limited elevation range. In addition to the
effect on habitat creation and maintenance, stochastic events, which are by definition highly
variable among beaches and parks, also affect dispersal, establishment, survival and seed set of
seabeach amaranth. Survival to 10 wk of our transplants ranged from 33-100% at CAHA and 0-
100% at CALO among sites within a park. Our selection of east-facing beaches and lower
elevations on west-facing sites (CALO) decreased the chances of seabeach amaranth transplant
survival, despite greater distances from shoreline for plots at these sites. Higher erosion rates on
0057147
Final Report 2004: Restore Seabeach Amaranth
Jolls, Sellars, Johnson and Wigent
2001 Natural Resource Preservation Program
RMP Project Statement Number: CAHA-N-018.000, CALO-N-006.001, ASIS-N-016.005
35
north and east-facing coasts are presumed to be associated with lack of establishment of
naturally-occurring plants as well (Weakley and Bücher 1992). Survival of seabeach amaranth
plants is extremely low, even under natural conditions. Some of the highest levels of mortality
followed prolonged salt water inundation (three tides cycles, Hancock 1995), as we observed at
our CALO Spit sites, and blowing (Hamilton 2000 a,b). Success of greenhouse-reared plants
transplanted to the field can be even lower. Flooding resulted in almost 100 percent mortality of
propagated plants at three of six experimental transplant sites in South Carolina in 1999. At a
fourth site, drifting sand covered most of the transplants, with only 10 of 196 plants
(approximately 5%) plants surviving to produce seed (Hamilton 2000 a,b). In mid-July 2003,
not even 5 wk into our study, of the three seaward plots at North Beach at CAHA, most of one
plot or nearly one-third of the 81 transplants had already perished.
Nevertheless, success of our transplants in Year 2 (2002) and in the final field season
(2003) demonstrated the usefulness of remote sensing data, particularly LIDAR, for evaluation
of seabeach amaranth habitat. Success of our transplants affirmed and reconfirmed the 0.77 –
2.00 m above Mean High Water range for survival and growth of seabeach amaranth. Plants
within and below the elevation range we have delineated grow larger, on average, than do plants
above 2.0 m above MHW, possibly due to greater availability of water and/or nutrients. Yet,
although larger plants can produce more seed (Wigent et al. 2002, Jolls et al. 2002), their
probability of survival can be extremely low due to the higher risk of overwash events. Distance
to shoreline and most importantly, site variability, are two other major factors affecting the
distribution and abundance of seabeach amaranth, both for naturally-occurring plants and
transplants.
0057148

Final Report 2004: Restore Seabeach Amaranth
Jolls, Sellars, Johnson and Wigent
2001 Natural Resource Preservation Program
RMP Project Statement Number: CAHA-N-018.000, CALO-N-006.001, ASIS-N-016.005
36
Plants at lower elevations may grow larger, however, their risk of mortality due to
overwash is increased. This risk is decreased on wider beaches with a greater distance to
shoreline. Regrettably, low survival of our transplants in the NEAR vs. FAR design, produced
by site variability among beaches, limit our ability to make inferences about the role of distance
from shoreline on plant size or risk of herbivory.
Transplants above our predicted upper limit of 2.0 m above MHW have the potential to
result in inferior populations of smaller plants and fewer seeds. Success of plants above the
upper reaches of our predicted range may also be limited by water availability and biotic factors
such as competition and herbivory. We observed that plants beyond the upper reaches of model
predictions can be just if not more likely to survive to seed set than were transplants with our
predicted elevation range, depending on beach location. Survival and seed set of individual
plants, however, does not necessarily predict success overall at the population-level. In 2003,
survival of plants to wk 10 was equal between HIGH and IN plots for both parks, however,
above the predicted elevations, plants on average were smaller (5.3 vs. 26.6 cm at CAHA and 6.7
vs. 17.1 cm diameter at CALO). These “higher” transplants were slightly more likely to set seed
in 2003 (92.8% vs. 85.2 only at CAHA) as well as in 2002, however, total seed production by
these smaller plants would be reduced. Plants up the beach also were more likely to suffer more
intense herbivory, which also might reduce survival and seed output. These seabeach amaranth
nearer the dunes may also be limited by water availability (C. A. Wigent, in prep.) and other
biotic factors such competition (S. E. Johnson, in prep.).
Habitat, and those dynamic natural forces that create and maintain it, must be preserved
for Amaranthus pumilus conservation and management. The challenge is predicting habitat
based on unpredictable forces. Long-term studies can generate a defensible trend, however, even
0057149

Final Report 2004: Restore Seabeach Amaranth
Jolls, Sellars, Johnson and Wigent
2001 Natural Resource Preservation Program
RMP Project Statement Number: CAHA-N-018.000, CALO-N-006.001, ASIS-N-016.005
37
the largest data sets can fall short predicting short-term stochastic events. Predicting seabeach
amaranth habitat and plant success poses similar challenges to those confronted by the North
Carolina Division of Coastal Management in their presentation of long-term shoreline erosion
rates. In their words, “These maps are for general information only. They illustrate average rates
of shoreline change over approximately 50 years. The information presented here is not
predictive, nor does it reflect the short-term erosion that occurs during storms.” Despite our
inability to predict it, this stochasticity is a critical part of the physical habitat and species
biology of Amaranthus pumilus.
In addition to habitat, however, a seed source must be available to colonize this habitat
whenever it comes available. As a result, the protection of extant plants, both locally and
throughout the species geographic range, is paramount. The role of the seed bank, whether local
or distant, is critical, although its location may be unknown. There is anecdotal evidence of
plants appearing on dredge spoil, nourished beaches and on sites where the plant was presumed
extirpated for decades. For example, in New York after four decades of absence, the plant now
numbers in the 100‟s of thousands. In New Jersey, after being last seen in 1913, several hundred
to several thousand plants were recorded in 2000-2004; some have speculated that Hurricane
Hugo in 1989 may have transported seeds from larger populations further south, such as North
Carolina. These observations suggest that on and offshore sediments also play majors roles in
seabeach amaranth population establishment and persistence. They further suggest that
conservation of habitat and seed sources need to extend throughout the geographic range of this
plant. The conservation challenge then becomes maintaining habitat and plants where they now
occur, potential habitat were plants might eventually be, as well as unknown sites where seeds
might be.
0057150

Final Report 2004: Restore Seabeach Amaranth
Jolls, Sellars, Johnson and Wigent
2001 Natural Resource Preservation Program
RMP Project Statement Number: CAHA-N-018.000, CALO-N-006.001, ASIS-N-016.005
38
Our transplant work confirmed our GIS model; seabeach amaranth is dispersed to and
thrives in a narrow elevation range, spatially and temporally, created and removed by the
dynamism of natural shoreline processes. The application and extension of this model needs to
be tested at other sites. A third and most recent Amaranthus pumilus reintroduction occurred in
2003 at a NC Coastal Reserve on Bird Island, Brunswick County, North Carolina, directed by
Dale Suiter of the USFWS, and Kristen Rosenfeld and Dr. Tom Wentworth of North Carolina
State University. The transplant area is entirely within our predicted elevation range, despite its
unique feature of being south-facing. Their work can be used to further test aspects of our
model, although the relationship between mean high water, elevation, distance from shoreline,
and thus risk of overwash, will change further south along the Atlantic Coast.
Our methods, and those of others (Brenner 1999), provide ease of cultivation and
transplant which can provide options for Amaranthus pumilus reintroduction and recovery. The
town of Oak Island has raised 5,000 amaranth plants since 2001, with efforts by USFWS and
David Nash, an NCSU cooperative extension coastal management agent for Brunswick and New
Hanover counties (The Raleigh News and Observer, July 28, 2003). The tractability of this
species in culture, however, cannot replace sound science-based ecosystem management and
habitat conservation. More information on genetic variation and relationships among
populations is needed to understand the population- and genetic-level consequences of
reintroductions, although the predictive certainty needed for certain management applications
may not always be available (Mistretta 1994). Tens of thousands of plants can be propagated,
even from a single genotype, at the rate of several generations per year in the simplest of
controlled environments. Even if we can cultivate and re-introduced rare species, re-
0057151

Final Report 2004: Restore Seabeach Amaranth
Jolls, Sellars, Johnson and Wigent
2001 Natural Resource Preservation Program
RMP Project Statement Number: CAHA-N-018.000, CALO-N-006.001, ASIS-N-016.005
39
establishment requires restoration of critical ecological and evolutionary processes that provide
and maintain habitat (Montalvo et al. 1997).
Remotely sensed data can allow partial transcendence of some of our limitations of space
and time in the evaluation of a species and its habitat throughout their geographic range.
Inferences from these approaches, however, are only as valid as the data used to make the
inferences and the confirmation of models by field work. GIS analyses can offer synthesis of
many different environmental variables into a more complete evaluation of limits on species
distribution and abundance throughout their ranges in their ecosystems. Ecosystem approaches
to conservation and management of species of concern are advocated by both the scientific
community (Grumbine 1994, 1997, Christensen et al. 1996) and agencies responsible for
endangered species management (Brown and Marshall 1996, Thomas 1996, Clark 1999).
Seabeach amaranth might serve as a conservation “umbrella” for coastal biodiversity of Cape
Hatteras, Cape Lookout and Assateague Island National Seashores. Identification of critical
amaranth habitat using GIS analysis of LIDAR and construction of maps of accreting and
eroding shorelines can be applied to other sympatric species of concern similarly dependent on
natural shoreline dynamics, including colonial nesting shorebirds like the Least Tern (Sterna
antillarum), the Piping Plover (Charadius melodus) and sea turtles.
0057152

Final Report 2004: Restore Seabeach Amaranth
Jolls, Sellars, Johnson and Wigent
2001 Natural Resource Preservation Program
RMP Project Statement Number: CAHA-N-018.000, CALO-N-006.001, ASIS-N-016.005
40
ORIGINAL PROPOSED SCHEDULE
REVISED PER CONTRACTUAL AGREEMENT
( denotes completed task)
Fiscal Year 1 (10/1/2000-9/30/2001)
October 2000 collect seed for Task 2; Transplant Experiment I
(2000 LIDAR collection; fly-overs by
NOAA/NASA/USGS ATM Beach Mapping Project)
October-December 2000 GIS analysis of 1996-1999 beach change (Task 1);
December 2000 stratify seeds of cohort 2000 for Transplant Experiment I
January-April 2001 ongoing GIS analysis
March 2001 begin rearing plants in greenhouse/growth chamber
April 2001 transplant reared plants to field (Task 2-I)
June-September 2001 monitor success of transplants
obtain and process 2000 LIDAR (Task 1)
Draft Interim Report
Fiscal Year 2 (10/1/2001-9/30/2002)
October-November 2001 collect seed from natural and transplant individuals
collect seed for Task 2; Transplant Experiment II
GIS analysis of 1999-2000 beach change (Task 1)
processing and analysis of ASIS LIDAR data; GIS
analysis of ASIS Amaranthus pumilus
analysis of Transplant Population I
December 2001 stratify seeds of cohort 2001 for Transplant Experiment I
0057153

Final Report 2004: Restore Seabeach Amaranth
Jolls, Sellars, Johnson and Wigent
2001 Natural Resource Preservation Program
RMP Project Statement Number: CAHA-N-018.000, CALO-N-006.001, ASIS-N-016.005
41
30 December 2001 submission of Annual Report 1
January –April 2002 ongoing GIS analysis
March 2002 IAR to NPS Intranet
begin rearing plants in greenhouse/growth chamber II
April 2002 transplant reared plants to field (Task 2-II);
completion of LIDAR/GIS analysis
June-September 2002 monitor success of transplants II
October-November 2002 collect seed from natural and transplant individuals
30 December 2002 submission of Annual Report 2
Fiscal Year 3 (10/1/2002-9/30/2003)
October 2002 collect seed for Task 2; Transplant Experiment III
October-December analysis of Transplant Population II
December 2002 stratify seed of cohort 2002 for Transplant Experiment III
March 2003 IAR to NPS Intranet
begin rearing plants in greenhouse/growth chamber for
Transplant Experiment III (Task 2-III)
April-June 2003 transplant reared plants to field in June-August 2003
monitoring of Amaranthus pumilus populations
September 2003 submission of Draft Final Interim Report
0057154

Final Report 2004: Restore Seabeach Amaranth
Jolls, Sellars, Johnson and Wigent
2001 Natural Resource Preservation Program
RMP Project Statement Number: CAHA-N-018.000, CALO-N-006.001, ASIS-N-016.005
42
Calendar Year 2004
1 March 2004 IAR to NPS Intranet
15 July 2004 Annual Report Draft Final Report to NPS, including CD-
ROM of CAHA/CHLS/ASIS beach shoreline,
accretion/erosional hotspots, seabeach amaranth
occurrences
13 August 2004 presentation to CAHA and CALO staff
25 September 2004 submission of Final Report
0057155

Final Report 2004: Restore Seabeach Amaranth
Jolls, Sellars, Johnson and Wigent
2001 Natural Resource Preservation Program
RMP Project Statement Number: CAHA-N-018.000, CALO-N-006.001, ASIS-N-016.005
43
LITERATURE CITED
Baldwin, K. A. and M. A. Maun. 1983. Microenvironment of Lake Huron sand dunes. Canadian
Journal of Botany 61: 241-255.
Baskin, J.M. and C. C. Baskin. 1998. Seed dormancy and germination in the rare plant species
Amaranthus pumilus. Castanea 63: 493-494.
Bazzaz, F. A. 1979. The physiological ecology of plant succession. Annual review of Ecology
and Systematics 10: 351-371.
Billington, H. L., A. M. Mortimer and T. McNeilly. 1990. Survival and reproduction in adjacent
grass populations: Effects of clone, time and environment. Journal of Ecology 78: 1-14.
Brenner, D.M. 1999. Seabeach amaranth germplasm. Chinquapin. 7:14
Brown, D. G., and A. F. Arbogast. 1999. Digital photogrammetric change analysis as applied to
active coastal dunes in Michigan. Photogrammetric Engineering & Remote Sensing 65:
467-474.
Brown, R. S. and K. Marshall. 1996. Ecosystem management in state governments. Ecological
Applications 6: 721-723.
Bücher, M. A. and A. S. Weakley. 1990. Status survey of Seabeach Amaranth (Amaranthus
pumilus) in North Carolina and South Carolina. Unpublished recovery plan.
Chapin III, F. S., B. H. Walker, R. J. Hobbs, D. U. Hooper, J. H. Lawton, O. E. Salsa and D.
Tilman. 1997. Biotic control over the functioning of ecosystems. Science 277: 500- 504.
Christensen, N. L., A. M. Bartuska, J. H. Brown, S. Carpenter, C. D'Antonio, R. Francis, J. F.
Franklin, J. A. MacMahon, R. F. Noss, D. J. Parsons, C. H. Peterson, M. G. Turner, R. G.
0057156

Final Report 2004: Restore Seabeach Amaranth
Jolls, Sellars, Johnson and Wigent
2001 Natural Resource Preservation Program
RMP Project Statement Number: CAHA-N-018.000, CALO-N-006.001, ASIS-N-016.005
44
Woodmansee. 1996. The report of the Ecological Society of America committee on the
scientific basis for ecosystem management. Ecological Applications 6: 665-691.
Clark, J. R. 1996. The ecosystem approach from a practical point of view. Conservation Biology
13: 679-681.
de Jong, T. M. 1979. Water and salinity relations of California beach species. Journal of Ecology
67: 647-663.
Gerry, A. K. and S. D. Wilson. 1995. The influence of initial size on the competitive response of
six plant species. Ecology 76: 272-279.
Grumbine, R. E. 1994. What is ecosystem management? Conservation Biology 8:1-12.
Grumbine, R. E. 1997. Reflections on “what is ecosystem management?” Conservation Biology
11:41-47.
Hamilton, R.D. 2000a. Techniques for the propagation of Amaranthus pumilus. Unpublished
report. Waddell Mariculture Center. Bluffton, South Carolina. 4 pp.
Hamilton, R.D. 2000b. DNR Restoration Program for Amaranthus pumilus. Unpublished report.
Waddell Mariculture Center. Bluffton, South Carolina. 3 pp.
Hancock, T. E. 1995. Ecology of the threatened species seabeach amaranth (Amaranthus pumilus
Rafinesque). M.S. Thesis, University of North Carolina at Wilmington. Wilmington,
North Carolina.
Hancock, T. E. and P. E. Hosier. 2003. Ecology of the threatened species Amaranthus pumilus
Rafinesque. Castanea 68: 236-244.
Jolls, C. L., K. E. Trueblood, J. D. Sellars and C. A. Wigent. 2002. Elevation, plant size and seed
set: aspects of the recovery of seabeach amaranth (Amaranthus pumilus) in North
Carolina. Southeastern Biology 49: 188.
0057157

Final Report 2004: Restore Seabeach Amaranth
Jolls, Sellars, Johnson and Wigent
2001 Natural Resource Preservation Program
RMP Project Statement Number: CAHA-N-018.000, CALO-N-006.001, ASIS-N-016.005
45
Jolls, C. L., A. Cooley, and J. D. Sellars. 2001. Germination ecology of seabeach amaranth,
Amaranthus pumilus, in controlled environments. Southeastern Biology 48: 169.
Lambert, J. D. and M. H. Carr. 1998. The Paseo Pantera project: A case study using GIS to
improve continental-scale conservation planning. In B. G. Savitsky and T. E. Lacher Jr.,
eds. GIS methodologies for developing conservation strategies: Tropical forest recovery
and wildlife management in Costa Rica. Columbia Press, New York.
Lea, C. and S. H. King. 2002. Restoring an Atlantic barrier island endemic. Endangered Species
Bulletin 27: 20-21.
Lopez, W. S. 1998. Application of the HEP methodology and use of GIS to identify priority sites
for the management of white-tailed deer. In B. G. Savitsky and T. E. Lacher Jr. eds. GIS
methodologies for developing conservation strategies: Tropical forest recovery and
wildlife management in Costa Rica. Columbia Press, New York.
Ludwig, D. 1999. Is it meaningful to estimate a probability of extinction? Ecology 80: 298-310.
Matthies, D., I. Brauer, W. Maibom and T. Tscharntke. 2004. Population size and the risk of
local extinction: empirical evidence from rare plants. OIKOS 105: 481-488.
Meredith, A., D. Eslinger and D. Aurin. 1999. An evaluation of hurricane-induced erosion along
the North Carolina coast using airborne LIDAR surveys. CSC Technical Report:
NOAA/CSC/99031-PUB. 30 pp.
Mistretta, O. 1994. Genetics of species reintroduction: applications of genetic analysis.
Biodiversity and Conservation 3: 184-190.
Montalvo, A.M., S. L. Williams, K. J. Rice, S. L. Buchmann, C. Cory, S. N. Handel, G. P.
Nabhan, R. Primack and R. H. Robichaux. 1997. Restoration biology: A population
biology perspective. Restoration Ecology 5: 277-290.
0057158

Final Report 2004: Restore Seabeach Amaranth
Jolls, Sellars, Johnson and Wigent
2001 Natural Resource Preservation Program
RMP Project Statement Number: CAHA-N-018.000, CALO-N-006.001, ASIS-N-016.005
46
Payne, A. M. and M. A. Maun. 1984. Reproduction and survivorship of Cakile edentula var.
lacustris along the Lake Huron shoreline. The American Midland Naturalist 111: 86-95.
Savitsky, B. G. 1998. GIS. Pages 41-47 in B. G. Savitsky and T. E. Lacher Jr., editors. GIS
methodologies for developing conservation strategies: tropical forest recovery and
wildlife management in Costa Rica. Columbia Press, New York, New York, USA.
Scepan, F. D. and L. L. Blum. 1987. A geographic information system for managing California
condor habitat. Second Annual International Conference, Exhibits and Workshops on
Geographic Information Systems. American Society for Photogrammetry and Remote
Sensing American Congress on Surveying and Mapping, Falls Church, VA.
Schemske, D. M., B. C. Husband, M. H. Ruckleshaus, C. Goodwillie, I. M. Parker and J. G.
Bishop. 1994. Evaluation approaches to the conservation of rare and endangered plants.
Ecology 75: 584-606.
Sellars, J. D. 2001. Habitat assessment and restoration methodologies for seabeach amaranth
(Amaranthus pumilus, Amaranthaceae). M.S. Thesis, East Carolina University,
Greenville, NC. 94 pp.
Sellars, J. D., and C. L. Jolls. 2000. Methodologies for detecting changes in coastal dune habitat
using Light Detection and Ranging (LIDAR) data. Association of Southeastern Biologists
Bulletin 47: 209. abstr.
Sellars, J. D., and C. L. Jolls. 2001a. Habitat assessment using aerial photography and LIDAR
for a rare plant of the Atlantic coastal dune ecosystem. Coastal GeoTools „01, NOAA
Coastal Services Center, Charleston, SC. abstr.
0057159

Final Report 2004: Restore Seabeach Amaranth
Jolls, Sellars, Johnson and Wigent
2001 Natural Resource Preservation Program
RMP Project Statement Number: CAHA-N-018.000, CALO-N-006.001, ASIS-N-016.005
47
Sellars, J. D., and C. L. Jolls. 2001b. Critical knowledge for the restoration of seabeach
amaranth, Amaranthus pumilus. Southeastern Biology 48: 149. abstr.
Sellars, J. D. and C. L. Jolls. 2002. Remote sensing, GIS and statistical analyses of the habitat
variables controlling seabeach amaranth, Amaranthus pumilus. Southeastern Biology 49:
166. abstr.
Sellars, J. D., C. L. Jolls and C. A. Wigent, 2003. Success of seabeach amaranth (Amaranthus
pumilus Raf.) using habitat selection based on light detection and ranging (LIDAR) data.
Southeastern Biology 50: 168-169. abstr.
Sinton, D. S., J. A. Jones, J. L. Ohmann, and F. J. Swanson. 2000. Windthrow disturbance, forest
composition, and structure in the Bull Run Basin, Oregon. Ecology 81: 2539-2556.
Stockdon, H. F., Sallenger, Jr., A. H., List, J. H., and Holman, R. A., 2002. Estimation of
shoreline position and change using airborne topographic lidar data. Journal of Coastal
Research 18: 502-513.
Thibault, D., S. Chalifoux and M. Laperle. 1998. Using satellite imagery as a planning tool for
Harlequin duck inventory. International Journal of Remote Sensing 19: 5-9.
Thompson, J. A., J. C. Bell, and C. A. Butler. 2001. Digital elevation model resolution: effects
on terrain attribute calculation and quantitative soil-landscape modeling. Geoderma 100:
67-89.
Thomas, J. F., R. W. Downs and C. H. Saravitz. 2003. Phytotron Procedural Manual for
Controlled Environment Research at the Southeastern Plant Environment Laboratory.
North Carolina Agricultural Research Service Technical Bulletin 244 (revised). 35 pp.
Thomas, J. W. 1996. Forest Service perspective on ecosystem management. Ecological
Applications 6: 703-705.
0057160

Final Report 2004: Restore Seabeach Amaranth
Jolls, Sellars, Johnson and Wigent
2001 Natural Resource Preservation Program
RMP Project Statement Number: CAHA-N-018.000, CALO-N-006.001, ASIS-N-016.005
48
U.S. Fish & Wildlife Service. 1992. Endangered and Threatened Wildlife and Plants. Proposed
threatened status for the plant Amaranthus pumilus (Seabeach Amaranth) Federal
Register. 57(101): 21921-21925.
U.S. Fish and Wildlife Service. 1993. Endangered and Threatened Wildlife and Plants.
Amaranthus pumilus determined to be threatened. Federal Register FR Doc. 93-8076,
Washington, D.C. http://ecos.fws.gov/tess/frdocs/1993/93-8076.html
U.S. Fish and Wildlife Service. 1996. Recovery Plan for Seabeach Amaranth (Amaranthus
pumilus) Rafinesque. Atlanta, Georgia. 59 pp.
Weakley, A. and M. Bücher. 1992. Status survey of seabeach amaranth (Amaranthus pumilus
Rafinesque) in North and South Carolina, second edition (after Hurricane Hugo). Report
to North Carolina Plant Conservation Program, North Carolina Dept. Agriculture,
Raleigh, and Endangered Species Field Office, U.S. Fish and Wildlife Service, Asheville,
North Carolina. 149 pp.
Vitousek, P. M., H. A. Mooney, J. Lubchenco and J. M. Melillo. 1997. Human domination of the
Earth‟s ecosystems. Science 277: 494-499.
Wigent, C. A., K. E. Trueblood, J. D. Sellars, and C. L. Jolls. 2002. Plant size, fecundity and
remote sensing: Implications for the recovery of seabeach amaranth (Amaranthus
pumilus) in North Carolina. Journal of the North Carolina Academy of Science. 118:
134-135. abstr.
0057161

Final Report 2004: Restore Seabeach Amaranth
Jolls, Sellars, Johnson and Wigent
2001 Natural Resource Preservation Program
RMP Project Statement Number: CAHA-N-018.000, CALO-N-006.001, ASIS-N-016.005
49
Figure 1. LIDAR elevation data are recorded by measuring the time required for a laser to reach
the beach surface. Courtesy NOAA Coastal Services Center
http://www.csc.noaa.gov/products/sccoasts/html/tutlid.htm
0057162

Final Report 2004: Restore Seabeach Amaranth
Jolls, Sellars, Johnson and Wigent
2001 Natural Resource Preservation Program
RMP Project Statement Number: CAHA-N-018.000, CALO-N-006.001, ASIS-N-016.005
50
Figure 2. Selection of transplant sites was facilitated using LIDAR data. Areas in green are
within the elevation range of 0.77 – 2.00 m above Mean High Water (MHW), are not
experiencing strong erosional trends and support low vegetation cover . Potential habitat for
year 2000 and plant occurrences from 2002 have been overlain on year 2000 passive-LIDAR
imagery for the east end of Shackleford. Areas of darker gray, landward of the MHW line, are
vegetated dune.
0057163

Final Report 2004: Restore Seabeach Amaranth
Jolls, Sellars, Johnson and Wigent
2001 Natural Resource Preservation Program
RMP Project Statement Number: CAHA-N-018.000, CALO-N-006.001, ASIS-N-016.005
51
Figure 3. Shoreline change analyses (elevation by year and elevation change) is partitioned as a
series of four “tiles” at Assateague Island National Seashore (ASIS).
0057164
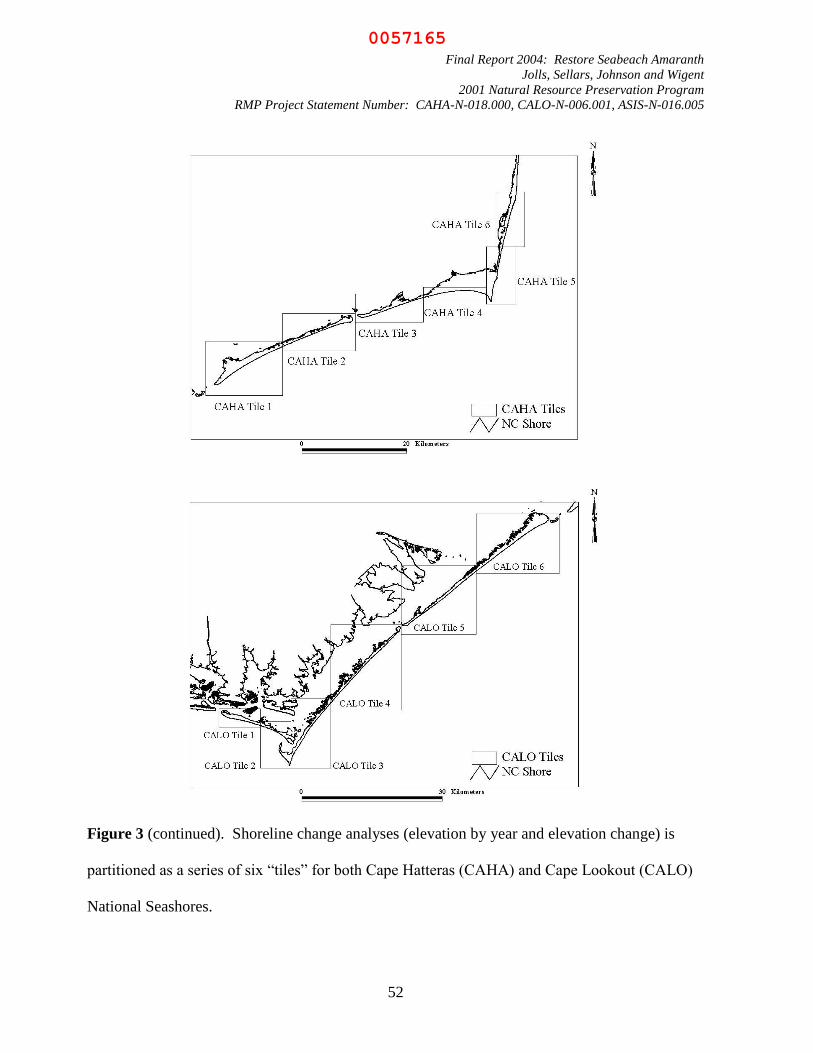
Final Report 2004: Restore Seabeach Amaranth
Jolls, Sellars, Johnson and Wigent
2001 Natural Resource Preservation Program
RMP Project Statement Number: CAHA-N-018.000, CALO-N-006.001, ASIS-N-016.005
52
Figure 3 (continued). Shoreline change analyses (elevation by year and elevation change) is
partitioned as a series of six “tiles” for both Cape Hatteras (CAHA) and Cape Lookout (CALO)
National Seashores.
0057165

Final Report 2004: Restore Seabeach Amaranth
Jolls, Sellars, Johnson and Wigent
2001 Natural Resource Preservation Program
RMP Project Statement Number: CAHA-N-018.000, CALO-N-006.001, ASIS-N-016.005
53
Figure 4. Natural plant occurrences for the years 2001-2003 on the Tile 1 section of Assateague
Island National Seashore overlain on the LIDAR Passive Reflectance image from 2000. Areas
in green are within the elevation range of 0.77 – 2.00 m above Mean High Water (MHW), are
not experiencing strong erosional trends and support low vegetation cover. Areas of darker gray,
landward of the MHW line, are vegetated dune.
0057166

Final Report 2004: Restore Seabeach Amaranth
Jolls, Sellars, Johnson and Wigent
2001 Natural Resource Preservation Program
RMP Project Statement Number: CAHA-N-018.000, CALO-N-006.001, ASIS-N-016.005
54
Figure 5. Natural plant occurrences for the years 2001-2003 on the Tile 2 section of Assateague
Island National Seashore overlain on the LIDAR Passive Reflectance image from 2000. Areas
in green are within the elevation range of 0.77 – 2.00 m above Mean High Water (MHW), are
not experiencing strong erosional trends and support low vegetation cover. Areas of darker gray,
landward of the MHW line, are vegetated dune.
0057167
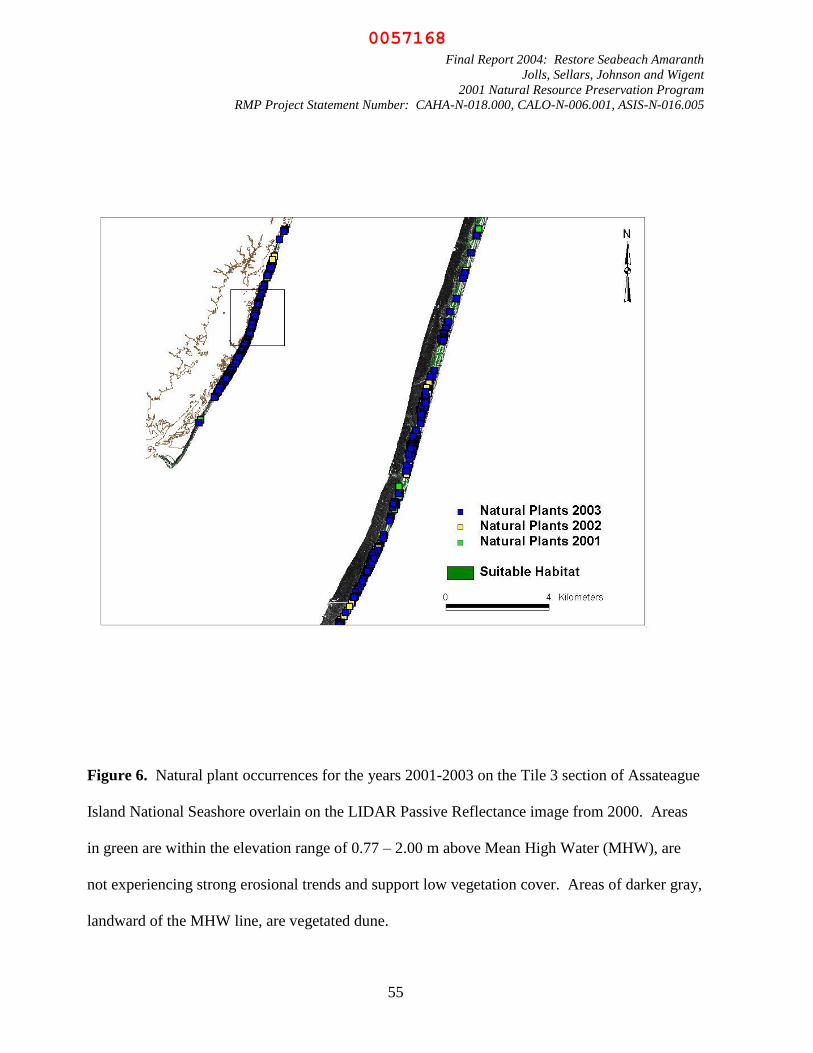
Final Report 2004: Restore Seabeach Amaranth
Jolls, Sellars, Johnson and Wigent
2001 Natural Resource Preservation Program
RMP Project Statement Number: CAHA-N-018.000, CALO-N-006.001, ASIS-N-016.005
55
Figure 6. Natural plant occurrences for the years 2001-2003 on the Tile 3 section of Assateague
Island National Seashore overlain on the LIDAR Passive Reflectance image from 2000. Areas
in green are within the elevation range of 0.77 – 2.00 m above Mean High Water (MHW), are
not experiencing strong erosional trends and support low vegetation cover. Areas of darker gray,
landward of the MHW line, are vegetated dune.
0057168

Final Report 2004: Restore Seabeach Amaranth
Jolls, Sellars, Johnson and Wigent
2001 Natural Resource Preservation Program
RMP Project Statement Number: CAHA-N-018.000, CALO-N-006.001, ASIS-N-016.005
56
Figure 7. Natural plant occurrences for the years 2001-2003 on the Tile 4 section of Assateague
Island National Seashore overlain on the LIDAR Passive Reflectance image from 2000. Areas
in green are within the elevation range of 0.77 – 2.00 m above Mean High Water (MHW), and
have a reflectance value above 170 on a scale from 0 to 255. Suitable habitat areas are not
experiencing strong erosional trends and support low vegetation cover. Areas of darker gray,
landward of the MHW line, are vegetated dune and marsh.
0057169

Final Report 2004: Restore Seabeach Amaranth
Jolls, Sellars, Johnson and Wigent
2001 Natural Resource Preservation Program
RMP Project Statement Number: CAHA-N-018.000, CALO-N-006.001, ASIS-N-016.005
57
Figure 8. Natural plant occurrences at Hatteras Point (CAHA) for the years 2000 through 2003
overlain on the LIDAR Passive Reflectance image from 1999. Source: ECU and NPS GPS
survey data. Areas in green are within the elevation range of 0.77 – 2.00 m above Mean High
Water (MHW), and have a reflectance value above 170 on a scale from 0 to 255. Suitable
habitat areas are not experiencing strong erosional trends and support low vegetation cover.
Areas of darker gray, landward of the MHW line, are vegetated dune and marsh.
0057170
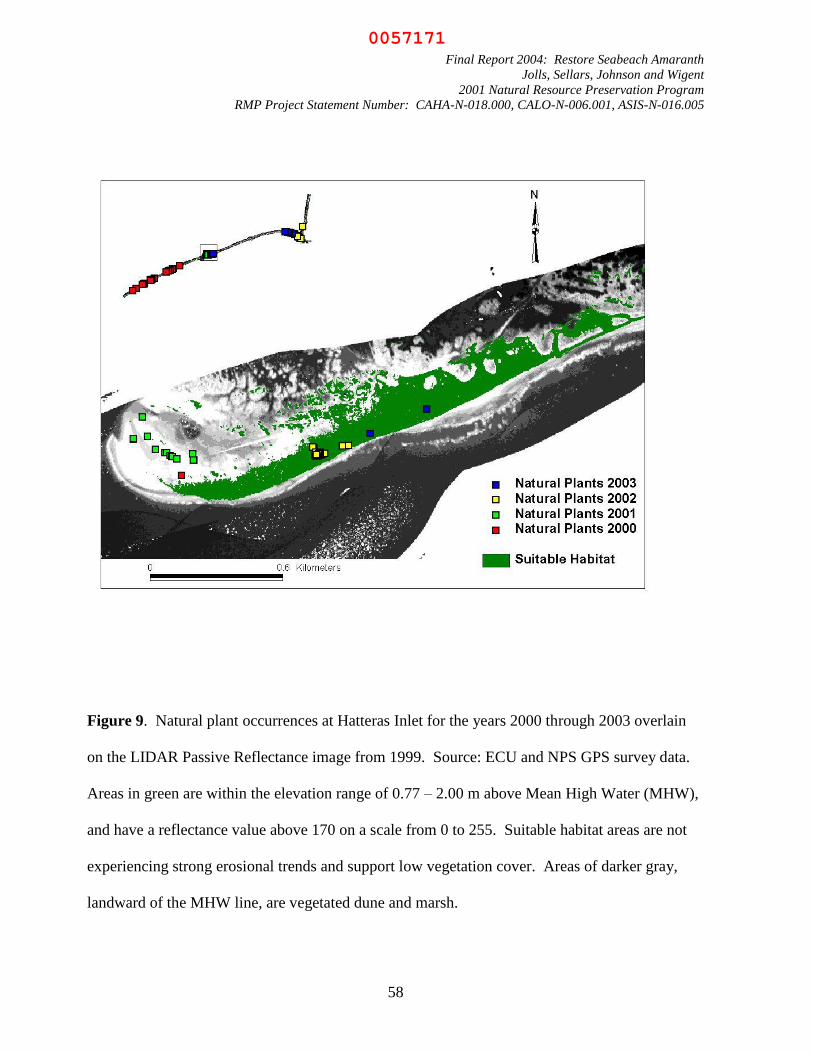
Final Report 2004: Restore Seabeach Amaranth
Jolls, Sellars, Johnson and Wigent
2001 Natural Resource Preservation Program
RMP Project Statement Number: CAHA-N-018.000, CALO-N-006.001, ASIS-N-016.005
58
Figure 9. Natural plant occurrences at Hatteras Inlet for the years 2000 through 2003 overlain
on the LIDAR Passive Reflectance image from 1999. Source: ECU and NPS GPS survey data.
Areas in green are within the elevation range of 0.77 – 2.00 m above Mean High Water (MHW),
and have a reflectance value above 170 on a scale from 0 to 255. Suitable habitat areas are not
experiencing strong erosional trends and support low vegetation cover. Areas of darker gray,
landward of the MHW line, are vegetated dune and marsh.
0057171

Final Report 2004: Restore Seabeach Amaranth
Jolls, Sellars, Johnson and Wigent
2001 Natural Resource Preservation Program
RMP Project Statement Number: CAHA-N-018.000, CALO-N-006.001, ASIS-N-016.005
59
Figure 10. Natural plant occurrences on Ocracoke Island (CAHA) from 2002 and 2003 overlain
on the LIDAR Passive Reflectance image from 1999. Source: NPS GPS survey data. Areas in
green are within the elevation range of 0.77 – 2.00 m above Mean High Water (MHW), and have
a reflectance value above 170 on a scale from 0 to 255. Suitable habitat areas are not
experiencing strong erosional trends and support low vegetation cover. Areas of darker gray,
landward of the MHW line, are vegetated dune and marsh.
0057172

Final Report 2004: Restore Seabeach Amaranth
Jolls, Sellars, Johnson and Wigent
2001 Natural Resource Preservation Program
RMP Project Statement Number: CAHA-N-018.000, CALO-N-006.001, ASIS-N-016.005
60
Figure 11. Natural plant occurrences at Cape Lookout Point overlain on the LIDAR Passive
Reflectance image from 2000. Areas in green are within the elevation range of 0.77 – 2.00 m
above Mean High Water (MHW), and have a reflectance value above 170 on a scale from 0 to
255. Suitable habitat areas are not experiencing strong erosional trends and support low
vegetation cover. Areas of darker gray, landward of the MHW line, are vegetated dune and
marsh.
0057173

Final Report 2004: Restore Seabeach Amaranth
Jolls, Sellars, Johnson and Wigent
2001 Natural Resource Preservation Program
RMP Project Statement Number: CAHA-N-018.000, CALO-N-006.001, ASIS-N-016.005
61
Figure 12. Natural plant occurrences at Cape Lookout Spit overlain on the LIDAR Passive
Reflectance image from 2000. Areas in green are within the elevation range of 0.77 – 2.00 m
above Mean High Water (MHW), and have a reflectance value above 170 on a scale from 0 to
255. Suitable habitat areas are not experiencing strong erosional trends and support low
vegetation cover. Areas of darker gray, landward of the MHW line, are vegetated dune and
marsh.
0057174

Final Report 2004: Restore Seabeach Amaranth
Jolls, Sellars, Johnson and Wigent
2001 Natural Resource Preservation Program
RMP Project Statement Number: CAHA-N-018.000, CALO-N-006.001, ASIS-N-016.005
62
Figure 13. Natural plant occurrences on the east end of Shackleford Banks (CALO) overlain on
the LIDAR Passive Reflectance image from 2000. Source: ECU and NPS GPS survey data.
Areas in green are within the elevation range of 0.77 – 2.00 m above Mean High Water (MHW),
and have a reflectance value above 170 on a scale from 0 to 255. Suitable habitat areas are not
experiencing strong erosional trends and support low vegetation cover. Areas of darker gray,
landward of the MHW line, are vegetated dune and marsh.
0057175

Final Report 2004: Restore Seabeach Amaranth
Jolls, Sellars, Johnson and Wigent
2001 Natural Resource Preservation Program
RMP Project Statement Number: CAHA-N-018.000, CALO-N-006.001, ASIS-N-016.005
63
Figure 14. Natural plant occurrences on the west end of Shackleford Banks (CALO) overlain on
the LIDAR Passive Reflectance image from 2000. Source: ECU and NPS GPS survey data.
Areas in green are within the elevation range of 0.77 – 2.00 m above Mean High Water (MHW),
and have a reflectance value above 170 on a scale from 0 to 255. Suitable habitat areas are not
experiencing strong erosional trends and support low vegetation cover. Areas of darker gray,
landward of the MHW line, are vegetated dune and marsh.
0057176

Final Report 2004: Restore Seabeach Amaranth
Jolls, Sellars, Johnson and Wigent
2001 Natural Resource Preservation Program
RMP Project Statement Number: CAHA-N-018.000, CALO-N-006.001, ASIS-N-016.005
64
Figure 15. Locations of outplanting sites (plots) at Cape Hatteras Point (CAHA) for the years
2000 through 2003. Areas in green are within the elevation range of 0.77 – 2.00 m above Mean
High Water (MHW), and have a reflectance value above 170 on a scale from 0 to 255. Suitable
habitat areas are not experiencing strong erosional trends and support low vegetation cover.
Potential habitat for year 1999 and plot locations have been overlain on 1999 passive-LIDAR
imagery for Cape Hatteras Point (CAHA). Areas of darker gray, landward of the MHW line, are
vegetated dune and marsh.
0057177

Final Report 2004: Restore Seabeach Amaranth
Jolls, Sellars, Johnson and Wigent
2001 Natural Resource Preservation Program
RMP Project Statement Number: CAHA-N-018.000, CALO-N-006.001, ASIS-N-016.005
65
Figure 16. Locations of outplanting sites (plots) at Hatteras Inlet (CAHA) for the year 2000
through 2003. Plots were established only during 2000 and 2001. Areas in green are within the
elevation range of 0.77 – 2.00 m above Mean High Water (MHW), and have a reflectance value
above 170 on a scale from 0 to 255. Suitable habitat areas are not experiencing strong erosional
trends and support low vegetation cover. Potential habitat for year 1999 and plot locations have
been overlain on 1999 passive-LIDAR imagery for Hatteras Inlet. Areas of darker gray,
landward of the MHW line, are vegetated dune and marsh.
0057178
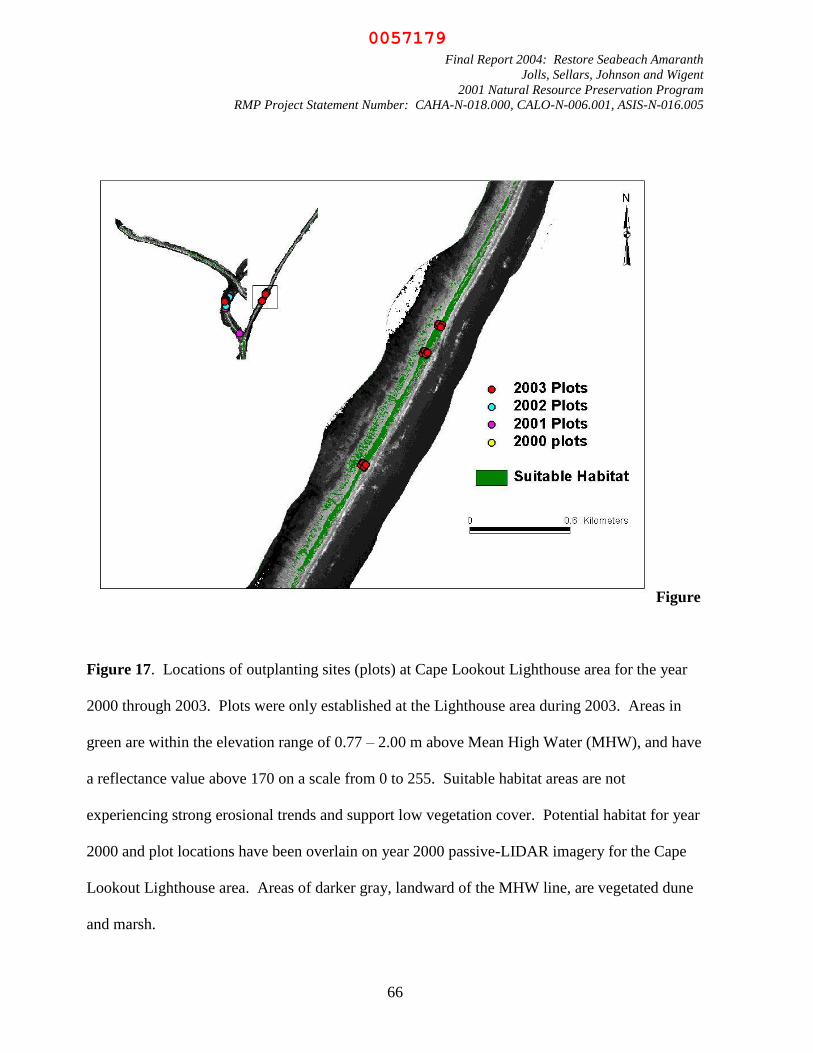
Final Report 2004: Restore Seabeach Amaranth
Jolls, Sellars, Johnson and Wigent
2001 Natural Resource Preservation Program
RMP Project Statement Number: CAHA-N-018.000, CALO-N-006.001, ASIS-N-016.005
66
Figure
Figure 17. Locations of outplanting sites (plots) at Cape Lookout Lighthouse area for the year
2000 through 2003. Plots were only established at the Lighthouse area during 2003. Areas in
green are within the elevation range of 0.77 – 2.00 m above Mean High Water (MHW), and have
a reflectance value above 170 on a scale from 0 to 255. Suitable habitat areas are not
experiencing strong erosional trends and support low vegetation cover. Potential habitat for year
2000 and plot locations have been overlain on year 2000 passive-LIDAR imagery for the Cape
Lookout Lighthouse area. Areas of darker gray, landward of the MHW line, are vegetated dune
and marsh.
0057179

Final Report 2004: Restore Seabeach Amaranth
Jolls, Sellars, Johnson and Wigent
2001 Natural Resource Preservation Program
RMP Project Statement Number: CAHA-N-018.000, CALO-N-006.001, ASIS-N-016.005
67
Figure 18. Locations of outplanting sites (plots) at Cape Lookout Point for the year 2000
through 2003. Only during the year 2001 were plots established on the Point.
0057180

Final Report 2004: Restore Seabeach Amaranth
Jolls, Sellars, Johnson and Wigent
2001 Natural Resource Preservation Program
RMP Project Statement Number: CAHA-N-018.000, CALO-N-006.001, ASIS-N-016.005
68
Figure 19. Locations of outplanting sites (plots) at Cape Lookout Spit for the year 2000 through
2003. No plots were plots established on the Spit during 2000. Areas in green are within the
elevation range of 0.77 – 2.00 m above Mean High Water (MHW), and have a reflectance value
above 170 on a scale from 0 to 255. Suitable habitat areas are not experiencing strong erosional
trends and support low vegetation cover. Potential habitat for year 2000 and plot locations have
been overlain on year 2000 passive-LIDAR imagery for Cape Lookout Spit. Areas of darker
gray, landward of the MHW line, are vegetated dune and marsh.
0057181
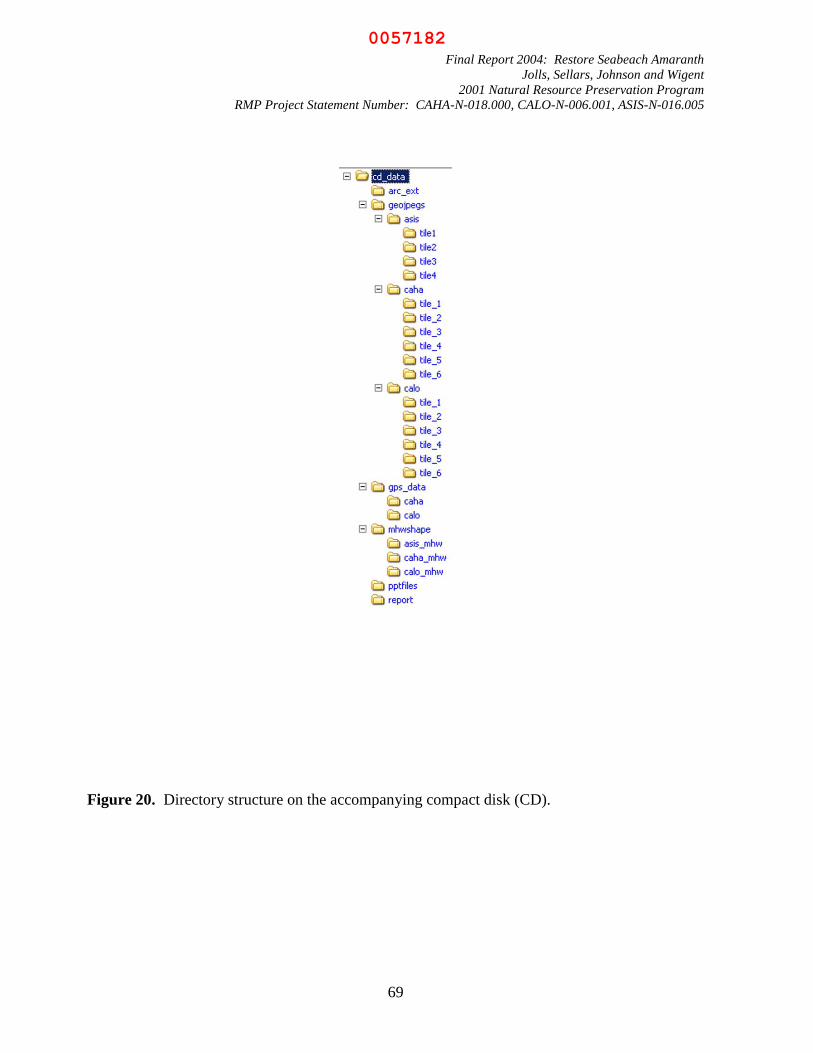
Final Report 2004: Restore Seabeach Amaranth
Jolls, Sellars, Johnson and Wigent
2001 Natural Resource Preservation Program
RMP Project Statement Number: CAHA-N-018.000, CALO-N-006.001, ASIS-N-016.005
69
Figure 20. Directory structure on the accompanying compact disk (CD).
0057182

Final Report 2004: Restore Seabeach Amaranth
Jolls, Sellars, Johnson and Wigent
2001 Natural Resource Preservation Program
RMP Project Statement Number: CAHA-N-018.000, CALO-N-006.001, ASIS-N-016.005
70
0.87
0.40
1.000.97 0.97 0.97
0.00 0.00
0.90
1.00
0.93
0.03
0.00
0.20
0.40
0.60
0.80
1.00
1.20
P1 IN P2 IN P3 OUT I1 IN I2 IN I3 OUT O1 IN O2 OUT O3 OUT L1 IN L2 IN L3 OUT
Site
Po
rp
orti
on
Ali
ve
Figure 21. Survival of 2001 transplants of seabeach amaranth to Cape Hatteras (CAHA) and
Cape Lookout (CALO) National Seashores during approximately two months of the growing
season. P = Cape Hatteras Point (CAHA), I = Cape Hatteras Inlet (CAHA), O = N. Ocracoke
Island (CAHA), L – Cape Lookout Spit (CALO). IN and OUT denote sites within or outside the
predicted elevation range for success of transplants based on 1998 (CALO) and 1999 (CAHA)
LIDAR.
0057183

Final Report 2004: Restore Seabeach Amaranth
Jolls, Sellars, Johnson and Wigent
2001 Natural Resource Preservation Program
RMP Project Statement Number: CAHA-N-018.000, CALO-N-006.001, ASIS-N-016.005
71
7427415N =
Elevation Group
HighInLow
15.0
10.0
5.0
0.0
-5.0
Figure 22. The proportional change in diameter of 2002 transplants from 2 wk to 10 wk
followed a significant negative trend. Transplants to lower elevations were larger than plants in
the next higher elevation group. The IN and HIGH groups contained 11 individuals each that
had been decapitated and were withheld from the analysis.
Pro
port
ional
Chan
ge
in D
iam
eter
(wk 2
– w
k 1
0)
0057184

Final Report 2004: Restore Seabeach Amaranth
Jolls, Sellars, Johnson and Wigent
2001 Natural Resource Preservation Program
RMP Project Statement Number: CAHA-N-018.000, CALO-N-006.001, ASIS-N-016.005
72
Elevation Group
HighInLow
Pro
port
ion S
urv
ivin
g a
t W
eek 1
0
01.0
0.8
0.6
0.4
0.2
00.0
Figure 23. The proportion of Amaranthus pumilus surviving thorough 10 wk in 2002 was
significantly influenced by elevation group. Plants at lower elevations experienced more
frequent overwash and flooding.
n = 15/150 n = 285/450 n = 85/90
0.10 0.63 0.94
Pro
port
ion o
f P
lants
Surv
ivin
g t
o w
k 1
0
0057185
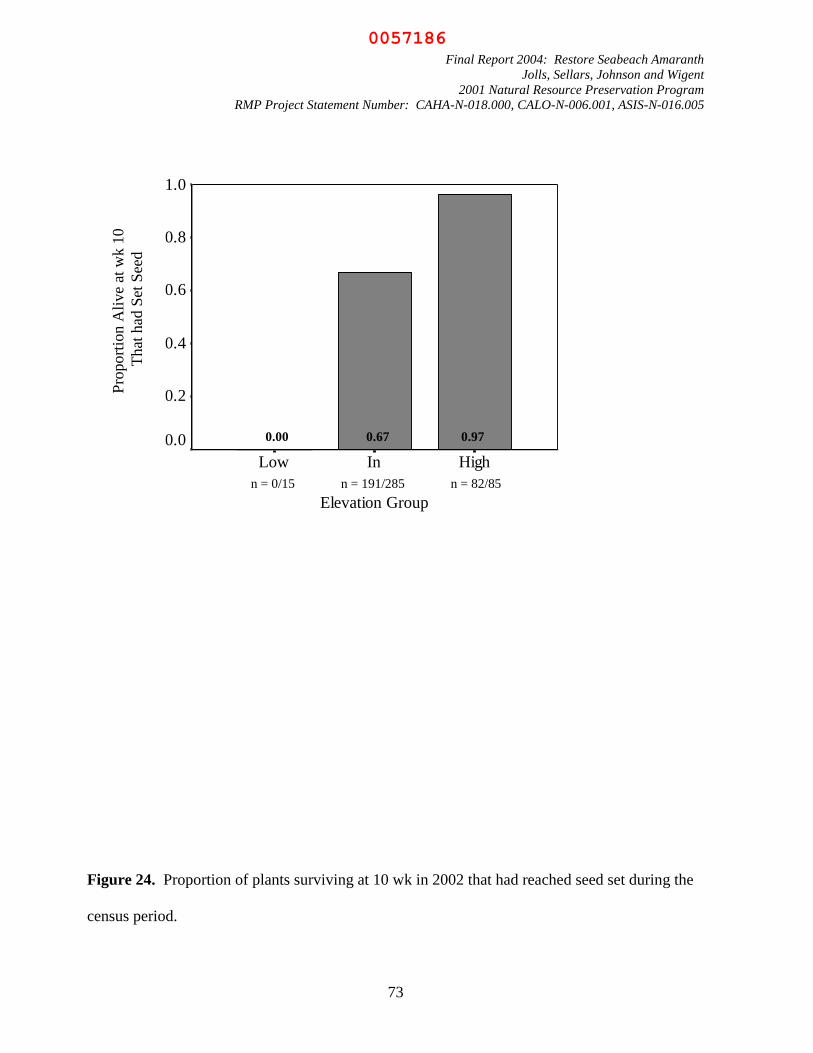
Final Report 2004: Restore Seabeach Amaranth
Jolls, Sellars, Johnson and Wigent
2001 Natural Resource Preservation Program
RMP Project Statement Number: CAHA-N-018.000, CALO-N-006.001, ASIS-N-016.005
73
Elevation Group
HighInLow
01.0
0.8
0.6
0.4
0.2
00.0
Figure 24. Proportion of plants surviving at 10 wk in 2002 that had reached seed set during the
census period.
n = 0/15 n = 191/285 n = 82/85
0.00 0.67 0.97
Pro
port
ion A
live
at w
k 1
0
That
had
Set
See
d
0057186
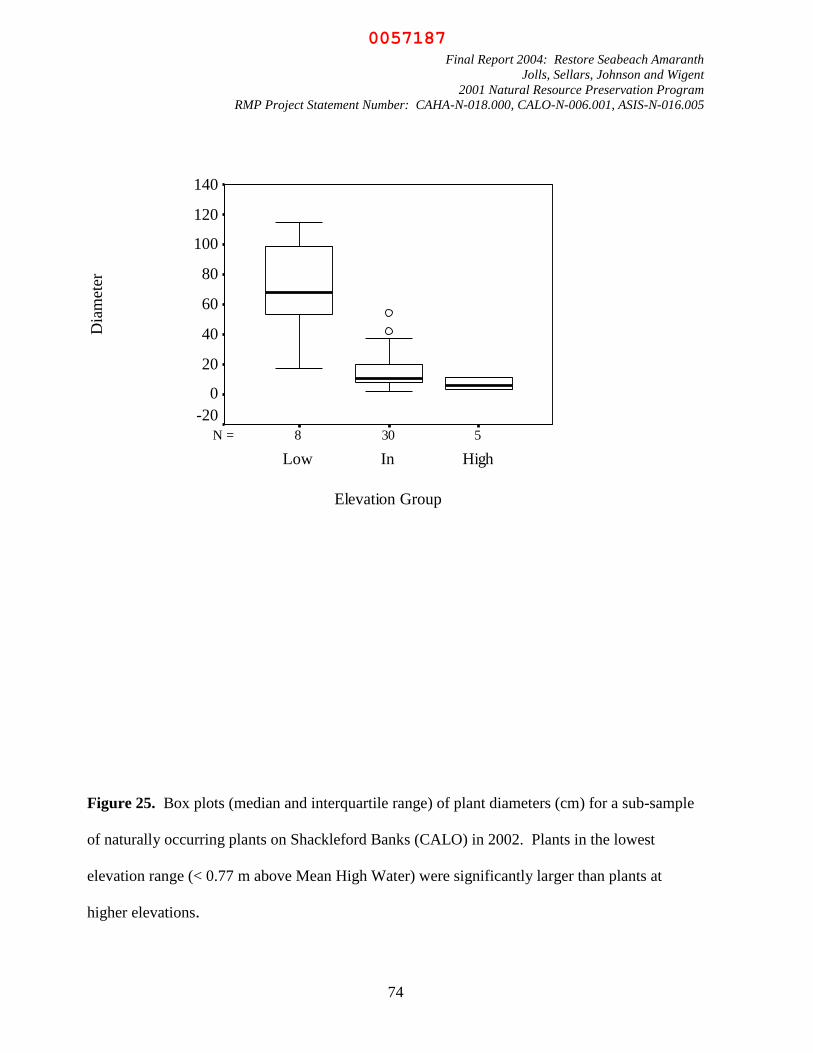
Final Report 2004: Restore Seabeach Amaranth
Jolls, Sellars, Johnson and Wigent
2001 Natural Resource Preservation Program
RMP Project Statement Number: CAHA-N-018.000, CALO-N-006.001, ASIS-N-016.005
74
5308N =
Elevation Group
HighInLow
Dia
met
er
140
120
100
80
60
40
20
0
-20
Figure 25. Box plots (median and interquartile range) of plant diameters (cm) for a sub-sample
of naturally occurring plants on Shackleford Banks (CALO) in 2002. Plants in the lowest
elevation range (< 0.77 m above Mean High Water) were significantly larger than plants at
higher elevations.
0057187

Final Report 2004: Restore Seabeach Amaranth
Jolls, Sellars, Johnson and Wigent
2001 Natural Resource Preservation Program
RMP Project Statement Number: CAHA-N-018.000, CALO-N-006.001, ASIS-N-016.005
75
0
10
20
30
40
50
60
70
80
90
100
110
Week 2 Week 4 Week 6 Week 8 Week 10
Census Period
Mea
n P
erce
nt
Surv
ival
Hi
Lo
Figure 26. Mean percent survival throughout 10 wk (02 June –20 August 2003) for Amaranthus
pumilus transplants growing above (HIGH) and within (IN) the predicted elevation range at Cape
Hatteras National Seashore. Bars represent the upper ends of 95% confidence intervals (n = 6).
0057188
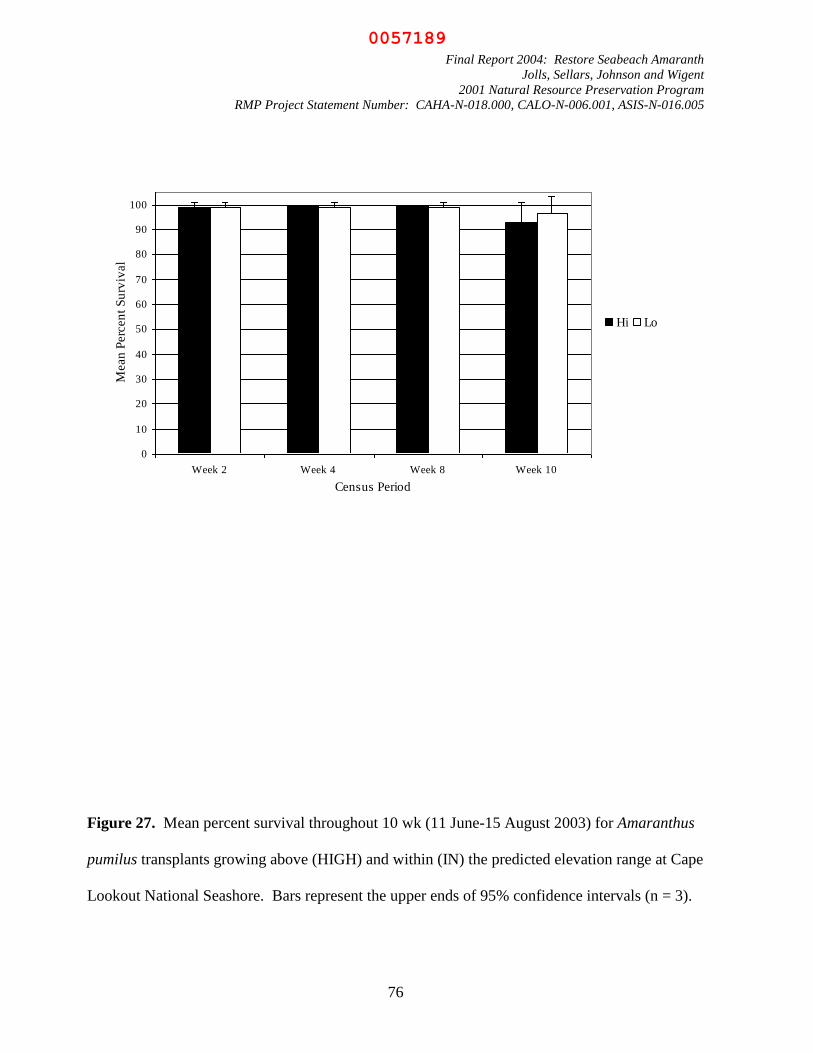
Final Report 2004: Restore Seabeach Amaranth
Jolls, Sellars, Johnson and Wigent
2001 Natural Resource Preservation Program
RMP Project Statement Number: CAHA-N-018.000, CALO-N-006.001, ASIS-N-016.005
76
0
10
20
30
40
50
60
70
80
90
100
Week 2 Week 4 Week 8 Week 10
Census Period
Mean
Perc
en
t S
urv
ival
Hi Lo
In
Figure 27. Mean percent survival throughout 10 wk (11 June-15 August 2003) for Amaranthus
pumilus transplants growing above (HIGH) and within (IN) the predicted elevation range at Cape
Lookout National Seashore. Bars represent the upper ends of 95% confidence intervals (n = 3).
0057189

Final Report 2004: Restore Seabeach Amaranth
Jolls, Sellars, Johnson and Wigent
2001 Natural Resource Preservation Program
RMP Project Statement Number: CAHA-N-018.000, CALO-N-006.001, ASIS-N-016.005
77
0
10
20
30
40
50
60
70
80
90
100
Week 2 Week 4 Week 8 Week 10
Census Period
Mea
n P
erce
nt
Su
rviv
al
FAR
NEAR
Figure 28. Mean percent survival throughout 10 wk (11 June-15 August 2003) for Amaranthus
pumilus transplants growing two distances (NEAR and FAR) from shore at Cape Lookout
National Seashore. Bars represent the upper ends of 95% confidence intervals (n=3).
0057190

Final Report 2004: Restore Seabeach Amaranth
Jolls, Sellars, Johnson and Wigent
2001 Natural Resource Preservation Program
RMP Project Statement Number: CAHA-N-018.000, CALO-N-006.001, ASIS-N-016.005
78
0
20
40
60
80
100
120
140
Week 2 Week 4 Week 6 Week 8 Week 10
Census Period
Perc
en
t S
ett
ing
Seed
CAHA HI
CAHA IN
CALO HI
CALO IN
Figure 29. Phenology of Amaranthus pumilus transplants represented as the percentage of plants
setting seed after 10 wk in research plots above (HIGH) and within (IN) the predicted elevation
range at Cape Hatteras (CAHA) and Cape Lookout (CALO) National Seashores. Data were not
collected for CALO during Week 6. The bars represent 95% confidence intervals (for CAHA, n
= 6 and for CALO, n = 3).
0057191

Final Report 2004: Restore Seabeach Amaranth
Jolls, Sellars, Johnson and Wigent
2001 Natural Resource Preservation Program
RMP Project Statement Number: CAHA-N-018.000, CALO-N-006.001, ASIS-N-016.005
79
Figure 30. Potential application of GIS model of Amaranthus pumilus habitat to animal species
of concern. Habitat is delineated as 0.77-0.22 m above MHW. Locations of nesting animals are
overlain on seabeach amaranth habitat along with plant occurrences (in red): Piping Plover
(Charadius melodus)in brown, American Oystercatcher (in orange) and sea turtles (Caretta
caretta) in blue.
Seabeach Amaranth (2000-2001)
Piping Plover (1999-2000)
American Oystercatcher (1999-2000)
Sea Turtle (2001)
0057192

Final Report 2004: Restore Seabeach Amaranth
Jolls, Sellars, Johnson and Wigent
2001 Natural Resource Preservation Program
RMP Project Statement Number: CAHA-N-018.000, CALO-N-006.001, ASIS-N-016.005
80
Table 1. Numbers of naturally occurring plants of Amaranthus pumilus at Cape Hatteras (CAHA) and Cape Lookout (CALO) National
Seashores since 1985. Empty cells represent no data. Censuses were completed by a variety of personnel and agencies, typically July-
August.
Park Site 2003 2002 2001 2000 1999 1998 1997 1996 1995 1994 1993 1990 1988 1987 1986 1985
CAHA Hatteras
Point 16 45 37 1 present 9 59 2 2830 800 5200 200
CAHA Hatteras
Inlet 2 75 16 1 present 47 16 62 0 0 252 1718 274 300 450
CAHA N. Ocra-
coke 36 13 0 6 14 1 0 0 250 13310 1409 100 100
CALO N. Core
Banks 1 0 0 2 121 2 1 30 63 82 292 700 0 1
CALO S. Core
Banks 205 69 42 4 0 4 0 0 45 641 1208 0 14
CALO Shackle-
ford 1354 261 126 16 9 369 51 3 1155 948 975 175 2 0
PARK
TOTALS
CAHA 54 133 53 2 56 81 78 1 0 0 3332 15828 6883 600 550
CALO 1560 330 168 20 11 494 53 4 1230 1652 2265 467 702 14 1
TOTAL 1614 463 221 22 11 550 134 82 1231 1652 2265 3799 16530 6879 601
0057193
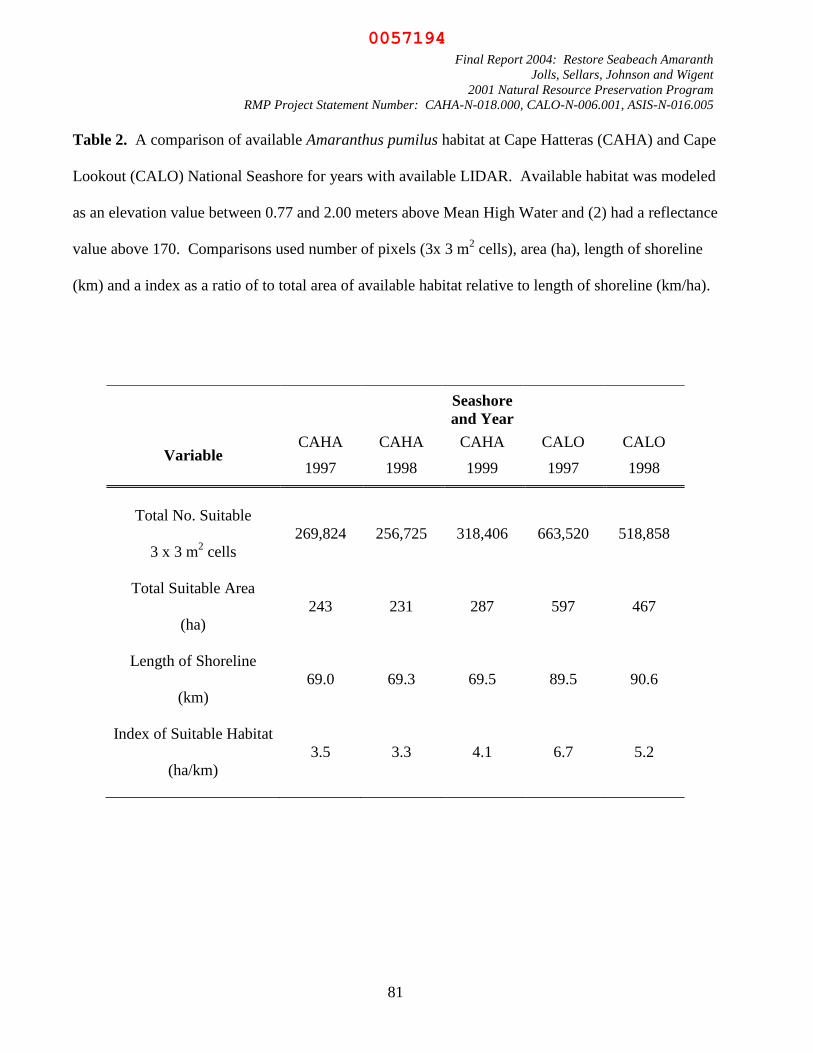
Final Report 2004: Restore Seabeach Amaranth
Jolls, Sellars, Johnson and Wigent
2001 Natural Resource Preservation Program
RMP Project Statement Number: CAHA-N-018.000, CALO-N-006.001, ASIS-N-016.005
81
Table 2. A comparison of available Amaranthus pumilus habitat at Cape Hatteras (CAHA) and Cape
Lookout (CALO) National Seashore for years with available LIDAR. Available habitat was modeled
as an elevation value between 0.77 and 2.00 meters above Mean High Water and (2) had a reflectance
value above 170. Comparisons used number of pixels (3x 3 m2 cells), area (ha), length of shoreline
(km) and a index as a ratio of to total area of available habitat relative to length of shoreline (km/ha).
Seashore
and Year
Variable CAHA
1997
CAHA
1998
CAHA
1999
CALO
1997
CALO
1998
Total No. Suitable
3 x 3 m2 cells
269,824 256,725 318,406 663,520 518,858
Total Suitable Area
(ha)
243 231 287 597 467
Length of Shoreline
(km)
69.0 69.3 69.5 89.5 90.6
Index of Suitable Habitat
(ha/km)
3.5 3.3 4.1 6.7 5.2
0057194

Final Report 2004: Restore Seabeach Amaranth
Jolls, Sellars, Johnson and Wigent
2001 Natural Resource Preservation Program
RMP Project Statement Number: CAHA-N-018.000, CALO-N-006.001, ASIS-N-016.005
82
Table 3. Survival of all 2001 Amaranthus pumilus transplants on Cape Hatteras and Cape Lookout
National Seashores. There were 90 transplants in three plots (30 per plot) at each of the four sites.
Site Number of
Transplants Alive
Proportion of
Transplants Alive
Hatteras Point 68 0.76
Hatteras Inlet 87 0.97
North Ocracoke 27 0.30
Cape Lookout 59 0.66
0057195

Final Report 2004: Restore Seabeach Amaranth
Jolls, Sellars, Johnson and Wigent
2001 Natural Resource Preservation Program
RMP Project Statement Number: CAHA-N-018.000, CALO-N-006.001, ASIS-N-016.005
83
Table 4. Survival of 2001 Amaranthus pumilus transplants by placement in or out of “good” habitat
for 12 plots as of 2 August 2001 at Cape Lookout and 14 August 2001 Cape Hatteras National
Seashores.
Habitat # Alive/
# Planted Proportion
IN (n = 7) 154/210 0.73
OUT (n= 5) 87/150 0.58
0057196

Final Report 2004: Restore Seabeach Amaranth
Jolls, Sellars, Johnson and Wigent
2001 Natural Resource Preservation Program
RMP Project Statement Number: CAHA-N-018.000, CALO-N-006.001, ASIS-N-016.005
84
Table 5. Number and percent survival to 10 wk (01 June to 20 August 2003) of Amaranthus pumilus
transplants in research plots above (HIGH) and within (IN) the predicted elevation range at Cape
Hatteras National Seashore. Numbers in parentheses represent the expected values used in Pearson‟s
Chi-Square Analysis.
Elevation Number
Planted
Number
Surviving
Number Not
Surviving
Percent
Survival
HIGH 162 158 (148) 4 (14) 97.53
IN 162 138 (148) 24 (14) 85.19
Total 324 296 28 Mean 91.36
95% CI ±12.09
n 2
0057197

Final Report 2004: Restore Seabeach Amaranth
Jolls, Sellars, Johnson and Wigent
2001 Natural Resource Preservation Program
RMP Project Statement Number: CAHA-N-018.000, CALO-N-006.001, ASIS-N-016.005
85
Table 6. Number and percent survival to 10 wk of Amaranthus pumilus transplants in research plots
above (HIGH) and within (IN) the predicted elevation range at Cape Lookout National Seashore.
Expected values are not presented for data analyzed using Fisher‟s Exact Test.
Elevation Number
Planted
Number
Surviving
Number Not
Surviving
Percent
Survival
HIGH 81 75 6 92.59
IN 81 78 3 92.30
Total 162 153 9 Mean
92.45
95% CI 3.63
n 2
0057198

Final Report 2004: Restore Seabeach Amaranth
Jolls, Sellars, Johnson and Wigent
2001 Natural Resource Preservation Program
RMP Project Statement Number: CAHA-N-018.000, CALO-N-006.001, ASIS-N-016.005
86
Table 7. Percent survival to 10 wk (01 June to 20 August 2003) of Amaranthus pumilus transplants
in research plots above (HIGH) and within (IN) the predicted elevation range at Cape Hatteras
National Seashore (CAHA). Plots are arranged from the most northern (North 1) to most southern
(South 3) beach position.
Beach
Position Elevation
Number
Planted
Number
Alive
Percent
Survival
North 1 HIGH 27 26 96.3
North 1 LOW 27 27 100
North 2 HIGH 27 26 96.3
North 2 LOW 27 26 96.3
North 3 HIGH 27 25 92.59
North 3 LOW 27 22 81.48
South 1 HIGH 27 27 100
South 1 LOW 27 27 100
South 2 HIGH 27 27 100
South 2 LOW 27 27 100
South 3 HIGH 27 27 100
South 3 LOW 27 9 33.33
Total 324 296 Mean 91.36
95%
CI ± 10.77
n 12
0057199

Final Report 2004: Restore Seabeach Amaranth
Jolls, Sellars, Johnson and Wigent
2001 Natural Resource Preservation Program
RMP Project Statement Number: CAHA-N-018.000, CALO-N-006.001, ASIS-N-016.005
87
Table 8. Percent survival to 10 wk (11 June to 15 August 2003) of Amaranthus pumilus transplants
in research plots above (HIGH) and within (IN) the predicted elevation range at Cape Lookout
National Seashore (CALO). The six plots are arranged from the most northern (North 1) to most
southern (North 3) beach position.
Beach
Position Elevation
Number
Planted
Number
Alive
Percent
Survival
North 1 HIGH 27 22 81.48
North 1 LOW 27 27 100
North 2 HIGH 27 24 88.89
North 2 LOW 27 24 88.89
North 3 HIGH 27 17 62.96
North 3 LOW 27 26 96.3
Total 162 140 Mean 86.42
95% CI ±10.55
n 6
0057200

Final Report 2004: Restore Seabeach Amaranth
Jolls, Sellars, Johnson and Wigent
2001 Natural Resource Preservation Program
RMP Project Statement Number: CAHA-N-018.000, CALO-N-006.001, ASIS-N-016.005
88
Table 9. Number and percent survival to 10 wk of Amaranthus pumilus transplants in research plots
two distances from shore (FAR and Near) at Cape Lookout National Seashore. Numbers in
parentheses represent the expected values used in Pearson Chi-Square Analysis.
Distance
From Shore
n Number
Surviving
Number Not
Surviving
Percent
Survival
FAR 81 25 (13.5) 56 (67.5) 30.86
NEAR 81 2 (13.5) 79 (67.5) 2.47
Total 162 27 135 Mean 16.67
95% CI 27.83
n 2
0057201

Final Report 2004: Restore Seabeach Amaranth
Jolls, Sellars, Johnson and Wigent
2001 Natural Resource Preservation Program
RMP Project Statement Number: CAHA-N-018.000, CALO-N-006.001, ASIS-N-016.005
89
Table 10. Percent survival to 10 wk (11 June to 15 August 2003) of Amaranthus pumilus transplants
in research plots two distances from shore (NEAR and FAR) at Cape Lookout National Seashore.
Plots are arranged from the most northern (North 1) to the most southern (North 3) beach position.
Beach
Position
Distance
From
Shore
Number
Planted
Number
Alive
Percent
Survival
North 1 FAR 27 0 0
North 1 NEAR 27 0 0
North 2 FAR 27 0 0
North 2 NEAR 27 2 7.41
North 3 FAR 27 25 92.59
North 3 NEAR 27 0 0
Total 162 26 Mean 16.67
95% CI ±29.86
n 6
0057202
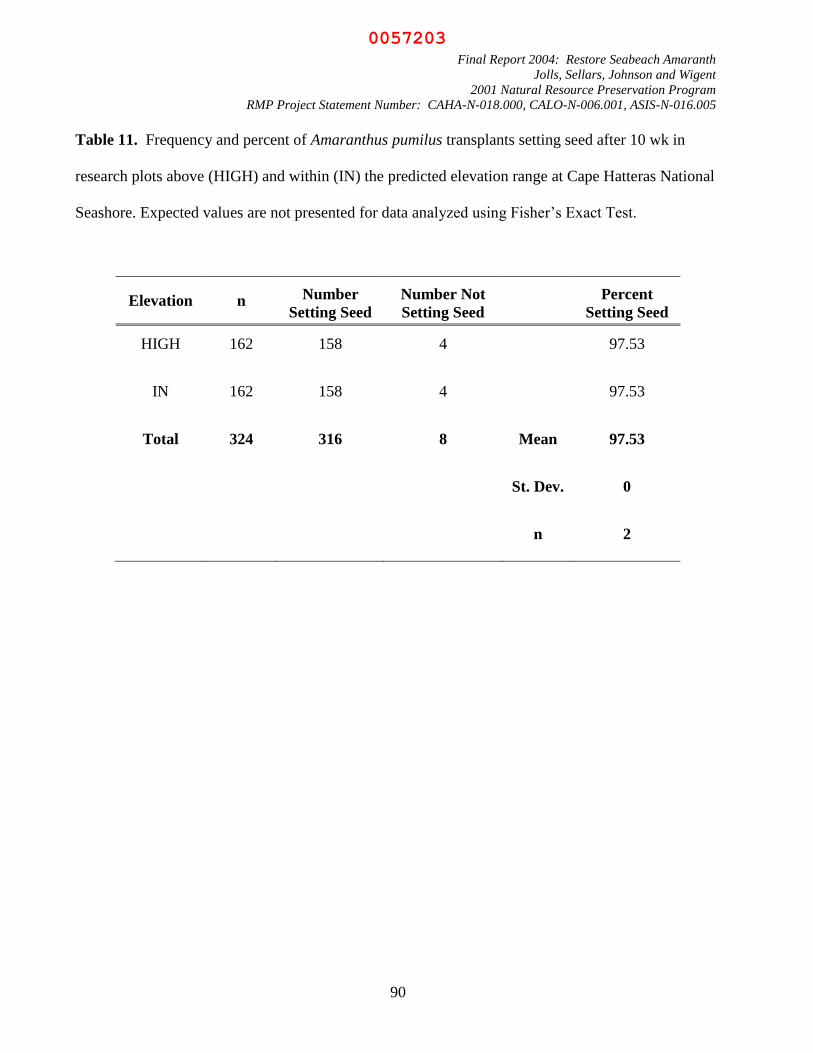
Final Report 2004: Restore Seabeach Amaranth
Jolls, Sellars, Johnson and Wigent
2001 Natural Resource Preservation Program
RMP Project Statement Number: CAHA-N-018.000, CALO-N-006.001, ASIS-N-016.005
90
Table 11. Frequency and percent of Amaranthus pumilus transplants setting seed after 10 wk in
research plots above (HIGH) and within (IN) the predicted elevation range at Cape Hatteras National
Seashore. Expected values are not presented for data analyzed using Fisher‟s Exact Test.
Elevation n Number
Setting Seed
Number Not
Setting Seed Percent
Setting Seed
HIGH 162 158 4 97.53
IN 162 158 4 97.53
Total 324 316 8 Mean 97.53
St. Dev. 0
n 2
0057203

Final Report 2004: Restore Seabeach Amaranth
Jolls, Sellars, Johnson and Wigent
2001 Natural Resource Preservation Program
RMP Project Statement Number: CAHA-N-018.000, CALO-N-006.001, ASIS-N-016.005
91
Table 12. Frequency and percent of Amaranthus pumilus transplants setting seed after 10 wk in
research plots above (HIGH) and within (IN) the predicted elevation range at Cape Lookout National
Seashore. Expected values are not presented for data analyzed using Fisher‟s Exact Test.
Elevation n Number
Setting Seed
Number Not
Setting Seed
Percent
Setting Seed
HIGH 162 81 0 100.00
IN 162 79 2 97.53
Total 324 160 2 Mean 98.77
95% CI 2.43
n 2
0057204
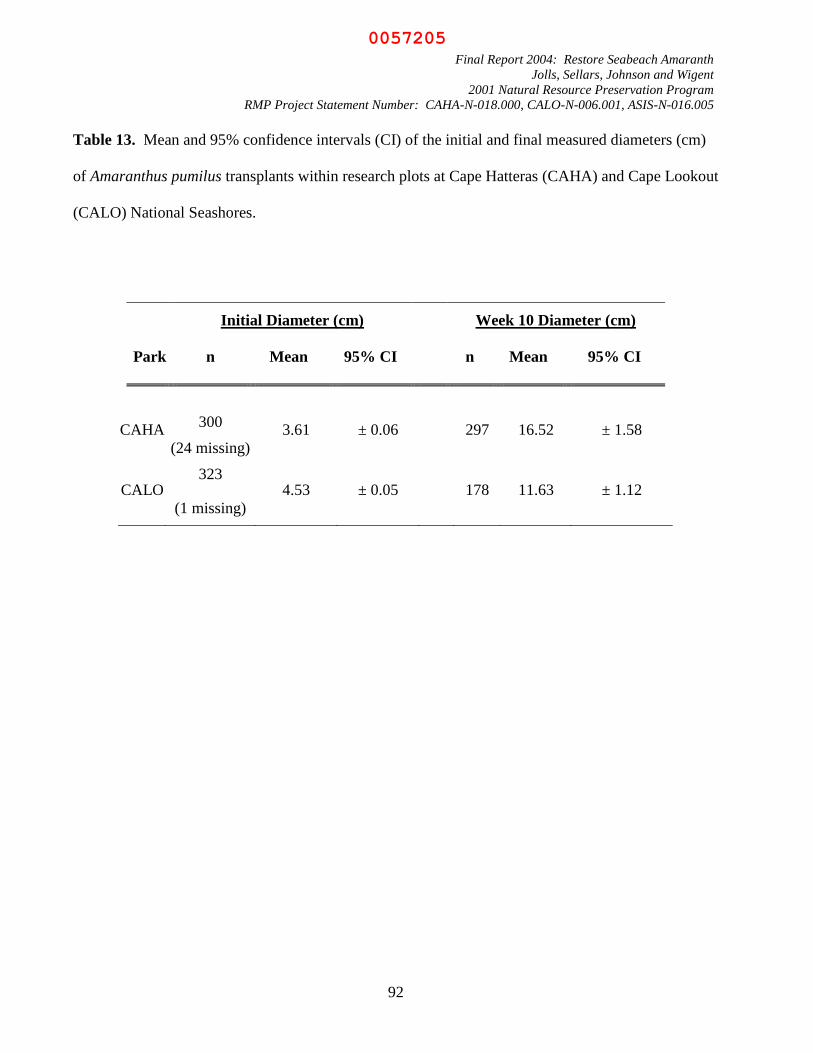
Final Report 2004: Restore Seabeach Amaranth
Jolls, Sellars, Johnson and Wigent
2001 Natural Resource Preservation Program
RMP Project Statement Number: CAHA-N-018.000, CALO-N-006.001, ASIS-N-016.005
92
Table 13. Mean and 95% confidence intervals (CI) of the initial and final measured diameters (cm)
of Amaranthus pumilus transplants within research plots at Cape Hatteras (CAHA) and Cape Lookout
(CALO) National Seashores.
Initial Diameter (cm) Week 10 Diameter (cm)
Park n Mean 95% CI n Mean 95% CI
CAHA 300
(24 missing)
3.61 ± 0.06 297 16.52 ± 1.58
CALO 323
(1 missing)
4.53 ± 0.05 178 11.63 ± 1.12
0057205
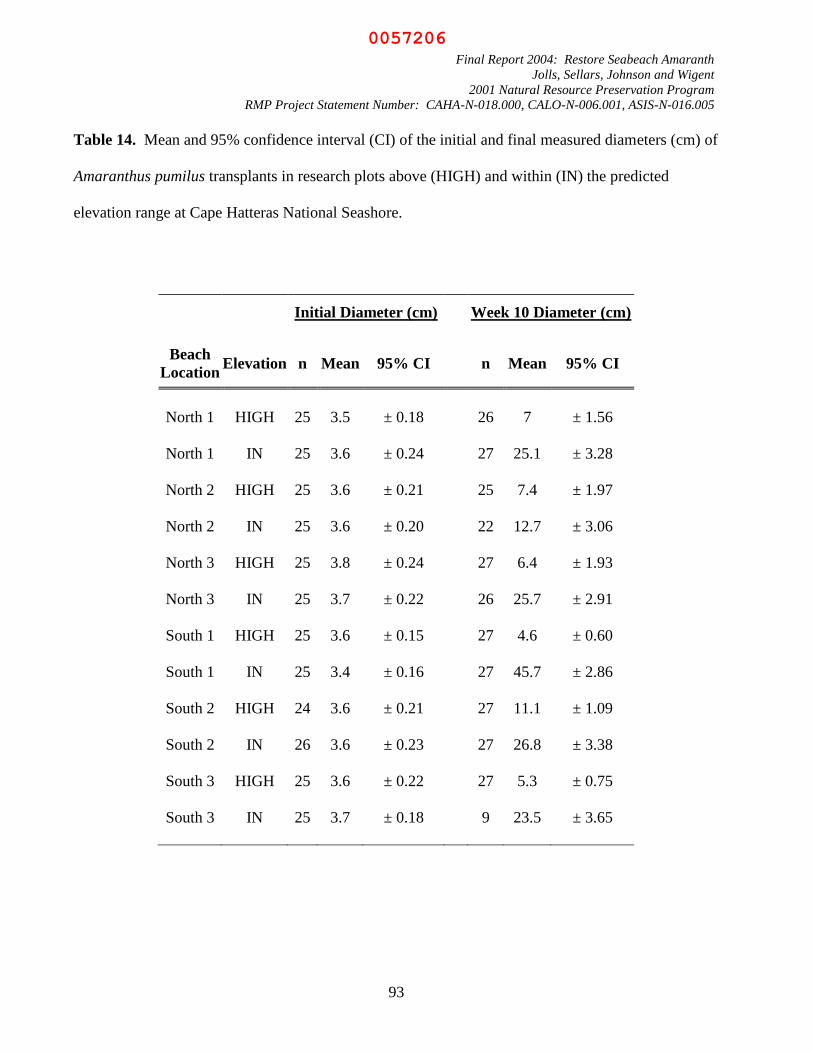
Final Report 2004: Restore Seabeach Amaranth
Jolls, Sellars, Johnson and Wigent
2001 Natural Resource Preservation Program
RMP Project Statement Number: CAHA-N-018.000, CALO-N-006.001, ASIS-N-016.005
93
Table 14. Mean and 95% confidence interval (CI) of the initial and final measured diameters (cm) of
Amaranthus pumilus transplants in research plots above (HIGH) and within (IN) the predicted
elevation range at Cape Hatteras National Seashore.
Initial Diameter (cm) Week 10 Diameter (cm)
Beach
Location Elevation n Mean 95% CI n Mean 95% CI
North 1 HIGH 25 3.5 ± 0.18 26 7 ± 1.56
North 1 IN 25 3.6 ± 0.24 27 25.1 ± 3.28
North 2 HIGH 25 3.6 ± 0.21 25 7.4 ± 1.97
North 2 IN 25 3.6 ± 0.20 22 12.7 ± 3.06
North 3 HIGH 25 3.8 ± 0.24 27 6.4 ± 1.93
North 3 IN 25 3.7 ± 0.22 26 25.7 ± 2.91
South 1 HIGH 25 3.6 ± 0.15 27 4.6 ± 0.60
South 1 IN 25 3.4 ± 0.16 27 45.7 ± 2.86
South 2 HIGH 24 3.6 ± 0.21 27 11.1 ± 1.09
South 2 IN 26 3.6 ± 0.23 27 26.8 ± 3.38
South 3 HIGH 25 3.6 ± 0.22 27 5.3 ± 0.75
South 3 IN 25 3.7 ± 0.18 9 23.5 ± 3.65
0057206

Final Report 2004: Restore Seabeach Amaranth
Jolls, Sellars, Johnson and Wigent
2001 Natural Resource Preservation Program
RMP Project Statement Number: CAHA-N-018.000, CALO-N-006.001, ASIS-N-016.005
94
Table 15. Mean and 95% confidence interval (CI) of the initial and final measured diameters (cm) of
Amaranthus pumilus transplants in research plots within above (HIGH) and (IN) the predicted
elevation range at Cape Lookout National Seashore.
Initial Diameter (cm) Week 10 Diameter (cm)
Beach
Position Elevation n Mean 95% CI n Mean 95% CI
North 1 HIGH 27 4.5 ± 0.16 26 5.1 ± 0.53
North 1 IN 27 4.7 ± 0.18 26 19.6 ± 2.39
North 2 HIGH 27 4.5 ± 0.15 25 6 ± 0.57
North 2 IN 26 4.6 ± 0.19 24 9.4 ± 1.04
North 3 HIGH 27 4.6 ± 0.17 23 9.1 ± 2.26
North 3 IN 27 4.5 ± 0.20 27 22.3 ± 2.37
0057207

Final Report 2004: Restore Seabeach Amaranth
Jolls, Sellars, Johnson and Wigent
2001 Natural Resource Preservation Program
RMP Project Statement Number: CAHA-N-018.000, CALO-N-006.001, ASIS-N-016.005
95
Table 16. Mean and 95% confidence interval (CI) of the initial and final measured diameters (cm) of
Amaranthus pumilus transplants in research plots two distances from shore (NEAR vs. FAR) at Cape
Lookout National Seashore.
Initial Diameter (cm) Week 10 Diameter (cm)
Beach
Position
Distance
From
Shore
n Mean 95% CI n Mean 95% CI
North 1 Far 27 4.5 ± 0.19 0 ± 0.00
North 1 Near 27 4.5 ± 0.24 0 ± 0.00
North 2 Far 27 4.4 ± 0.17 0 ± 0.00
North 2 Near 27 4.5 ± 0.19 2 11.1 ± 10.58
North 3 Far 27 4.4 ± 0.18 25 8.7 ± 0.79
North 3 Near 27 4.6 ± 0.17 0 ± 0.00
0057208

Final Report 2004: Restore Seabeach Amaranth
Jolls, Sellars, Johnson and Wigent
2001 Natural Resource Preservation Program
RMP Project Statement Number: CAHA-N-018.000, CALO-N-006.001, ASIS-N-016.005
96
Table 17. 2 x 2 Chi-Square contingency table of the number of Amaranthus pumilus transplants with
or without observed herbivory during wk 10 at Cape Hatteras (CAHA) (n = 297) and Cape Lookout
(CALO) (n = 178) National Seashores. Expected values are shown within parentheses.
Park
Number of
Plants With
Herbivory
Number of
Plants Without
Herbivory Row Totals
CAHA 215 (231.35) 82 (65.65) 297
CALO 155 (138.65) 23 (39.35) 178
Column Totals 370 105 475
0057209

Final Report 2004: Restore Seabeach Amaranth
Jolls, Sellars, Johnson and Wigent
2001 Natural Resource Preservation Program
RMP Project Statement Number: CAHA-N-018.000, CALO-N-006.001, ASIS-N-016.005
97
Table 18. 2 x 3 Chi-Square contingency table of the number of Amaranthus pumilus transplants
exhibiting different degrees of herbivory during wk 10 at Cape Hatteras (CAHA) (n = 297) and Cape
Lookout (CALO) (n = 178) National Seashores. Expected values are shown within parentheses.
Park
Number of
Plants with
Low
Herbivory
Number of
Plants with
Moderate
Herbivory
Number of
Plants with
High
Herbivory Row Totals
CAHA 136 (143.53) 61 (55.20) 18 (16.27) 215
CALO 111 (103.47) 34 (39.80) 10 (11.73) 155
Column Totals 247 95 28 370
0057210

Final Report 2004: Restore Seabeach Amaranth
Jolls, Sellars, Johnson and Wigent
2001 Natural Resource Preservation Program
RMP Project Statement Number: CAHA-N-018.000, CALO-N-006.001, ASIS-N-016.005
98
Table 19. 2 x 2 Chi-Square contingency table of the number of Amaranthus pumilus transplants with
or without observed herbivory during wk 10 in research plots above (HIGH) (n = 159) and within
(IN) (n = 138) the predicted elevation range at Cape Hatteras National Seashore (CAHA). Expected
values are shown within parentheses.
Elevation
Number of
Plants With
Herbivory
Number of
Plants Without
Herbivory Row Totals
HIGH 145 (115.10) 14 (43.90) 159
IN 70 (99.90) 68 (38.10) 138
Column Totals 215 82 297
0057211

Final Report 2004: Restore Seabeach Amaranth
Jolls, Sellars, Johnson and Wigent
2001 Natural Resource Preservation Program
RMP Project Statement Number: CAHA-N-018.000, CALO-N-006.001, ASIS-N-016.005
99
Table 20. 2 x 3 Chi-Square contingency table of the number of Amaranthus pumilus transplants
exhibiting different degrees of herbivory during wk 10 in research plots above (HIGH) (n = 159) and
within (IN) (n = 138) the predicted elevation range at Cape Hatteras National Seashore (CAHA).
Expected values are shown within parentheses.
Elevation
Number of
Plants With
Low
Herbivory
Number of
Plants With
Moderate
Herbivory
Number of
Plants With
High
Herbivory
Row Totals
HIGH 71 (91.72) 56 (41.14) 18 (12.14) 145
IN 65 (44.28) 5 (19.86) 0 (5.86) 70
Column Totals 136 61 18 215
0057212
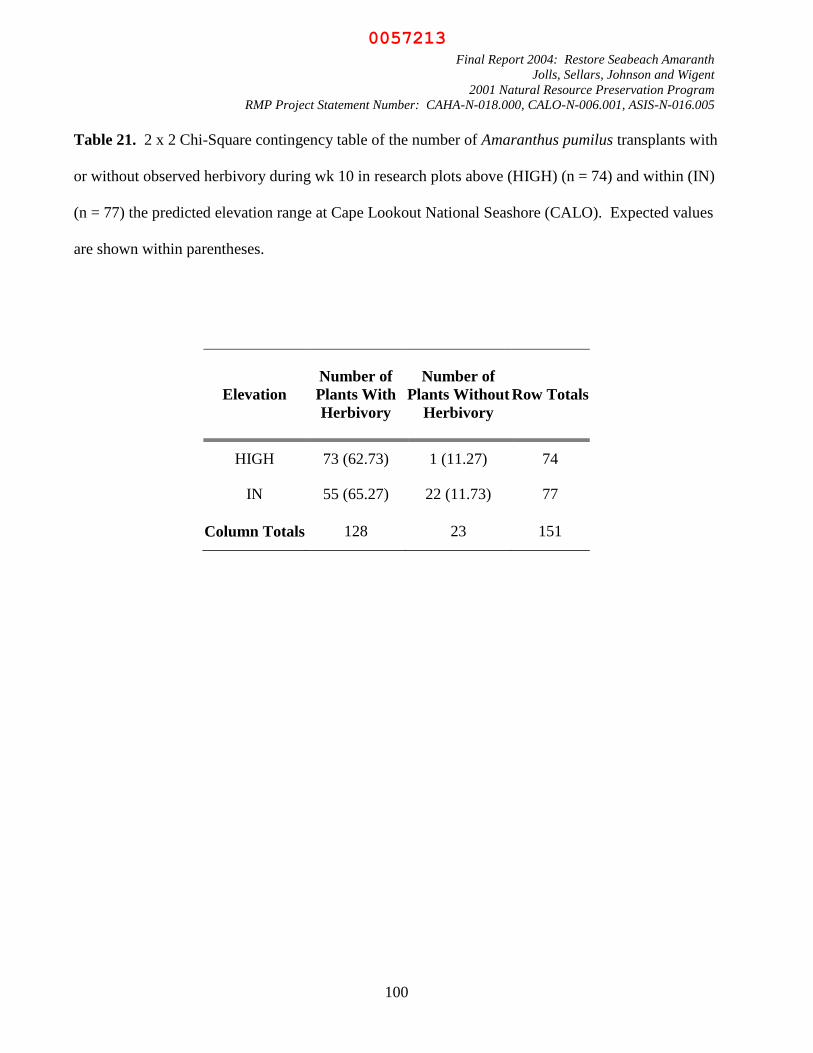
Final Report 2004: Restore Seabeach Amaranth
Jolls, Sellars, Johnson and Wigent
2001 Natural Resource Preservation Program
RMP Project Statement Number: CAHA-N-018.000, CALO-N-006.001, ASIS-N-016.005
100
Table 21. 2 x 2 Chi-Square contingency table of the number of Amaranthus pumilus transplants with
or without observed herbivory during wk 10 in research plots above (HIGH) (n = 74) and within (IN)
(n = 77) the predicted elevation range at Cape Lookout National Seashore (CALO). Expected values
are shown within parentheses.
Elevation
Number of
Plants With
Herbivory
Number of
Plants Without
Herbivory
Row Totals
HIGH 73 (62.73) 1 (11.27) 74
IN 55 (65.27) 22 (11.73) 77
Column Totals 128 23 151
0057213
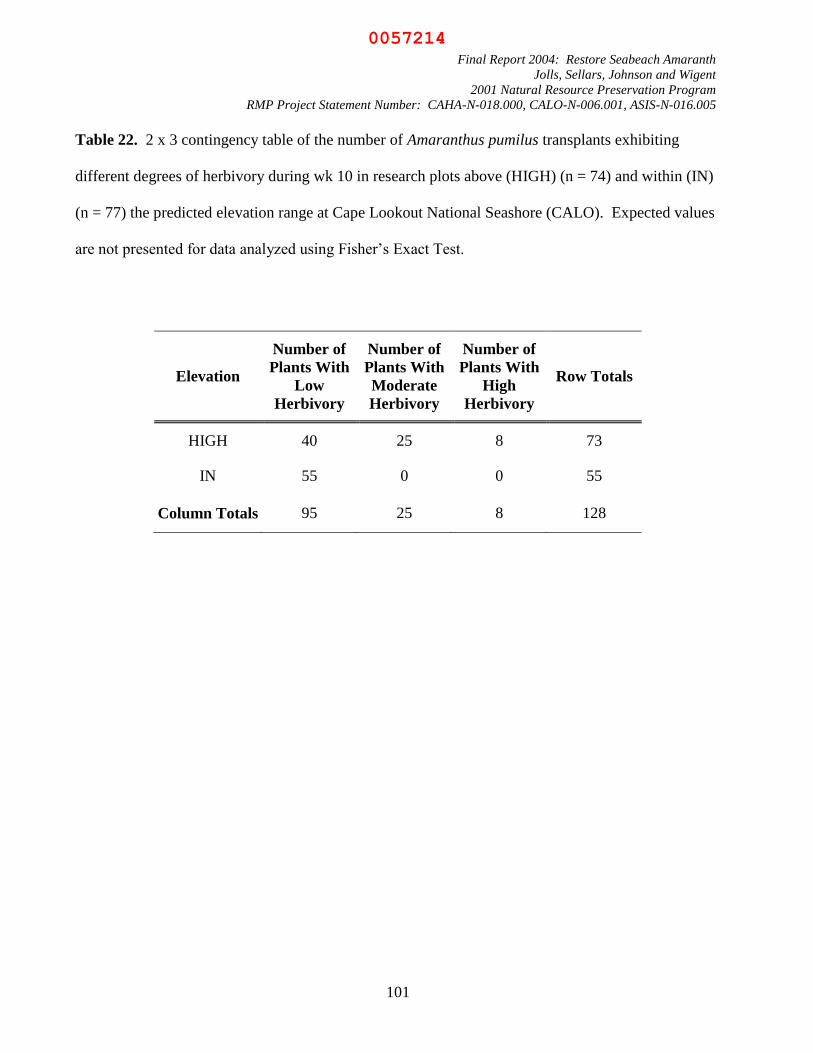
Final Report 2004: Restore Seabeach Amaranth
Jolls, Sellars, Johnson and Wigent
2001 Natural Resource Preservation Program
RMP Project Statement Number: CAHA-N-018.000, CALO-N-006.001, ASIS-N-016.005
101
Table 22. 2 x 3 contingency table of the number of Amaranthus pumilus transplants exhibiting
different degrees of herbivory during wk 10 in research plots above (HIGH) (n = 74) and within (IN)
(n = 77) the predicted elevation range at Cape Lookout National Seashore (CALO). Expected values
are not presented for data analyzed using Fisher‟s Exact Test.
Elevation
Number of
Plants With
Low
Herbivory
Number of
Plants With
Moderate
Herbivory
Number of
Plants With
High
Herbivory
Row Totals
HIGH 40 25 8 73
IN 55 0 0 55
Column Totals 95 25 8 128
0057214
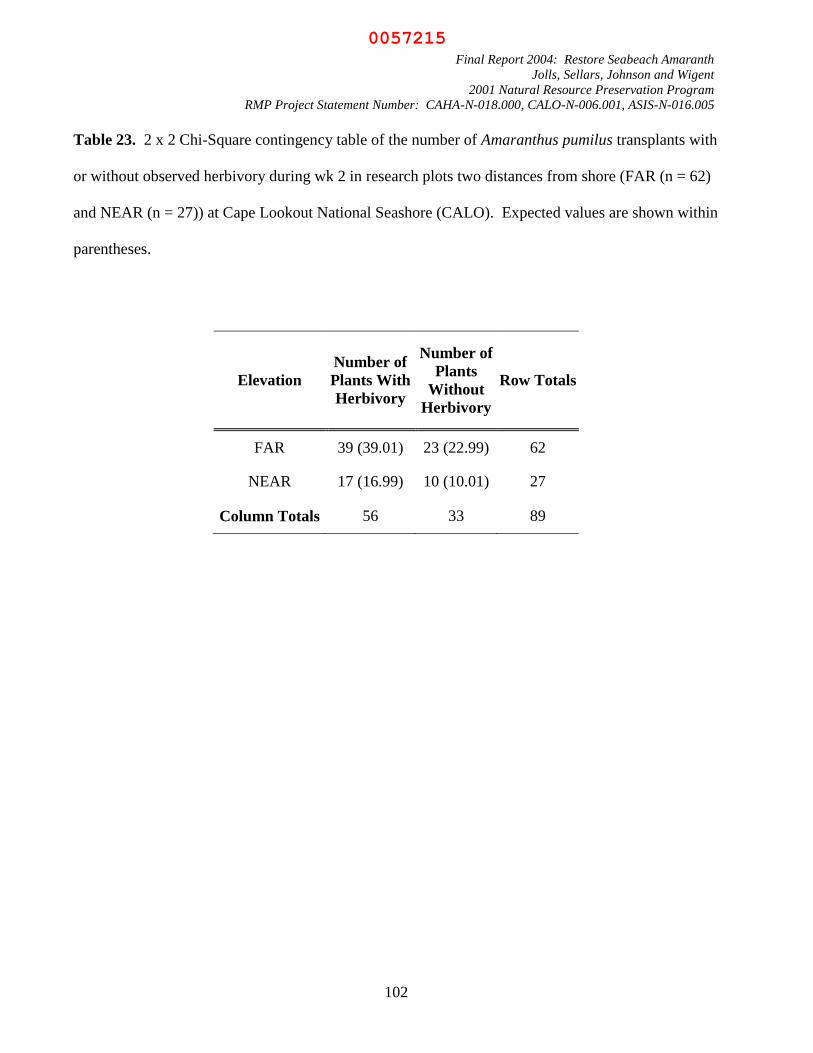
Final Report 2004: Restore Seabeach Amaranth
Jolls, Sellars, Johnson and Wigent
2001 Natural Resource Preservation Program
RMP Project Statement Number: CAHA-N-018.000, CALO-N-006.001, ASIS-N-016.005
102
Table 23. 2 x 2 Chi-Square contingency table of the number of Amaranthus pumilus transplants with
or without observed herbivory during wk 2 in research plots two distances from shore (FAR (n = 62)
and NEAR (n = 27)) at Cape Lookout National Seashore (CALO). Expected values are shown within
parentheses.
Elevation
Number of
Plants With
Herbivory
Number of
Plants
Without
Herbivory
Row Totals
FAR 39 (39.01) 23 (22.99) 62
NEAR 17 (16.99) 10 (10.01) 27
Column Totals 56 33 89
0057215
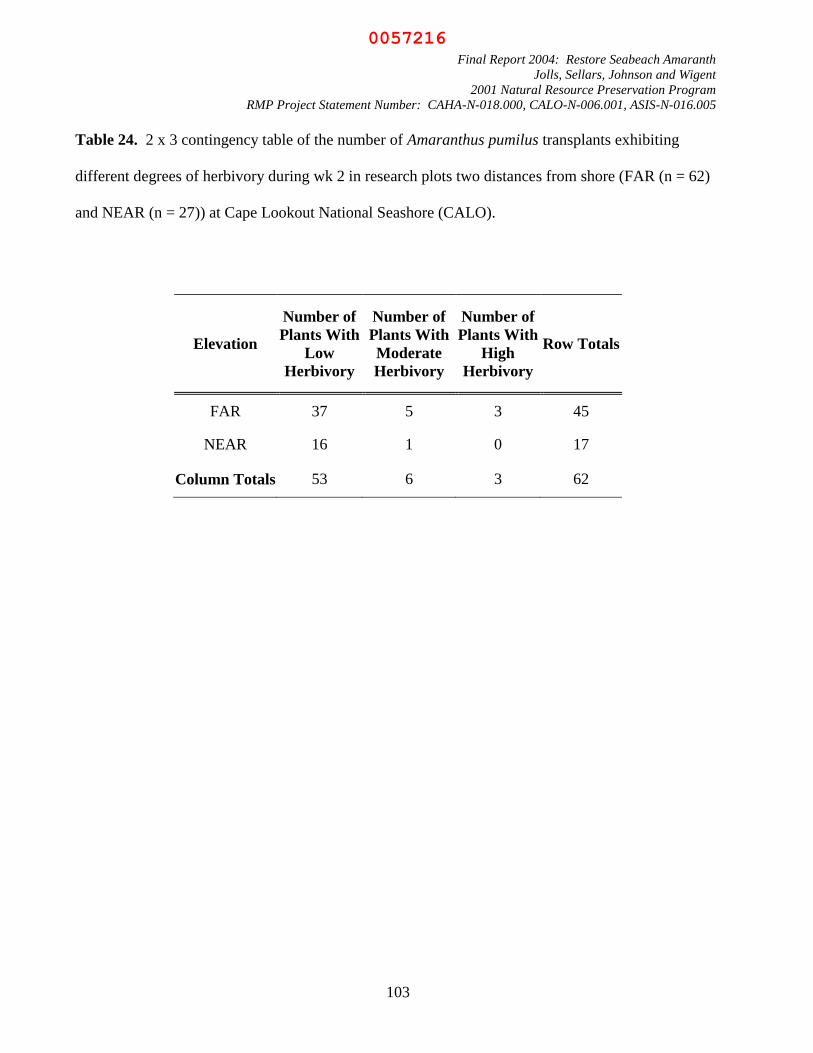
Final Report 2004: Restore Seabeach Amaranth
Jolls, Sellars, Johnson and Wigent
2001 Natural Resource Preservation Program
RMP Project Statement Number: CAHA-N-018.000, CALO-N-006.001, ASIS-N-016.005
103
Table 24. 2 x 3 contingency table of the number of Amaranthus pumilus transplants exhibiting
different degrees of herbivory during wk 2 in research plots two distances from shore (FAR (n = 62)
and NEAR (n = 27)) at Cape Lookout National Seashore (CALO).
Elevation
Number of
Plants With
Low
Herbivory
Number of
Plants With
Moderate
Herbivory
Number of
Plants With
High
Herbivory
Row Totals
FAR 37 5 3 45
NEAR 16 1 0 17
Column Totals 53 6 3 62
0057216
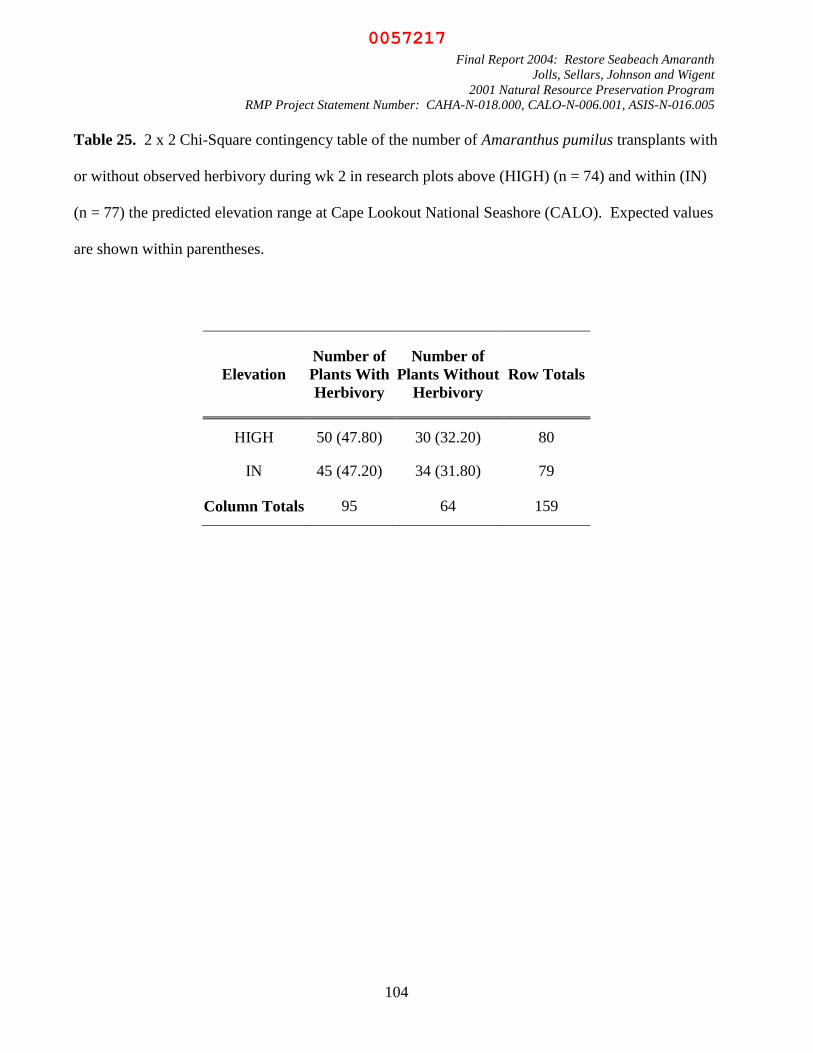
Final Report 2004: Restore Seabeach Amaranth
Jolls, Sellars, Johnson and Wigent
2001 Natural Resource Preservation Program
RMP Project Statement Number: CAHA-N-018.000, CALO-N-006.001, ASIS-N-016.005
104
Table 25. 2 x 2 Chi-Square contingency table of the number of Amaranthus pumilus transplants with
or without observed herbivory during wk 2 in research plots above (HIGH) (n = 74) and within (IN)
(n = 77) the predicted elevation range at Cape Lookout National Seashore (CALO). Expected values
are shown within parentheses.
Elevation
Number of
Plants With
Herbivory
Number of
Plants Without
Herbivory
Row Totals
HIGH 50 (47.80) 30 (32.20) 80
IN 45 (47.20) 34 (31.80) 79
Column Totals 95 64 159
0057217

Final Report 2004: Restore Seabeach Amaranth
Jolls, Sellars, Johnson and Wigent
2001 Natural Resource Preservation Program
RMP Project Statement Number: CAHA-N-018.000, CALO-N-006.001, ASIS-N-016.005
105
Table 26. 2 x 2 Chi-Square contingency table of the number of Amaranthus pumilus transplants
exhibiting different degrees of herbivory during wk 2 in research plots above (HIGH) (n = 74) and
within (IN) (n = 77) the predicted elevation range at Cape Lookout National Seashore (CALO).
Expected values are shown within parentheses.
Elevation
Number of
Plants With
Low Herbivory
Number of
Plants With
Moderate
Herbivory
Row Totals
HIGH 10 (9.62) 0 (0.38) 10
IN 15 (15.38) 1 (0.62) 16
Column Totals 25 1 26
0057218
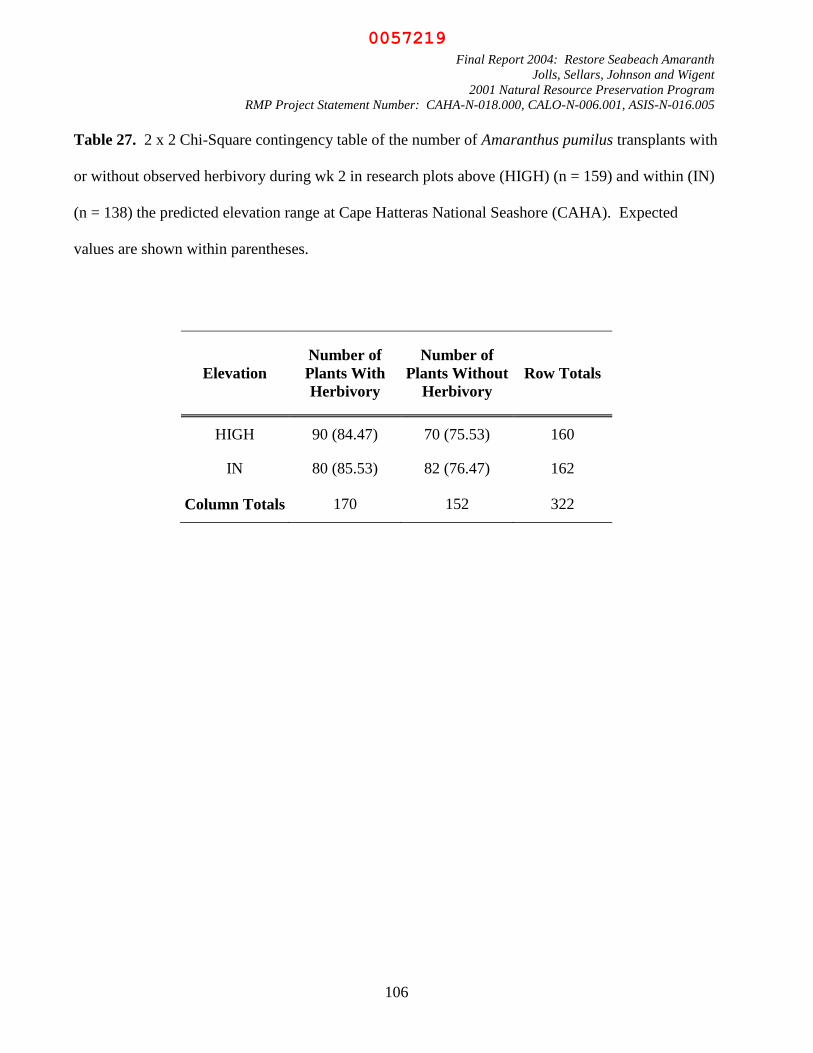
Final Report 2004: Restore Seabeach Amaranth
Jolls, Sellars, Johnson and Wigent
2001 Natural Resource Preservation Program
RMP Project Statement Number: CAHA-N-018.000, CALO-N-006.001, ASIS-N-016.005
106
Table 27. 2 x 2 Chi-Square contingency table of the number of Amaranthus pumilus transplants with
or without observed herbivory during wk 2 in research plots above (HIGH) (n = 159) and within (IN)
(n = 138) the predicted elevation range at Cape Hatteras National Seashore (CAHA). Expected
values are shown within parentheses.
Elevation
Number of
Plants With
Herbivory
Number of
Plants Without
Herbivory
Row Totals
HIGH 90 (84.47) 70 (75.53) 160
IN 80 (85.53) 82 (76.47) 162
Column Totals 170 152 322
0057219

Final Report 2004: Restore Seabeach Amaranth
Jolls, Sellars, Johnson and Wigent
2001 Natural Resource Preservation Program
RMP Project Statement Number: CAHA-N-018.000, CALO-N-006.001, ASIS-N-016.005
107
Table 28. 2 x 2 Chi-Square contingency table of the number of Amaranthus pumilus transplants
exhibiting different degrees of herbivory during wk 2 in research plots above (HIGH) (n = 159) and
within (IN) (n = 138) the predicted elevation range at Cape Hatteras National Seashore (CAHA).
Expected values are shown within parentheses.
Elevation
Number of
Plants With
Low
Herbivory
Number of
Plants With
Moderate
Herbivory
Row Totals
HIGH 65 (75.18) 25 (14.82) 90
IN 77 (66.82) 3 (13.18) 80
Column Total 142 28 170
0057220
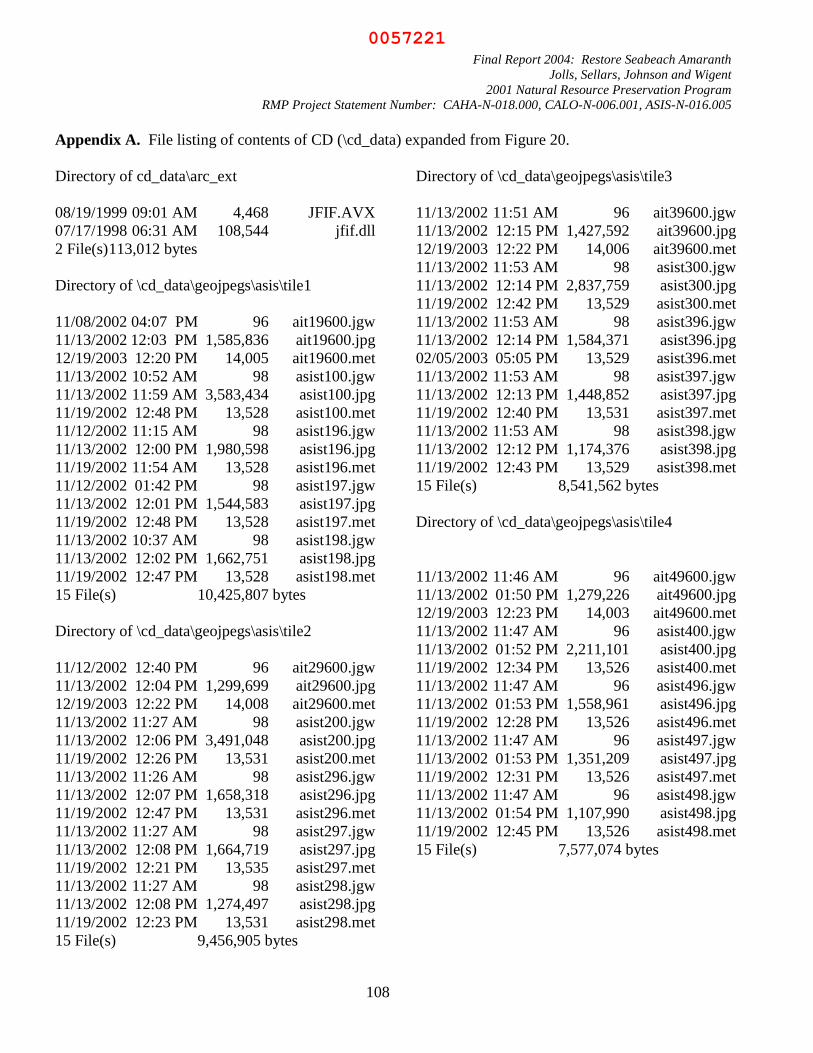
Final Report 2004: Restore Seabeach Amaranth
Jolls, Sellars, Johnson and Wigent
2001 Natural Resource Preservation Program
RMP Project Statement Number: CAHA-N-018.000, CALO-N-006.001, ASIS-N-016.005
108
Appendix A. File listing of contents of CD (\cd_data) expanded from Figure 20.
Directory of cd_data\arc_ext
08/19/1999 09:01 AM 4,468 JFIF.AVX
07/17/1998 06:31 AM 108,544 jfif.dll
2 File(s) 113,012 bytes
Directory of \cd_data\geojpegs\asis\tile1
11/08/2002 04:07 PM 96 ait19600.jgw
11/13/2002 12:03 PM 1,585,836 ait19600.jpg
12/19/2003 12:20 PM 14,005 ait19600.met
11/13/2002 10:52 AM 98 asist100.jgw
11/13/2002 11:59 AM 3,583,434 asist100.jpg
11/19/2002 12:48 PM 13,528 asist100.met
11/12/2002 11:15 AM 98 asist196.jgw
11/13/2002 12:00 PM 1,980,598 asist196.jpg
11/19/2002 11:54 AM 13,528 asist196.met
11/12/2002 01:42 PM 98 asist197.jgw
11/13/2002 12:01 PM 1,544,583 asist197.jpg
11/19/2002 12:48 PM 13,528 asist197.met
11/13/2002 10:37 AM 98 asist198.jgw
11/13/2002 12:02 PM 1,662,751 asist198.jpg
11/19/2002 12:47 PM 13,528 asist198.met
15 File(s) 10,425,807 bytes
Directory of \cd_data\geojpegs\asis\tile2
11/12/2002 12:40 PM 96 ait29600.jgw
11/13/2002 12:04 PM 1,299,699 ait29600.jpg
12/19/2003 12:22 PM 14,008 ait29600.met
11/13/2002 11:27 AM 98 asist200.jgw
11/13/2002 12:06 PM 3,491,048 asist200.jpg
11/19/2002 12:26 PM 13,531 asist200.met
11/13/2002 11:26 AM 98 asist296.jgw
11/13/2002 12:07 PM 1,658,318 asist296.jpg
11/19/2002 12:47 PM 13,531 asist296.met
11/13/2002 11:27 AM 98 asist297.jgw
11/13/2002 12:08 PM 1,664,719 asist297.jpg
11/19/2002 12:21 PM 13,535 asist297.met
11/13/2002 11:27 AM 98 asist298.jgw
11/13/2002 12:08 PM 1,274,497 asist298.jpg
11/19/2002 12:23 PM 13,531 asist298.met
15 File(s) 9,456,905 bytes
Directory of \cd_data\geojpegs\asis\tile3
11/13/2002 11:51 AM 96 ait39600.jgw
11/13/2002 12:15 PM 1,427,592 ait39600.jpg
12/19/2003 12:22 PM 14,006 ait39600.met
11/13/2002 11:53 AM 98 asist300.jgw
11/13/2002 12:14 PM 2,837,759 asist300.jpg
11/19/2002 12:42 PM 13,529 asist300.met
11/13/2002 11:53 AM 98 asist396.jgw
11/13/2002 12:14 PM 1,584,371 asist396.jpg
02/05/2003 05:05 PM 13,529 asist396.met
11/13/2002 11:53 AM 98 asist397.jgw
11/13/2002 12:13 PM 1,448,852 asist397.jpg
11/19/2002 12:40 PM 13,531 asist397.met
11/13/2002 11:53 AM 98 asist398.jgw
11/13/2002 12:12 PM 1,174,376 asist398.jpg
11/19/2002 12:43 PM 13,529 asist398.met
15 File(s) 8,541,562 bytes
Directory of \cd_data\geojpegs\asis\tile4
11/13/2002 11:46 AM 96 ait49600.jgw
11/13/2002 01:50 PM 1,279,226 ait49600.jpg
12/19/2003 12:23 PM 14,003 ait49600.met
11/13/2002 11:47 AM 96 asist400.jgw
11/13/2002 01:52 PM 2,211,101 asist400.jpg
11/19/2002 12:34 PM 13,526 asist400.met
11/13/2002 11:47 AM 96 asist496.jgw
11/13/2002 01:53 PM 1,558,961 asist496.jpg
11/19/2002 12:28 PM 13,526 asist496.met
11/13/2002 11:47 AM 96 asist497.jgw
11/13/2002 01:53 PM 1,351,209 asist497.jpg
11/19/2002 12:31 PM 13,526 asist497.met
11/13/2002 11:47 AM 96 asist498.jgw
11/13/2002 01:54 PM 1,107,990 asist498.jpg
11/19/2002 12:45 PM 13,526 asist498.met
15 File(s) 7,577,074 bytes
0057221

Final Report 2004: Restore Seabeach Amaranth
Jolls, Sellars, Johnson and Wigent
2001 Natural Resource Preservation Program
RMP Project Statement Number: CAHA-N-018.000, CALO-N-006.001, ASIS-N-016.005
109
Appendix A (continued).
Directory of \cd_data\geojpegs\caha\tile_1
02/05/2003 11:35 PM 96 cahat100.jgw
02/05/2003 11:38 PM 1,102,826 cahat100.jpg
01/29/2003 06:15 PM 12,492 cahat100.met
01/08/2002 02:38 PM 96 cahat197.jgw
02/05/2003 12:19 PM 1,491,533 cahat197.jpg
02/11/2003 09:53 AM 13,736 cahat197.met
01/08/2002 02:54 PM 96 cahat198.jgw
01/08/2002 03:05 PM 1,192,714 cahat198.jpg
01/29/2003 06:34 PM 13,536 cahat198.met
12/04/2002 11:39 AM 96 cahat199.jgw
12/04/2002 11:38 AM 1,118,044 cahat199.jpg
01/29/2003 06:49 PM 13,536 cahat199.met
02/05/2003 02:21 PM 96 cht19700.jgw
02/05/2003 02:50 PM 1,085,071 cht19700.jpg
12/19/2003 12:23 PM 14,013 cht19700.met
15 File(s) 6,057,981 bytes
Directory of \cd_data\geojpegs\caha\tile_2
02/05/2003 11:50 PM 96 cahat200.jgw
02/05/2003 11:55 PM 919,503 cahat200.jpg
02/06/2003 12:14 AM 12,491 cahat200.met
01/08/2002 03:42 PM 96 cahat297.jgw
02/05/2003 01:21 PM 1,280,049 cahat297.jpg
02/11/2003 09:58 AM 13,741 cahat297.met
01/08/2002 03:45 PM 96 cahat298.jgw
01/08/2002 03:49 PM 988,590 cahat298.jpg
01/29/2003 06:37 PM 13,535 cahat298.met
12/04/2002 12:00 PM 96 cahat299.jgw
12/04/2002 10:15 AM 912,252 cahat299.jpg
01/29/2003 06:37 PM 13,535 cahat299.met
02/05/2003 02:30 PM 98 cht29700.jgw
02/05/2003 02:59 PM 997,339 cht29700.jpg
12/19/2003 12:24 PM 14,012 cht29700.met
15 File(s) 5,165,529 bytes
Directory of \cd_data\geojpegs\caha\tile_3
02/05/2003 11:50 PM 94 cahat300.jgw
02/06/2003 12:00 AM 781,933 cahat300.jpg
02/06/2003 12:16 AM 12,492 cahat300.met
01/08/2002 04:07 PM 94 cahat397.jgw
02/05/2003 01:23 PM 1,042,845 cahat397.jpg
02/11/2003 09:57 AM 13,739 cahat397.met
01/08/2002 04:08 PM 96 cahat398.jgw
01/08/2002 04:10 PM 1,268,655 cahat398.jpg
01/29/2003 06:44 PM 13,536 cahat398.met
12/04/2002 12:01 PM 96 cahat399.jgw
12/04/2002 10:20 AM 812,317 cahat399.jpg
01/29/2003 06:45 PM 13,536 cahat399.met
02/05/2003 02:30 PM 96 cht39700.jgw
02/05/2003 03:00 PM 915,804 cht39700.jpg
12/19/2003 12:24 PM 14,013 cht39700.met
15 File(s) 4,889,346 bytes
Directory of \cd_data\geojpegs\caha\tile_4
02/05/2003 11:51 PM 94 cahat400.jgw
02/06/2003 12:02 AM 590,200 cahat400.jpg
02/06/2003 12:18 AM 12,491 cahat400.met
01/08/2002 04:46 PM 94 cahat497.jgw
02/05/2003 01:59 PM 837,904 cahat497.jpg
02/11/2003 09:56 AM 13,738 cahat497.met
02/05/2003 11:51 PM 94 cahat498.jgw
01/08/2002 05:03 PM 938,063 cahat498.jpg
01/29/2003 06:46 PM 13,535 cahat498.met
12/04/2002 12:59 PM 96 cahat499.jgw
12/04/2002 10:23 AM 703,556 cahat499.jpg
01/29/2003 06:46 PM 13,535 cahat499.met
02/05/2003 02:31 PM 96 cht49700.jgw
02/05/2003 03:02 PM 691,672 cht49700.jpg
12/19/2003 12:24 PM 14,012 cht49700.met
15 File(s) 3,829,180 bytes
0057222
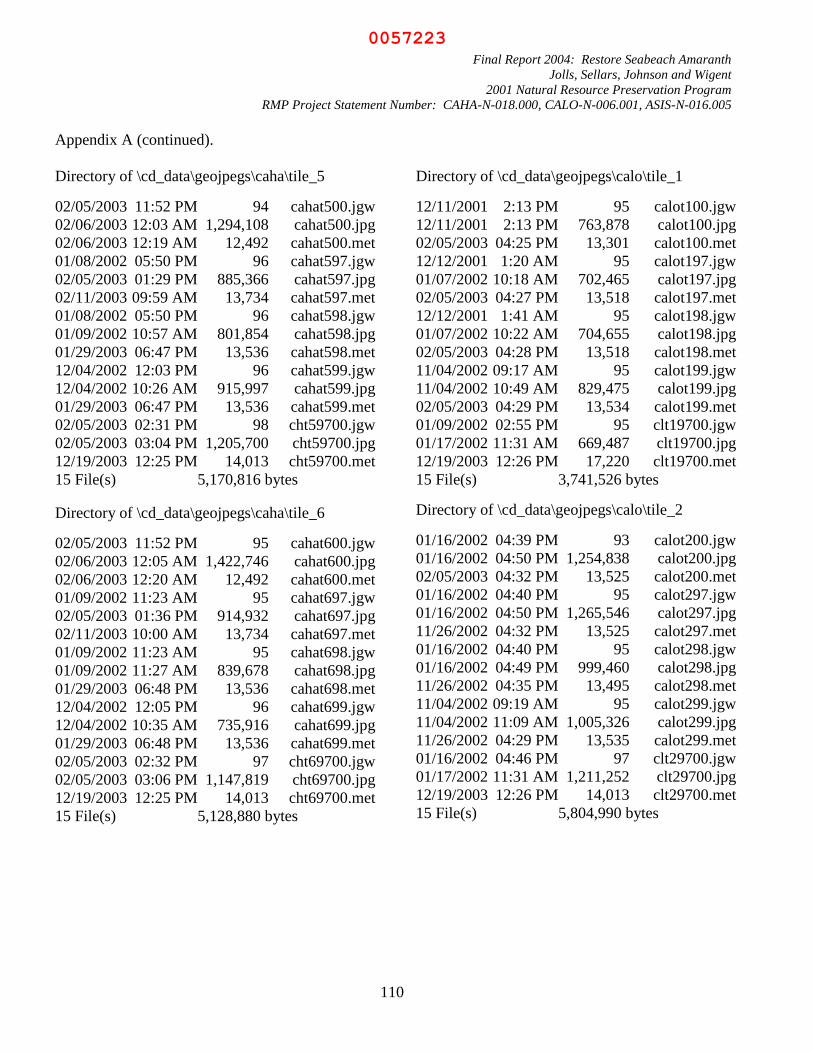
Final Report 2004: Restore Seabeach Amaranth
Jolls, Sellars, Johnson and Wigent
2001 Natural Resource Preservation Program
RMP Project Statement Number: CAHA-N-018.000, CALO-N-006.001, ASIS-N-016.005
110
Appendix A (continued).
Directory of \cd_data\geojpegs\caha\tile_5
02/05/2003 11:52 PM 94 cahat500.jgw
02/06/2003 12:03 AM 1,294,108 cahat500.jpg
02/06/2003 12:19 AM 12,492 cahat500.met
01/08/2002 05:50 PM 96 cahat597.jgw
02/05/2003 01:29 PM 885,366 cahat597.jpg
02/11/2003 09:59 AM 13,734 cahat597.met
01/08/2002 05:50 PM 96 cahat598.jgw
01/09/2002 10:57 AM 801,854 cahat598.jpg
01/29/2003 06:47 PM 13,536 cahat598.met
12/04/2002 12:03 PM 96 cahat599.jgw
12/04/2002 10:26 AM 915,997 cahat599.jpg
01/29/2003 06:47 PM 13,536 cahat599.met
02/05/2003 02:31 PM 98 cht59700.jgw
02/05/2003 03:04 PM 1,205,700 cht59700.jpg
12/19/2003 12:25 PM 14,013 cht59700.met
15 File(s) 5,170,816 bytes
Directory of \cd_data\geojpegs\caha\tile_6
02/05/2003 11:52 PM 95 cahat600.jgw
02/06/2003 12:05 AM 1,422,746 cahat600.jpg
02/06/2003 12:20 AM 12,492 cahat600.met
01/09/2002 11:23 AM 95 cahat697.jgw
02/05/2003 01:36 PM 914,932 cahat697.jpg
02/11/2003 10:00 AM 13,734 cahat697.met
01/09/2002 11:23 AM 95 cahat698.jgw
01/09/2002 11:27 AM 839,678 cahat698.jpg
01/29/2003 06:48 PM 13,536 cahat698.met
12/04/2002 12:05 PM 96 cahat699.jgw
12/04/2002 10:35 AM 735,916 cahat699.jpg
01/29/2003 06:48 PM 13,536 cahat699.met
02/05/2003 02:32 PM 97 cht69700.jgw
02/05/2003 03:06 PM 1,147,819 cht69700.jpg
12/19/2003 12:25 PM 14,013 cht69700.met
15 File(s) 5,128,880 bytes
Directory of \cd_data\geojpegs\calo\tile_1
12/11/2001 2:13 PM 95 calot100.jgw
12/11/2001 2:13 PM 763,878 calot100.jpg
02/05/2003 04:25 PM 13,301 calot100.met
12/12/2001 1:20 AM 95 calot197.jgw
01/07/2002 10:18 AM 702,465 calot197.jpg
02/05/2003 04:27 PM 13,518 calot197.met
12/12/2001 1:41 AM 95 calot198.jgw
01/07/2002 10:22 AM 704,655 calot198.jpg
02/05/2003 04:28 PM 13,518 calot198.met
11/04/2002 09:17 AM 95 calot199.jgw
11/04/2002 10:49 AM 829,475 calot199.jpg
02/05/2003 04:29 PM 13,534 calot199.met
01/09/2002 02:55 PM 95 clt19700.jgw
01/17/2002 11:31 AM 669,487 clt19700.jpg
12/19/2003 12:26 PM 17,220 clt19700.met
15 File(s) 3,741,526 bytes
Directory of \cd_data\geojpegs\calo\tile_2
01/16/2002 04:39 PM 93 calot200.jgw
01/16/2002 04:50 PM 1,254,838 calot200.jpg
02/05/2003 04:32 PM 13,525 calot200.met
01/16/2002 04:40 PM 95 calot297.jgw
01/16/2002 04:50 PM 1,265,546 calot297.jpg
11/26/2002 04:32 PM 13,525 calot297.met
01/16/2002 04:40 PM 95 calot298.jgw
01/16/2002 04:49 PM 999,460 calot298.jpg
11/26/2002 04:35 PM 13,495 calot298.met
11/04/2002 09:19 AM 95 calot299.jgw
11/04/2002 11:09 AM 1,005,326 calot299.jpg
11/26/2002 04:29 PM 13,535 calot299.met
01/16/2002 04:46 PM 97 clt29700.jgw
01/17/2002 11:31 AM 1,211,252 clt29700.jpg
12/19/2003 12:26 PM 14,013 clt29700.met
15 File(s) 5,804,990 bytes
0057223

Final Report 2004: Restore Seabeach Amaranth
Jolls, Sellars, Johnson and Wigent
2001 Natural Resource Preservation Program
RMP Project Statement Number: CAHA-N-018.000, CALO-N-006.001, ASIS-N-016.005
111
Appendix A (continued).
Directory of \cd_data\geojpegs\calo\tile_3
01/07/2002 01:06 PM 96 calot397.jgw
01/07/2002 01:12 PM 1,386,817 calot397.jpg
02/05/2003 04:13 PM 13,520 calot397.met
01/07/2002 12:56 PM 94 calot398.jgw
01/07/2002 01:13 PM 1,125,891 calot398.jpg
02/05/2003 04:37 PM 13,520 calot398.met
11/04/2002 09:23 AM 96 calot399.jgw
11/04/2002 11:14 AM 1,190,958 calot399.jpg
11/26/2002 04:40 PM 13,536 calot399.met
11/04/2002 09:23 AM 96 clt39799.jgw
11/04/2002 11:30 AM 1,210,397 clt39799.jpg
12/19/2003 12:27 PM 14,013 clt39799.met
12 File(s) 4,969,034 bytes
Directory of \cd_data\geojpegs\calo\tile_4
01/07/2002 03:19 PM 96 calot497.jgw
01/07/2002 03:31 PM 1,810,841 calot497.jpg
02/05/2003 04:18 PM 13,520 calot497.met
01/07/2002 03:26 PM 94 calot498.jgw
01/07/2002 03:31 PM 1,544,167 calot498.jpg
02/05/2003 04:20 PM 13,519 calot498.met
11/04/2002 09:30 AM 96 calot499.jgw
11/04/2002 11:18 AM 1,554,431 calot499.jpg
02/05/2003 04:22 PM 13,536 calot499.met
11/04/2002 09:30 AM 96 clt49799.jgw
11/04/2002 11:33 AM 1,620,981 clt49799.jpg
12/19/2003 12:27 PM 14,015 clt49799.met
12 File(s) 6,585,392 bytes
Directory of \cd_data\geojpegs\calo\tile_5
01/07/2002 03:59 PM 96 calot597.jgw
01/07/2002 04:03 PM 1,597,830 calot597.jpg
02/05/2003 04:47 PM 13,520 calot597.met
01/07/2002 03:51 PM 96 calot598.jgw
01/07/2002 04:04 PM 1,393,454 calot598.jpg
02/05/2003 04:48 PM 13,520 calot598.met
11/04/2002 09:39 AM 96 calot599.jgw
11/04/2002 11:22 AM 1,392,337 calot599.jpg
02/05/2003 04:49 PM 13,536 calot599.met
11/04/2002 09:39 AM 96 clt59799.jgw
11/04/2002 11:38 AM 1,513,794 clt59799.jpg
12/19/2003 12:27 PM 14,013 clt59799.met
12 File(s) 5,952,388 bytes
Directory of \cd_data\geojpegs\calo\tile_6
01/07/2002 05:18 PM 96 calot697.jgw
01/07/2002 05:12 PM 1,443,315 calot697.jpg
02/05/2003 04:53 PM 13,520 calot697.met
01/07/2002 05:19 PM 96 calot698.jgw
01/07/2002 05:15 PM 1,562,229 calot698.jpg
02/05/2003 04:54 PM 13,520 calot698.met
11/04/2002 09:51 AM 96 calot699.jgw
11/04/2002 11:26 AM 1,202,277 calot699.jpg
11/26/2002 05:24 PM 13,536 calot699.met
11/04/2002 09:51 AM 96 clt69799.jgw
11/04/2002 11:41 AM 1,436,461 clt69799.jpg
12/19/2003 12:27 PM 14,013 clt69799.met
12 File(s) 5,699,255 bytes
0057224

Final Report 2004: Restore Seabeach Amaranth
Jolls, Sellars, Johnson and Wigent
2001 Natural Resource Preservation Program
RMP Project Statement Number: CAHA-N-018.000, CALO-N-006.001, ASIS-N-016.005
112
Appendix A (continued).
Directory of \cd_data\gps_data\caha
12/05/2002 11:53 AM 244 caha2000.dbf
12/06/2002 12:28 PM 6,660 caha2000.met
12/05/2002 11:24 AM 164 caha2000.sbn
12/05/2002 11:24 AM 124 caha2000.sbx
12/05/2002 11:24 AM 156 caha2000.shp
12/05/2002 11:24 AM 116 caha2000.shx
12/05/2002 11:52 AM 2,706 caha2001.dbf
12/06/2002 12:27 PM 6,660 caha2001.met
12/05/2002 11:24 AM 8,764 caha2001.sbn
12/05/2002 11:24 AM 156 caha2001.sbx
12/05/2002 11:24 AM 1,584 caha2001.shp
12/05/2002 11:24 AM 524 caha2001.shx
12/04/2003 10:40 AM 7,994 caha2002.dbf
12/06/2002 12:29 PM 6,660 caha2002.met
12/05/2002 11:25 AM 9,308 caha2002.sbn
12/05/2002 11:25 AM 164 caha2002.sbx
12/05/2002 11:25 AM 3,460 caha2002.shp
12/05/2002 11:25 AM 1,060 caha2002.shx
12/04/2003 11:20 AM 2,779 caha2003.dbf
09/09/2003 12:15 PM 6,660 caha2003.met
09/09/2003 12:08 PM 7,980 caha2003.sbn
09/09/2003 12:08 PM 188 caha2003.sbx
09/09/2003 12:08 PM 1,640 caha2003.shp
09/09/2003 12:08 PM 540 caha2003.shx
09/09/2003 12:43 PM 3,762 cahaplot.dbf
09/09/2003 12:52 PM 6,495 cahaplot.met
09/09/2003 12:43 PM 5,732 cahaplot.sbn
09/09/2003 12:43 PM 212 cahaplot.sbx
09/09/2003 12:43 PM 4,132 cahaplot.shp
09/09/2003 12:43 PM 1,252 cahaplot.shx
30 File(s) 97,876 bytes
0057225

Final Report 2004: Restore Seabeach Amaranth
Jolls, Sellars, Johnson and Wigent
2001 Natural Resource Preservation Program
RMP Project Statement Number: CAHA-N-018.000, CALO-N-006.001, ASIS-N-016.005
113
Appendix A (continued).
Directory of \cd_data\gps_data\calo
11/25/2003 01:16 PM 20,182 calo2000.dbf
12/05/2002 03:18 PM 6,633 calo2000.met
12/05/2002 11:36 AM 2,276 calo2000.sbn
12/05/2002 11:36 AM 140 calo2000.sbx
12/05/2002 11:36 AM 660 calo2000.shp
12/05/2002 11:36 AM 260 calo2000.shx
12/05/2002 11:32 AM 7,386 calo2001.dbf
12/05/2002 03:15 PM 6,633 calo2001.met
12/05/2002 11:23 AM 8,388 calo2001.sbn
12/05/2002 11:23 AM 212 calo2001.sbx
12/05/2002 11:23 AM 4,804 calo2001.shp
12/05/2002 11:23 AM 1,444 calo2001.shx
11/25/2003 03:35 PM 14,352 calo2002.dbf
12/05/2002 03:11 PM 6,633 calo2002.met
12/05/2002 11:24 AM 9,756 calo2002.sbn
12/05/2002 11:24 AM 284 calo2002.sbx
12/05/2002 11:24 AM 9,340 calo2002.shp
12/05/2002 11:24 AM 2,740 calo2002.shx
09/08/2003 04:51 PM 19,098 calo2003.dbf
09/08/2003 03:54 PM 6,633 calo2003.met
09/08/2003 04:51 PM 12,532 calo2003.sbn
09/08/2003 04:51 PM 220 calo2003.sbx
09/08/2003 04:51 PM 14,828 calo2003.shp
09/08/2003 04:51 PM 4,308 calo2003.shx
09/09/2003 12:43 PM 3,510 caloplot.dbf
09/09/2003 12:59 PM 6,494 caloplot.met
09/09/2003 12:43 PM 8,204 caloplot.sbn
09/09/2003 12:43 PM 244 caloplot.sbx
09/09/2003 12:43 PM 3,124 caloplot.shp
09/09/2003 12:43 PM 964 caloplot.shx
30 File(s) 182,282 bytes
Directory of \cd_data\mhwshape\asis_mhw
11/26/2002 12:41 PM 523 aimhw_00.dbf
12/19/2003 02:23 PM 6,305 aimhw_00.met
11/26/2002 12:41 PM 4,404 aimhw_00.sbn
11/26/2002 12:41 PM 164 aimhw_00.sbx
11/26/2002 12:41 PM 1,183,260 aimhw_00.shp
11/26/2002 12:41 PM 236 aimhw_00.shx
11/26/2002 12:42 PM 923 aimhw_96.dbf
12/19/2003 02:06 PM 6,305 aimhw_96.met
11/26/2002 12:42 PM 4,572 aimhw_96.sbn
11/26/2002 12:42 PM 204 aimhw_96.sbx
11/26/2002 12:42 PM 1,188,108 aimhw_96.shp
11/26/2002 12:42 PM 364 aimhw_96.shx
11/26/2002 12:42 PM 448 aimhw_97.dbf
12/19/2003 02:20 PM 6,305 aimhw_97.met
11/26/2002 12:42 PM 268 aimhw_97.sbn
11/26/2002 12:42 PM 132 aimhw_97.sbx
11/26/2002 12:42 PM 1,082,500 aimhw_97.shp
11/26/2002 12:42 PM 212 aimhw_97.shx
11/26/2002 12:41 PM 548 aimhw_98.dbf
12/19/2003 02:20 PM 6,305 aimhw_98.met
11/26/2002 12:41 PM 412 aimhw_98.sbn
11/26/2002 12:41 PM 148 aimhw_98.sbx
11/26/2002 12:41 PM 1,171,492 aimhw_98.shp
11/26/2002 12:41 PM 244 aimhw_98.shx
24 File(s) 4,664,382 bytes
0057226

Final Report 2004: Restore Seabeach Amaranth
Jolls, Sellars, Johnson and Wigent
2001 Natural Resource Preservation Program
RMP Project Statement Number: CAHA-N-018.000, CALO-N-006.001, ASIS-N-016.005
114
Appendix A (continued).
Directory of \cd_data\mhwshape\caha_mhw
01/28/2003 01:56 PM 3,798 chmhw_00.dbf
12/19/2003 02:32 PM 6,318 chmhw_00.met
01/28/2003 01:56 PM 1,303,444 chmhw_00.shp
01/28/2003 01:56 PM 1,284 chmhw_00.shx
01/16/2002 09:55 AM 398 chmhw_96.dbf
12/19/2003 02:33 PM 6,318 chmhw_96.met
01/16/2002 09:55 AM 356 chmhw_96.sbn
01/16/2002 09:55 AM 140 chmhw_96.sbx
01/16/2002 09:55 AM 381,188 chmhw_96.shp
01/16/2002 09:55 AM 196 chmhw_96.shx
01/16/2002 11:12 AM 323 chmhw_97.dbf
12/19/2003 02:33 PM 6,318 chmhw_97.met
01/16/2002 11:12 AM 228 chmhw_97.sbn
01/16/2002 11:12 AM 132 chmhw_97.sbx
01/16/2002 11:12 AM 1,256,816 chmhw_97.shp
01/16/2002 11:12 AM 172 chmhw_97.shx
01/16/2002 11:20 AM 373 chmhw_98.dbf
12/19/2003 02:33 PM 6,318 chmhw_98.met
01/16/2002 11:20 AM 244 chmhw_98.sbn
01/16/2002 11:20 AM 132 chmhw_98.sbx
01/16/2002 11:20 AM 1,328,556 chmhw_98.shp
01/16/2002 11:20 AM 188 chmhw_98.shx
02/26/2002 09:45 AM 373 chmhw_99.dbf
12/19/2003 02:32 PM 6,318 chmhw_99.met
02/26/2002 09:45 AM 244 chmhw_99.sbn
02/26/2002 09:45 AM 132 chmhw_99.sbx
02/26/2002 09:45 AM 1,383,228 chmhw_99.shp
02/26/2002 09:45 AM 188 chmhw_99.shx
28 File(s) 5,693,723 bytes
Directory of \cd_data\mhwshape\calo_mhw
01/15/2002 03:45 PM 2,073 clmhw_00.dbf
12/19/2003 02:47 PM 6,316 clmhw_00.met
01/15/2002 03:45 PM 6,300 clmhw_00.sbn
01/15/2002 03:45 PM 204 clmhw_00.sbx
01/15/2002 03:45 PM 536,220 clmhw_00.shp
01/15/2002 03:45 PM 732 clmhw_00.shx
01/15/2002 03:27 PM 2,023 clmhw_97.dbf
12/19/2003 02:46 PM 6,316 clmhw_97.met
01/15/2002 03:27 PM 8,828 clmhw_97.sbn
01/15/2002 03:27 PM 180 clmhw_97.sbx
01/15/2002 03:27 PM 1,635,516 clmhw_97.shp
01/15/2002 03:27 PM 716 clmhw_97.shx
01/15/2002 03:30 PM 2,273 clmhw_98.dbf
12/19/2003 02:47 PM 6,316 clmhw_98.met
01/15/2002 03:30 PM 8,916 clmhw_98.sbn
01/15/2002 03:30 PM 188 clmhw_98.sbx
01/15/2002 03:30 PM 1,707,404 clmhw_98.shp
01/15/2002 03:30 PM 796 clmhw_98.shx
01/21/2003 11:14 AM 723 clmhw_99.dbf
12/19/2003 02:47 PM 6,316 clmhw_99.met
01/21/2003 11:14 AM 1,877,292 clmhw_99.shp
01/21/2003 11:14 AM 300 clmhw_99.shx
22 File(s) 5,815,948 bytes
Directory of \cd_data\pptfiles
12/15/2003 04:24 PM 2,463,744 lidar.ppt
1 File(s) 2,463,744 bytes
Directory of \cd_data\report
10/22/2001 06.15 PM 404,992 Interim_Report_10_22_2001.doc
10/02/2002 12:41 PM 1,143,808 Interim_Report_10_02_2002.doc
10/10/2003 12:30 PM 2,260,992 Interim_Report_10_7_2003.doc
09/21/2004 04:33 PM 10,843 Final_Presentation_8_13_2003_edited.ppt
47 File(s) 11,270,819 bytes
0057227