Embed Size (px)
Citation preview

Restoration of Prime Farmland Disturbed by Mineral Sand Mining
in the Upper Coastal Plain of Virginia
Philip D. Schroeder
Thesis submitted to the Faculty of the
Virginia Polytechnic Institute and State University
in partial fulfillment of the requirements for the degree of
Master of Science
in
Crop and Soil Environmental Sciences
APPROVED:
W. L. Daniels, Chair
M. M. Alley
J. C. Baker
L. W. Zelazny
February 19, 1997
Blacksburg, Virginia

Restoration of Prime Farmland Disturbed by Mineral Sand Mining
in the Upper Coastal Plain of Virginia
by
Philip D. Schroeder
W. Lee Daniels, Chairman
Crop and Soil Environmental Sciences
(ABSTRACT)
Economic deposits of heavy mineral sand were identified in the late 1980's under prime
farmland along the Upper Coastal Plain of Virginia. Mining in Virginia will commence in 1997 on
the Old Hickory Deposit in Dinwiddie/Sussex Counties. Experiments were established on two
mine pits representing two likely pit closure scenarios; regrading the surface with unprocessed
subsoil (Pit 1) or filling to the surface with processed material (Pit 3). To evaluate topsoil
replacement vs. organic amendment, each pit was split into two experiments, and an adjacent
undisturbed control was established. One half of each pit was covered with approximately 30 cm
of topsoil, and the other half of each pit received 112 Mg ha of yard waste compost. The -1
experiment was double-cropped with wheat ( Triticum vulgare) and soybeans (Glycine max) in
1995/1996. The control and Topsoil treatment on Pit 1 produced the highest wheat yield, but
soybean yield was highest on the Control and the Topsoil and Compost treatments on Pit 3.
Wheat yield was positively related to root length, while soybean yield varied with soil bulk
density. Soybean rooting was found throughout all horizons in the undisturbed soils, but was
limited to the surface 20 to 40 cm in all mine soil treatments. Very wet weather masked treatment
effects in both crops, but the physical and chemical properties of the mine soils indicate that the
key to reclaiming these areas lies in effective remixing of mined materials, and developing and
maintaining soil humus levels.

iii
Acknowledgments
I would like to thank my major professor, Dr. W. Lee Daniels, for the opportunity to
pursue this project and for his infinite patience and friendship. Thanks to Dr. Mark Alley for his
helpful advice on agronomic topics and constant encouragement. I also greatly appreciate the
advice and input of Dr. Lucian Zelazny for whom I have the utmost respect as both a teacher and
a scientist. I would also like to thank Dr. James Baker for all his help, encouragement, and good
natured approach to life and science. I am very grateful to Mr. Ronnie Alls and Mr. Jim
Hammons for their invaluable help in the field. Thanks to Mike Genthner and Velva Groover for
their early work on this project and their continued support. I would like to acknowledge my
friend, Dr. Barry Stewart, for his advice and friendship. Thanks to Mr. Steve Nagle for his help in
the field and patience in the lab. I also greatly appreciate the friendship and assistance of Dr. Ren-
sheng Li who, through his knowledge and willingness to help, added greatly to this study. Finally,
thanks to Mr. W.T. Price for all his help in the lab and for his friendship.
I would like to thank RGC (USA) Mineral Sands for funding this study and for their help
in coordinating field work. I would especially like to thank Charles Saunders, Russell Clark, and
Lamar Clemons at the Old Hickory Project. I would also like to thank Mr Francis Barnes for his
help in tillage operations and his interest in this study. The long term support of Mr. Elliot Mallard
and Mr. Denis Brooks are also appreciated.
Finally I would like to thank my parents for their never-ending love and faith in me, and
their willingness to support me when ever I needed their help.

iv
Table of Contents
Chapter 1.
Introduction. . . . . . . . . . . . . . . . . . . . . . . . . . . . . . . . . . . . . . . . . . . . . . . . . . . . . . . . . . .1
Mineral Sands . . . . . . . . . . . . . . . . . . . . . . . . . . . . . . . . . . . . . . . . . . . . . . . . . . . . . . . . .3
The Old Hickory Project . . . . . . . . . . . . . . . . . . . . . . . . . . . . . . . . . . . . . . . . . . . . . . . . .5
Reclamation of Mineral Sand Mining . . . . . . . . . . . . . . . . . . . . . . . . . . . . . . . . . . . . . . . .8
Sand and Gravel Mine Reclamation . . . . . . . . . . . . . . . . . . . . . . . . . . . . . . . . . . . . . . . .11
Tin Mine reclamation. . . . . . . . . . . . . . . . . . . . . . . . . . . . . . . . . . . . . . . . . . . . . . . . . . .12
Prime Farmland Reclamation . . . . . . . . . . . . . . . . . . . . . . . . . . . . . . . . . . . . . . . . . . . . .12
Organic Amendments . . . . . . . . . . . . . . . . . . . . . . . . . . . . . . . . . . . . . . . . . . . . . . . . . . 15
Physical Factors Affecting Root Growth . . . . . . . . . . . . . . . . . . . . . . . . . . . . . . . . . . . . 17
Root Systems of Soybeans . . . . . . . . . . . . . . . . . . . . . . . . . . . . . . . . . . . . . . . . . . . . . . 18
Methods of Studying Root Systems . . . . . . . . . . . . . . . . . . . . . . . . . . . . . . . . . . . . . . . 19
Preliminary Soil and Greenhouse Studies for RGC . . . . . . . . . . . . . . . . . . . . . . . . . . . . .20
Chapter 2.
Materials and Methods.. . . . . . . . . . . . . . . . . . . . . . . . . . . . . . . . . . . . . . . . . . . . . . . . . 22
Experimental Design and Installation . . . . . . . . . . . . . . . . . . . . . . . . . . . . . . . . . . . . . . 22
Soil Sampling . . . . . . . . . . . . . . . . . . . . . . . . . . . . . . . . . . . . . . . . . . . . . . . . . . . . . . . 34
Rooting Analysis . . . . . . . . . . . . . . . . . . . . . . . . . . . . . . . . . . . . . . . . . . . . . . . . . . . . . 35
Soil Physical Analysis . . . . . . . . . . . . . . . . . . . . . . . . . . . . . . . . . . . . . . . . . . . . . . . . . 39
Soil Chemical Analysis . . . . . . . . . . . . . . . . . . . . . . . . . . . . . . . . . . . . . . . . . . . . . . . . 40

v
Crop Yield Analysis . . . . . . . . . . . . . . . . . . . . . . . . . . . . . . . . . . . . . . . . . . . . . . . . . . 40
Data Analysis . . . . . . . . . . . . . . . . . . . . . . . . . . . . . . . . . . . . . . . . . . . . . . . . . . . . . . . 41
Chapter 3.
Results and Discussion . . . . . . . . . . . . . . . . . . . . . . . . . . . . . . . . . . . . . . . . . . . . . . . . 42
Crop Response to Topsoil Replacement vs Compost Application . . . . . . . . . . . . . . . . 42
Wheat Yield . . . . . . . . . . . . . . . . . . . . . . . . . . . . . . . . . . . . . . . . . . . . . . . . . . . . . . . . 42
Soybean Yield . . . . . . . . . . . . . . . . . . . . . . . . . . . . . . . . . . . . . . . . . . . . . . . . . . . . . . . 50
Soil Morphology . . . . . . . . . . . . . . . . . . . . . . . . . . . . . . . . . . . . . . . . . . . . . . . . . . . . . 64
Soil Physical and Chemical Properties . . . . . . . . . . . . . . . . . . . . . . . . . . . . . . . . . . . . . 70
Chapter 4.
Summary and Conclusions . . . . . . . . . . . . . . . . . . . . . . . . . . . . . . . . . . . . . . . . . . . . . . 85
Literature Cited . . . . . . . . . . . . . . . . . . . . . . . . . . . . . . . . . . . . . . . . . . . . . . . . . . . . . . . . . . . 89
Appendix I. Chemical Properties of Yard Waste Compost. . . . . . . . . . . . . . . . . . . . . . . . . . . . 101
Appendix II. Historic Crop production Data. . . . . . . . . . . . . . . . . . . . . . . . . . . . . . . . . . . . . .103
Appendix III. Morphological Descriptions of Undisturbed Control Soils . . . . . . . . . . . . . . . . 105
Appendix IV. Morphological Descriptions of Mine Soils . . . . . . . . . . . . . . . . . . . . . . . . . . . . 122

vi
Appendix V. Profile descriptions for Auger Borings from Pit 1 Prior to
Treatment Application . . . . . . . . . . . . . . . . . . . . . . . . . . . . . . . . . . . . . . . . . . . . . . . 134
Appendix VI. Profile descriptions for Auger Borings from Pit 3 Prior to
Treatment Application. . . . . . . . . . . . . . . . . . . . . . . . . . . . . . . . . . . . . . . . . . . . . . . 142
Appendix VII. Chemical and Physical Data for Soil Samples Taken from Pit
Areas Prior to Mining. . . . . . . . . . . . . . . . . . . . . . . . . . . . . . . . . . . . . . . . . . . . . . . . 148
Appendix VIII. Chemical Data for Soil Samples Taken After Wheat Harvest . . . . . . . . . . . . 156
Appendix IX. Physical and Chemical Properties of Soil Samples Taken After
Soybean Harvest . . . . . . . . . . . . . . . . . . . . . . . . . . . . . . . . . . . . . . . . . . . . . . . . . . . 158
Vita . . . . . . . . . . . . . . . . . . . . . . . . . . . . . . . . . . . . . . . . . . . . . . . . . . . . . . . . . . . . . . . . . . . 164

vii
List of Figures
Figure 1. Project location map. . . . . . . . . . . . . . . . . . . . . . . . . . . . . . . . . . . . . . . . . . . . . . . . . . 2
Figure 2. Geologic Cross section at Old Hickory . . . . . . . . . . . . . . . . . . . . . . . . . . . . . . . . . . . . 6
Figure 3. Original pilot mine site map . . . . . . . . . . . . . . . . . . . . . . . . . . . . . . . . . . . . . . . . . . . . 23
Figure 4. Simplified wet mill diagram . . . . . . . . . . . . . . . . . . . . . . . . . . . . . . . . . . . . . . . . . . . . 24
Figure 5. Map of topsoil material that was pushed onto Pit 1 . . . . . . . . . . . . . . . . . . . . . . . . . . 26
Figure 6. Surface diagram showing the location of unprocessed material in Pit 1 . . . . . . . . . . . 27
Figure 7. Layout of experimental plots . . . . . . . . . . . . . . . . . . . . . . . . . . . . . . . . . . . . . . . . . . . 31
Figure 8. Typical plot layout . . . . . . . . . . . . . . . . . . . . . . . . . . . . . . . . . . . . . . . . . . . . . . . . . . 32
Figure 9. Diagram of the location of premine auger sampling points . . . . . . . . . . . . . . . . . . . . . 36
Figure 10. Location of variability samples taken from Pit 1 . . . . . . . . . . . . . . . . . . . . . . . . . . . 37
Figure 11. Location of soil pits dug after soybean harvest . . . . . . . . . . . . . . . . . . . . . . . . . . . . 38
Figure 12. Yield of wheat harvested in June, 1996 . . . . . . . . . . . . . . . . . . . . . . . . . . . . . . . . . . 43
Figure 13. Clay content of surface horizons in each treatment . . . . . . . . . . . . . . . . . . . . . . . . . 46
Figure 14. Wheat root length . . . . . . . . . . . . . . . . . . . . . . . . . . . . . . . . . . . . . . . . . . . . . . . . . . 48
Figure 15. Wheat yield vs root length . . . . . . . . . . . . . . . . . . . . . . . . . . . . . . . . . . . . . . . . . . . . 49
Figure 16. Soybean root length . . . . . . . . . . . . . . . . . . . . . . . . . . . . . . . . . . . . . . . . . . . . . . . . 53
Figure 17. Soybean root distribution in the Control . . . . . . . . . . . . . . . . . . . . . . . . . . . . . . . . . 54
Figure 18. Soybean root distribution in the Topsoil treatment on Pit 1 . . . . . . . . . . . . . . . . . . . 55

viii
Figure 19. Soybean root distribution in the Compost treatment on Pit 1 . . . . . . . . . . . . . . . . . 56
Figure 20. Soybean root distribution in the Topsoil treatment on Pit 3 . . . . . . . . . . . . . . . . . . . 57
Figure 21. Soybean root distribution in the Compost treatment on Pit 3 . . . . . . . . . . . . . . . . . 58
Figure 22. Bulk density of surface horizons . . . . . . . . . . . . . . . . . . . . . . . . . . . . . . . . . . . . . . . 59
Figure 23. Soybean yield vs bulk density . . . . . . . . . . . . . . . . . . . . . . . . . . . . . . . . . . . . . . . . . 62
Figure 24. Soybean yield vs bulk density (control and topsoil treatments only). . . . . . . . . . . . . 63
Figure 25. Diagram of differential settling of tailings and slimes . . . . . . . . . . . . . . . . . . . . . . . . 65
Figure 26. Surface plot of depth to processed materials in Pit 1 . . . . . . . . . . . . . . . . . . . . . . . . 67
Figure 27. Surface plot of depth to material not mechanically mixed in Pit 3 . . . . . . . . . . . . . . 69
Figure 28. Variability in clay content of surface horizons . . . . . . . . . . . . . . . . . . . . . . . . . . . . . 72
Figure 29. Variability in clay content at 100 cm depth . . . . . . . . . . . . . . . . . . . . . . . . . . . . . . . 73
Figure 30. Bulk density vs carbon content for surface soil samples . . . . . . . . . . . . . . . . . . . . . 75
Figure 31. Calcium content vs % clay in surface soil samples . . . . . . . . . . . . . . . . . . . . . . . . . . 78
Figure 32. Calcium content vs % carbon in surface soil samples . . . . . . . . . . . . . . . . . . . . . . . 79
Figure 33. Effective CEC vs % clay in surface soil samples . . . . . . . . . . . . . . . . . . . . . . . . . . . 82
Figure 34. Effective CEC vs % carbon in surface soil samples . . . . . . . . . . . . . . . . . . . . . . . . . 83

ix
List of Tables
Table 1. Average kernels per head and 1000 kernel weight for wheat
harvested in June, 1996 . . . . . . . . . . . . . . . . . . . . . . . . . . . . . . . . . . . . . . . . . . . . . . . . 45
Table 2. Yield, plant population, and seed moisture for soybeans harvested
in November, 1996 . . . . . . . . . . . . . . . . . . . . . . . . . . . . . . . . . . . . . . . . . . . . . . . . . . . .51
Table 3. Average pH and total carbon content for soil samples taken surface
horizons after soybean harvest . . . . . . . . . . . . . . . . . . . . . . . . . . . . . . . . . . . . . . . . . . . 61
Table 4. Water holding capacity in surface and subsurface soil samples . . . . . . . . . . . . . . . . . . 76
Table 5. Soil P and Ca data . . . . . . . . . . . . . . . . . . . . . . . . . . . . . . . . . . . . . . . . . .. . . . . . . . . . 77
Table 6. Surface and subsurface pH data . . . . . . . . . . . . . . . . . . . . . . . . . . . . . . . . . . . . . . . . . 81
Table 7. Surface and subsurface ECEC data . . . . . . . . . . . . . . . . . . . . . . . . . . . . . . . . . . . . . . 84

1
Chapter 1
INTRODUCTION
Mineral sand deposits were discovered in Virginia in the late 1980's (Berquist and
Goodwin, 1989). These deposits occur along the “Fall Zone” which separates the Coastal Plain
and Piedmont provinces. A large portion of the land underlain by these deposits is prime farmland
and has traditionally produced high yields of peanut (Arachis hypogaea L.), soybean (Glycine
max), tobacco (Nicotiana tobacum L.), and (recently) cotton (Gossypium hirsutum). This high
productivity necessitates the development of a sound reclamation plan if this major mineral
resource is to be exploited.
The largest ore body in Virginia is known as the Old Hickory deposit (Fig. 1) and is the
subject of this study. Covering approximately 2,550 ha (6,300 acres), it is located 97 km (60
miles) south of Richmond and 177 km (110 miles) west of the Atlantic Coast. In 1989, (RGC
Mineral sands (USA) Inc.) entered into a research agreement with Virginia Tech. This agreement
called for the complete mapping and characterization of the soils within the deposit, greenhouse
studies of possible reclamation strategies, and field trials on pilot-scale mine tailings. This study
will partially fulfill the last part of the research agreement.
The objectives of this study are threefold:
1) To characterize and compare the physical and chemical properties of adjacent undisturbed and
reclaimed mine soils at the Old Hickory Project. This will serve as baseline research for future
comparative studies

2
Figure 1. Map of physiographic provinces across Virginia and North Carolina indicating the
location of the heavy mineral deposits. (Locationd from Carpenter and Carpenter, 1991)

3
(2) To evaluate the agronomic productivity of reconstructed mine soils amended with organic
matter (yard waste compost) compared to adjacent undisturbed soils.
(3) To evaluate the agronomic productivity of reconstructed mine soils amended with topsoil
compared to adjacent undisturbed soils.
Mineral Sands
The term mineral sand is applied to sand that is generally black in color and has a particle
density around 4 g cm . The economic minerals commonly found in mineral sands include rutile-3
(TiO ), ilmenite (FeTiO ), leucoxene (Fe Ti O ), zircon (ZrSiO ), and other minor high density2 3 2 3 9 4
components. These minerals are a major source of titanium which is most commonly used in the
production of white pigments and high strength metal alloys used in various metallurgical
applications. Small amounts of titanium minerals are also used in abrasives, foundry sands, and
welding rod coatings (Garnar and Stanaway, 1994). Zircon is commonly used in refractories,
foundries, and ceramics. When added to ceramics it enhances their thermal characteristics, and is
also used in waxes, inks, polishing compounds, and toothpaste (AME Mineral Economics, 1994).
Sand deposits containing heavy minerals are the result of the weathering and erosion of
igneous or sedimentary rock. These weathering products are transported and sorted by moving
water and concentrated as placer deposits. Placers may be beach deposits, alluvial fans, or river
deposits (Lynd and Lefond, 1983). Stanaway (1992) described two types of placers, (1) trap
placers, which develop on scour, erosion, and unconformity surfaces, are rarely more than a meter
thick, and (2) bed placers which can be tens of meters thick and result when high specific gravity
4
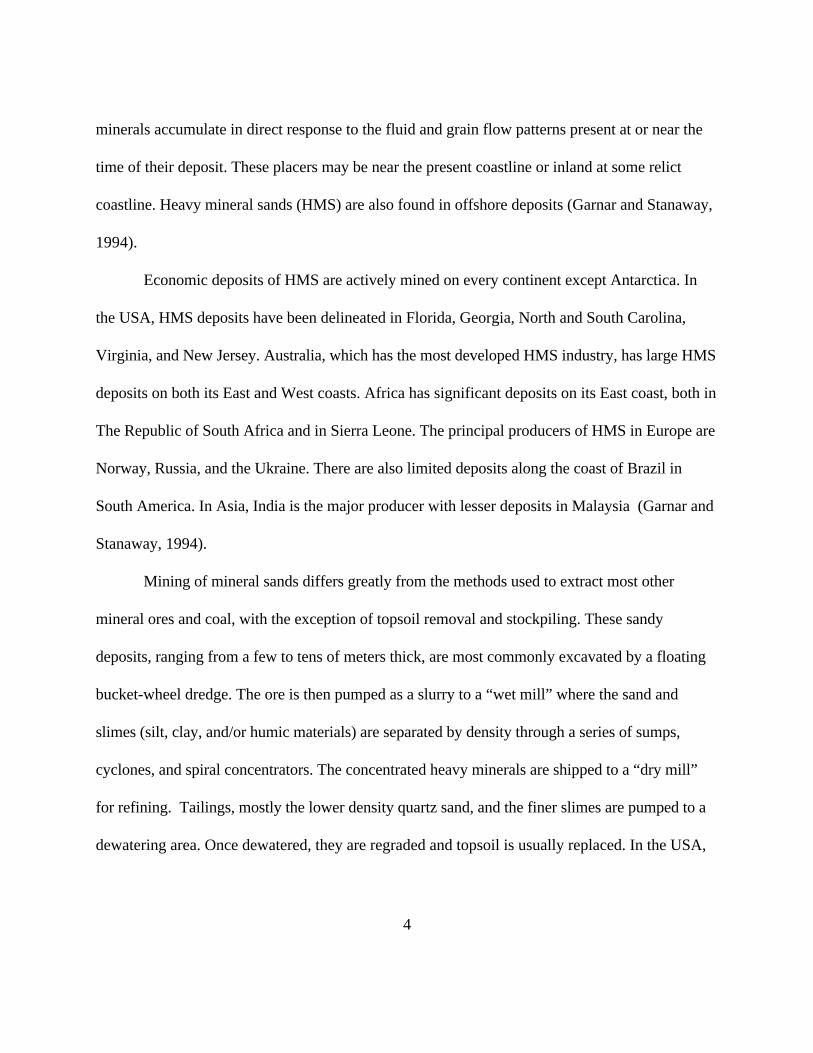
minerals accumulate in direct response to the fluid and grain flow patterns present at or near the
time of their deposit. These placers may be near the present coastline or inland at some relict
coastline. Heavy mineral sands (HMS) are also found in offshore deposits (Garnar and Stanaway,
1994).
Economic deposits of HMS are actively mined on every continent except Antarctica. In
the USA, HMS deposits have been delineated in Florida, Georgia, North and South Carolina,
Virginia, and New Jersey. Australia, which has the most developed HMS industry, has large HMS
deposits on both its East and West coasts. Africa has significant deposits on its East coast, both in
The Republic of South Africa and in Sierra Leone. The principal producers of HMS in Europe are
Norway, Russia, and the Ukraine. There are also limited deposits along the coast of Brazil in
South America. In Asia, India is the major producer with lesser deposits in Malaysia (Garnar and
Stanaway, 1994).
Mining of mineral sands differs greatly from the methods used to extract most other
mineral ores and coal, with the exception of topsoil removal and stockpiling. These sandy
deposits, ranging from a few to tens of meters thick, are most commonly excavated by a floating
bucket-wheel dredge. The ore is then pumped as a slurry to a “wet mill” where the sand and
slimes (silt, clay, and/or humic materials) are separated by density through a series of sumps,
cyclones, and spiral concentrators. The concentrated heavy minerals are shipped to a “dry mill”
for refining. Tailings, mostly the lower density quartz sand, and the finer slimes are pumped to a
dewatering area. Once dewatered, they are regraded and topsoil is usually replaced. In the USA,
5
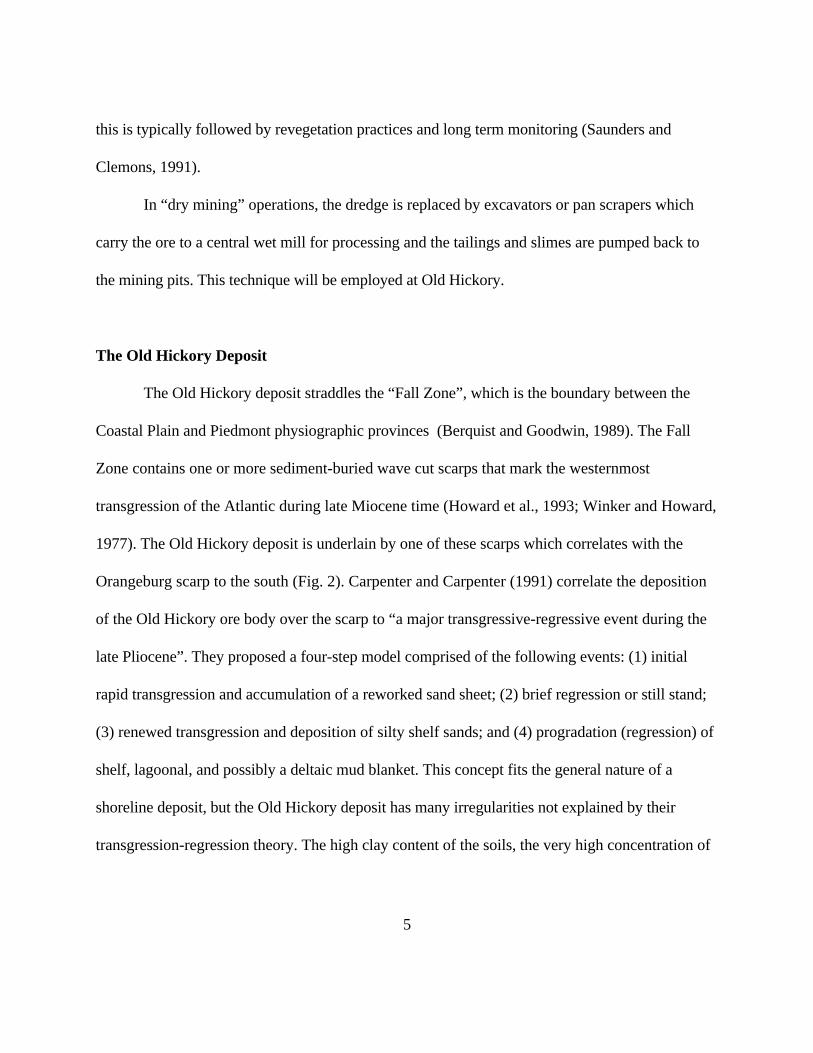
this is typically followed by revegetation practices and long term monitoring (Saunders and
Clemons, 1991).
In “dry mining” operations, the dredge is replaced by excavators or pan scrapers which
carry the ore to a central wet mill for processing and the tailings and slimes are pumped back to
the mining pits. This technique will be employed at Old Hickory.
The Old Hickory Deposit
The Old Hickory deposit straddles the “Fall Zone”, which is the boundary between the
Coastal Plain and Piedmont physiographic provinces (Berquist and Goodwin, 1989). The Fall
Zone contains one or more sediment-buried wave cut scarps that mark the westernmost
transgression of the Atlantic during late Miocene time (Howard et al., 1993; Winker and Howard,
1977). The Old Hickory deposit is underlain by one of these scarps which correlates with the
Orangeburg scarp to the south (Fig. 2). Carpenter and Carpenter (1991) correlate the deposition
of the Old Hickory ore body over the scarp to “a major transgressive-regressive event during the
late Pliocene”. They proposed a four-step model comprised of the following events: (1) initial
rapid transgression and accumulation of a reworked sand sheet; (2) brief regression or still stand;
(3) renewed transgression and deposition of silty shelf sands; and (4) progradation (regression) of
shelf, lagoonal, and possibly a deltaic mud blanket. This concept fits the general nature of a
shoreline deposit, but the Old Hickory deposit has many irregularities not explained by their
transgression-regression theory. The high clay content of the soils, the very high concentration of

6
Figure 2. Geologic cross section of the Old Hickory deposit showing the location andconcentration of heavy minerals.

7
mineral in some parts of the ore body (>40%), and the presence of HMS above the scarp, all
point to other possibilities. Carpenter and Carpenter (1991) offer two possible origins for the clay.
First, they hypothesize that the clay is the weathering product of sand-sized feldspar grains
deposited with the HMS, or secondly, that the clay was introduced after HMS deposition.
Although the second theory would allow for higher amounts of clay than could be accounted for
from feldspar weathering, the authors do not offer any evidence for the process of this clay
introduction.
Another possible explanation is offered by Larsen (1993) who hypothesized that HMS
accumulation along the Fall Zone is due to changes in stream gradient or slope. As streams cross
from the Piedmont to the Coastal Plain, their gradient drops in relation to the decreasing slope of
the surface they pass over. Larsen concluded that as stream gradient decreases, sediments are
sorted by density and that heavy minerals such as ilminite would be deposited closer to the Fall
Zone.
It has also been postulated that the high concentrations of heavy mineral sands in similar
environments in Australia were caused by tsunami (Bryant et al., 1991). This theory may also
explain the bisequal nature (discussed later) of soil overlying the scarp at Old Hickory. Tsunami
may have sheared off the upper layers of the original soil leaving the lower horizons intact to be
buried by mixed sediments when the water receded. Possible tsunami activity in the Atlantic
Ocean has been reported by Dawson et al. (1988) who found sand layers far inland along the East
Coast of Scotland which may have been deposited by tsunami.
Other possible mechanisms favored by RGC exploration geologists include concentration

8
of HMS by a cycle of large storms (hurricanes), which could bring HMS in from offshore and
concentrate it in beach deposits. In fact, this process is active in Australia today, and earlier HMS
mining originally developed to exploit storm deposits immediately following cyclones.
Reclamation of Mineral Sand Mining
Mineral sands have been mined in Australia since the turn of the century (Morley, 1982).
Mining was initially confined to rich placer deposits found on the beaches north of Brisbane.
Mining these deposits involved little environmental conflict and reclamation was limited to
recontouring the remaining sand before the next high tide. As the industry grew, frontal dune
deposits became the target of mining operations. Although these areas required reclamation,
limited knowledge of dune function focused reclamation on dune stabilization. To this end, dunes
were flattened and planted with spiniflex grass (Spiniflex sericeu). The first official rehabilitation
conditions were placed on mining leases in Queensland in 1951. Over the following decades,
changes in Australian societal values and the development of the conservation movement led to
the development of reclamation strategies and limited mining in eastern Australia. Mining began in
Western Australia in 1956 (Brooks, 1997). With increased restrictions on the East Coast, the
western deposits became the focus of mining.
In Australia, mineral sands deposits are located in many different landforms including
frontal dunes, high dunes, heathlands, wetlands, and farmland. Brooks (1997) summarized studies
of reclamation projects on each of these landforms and concluded that there are several basic
principals common to all successful reclamation projects he studied:

9
! Selection of the post-mining land use prior to the commencement of
mining.
! Assessment of the pre-existing environmental conditions, including
vegetation, fauna, soils, hydrology, and cultural and natural heritage values.
! Landform reconstruction to re-establish topographic patterns, with
particular attention being given to surface drainage.
! Careful management of topsoil because of its organic enrichment and seed
load.
! Surface stabilization to enable establishment of native species seedlings,
many of which are small and establish slowly.
! Direct seeding of native species as the most efficient means of enhancing
regeneration from topsoil, both economically and biologically.
! Enhancement planting of nursery raised stock, with emphasis on species
that are difficult to propagate with field techniques.
! Monitoring of the serial development of the vegetation and fauna to ensure
the newly created ecosystem is progressing satisfactorily.
These steps are also currently employed, in modified form, by RGC at sites in central Florida
(Saunders and Clemons, 1991), and soils at these sites have been found to develop significant
subsoil horizonation in 5 to 10 years (Daniels et al., 1992). Daniels et al. also found that rooting
was limited to 50 cm or less due to compaction of subsurface tailings and/or the seasonal water
table. Bulk densities as high as 1.80 g cm were found, and they concluded that wet settling of the-3
10
tailings coupled with grading led to compaction.
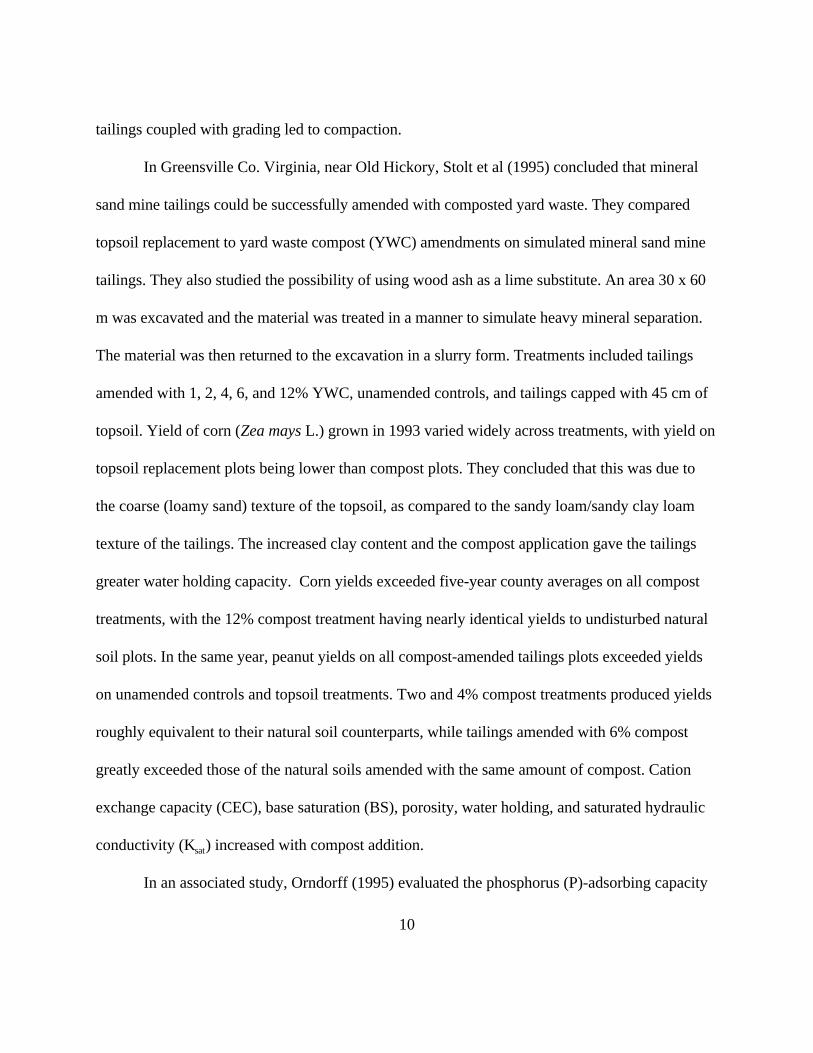
In Greensville Co. Virginia, near Old Hickory, Stolt et al (1995) concluded that mineral
sand mine tailings could be successfully amended with composted yard waste. They compared
topsoil replacement to yard waste compost (YWC) amendments on simulated mineral sand mine
tailings. They also studied the possibility of using wood ash as a lime substitute. An area 30 x 60
m was excavated and the material was treated in a manner to simulate heavy mineral separation.
The material was then returned to the excavation in a slurry form. Treatments included tailings
amended with 1, 2, 4, 6, and 12% YWC, unamended controls, and tailings capped with 45 cm of
topsoil. Yield of corn (Zea mays L.) grown in 1993 varied widely across treatments, with yield on
topsoil replacement plots being lower than compost plots. They concluded that this was due to
the coarse (loamy sand) texture of the topsoil, as compared to the sandy loam/sandy clay loam
texture of the tailings. The increased clay content and the compost application gave the tailings
greater water holding capacity. Corn yields exceeded five-year county averages on all compost
treatments, with the 12% compost treatment having nearly identical yields to undisturbed natural
soil plots. In the same year, peanut yields on all compost-amended tailings plots exceeded yields
on unamended controls and topsoil treatments. Two and 4% compost treatments produced yields
roughly equivalent to their natural soil counterparts, while tailings amended with 6% compost
greatly exceeded those of the natural soils amended with the same amount of compost. Cation
exchange capacity (CEC), base saturation (BS), porosity, water holding, and saturated hydraulic
conductivity (K ) increased with compost addition.sat
In an associated study, Orndorff (1995) evaluated the phosphorus (P)-adsorbing capacity

11
of mineral sand mine tailings amended with YWC. She reported that P-adsorption potential
ranged from moderate to low. Decreases in adsorption corresponded to increases in compost
application rate. Untreated tailings adsorbed the most P and undisturbed soil the least.
She hypothesized that the decrease in P-adsorption on compost treated versus untreated plots
was related to (1) wood ash application, which increased pH and decreased anion exchange
capacity, (2) P-fertilizer applications which satisfied adsorption sites, and (3) organic matter
additions, which both physically blocked adsorption sites and competed with P for adsorption
sites. Application of 12% YWC reduced P-adsorption of the tailings to levels near that of the
natural soils. She concluded that the tailings would be best managed with high compost
applications and low annual P-applications.
Sand and Gravel Mine Reclamation
The mining of sand and gravel for construction materials has been practiced for centuries.
These areas have often been abandoned with little or no reclamation effort, particularly areas
mined before the 1980's. Spoils from sand and gravel mining are generally coarse textured, and
mineralogically heterogeneous. They are low in organic matter, have little or no structure, and are
deficient in plant nutrients. Without some amelioration, any plants grown on these spoils are
susceptible to water, temperature, and nutrient stresses (Hornick, 1982). Hornick (1988)
concluded that sewage sludge compost and feedlot manure improved yields in corn and bush
beans (Phaseolus vulgaris l.) grown on sand and gravel spoils. The improvement in yield was
attributed to organic additions through their effect on pH stability, soil physical properties, and

12
the supply of micro- and macro-nutrients. In studies of aggregate mine rehabilitation to prime
farmland in southern Ontario, Mackintosh and Mozuraitis (1982) found that the absence of
topsoil or the mixing of topsoil with subsoil, and its inherent dilution of organic matter, was the
most common problem limiting reclamation success.
Tin Mine Reclamation
The practice of tin mining produces waste materials similar to those of mineral sand
mining. Tin is generally found in placer deposits and is also mined by floating dredge or gravel
pump. After mining, sand tailings and slime ponds remain. These materials are often unreclaimed
and frequently remain barren after 20 years. In an extensive study of tin tailings in Malaysia,
Mitchell (1959) found that there was almost a complete loss of organic matter and N in the
tailings. He also noted that in areas where slimes had accumulated, there was a marked increase in
the variety and quantity of plant growth. In an earlier study by Birkinshaw (1931), rice ( Oryza
sativa L. ) was shown to produce significantly higher yields on tin tailings that were covered with
45 to 60 cm of slimes. Mok and Lim (1985) reported that mixing slimes with sand tailings
improved productivity, but that organic amendments were also necessary to achieve sustained
yields.
Prime Farmland Reclamation
Prime farmland is cropland that has the most favorable combination of chemical, physical
and environmental properties for the production of food, fiber, and oil crops (Grandt, 1988). The
13
Federal Surface Mining Control and Reclamation Act (SMCRA) of 1977 requires that prime
farmland disturbed by coal mining be returned to pre-mining productivity, and there has been
extensive research in this area. Much of this research has been focused in the American Midwest
where extensive coal deposits underlie prime farmland. Central to this research has been
SMCRA’s requirement that soil horizons be replaced and original contours recreated.
Jansen and Dancer (1981) observed that corn yields on replaced topsoil depended on the quality
of the topsoil and its thickness. They also found that some subsoils can give higher yields than
topsoil depending on the chemical and physical properties of the material. Underwood and Sutton
(1992) concluded that corn yields on Ohio mine soils increased with increasing thickness of
replaced topsoil. Their research also found that increases in clay content led to compaction during
replacement. In studies of loamy sand mine spoils in North Dakota, Halvorson et al. (1986)
concluded that at least 0.7 m of topsoil was needed to attain maximum yields. In addition to
thickness of topsoil, its’ physical properties are also important. Potter et al. (1988) report that
macroporosity and hydraulic conductivity were significantly lower in reclaimed topsoil as
compared to undisturbed topsoil.
Another factor of concern in reclamation is topsoil handling. The best method is to directly
haul and place it over recontoured mine spoil instead of stockpiling (Hargis and Redente, 1984).
Hossner et al. (1992) reported that mixing of subsoil and topsoil increased productivity in two
clayey Texas soils. Another study in Texas found that a more productive soil could be created
from selected overburden (DeMent et al.,1992 ). They reported subsurface materials to be higher
in weatherable minerals, higher in pH, and higher in CEC than the native surface soils. Soil formed

14
in this overburden out-yielded all native soils for coastal bermudagrass (Cynadon dactylon [L]
Pers.) and wheat (Triticum aestivum L.). In contrast, Semalulu and Barnhisel (1992) concluded
that acidic subsoils may fix P in quantities large enough to cause significant yield reduction. These
findings were supported by Mankolo (1994) in studies of P-uptake by corn on mineral sand mine
soils. In Greensville Co. Virginia, she observed that even with P application rates as high as 289
kg ha as triple-superphosphate, corn ear leaves had P contents below the critical 0.25% level. -1
An extensive greenhouse study by Stucky et al. (1986) observed that subsurface soil materials
may be suitable for crop production if they have the appropriate balance of pH, fertility, and
texture.
Compaction has been found to be the most limiting factor in many mine reclamation
studies. Compaction causes an increase in bulk density and associated soil strength. Soils with
high bulk density have low porosity, slow saturated hydraulic conductivity (K ), and highsat
resistance to root penetration. Studies by Taylor (1974) concluded that compaction reduced
yields in nearly all soils, and Barnhisel and Gray (1990) concluded that compaction was a major
factor limiting yield on mine soils. Schuman et al. (1985) reported compaction to be a major
problem in reclaiming bentonite mined land in the Northern Great Plains. Replacement of rooting
media by scrapers can cause severe compaction and reductions in corn and soybean yields. Hooks
et al. (1992) concluded that end-dumping from trucks and grading with low ground pressure
bulldozers was the preferred method of soil replacement.
Deep ripping has been shown to be an effective technique for remediating compaction.
Bledsoe et al. (1992) concluded that deep ripping reduced compaction and increased corn yields

15
on mine soils in Illinois. The same observations were made by Caldwell et al. (1992) in Kansas,
and by Powell et al. (1988) and Wells and Barnhisel (1992) in Kentucky.
Although the Old Hickory project will not employ heavy earth moving equipment to
replace tailings, compaction may still be a problem. Compaction may result from wet settling as
reported by Daniels et al. (1992), bulldozer traffic during regrading and topsoil replacement, or
through the use of rubber-tired loaders and haulers during material handling operations.
ORGANIC AMENDMENTS
Additions of organic materials have, since ancient times, been known to improve soil
productivity. According to King (1911) the ability of long lived civilizations such as China, Japan,
and Korea to maintain their agricultural base is directly linked to the use of organic amendments.
Organic matter contributes to CEC, water holding capacity, aggregate stability, and nutrient
availability (McConnell et al., 1993). Most soil organic matter is concentrated in the surface
horizons and decreases rapidly with depth. The low level of organic matter in subsoils is a major
limitation when they must be used as parent material for soil reclamation. Terman et al. (1973)
concluded that additions of municipal waste compost improved yields of corn, and tall fescue
(Festuca arundinacea ) due to increased availability of N, P, K, Zn, and Ca. Similar conclusions
were reached by Mays et al. (1973) with applications of sewage sludge compost to forage
sorghum (Sorguhm bicolor), corn, and bermudagrass. They observed increases in soil nutrient
supply and water holding capacity along with a decrease in bulk density.
Many investigators have studied the ability of organic additions to restore mined land to

16
productivity. In an extensive review of surface mine reclamation with municipal sewage sludge,
Sopper (1993) summarized studies from around the globe as well as his own field studies. He
concluded that the application of sewage sludge is an effective and safe method to reclaim surface
mined land. In a study of degraded soils in India, Kaura and Verma (1982) reported that organic
amendments improved soil structure. They also concluded that aggregate formation was further
enhanced when undecomposed organic matter was added instead of compost. Organic
amendments have also been used to amend degraded sandy soils in Nigeria. Obi and Ebo (1994)
reported that the incorporation of poultry litter improved soil structure, and increased water
holding capacity, K , and infiltration rate. Similar results were reported by Hortenstine andsat
Rothwell (1972) on organically amended phosphate mine tailings in Florida. Sewage sludge and
sludge/garbage compost were employed to amend mine soils and increased yield of corn and grain
sorghum. Amended mine soils were less acidic, and had higher levels of available N and P than
unamended mine soils. In a long term study of coal mine soils in southwest Virginia, Roberts et al.
(1988) found that mine soils amended with sewage sludge developed deeper A horizons than
unamended soils. Sludge amended soils also had higher total N, higher extractable P, and less
extractable Fe. In a study of prime farmland reclaimed after surface mining, Olsen and Jones
(1988) reported that organic amended mine soils produced as good or better corn yields than
topsoil replacement.
A number of other investigators have also reported that yard waste compost (YWC)
improved soil chemical and physical properties. Studies of sandy soils showed improved water
holding capacity and higher crop yields with the addition of YWC (Mays et al., 1973).

17
Incorporation of YWC into mine soils was shown to decrease compaction, and increase water
holding (Clapp et al., 1986), and soil pH ( McConnell et al., 1993). Compost additions also
improved micronutrient availability and lowered Al toxicity. Terman et al. (1973) reported that
YWC can supply relatively high amounts of N, P, and K, while Mankolo (1994) found YWC to
be very effective at amending spoils from mineral sand mining. Incidentally, yard waste represents
approximately 20 percent of U.S. municipal waste (Parr, 1992).
Physical Factors Affecting Root Growth
Plant roots have three main functions, (1) anchoring the plant in the soil, (2) absorption of
water and nutrients, and (3) synthesis of organic compounds needed by the plant (Drew and Goss,
1973). The amount of water and nutrients available to the plant is largely determined by the total
volume of soil exploited by its’ root system. The volume of soil explored by a plant’s root system
depends on root genetic properties and soil physical factors. The primary physical factor affecting
root growth is soil density and associated strength. Soils with high bulk density and strength will
limit root growth by mechanical impedance (Gerard et al., 1982). Roots grow through the soil by
penetrating voids or by moving soil particles (when possible) when there are no voids (Taylor,
1974). When a soil is compacted or disturbed, the number and size of pores is reduced. In a study
of rooting in mine soils, McSweeney and Jansen (1984) reported that rooting was limited in
massive and compacted mine soils, but was prolific in what they termed “fritted” minesoils. This
term refers to a structural arrangement of rounded aggregates loosely compressed together. In a
recent study of the effects of subsurface compaction on wheat, Oussible et al. (1993) reported
18
that root density, number of tillers, and N-accumulation were all reduced by compaction.
The most common measure of soil compaction is bulk density. Bulk densities above 1.65 g
cm to 1.75 g cm , depending on texture and water content, are commonly reported to limit root-3 -3
growth (Drew and Goss, 1973). Jones (1983) also reported that texture affected the bulk density
at which rooting is limited. He concluded that soils with higher clay (or clay + silt) contents
exhibited restricted root growth at lower bulk densities than in sandy soils. Although there are
many factors which can limit growth, roots can compensate through enhanced growth into areas
unaffected by the limiting factor. This compensatory growth results from the independent nature
of each axis or lateral in the root system and its ability to react to its own environment (Crossett
et al., 1975).
Root Systems of Soybeans
Part of this study will include the mapping of the root systems of soybeans grown on both
undisturbed and reclaimed soil, therefore a discussion of the nature and habit of soybean root
systems is warranted. Soybeans are usually described as weakly taprooted. The components of the
soybean root system include the taproot, secondary or lateral roots, tertiary, and other smaller
roots (Kaspar, 1985). Development begins with the emergence of the radicle from the seed. From
the radicle, a taproot descends to depths as great as 1.5 m, but is usually limited to a much
shallower depth by unfavorable conditions. Four vertical rows of lateral roots extend from the
taproot at 90 angles. These laterals will extend 20 to 35 cm before turning downward to a depth0
of up to 1.8 m. Root hairs can develop from any epidermal cell and are primarily responsible for

19
water and nutrient uptake (Kaspar, 1985; Mitchell and Russell, 1971). Although some parts of the
root system may reach depths of 1.8 m, 90 % of the root mass is found in the upper 15 cm
(Mitchell and Russell, 1971).
Methods of Studying Root Systems
The study of plant root systems has evolved into two main fields, root ecology and root
physiology. The physiologist is interested in the processes within the root such as cell division or
nutrient transport and may use indirect methods to study roots. In contrast, the ecologist wants to
know how the root responds to its environment.
Indirect methods of root study include the uptake of radioactive and non-radioactive
tracers, staining techniques, and water depletion. These methods attempt to quantify activity
within the root system either by the movement of some chemical or by uptake and movement of
water. If, however, the researcher wants to observe the interaction of the root system and its
environment, a more direct approach is needed. A method must be employed which exposes the
entire root system or some part of it.
Bohm et al. (1977) compared five methods for studying soybean root density and
development. Those methods included soil water-depletion, framed monolith, core-sampling,
mini-rhizotron, and trench profile. They concluded that when the goal of the research is to
observe roots in relation to their soil environment, the trench profile method (Bohm, 1976) was
the best. This method involves the excavation of a trench across the plant rows so that the soil-
root system may be observed directly. If the researcher is interested in root density, the framed

20
monolith method (Nelson and Allmaras, 1969), where a section of soil and associated roots are
removed from the soil, or the core method (Waddington, 1971), in which the entire soil profile is
sampled in long continuous cores, are superior. Bohm et al. concluded that both of these methods
are more time-consuming than the trench profile method due to root cleaning, but all three
methods equally estimate the relative percentage of roots in a given soil layer.
A modification of the core method involves the use of a soil auger to obtain samples for
root analysis (Bohm, 1977). Roots obtained in this manner are suitable for length estimate analysis
by the line intercept method outlined by Tennant (1975). Using a grid, he estimated the total
length of root samples by counting the number of intersections between roots and grid lines. He
concluded that this method could estimate root lengths with variation of 5 % or less.
Preliminary Soil and Greenhouse Studies for RGC
Beginning in the summer of 1989, the soils of the entire Old Hickory deposit (app. 2,550
ha) were mapped on a 1:12,000 scale by Hodges et al (1997) of the Virginia Tech Soil Survey.
The highly dissected nature of the area gives rise to a variety of soils and parent materials. Hodges
et al. identified 25 soil series within the area of the ore body. In a relatively small area, there are
adjacent soils that have formed in residual Piedmont materials, unconsolidated Coastal Plain
sediments, and colluvial mixes of Piedmont and Coastal Plain materials. The majority of soil series
in the deposit have sandy surface horizons underlain by argillic horizons. Soils near the scarp (see
Fig. 3) commonly have bisequal character with younger yellowish argillic horizon materials
overlying redder B and C horizons. Subsoil clay contents range from 17 to 45 %. The clay

21
fraction of these soils is dominated by low charge minerals (Vanwormhoudt, 1993), with
relatively low CEC’s (2-16 cmol/kg) and their pH is in the strongly acid range of 4.5 to 5.5
(Daniels et al., 1992).
Upon completion of soil mapping, five pedons which were typical of soils that would be
mined were selected for generation of simulated tailings and slimes. Sampling sites were chosen
based on high mineral content, typical soil, and high crop productivity potential. Heavy mineral
sands were wet separated from tailings in a spiral separator. These tailings and slimes were then
transported to Va Tech and used in greenhouse studies, which focused on the evaluation of
different mixtures of tailings and slimes as plant growth media. After several rotations of wheat,
soybean, and corn (Zea mays L.) it was concluded that a uniform blend of tailings and slimes
could be successfully used as a topsoil substitute (Daniels et al., 1995). They also concluded that
subsoil variations in texture and water holding capacity may not be a major concern. The field
experiment reported in this thesis represents a progression from these greenhouse trials to field
conditions.

22
Chapter 2
MATERIALS AND METHODS
Experimental Design and Installation
In the fall of 1994, RGC began work on a pilot scale mine at a site within the Old Hickory
deposit. The initial design of the mine area included three 24 x 60 m pits to be excavated for
heavy mineral extraction and one 45 x 45 m area to be preserved as an undisturbed control
(Fig. 3). The control area was roped off and no traffic or drainage from the active site was
allowed onto this area. Prior to pit excavation, topsoil was removed by pan scrapers and
stockpiled for later use. Pit #1 was excavated to a depth of approximately 5 m with a track
excavator. The ore from Pit #1 was stockpiled until excavation was complete. Some of the
excavated subsoil material was piled around the edge of the pit to form dikes which would allow
the pit to be filled above original grade. This was needed to account for expected shrinkage
during dewatering.
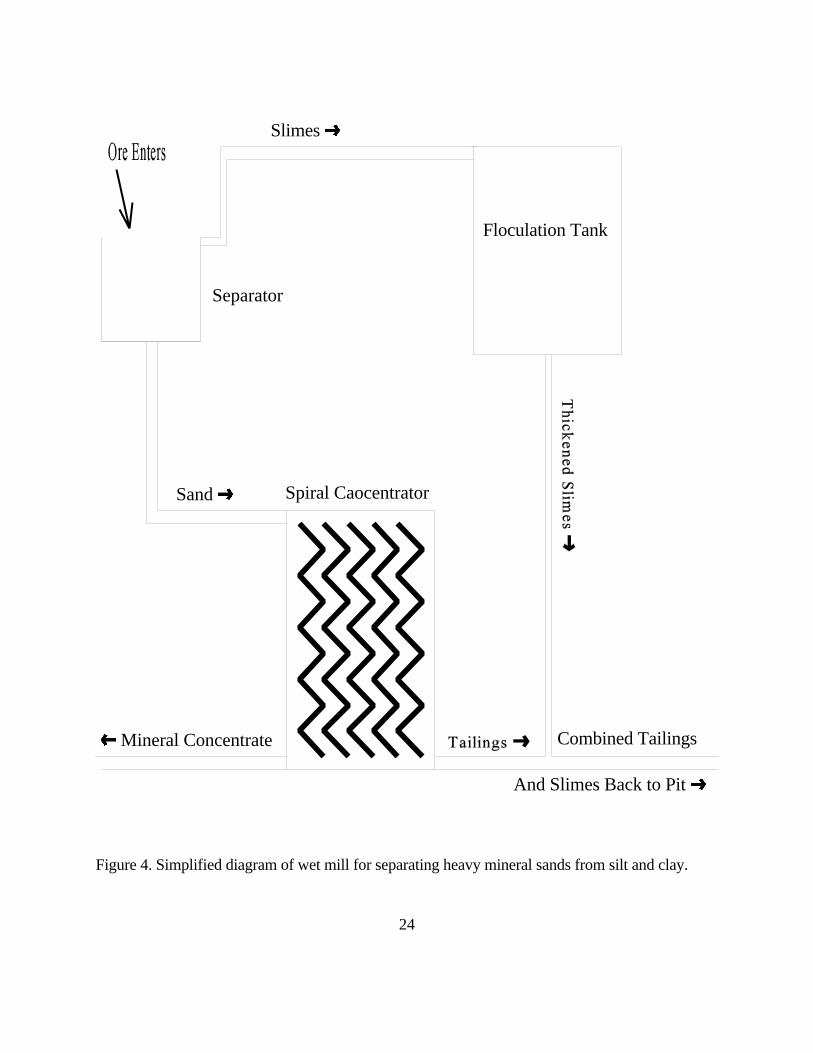
The stockpiled ore was then fed through a separator, consisting of a shaking screen, a pug
mill and a sump where water was used to separate sand from slimes (silt and clay). Heavy mineral
sands were separated from the host sands in a series of gravity spirals. In an attempt to improve
recombination with the sandy tailings, the slimes were flocculated with an anionic polymer
(Nalco 9825) in a large stirring tank called a thickener. Tailings and slimes were thenTM
recombined and returned to the pit (Fig. 4). This was accomplished by pumping the recombined

23
Figure 3. Original pilot mine site map showing location of mine pits, wet mill, ore stockpile, and undisturbed control area.
Floculation Tank
Slimes º
Separator
Sand º Spiral Caocentrator
Combined Tailings
And Slimes Back to Pit º
» Mineral Concentrate
24
Figure 4. Simplified diagram of wet mill for separating heavy mineral sands from silt and clay.
25
tailings and slimes, at around 50% solids, through pipes to a dispensing point along the side of a
pit. At the end of the pipe a dispersing device was employed to spread the flow over a larger area.
Periodically, the discharge point was moved around the pit and between pits in an effort to fill the
pits evenly.
As Pit #1 was being filled, Pit #3 was excavated. The same procedure was followed in
digging and filling Pit #3, with the exception that Pit #3 was excavated to a depth of 6 m. Pit #2
was excavated last to ensure that if the pit walls proved unstable there would be no chance of
RGC ending up with one very large pit instead of three smaller ones.
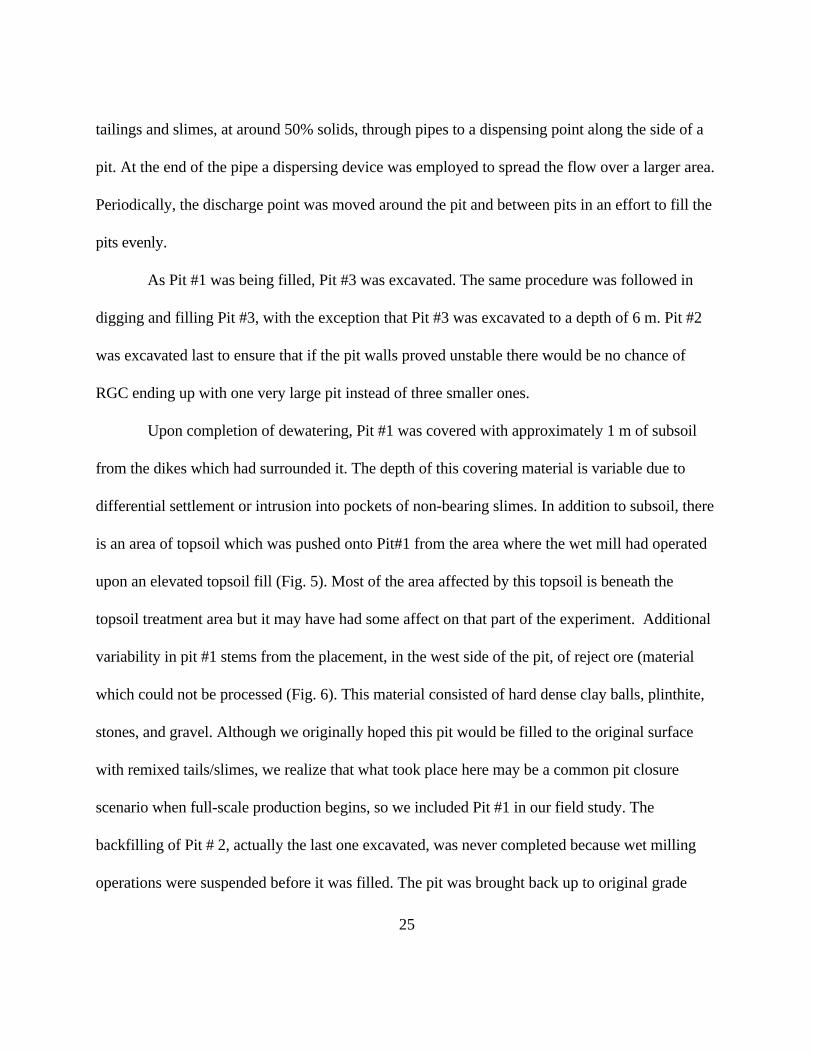
Upon completion of dewatering, Pit #1 was covered with approximately 1 m of subsoil
from the dikes which had surrounded it. The depth of this covering material is variable due to
differential settlement or intrusion into pockets of non-bearing slimes. In addition to subsoil, there
is an area of topsoil which was pushed onto Pit#1 from the area where the wet mill had operated
upon an elevated topsoil fill (Fig. 5). Most of the area affected by this topsoil is beneath the
topsoil treatment area but it may have had some affect on that part of the experiment. Additional
variability in pit #1 stems from the placement, in the west side of the pit, of reject ore (material
which could not be processed (Fig. 6). This material consisted of hard dense clay balls, plinthite,
stones, and gravel. Although we originally hoped this pit would be filled to the original surface
with remixed tails/slimes, we realize that what took place here may be a common pit closure
scenario when full-scale production begins, so we included Pit #1 in our field study. The
backfilling of Pit # 2, actually the last one excavated, was never completed because wet milling
operations were suspended before it was filled. The pit was brought back up to original grade

5.5m 11.0m 16.5m 22.0m 27.5m 33.0m 38.5m 44.0m 49.5m 55.0m
Sampling grid spacing
4.3m
8.6m
12.9m
17.2m
N
26
Figure 5. Topsoil material (shaded areas) that was pushed onto Pit 1 during surface grading.

N
27
Figure 6. Surface map showing the location of unprocessed materials dumped into Pit 1 duringbackfilling.

28
with various dike and mixed surface materials. Because there is limited chance any operational
pits will be treated in this manner, Pit #2 was not included in this study.
Due to the problems encountered during the filling of Pits #1 and #2, the filling and
surface configuration of Pit #3 became critical. In order to have a surface consisting of remixed
tails and slimes, Pit #3 was filled above original elevation in the hope that when dewatering was
complete we would have a suitable surface for installation of field plots. After back-filling was
completed (early April, 1995) the entire surface of the pit was hydroseeded with a mixture of
annual rye (Secale cereale) and redtop fescue (Agrostis alba) in an effort to speed dewatering and
control erosion around the dikes. By early June it was determined that Pit #3 had dewatered
enough to begin surface work. On June 5, 1995, a track loader was employed to remove the dikes
surrounding the pit. This was accomplished by “back-blading” the material away from the pit. The
main goal in removing the dikes in this fashion was to keep unprocessed soil material out of the
pit. Once dike removal was complete, an attempt was made to begin “walking” the tails, which
involves repeatedly driving a bulldozer back and forth across the pit surface. This proved
unworkable when the track loader became stuck and had to be pulled out several times. Over this
period it became apparent that there were two major challenges with Pit #3: (1) There was
extensive segregation of tailings and slimes; and (2) there was not enough material to bring the
surface back up to original grade. These problems were addressed by shortening the pit by about
20 m and by using the excavator to physically remix the materials. Material from the south end of
the pit was excavated and used to bring the rest of the pit up to grade. The south end of the pit
was then back-filled with subsurface materials from around the site. This enabled us to have a

29
suitable surface for plot installation that covered an area approximately 30 m by 50 m. This area
was sampled for variability in mid-July using the same grid interval as Pit #1 (4.3 m by 5.5 m).
Subsequent to the dewatering and grading of Pits 1 and 3, the entire site (except for the
undisturbed control area) received 560 kg ha P O and 168 kg ha K O on September 11. On-1 -12 5 2
September 12, the entire site received agricultural lime at a rate of 2.2 Mg ha . In an effort to-1
reduce compaction and incorporate the fertilizer, we enlisted the aid of Mr. Mark Spiers who used
a large V-ripper to rip all experimental areas to a depth of 25 cm or more. This was followed by a
thorough discing to help smooth the surface prior to the installation of experiments.
Originally, we had planned to install a replicated plot experiment involving five loading
rates of compost with four replications of each treatment. This would have required twenty plots
in each experimental area (4 pit halves plus control) for a total of 100 plots. By the time grading
of the pits was completed it became obvious, from the size of the usable pit surfaces, that if we
installed this design each plot would have to be very small (less than 3 m by 4 m). Upon
consultation with our cropping system expert, Dr. Marcus Alley, we concluded that this design
was not feasible based on his recommendation that the plots be no smaller than 4 m by 5 m. In
addition to Dr. Alley, we consulted Dr. Erik Smith of the Virginia Tech Statistics Department.
After reviewing crop yield variance data from the Ti Sands experiment (Stolt et al.,1995), he
advised us that in order to have a sound design and be capable of separating differences in yields
as low as 15%, we would need a large number of plots. With this advice in mind, we changed the
design.
To achieve our goals of sufficient plot size and statistical power, we settled on a design

30
that treats the experiment as five separate experimental units within the overall study (Fig.7). One
experiment, consisting of 24 plots measuring 3.6 m by 7.2 m was installed on the previously set-
aside area of undisturbed soil adjacent to the mined area. The second and third experimental units
were set up on Pit #1 which was divided into two experimental areas. Each area was then
subdivided into 12 plots measuring 3.6 m by 6 m (Fig. 8). On September 29, the northern half
received 30 cm of topsoil (based on the earlier RGC greenhouse studies) which had been scraped
off of the pit area prior to excavation. A bulldozer was employed to place the topsoil, and
differential settling of the pit surface made depth control difficult and variability in thickness
resulted. The southern half received composted yard waste at the rate of 112 Mg/ha on October
12. This rate was based on work by Stolt et al. (1995) at the Ti Sands project. The compost was
obtained from the Rt. 623 Landfill west of Richmond, VA (for chemical analysis of compost see
App. I). Application of compost was accomplished by weighing out the appropriate amount of
compost for each plot and raking it out to achieve even distribution.
The fourth and fifth experiments were installed on Pit #3. This area is also split between a
topsoil replacement experimental unit and a compost amendment experimental unit. Due to
insufficient retention of topsoil, Pit #3 received two topsoil applications. The first application was
from the original stockpile of topsoil and was applied on September 29. This was insufficient to
cover the experimental area to a depth of 25 cm. To remedy this, more topsoil was scraped from
an undisturbed area south of the control plots and applied to Pit #3 on October 11. Again, each
half of the pit was laid out in 3.6 m by 6 m plots. Yard waste compost was applied at the rate of
112 Mg ha by the method described above. On October 26, 1995 all plots received additional-1

31
Figure 7. Layout of experimental plots.
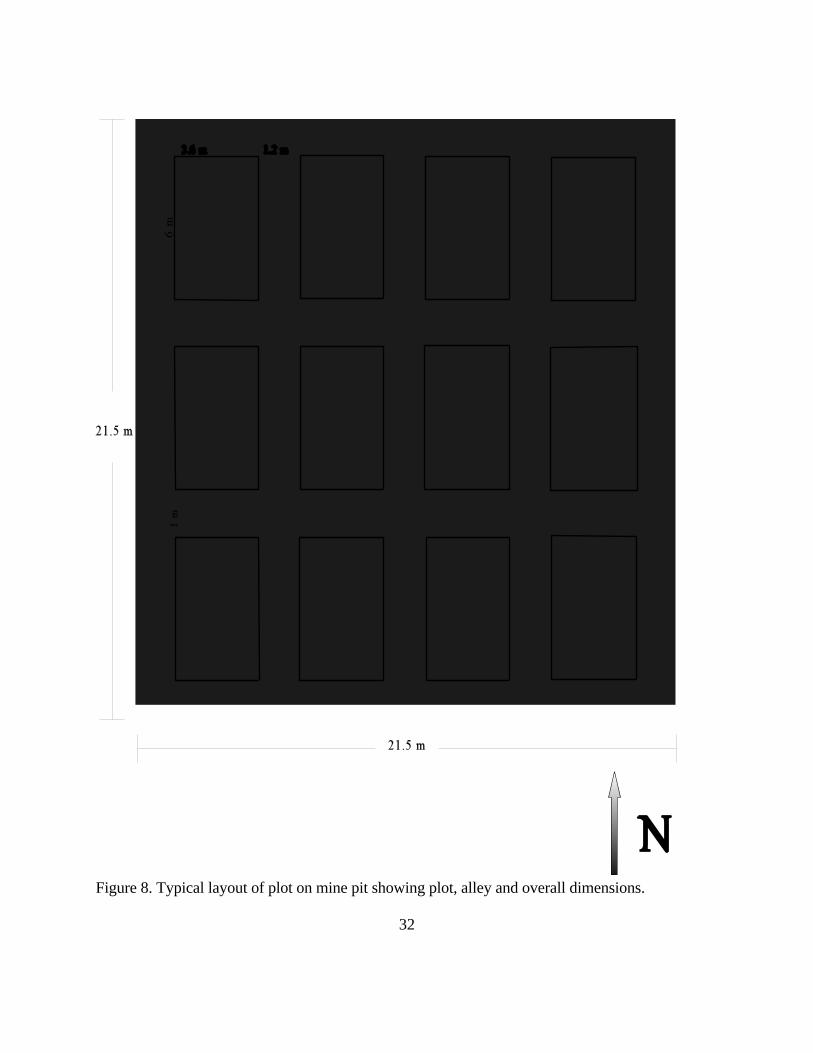
32
Figure 8. Typical layout of plot on mine pit showing plot, alley and overall dimensions.
33
fertilizer (179 Kg ha P O , 179 Kg ha K O, and 34 Kg ha N) to ensure adequate and uniform-1 -1 -12 5 2
fertility. The fertilizer was weighed out in individual plot applications and hand-applied. The
topsoil replacement areas also received 2.2 Mg ha agricultural lime to balance pH against the-1
remainder of the experimental areas. With the aid of Mr. Francis Barnes, we chisel-plowed the
topsoil treatments to break up any compaction of the topsoil due to bulldozer placement. Mr.
Barnes also disced all experimental areas to incorporate fertilizer and compost, and prior to
planting used a field cultivator to smooth and firm the seed bed. On October 27, 1995, wheat
(Triticum vulgare var. Coker 9803) was drilled at a rate of 134 kg ha . This was accomplished-1
with a conventional grain drill on a 18 cm row spacing. Several weeks after planting, Mr. Barnes
planted the balance of the surrounding Pilot Plant site with Pioneer variety 2580 wheat.
To assess stand establishment, plant population counts were taken on November 11, 1995.
This was accomplished by counting the number of plants in four 1 m lengths of row in each plot.
On February 2, 1996, 45 kg ha N was applied as UAN along with Harmony Extra-1 TM
(Thifensulfuron, and Tribenuron) at a rate of 37 ml ha for control of broadleaf weeds. Nitrogen-1
was again applied on January 11, 1996 at the rate of 101 kg ha to topsoil and control plots, and-1
34 kg ha to compost plots. The application rate was reduced on compost plots because-1
mineralization of N in the compost could lead to lodging if the full rate were applied. On May 3,
1996, Malathion was applied to control cereal leaf beatle, and on May 30, 1996 ManzateTM
(Mancozeb) and Bayleton (Tridimefor) were applied to insure that fungal disease would not beTM
a problem.
Just prior to harvest, head counts were taken for later yield component calculations.

34
Wheat was harvested on June 18, 1996. This was accomplished with a Hedge 140 research plot
combine. The center 2 m of each plot was harvested and samples were taken to Virginia Tech for
yield determination. Following wheat harvest, soil and root samples were taken from six randomly
selected plots in each treatment area.
On June 22, 1996, soybeans (var. Hutcheson ) were planted with a no-till drill in 43 cm
rows. Three days after planting, Squadron (Imazaquin, and Pendimethalin) and RoundupTM TM
(Glyphosphate) were applied at rates of 1.75 l ha and 3.5 l ha respectively to control weeds.-1 -1
Plant population counts were taken on July 24, 1996, by counting the number of plants in two 1-
m sections of row in each plot. Just prior to harvest, plant heights were measured. This was
accomplished by measuring the height of four randomly selected plants in each of the 72 plots.
The soybeans were harvested from the Topsoil treatment on Pit 3 on November 17, 1996 and the
balance of the treatments were harvested on the November 24, 1996 with the same research
combine used to harvest wheat in the spring. The split harvest was due to mechanical difficulties
with the combine and bad weather. Samples from each plot were transported to Virginia Tech for
yield calculation. After soybean harvest, pits were dug on selected plots for soil description,
sampling, and root mapping.
SOIL SAMPLING
Soil sampling began prior to the commencement of pit excavation, with deep auger
sampling of the undisturbed soil in the area of each pit. Three borings were taken from each pit
location (Fig. 9) to a depth of 300 cm. Samples of all major soil horizons were collected and
35
descriptions were written. Subsequent to excavation of Pit 1, a detailed description and sampling
of the natural soil exposed in the pit face was completed. Both of these sample sets will, along
with later samples taken from the control plots, serve as the source for baseline undisturbed soil
data.
With the completion of mining operations, Pits 1 and 3 were sampled for variability
analysis. These samples were obtained with a 7.5 cm bucket auger to a depth of at least 150 cm
on a 4.3 x 5.5 m grid (Fig. 10). Following wheat harvest, composite soil samples from the surface
of 6 randomly selected plots in each treatment were taken to a depth of 15 cm with a soil probe.
These samples were analyzed for their chemical and physical properties as described later.
Final soil samples were taken just after soybean harvest. This was accomplished by digging
pits along the edge of 18 randomly selected plots (Fig. 11). These pits were excavated to a depth
of at least 150 cm, except where ground-water intruded. A face in each pit (perpendicular to
soybean rows) was described in detail and bulk soil samples were taken from all horizons for
laboratory analysis. Three bulk density samples were taken, from each horizon of sufficient
thickness, by the core method (Blake and Hartage, 1986).
ROOTING ANALYSES
In addition to sampling the crop yield and soil parameters discussed above, root length
and distribution were studied. Following wheat harvest, root samples were obtained from six
randomly chosen plots within each treatment. A 7.5 cm bucket auger was employed to collect all
the soil and roots to a depth of 46 cm. Roots were separated from soil materials by the flotation

36
Figure 9. Location of auger sampling site for samples taken in pit areas prior to mining.

37
Figure 10. Location of variability samples taken from Pit 1. Auger borings were made at each line intersection.
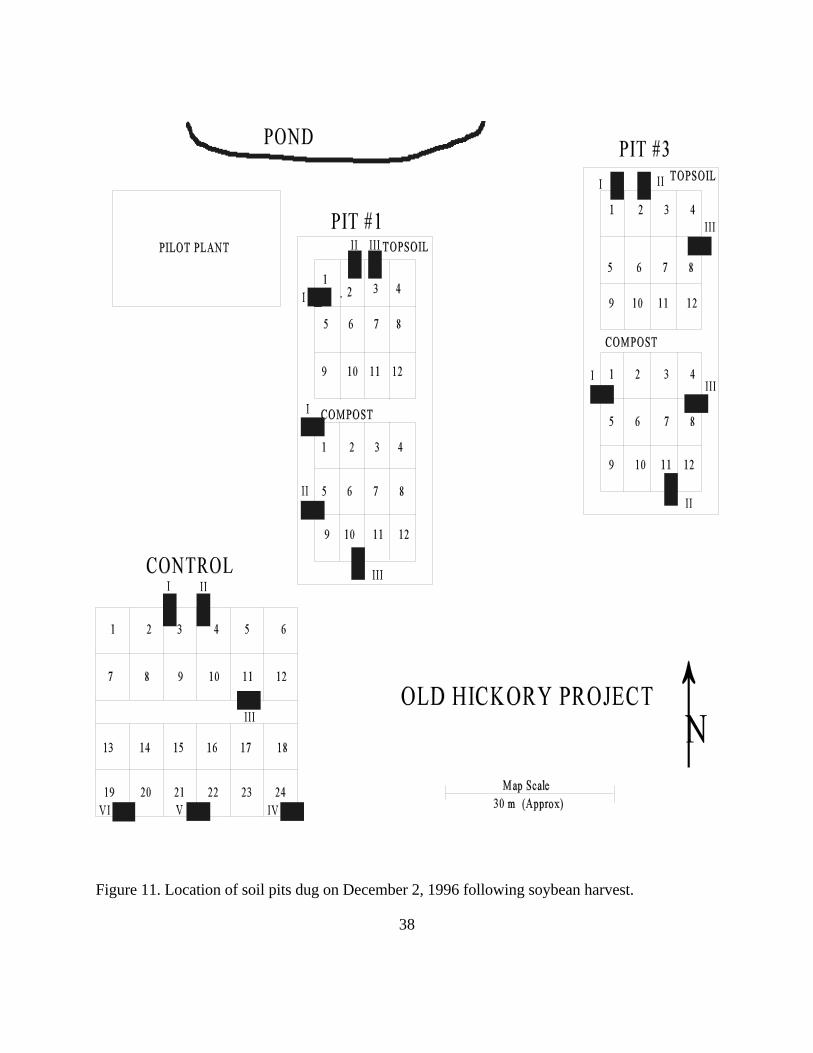
38
Figure 11. Location of soil pits dug on December 2, 1996 following soybean harvest.

39
method (Bohm, 1979). After separation, the root samples were stored in alcohol at 10 C until0
length analysis could be preformed. Root length was determined with a Delta T analyzer (DeHart
Devices LTD. Cambridge, England).
Following soybean harvest, rooting distributions were mapped by a method similar to that
described by Bohm (1976). Pit faces, perpendicular to soybean rows, were made vertical with a
spade and smoothed with a small cement trowel. About 5 cm of soil was removed from the pit
face to expose roots. A framed 1x1 m plexiglass sheet was mounted on the pit face, and root
position was mapped on a polyester film overlay by making a dot on the film for each exposed
root. Approximate horizon boundaries were also traced. Root density was estimated by assuming
that each dot represents 5 cm of root length and each map represented 0.05 m . Bohm (1977)3
concluded that this method would underestimate actual root length and density, but it should
prove adequate for comparison among treatments and between natural and disturbed soils in this
study.
SOIL PHYSICAL ANALYSIS
In the laboratory, field samples were dried, and ground to pass a 2 mm sieve. Once
ground, the samples were analyzed for particle size distribution by the pipette method (Gee and
Bauder, 1986). Water retention characteristics were determined on selected surface and
subsurface samples (Klute, 1986), and particle densities were determined by the pycnometer
method (Blake and Hartage, 1986). Bulk densities were adjusted to compensate for the high
particle density of the HM present. This was accomplished by multiplying the bulk density by the
40
ratio of observed particle density to “normal” soil particle density (i.e. 2.65 g cm ). -3
SOIL CHEMICAL ANALYSIS
Chemical analyses included pH in a 1:1 water slurry (McClean, 1982). Total C was
determined by combustion on a Leco carbon furnace. Extractable Ca, Mg, K, P, B, Zn, Fe, Al,TM
and Cu were determined by a dilute double acid extraction and inductively coupled plasma
spectrometer analysis (Donahue, 1994). Exchangeable bases were determined by extraction with
pH 7 N NH OAc (Thomas, 1982) and atomic absorption spectrophotometer analysis.4
Exchangeable H and Al were determined by BaCl -TEA and KCl extraction respectively2
(Thomas, 1982). Effective cation exchange capacity (ECEC) was taken as the sum of bases plus
KCl extractable Al. Cation exchange capacity was calculated as the sum of NH OAc4
exchangeable bases and BaCl -TEA exchangeable H. Base saturation was calculated as sum of2
bases divided by CEC.
CROP YIELD ANALYSIS
Wheat and soybean samples obtained at harvest were transported to Virginia Tech where
bulk sample weights, moisture content, average bushel weight, and grain weights were
determined. Moisture content and average bushel weights were determined with a Dickey-john
(GAC II) Grain computer.
41
DATA ANALYSIS
The overall experiment was treated as a simple one-way design with six treatments (the 4
pit and 2 control cells) and 12 replications each. A conventional overall F-test was applied to the
entire sample set for a given parameter (e.g. wheat yield) at a given time, and then the means were
contrasted with the LSD approach if the F-test was significant. To assess whether the data were
normally distributed, histograms and box plots were prepared for each data set. For data with
non-normal distribution, non-parametric methods such as the Wilcoxon rank-sum test were used.
Regression analyses were employed to compare and contrast various interactions such as soil
available-P vs carbon content.
42
Chapter 3
RESULTS AND DISCUSSION
Crop Response to Topsoil Replacement vs Compost Application.
Winter wheat and soybeans were grown from October, 1995 to November, 1996 to
evaluate crop response to topsoil replacement and compost application on material mined for
HM. With the exception of the first three weeks of July, rainfall was above normal, and 1996 was
one of the wettest years on record. Temperatures were below normal for the period as well. The
combination of high rainfall and low temperatures definitely affected crop yields and relative
treatment response. All results must be considered in relation to these weather conditions.
Wheat Yield
There were strong differences in yield among the treatments (p = 0.0001). Undisturbed
control plots produced the highest wheat yield of all experimental areas, however, there was no
difference in mean yield between the Control and the Topsoil treatment on Pit 1 (Fig. 12). Both
the Topsoil treatment on Pit 1 and the undisturbed Control were higher than typical (3000 kg ha )-1
wheat yields for this region (App. II). Of the remaining treatments, the Compost treatment on Pit
1 and the Topsoil treatment on Pit 3 produced similar yields, while the Compost treatment on Pit
3 produced lower yield than the Compost treatment on Pit 1.
Shortly after emergence, population counts were taken and, although there were no

43
Figure 12. Yield of wheat harvested from experimental plots on June 18, 1996.Means with the same letter are not different (p = 0.0001). Error bars indicate Standard error ofthe mean. C: Control, T1: Pit 1 topsoil, C1: Pit 1 compost, T3: Pit 3 topsoil, C3: Pit 3 compost.

44
differences by treatment (p = 0.23), the treatment that produced the highest yield, the Control,
also supported the highest plant population, and the treatment with the lowest population, Pit 3
Compost, had the lowest yield.
The experimental site rests on the summit and shoulder of a low ridge, with Pit 1 on the
summit and Pit 3 on the shoulder/sideslope. The control area straddles both the ridge and the
shoulder, giving it characteristics of both positions. The location of the treatment areas in relation
to the landscape appears to have influenced yield through effects on temperature and moisture
factors. Pit 1 is on the summit with the topsoil treatments raised 30 cm above the surrounding
grade (due to placement of topsoil on the surface of Pit 1), which would lead to improved soil
drainage. Because Pit 3 is on the shoulder/sideslope, it also receives runoff from the slope above
and therefore tends to remain wet longer than Pit 1. In fact, when samples were taken after wheat
harvest there was free water within 45 cm of the surface in the Compost treatment half of Pit 3.
Additionally, the Topsoil treatment on Pit 3 is raised approximately 40 cm above the Compost
treatment (again due to placement of topsoil on the surface of the pit) which directed additional
water onto the composted half. In a study of the effect of waterlogging on wheat yield in
Louisiana, Musgrave (1994) reported that grain yield was reduced by 51 % for wheat (var Coker
9877) grown on waterlogged soil compared to well drained soils. He also reported that yield
reductions were due to differences in kernel number and weight. Table 1 shows that the two
treatments with the lowest yield also had lower kernel numbers and weights.

45
Table 1. Average kernels per head and 1000 kernel weight for wheat harvested from experimental plots on June 18, 1996.
Treatment Kernels per head 1000 Kernel weight (g)
Control 26.7 a† 33.0 a‡
Pit 1 topsoil 26.7 a 33.2 a
Pit 1 compost 23.9 ab 31.5 b
Pit 3 topsoil 25.7 a 30.6 b
Pit 3 compost 20.2 b 30.9 b † Means followed by the same letter are not different (p = 0.01) ‡ Means followed by the same letter are not different (p = 0.0001)
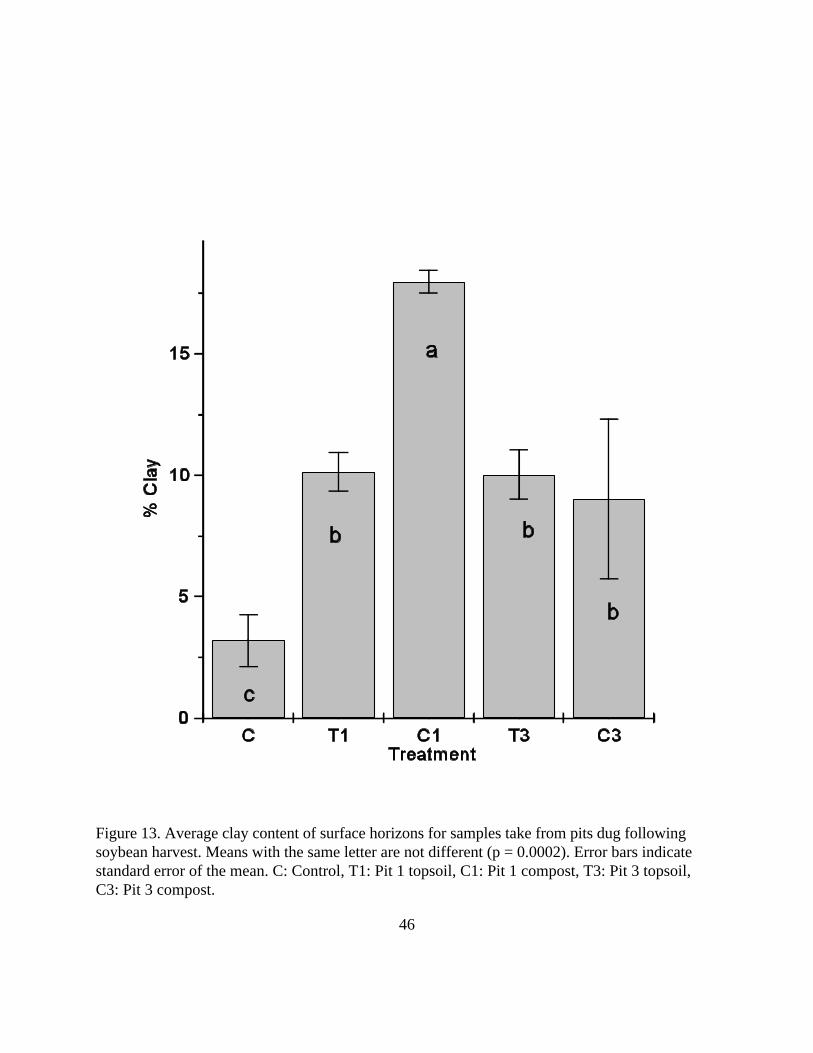
Another factor that may be evident here is the difference in texture among the treatments
(Fig.13). The Topsoil treatments contained less clay in their surface horizons than either of the
Compost treatments. Although the compost treated surface on Pit 1 contained more clay than the
Compost treatment on Pit 3, the fact that it resides in an area where water would runoff faster
may account for the higher yield as compared to Pit 3.
Another yield parameter of interest is grain moisture at harvest. Water content is a
measure of plant maturity, the lower the moisture content the more mature the plant.
Grain moisture ranged from 12.8 to 15.1 %. These differences were related to time of harvest.
Although all plots were harvested on the same day, the plots on Pit 3 were harvested late in the
afternoon due to a breakdown of the combine we used. Grain water content was lowest in the
Topsoil treatment on Pit 3 followed by Pit 3 Compost, Control, Pit 1 Topsoil, and Pit 1 Compost.
These differences were significant at the 0.05 level, but the actual range was not beyond what
46
Figure 13. Average clay content of surface horizons for samples take from pits dug following soybean harvest. Means with the same letter are not different (p = 0.0002). Error bars indicatestandard error of the mean. C: Control, T1: Pit 1 topsoil, C1: Pit 1 compost, T3: Pit 3 topsoil,C3: Pit 3 compost.

47
could normally be expected in wheat grain. Although the grain moisture does not indicate
differences in maturity, differences in maturity were obvious in the field. The plants on Pit 3
matured about 10 days ahead of the other treatments. These differences may be related to stress
on the plants. Stressed plants may mature earlier than plants not under stress. In this case, the two
treatments with the lowest water content, and hence the most mature, were Pit 3 Topsoil and Pit
3 Compost. One possible source of stress in these treatments would be the presence of ground-
water within 30 cm of the surface in the Compost treatment. There was also significant sheet
erosion uphill and deposition onto the Compost half of Pit 3 in early January, 1996. This affected
the Compost treatment on Pit 3 and to a lesser extent the Topsoil treatment. Erosion was not a
problem on Pit 1 because it is situated on a higher area of the landscape which has very little
slope. Another stress factor which may have affected the maturity of the wheat on the Pit 3
Topsoil treatment was the presence of significant amounts of annual ryegrass (Lolium multiflorum
Lam.) and resultant competition for water and nutrients.
Some of the observed treatment effects on wheat yield may be explained by the root
length data. Root length from the Control treatment was different from all other treatments
(p = 0.002). Mean root length was greatest for Control plots, followed by Pit 1 Topsoil, Pit 1
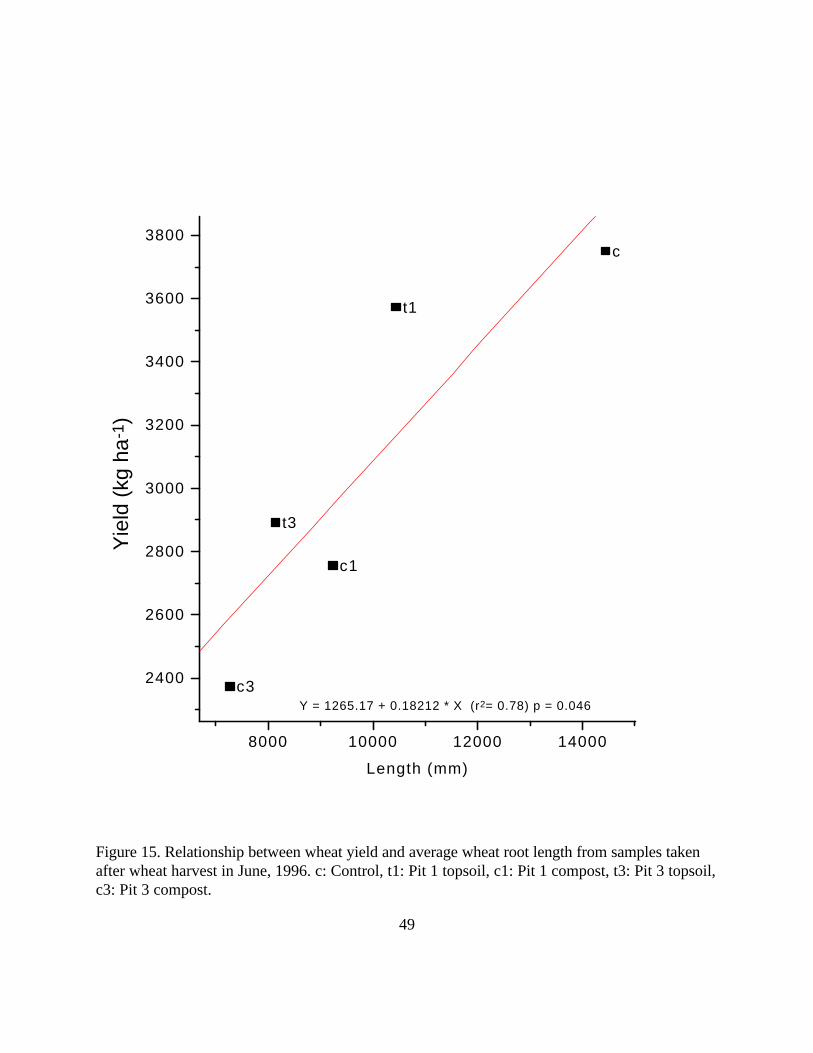
Compost, Pit 3 Topsoil, and Pit 3 Compost respectively (Fig. 14). As would be expected, there
was a linear relationship (P = 0.046) between wheat root length and yield (Fig. 15). Attempts to
correlate root length to bulk density were not successful, however. In fact, there was a positive
correlation between root length and bulk density. I believe this to be the result of weather effects
masking treatment effects.
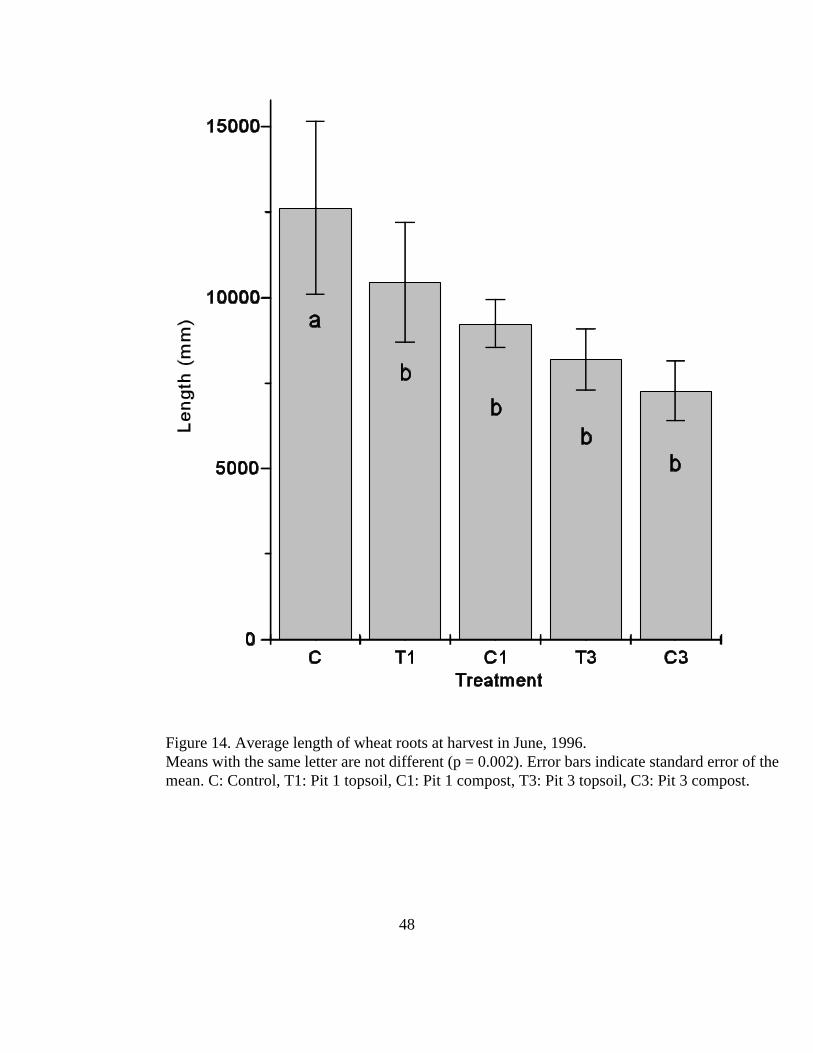
48
Figure 14. Average length of wheat roots at harvest in June, 1996.Means with the same letter are not different (p = 0.002). Error bars indicate standard error of themean. C: Control, T1: Pit 1 topsoil, C1: Pit 1 compost, T3: Pit 3 topsoil, C3: Pit 3 compost.
8000 10000 12000 14000
2400
2600
2800
3000
3200
3400
3600
3800c
t1
c1
t3
c3Y = 1265.17 + 0.18212 * X (r2= 0.78) p = 0.046
Yie
ld (
kg h
a-1
)
Length (mm)
49
Figure 15. Relationship between wheat yield and average wheat root length from samples takenafter wheat harvest in June, 1996. c: Control, t1: Pit 1 topsoil, c1: Pit 1 compost, t3: Pit 3 topsoil,c3: Pit 3 compost.

50
Analysis of other chemical and physical properties of the treatment soils revealed no other
correlations which might explain treatment effects. I believe that the two Topsoil treatments out-
yielded their companion Compost treatments due to differences in several factors. First, both of
the Topsoil treatments are elevated above their corresponding Compost treatments. This would
result in better drainage which was advantageous in the wet weather. Second, the Topsoil
treatments were coarser in texture, and therefore better drained. This would result in them
warming up faster in the spring, thus giving the wheat an advantage in cold weather. Third, N
application was reduced on the Compost treatments because we feared potential N mineralization
from the compost would lead to lodging. Although this concern was warranted, I believe the cold
weather and wet soil conditions may have limited N mineralization and therefore resulted in
sufficient N deficiency to reduce yields, but not enough to cause visible deficiency symptoms.
Finally, the added YWC in the compost plots increased water holding. This may have exacerbated
the poor drainage and excess water present in this very wet spring. Overall, excess soil water was
the main cause of low yield.
Soybean Yield
There were no differences in fall, 1996, soybean yield (Table 2) among the Control, Pit 3
topsoil, and Pit 3 Compost treatments. Yield on Pit 1 Compost was lower than Pit 3 Topsoil, but
not lower than the Control. Overall, yield was lowest for the Topsoil treatment on Pit 1. All
treatments exceeded typical yields for the region, however, based on a ten year county average of
1716 kg ha (App. II). -1
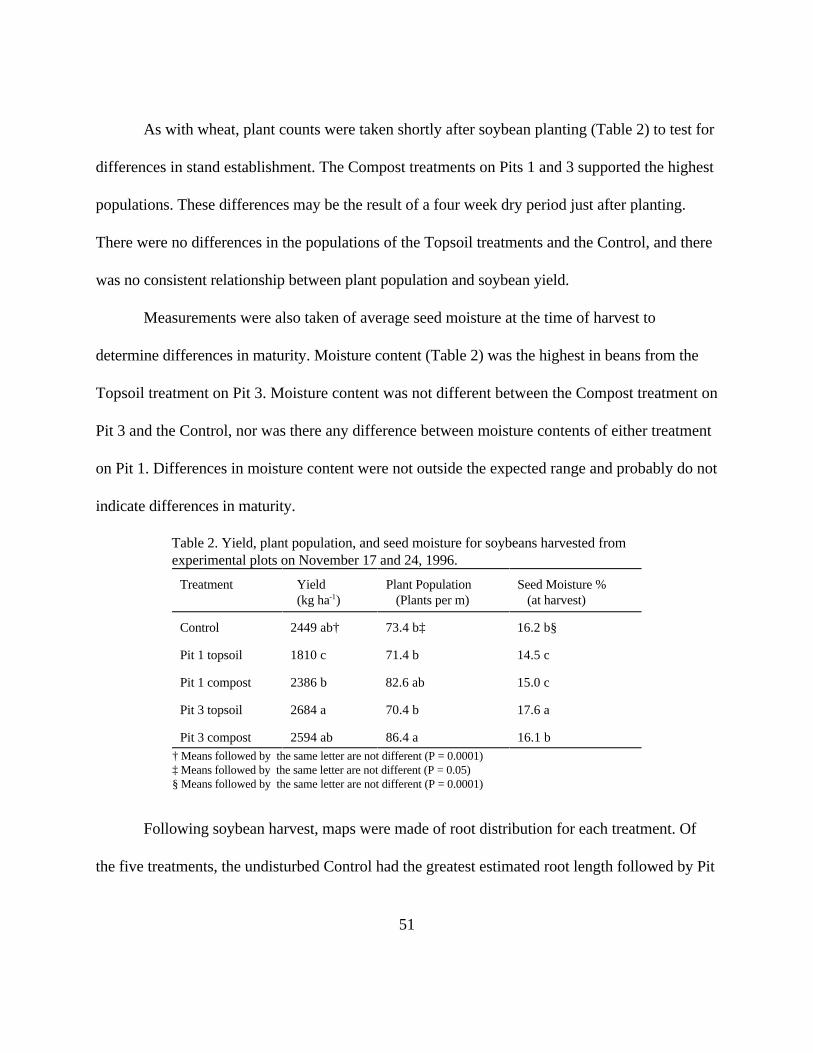
51
As with wheat, plant counts were taken shortly after soybean planting (Table 2) to test for
differences in stand establishment. The Compost treatments on Pits 1 and 3 supported the highest
populations. These differences may be the result of a four week dry period just after planting.
There were no differences in the populations of the Topsoil treatments and the Control, and there
was no consistent relationship between plant population and soybean yield.
Measurements were also taken of average seed moisture at the time of harvest to
determine differences in maturity. Moisture content (Table 2) was the highest in beans from the
Topsoil treatment on Pit 3. Moisture content was not different between the Compost treatment on
Pit 3 and the Control, nor was there any difference between moisture contents of either treatment
on Pit 1. Differences in moisture content were not outside the expected range and probably do not
indicate differences in maturity.
Table 2. Yield, plant population, and seed moisture for soybeans harvested from experimental plots on November 17 and 24, 1996.
Treatment Yield Plant Population Seed Moisture % (kg ha ) (Plants per m) (at harvest)-1
Control 2449 ab† 73.4 b‡ 16.2 b§
Pit 1 topsoil 1810 c 71.4 b 14.5 c
Pit 1 compost 2386 b 82.6 ab 15.0 c
Pit 3 topsoil 2684 a 70.4 b 17.6 a
Pit 3 compost 2594 ab 86.4 a 16.1 b † Means followed by the same letter are not different (P = 0.0001) ‡ Means followed by the same letter are not different (P = 0.05) § Means followed by the same letter are not different (P = 0.0001)
Following soybean harvest, maps were made of root distribution for each treatment. Of
the five treatments, the undisturbed Control had the greatest estimated root length followed by Pit

52
1 Compost, Pit 1 Topsoil, and Pit 3 Topsoil. Pit 3 Compost had the lowest estimated root length
(Fig. 16). There was no correlation between plot yield and total estimated root length by pit, but
the distribution of rooting with respect to depth revealed some interesting patterns. In the
undisturbed Control, significant rooting was found in all layers to a depth of at least 150 cm
(Fig. 17 ). In contrast, rooting was limited to the surface 40 cm in all the treatments on disturbed
soils except for Pit 3 Topsoil (Figs. 18-21). Roots present at up to 100 cm in the Pit 3 Topsoil
pits were probably relics from the grass mixture that was hydro-seeded on the pit surface prior to
regrading, because they were mostly found in pockets of concentrated slimes. Rooting in the
Compost treatment on Pit 1 showed some areas where roots had ventured into the subsoil by
following what appeared to be settling cracks in the regraded subsoil that covers Pit 1. This was
also seen in the second pit dug in the Topsoil treatment on Pit 1. Although there was no evidence
of roots following cracks in either treatment on Pit 3, the second pit dug into the Compost
treatment did display some development of soil structure with associated root exploration.
The fact that there was, generally, very little rooting into the subsoil of any treatment on
disturbed soil points to some physical or chemical factors inhibiting root growth. Although there
was no correlation between root length and bulk density, there is reason to believe that it was the
major factor limiting root length on both treatments on Pit 1. The surface bulk density of both the
treatments (Fig. 22 ) was in the range reported to limit root growth (Drew and Goss, 1973).
From this figure it would appear that the root growth should have been limited by bulk density in
the control also. The answer to this apparent contradiction lies in the well developed structure in
the undisturbed soils (see App. III for complete soil descriptions). Roots will follow the planes
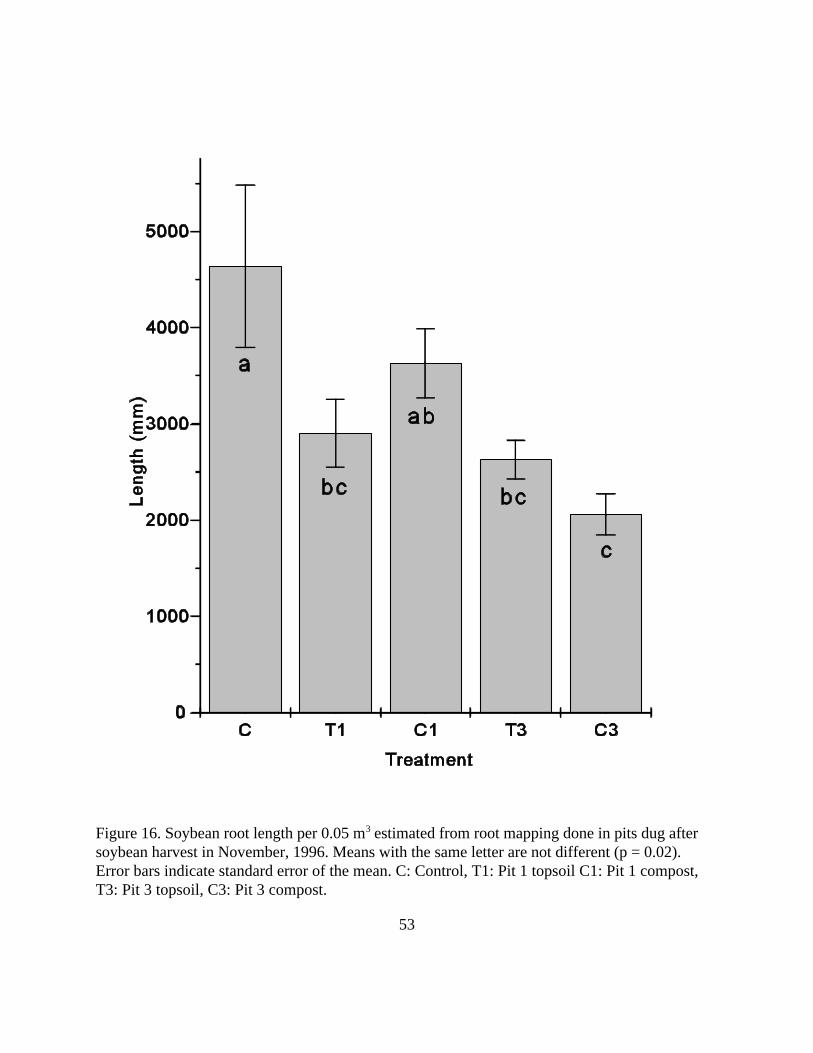
53
Figure 16. Soybean root length per 0.05 m estimated from root mapping done in pits dug after 3
soybean harvest in November, 1996. Means with the same letter are not different (p = 0.02).Error bars indicate standard error of the mean. C: Control, T1: Pit 1 topsoil C1: Pit 1 compost,T3: Pit 3 topsoil, C3: Pit 3 compost.
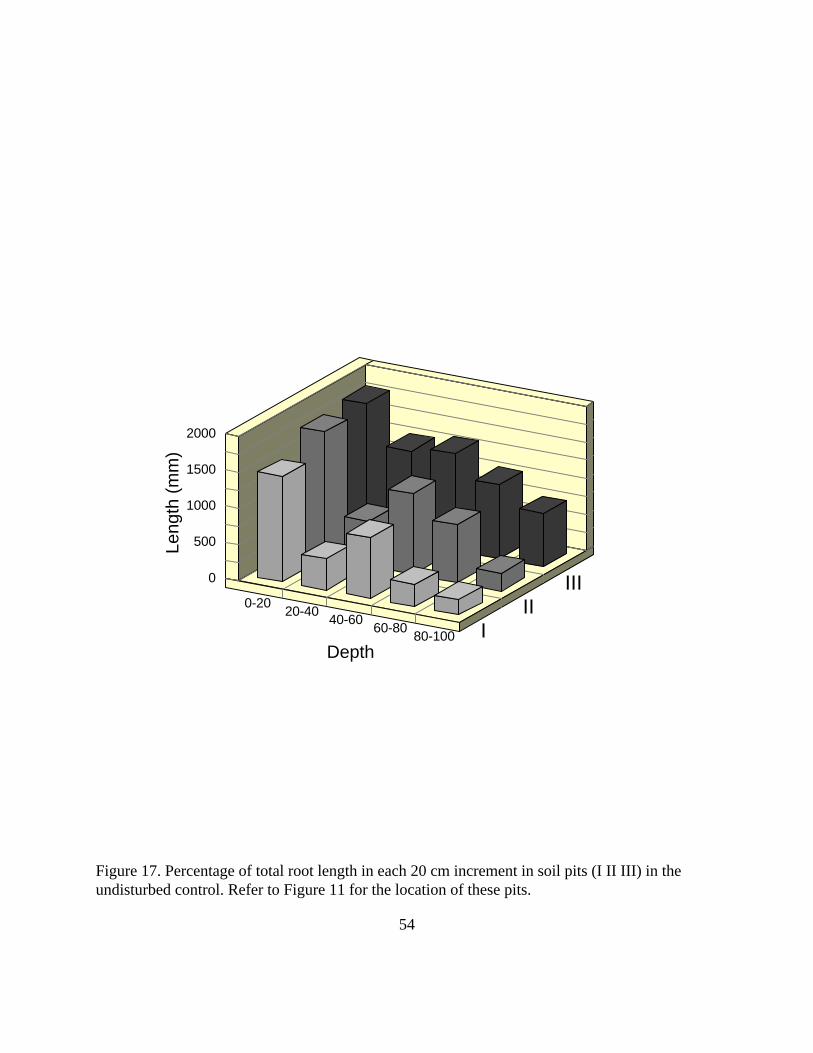
0
500
1000
1500
2000
Leng
th (
mm
)
0-2020-40
40-6060-80
80-100Depth
III
III
54
Figure 17. Percentage of total root length in each 20 cm increment in soil pits (I II III) in theundisturbed control. Refer to Figure 11 for the location of these pits.

0
500
1000
1500
2000
2500
3000
3500
Leng
th (
mm
)
0-2020-40
40-6060-80
80-100Depth
III
III
55
Figure 18. Percentage of root length in each 20 cm increment in soil pits (I II III ) in the Topsoiltreatment on Pit 1. Refer to Figure 11 for the location of these pits.

0
500
1000
1500
2000
2500
3000
3500
Leng
th (
mm
)
0-2020-40
40-6060-80
80-100Depth
I
II
III
56
Figure 19. Percentage of root length in each 20 cm increment in soil pits (I II III ) in the composttreatment on Pit 1. Refer to Figure 11 for the location of these pits.

0
500
1000
1500
2000
2500
Leng
th (
mm
)
0-2020-40
40-6060-80
80-100Depth
III
III
57
Figure 20. Percentage of root length in each 20 cm increment in soil pits (I II III ) in the Topsoiltreatment on Pit 3. Refer to Figure 11 for the location of theses pits.

0
500
1000
1500
2000
2500
Leng
th (
mm
)
0-2020-40
40-6060-80
80-100Depth
III
III
58
Figure 21. Percentage of root length in each 20 cm increment in soil pits (I II III ) in the Composttreatment on Pit 3. Refer to Figure 11 for the location of these pits.

59
Figure 22. Bulk density of surface horizons adjusted for heavy mineral content by the ratio ofactual particle density to normal soil particle density (2.65 g cm ). Means with the same letter are-3
not different (p = 0.0001). Error bars indicate standard error of the mean. C: Control, T1: Pit 1topsoil, C1: Pit 1 compost, T3: Pit 3 topsoil, C3: Pit 3 compost.
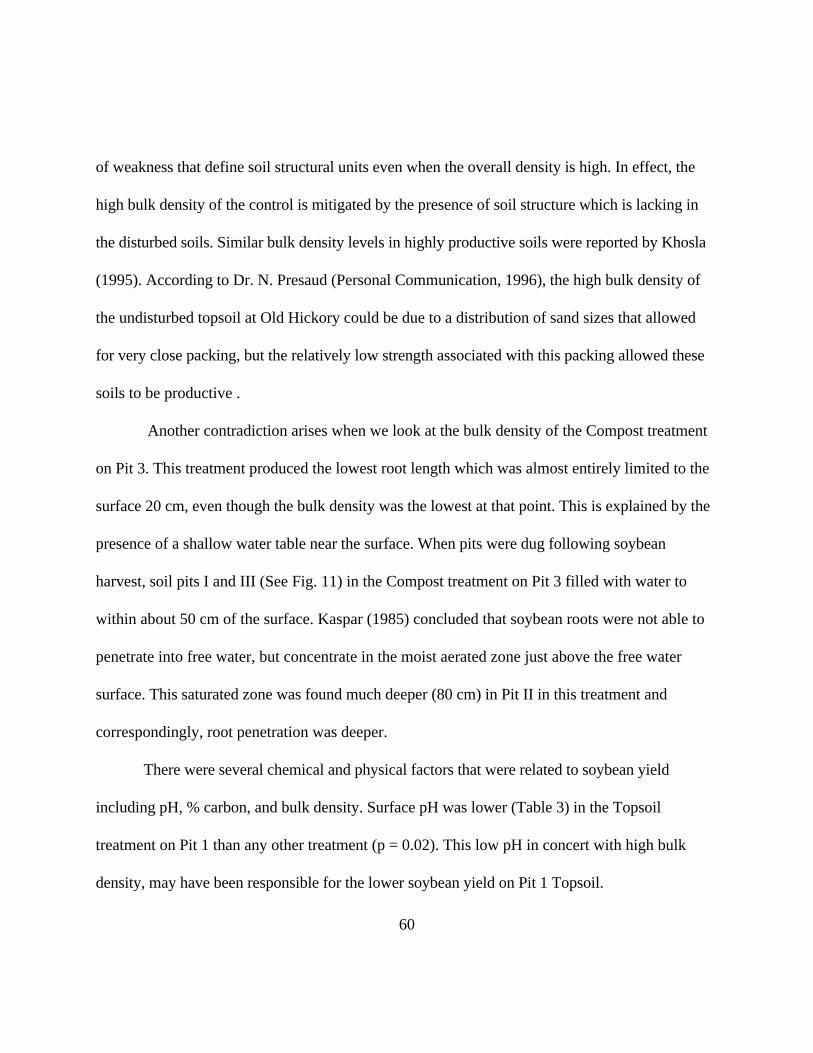
60
of weakness that define soil structural units even when the overall density is high. In effect, the
high bulk density of the control is mitigated by the presence of soil structure which is lacking in
the disturbed soils. Similar bulk density levels in highly productive soils were reported by Khosla
(1995). According to Dr. N. Presaud (Personal Communication, 1996), the high bulk density of
the undisturbed topsoil at Old Hickory could be due to a distribution of sand sizes that allowed
for very close packing, but the relatively low strength associated with this packing allowed these
soils to be productive .
Another contradiction arises when we look at the bulk density of the Compost treatment
on Pit 3. This treatment produced the lowest root length which was almost entirely limited to the
surface 20 cm, even though the bulk density was the lowest at that point. This is explained by the
presence of a shallow water table near the surface. When pits were dug following soybean
harvest, soil pits I and III (See Fig. 11) in the Compost treatment on Pit 3 filled with water to
within about 50 cm of the surface. Kaspar (1985) concluded that soybean roots were not able to
penetrate into free water, but concentrate in the moist aerated zone just above the free water
surface. This saturated zone was found much deeper (80 cm) in Pit II in this treatment and
correspondingly, root penetration was deeper.
There were several chemical and physical factors that were related to soybean yield
including pH, % carbon, and bulk density. Surface pH was lower (Table 3) in the Topsoil
treatment on Pit 1 than any other treatment (p = 0.02). This low pH in concert with high bulk
density, may have been responsible for the lower soybean yield on Pit 1 Topsoil.

61
The cause of the low pH on Pit 1 Topsoil is discussed later. The fact that the Topsoil treatment on
Pit 1 produced high wheat yield may be due to enhanced acid tolerance in wheat as compared to
legumes. Wheat can produce moderate yields at soil pH as low as 5.0 to 5.2 (Westerman, 1987) .
The relationship between yield and % total carbon was nonsignificant (p = 0.41). The two
Compost treatments logically had the highest carbon content and produced high yields (Table 3).
In contrast, the Control had relatively low carbon content, yet also produced high yield. This
contradiction is most likely due to the higher ECEC of the subsurface horizons of the Control.
Differences in ECEC are discussed in the section on soil physical and chemical properties.
Table 3. Average pH and total carbon for soil samples taken from surface horizons after soybean harvest.
Treatment pH Total Carbon
Control 5.59 a† 0.53 cd‡
Pit 1 Topsoil 5.10 b 0.41 d
Pit 1 Compost 5.47 a 1.41 a
Pit 3 Topsoil 5.73 a 0.82 bc
Pit 3 Compost 5.48 a 1.15 ab
† Means followed by the same letter are not different (p = 0.02) ‡ Means followed by the same letter are not different (p = 0.0003)
Another factor linearly related to soybean yield was bulk density (Fig. 23). Here again, the
r was low (0.23) but the trend was significant (p = 0.05). Overall, as bulk density (Bd) decreased,2
yield increased. If we look at just the control and topsoil treatments (Fig. 24) the relationship
becomes stronger (r = 0.43, p = 0.02), due to much lower surface Bd in the Compost treatments. 2

1.2 1.3 1.4 1.5 1.6 1.7 1.8
1500
2000
2500
3000
3500
t1
t1
t1
c1
c1c1
t3
t3
t3
c3
c3
c3
c
cc
c
c
c
Y = 4283.5452 + -1172.8868 X (r 2 = 0.22) p = 0.05
Bulk Density (g cm-3)
62
Figure 23. Soybean yield vs Bulk density (adjusted for heavy mineral content) for surface samplestaken from soil pits dug after soybean harvest. C: Control, t1: Pit 1 topsoil, c1: Pit 1 compost, t3:Pit 3 topsoil, c3: Pit 3 compost.
1.65 1.70 1.75 1.80 1.85
1500
2000
2500
3000
3500
t1
t1
t1
t3
t3
t3 c
cc
c
c
c
Bulk density (g cm-3)
Y = 11468.2617 + -5282.1819 X (r2 = 0.43) p = 0.02
63
Figure 24. Soybean yield on control and topsoil treatments vs bulk density (adjusted for heavymineral content) for surface samples taken from pits dug after soybean harvest. C: Control, t1: Pit1 topsoil, t3: Pit 3 topsoil.

64
These plots did not produce high yield due to other factors, namely the high water table in Pit 3
and the compacted clay subsurface in Pit 1.
Soil Morphology
The undisturbed soils in the study area are classified as Faceville (clayey, kaolinitic,
thermic Typic Kandiudults) and Varina (clayey, kaolinitic, thermic Plinthic Paleudults). These are
highly weathered soils that may date to Pliocene time. They feature sandy surfaces underlain by
clayey argillic horizons. The Ap horizons of all the profiles sampled had sand to sandy loam
textures, dark yellowish brown to yellowish red color, and ranged from 10 to 30 cm thick. They
all had weak fine granular structure, and significant rooting and macro-porosity. These surface
horizons also exhibited significant concentrations of HM. Subsurface Bt horizons had textures
that ranged from sandy clay loam to clay loam, were dark yellowish brown to dark red color, and
continued to depths of 300 cm or more. They commonly had weak to moderate subangular
blocky structure and were fairly porous. Heavy mineral concentrations were significant, but lower
than the surface horizons (for complete profile descriptions see App. III).
The first mine pit refilled ( Pit 1) contained a great deal of variability due to mining and
regrading. Due to fluctuations in pumping density and the height at which the discharge was set (1
to 1.5 m above the water surface), significant resegregation of the tails and slimes occurred
leaving a spatially variable material (Fig. 25). When pit 1 was being back-filled, the mining crew
dumped material that could not be processed by the wet mill into it. This material consisted of
hard clay balls, gravel, and plinthic masses. Upon the completion of back-filling, Pit 1 was

5 m
30 m
65
Figure 25. Diagram showing the differential settling of tailings and slimes as they are dischargedinto a mine pit.

66
covered with subsoil material from the dikes that surrounded it and the remainder of the
unprocessed material from Pit 2. As the bulldozer pushed this subsoil material across Pit 1, areas
of concentrated slimes were forced to the surface as the more consolidated subsoil material
displaced it. The surface of processed material in Pit 1 is shown in Figure 26. The areas of
concentrated slimes correlate with the deeper areas on this figure, and the peaks on this surface
relate to points where the tailings were originally discharged into the pit and formed thick fan
deposits.
The Ap horizon of the topsoil treatment of Pit 1 was defined by the depth of replaced
topsoil and ranged in thickness from 36 to 43 cm (see APP. IV, V, and VI for compleet profile
descriptions). It was dark brown in color, had a sand to loamy sand texture, few fine pores, and
few fine and medium roots. Since this is topsoil that was removed prior to mining, there was
considerable HM present. The subsurface C horizons in Pit 1 had textures ranging from clay to
sand, with colors ranging from yellow to red. These C horizons ranged in thickness from 40 to
140 cm and were structureless. There were a few roots present in the C horizons just below the
contact with the replaced topsoil. Few fine pores were present throughout these horizons. The
lower horizons, which are composed of processed material, were typically either sand or mixed
silt and clay (slime). The upper horizons were mostly regraded subsoil with small pockets of
topsoil mixed in.
The Ap horizon in the Compost treatment on Pit 1 ranged in thickness from 6 to 8 cm and
were defined by the depth to which the compost was incorporated. Color ranged from light
reddish brown to red, to black in areas of concentrated compost. The texture was sandy loam to

67
Figure 26. Surface plot of depth to processed material in Pit 1. High points represent areas ofconcentrated tailings related to fixed pipe discharge points.

68
sandy clay loam and fine and medium roots were common throughout. The presence of
incorporated compost gave rise to common fine and medium pores, although there was no
definable soil structure present. The C horizons were very similar to those under the Topsoil
treatment on Pit 1.
Like Pit 1, Pit 3 also contains a great deal of variability in spite of RGC’s efforts to remix
the material. Figure 27 depicts the depth to materials that remain stratified. The variability in
depth is related the resegregation of tailings and slimes as they were discharged into the pit. The
south end of the pit was dominated by slimes and the north end by tailings. The fluid nature of the
slimes made them easier to remix, whereas the sandy tailings resisted remixing and remain
segregated.
The Ap horizon in the Topsoil treatment on Pit 3 was thicker than the Ap horizon in the
Pit 1 topsoil treatment, ranging from 47 to 64 cm. This increased thickness was the result of the
uneven nature of the original pit surface and the split application of topsoil. The surface horizon
on Pit 3 Topsoil had the same texture and color, and in all other respects was visually identical to
the topsoil on Pit 1.
The differences in topsoil thickness on both Pits 1 and 3 from our planned 30 cm thickness
were most likely the result of subsidence of the pit surfaces during topsoil application. This
subsidence resulted in extra topsoil being added to reach the original design grade for a 30 cm
thickness over the original surface.
The Ap horizons in the Compost treatment on Pit 3 were very similar to those on the
Compost treatment of Pit 1. The only significant difference in morphology was a sandier

N
69
Figure 27. Surface map of Pit 3 showing the depth to material that was not mechanically mixed.

70
texture in Pit 3. The compost seemed to be dominating the morphology of the surface horizons on
the Compost plots to the extent that it was masking the morphological differences that I would
expect if these materials had not been amended.
The C horizons in mine Pit 3 were very different from those of Pit 1. Horizon thickness
ranged from 4 to 61 cm. Most of the horizons consisted of stratified layers which varied in
thickness from a few mm to tens of cm, and in texture from clay to sand. The color of this
material ranged from very pale brown to yellowish red. Depending on texture, these horizons
were either massive or single-grain, with the exception of some weak structural development in
the second pit dug into the Compost treatment of Pit 3. Similar rapid development of structure
was reported by Roberts et al (1988). They reported that well developed A horizons and
transitional AC horizons were present in three year-old mine soils amended with sewage sludge.
They attributed this development to the organic additions and rooting. The presence of pores
(packing voids) in these horizons is linked to texture. Areas with sandy texture had some inherent
macro-porosity while, in contrast the clayey layers were essentially devoid of macropores.
Soil Physical and Chemical Properties
There were differences in physical and chemical properties among the treatments and
between mine soils and undisturbed soils (See App. VII and IX for data). Figure 28 relates the
clay content of the surface horizons of the two mined pits prior to compost and topsoil treatment
application, and the undisturbed Control. The clay content of the surface horizon of the Control
was lower than either mine pit surface, and Pit 1 contained the most surface clay (p = 0.0001).
71
Variance within each of these means is characterized by the standard deviation, standard error,
and coefficient of variability. These were all highest for the Control. This variability is due to the
highly weathered, and eroded state of the natural soils in this area. The sand fraction of the topsoil
on the Control is dominated by quartz and HM which concentrates in the surface due to its higher
density. Clay and silt will generally move downhill and accumulate. This is evident by the increase
in clay downhill from soil pit I (1.5 %) to soil pit IV (7.8 %) (See Fig. 11).
In contrast to surface clay contents, the Control soils had more clay in subsurface horizons
than either Pits 1 or 3 (p = 0.0001). Coefficient of variability, standard deviation, and standard
error are greatest for Pit 3, and similar to those for Pit 1 (Fig. 29). Compared to the Control,
there was much more variability in the disturbed areas. The variability in clay content in the mined
pits stemmed from the methods employed to backfill and regrade them. The clay content at 100
cm in Pit 1 is controlled by the presence of the subsoil material that was pushed
onto it. This material mixed with the slimes and tailings in the pit, thereby leaving a variable
texture. This mixing also explains the lower variability in Pit 1 as compared to Pit 3. The attempt
to remix Pit 3 resulted in a fairly uniform surface, but was not successful at remixing materials at
100 cm or more.
As mentioned earlier, there were also differences in the bulk density of the surface
horizons among the treatments. Bulk density was highest in the Topsoil treatment on Pit 1 and the
undisturbed Control (Fig. 22). There was no difference in bulk density between the two Compost
treatments, and the lower bulk density in the Compost treatments was due to the aggregation of
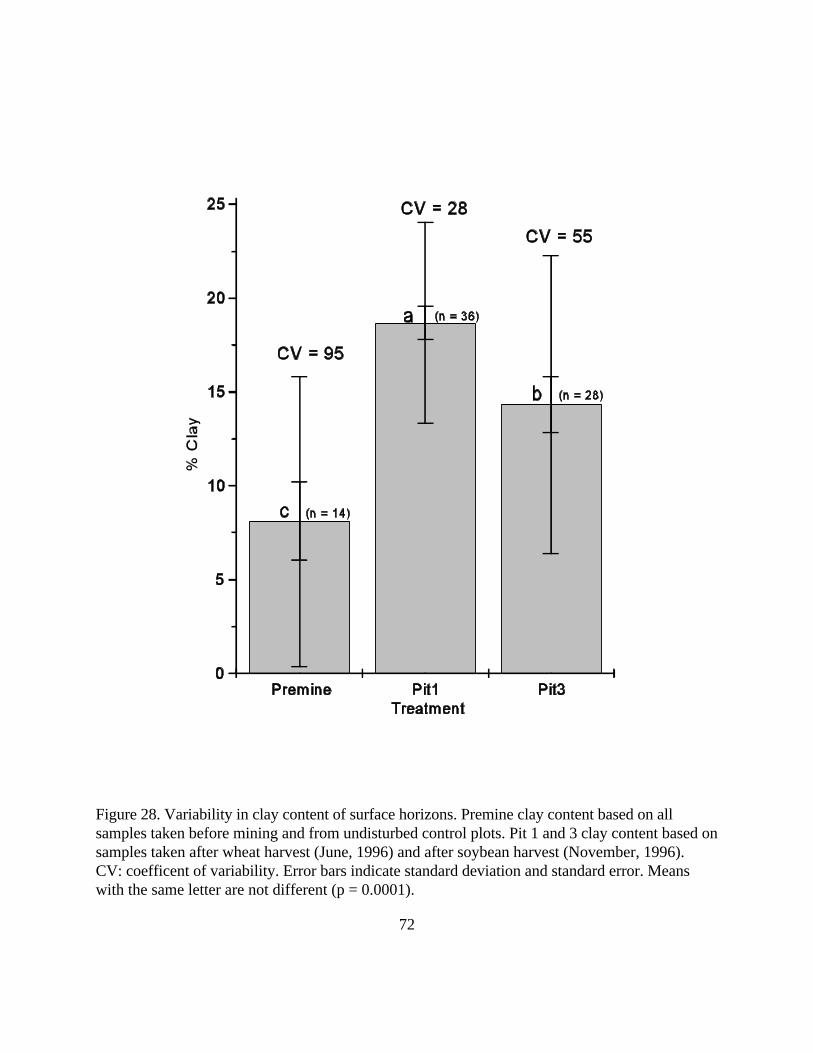
72
Figure 28. Variability in clay content of surface horizons. Premine clay content based on allsamples taken before mining and from undisturbed control plots. Pit 1 and 3 clay content based onsamples taken after wheat harvest (June, 1996) and after soybean harvest (November, 1996). CV: coefficent of variability. Error bars indicate standard deviation and standard error. Meanswith the same letter are not different (p = 0.0001).
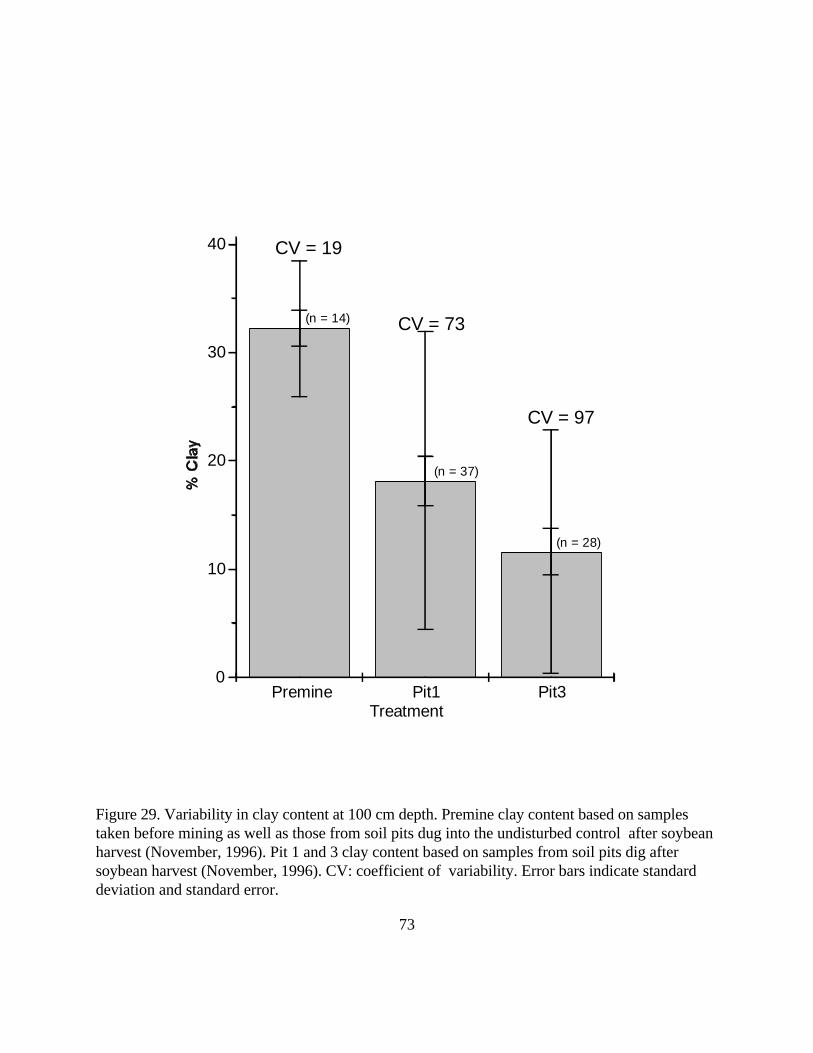
Premine Pit1 Pit30
10
20
30
40
(n = 28)
(n = 37)
(n = 14)
CV = 97
CV = 73
CV = 19
Treatment
73
Figure 29. Variability in clay content at 100 cm depth. Premine clay content based on samples taken before mining as well as those from soil pits dug into the undisturbed control after soybeanharvest (November, 1996). Pit 1 and 3 clay content based on samples from soil pits dig aftersoybean harvest (November, 1996). CV: coefficient of variability. Error bars indicate standarddeviation and standard error.

74
the compost. This is supported by the strong linear relationship between surface bulk density and
surface carbon content (Fig. 30). This compaction is most likely the result of bulldozer placement
and insufficient remedial ripping. As discussed earlier, the high bulk density of the undisturbed
Control may have been due to packing arrangement. Packing arrangement could also explain the
high bulk density in the topsoil replacement treatments, but this arrangement of particles probably
takes a long period of erosion and eluviation to develop.
Subsurface bulk density values did not differ between the undisturbed Control and either
of the two mined pits (p = 0.17). Bulk density in the mine soils, however, covered a much larger
range than in the undisturbed soils due to their stratified nature. Horizons of concentrated slime in
the mine soils were observed at densities of ~1.0 g cm , while sandy horizon bulk densities range-3
from 1.6 to 1.9 g cm . -3
Due to high variability, water holding capacity of the surface horizons among treatments
was not different at the 0.05 level (Table 4), however judging from the data it appears that the
compost plots had higher water holding capacity in their surface horizons. There were also
differences in subsurface water holding capacity between the two mine pits (p = 0.06). Although
this p-value is not very low, I believe that it is important to discuss the source of this difference.
The same stratification that affected bulk density was also at work here. The slime layers hold
large amount of water compared to the sandy layers. The presence of these layers and the
difference in particle size could lead to problems with water movement in these soils. Assuming
similar gravitational effects, water moves from areas of high matric potential to areas of low
potential. Thus when a clay layer overlies a sandy layer there will be no movement of water into

0.4 0.6 0.8 1.0 1.2 1.4 1.6 1.8
1.2
1.3
1.4
1.5
1.6
1.7
1.8t1t1
t1
c1
c1 c1
t3
t3t3
c3
c3
c3
ccc
cc
c
Y = 4.97922 - 0.46633 X (r 2=0.89) p = 0.0001
% Carbon
75
Figure 30. Carbon content vs bulk density (adjusted for heavy mineral content) for samples taken from soil pits dug after soybean harvest (November, 1996). C: Control, t1: Pit 1 topsoil, c1: Pit 1compost, t3: Pit 3 topsoil, c3: Pit 3 compost.

76
the sand until the matric potential is overcome by gravitational potential as saturation is reached.
When water begins to flow, the rate at which it percolates will be determined by the K of thesat
least permeable layer. The slime layers, due to their massive nature and lack of macropores, would
limit the flow of water under saturated conditions leading to perched water tables. When drought
conditions persist, the sandy layers will become very dry and the slime layers may hold their water
at potentials too low for plants to readily absorb.
Table 4. Water holding capacity of surface and subsurface samples taken from pits dug after soybean harvest (November 24, 1996). Subsurface samples were not differentiated by treatment but by whether they were from undisturbed or mined areas.
Treatment Surface Water Holding % Subsurface water holding %
Control 2.8 a† 4.1 a‡
Pit 1 Topsoil 2.5 a2.6 ab
Pit 1 Compost 3.3 a
Pit 3 Topsoil 2.6 a1.5 b
Pit 3 Compost 6.2 a
† Means followed by the same letter are not significant. (P = 0.2) ‡ Means followed by the same letter are not significant. (P = 0.05)
Important differences in chemical properties among the treatments include available P, Ca,
% total carbon, pH, and ECEC. Available P was highest among Pit 3 Compost, Pit 1 Compost,
and the Control (Table 5). Likewise, there was no difference between the two lower P Topsoil
treatments. These groupings are explained by a combination of factors. First, the high P in the
Compost treatments would be due to mineralization of organic P from the compost, the P
fertilizer applied before treatment application, and the availability factors discussed by Orndorf

77
(1995). Second, the high P of the Control is likely due to the combination of relatively high humus
content, and a history of P fertilization. In contrast, the Topsoil treatments are lower in humus,
and did not receive as much P fertilizer as the pit surfaces, and are therefore understandably lower
in available P. Available P levels in subsoils were not different between the Control and either of
the mined pits.
Table 5. Soil phosphorus, and calcium data. Surface values are for samples taken afterwheat harvest (June 18,1996). Subsurface Ca values are for samples taken from pits dug after soybean harvest (November 24, 1996). Subsurface samples were not differentiated by treatment but by whether they were from undisturbed or mined areas.
Treatment Surface P (ppm) Surface Ca (ppm) Subsoil Ca (ppm)
Control 10.1 a† 72.2 c‡ 313 a§
Pit 1 Topsoil 4.2 b 72.7 c182 b
Pit 1 Compost 7.4 a 137.1 a
Pit 3 Topsoil 3.1 b 111.5 b169 b
Pit 3 Compost 11.8 a 111.3 b † Means followed by the same letter are not different. (P = 0.000)
‡ Means followed by the same letter are not different. (P = 0.002)
§ Means followed by the same letter are not different. (P = 0.0002)
Plant available Ca (dilute double acid extractable) was highest in the Compost treatment
on Pit 1 (Table 5), but there was no difference in Ca levels between the Compost treatment on Pit
3 and the Topsoil treatment on Pit 3, or between the Control and the Topsoil treatment on Pit 1.
The linear relationships between Ca and both % Clay (r = 0.55) and % carbon (r = 0.93) explain2 2
the observed Ca data (Figs. 31 and 32). The Compost treatment on Pit 1 had both the highest clay
content and the highest carbon content, while the treatments with the lowest available Ca also had
the lowest clay and carbon contents. Subsurface available Ca levels were highest in the Control,

0 5 10 15 20
200
400
600
800
1000
c
c
cc
cc
t1t1t1
c1
c1c1
t3t3
t3
c3
c3
c3
Y = 152.7264 + 38.55411 X (r 2 = 0.55) p = 0.00004
% Clay
78
Figure 31. Calcium vs clay content for surface samples taken from soil pits dug after soybean harvest (November, 1996). C: Control, t1: Pit 1 topsoil, c1: Pit 1 compost, t3: Pit 3 topsoil, c3:Pit 3 compost.

0.4 0.6 0.8 1.0 1.2 1.4 1.6 1.8
200
400
600
800
1000
c
c
cc
cc
t1t1t1
c1
c1 c1
t3t3
t3
c3
c3
c3
Y = -51.71278 + 679.71299 X (r 2 = 0.93) p = 0.00001
% Carbon
79
Figure 32. Calcium content vs % carbon for surface samples taken from soil pits dug after soybean harvest (November, 1996) C: Control, t1: Pit 1 topsoil, c1: Pit 1 compost, t3: Pit 3topsoil, c3: Pit 3 compost.

80
but there was no difference between Pits 1 and 3 (Table 5). The higher Ca content of the
subsurface horizons in the Control area was likely due to its higher clay content and long history
of Ca additions in the form of lime and gypsum that are routinely applied for rowcrop production.
Lower levels in the mine soil resulted from the dilution effect of mixing soil materials from depths
of up to 6 m. The materials from the lower depths of the mine pits would likely have very little
plant available Ca. This is supported by the lower levels of Ca in the Btv horizons in the
undisturbed Control.
As expected, the carbon content in the surface horizon was greatest for the Compost
treatment on Pit 1 and the Compost treatment on Pit 3 (Table 3). The difference in carbon content
between the two Topsoil treatments may stem from the fact that the topsoil on pit 1 was stored
for about a year while Pit 3 was capped with a layer of fresh directly hauled topsoil. Abdul-
Kareem (1984) reported reduction in O.M. of up to 85 % in topsoil of a sandy soil that was
stored for eight years. Carbon content of the subsoils showed no difference between disturbed and
undisturbed areas.
Acidity of the surface horizons, as measured by pH, was lowest for the Topsoil treatment
on Pit 1 (Table 6), and did not differ among the other treatments. These values represent bulk
samples of the entire depth of replaced topsoil (30 to 50 cm ). The low pH in the topsoil on Pit 1
was likely due decomposition of organic matter and associated production of humic acids and
CO acidity during the year it was stockpiled. This should have been ameliorated when lime was2
applied in October, 1995. To better understand these low pH measurements more samples were
obtained from the surface 15 cm of all treatments on February 4, 1997. These samples indicated a

81
higher pH in the surface (0-15 cm) of the Topsoil treatment on Pit 1. The contradiction between
these pH measurements suggests that the applied lime was incorporated into the upper 15 cm of
the replaced topsoil, but did not influence deeper soil pH.
Subsurface soil pH was higher in the undisturbed Control than either mine soil (Table 6).
The lower pH in the mine soil was due to the mixing of more acidic soil materials from the lower
depths of the mining pits. This is supported by the lower pH of the Btv horizons in several of the
soil pits dug into the undisturbed control.
Table 6. Surface and Subsurface pH data. Subsoil samples were not differentiated by treatment but by whether they were from undisturbed or mined areas.
Treatment Surface pH (15 cm)† Surface pH (comp)‡ Subsoil pH
Control 5.94 5.59 a§ 5.18 a¶
Pit 1 Topsoil 5.78 5.10 b4.77 b
Pit 1 Compost 5.63 5.48 a
Pit 3 Topsoil 5.50 5.73 a4.65 b
Pit 3 compost 5.35 5.48 a
Sample taken from the upper 15 cm February 4, 1997. †
‡ Composite samples of full topsoil depth taken from soil pits dug after soybean harvest. § Means followed by the same letter are not different (p= 0.02) ¶ Means followed by the same letter are not different (p= 0.0001)
Effective CEC of the surface horizons differed among the treatments (Table 7), and there
were some interesting trends associated with this data set. The treatment with the largest ECEC
value was Pit 1 Compost. This was due to the strong relationship between ECEC and % clay
(Fig. 33), and % carbon (Fig. 34). The fact that the relationship between ECEC and clay was not
linear reveals the effect of clay content on ECEC is not independent of the effect of carbon

0 5 10 15 20
2
4
6
8
t1
t11t
c1
c1
c1
t3
t3t3c3
c3
c3
cc
c
ccc
Y = 1.84098 + -0.15885 * X + 0.0258 * X 2 (r2=0.80)
% Clay
82
Figure 33. Effective CEC vs % clay in surface horizons for samples taken from soil pits dug after soybean harvest (November, 1996). C: Control, t1: Pit 1 topsoil, c1: Pit 1 compost, t3: Pit 3 topsoil, c3: Pit 3 compost.

0.4 0.6 0.8 1.0 1.2 1.4 1.6 1.8
2
4
6
8
t1
t1t1
c1
c1
c1
t3
t3t3c3
c3
c3
cc
c
ccc
Y = -0.80253 + 5.062 X (r 2=0.86) p = 0.0001
% Carbon
83
Figure 34. Effective CEC vs % carbon in surface samples taken from soil pits dug after soybean harvest (November, 1996). C: Control, t1: Pit 1 topsoil, c1: Pit 1 compost, t3: Pit 3 topsoil, c3: Pit 3 compost.

84
content. This interaction can be seen in the position of the Pit 1 Topsoil treatment in relation to
that of the Pit 3 Topsoil treatment on figure 36. The two treatments had similar clay content but
the Topsoil treatment on Pit 1 had much lower ECEC. The lower ECEC of the Topsoil treatment
on Pit 1 is due to its’ low carbon content. This would lead to the conclusion that while clay
contributes to ECEC, carbon content is more important. This conclusion is supported by the
strongly linear relationship (r = 0.86) between ECEC and carbon content.2
Analysis of subsurface ECEC revealed that the undisturbed Control had higher ECEC than
either of the two mined pits (Table 7), and that there was no difference between the two mined
pits. The reason that the ECEC of the Control was higher relates to the ECEC vs % clay
relationship discussed earlier. The fact that no difference existed between the two mined pits
probably relates to the variability in texture discussed earlier. The upper subsurface of Pit 1 did
have higher clay and hence higher ECEC, but when this was averaged over all the observations,
there was no difference with Pit 3.
Table 7. Effective cation exchange capacity data for samples taken from pits dug after soybean harvest(November 24, 1996). Surface indicates A horizons. Subsurface
samples were not differentiated by treatment but by whether they were from undisturbed or mined areas.
Treatment Surface ECEC (cmol kg ) Subsoil ECEC (cmol kg )-1 -1
Control 1.65 b† 3.99 a‡
Pit 1 Topsoil 1.64 b1.96 b
Pit 1 Compost 7.55 a
Pit 3 Topsoil 3.72 a1.89 b
Pit 3 compost 3.66 ab † Means followed by the same letter are not different. (P = 0.01)
‡ Means followed by the same letter are not different. (P = 0.0002)

85
Chapter 4
SUMMARY AND CONCLUSIONS
Mineral sand mining in prime farmland on Virginia’s Upper Coastal Plain will present
unique reclamation challenges. This study looked at the possibility of returning this land to
agricultural production. The main focus was upon the use of returned topsoil and organic
amendments such as yard waste compost applied directly to regraded mine soil materials. To
study this possibility, two pilot-scale mine pits were amended with topsoil and compost, and crops
of winter wheat and soybeans were grown. The two mining pits represented different pit closure
scenarios. All treatments were compared to adjacent undisturbed land.
Wheat yields were highest on the undisturbed Control and the Topsoil Treatment on Pit 1,
while the lowest wheat yield was observed on the Compost treatment on Pit 3. The lower yield on
Pit 3 Compost was likely due to the presence of saturated zones near the surface of Pit 3. Another
factor affecting treatment differences in wheat yield was the infestation of ryegrass in the Topsoil
treatment on Pit 3.
Double-crop soybean yields were highest on the Topsoil treatment on Pit 3, the
undisturbed Control, and the Compost treatment on Pit 3. In contrast to wheat yield, the Topsoil
treatment on Pit 1 generated the lowest soybean yield. This was likely due to a combination of
low pH and high bulk density in this treatment. The contradiction that the Compost treatment on
Pit 3 produced the lowest wheat yield and the second highest soybean yield was related to the
combination of high water table, the high water holding of the compost, and erosion during the
86
winter reduced wheat yield. In contrast, the high water table and improved nutrient availability
due to the compost addition favored the soybean crop.
There were many differences in chemical and physical properties between the mine soils
and the undisturbed soil. There were also many differences between the two mining pits along
with significant variability within the mine pits. This variability was directly related to the mining
and reclamation methods employed. The variability is expressed as differences in texture, ECEC,
bulk density, water holding capacity, and associated chemical properties. The effect of this
variability on productivity was masked by above-average rainfall; in a more typical year I would
expect yields to be lower on all treatments, and relative effects would be more pronounced. The
main factor limiting yield in a “typical year” would be water stress. The presence of high bulk
density and low water holding in the subsoils of the mined areas would prevent plants from
obtaining sufficient water through a combination of mechanical impedance and low moisture
content of the soil that roots were able to exploit
Other effects of this variability on productivity stem from the important observed
relationships of clay and carbon content to the availability of plant nutrients. As the clay and
carbon contents increase, plant nutrients became more available. If these mine soils are to be
productive, clay and carbon contents must therefore be controlled. The key to controlling the clay
content of these mine soils is in preventing resegregation of the tailings and slimes at the point of
discharge. This could be accomplished by increasing the density at which the material is pumped
and reducing the discharge height. One possible way to achieve increased pumping density would
be to design a mixing and pumping system that could handle very high density material. Such

87
systems are in regular use in the construction industry to move concrete at very high density. Such
a system could be used to pump a dense mix of flocculated slimes and sand to the mine pits. Once
at the pit, the discharge would also have to be moved regularly as the thicker material will not
spread out as well as it does at lower density. Other advantages of pumping at higher density
would be shorter dewatering time and less surface regrading. Another possible solution to the
resegregation problem would be to find some chemical agent that could bind the sand and clay
particles together. This would make pumping density and discharge velocity much less important.
Controlling the humus content of the raw mine soils involves addition of a suitable carbon
source such as YWC, biosolids, or some other material. The possibility exists that importing this
carbon source in the form of YWC may prove too costly. If this is the case, either topsoil will
have to be replaced and a significant amount of HM will not be recovered, or some other method
of increasing carbon content will need to be employed. One possible method would be to allow
natural accumulation of carbon through the production of an herbaceous cover crop. This would
likely take many years, but could be an answer to long term reclamation if substantial organic
additions prove too costly.
If building and controlling soil humus content proves to problematic, topsoil replacement
may be unavoidable. In this case there are also problems to be addressed. The handling of topsoil
is critical to the success of its’ use on mined land. If the topsoil is stored there may be significant
degradation to its chemical and biological properties. The best method is to remove it ahead of the
mining operation and replace it directly over recently mined land. The act of placing the topsoil
also will present problems. Variability in thickness may result from bulldozer placement of topsoil

88
due to differences in the bearing capacity of the mined materials. Additionally, bulldozer
placement will cause compaction of the topsoil. This may be remedied by deep ripping, but pulling
a ripper through the soil at depths of 30 cm or more requires a great deal of force and the freshly
laid topsoil may not provide sufficient traction.
From the preceding discussion it is clear that neither of the two reclamation methods
studied is clearly better than the other. They both present unique advantages and disadvantages. I
believe the Compost treatment may be the best in the long run, especially if the resegregation
problem can be solved. The uncertainty about the effect of drought on these mine soils needs to
be addressed through further research. However, the fact that both reclamation alternatives
(topsoiling and compost additions) equaled the Control for at least one crop, and consistently
exceeded the County yield average, should be viewed as a “cautiously optimistic” indicator that
these landscapes can be returned to at least moderate levels of row-crop productivity. This
success will depend on controlling resegregation of tailings and slimes, remediating compaction in
replaced topsoil, and the building and maintaining of soil humus levels.

89
LITERATURE CITED
Abdul-Kareem, A.W. 1984. The effects on topsoil of long-term storage in stockpiles. Plant and
Soil. 73:357-363.
AME Mineral Economics. 1994. Titanium Minerals 1994. A complete cost analysis. AME
Mineral Economics, Sidney.
Barnhisel, R.I., and R.B. Gray, 1990. Managing restored prime farmland for corn production. p
143-149. In J. Skousen et al. (Eds.). Proceedings of the 1990 Mining and Reclamation
Conf. and Exhibition. Charseston, WV. April 23-26, 1990. WVA. Univ., Morgantown.
Berquist. C.R.,Jr., and B.K. Goodwin. 1989. Terrace gravel, heavy mineral deposits, and faulted
basement along and near the Fall Zone in southeast Virginia. Guidebook No. 5,
Department of Geology, College of William and Mary, Williamsburg, VA.
Birkinshaw, F. 1931. Reclaiming old mining land for agriculture. Malay. Agric. J. 19:470-476.
Blake G.R., and K.H. Hartage. 1986. Bulk density core method. P. 364-367. In A. Klute (ed.)
Methods of Soil Analysis, Part 1. 2nd ed. Agron. Monogr. 9. ASA, and SSSA, Madison,
WI.
Bledsoe, L, E.C. Varsa, S.K. Chong, F.J. Olsen, B.P. Klubek, and D.J. Stucky. 1992. The
Effects of deep tillage of reclaimed mine soils on corn root development. p. 51-58. In R.E.
Dunker, R.I. Barnhisel, and R.G. Darmody (eds.) Prime farmland reclamation. Proc.
National Symposium on Prime Farmland Reclamation St, Louis, MO. Aug.
10-14 1992.University of Illinois at Urbana Champaign.

90
Bohm, W. 1976. In-situ estimation of root length at natural soil profiles. J. Agric. Sci.,
Cambridge. 87:365-368.
Bohm, W., H. Maduakor, and H.M. Taylor. 1977. Comparison of five methods for comparing
soybean rooting density and development. Agron. J. 69:415-418.
Bohm, W. 1979. Methods of Studying Root Systems. Springer-Verlag: New York, New York.
Brooks, D.R. 1997. Personal communication. Reclamation of land disturbed for mining of heavy
mineral sand. Chapter of future ASA monograph. ASA, Madison, WI.
Bryant , E.A., R.W. Young, and D.M. Price. 1991. Evidence of tsunami sedimentation on the
southeastern coast of Australia. Geol. 100:753-765.
Caldwell, W.E., D.A. Whitney, R.E. Lamond, J.S. Hickman, and G.A. Kilgore. 1992.
Reconstructed soil depth for rowcrop production on reclaimed prime farmland in
southeast Kansas. p. 43-50. In R.E. Dunker, R.I. Barnhisel, and R.G. Darmody
(eds.) Prime farmland reclamation. Proc. National Symposium on Prime Farmland
Reclamation, St. Louis, MO. Aug. 10-14 1992.University of Illinois at Urbana
Champaign.
Carpenter, R.H. and S.F. Carpenter. 1991. Heavy mineral deposits in the Upper coastal plain of
North Carolina and Virginia. Economic Geol. 86:1657-1671.
Clapp, C. E., S.A. Stark, D.E. Clay, and W.E. Larson. 1986. Sewage sludge organic matter and
soil properties pp. 209-253. In Y. Chen et al. (Eds.) The Role of Organic Matter in
modern agriculture. Martinus Njhoff Publishers, Dordrechl, The Netherlands.

91
Crossett, R.N., D.J. Campbell, and H.E. Stewart. 1975. Compensatory growth in cereal root
systems. Plant and Soil. 42:673-683.
Daniels, W.L., L.W. Zelazney, M.M. Alley, and K.C. Haering. 1992. The development of
restoration strategies for prime agricultural soils following mineral sand mining in the
coastal plain of the eastern USA. p. 183-190. In R.E. Dunker, R.I. Barnhisel, and R.G.
Darmody (eds.) Prime farmland reclamation. Proc. National Symposium on Prime
Farmland Reclamation, St. Louis, MO. Aug. 10-14 1992.University of Illinois at Urbana
Champaign.
Daniels, W.L., L.W. Zelazney, M.M. Alley, M.H. Genthner, P. Schroeder, and V.A.L. Groover.
1995. Development of technologies for the reclamation of coastal plain soils and their
return to crop production. Research progress report. Dept of Crop and Soil
Environmental Sciences. VPI&SU, Blacksburg.
Dawson, A.G., D. Long, and D.E. Smith. 1988. The storegga slides: evidence from eastern
Scotland for a possible tsunami. Marine Geology. 82:271-276.
DeMent, J.A., S. Cooney, and J. Denman.1992. Development of a prime farmland minesoil in
selectively cast overburden in northeast Texas. p. 177-182. In R.E. Dunker, R.I.
Barnhisel, and R.G. Darmody (eds.) Prime farmland reclamation. Proc. National
Symposium on Prime Farmland Reclamation, St. Louis, MO. Aug. 10-14 1992.University
of Illinois at Urbana Champaign.
Donohue, S.J. 1994. Laboratory procedures: Virginia tech soil testing and plant analysis
laboratory. Virginia Agric. Ext. Bull. 452-881.

92
Drew, M.C., and M.J. Goss. 1973. Effects of soil physical factors on root growth. Chemistry and
Industry. 14:676-684.
Garnar, T.E., and K.J. Starnaway. 1994. Titanium minerals. p. 1071-1087. In D.P. Car (ed.)
Industrial minerals and rocks. 6th ed. Society of Mining, Metallurgy, and Exploration,
Littelton, Co.
Gerard, C.J., P. Sexton, and G. Shaw. 1982. Physical factors influencing soil strength and root
growth. Agron. J. 74:875-879.
Grandt, A.F. 1988. Productivity of reclaimed lands - cropland. pp. 1321-135. In L.R.
Hossner (ed.) Reclamation of Surface Mined Lands. CRC Press, Boca Raton, FL.
Gee, G.W., and J.W. Bauder. 1986. Particle size analysis pipette method. p. 399-404. In A. Klute
(ed.) Methods of Soil Analysis. Part 1. 2nd ed. Agron. Monogr. 9. ASA, SSSA, Madison.
WI.
Halvorson, G.A., S.W. Melsted, S.A. Schroeder, C.M. Smith, and M.W. Pole. 1986. Topsoil and
subsoil thickness requirements for reclamation of nonsodic mined-land. Soil Sci. Soc. Am.
J. 50(2):419-422.
Hargis, N.E., and E.F Redente. 1984. Soil handling for surface mine reclamation. J. Soil Water
Cons. 39:300-305.
Hodges, R.L., W.L. Daniels, and P.J. Thomas. 1997. Soil survey of Old Hickory Project area.
Crop and Soil Env. Sci. Dept., Virginia Tech, Blacksburg, VA.
93
Hooks, C.L., R.E. Dunker, S.L. Vance, and R.G. Darmody. 1992. Rowcrop response to truck
and scraper hauled root media systems in soil reconstruction. p. 19-23. In R.E. Dunker,
R.I. Barnhisel, and R.G. Darmody (eds.) Prime farmland reclamation. Proc. National
Symposium on Prime Farmland Reclamation, St. Louis, MO. Aug. 10-14 1992.University
of Illinois at Urbana Champaign.
Hornick, S.B. 1982. Crop production on waste amended gravel spoils. p. 179-194. In
Spooer, W.E., E.M. Seaker, and R.K. Bastian (Eds.) Land Reclamation and Biomass
Production with Municipal wastewater and Sludge. Pennsylvania University Press,
University Park.
Hornick, S.B. 1988. Use of organic amendments to increase the productivity of sand and gravel
spoils: Effect on yield and composition of sweet corn. Amer. J. Alternative Agriculture.
3(4):156-162.
Hortenstine, C.C., and D.F. Rothwell. 1972. Use of municipal compost in reclamation of
phosphate-mining sand tailings. J. Env. Qual. 1(4):415-418.
Hossner L.R.,S.G. Tipton, and D.G. Purdy. 1992. Reclamation of alluvial valley soils in Texas
using mixed overburden. p. 25-30. In R.E. Dunker, R.I. Barnhisel, and R.G. Darmody
(eds.) Prime farmland reclamation. Proc. National Symposium on Prime Farmland
Reclamation St. Louis, MO. Aug. 10-14 1992.University of Illinois at Urbana Champaign.
Howard, J.L., D.F. Amos, and W.L. Daniels. 1993. Alluvial soil chronosequence in the inner
coastal plain, central virginia. Quaternary Research. 39:201-213.
94
Jansen, I.J., and W.S. Dancer. 1981. Rowcrop yield response to soil horizon replacement
after mining. p. 357-362. In Proceedings of the Symposium on Surface Mining
Hydrology, Sedimentation and reclamation. Univ. Of Kentucky College of Engineering,
Louisville, Ky.
Jones, C.A. 1983. Effect of soil texture on critical bulk densities for root growth. Soil Sci. Soc.
Am. J. 47:1208-1211.
Kaspar, T.C. 1985. Growth and development of soybean root systems. P. 841-847. In R. Shibles
(ed.) Proc. World Soybean Research Conference III. Iowa State University, Aug. 12-17,
1984. Westview Press, Boulder, CO.
Kaura, D.L., and G.P. Verma. 1982. Improvement of soil structure of a degraded soil with
organic amendments. J. Ind. Soc. Soil Sci. 30(4):528-530.
King, H.F. 1911. Farmers for forty centuries: permanent agriculture in China, Korea, and Japan.
Reissued by Rodale Press, Emmaus, PA
Klute, A. 1986. Water retention: laboratory methods. p. 635-660. In A. Klute (ed.) Methods of
Soil Analysis, Part 1. 2nd ed Agron. Monogr. 9. ASA and SSSA, Madison. WI.
Khosla, R. 1995. Yield and water use efficiency of different plant populations of dryland corn and
sorghum. MS. Thesis. Virginia Polytechnic Institute and State University. Blacksburg.
pp. 98.
Larsen, C.E. 1993. Heavy minerals at the fall zone - a theoretical model of grain size, density, and
gradient. US Geological Survey Bulletin. 2039:167-180.

95
Lynd, L.E., and S.J. Lefond. 1983. Titanium minerals. p. 1303-1362. In S.J. Lefond (ed)
Industrial minerals and rocks. 5th ed. AIME, Littrlton, CO.
Mackintosh, E.E. and E.J. Mozuraitis. 1982. Agriculture and the Aggregate Industry:
Rehabilitation of extracted sand and gravel lands to an agricultural after-use. Ontario
Department of Natural Resources, Mineral Resources Branch, Industrial Mineral
Background Paper 3. Ministry of Natural Resources, Toronto, Ont.
Mankolo, R.N. 1994. Nutrient availability in mineral sand tailings amended with yard waste
compost and wood ash. Masters Thesis. VPI&SU, Blacksburg. pp. 94.
Mays, D.A., G.L. Terman, and J.C. Dugan. 1973. Municipal compost effects on crop yield and
soil properties. J. Environ. Qual. 2:89-92
McClean, E.O.. 1982. Soil pH and lime requirement. p. 199-223. In A.L. Page (ed.) Methods
of Soil Analysis, Part 2. 2nd ed Agron. Monogr. 9. ASA and SSSA, Madison. WI.
McConnell, D.B., A. Shiralipour, and W.H. Smith. 1993. Compost application improves soil
properties. Biocycle. 4:61-63.
McSweeney, K., and I.J. Jansen. 1984. Soil structure and associated rooting behavior in
minesoils. Soil Sci. Sco. Am. J. 84:607-612.
Mitchell, B.A. 1959. The ecology of tin mine spoil heaps. Malayan Forester. 22(2):111-128.
Mitchell, R.L., and W.J. Russell. 1971. Root development and rooting patterns of soybean
evaluated under field conditions. Agron. J. 63:313-316.
96
Mok, C.K., and K.H. Lim. 1985. Reclamation of tin tailings for crop production. p. 95-111. In
Advances in soil research in Malaysia. Proc. Technical workshop on soil science:
organized by UPM/DOA/Belgum, Serdang, Selangor: nov 8-10, 1983.
Morley, I.W. 1982. Black sands, The history of mineral sand mining in eastern Australia.
University of Queensland Press, St. Lucia, Australia.
Musgrave, M.E. 1994. Waterlogging effects on yield and photosynthesis in eight winter wheat
cultivars. Crop Sci. 34:1314-1318.
Nelson, W.W., and R.R. Allmaras. 1969. An improved monolith method for excavating and
describing roots. Agron. J. 61:751-754.
Obi, M.E., and P.O. Ebo. 1994. The effects of organic and inorganic amendments on soil physical
properties and maize production in a severely degraded sandy soil in southern Nigeria.
Bioresource Technology. 51(2/3):117-123.
Olsen, F.J., and J.H. Jones. 1988. Organic amendments compared to topsoil replacement for the
reclamation of prime farmland. p. 215-224. In trans. Illinois Academy of Science. 81(3,4).
Orndorf, Z.W. 1995. Phosphorus adsorption on sandy mine tailings: A comparison of treatments
with fertilizers, wood ash, and compost. MS. Thesis. VPI & SU. Blacksburg. pp. 69.
Oussible, M., and R.R. Allmaras, R.D. Wych, and R.K. Crookston. 1993. Subsurface compaction
effects on tillering and nitrogen accumulation in wheat. Agron. J. 85:619-625.
Parr, J.F., and S.B. Hornick. 1992. Agricultural use of organic amendments: a historical
perspective. Amer. J. Alternative Agriculture. 7(4)181-189.

97
Potter, K.N., F.S. Carter, and E.C. Doll. 1988. Physical properties of constructed and undisturbed
soils. Soil Sci. Soc. Am. J. 52(5):1435-1438.
Powell, J.L, R.I. Barnhisel, and C.G. Poneleit. 1988. The role of variety and population in
meeting target yield levels for phase III bond release. p. 257-265. In Proc 1988 Mine
Drainage and Surface Mine Reclamation Conference. Pittsburgh, April 17-22,1988. U.S.
Department of Interior; Bureau of Mines and Office of Surface Mine Reclamation and
Enforcement. BOM Pub # 88-3-32.
Roberts, J.A., W.L. Daniels, J.C. Bell, and J.A. Burger. 1988. Early stages of mine soil genesis
as affected by topsoiling and organic amendments. SSSA. J. 52(2):730-738
Saunders, C.L. and C.L. Clemons. 1991. Mineral sand extraction and land reclamation on a
relict beach ridge clay county, Florida. In Reclamation: a multi-discipline approach. Proc.
The National Association of State Land Reclamationists Annual Conference. Orlando, FL.
October 8-10, 1991. NASLR, Herndon, VA.
Schuman, G.E., E.J. Depuit, J.A. Smith, and L.A. King. 1985. Reclamation of bentonite mined
lands in the great plains. p. 131-150. In Symposium on the Reclamation of Lands
Disturbed by Surface Mining. A Cornerstone for Communication and
Understanding. Science Reviews Limited. Middlesex, England. 1985.
98
Semalulu O., and R.I. Barnhisel. 1992. Phosphorus availability as affected by topsoil and subsoil
mixing. p. 93-91. In R.E. Dunker, R.I. Barnhisel, and R.G. Darmody
(eds.) Prime farmland reclamation. Proc. National Symposium on Prime Farmland
Reclamation, St. Louis, MO. Aug. 10-14 1992.University of Illinois at Urbana
Champaign.
Sopper, W.E. 1993. Municipal Sludge Use in Land Reclamation. Lewis Publishers: Boca Raton,
Florida
Stanaway, K.J. 1992. Heavy mineral placers. Mining Engineering. 44:352-358.
Stolt, M.H., J.C. Baker, D.C. Martens, and J.R. McKenna. 1995. Reclamation of prime
agricultural land after surface mining mineral sands from the virginia coastal plain:
Variability in physical and chemical properties and productivity of tailings. P. 175-185. In
G.E. Shuman and G.F. Vance (eds.) Decades later: a time for reassessment. Proc. 1995
ASSMR national meeting, Gillette, WY. June 3-8. ASSMR, Princeton, WV.
Stucky, D.J., R.J. Christ, and R.L. Holmes. 1986. Greenhouse studies of growth and yield of
soybeans in sub-surface horizon materials. Reclamation and Revegetation Research. 5:
491-481
Taylor H. M. 1974. Root behavior as affected by soil structure and strength. p. 271-291. In E.W.
Carson (ed.) The Plant Root and Its Environment. UVA Press, Charlottesville, VA.
Tennant, D. 1975. A test of a modified line intersect method of estimating root length. J . Ecol.
63:995-1001.

99
Terman, G.L., J.M. Soileau, and S.E. Allen. 1973. Municipal waste compost: effects on crop
yields and nutrient content in greenhouse pot experiments. J. Environ. Qual. 2:84-88.
Thomas, G.W. 1982. Exchangeable cations. p. 159-166. In A.L. Page (ed.) Methods of soil
analysis. Part 2. 2nd ed. Agron. Monogr. 9. ASA and SSSA, Madison, WI.
Underwood, J.F., and P. Sutton. 1992. Factors influencing corn grain production on Ohio
minesoils. p. 1-9. In R.E. Dunker, R.I. Barnhisel, and R.G. Darmody
(eds.) Prime farmland reclamation. Proc. National Symposium on Prime Farmland
Reclamation, St. Louis, MO. Aug. 10-14 1992. University of Illinois at Urbana
Champaign.
Vanwormhoudt, A. 1993. Soil mineralogy of an upper coastal plain landscape in virginia.
Masters Thesis. VPI&SU, Blacksburg. pp. 136.
Waddington, J. 1971. Observation of plant roots in situ. Can. J. Bot. 49: 1850-1852.
Wells L.G., and R.I. Barnhisel. 1992. Bulk density response to placement methods and remedial
measures in reconstructed prime farmland soils. p. 213-220. In R.E. Dunker, R.I.
Barnhisel, and R.G. Darmody (eds.) Prime farmland reclamation. Proc. National
Symposium on Prime Farmland Reclamation St. Louis, MO. Aug. 10-14 1992.University
of Illinois at Urbana Champaign, Urbana.
Westerman, R.L. 1987. Soil reaction-acidity, alkalinity, and salinity. In E.G. Heyne (ed) Wheat
and Wheat Improvement. 2nd ed Agron. Monogr.13. ASA, CSSA, and SSSA, Madison,
WI.

100
Winker, C.D., and J.D. Howard. 1977. Correlation of tectonically deformed shorelines on the
southern atlantic coastal plain. Geol. 5:123-127.

101
APPENDIX I
CHEMICAL PROPERTIES OF YARD WASTE COMPOST
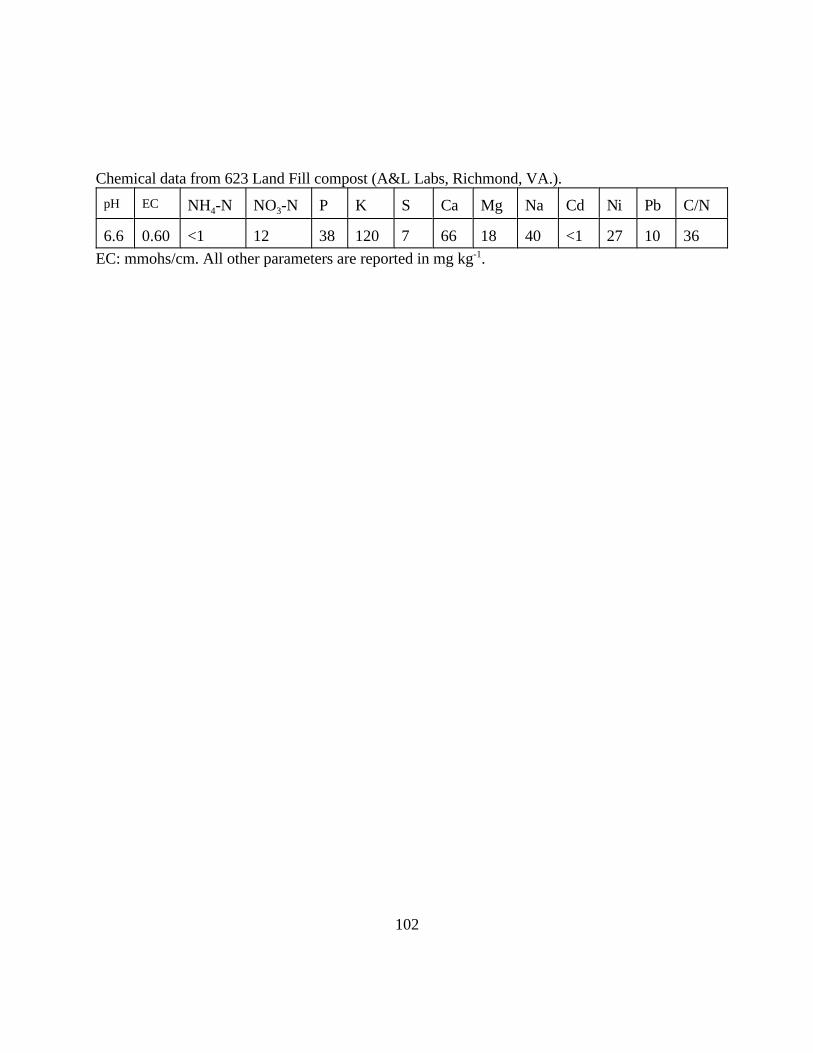
102
Chemical data from 623 Land Fill compost (A&L Labs, Richmond, VA.).
pH EC NH -N NO -N P K S Ca Mg Na Cd Ni Pb C/N 4 3
6.6 0.60 <1 12 38 120 7 66 18 40 <1 27 10 36
EC: mmohs/cm. All other parameters are reported in mg kg .-1

103
APPENDIX II
Historic Crop production data

104
YEAR
1985 1986 1987 1988 1989 1990 1991 1992 1993 1994 1995
Crop
Wheat County
Dinwiddie Harvested ac. 4500 2900 3600 3700 5000 4900 4000 4400 4400 5000 5200
Sussex 5700 3600 4500 3700 5600 5900 5500 7200 6400 6600 6800
Dinwiddie Yield (bu/ac) 23 38 36 51 45 42 45 52 48 53 60
Sussex 27 38 43 55 42 43 51 59 57 61 63
Corn grainDinwiddie Harvested ac. 5300 3100 3400 2900 3300 3100 2700 2600 1600 2200 1800
Sussex 11000 10600 7300 7100 7500 7500 7200 7300 6800 7200 3300
Dinwiddie Yield (bu/ac) 85 38 65 84 112 74 76 105 39 79 102
Sussex 125 33 63 88 99 84 84 118 58 52 114
Soy beansDinwiddie Harvested ac. 24300 18200 12800 13400 14200 13000 12800 12300 11200 12200 11700
Sussex 720000 554400 435000 554900 604800 564900 464400 523900 290700 336000 356200
Dinwiddie Yield (bu/ac) 20 21 24 29 33 28 27 31 14 29 25
Sussex 30 28 25 31 32 31 27 31 17 21 26
Cotton Dinwiddie Harvested ac. N/A N/A N/A N/A N/A N/A N/A 625 450 870 2500
Sussex N/A N/A N/A N/A N/A N/A 615 915 905 1775 8250
Dinwiddie Yield (lb/ac) N/A N/A N/A N/A N/A N/A N/A 553 512 856 502
Sussex N/A N/A N/A N/A N/A N/A 1194 635 583 834 691
Tobacco Dinwiddie Harvested ac. 1090 1080 1020 1150 1230 1410 1360 1290 1260 1180 1160
Sussex 190 180 150 205 200 220 205 195 220 200 200
Dinwiddie Yield (lb/ac) 2485 2345 2780 2575 2380 2550 2775 2470 2565 2850 2395
Sussex 2420 2115 2785 2600 2225 2825 2620 2470 2505 2765 2660

105
APPENDIX III
Morphological Descriptions of Undisturbed Control Soils

106
Location: Control plot # 3 (pit I ).†
Vegetation: Soybeans. Parent material: stratified Upper Coastal Plain fluviomarine sediments.
Physiography: Ridge summit. Relief: 15 m.
Elevation: 65 m. Slope: 2 percent.
Erosion: Moderate. Permeability: Moderate.
Described by Pamela Thomas and Phil Schroeder, 12/4/96.
Ap-- 0 to 19 cm; brown (10 YR 4/3) loamy sand: weak fine granular structure; very friable,
non-sticky, non-plastic; common fine and few medium roots; common coarse and few
very coarse pores; 20 % HM*; abrupt smooth boundary.
E-- 19 to 27 cm; brown (7.5 YR 5/4) loamy sand; single grain; loose, non-sticky, non-plastic;
common fine roots; few coarse and medium pores; 20 % HM. Clear wavy boundary.
Bt1-- 27 to 59 cm; yellowish red (5 YR 5/8) sandy clay loam; weak medium ans coarse
subangular blocky structure; friable; sticky, slightly plastic; common fine and few
medium roots; common coarse, many medium and few fine pores; few faint and many
prominent clay films on ped faces, 10 % HM; gradual smooth boundary.
Bt2-- 59 to 89 cm; yellowish red (5 YR 5/8) sandy clay loam; moderate medium and coarse
subangular blocky structure; friable; sticky, slightly plastic; common fine roots; common
coarse and medium pores; few faint clay films on ped faces, many prominent clay
bridges between sand grains; 10 % HM; gradual smooth boundary.
Bt3-- 89 to 150+ cm; red (2.5 YR 4/8) sandy clay loam; weak coarse prismatic parting to
moderate medium subangular blocky structure; friable; sticky, slightly plastic; few fine
roots; few fine and common medium pores; few faint clay films on ped faces, many
prominent clay bridges between sand grains; 10 % HM.
* Heavy mineral content based on visual estimation in situ.
† See figure 11 for the location of these pits.
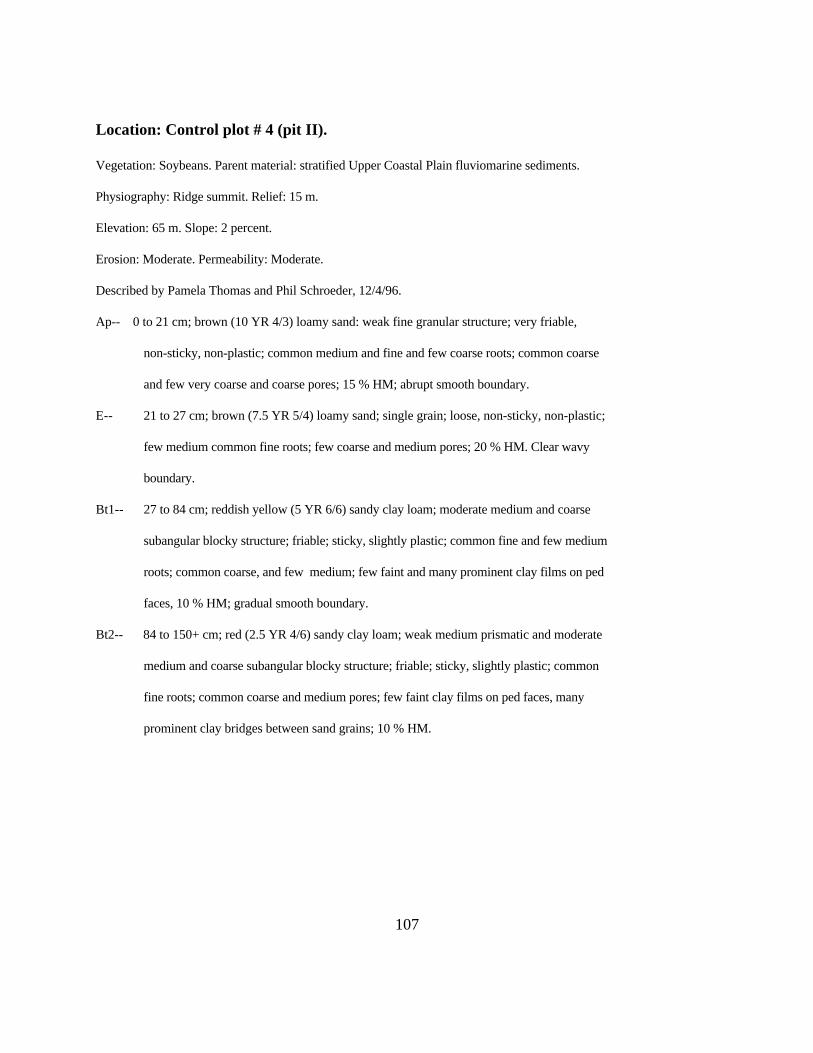
107
Location: Control plot # 4 (pit II).
Vegetation: Soybeans. Parent material: stratified Upper Coastal Plain fluviomarine sediments.
Physiography: Ridge summit. Relief: 15 m.
Elevation: 65 m. Slope: 2 percent.
Erosion: Moderate. Permeability: Moderate.
Described by Pamela Thomas and Phil Schroeder, 12/4/96.
Ap-- 0 to 21 cm; brown (10 YR 4/3) loamy sand: weak fine granular structure; very friable,
non-sticky, non-plastic; common medium and fine and few coarse roots; common coarse
and few very coarse and coarse pores; 15 % HM; abrupt smooth boundary.
E-- 21 to 27 cm; brown (7.5 YR 5/4) loamy sand; single grain; loose, non-sticky, non-plastic;
few medium common fine roots; few coarse and medium pores; 20 % HM. Clear wavy
boundary.
Bt1-- 27 to 84 cm; reddish yellow (5 YR 6/6) sandy clay loam; moderate medium and coarse
subangular blocky structure; friable; sticky, slightly plastic; common fine and few medium
roots; common coarse, and few medium; few faint and many prominent clay films on ped
faces, 10 % HM; gradual smooth boundary.
Bt2-- 84 to 150+ cm; red (2.5 YR 4/6) sandy clay loam; weak medium prismatic and moderate
medium and coarse subangular blocky structure; friable; sticky, slightly plastic; common
fine roots; common coarse and medium pores; few faint clay films on ped faces, many
prominent clay bridges between sand grains; 10 % HM.

108
Location: Control plot # 11 (pit III).
Vegetation: Soybeans. Parent material: stratified Upper Coastal Plain fluviomarine sediments.
Physiography: Ridge summit. Relief: 15 m.
Elevation: 65 m. Slope: 2 percent.
Erosion: Moderate. Permeability: Moderate.
Described by Pamela Thomas and Phil Schroeder, 12/4/96.
Ap-- 0 to 17 cm; brown (10 YR 4/3) loamy sand; few medium prominent yellowish red
(5 YR 4/6) mottles; weak fine granular structure; very friable, non-sticky, non-plastic;
few coarse, common fine and medium roots; few medium pores; 15 % HM; abrupt smooth
boundary.
Bt1-- 17 to 82 cm; yellowish red (5 YR 4/6) sandy clay loam; moderate medium and coarse
subangular blocky structure; friable; sticky, slightly plastic; common fine and few medium
roots; common coarse, many medium pores; few distinct clay films on ped faces, and many
prominent clay bridges between sand grains; 10 % HM; diffuse smooth boundary.
Bt2-- 82 to 150+ cm; red (2.5 YR 4/8) sandy clay loam; weak coarse prismatic parting to
moderate medium and coarse subangular blocky structure; friable; sticky, slightly
plastic; few fine and common medium roots; few coarse and common medium pores; few
faint clay films on ped faces, many prominent clay bridges between sand grains; 10 %
HM.
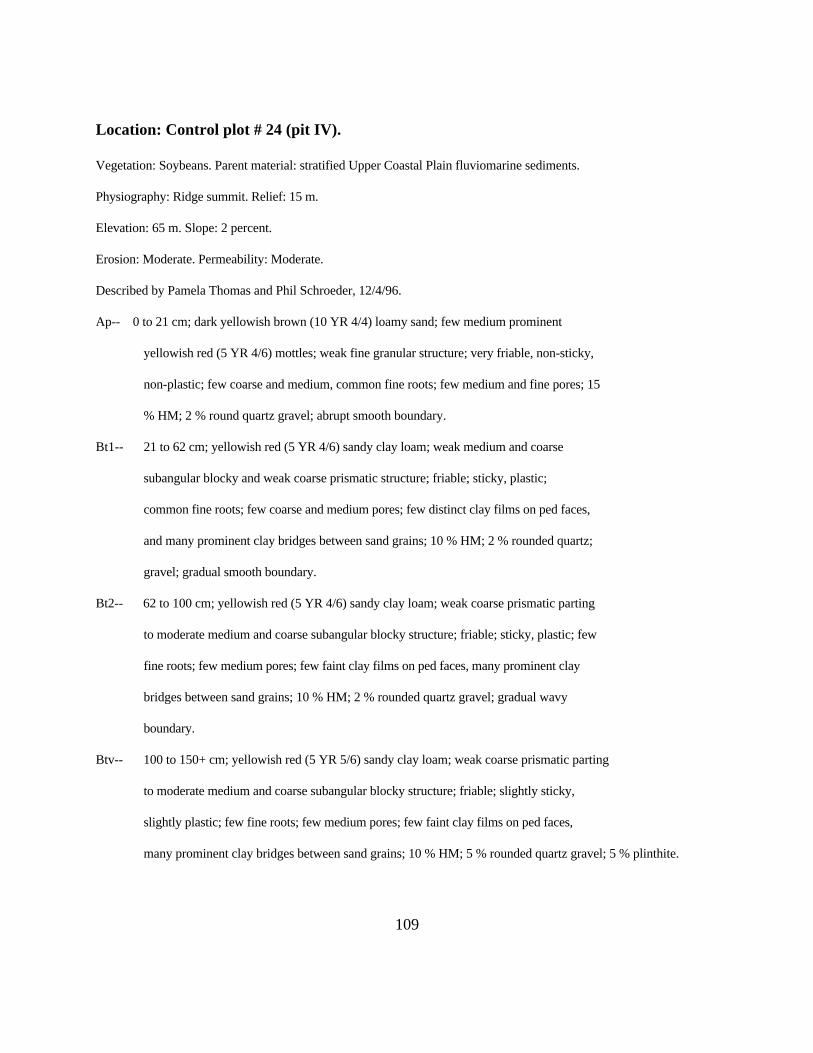
109
Location: Control plot # 24 (pit IV).
Vegetation: Soybeans. Parent material: stratified Upper Coastal Plain fluviomarine sediments.
Physiography: Ridge summit. Relief: 15 m.
Elevation: 65 m. Slope: 2 percent.
Erosion: Moderate. Permeability: Moderate.
Described by Pamela Thomas and Phil Schroeder, 12/4/96.
Ap-- 0 to 21 cm; dark yellowish brown (10 YR 4/4) loamy sand; few medium prominent
yellowish red (5 YR 4/6) mottles; weak fine granular structure; very friable, non-sticky,
non-plastic; few coarse and medium, common fine roots; few medium and fine pores; 15
% HM; 2 % round quartz gravel; abrupt smooth boundary.
Bt1-- 21 to 62 cm; yellowish red (5 YR 4/6) sandy clay loam; weak medium and coarse
subangular blocky and weak coarse prismatic structure; friable; sticky, plastic;
common fine roots; few coarse and medium pores; few distinct clay films on ped faces,
and many prominent clay bridges between sand grains; 10 % HM; 2 % rounded quartz;
gravel; gradual smooth boundary.
Bt2-- 62 to 100 cm; yellowish red (5 YR 4/6) sandy clay loam; weak coarse prismatic parting
to moderate medium and coarse subangular blocky structure; friable; sticky, plastic; few
fine roots; few medium pores; few faint clay films on ped faces, many prominent clay
bridges between sand grains; 10 % HM; 2 % rounded quartz gravel; gradual wavy
boundary.
Btv-- 100 to 150+ cm; yellowish red (5 YR 5/6) sandy clay loam; weak coarse prismatic parting
to moderate medium and coarse subangular blocky structure; friable; slightly sticky,
slightly plastic; few fine roots; few medium pores; few faint clay films on ped faces,
many prominent clay bridges between sand grains; 10 % HM; 5 % rounded quartz gravel; 5 % plinthite.

110
Location: Control plot # 22 (pit V).
Vegetation: Soybeans. Parent material: stratified Upper Coastal Plain fluviomarine sediments.
Physiography: Ridge summit. Relief: 15 m.
Elevation: 65 m. Slope: 2 percent.
Erosion: Moderate. Permeability: Moderate.
Described by Pamela Thomas and Phil Schroeder, 12/4/96.
Ap-- 0 to 19 cm; dark grayish brown (10 YR 4/2) loamy sand; weak fine granular structure;
very friable, non-sticky, non-plastic; few coarse and medium, common fine roots; few
coarse and common medium pores; 10 % HM; abrupt smooth boundary.
Bt1-- 19 to 93 cm; yellowish red (5 YR 4/6) sandy clay loam; weak medium and coarse
subangular blocky and weak coarse prismatic structure; friable; sticky, slightly plastic;
few coarse, common fine and medium roots; few coarse and common medium pores; few
distinct clay films on ped faces, and many prominent clay bridges between sand grains;
10 % HM; gradual smooth boundary.
Bt2-- 93 to 162 cm; red (2.5 YR 4/6) sandy clay loam; few common prominent brownish yellow
mottles; weak coarse prismatic parting to weak coarse subangular blocky structure;
friable; sticky, plastic; few fine roots; few coarse and common medium pores; few faint
clay films on ped faces, many prominent clay bridges between sand grains; 10 % HM;
gradual wavy boundary.
Btv-- 162 to 187+ cm; red (2.5 YR 5/8) sandy clay loam; weak coarse prismatic parting to
weak coarse subangular blocky structure; friable; sticky, slightly plastic; few fine roots;
few medium pores; common distinct clay bridges between sand grains; 2 % HM; 5 %
rounded quartz gravel; 5 % plinthite.

111
Location: Old Hickory Test Pit 1, east wall.
Classification: Fine-loamy, siliceous, thermic Typic Kandiudults.
Vegetation: Soybeans.
Parent material: Stratified Upper Coastal Plain fluviomarine sediments.
Physiography: Ridge summit. Relief: 15 m.
Elevation: 65 m.,Slope: 2 percent.
Aspect: SE 110 degrees. Erosion: Moderate.
Permeability: Moderate. Drainage: Well drained.
Sampled by: Mike Genthner and Phil Schroeder, 11/4/94.
Ap-- 0 to 30 cm; dark yellowish brown (10YR 4/4) loamy sand; weak fine granular structure; very friable,
non-sticky, non-plastic; common medium and many fine roots; abrupt smooth boundary.
Bt1-- 30 to 76 cm; yellowish red (5YR 4/6) sandy loam; weak medium subangular blocky structure;
friable, slightly sticky, slightly plastic; many fine roots; gradual smooth boundary.
Bt2-- 76 to 168 cm; red (2.5YR 4/6) sandy clay loam; weak coarse subangular blocky structure; firm,
slightly sticky, slightly plastic; gradual smooth boundary; common fine roots.
Bt3-- 168 to 234 cm; red (2.5YR 4/6) sandy clay loam; moderate medium subangular blocky structure;
friable, slightly sticky, slightly plastic; gradual smooth boundary; few fine roots.
Bt4-- 234 to 305 cm; red (2.5YR 4/8) sandy loam; weak medium subangular blocky structure; friable,
slightly sticky, slightly plastic; gradual boundary.
C-- 305 to 371 cm; strong brown (7.5YR 4/8) loamy sand; massive; friable, slightly sticky, non-plastic; 2
percent plinthite nodules; few fine vertical white (10YR 8/1) clay depletions; gradual boundary.
Cv-- 371 to 410+cm; mixed dark red (2.5YR 3/6) and yellowish red (5YR 5/8) sand; massive; friable,
non-sticky, non-plastic; 5 percent plinthite nodules; many fine and medium white (10YR 8/1) clay
depletions.
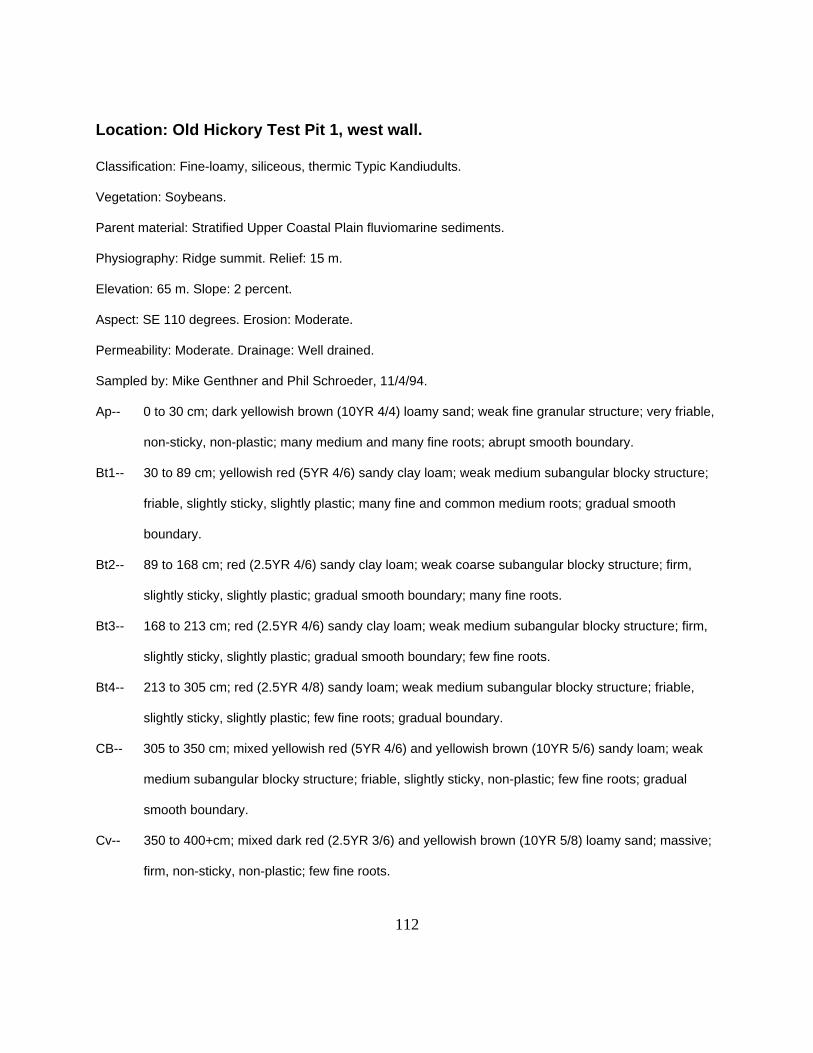
112
Location: Old Hickory Test Pit 1, west wall.
Classification: Fine-loamy, siliceous, thermic Typic Kandiudults.
Vegetation: Soybeans.
Parent material: Stratified Upper Coastal Plain fluviomarine sediments.
Physiography: Ridge summit. Relief: 15 m.
Elevation: 65 m. Slope: 2 percent.
Aspect: SE 110 degrees. Erosion: Moderate.
Permeability: Moderate. Drainage: Well drained.
Sampled by: Mike Genthner and Phil Schroeder, 11/4/94.
Ap-- 0 to 30 cm; dark yellowish brown (10YR 4/4) loamy sand; weak fine granular structure; very friable,
non-sticky, non-plastic; many medium and many fine roots; abrupt smooth boundary.
Bt1-- 30 to 89 cm; yellowish red (5YR 4/6) sandy clay loam; weak medium subangular blocky structure;
friable, slightly sticky, slightly plastic; many fine and common medium roots; gradual smooth
boundary.
Bt2-- 89 to 168 cm; red (2.5YR 4/6) sandy clay loam; weak coarse subangular blocky structure; firm,
slightly sticky, slightly plastic; gradual smooth boundary; many fine roots.
Bt3-- 168 to 213 cm; red (2.5YR 4/6) sandy clay loam; weak medium subangular blocky structure; firm,
slightly sticky, slightly plastic; gradual smooth boundary; few fine roots.
Bt4-- 213 to 305 cm; red (2.5YR 4/8) sandy loam; weak medium subangular blocky structure; friable,
slightly sticky, slightly plastic; few fine roots; gradual boundary.
CB-- 305 to 350 cm; mixed yellowish red (5YR 4/6) and yellowish brown (10YR 5/6) sandy loam; weak
medium subangular blocky structure; friable, slightly sticky, non-plastic; few fine roots; gradual
smooth boundary.
Cv-- 350 to 400+cm; mixed dark red (2.5YR 3/6) and yellowish brown (10YR 5/8) loamy sand; massive;
firm, non-sticky, non-plastic; few fine roots.

113
Descriptions from auger borings in pit areas prior to mining (see Figure 9 for the
location of these borings).
VT 1A
Ap-- 0 to 25 cm; dark yellowish brown (10YR 4/4) loamy sand; weak fine granular
structure; very friable, nonsticky, nonplastic; abrupt boundary.
Bt1-- 25 to 76 cm; strong brown (7.5YR 4/6) sandy clay loam; weak coarse subangular
blocky structure; friable, slightly sticky, plastic; clear boundary.
Bt2-- 76 to 152 cm; red (2.5YR 4/6) sandy clay; weak coarse subangular blocky
structure; friable, sticky, plastic; diffuse boundary.
Bt3-- 152 to 198 cm; red (2.5YR 4/6) sandy clay; weak coarse subangular blocky
structure; friable, sticky, plastic; gradual boundary.
Bt4-- 198 to 259 cm; red (2.5YR 4/8) sandy loam; weak medium subangular blocky
structure; friable, slightly sticky, slightly plastic; clear boundary.
BC-- 259 to 305 cm; yellowish red (5YR 5/8) loam; weak medium subangular blocky
structure; friable, slightly sticky, nonplastic.

114
VT 1B
Ap-- 0 to 20 cm; dark yellowish brown (10YR 4/4) loamy sand; weak fine and medium
granular structure; very friable, nonsticky, nonplastic; abrupt boundary.
Bt1-- 20 to 58 cm; yellowish red (5YR 4/6) sandy clay loam; weak medium and coarse
subangular blocky structure; friable, sticky, slightly plastic, clear boundary.
Bt2-- 58 to 132 cm; red (2.5YR 4/6) sandy clay loam; weak medium and coarse
subangular blocky structure; friable, sticky, plastic; gradual boundary.
Bt3-- 132 to 191 cm; red (2.5YR 4/8) sandy clay loam; weak medium subangular
blocky structure; friable, sticky, slightly plastic; gradual boundary.
BC-- 191 to 229 cm; red (2.5YR 4/8) sandy loam; weak medium subangular blocky
structure; friable, slightly sticky, slightly plastic; clear boundary.
C1-- 229 to 274 cm; strong brown (7.5YR 5/8) loamy sand; few medium distinct
yellowish red (5YR 5/8) mottles; weak medium subangular blocky structure;
friable, slightly sticky, nonplastic; clear boundary.
C2-- 274 to 305 cm; brownish yellow (10YR 6/8) and white (10 YR 8/1) sand;
massive; friable, nonsticky, nonplastic.

115
VT 1C
Ap-- 0 to 15 cm; reddish brown (5YR 4/4) sandy loam; weak fine, medium, and coarse
subangular blocky structure; friable, slightly sticky, slightly plastic; abrupt
boundary.
Bt1-- 15 to 51 cm; red (2.5YR 4/6) sandy clay loam; weak medium and coarse
subangular blocky structure; friable, sticky, plastic; clear boundary.
Bt2-- 51 to 107 cm; dark red (2.5YR 3/6) sandy clay loam; weak medium and coarse
subangular blocky structure; friable, sticky, plastic; gradual boundary.
Bt3-- 107 to 173 cm; red (2.5YR 4/6) sandy loam; weak medium subangular blocky
structure; friable, slightly sticky, slightly plastic; gradual boundary.
BC-- 173 to 231 cm; red (2.5YR 4/8) loamy sand; weak medium subangular blocky
structure; friable, slightly sticky, nonplastic; gradual boundary.
C-- 231 to 305 cm; brownish yellow (10YR 6/8) and white (10YR 8/1) sand;
massive; very friable, nonsticky, nonplastic.

116
VT 2A
Ap-- 0 to 18 cm; dark yellowish brown (10YR 4/4) loamy sand; weak fine granular
structure; very friable, nonsticky, nonplastic; abrupt boundary.
Bt1-- 18 to 81 cm; yellowish red (5 YR 4/6) sandy clay loam; weak medium and coarse
subangular blocky structure; friable, slightly sticky, slightly plastic; clear
boundary.
Bt2-- 81 to 137 cm; red (2.5YR 4/6) sandy clay loam; weak medium and coarse
subangular blocky structure; friable, slightly sticky, slightly plastic; diffuse
boundary.
Bt3-- 137 to 188 cm; red (2.5YR 4/6) sandy clay loam; weak medium and coarse
subangular blocky structure; friable, slightly sticky, slightly plastic; gradual
boundary.
Bt4-- 188 to 239 cm; red (2.5YR 4/6) sandy loam; weak medium and coarse
subangular blocky structure; friable, slightly sticky, slightly plastic; gradual
boundary.
BC-- 239 to 305 cm; yellowish red (5YR 5/8) loamy sand; weak medium and coarse
subangular blocky structure; friable, slightly sticky, nonplastic.
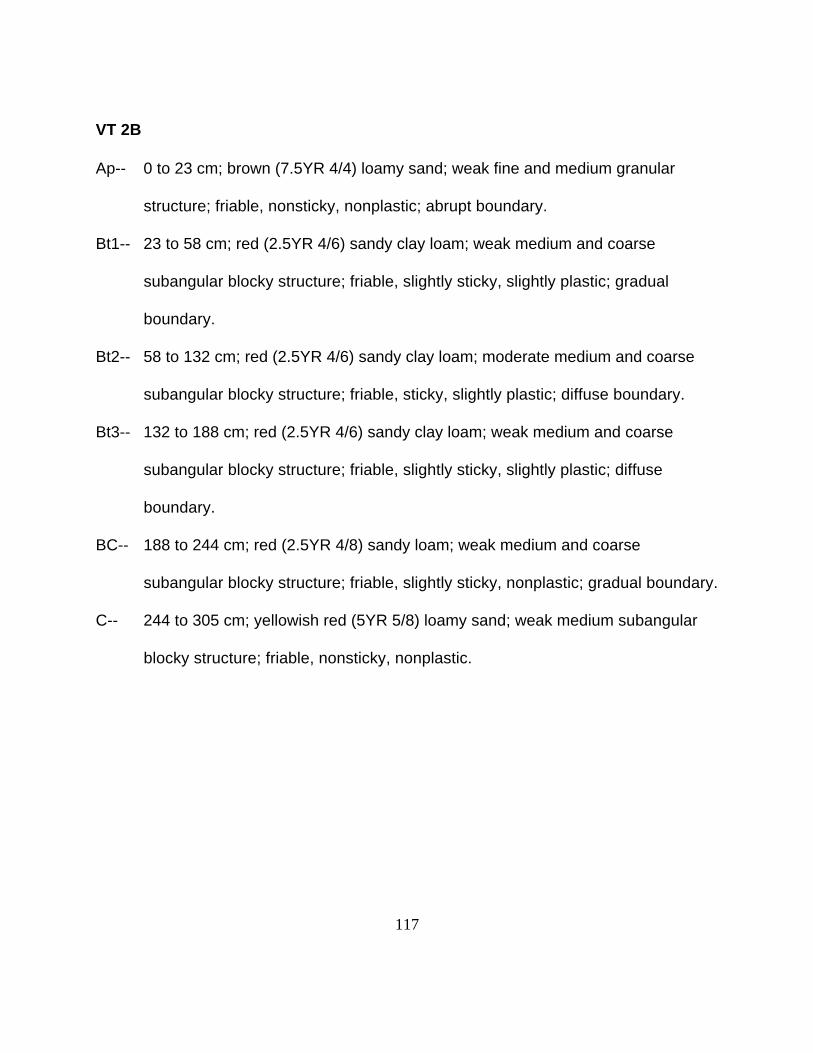
117
VT 2B
Ap-- 0 to 23 cm; brown (7.5YR 4/4) loamy sand; weak fine and medium granular
structure; friable, nonsticky, nonplastic; abrupt boundary.
Bt1-- 23 to 58 cm; red (2.5YR 4/6) sandy clay loam; weak medium and coarse
subangular blocky structure; friable, slightly sticky, slightly plastic; gradual
boundary.
Bt2-- 58 to 132 cm; red (2.5YR 4/6) sandy clay loam; moderate medium and coarse
subangular blocky structure; friable, sticky, slightly plastic; diffuse boundary.
Bt3-- 132 to 188 cm; red (2.5YR 4/6) sandy clay loam; weak medium and coarse
subangular blocky structure; friable, slightly sticky, slightly plastic; diffuse
boundary.
BC-- 188 to 244 cm; red (2.5YR 4/8) sandy loam; weak medium and coarse
subangular blocky structure; friable, slightly sticky, nonplastic; gradual boundary.
C-- 244 to 305 cm; yellowish red (5YR 5/8) loamy sand; weak medium subangular
blocky structure; friable, nonsticky, nonplastic.

118
VT 2C
Ap-- 0 to 13 cm; reddish brown (5YR 4/4) sandy loam; weak fine and medium
subangular blocky structure; friable, slightly sticky, nonplastic; abrupt boundary.
Bt1-- 13 to 61 cm; reddish brown (2.5YR 4/4) sandy clay loam; weak medium and
coarse subangular blocky structure; friable, slightly sticky, slightly plastic;
gradual boundary.
Bt2-- 61 to 107 cm; red (10R 4/6) sandy clay; moderate medium and coarse
subangular structure; firm, sticky, plastic; clear boundary.
Bt3-- 107 to 152 cm; red (10R 4/8) sandy clay loam; weak medium and coarse
subangular blocky structure; friable, slightly sticky, slightly plastic; clear
boundary.
Bt4-- 152 to 183 cm; red (2.5YR 4/6) sandy loam; weak medium subangular blocky
structure; friable, slightly sticky, nonplastic; gradual boundary.
BC-- 183 to 244 cm; red (2.5YR 4/6) and yellowish red (5YR 5/8) sandy loam; weak
medium subangular blocky structure; friable, nonsticky, nonplastic; gradual
boundary.
C-- 244 to 305 cm; strong brown (7.5 YR 5/8), white (10YR 8/1), and brownish
yellow (10YR 6/8) loamy sand; massive; very friable, nonsticky, nonplastic.
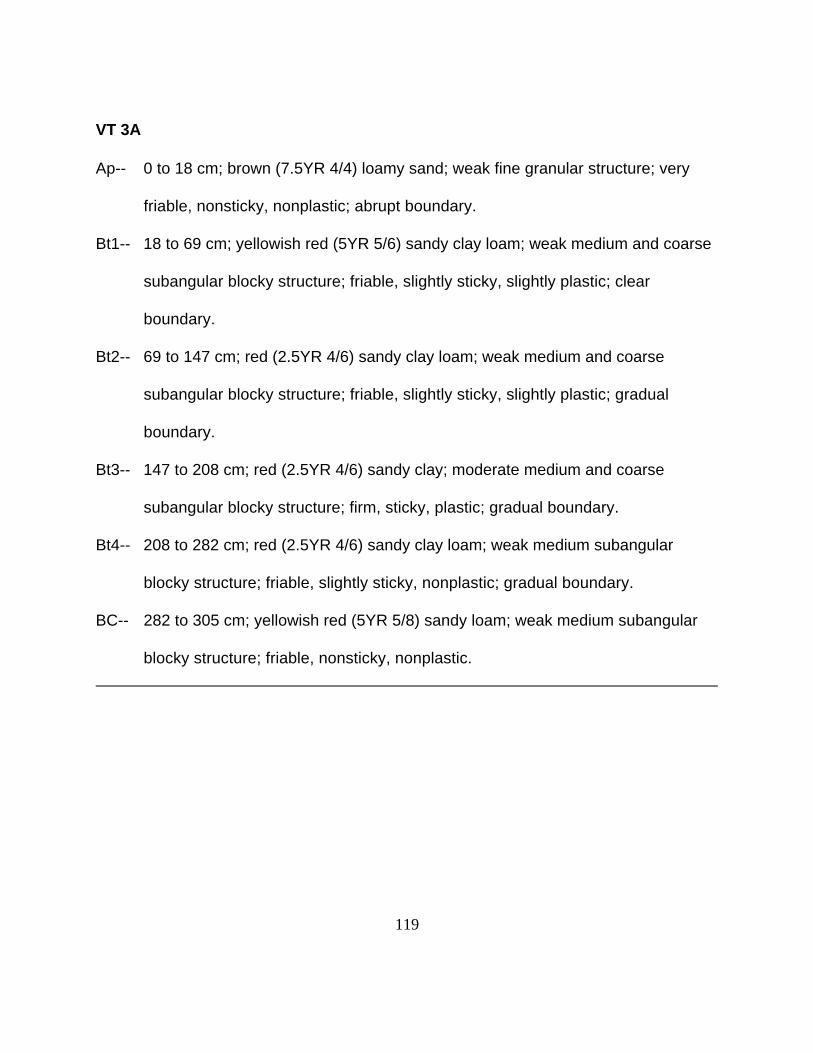
119
VT 3A
Ap-- 0 to 18 cm; brown (7.5YR 4/4) loamy sand; weak fine granular structure; very
friable, nonsticky, nonplastic; abrupt boundary.
Bt1-- 18 to 69 cm; yellowish red (5YR 5/6) sandy clay loam; weak medium and coarse
subangular blocky structure; friable, slightly sticky, slightly plastic; clear
boundary.
Bt2-- 69 to 147 cm; red (2.5YR 4/6) sandy clay loam; weak medium and coarse
subangular blocky structure; friable, slightly sticky, slightly plastic; gradual
boundary.
Bt3-- 147 to 208 cm; red (2.5YR 4/6) sandy clay; moderate medium and coarse
subangular blocky structure; firm, sticky, plastic; gradual boundary.
Bt4-- 208 to 282 cm; red (2.5YR 4/6) sandy clay loam; weak medium subangular
blocky structure; friable, slightly sticky, nonplastic; gradual boundary.
BC-- 282 to 305 cm; yellowish red (5YR 5/8) sandy loam; weak medium subangular
blocky structure; friable, nonsticky, nonplastic.

120
VT 3B
Ap-- 0 to 10 cm; brown (7.5YR 4/4) loamy sand; weak fine and medium granular
structure; very friable, nonsticky, nonplastic; abrupt boundary.
Bt1-- 10 to 38 cm; red (2.5YR 4/6) sandy clay loam; weak medium and coarse
subangular blocky structure; friable, slightly sticky, slightly plastic; clear
boundary.
Bt2-- 38 to 97 cm; red (2.5YR 4/6) sandy clay loam; moderate medium and coarse
subangular blocky structure; friable, sticky, slightly plastic; diffuse boundary.
Bt3-- 97 to 152 cm; red (2.5YR 4/6) sandy clay loam; moderate medium and coarse
subangular blocky structure; friable, sticky, slightly plastic; gradual boundary.
Bt4-- 152 to 203 cm; red (2.5YR 4/6) sandy loam; weak medium subangular blocky
structure; friable, slightly sticky, nonplastic; gradual boundary.
BC-- 203 to 236 cm; red (2.5YR 4/8) sandy loam; weak medium subangular blocky
structure; friable, slightly sticky, nonplastic; gradual boundary.
CB-- 236 to 274 cm; yellowish red (5YR 4/6) and strong brown (7.5YR 5/8) loamy
sand; weak medium subangular blocky structure; friable, nonsticky, nonplastic;
gradual boundary.
C-- 274 to 305 cm; yellowish brown (10YR 5/8) and light gray (10YR 7/1) sand;
massive; very friable, nonsticky, nonplastic.
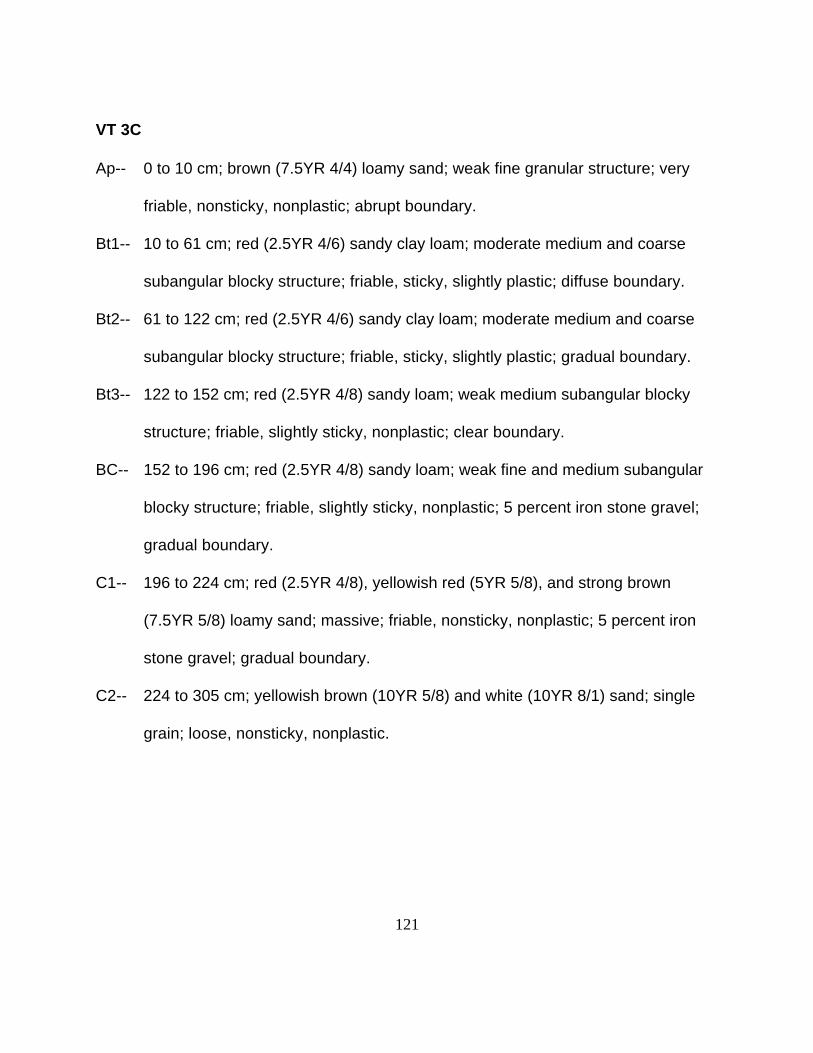
121
VT 3C
Ap-- 0 to 10 cm; brown (7.5YR 4/4) loamy sand; weak fine granular structure; very
friable, nonsticky, nonplastic; abrupt boundary.
Bt1-- 10 to 61 cm; red (2.5YR 4/6) sandy clay loam; moderate medium and coarse
subangular blocky structure; friable, sticky, slightly plastic; diffuse boundary.
Bt2-- 61 to 122 cm; red (2.5YR 4/6) sandy clay loam; moderate medium and coarse
subangular blocky structure; friable, sticky, slightly plastic; gradual boundary.
Bt3-- 122 to 152 cm; red (2.5YR 4/8) sandy loam; weak medium subangular blocky
structure; friable, slightly sticky, nonplastic; clear boundary.
BC-- 152 to 196 cm; red (2.5YR 4/8) sandy loam; weak fine and medium subangular
blocky structure; friable, slightly sticky, nonplastic; 5 percent iron stone gravel;
gradual boundary.
C1-- 196 to 224 cm; red (2.5YR 4/8), yellowish red (5YR 5/8), and strong brown
(7.5YR 5/8) loamy sand; massive; friable, nonsticky, nonplastic; 5 percent iron
stone gravel; gradual boundary.
C2-- 224 to 305 cm; yellowish brown (10YR 5/8) and white (10YR 8/1) sand; single
grain; loose, nonsticky, nonplastic.

122
Appendix IV
Morphological Description of Mine Soils
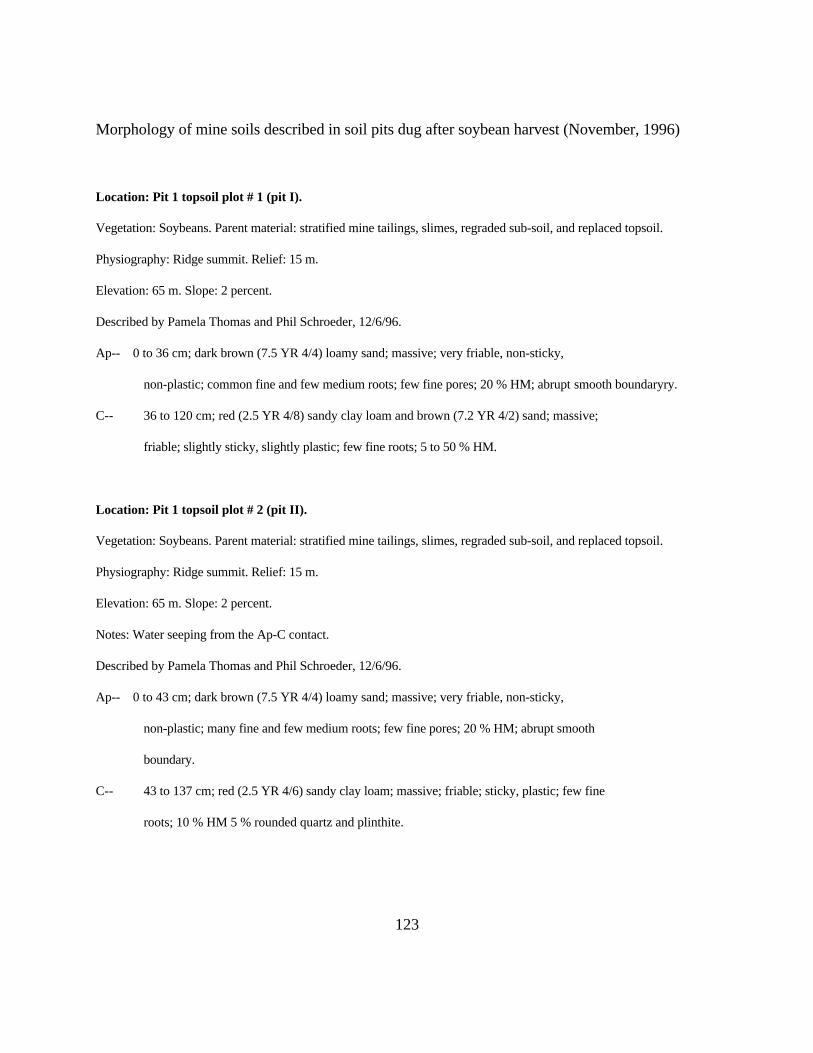
123
Morphology of mine soils described in soil pits dug after soybean harvest (November, 1996)
Location: Pit 1 topsoil plot # 1 (pit I).
Vegetation: Soybeans. Parent material: stratified mine tailings, slimes, regraded sub-soil, and replaced topsoil.
Physiography: Ridge summit. Relief: 15 m.
Elevation: 65 m. Slope: 2 percent.
Described by Pamela Thomas and Phil Schroeder, 12/6/96.
Ap-- 0 to 36 cm; dark brown (7.5 YR 4/4) loamy sand; massive; very friable, non-sticky,
non-plastic; common fine and few medium roots; few fine pores; 20 % HM; abrupt smooth boundaryry.
C-- 36 to 120 cm; red (2.5 YR 4/8) sandy clay loam and brown (7.2 YR 4/2) sand; massive;
friable; slightly sticky, slightly plastic; few fine roots; 5 to 50 % HM.
Location: Pit 1 topsoil plot # 2 (pit II).
Vegetation: Soybeans. Parent material: stratified mine tailings, slimes, regraded sub-soil, and replaced topsoil.
Physiography: Ridge summit. Relief: 15 m.
Elevation: 65 m. Slope: 2 percent.
Notes: Water seeping from the Ap-C contact.
Described by Pamela Thomas and Phil Schroeder, 12/6/96.
Ap-- 0 to 43 cm; dark brown (7.5 YR 4/4) loamy sand; massive; very friable, non-sticky,
non-plastic; many fine and few medium roots; few fine pores; 20 % HM; abrupt smooth
boundary.
C-- 43 to 137 cm; red (2.5 YR 4/6) sandy clay loam; massive; friable; sticky, plastic; few fine
roots; 10 % HM 5 % rounded quartz and plinthite.

124
Location: Pit 1 topsoil plot # 3 (pit III).
Vegetation: Soybeans. Parent material: stratified mine tailings, slimes, regraded soil, and replaced topsoil.
Physiography: Ridge summit. Relief: 15 m.
Elevation: 65 m. Slope: 2 percent.
Described by Pamela Thomas and Phil Schroeder, 12/6/96.
Ap-- 0 to 41 cm; dark brown (7.5 YR 4/4) loamy sand; massive; very friable, non-sticky,
non-plastic; common fine and few medium roots; few fine pores; 20 % HM; abrupt wavy
boundary.
C1-- 41 to 149 cm; red (2.5 YR 4/6) sandy clay loam; massive; friable; slightly sticky, plastic;
common fine roots; few fine pores; 5 % HM; 15 % fine gravel; abrupt wavy boundary.
C2-- 149 to 189 cm; yellowish red (5 YR 5/8) clay; massive; sticky and plastic; 1 % HM;
abrupt wavy boundary .
C3-- 189 to 200 cm; strong brown (7.5 YR 5/8) sand; single grain; loose; non-sticky, non-
plastic; 3 % HM.
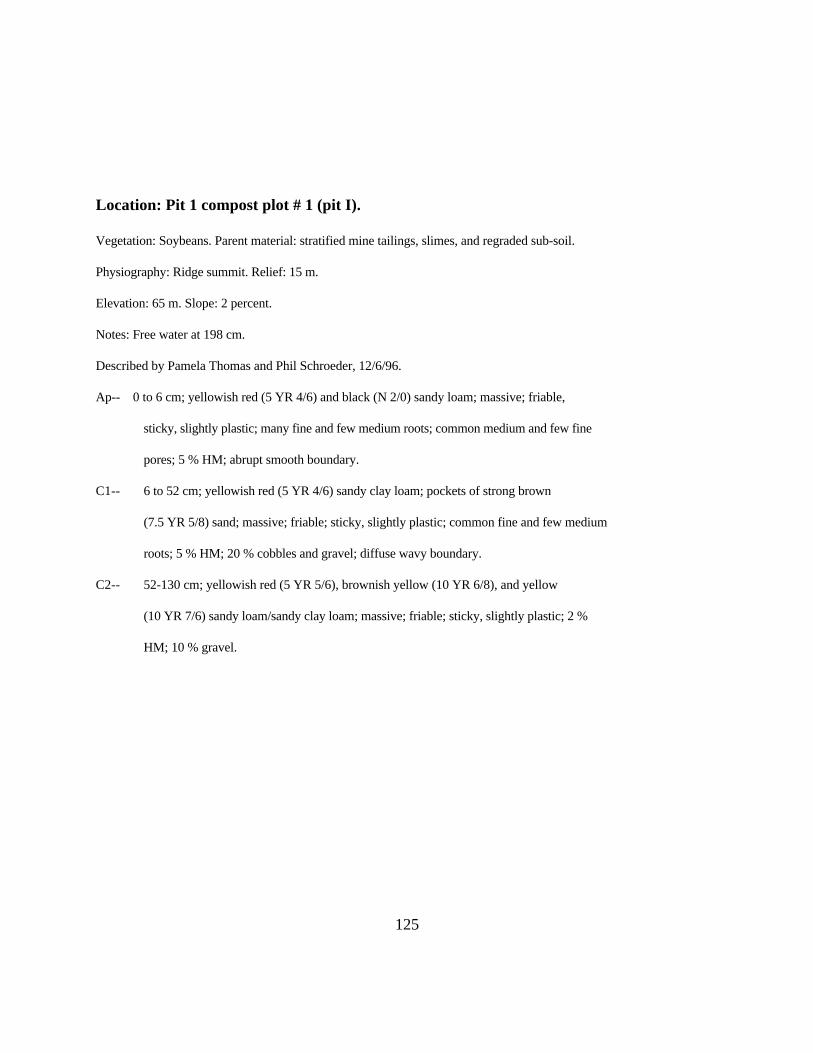
125
Location: Pit 1 compost plot # 1 (pit I).
Vegetation: Soybeans. Parent material: stratified mine tailings, slimes, and regraded sub-soil.
Physiography: Ridge summit. Relief: 15 m.
Elevation: 65 m. Slope: 2 percent.
Notes: Free water at 198 cm.
Described by Pamela Thomas and Phil Schroeder, 12/6/96.
Ap-- 0 to 6 cm; yellowish red (5 YR 4/6) and black (N 2/0) sandy loam; massive; friable,
sticky, slightly plastic; many fine and few medium roots; common medium and few fine
pores; 5 % HM; abrupt smooth boundary.
C1-- 6 to 52 cm; yellowish red (5 YR 4/6) sandy clay loam; pockets of strong brown
(7.5 YR 5/8) sand; massive; friable; sticky, slightly plastic; common fine and few medium
roots; 5 % HM; 20 % cobbles and gravel; diffuse wavy boundary.
C2-- 52-130 cm; yellowish red (5 YR 5/6), brownish yellow (10 YR 6/8), and yellow
(10 YR 7/6) sandy loam/sandy clay loam; massive; friable; sticky, slightly plastic; 2 %
HM; 10 % gravel.
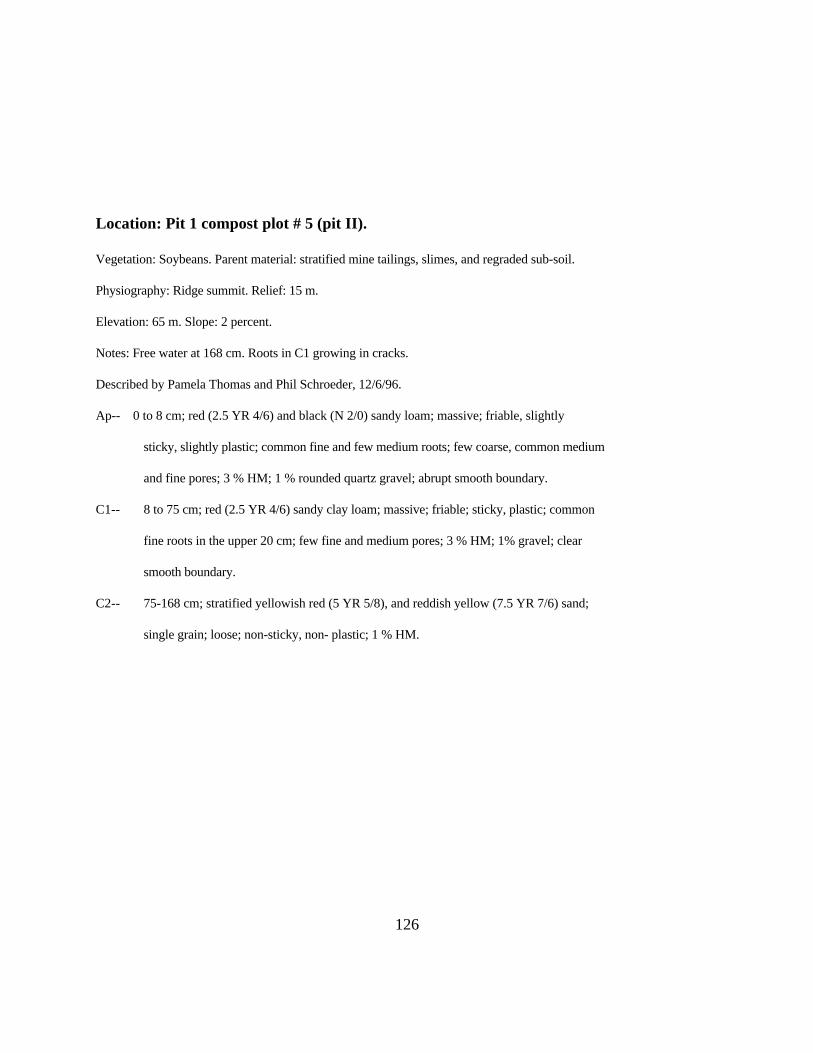
126
Location: Pit 1 compost plot # 5 (pit II).
Vegetation: Soybeans. Parent material: stratified mine tailings, slimes, and regraded sub-soil.
Physiography: Ridge summit. Relief: 15 m.
Elevation: 65 m. Slope: 2 percent.
Notes: Free water at 168 cm. Roots in C1 growing in cracks.
Described by Pamela Thomas and Phil Schroeder, 12/6/96.
Ap-- 0 to 8 cm; red (2.5 YR 4/6) and black (N 2/0) sandy loam; massive; friable, slightly
sticky, slightly plastic; common fine and few medium roots; few coarse, common medium
and fine pores; 3 % HM; 1 % rounded quartz gravel; abrupt smooth boundary.
C1-- 8 to 75 cm; red (2.5 YR 4/6) sandy clay loam; massive; friable; sticky, plastic; common
fine roots in the upper 20 cm; few fine and medium pores; 3 % HM; 1% gravel; clear
smooth boundary.
C2-- 75-168 cm; stratified yellowish red (5 YR 5/8), and reddish yellow (7.5 YR 7/6) sand;
single grain; loose; non-sticky, non- plastic; 1 % HM.

127
Location: Pit 1 compost plot # 10 (pit III).
Vegetation: Soybeans. Parent material: stratified mine tailings, slimes, and regraded sub-soil.
Physiography: Ridge summit. Relief: 15 m.
Elevation: 65 m. Slope: 2 percent.
Notes: Bt horizon at 152 cm represents bottom of mine pit.
Described by Pamela Thomas and Phil Schroeder, 12/5/96.
Ap-- 0 to 8 cm; red (2.5 YR 4/6) and black (N 2/0) sandy clay loam; moderate medium
granular structure; friable, slightly sticky, slightly plastic; many fine and few medium
roots; common fine pores; 5 % HM; abrupt smooth boundary.
C1-- 8 to 26 cm; red (2.5 YR 4/6) sandy clay loam; massive; friable; sticky, plastic; common
fine roots; few fine pores; 10 % HM; clear smooth boundary.
C2-- 26 to 139 cm; yellowish red (5 YR 5/8) sand; single grain; loose; non- sticky, non-plastic;
common fine roots in the upper 10 cm; few fine pores; 2 % HM; 1 % gravel; abrupt wavy
boundary.
C3-- 139 to 152 cm; yellowish red (5 YR 5/6) clay; massive; sticky , plastic; 1% HM; abrupt
smooth boundary.
2Bt-- 152-- cm; red (2.5 YR 4/6) clay loam; moderate medium subangular blocky structure;
friable; sticky, plastic, few fine pores; many distinct clay bridges. 10 % HM.

128
Location: Pit 3 topsoil plot # 1 (pit I).
Vegetation: Soybeans. Parent material: stratified mine tailings, slimes, and replaced topsoil.
Physiography: sideslope. Relief: 15 m.
Elevation: 65 m. Slope: 5 percent.
Described by Pamela Thomas and Phil Schroeder, 12/5/96.
Ap1-- 0 to 16 cm; dark yellowish brown (10 YR 4/4) sand; massive; very friable, non-sticky,
non-plastic; common fine and few medium and coarse roots; few coarse and many medium
and fine pores; 30 % HM; clear smooth boundary.
Ap2-- 16 to 53 cm; dark yellowish brown (10 YR 4/4) sand; massive; very friable, non-sticky,
non-plastic; few fine, medium and coarse roots; few coarse and medium pores; 30 %
HM; abrupt smooth boundary.
C1-- 53 to 111 cm; red (2.5 YR 4/8) sand; many strong brown (7.5 YR 8/5) sand pockets;
massive; very friable; non-sticky, non-plastic; few fine , medium, and coarse roots; few
coarse and medium pores; 2 % HM; clear irregular boundary.
C2-- 111 to 164 cm; yellowish red (5 YR 5/6) clay; many strong brown (7.5 YR 8/5) sand
pockets; massive; sticky and plastic; few fine roots; 1 % HM; abrupt wavy boundary .
C3-- 164 to 190 cm; stratified reddish yellow (7.5 YR 7/6) and very pale brown (10 YR 8/4)
sand; single grain; loose; non-sticky, non-plastic; 1 % HM.
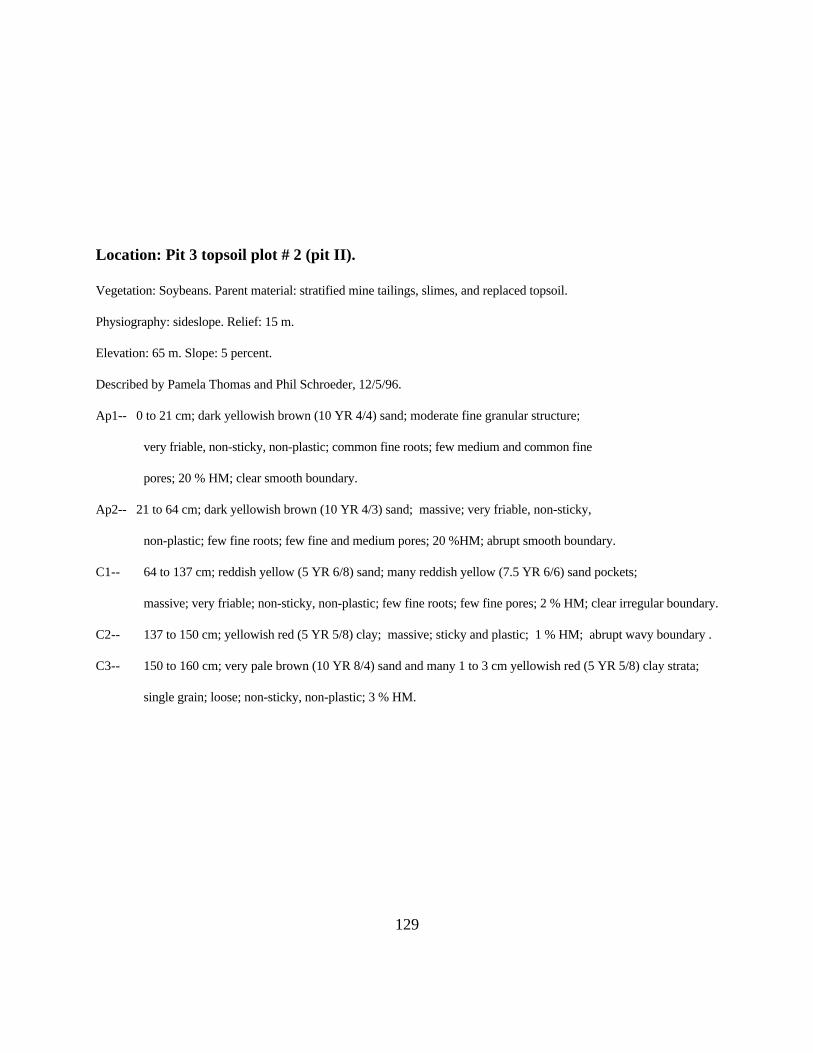
129
Location: Pit 3 topsoil plot # 2 (pit II).
Vegetation: Soybeans. Parent material: stratified mine tailings, slimes, and replaced topsoil.
Physiography: sideslope. Relief: 15 m.
Elevation: 65 m. Slope: 5 percent.
Described by Pamela Thomas and Phil Schroeder, 12/5/96.
Ap1-- 0 to 21 cm; dark yellowish brown (10 YR 4/4) sand; moderate fine granular structure;
very friable, non-sticky, non-plastic; common fine roots; few medium and common fine
pores; 20 % HM; clear smooth boundary.
Ap2-- 21 to 64 cm; dark yellowish brown (10 YR 4/3) sand; massive; very friable, non-sticky,
non-plastic; few fine roots; few fine and medium pores; 20 %HM; abrupt smooth boundary.
C1-- 64 to 137 cm; reddish yellow (5 YR 6/8) sand; many reddish yellow (7.5 YR 6/6) sand pockets;
massive; very friable; non-sticky, non-plastic; few fine roots; few fine pores; 2 % HM; clear irregular boundary.
C2-- 137 to 150 cm; yellowish red (5 YR 5/8) clay; massive; sticky and plastic; 1 % HM; abrupt wavy boundary .
C3-- 150 to 160 cm; very pale brown (10 YR 8/4) sand and many 1 to 3 cm yellowish red (5 YR 5/8) clay strata;
single grain; loose; non-sticky, non-plastic; 3 % HM.

130
Location: Pit 3 topsoil plot # 8 (pit III).
Vegetation: Soybeans. Parent material: stratified mine tailings, slimes, and replaced topsoil.
Physiography: sideslope. Relief: 15 m.
Elevation: 65 m. Slope: 5 percent.
Notes: free water at 150 cm. Described by Pamela Thomas and Phil Schroeder, 12/5/96.
Ap1-- 0 to 31 cm; dark yellowish brown (10 YR 4/4) loamy sand; moderate fine granular
structure in the upper 15 cm; very friable, non-sticky, non-plastic; common fine roots in
the upper 15 cm, few fine roots in the lower 15 cm; few very coarse , common coarse and
medium pores; 100 % HM; abrupt wavy boundary.
C1-- 31 to 47 cm; red (2.5 YR 5/8) loamy sand; reddish yellow (7.5 YR 6/8) strata in
the lower 5 cm; massive; friable; non-sticky, non-plastic; few fine, and medium roots; few
fine and medium pores; 10 % HM, 50 % HM in bottom 1 cm; 5 % clay balls 1 cm in
diam; abrupt wavy boundary.
C2-- 47 to 63 cm; red (2.5 YR 5/8) clay; massive; sticky and plastic; few fine roots; few fine
pores; abrupt wavy boundary.
C3-- 63 to 89 cm; yellowish red (5 YR 5/8) coarse loamy sand; massive; friable; slightly sticky;
few fine roots; few fine pores; non-plastic; 1 % HM; abrupt wavy boundary.
C4-- 89 to 105 cm; red (2.5 YR 4/8) clay; massive; sticky, plastic, abrupt wavy boundary.
C5-- 105 to 134 cm; reddish yellow (5 YR 6/8) sand; single grain; non-sticky, non-plastic; 1 %
HM; abrupt wavy boundary.
C6-- 134 to 150 cm; yellowish red (5 YR 5/8) clay; massive; sticky, plastic.

131
Location: Pit 3 compost plot # 1 (pit I).
Vegetation: Soybeans. Parent material: stratified mine tailings, slimes.
Physiography: sideslope. Relief: 15 m.
Elevation: 65 m. Slope: 5 percent.
Notes: Free water at 61 cm.
Described by Pamela Thomas and Phil Schroeder, 12/6/96.
Ap-- 0 to 6 cm; red (2.5 YR 4/6) and black (N 2/0) sandy loam; weak fine granular over
massive structure; friable, slightly sticky, non-plastic; common fine roots; common coarse
and medium pores; 3 % HM; abrupt smooth boundary.
C-- 6 to 67 cm; red (2.5 YR 4/6) loamy sand; massive; very friable; slightly sticky, non-plastic;
few fine roots; few coarse and medium pores. 3 % HM.
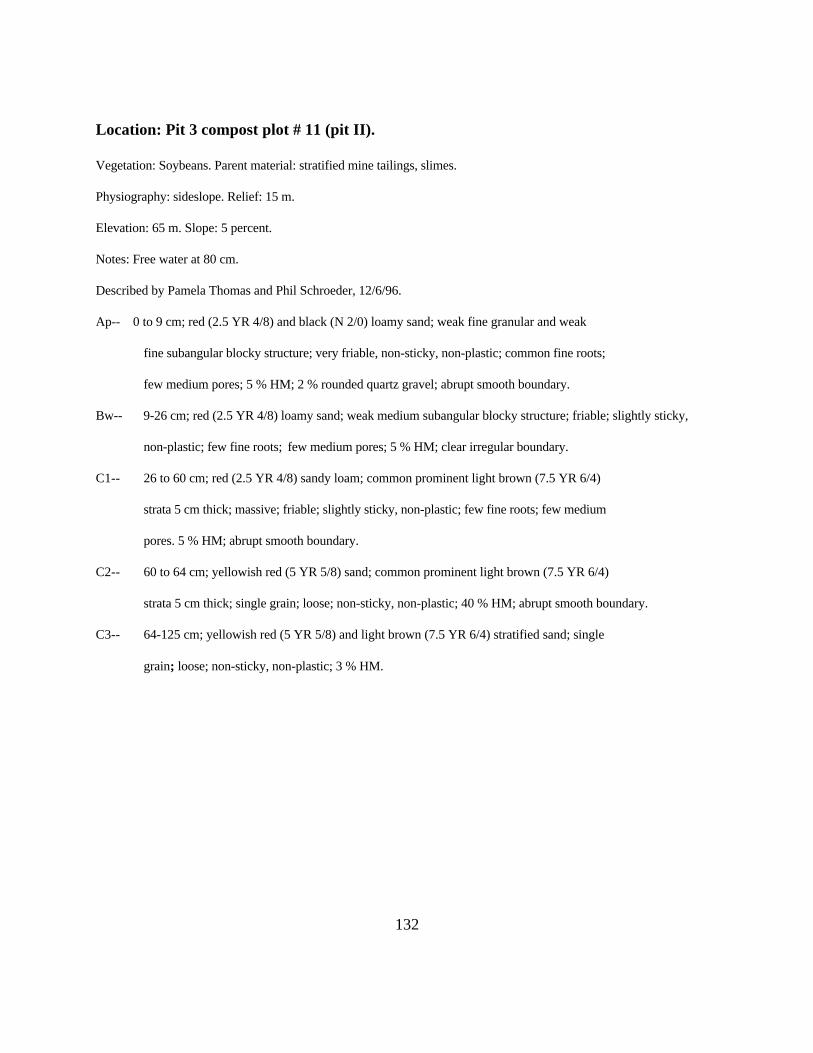
132
Location: Pit 3 compost plot # 11 (pit II).
Vegetation: Soybeans. Parent material: stratified mine tailings, slimes.
Physiography: sideslope. Relief: 15 m.
Elevation: 65 m. Slope: 5 percent.
Notes: Free water at 80 cm.
Described by Pamela Thomas and Phil Schroeder, 12/6/96.
Ap-- 0 to 9 cm; red (2.5 YR 4/8) and black (N 2/0) loamy sand; weak fine granular and weak
fine subangular blocky structure; very friable, non-sticky, non-plastic; common fine roots;
few medium pores; 5 % HM; 2 % rounded quartz gravel; abrupt smooth boundary.
Bw-- 9-26 cm; red (2.5 YR 4/8) loamy sand; weak medium subangular blocky structure; friable; slightly sticky,
non-plastic; few fine roots; few medium pores; 5 % HM; clear irregular boundary.
C1-- 26 to 60 cm; red (2.5 YR 4/8) sandy loam; common prominent light brown (7.5 YR 6/4)
strata 5 cm thick; massive; friable; slightly sticky, non-plastic; few fine roots; few medium
pores. 5 % HM; abrupt smooth boundary.
C2-- 60 to 64 cm; yellowish red (5 YR 5/8) sand; common prominent light brown (7.5 YR 6/4)
strata 5 cm thick; single grain; loose; non-sticky, non-plastic; 40 % HM; abrupt smooth boundary.
C3-- 64-125 cm; yellowish red (5 YR 5/8) and light brown (7.5 YR 6/4) stratified sand; single
grain; loose; non-sticky, non-plastic; 3 % HM.
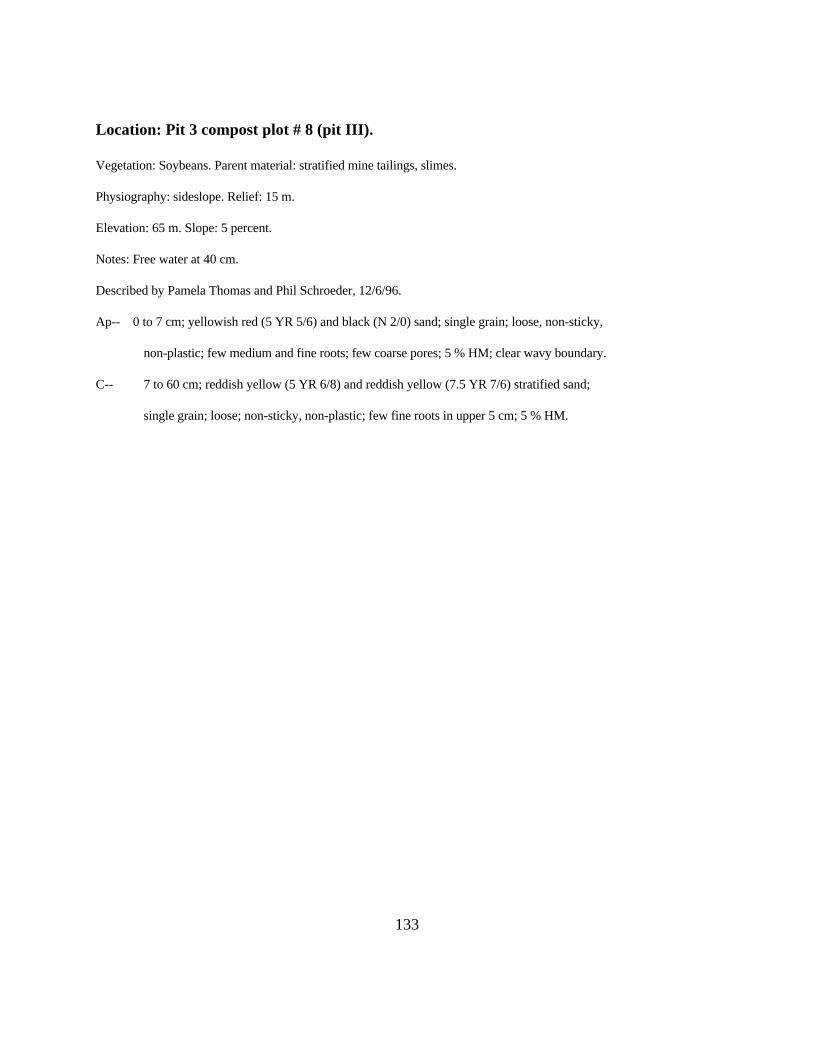
133
Location: Pit 3 compost plot # 8 (pit III).
Vegetation: Soybeans. Parent material: stratified mine tailings, slimes.
Physiography: sideslope. Relief: 15 m.
Elevation: 65 m. Slope: 5 percent.
Notes: Free water at 40 cm.
Described by Pamela Thomas and Phil Schroeder, 12/6/96.
Ap-- 0 to 7 cm; yellowish red (5 YR 5/6) and black (N 2/0) sand; single grain; loose, non-sticky,
non-plastic; few medium and fine roots; few coarse pores; 5 % HM; clear wavy boundary.
C-- 7 to 60 cm; reddish yellow (5 YR 6/8) and reddish yellow (7.5 YR 7/6) stratified sand;
single grain; loose; non-sticky, non-plastic; few fine roots in upper 5 cm; 5 % HM.

134
Appendix V
Profile Descriptions for Auger Borings from Pit 1 Prior toApplication of Treatments

135
Refer to Figure 10 for the location of these sampling pionts
1A0-36 cm; dark yellowish brown (10YR 3/4) sandy loam; regraded top soil.
36-41 cm; yellowish red (5YR 4/6) sand; tailings.
41-48 cm; yellowish red (5YR 5/8) sandy loam; tailings with some slimes.
48-152 cm; yellowish red (5YR 5\6) sandy loam; tailings.
1B0-46 cm; dark yellowish brown (10YR 3/4) sandy loam; regraded top soil.
46-56 cm; yellowish red (5YR 5/8) sandy clay loam; mix of tailings and slimes.
56-152 cm; yellowish red (5YR 5/8) and reddish yellow (7.5YR 6/6) sand; tailings.
1C0-41 cm; dark red (2.5YR 3/6) sandy clay loam; regraded sub-soil.
41-79 cm; yellowish red (5YR 4/6) loamy Sand; tailings..
79-152 cm; yellowish red (5YR 4/6) loamy sand; tailings.
1D0-36 cm; yellowish red (5YR 4/6) sandy clay loam; regraded sub-soil.
36-71 cm; red (2.5YR 4/6) sand; tailings.
71-81 cm; red (2.5YR 4/6) sand; tailings.
81-152 cm; yellowish red (5YR 4/6) sand; tailings.
2A0-46 cm; dark yellowish brown (10YR 4/6) loamy sand; regraded topsoil.
46-99 cm; strong brown (7.5YR 5/6) sandy clay loam; regraded sub-soil.
99-152 cm; yellowish red (5YR 5/8) sand; tailings.
2B0-76 cm; yellowish red (5YR 5/8)sandy clay loam; regraded sub-soil.
76-152 cm; yellowish red (5YR 5/8) and red (2.5YR 4/8) loamy sand, tailings with many thin slime layers.

136
2C 0-61 cm; yellowish red (5YR 4/6) sandy clay loam; regraded sub-soil.61-152 cm; yellowish red (5YR 5/8) and red (2.5YR 4/8) loamy sand, tailings with some slime layers.
2D0-30 cm; yellowish red (5YR 4/6) sandy clay loam; regraded sub-soil.
30-61 cm; yellowish red (5YR 5/8) sandy loam; regraded sub-soil.
61-66 cm; strong brown (7.5YR 5/6) clay, slime layer.
66-152 cm; yellowish red (5YR 5/8) and red (2.5YR 4/8) loamy sand, tailings with many thin slime layers.
3A0-30 cm; dark yellowish brown (10YR 3/4) sandy loam; regraded topsoil.
30-112 cm; yellowish red (5YR 4/6) sandy clay loam; regraded sub-soil.
112-152 cm; yellowish red (5YR 5/8) sand.
3B0-46 cm; dark yellowish brown (10YR 3/4) sandy loam; regraded topsoil.
46-123 cm; yellowish red (5YR 5/8) clay; slimes.
123-152 cm; yellowish red (5YR 4/6) sand.
3C0-46 cm; red (2.5YR 4/6) sandy clay loam; regraded sub-soil.
46-112 cm; red (2.5YR 4/6) clay/sandy clay. Mix of regraded sub-soil and slimes.
112-6-152 cm; strong brown (7.5YR 5/8) sand.
3D0-61 cm; yellowish red (5YR 4/6) sandy clay loam; regraded sub-soil.
61-122 cm; reddish brown (5YR 4/4) sandy loam; regraded sub-soil.
122-152 cm; yellowish red (5YR 4/6) sandy loam, mix of sand and slimes.

137
4A0-30 cm; dark yellowish brown (10YR 4/4) sandy loam; regraded topsoil.
30-152 cm; reddish yellow (10YR 6/8) sandy clay loam; regraded sub-soil.
4B0-30 cm; yellowish red (5YR 5/6) sandy loam; regraded top soil.
30-152 cm; yellowish red (5YR 4/6) sandy clay loam; mix of slimes and regraded sub-soil.
4C0-91 cm; yellowish red (5YR 5/6) sandy clay loam; regraded sub-soil.
91-152 cm; reddish brown (5YR 4/4) sandy clay loam; regraded sub-soil.
4D0-30 cm; yellowish red (5YR 4/6) sandy clay loam; regraded sub-soil.
30-91 cm; yellowish red (5YR 4/6), brownish yellow (10YR 6/8), and gray (2.5Y 6/0) sandy loam. Regraded sub-soil.
91-152 cm; brownish yellow (10YR 6/8), and yellowish red (5YR 4/6) sandy clay loam; unprocessed (reject) sub-soil material
5A0-46 cm; dark yellowish brown (10YR 4/4) and strong brown (7.5YR 5/6) sandy loam; regraded sub-soil with some topsoil mixed in.
46-152 cm; dark yellowish brown (10YR 4/3), and yellowish red (5YR 5/8) sandy loam; mix of slimes and regraded sub-soil.
5B
0-91 cm; brown (10YR 4/3) sandy loam; regraded topsoil.
91-152 cm;.yellowish red (5YR 4/6) sandy loam; regraded sub-soil.
5C
0-30 cm; dark yellowish brown (10YR 4/4) and strong brown (7.5YR 5/6) sandy loam; mix of regraded top and sub-soil.
30-152 cm; yellowish red (5YR 4/6) sandy loam; regraded sub-soil.

138
5D0-91 cm; reddish brown (5YR 4/4) sandy clay loam; regraded sub-soil.
91-112 cm; very dark gray (5YR 3/1) and yellowish red (5YR 4/6) sandy loan; remixed tails and slimes.
112-152 cm; yellowish red (5YR 4/6) sandy loam; mixed unprocessed subsoil and slimes.
6A0-10 cm; yellowish red (5YR 4/6) sandy clay loam; regraded sub-soil.
10-152 cm; yellowish red (5YR 5/8) clay; slimes.
6B0-36 cm; dark yellowish brown (10YR 3/4) sandy loam; regraded top soil.
36-152 cm; yellowish brown (10YR 5/8) and strong brown (7.5YR 5/6) sandy loam; regraded sub-soil.
152-213 cm; yellowish red (5YR 4/6) sandy clay loam; remixed tails and slimes.
6C0-91 cm; yellowish red (5YR 4/6) sandy clay loam; regraded sub-soil; water content to high to get deeper samples.
6D0-91 cm; brown (10YR 4/3) and yellowish red (5YR 5/6) sandy loam; mixed regraded top and sub-soil.
91-168 cm; brown (10YR 4/3) loamy sand; regraded topsoil.
168-213 cm; yellowish red (5YR 4/6) and brownish yellow (10YR 5/8) sandy loam; unprocessed (reject) sub-soil.
7A0-30 cm; yellowish red (5YR 4/6) sandy clay loam; regraded sub-soil.
30-213 cm; yellowish red (5YR 5/8) clay, slimes.
7B0-15 cm; yellowish red (5YR 5/8) clay loam; regraded sub-soil.
15-213 cm; yellowish red (5YR 5/6) clay, slimes.

139
7C0-91 cm; reddish brown (5YR 4/4) sandy clay loam; regraded sub-soil.
91-213 cm; yellowish red (5YR 5/8) sandy clay loam. Regraded sub-soil.
7D0-30 cm; yellowish red (5YR 5/8) sandy clay loam. Regraded sub-soil.
30-71 cm; strong brown (7.5YR 5/6) sandy clay loam; regraded sub-soil.
71-91 cm; brownish yellow (10YR 6/8) and yellowish red (5YR 4/6) sandy loam; unprocessed (reject) sub-soil.
91-213 cm; yellowish red (5YR 4/6), brownish yellow (10YR 6/8), and gray (2.5Y 6/0) sandy loam unprocessed (reject) sub-soil.
8A0-112 cm; yellowish red (5YR 5/6) sandy clay loam. Regraded sub-soil.
112-213 cm; yellowish red (5YR 5/8) sandy loam; remixed tails and slimes.
8B 0-91 cm; yellowish red (5YR 4/6) and dark yellowish brown (10YR 3/4) sandy clay loam; mixed regraded top and sub-soil.
91-122 cm; yellowish red (5YR 5/8) sandy clay loam; remixed tails and slimes.
122-213 cm; strong brown (7.5YR 5/6) loamy sand; mostly tailings.
8C0-152 cm; yellowish red (5YR 4/6) sandy clay loam; regraded sub-soil.
152-213 cm; yellowish red (5YR 5/8) loamy sand; mostly tailings.
8D0-61 cm; yellowish red (5YR 4/6) sandy clay loam; regraded sub-soil.
61-213 cm; brownish yellow (10YR 6/8) and yellowish red (5YR 4/6) sandy loam; unprocessed (reject) sub-soil.

140
9A0-81 cm; dark yellowish brown (10YR 3/4) and yellowish red (5YR 4/6) sandy clay loam; mixed regraded top and sub-soil.
81-112 cm; yellowish red (5YR 5/8) sandy clay loam; remixed tails and slimes.
112-147 cm; strong brown (7.5YR 5/8) loamy sand; tailings.
147-152 cm; yellowish red (5YR 5/8) sand clay loam; remixed tails and slimes.
152-213 cm; yellowish red (5YR 5/6) sand; tailings.
9B0-91 cm; yellowish red (5YR 4/6) and dark yellowish brown (10YR 3/4) sandy loam; mixed regraded top and sub-soil.
91-213 cm; reddish yellow (7.5YR 6/6) sand; tailings.
9C0-122 cm; yellowish red (5YR 4/6) and dark yellowish brown (10YR 3/4) sandy loam; mixed regraded top and sub-soil.
122-213 cm; reddish yellow (7.5YR 6/8) sand; tailings.
9D0-102 cm; yellowish red (5YR 4/6) and dark yellowish brown (10YR 3/4) sandy loam; mixed regraded top and sub-soil.
102-213 cm; light brown (7.5YR 6/4) sand; tailings.
10A 0-71 cm; yellowish red (5YR 4/6) sandy clay loam; regraded sub-soil.
71-91 cm; yellowish red (5YR 5/8) sand; tailings.
91-152 cm; yellowish red (5YR 5/6) sand; tailings.
152-213 cm; strong brown (7.5YR 5/8) sand; tailings.
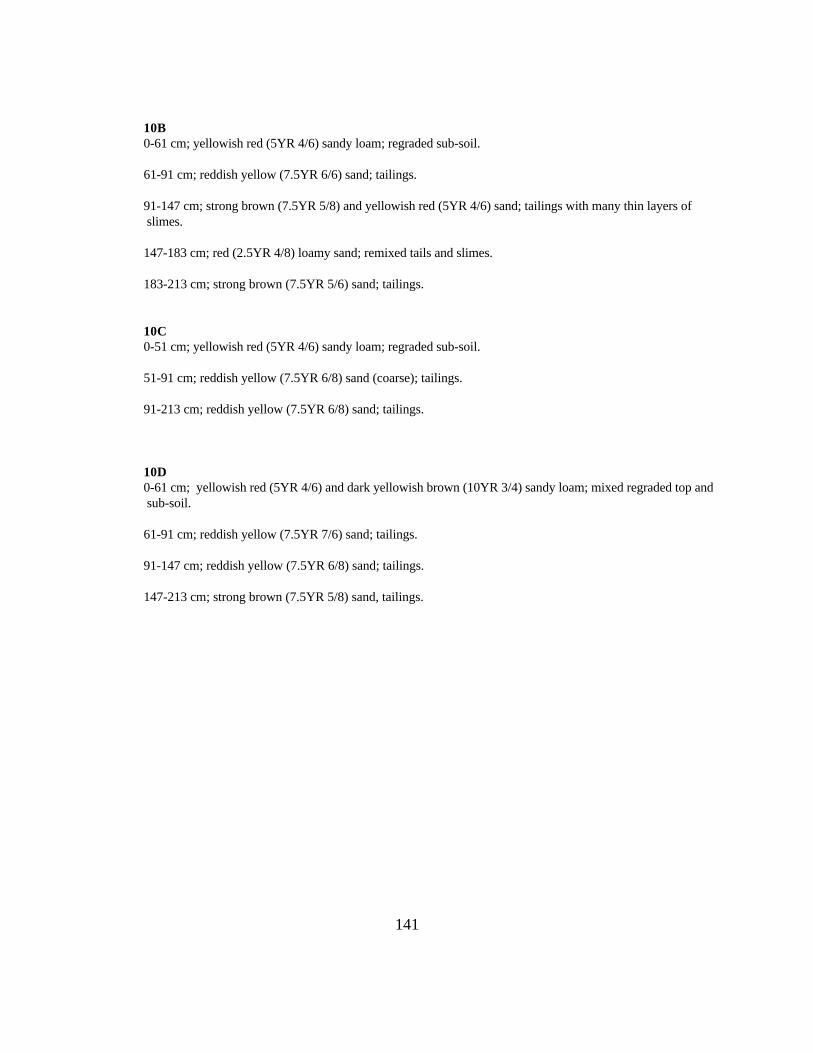
141
10B0-61 cm; yellowish red (5YR 4/6) sandy loam; regraded sub-soil.
61-91 cm; reddish yellow (7.5YR 6/6) sand; tailings.
91-147 cm; strong brown (7.5YR 5/8) and yellowish red (5YR 4/6) sand; tailings with many thin layers of slimes.
147-183 cm; red (2.5YR 4/8) loamy sand; remixed tails and slimes.
183-213 cm; strong brown (7.5YR 5/6) sand; tailings.
10C0-51 cm; yellowish red (5YR 4/6) sandy loam; regraded sub-soil.
51-91 cm; reddish yellow (7.5YR 6/8) sand (coarse); tailings.
91-213 cm; reddish yellow (7.5YR 6/8) sand; tailings.
10D0-61 cm; yellowish red (5YR 4/6) and dark yellowish brown (10YR 3/4) sandy loam; mixed regraded top and sub-soil.
61-91 cm; reddish yellow (7.5YR 7/6) sand; tailings.
91-147 cm; reddish yellow (7.5YR 6/8) sand; tailings.
147-213 cm; strong brown (7.5YR 5/8) sand, tailings.

142
APPENDIX VI
Profile Descriptions for Auger Borings from Pit 3 Samples TakenPrior to Application of Treatments

143
1A0-20 cm; yellowish red (5YR 5/8) sandy clay loam; remixed tailings and slimes.
20-76 cm; yellowish red (5YR 5/8) clay; slimes with decaying plant material.
76-122 cm; yellow (10YR 7/6) sand; tailings.
122-152 cm; yellowish red (5YR 5/8) sand; tailings.
1B0-30 cm; yellowish red (5YR 5/8) sandy loam; remixed tailings and slimes.
30-61 cm; yellowish red (5YR 5/8) clay; remixed tailings and slimes.
61-137 cm; yellow (10YR 7/6) sand; tailings.
137-152 cm; yellowish red (5YR 5/8) sand; tailings.
1C0-76 cm; yellowish red (5YR 5/8) sandy loam; remixed tailings and slimes.
76-60 cm; very pale brown (10YR 8/4) sand; tailings.
1D 0-25 cm; yellow (10YR 7/6) sandy loam; remixed tailings and slimes.
25-91 cm; yellowish red (5YR 5/8) sandy clay loam; remixed tailings and slimes.
91-152 cm; yellowish red (5YR 5/8) sand; tailings.
2A0-61 cm; yellowish red (5YR 5/8) sandy clay loam; remixed tailings and slimes.
61-91 cm; yellow (10YR 7/6) sand; tailings.
91-97 cm; yellowish red (5YR 5/8) clay; slimes.
97-152 cm; yellowish red (5YR 5/8) sand; tailings.
2B0-46 cm; yellowish red (5YR 5/8) sandy clay loam; remixed tailings and slimes.
46-152 cm; yellow (10YR 7/6) sand; tailings.

144
2C0-30 cm; yellowish red (5YR 5/8) loamy sand; remixed tailings and slimes.
30-91 cm; yellowish red (5YR 5/8) clay; remixed tailings and slimes.
91-152 cm; yellow (10YR 7/6) sand; tailings.
2D0-30 cm; yellowish red (5YR 5/8) sandy loam; remixed tailings and slimes.
30-152 cm; yellowish red (5YR 5/8) sand; tailings.
3A0-30 cm; sandy loam; remixed tailings and slimes.
30-122 cm; yellowish red (5YR 5/8) sandy clay loam; remixed tailings and slimes.
122-152 cm; reddish yellow (7.5YR 6/6) sand; tailings.
3B0-152 cm; yellowish red (5YR 5/8) sandy clay loam; remixed tailings and slimes.
3C0-30 cm; yellowish red (5YR 5/8) loamy sand; remixed tailings and slimes.
30-152 cm; yellowish red (5YR 5/8) sand; tailings.
3D0-30 cm; yellowish red (5YR 5/8) loamy sand; remixed tailings and slimes.
30-152 cm; yellowish red (5YR 5/8) sand; tailings.
4A0-30 cm; red (2.5YR 4/8) sandy clay loam; remixed tailings and slimes.
30-36 cm; brown (10YR 5/3) sand; tailings.
36-152 cm; yellowish red (5YR 5/8) sand; tailings.

145
4B0-91 cm; yellowish red (5YR 5/8) sand; tailings.
91-152 cm; yellowish red (5YR 5/8) sandy loam; remixed tailings and slimes.
4C 0-76 cm; yellowish red (5YR 5/8) sand; tailings.
76-152 cm; yellowish red (5YR 5/8) sand; tailings.
4D0-56 cm; yellowish red (5YR 5/8) sandy loam; remixed tailings and slimes.
56-152 cm; yellowish red (5YR 5/8) sand; tailings.
5A 0-76 cm; yellowish red (5YR 5/8) sand; tailings.
76-152 cm; yellowish red (5YR 5/8) sand; tailings.
5B0-20 cm; strong brown (7.5YR 5/8) sandy loam; remixed tailings and slimes.
20-76 cm; yellowish red (5YR 5/8) sandy clay loam; remixed tailings and slimes with decaying plant matter.
76-152 cm; yellowish red (5YR 5/8) sandy loam; remixed tailings and slimes.
5C0-76 cm; yellowish red (5YR 5/8) sandy loam; remixed tailings and slimes with decaying plant matter.
76-152 cm; yellowish red (5YR 5/8) sand; remixed tailings and slimes with decaying plant matter.
5D0-30 cm; yellowish red (5YR 5/8) sandy clay loam; remixed tailings and slimes.
30-122 cm; yellowish red (5YR 5/8) loamy sand; remixed tailings and slimes.
122-152 cm; yellowish red (5YR 5/8) sandy loam; remixed tailings and slimes with decaying plant matter.

146
6A0-36 cm; pink (7.5YR 7/4) sand; tailings.
36-152 cm; yellowish red (5YR 5/8) sand; tailings.
6B0-30 cm; very pale brown (10YR 8/4) sand; tailings.
30-91 cm; yellowish red (5YR 5/8) sandy loam; remixed tailings and slimes.
91-152 cm; yellowish red (5YR 5/8) sandy clay loam; remixed tailings and slimes.
6C 0-76 cm; yellowish red (5YR 5/8) sandy loam; remixed tailings and slimes..
76-152 cm; yellowish red (5YR 5/8) sandy loam; remixed tailings and slimes.
6D0-91 cm; yellowish red (5YR 5/8) sandy loam; tailings.
91-117 cm; yellowish red (5YR 5/8) loamy sand; remixed tailings and slimes with decaying plant matter.
117-152 cm; yellowish red (5YR 5/8) clay; slimes with decaying plant matter.
7A0-36 cm; yellowish red (5YR 5/8) sandy loam; remixed tailings and slimes.
36-61 cm; reddish yellow (7.5YR 6/8) loamy sand; tailings.
61-152 cm; yellowish red (5YR 5/8) sandy loam; remixed tailings and slimes.
7B0-76 cm; yellowish red (5YR 5/8) sandy loam; remixed tailings and slimes..
76-152 cm; yellowish red (5YR 5/8) sandy loam; remixed tailings and slimes.
7C 0-76 cm; yellowish red (5YR 5/8) sandy loam; remixed tailings and slimes..
76-152 cm; yellowish red (5YR 5/8) sandy loam; remixed tailings and slimes.

147
7D 0-76 cm; yellowish red (5YR 5/8) sandy loam; remixed tailings and slimes..
76-152 cm; yellowish red (5YR 5/8) sandy loam; remixed tailings and slimes.

148
APPENDIX VII
Chemical and Physical Data for Soil Samples Taken from Pit AreasPrior to Mining
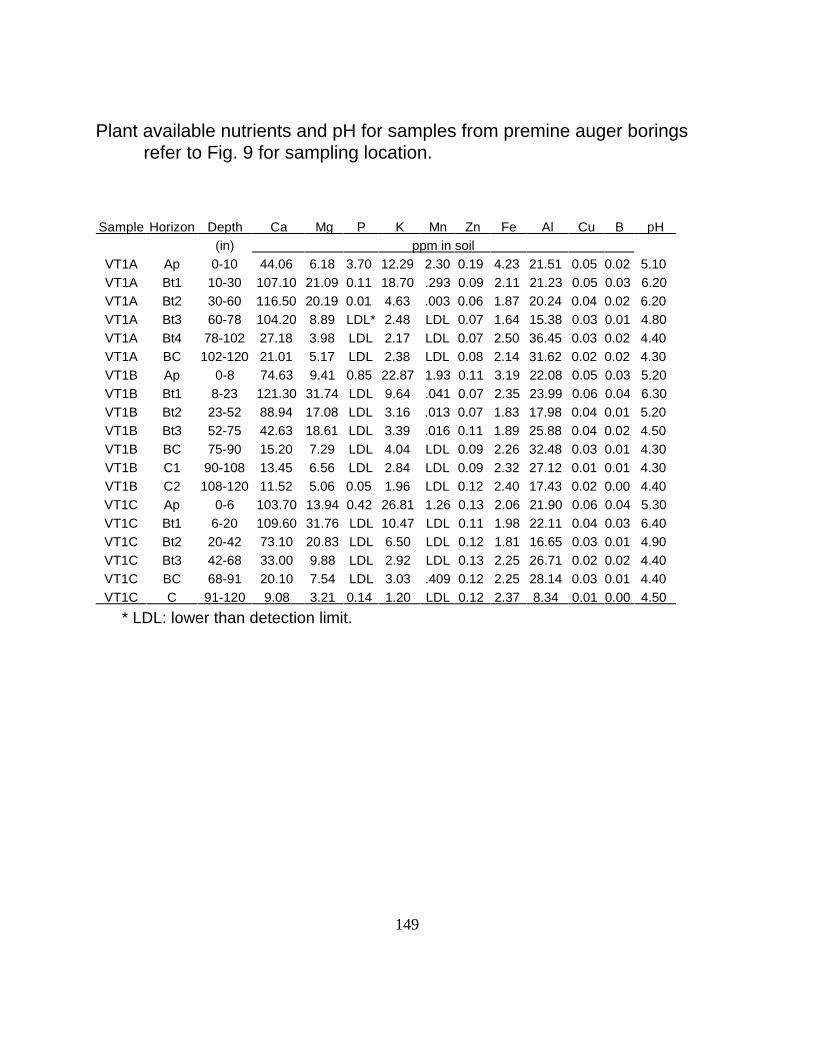
149
Plant available nutrients and pH for samples from premine auger borings refer to Fig. 9 for sampling location.
Sample Horizon Depth Ca Mg P K Mn Zn Fe Al Cu B pH(in) ppm in soil
VT1A Ap 0-10 44.06 6.18 3.70 12.29 2.30 0.19 4.23 21.51 0.05 0.02 5.10 VT1A Bt1 10-30 107.10 21.09 0.11 18.70 .293 0.09 2.11 21.23 0.05 0.03 6.20 VT1A Bt2 30-60 116.50 20.19 0.01 4.63 .003 0.06 1.87 20.24 0.04 0.02 6.20 VT1A Bt3 60-78 104.20 8.89 LDL* 2.48 LDL 0.07 1.64 15.38 0.03 0.01 4.80 VT1A Bt4 78-102 27.18 3.98 LDL 2.17 LDL 0.07 2.50 36.45 0.03 0.02 4.40 VT1A BC 102-120 21.01 5.17 LDL 2.38 LDL 0.08 2.14 31.62 0.02 0.02 4.30 VT1B Ap 0-8 74.63 9.41 0.85 22.87 1.93 0.11 3.19 22.08 0.05 0.03 5.20 VT1B Bt1 8-23 121.30 31.74 LDL 9.64 .041 0.07 2.35 23.99 0.06 0.04 6.30 VT1B Bt2 23-52 88.94 17.08 LDL 3.16 .013 0.07 1.83 17.98 0.04 0.01 5.20 VT1B Bt3 52-75 42.63 18.61 LDL 3.39 .016 0.11 1.89 25.88 0.04 0.02 4.50 VT1B BC 75-90 15.20 7.29 LDL 4.04 LDL 0.09 2.26 32.48 0.03 0.01 4.30 VT1B C1 90-108 13.45 6.56 LDL 2.84 LDL 0.09 2.32 27.12 0.01 0.01 4.30 VT1B C2 108-120 11.52 5.06 0.05 1.96 LDL 0.12 2.40 17.43 0.02 0.00 4.40 VT1C Ap 0-6 103.70 13.94 0.42 26.81 1.26 0.13 2.06 21.90 0.06 0.04 5.30 VT1C Bt1 6-20 109.60 31.76 LDL 10.47 LDL 0.11 1.98 22.11 0.04 0.03 6.40 VT1C Bt2 20-42 73.10 20.83 LDL 6.50 LDL 0.12 1.81 16.65 0.03 0.01 4.90 VT1C Bt3 42-68 33.00 9.88 LDL 2.92 LDL 0.13 2.25 26.71 0.02 0.02 4.40 VT1C BC 68-91 20.10 7.54 LDL 3.03 .409 0.12 2.25 28.14 0.03 0.01 4.40 VT1C C 91-120 9.08 3.21 0.14 1.20 LDL 0.12 2.37 8.34 0.01 0.00 4.50
* LDL: lower than detection limit.

150
Sample Horizon Depth Ca Mg P K Mn Zn Fe Al Cu B pH(in) ppm in soil
VT3A Bt1 7-27 107.50 25.36 LDL* 22.49 0.11 0.08 1.97 22.29 0.04 0.03 6.20 VT3A Bt2 27-58 80.78 18.13 LDL 9.22 0.00 0.07 1.63 16.45 0.03 0.01 5.40 VT3A Bt3 58-82 78.52 12.16 LDL 2.70 0.00 0.06 1.63 15.59 0.03 0.01 4.70 VT3A Bt4 82-111 32.20 8.74 LDL 2.79 0.01 0.06 2.21 31.23 0.03 0.02 4.40 VT3A BC 111-120 21.07 9.80 LDL 3.12 0.02 0.07 1.94 27.80 0.03 0.02 4.40 VT3B Ap 0-4 66.98 10.05 0.73 23.97 1.78 0.12 2.51 21.72 0.04 0.02 5.10 VT3B Bt1 4-15 127.20 26.35 LDL 9.05 0.13 0.09 2.10 22.97 0.05 0.03 6.30 VT3B Bt2 15-38 87.76 24.16 LDL 3.67 LDL 0.08 1.86 18.91 0.04 0.01 5.30 VT3B Bt3 38-60 81.05 12.06 LDL 2.52 LDL 0.08 1.65 14.99 0.03 0.01 4.80 VT3B Bt4 60-80 33.95 8.31 LDL 2.06 LDL 0.04 2.11 27.45 0.03 0.03 4.30 VT3B BC 80-93 15.91 7.45 LDL 2.11 LDL 0.05 2.20 32.81 0.03 0.02 4.40 VT3B CB 93-108 9.17 8.36 LDL 1.74 LDL 0.04 2.06 26.46 0.02 0.03 4.30 VT3B C 108-120 7.20 5.47 0.11 1.00 LDL 0.05 1.88 15.77 0.02 0.01 4.30 VT3C Ap 0-4 83.39 13.58 0.41 20.87 0.99 0.11 2.07 20.40 0.05 0.04 5.30 VT3C Bt1 4-24 79.31 23.80 LDL 5.75 LDL 0.05 1.85 19.46 0.03 0.02 5.10 VT3C Bt2 24-48 73.59 17.78 LDL 2.82 LDL 0.05 1.77 19.26 0.03 0.02 4.80 VT3C Bt3 48-60 25.40 6.41 LDL 2.41 LDL 0.06 2.50 35.15 0.03 0.02 4.40 VT3C BC 60-77 14.93 4.64 LDL 2.10 LDL 0.08 2.36 31.77 0.03 0.02 4.40 VT3C C1 77-88 13.04 5.03 0.03 1.94 LDL 0.06 2.10 26.83 0.02 0.02 4.40 VT3C C2 88-120 7.49 2.40 0.10 0.51 LDL 0.06 1.66 9.24 0.01 0.01 4.40

151
Particle size data for samples taken from auger borings of pit areas prior to mining
Series VT1A VT1A VT1A VT1A VT1A VT1B VT1B VT1B VT1B VT1B VT1B VT1B VT1C
Horizon Bt1 Bt2 Bt3 Bt4 BC Ap Bt1 Bt2 Bt3 BC C1 C2 Ap
%VCS 0.5 0.6 0.5 1.3 1.6 0.5 0.5 0.6 0.9 0.8 2.0 0.8 0.4
%CS 5.3 5.1 6.0 6.6 5.9 4.4 4.0 5.7 4.9 5.0 7.5 4.9 4.3
%MS 17.0 16.4 15.6 17.3 17.1 15.3 15.4 15.6 16.6 17.8 19.4 19.7 15.8
%FS 32.9 33.5 28.7 35.1 40.1 44.0 32.3 33.2 34.5 38.5 41.5 52.7 38.6
%VFS 6.2 5.8 10.6 5.5 6.6 7.7 6.1 5.9 6.3 5.9 6.8 7.9 6.6
Total % Sand 61.9 61.4 61.4 65.8 71.3 71.9 58.3 61.0 63.2 68.0 77.2 86.0 65.7
%CSI 2.5 4.9 5.3 6.7 0.1 4.8 5.9 5.3 1.4 4.5 3.9 3.6 0.1
%MSI 5.7 5.2 3.2 4.8 0.0 6.6 5.1 1.3 4.9 2.4 2.2 1.2 8.3
%FSI 6.8 1.8 1.5 0.8 1.1 3.3 4.5 1.8 1.4 1.7 0.0 0.6 1.9
Total % Silt 15.0 11.9 10.0 12.3 1.2 14.7 15.5 8.4 7.7 8.6 6.1 5.4 10.3
Total % Clay 23.1 26.7 28.6 21.9 27.5 13.4 26.2 30.6 29.1 23.4 16.7 8.6 24.0
Textural Class SCL SCL SCL SCL SCL SL SCL SCL SCL SCL SL LS SCL
Series VT1C VT1C VT1C VT1C VT1C VT2A VT2A VT2A VT2A VT2A VT2A VT2B VT2B
Horizon Bt1 Bt2 Bt3 BC C Ap Bt1 Bt2 Bt3 Bt4 BC Ap Bt1
%VCS 0.6 0.5 0.6 1.4 1.0 0.3 0.7 0.5 1.0 1.3 1.6 1.1 0.8
%CS 4.0 4.7 722.4 5.8 4.3 6.2 5.9 4.8 5.6 5.5 5.3 4.9 4.8
%MS 14.3 15.6 -700.1 19.6 27.0 19.4 17.0 14.7 15.0 15.8 16.6 17.6 15.4
%FS 32.7 31.9 38.7 41.5 53.3 43.9 33.0 35.1 31.3 32.7 40.5 40.0 32.4
%VFS 5.6 5.6 0.0 6.8 7.7 10.4 5.5 6.4 5.6 5.7 6.8 7.6 5.6
Total % Sand 57.2 58.3 61.6 75.1 93.3 80.2 62.1 61.5 58.5 61.0 70.8 71.2 59.0
%CSI 2.9 3.0 9.7 3.9 6.1 6.9 5.5 3.9 3.6 3.5 4.1 5.7 2.8
%MSI 3.0 2.9 2.2 1.9 0.0 7.2 6.1 4.6 3.0 1.1 2.1 5.9 4.6
%FSI 1.8 0.9 0.1 0.8 0.6 1.2 4.3 2.4 1.3 2.0 0.9 3.2 2.4
Total % Silt 7.7 6.8 12.0 6.6 6.7 15.3 15.9 10.9 7.9 6.6 7.1 14.8 9.8
Total % Clay 35.1 34.9 26.4 18.3 0.0 4.5 22.0 27.6 33.6 32.4 22.1 14.0 31.2
Textural Class SCL SCL SCL SL S LS SCL SCL SCL SCL SCL SL SCL
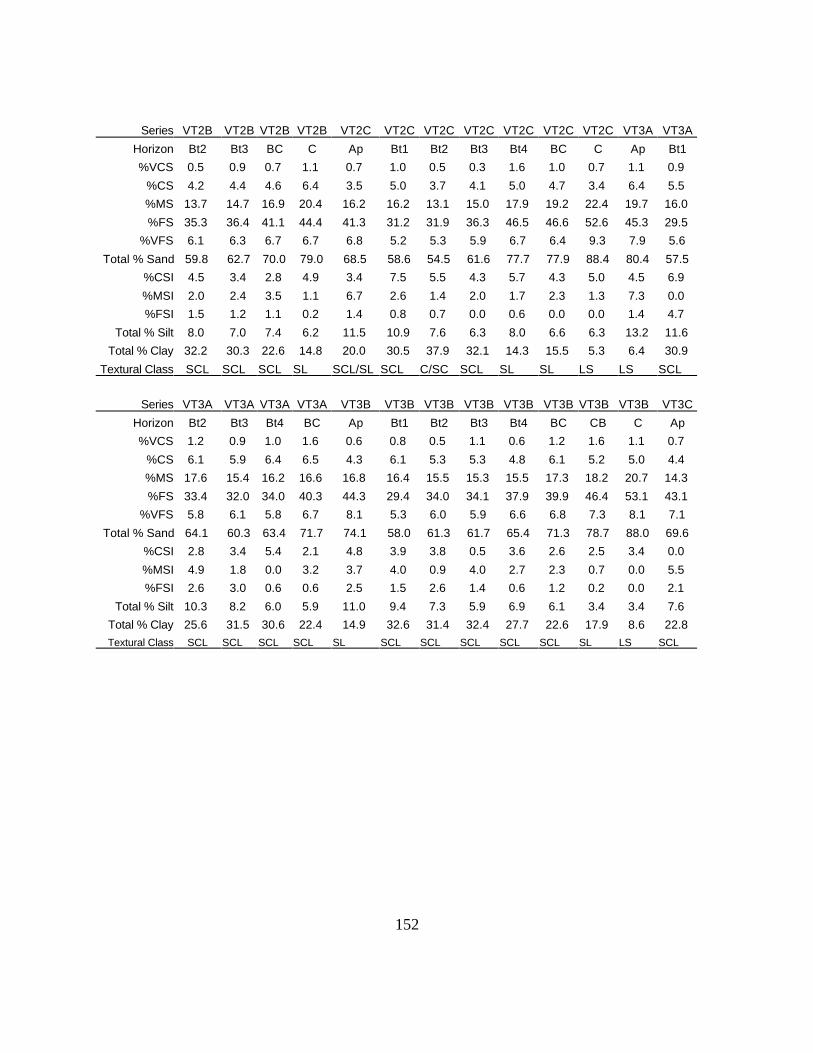
152
Series VT2B VT2B VT2B VT2B VT2C VT2C VT2C VT2C VT2C VT2C VT2C VT3A VT3A
Horizon Bt2 Bt3 BC C Ap Bt1 Bt2 Bt3 Bt4 BC C Ap Bt1
%VCS 0.5 0.9 0.7 1.1 0.7 1.0 0.5 0.3 1.6 1.0 0.7 1.1 0.9
%CS 4.2 4.4 4.6 6.4 3.5 5.0 3.7 4.1 5.0 4.7 3.4 6.4 5.5
%MS 13.7 14.7 16.9 20.4 16.2 16.2 13.1 15.0 17.9 19.2 22.4 19.7 16.0
%FS 35.3 36.4 41.1 44.4 41.3 31.2 31.9 36.3 46.5 46.6 52.6 45.3 29.5
%VFS 6.1 6.3 6.7 6.7 6.8 5.2 5.3 5.9 6.7 6.4 9.3 7.9 5.6
Total % Sand 59.8 62.7 70.0 79.0 68.5 58.6 54.5 61.6 77.7 77.9 88.4 80.4 57.5
%CSI 4.5 3.4 2.8 4.9 3.4 7.5 5.5 4.3 5.7 4.3 5.0 4.5 6.9
%MSI 2.0 2.4 3.5 1.1 6.7 2.6 1.4 2.0 1.7 2.3 1.3 7.3 0.0
%FSI 1.5 1.2 1.1 0.2 1.4 0.8 0.7 0.0 0.6 0.0 0.0 1.4 4.7
Total % Silt 8.0 7.0 7.4 6.2 11.5 10.9 7.6 6.3 8.0 6.6 6.3 13.2 11.6
Total % Clay 32.2 30.3 22.6 14.8 20.0 30.5 37.9 32.1 14.3 15.5 5.3 6.4 30.9
Textural Class SCL SCL SCL SL SCL/SL SCL C/SC SCL SL SL LS LS SCL
Series VT3A VT3A VT3A VT3A VT3B VT3B VT3B VT3B VT3B VT3B VT3B VT3B VT3C
Horizon Bt2 Bt3 Bt4 BC Ap Bt1 Bt2 Bt3 Bt4 BC CB C Ap
%VCS 1.2 0.9 1.0 1.6 0.6 0.8 0.5 1.1 0.6 1.2 1.6 1.1 0.7
%CS 6.1 5.9 6.4 6.5 4.3 6.1 5.3 5.3 4.8 6.1 5.2 5.0 4.4
%MS 17.6 15.4 16.2 16.6 16.8 16.4 15.5 15.3 15.5 17.3 18.2 20.7 14.3
%FS 33.4 32.0 34.0 40.3 44.3 29.4 34.0 34.1 37.9 39.9 46.4 53.1 43.1
%VFS 5.8 6.1 5.8 6.7 8.1 5.3 6.0 5.9 6.6 6.8 7.3 8.1 7.1
Total % Sand 64.1 60.3 63.4 71.7 74.1 58.0 61.3 61.7 65.4 71.3 78.7 88.0 69.6
%CSI 2.8 3.4 5.4 2.1 4.8 3.9 3.8 0.5 3.6 2.6 2.5 3.4 0.0
%MSI 4.9 1.8 0.0 3.2 3.7 4.0 0.9 4.0 2.7 2.3 0.7 0.0 5.5
%FSI 2.6 3.0 0.6 0.6 2.5 1.5 2.6 1.4 0.6 1.2 0.2 0.0 2.1
Total % Silt 10.3 8.2 6.0 5.9 11.0 9.4 7.3 5.9 6.9 6.1 3.4 3.4 7.6
Total % Clay 25.6 31.5 30.6 22.4 14.9 32.6 31.4 32.4 27.7 22.6 17.9 8.6 22.8
Textural Class SCL SCL SCL SCL SL SCL SCL SCL SCL SCL SL LS SCL

153
Series VT3 VT3C VT3C VT 3C VT 3C VT 3C
Horizon Bt1 Bt2 Bt3 BC C1 C2
%VCS 0.8 0.6 1.2 2.7 2.1 0.6
%CS 5.0 4.7 5.1 6.8 7.1 4.4
%MS 14.2 13.9 18.4 17.9 21.0 26.1
%FS 30.1 32.3 37.9 40.8 42.4 51.6
%VFS 5.0 5.3 6.4 6.4 6.2 8.2
Total % Sand 55.1 56.8 69.0 74.6 78.8 90.9
%CSI 0.0 0.3 0.3 2.8 2.8 4.0
%MSI 4.2 2.8 3.7 2.3 2.4 0.0
%FSI 1.0 1.4 1.2 0.1 0.0 0.0
Total % Silt 5.2 4.5 5.2 5.2 5.2 4.0
Total % Clay 39.7 38.7 25.8 20.2 16.0 5.1
Textural ClassC/SC C/SC SCL SCL/SL SL S

154
Exchangeable cations and CEC data for samples taken from the walls of Pit 1
Sampling Horizon Depth pH Ca Mg K H Al Bases ECEC CEC BSLocation (in) Exchangeable
East Wall Ap 0-12 5.60 0.57 0.05 0.18 5.40 0.60 0.80 1.40 6.20 12.90 Bt1 12-30 6.10 2.96 0.69 0.30 3.40 0.20 3.95 4.15 7.35 53.74 Bt2 30-66 5.20 2.48 0.32 0.05 5.60 0.90 2.85 3.75 8.45 33.73 Bt3 66-92 4.80 0.36 0.25 0.04 8.00 2.00 0.65 2.65 8.65 7.51 Bt4 92-120 4.80 0.06 0.39 0.05 6.40 1.90 0.50 2.40 6.90 7.25 C 120-146 5.60 0.02 0.12 0.02 4.80 1.10 0.16 1.26 4.96 3.23 Cv 146-162 4.90 0.04 0.06 0.02 4.00 0.80 0.12 0.92 4.12 2.91
West Wall Ap 0-12 5.20 0.49 0.07 0.18 2.80 1.60 0.74 2.34 3.54 20.90 Bt1 12-35 5.90 2.88 0.64 0.37 3.80 0.20 3.89 4.09 7.69 50.59 Bt2 35-66 5.10 1.70 0.31 0.22 6.40 0.90 2.23 3.13 8.63 25.84 Bt3 66-84 5.10 2.27 0.21 0.33 8.00 0.90 2.81 3.71 10.81 25.99 Bt4 84-120 4.70 0.43 0.20 0.09 5.80 1.60 0.72 2.32 6.52 11.04 CB 120-138 4.50 0.31 0.20 0.03 5.60 1.80 0.54 2.34 6.14 8.79 Cv 138-159 4.70 0.07 0.20 0.02 3.00 0.80 0.29 1.09 3.29 8.81

155
Particle size data for samples taken from the walls of Pit 1location E. WALL E. WALL E. WALL E. WALL E. WALL E. WALL E. WALL
Horizon Ap Bt 1 Bt 2 Bt 3 Bt4 C Cv
Depth 0-12 12-30 30-66 66-92 92-120 120-146 146-162
%VCS 0.8 0.3 0.9 1.2 0.9 1.6 1.0
%CS 8.0 5.5 7.3 5.9 6.8 5.8 4.6
%MS 20.4 18.0 18.1 15.6 16.9 22.0 21.4
%FS 42.7 31.3 29.3 30.5 35.3 45.6 54.5
%VFS 7.2 5.3 8.5 4.8 5.5 6.1 7.2
Total % Sand 79.1 60.4 64.1 58.0 65.4 81.1 88.7
%CSI 4.2 2.6 1.6 2.1 2.8 1.8 3.7
%MSI 8.1 0.1 3.1 0.9 3.2 0.0 1.6
%FSI 1.6 8.1 1.9 2.4 0.0 4.1 0.1
Total % Silt 13.9 10.8 6.6 5.4 6.0 5.9 5.4
Total % Clay 7.0 28.8 29.3 36.6 28.6 13.0 5.9
Textural Class LS SCL SCL C/SC SCL SL LS/S
location W. WALL W. WALL W. WALL W. WALL W. WALL W. WALL W. WALL
Horizon Ap Bt1 Bt2 Bt3 Bt4 CB Cv
Depth 0-12 12-35 35-66 66-84 84-120 120-138 138-159
%VCS 0.6 0.9 1.0 1.0 1.0 2.2 2.0
%CS 7.4 6.6 5.4 5.6 6.1 7.7 5.5
%MS 21.7 16.0 15.6 16.5 17.2 17.9 19.6
%FS 46.0 28.8 37.2 34.0 35.5 38.7 44.1
%VFS 5.8 5.7 6.3 5.4 5.9 5.8 6.8
Total % Sand 81.5 58.0 65.5 62.5 65.7 72.3 78.0
%CSI 5.1 3.4 3.2 2.0 2.8 2.2 7.6
%MSI 7.9 5.7 4.7 3.8 1.8 1.5 2.0
%FSI 2.6 3.7 2.5 0.3 2.6 1.2 1.2
Total % Silt 15.6 12.8 10.4 6.1 7.2 4.9 10.8
Total % Clay 2.9 29.2 24.1 31.4 27.1 22.8 11.2
Textural Class LS SCL SCL SCL SCL SCL SL

156
APPENDIX VIII
Chemical Data for Soil Samples Taken After Wheat Harvest

157
Plant available nutrients for surface soil samples taken after wheat harvest (June, 1996)
SAMPLE ID Ca Mg P K Mn Zn Fe Al Cu B pH TOT C
ppm in soil
CONT2 71.32 10.45 19.89 12.85 2.17 0.28 3.72 33.54 0.03 0.02 6.0 0.39
CONT4 89.20 11.89 20.49 14.22 1.84 0.26 3.92 31.32 0.01 0.02 6.3 0.42
CONT5 68.90 10.25 9.66 13.24 1.43 0.20 3.23 23.47 0.01 0.03 6.3 0.43
CONT6 67.83 10.87 6.43 14.94 1.42 9.30 3.05 23.18 0.01 0.03 6.5 0.49
CONT7 61.23 10.36 12.74 13.09 1.57 0.36 3.02 29.95 0.02 0.02 6.1 0.40
CONT10 73.72 12.02 6.45 17.53 1.68 0.25 2.87 24.25 0.01 0.03 6.3 0.55
CONT13 62.86 11.84 9.16 12.63 1.62 0.21 3.51 27.03 0.02 0.02 6.2 0.50
CONT14 86.16 13.97 7.37 16.89 1.87 0.19 2.92 22.97 0.01 0.04 6.5 0.57
CONT16 78.73 13.46 5.59 21.90 1.71 0.17 3.62 23.04 0.01 0.04 6.3 0.58
CONT17 62.45 10.98 3.58 18.74 1.33 0.14 2.90 21.51 0.01 0.03 6.1 0.55
PT1TS1 82.81 23.49 4.46 19.24 1.51 0.13 4.22 25.54 0.03 0.03 6.4 0.41
PT1TS3 72.54 18.25 4.11 22.94 1.44 0.13 4.80 26.72 0.04 0.03 6.2 0.43
PT1TS4 69.89 17.20 4.85 23.41 1.44 0.14 5.31 26.42 0.04 0.02 6.2 0.42
PT1TS7 70.03 17.88 3.93 19.45 1.31 0.13 4.46 24.74 0.03 0.02 6.2 0.40
PT1TS10 68.79 19.37 3.57 16.15 1.32 0.13 3.96 23.87 0.01 0.03 6.5 0.37
PT1TS12 72.48 19.84 4.76 21.92 1.41 0.13 4.67 24.81 0.02 0.03 6.4 0.40
PT1CP1 134.10 24.67 5.41 23.32 2.42 0.32 4.98 27.55 0.01 0.08 5.9 0.66
PT1CP6 142.80 24.36 7.88 30.22 2.36 0.35 6.04 29.32 0.01 0.09 6.0 0.81
PT1CP7 128.20 22.46 6.44 27.19 2.21 0.31 4.85 28.30 0.01 0.07 5.9 0.67
PT1CP9 137.40 24.41 9.37 29.72 2.15 0.31 4.85 31.16 0.01 0.09 6.1 0.74
PT1CP10 144.20 25.74 9.04 32.51 2.25 0.33 5.01 31.96 0.01 0.10 6.0 0.78
PT1CP12 136.20 25.68 6.75 28.13 2.01 0.28 4.63 29.93 LDL* 0.09 6.0 0.69
PT3TS1 101.20 25.34 2.62 25.52 1.73 0.15 5.20 21.77 LDL 0.04 6.9 0.61
PT3TS2 101.80 28.62 1.53 23.95 1.34 0.12 3.50 20.85 LDL 0.04 6.8 0.82
PT3TS3 120.30 33.20 4.37 26.27 1.79 0.14 4.05 25.61 LDL 0.05 6.9 0.80
PT3TS5 109.60 27.22 3.01 22.86 3.60 0.18 3.51 25.12 0.01 0.05 6.9 0.61
PT3TS9 120.50 30.58 3.23 29.98 1.70 0.15 3.73 25.07 0.01 0.05 6.8 0.68
PT3TS12 115.90 30.54 4.32 25.49 1.86 0.15 5.05 25.42 0.02 0.05 6.8 0.72
PT3CP2 108.80 18.80 9.93 23.93 1.41 0.29 5.57 20.47 0.03 0.07 6.0 0.50
PT3CP3 123.60 19.53 13.65 22.50 1.83 0.38 8.13 21.60 0.04 0.07 6.2 0.58
PT3CP5 107.40 18.52 11.05 20.76 1.37 0.30 5.53 23.21 0.03 0.05 5.8 0.59
PT3CP8 82.55 12.31 12.61 14.49 1.10 0.29 5.35 15.07 0.03 0.04 6.2 0.40
PT3CP10 123.40 21.02 12.40 26.17 1.57 0.30 6.05 22.78 0.05 0.07 6.2 0.49
PT3CP12 122.30 19.69 11.49 23.18 1.46 0.34 6.00 23.89 0.12 0.08 5.8 0.58
* LDL: Lower than detection limit. CONT: Control, PT1TS: Pit 1 topsoil, PT1CP: Pit 1 compostPT3TS: Pit 3 topsoil, PT3CP: Pit 3 compost.

158
APPENDIX IX
Physical and Chemical Properties of Soil Samples Taken AfterSoybean Harvest

159
Chemical and physical data for soil samples taken from soil pits dug after soybean harvest (November, 1996)Pit # Horizon Depth (cm) % Sand % Silt % Clay % carbon Bulk den. Adj Bd pH BASES ECEC CEC BS Ca Mg K H Al
Exchangeable
Control I Ap 0-19 84.9 13.5 1.6 0.48 1.93 1.76 5.90 1.27 1.37 4.07 31.22 1.00 0.26 0.01 2.80 0.10
Control I E 19-27 73.8 17.3 8.9 0.191 ns 5.08 0.74 1.24 2.74 27.01 0.40 0.13 0.21 2.00 0.50
Control I Bt1 27-59 60.6 15.3 24.1 0.287 1.80 1.59 4.80 2.36 2.86 3.36 70.24 1.60 0.38 0.38 1.00 0.50
Control I Bt2 59-89 55.9 9.0 35.1 0.21 1.84 1.62 4.72 4.04 4.44 10.64 37.97 2.50 1.22 0.32 6.60 0.04
Control I Bt3 89-150 63.0 7.9 29.1 0.138 1.84 1.62 4.86 2.72 3.22 5.92 45.95 1.80 0.63 0.29 3.20 0.50
Control II Ap 0-21 84.8 13.7 1.5 0.358 1.93 1.76 5.58 1.03 1.13 2.43 42.39 0.80 0.14 0.09 1.40 0.10
Control II Bt1 27-84 59.8 12.9 27.3 0.252 1.73 1.53 5.54 3.21 3.36 6.01 53.41 2.10 0.70 0.41 2.80 0.15
Control II Bt2 84-150 63.8 9.8 26.4 0.116 1.86 1.64 5.14 2.73 3.23 7.93 34.43 1.70 0.88 0.15 5.20 0.50
Control III Ap 0-17 80.9 14.4 4.7 0.431 1.90 1.73 5.74 1.31 1.41 2.51 52.19 0.90 0.28 0.13 1.20 0.10
Control III Bt1 17-82 54.3 10.5 35.2 0.263 1.68 1.48 5.88 4.58 4.68 9.58 47.81 3.00 1.35 0.23 5.00 0.01
Control III Bt2 82-150 61.1 8.8 30.1 0.0114 1.75 1.54 5.85 2.52 3.22 9.32 27.04 2.00 0.47 0.05 6.80 0.70
Control IV Ap 0-21 78.2 14.0 7.8 0.692 1.88 1.71 5.65 1.93 2.08 8.53 22.63 1.20 0.49 0.24 6.60 0.15
Control IV Bt1 21-62 56.0 8.8 35.2 0.173 1.68 1.48 5.78 6.29 6.44 12.69 49.57 4.20 1.84 0.25 6.40 0.15
Control IV Bt2 62-100 54.4 7.7 37.9 0.129 1.63 1.44 5.41 4.40 4.85 11.20 39.29 3.30 1.03 0.07 6.80 0.45
Control IV Btv 100-150 55.3 8.5 36.2 0.118 1.57 1.39 4.51 0.69 3.69 7.29 9.47 0.30 0.32 0.07 6.60 3.00
Control V Ap 0-19 83.1 14.5 2.4 0.64 1.84 1.68 5.30 2.04 2.09 2.04 100.00 1.40 0.49 0.15 0.00 0.05
Control V Bt1 19-93 57.3 9.8 32.9 0.173 1.62 1.43 5.54 4.56 4.61 6.16 74.03 2.90 1.54 0.12 1.60 0.05
Control V Bt2 93-162 53.2 5.6 41.2 0.131 1.56 1.41 4.85 4.62 6.02 7.02 65.81 4.00 0.53 0.09 2.40 0.14
Control V Btv 162-187 60.5 4.9 34.6 0.124 1.62 1.43 4.63 0.48 3.28 8.68 5.53 0.20 0.23 0.05 8.20 2.80
Control VI Ap 0-21 83.5 15.3 1.2 0.567 2.03 1.85 5.37 1.74 1.79 1.94 89.69 1.20 0.41 0.13 0.20 0.05
Control VI Bt1 21-69 55.2 10.4 34.4 0.259 1.57 1.38 5.48 4.29 4.39 7.69 55.79 2.40 1.42 0.47 3.40 0.10
Control VI Bt2 69-99 61.6 7.5 30.9 0.127 1.70 1.50 5.20 2.85 3.10 6.45 44.19 1.60 0.98 0.27 3.60 0.25
Control VI Bt3 99-124 52.3 3.4 44.3 0.152 1.60 1.41 5.37 3.82 4.37 7.82 48.85 3.00 0.51 0.31 4.00 0.55
Control VI Bt4 124-150 51.4 8.3 40.3 0.15 1.56 1.38 4.73 3.46 4.76 10.06 34.39 2.90 0.49 0.07 6.60 1.30

160
Pit # Horizon Depth (cm) % Sand % Silt % Clay % carbon Bulk den. Adj Bd pH BASES ECEC CEC BS Ca Mg K H Al
Exchangeable
1TS I Ap 0-36 80.1 10.9 9.0 0.365 1.99 1.82 4.99 0.97 1.27 5.17 18.76 0.60 0.18 0.19 4.20 0.30
1TS I C 36-120 75.1 10.7 14.2 0.217 2.06 1.82 4.74 1.15 1.75 2.55 45.10 0.70 0.31 0.14 1.40 0.60
1TS II Ap 0-43 80.0 10.3 9.7 0.393 1.98 1.81 5.34 1.46 1.71 5.06 28.85 0.90 0.29 0.27 3.60 0.25
1TS II C 43-137 66.7 8.2 25.1 0.187 1.23 1.62 4.91 1.86 2.46 9.66 19.25 1.20 0.53 0.13 7.80 0.60
1TS III Ap 0-41 80.3 8.0 11.7 0.458 1.92 1.75 4.96 1.64 1.94 4.24 38.68 1.00 0.31 0.33 2.60 0.3
1TS III C1 41-149 66.3 9.3 24.4 0.205 1.80 1.59 5.31 1.64 2.34 5.44 30.15 1.00 0.50 0.14 3.80 0.70
1TS III C2 149-189 19.2 14.3 66.5 0.266 0.92 0.92 4.64 3.07 5.27 13.07 23.49 1.90 0.92 0.25 10.00 2.20
1TS III C3 189-200 92.7 3.6 3.7 0.061 1.55 1.55 4.80 0.09 0.39 1.49 6.04 0.00 0.07 0.02 1.40 0.30
1CP I Ap 0-6 72.2 10.4 17.4 0.967 1.55 1.37 5.25 5.72 5.77 9.12 62.72 4.30 1.25 0.17 3.40 0.05
1CP I C1 6-52 70.10 9.6 20.3 0.179 1.79 1.58 4.70 1.66 2.46 4.46 37.22 1.00 0.52 0.14 2.80 0.80
1CP I C2 52-130 73.70 9.1 17.2 0.107 1.84 1.63 4.54 0.55 1.95 1.75 31.43 0.20 0.27 0.08 1.20 1.40
1CP II Ap 0-8 70.50 10.6 18.9 1.522 1.39 1.23 5.53 7.76 7.86 9.16 84.72 5.90 1.60 0.26 1.40 0.10
1CP II C1 8-75 71.10 10.5 18.4 0.197 1.92 1.69 4.85 1.61 2.21 6.01 26.79 1 0.42 0.19 4.40 0.60
1CP II C2 75-100 97.10 2.6 0.3 0.05 1.64 1.64 4.80 0.14 0.29 0.14 100.00 0.10 0.02 0.02 0.00 0.15
1CP III Ap 0-8 71.30 11.1 17.6 1.734 1.40 1.24 5.65 8.86 9.01 14.06 63.02 6.70 1.75 0.41 5.20 0.15
1CP III C1 8-26 72.80 6.7 20.5 0.194 1.88 1.66 4.66 1.68 2.13 4.28 39.25 1.00 0.46 0.22 2.60 0.45
1CP III C2 25-139 94.5 3.8 1.7 0.055 1.73 1.73 4.50 0.16 0.36 0.56 28.57 0.10 0.04 0.02 0.40 0.20
3TS I Ap1 0-16 76.9 14.9 8.2 0.806 1.86 1.69 5.85 3.01 3.06 8.61 34.96 1.80 0.94 0.27 5.60 0.05
3TS I Ap2 16-53 82.8 8.5 8.7 0.372 ns 5.33 0.94 1.34 6.74 13.95 0.50 0.19 0.25 5.80 0.40
3TS I C1 53-111 80.2 6.4 13.4 0.13 1.75 1.75 4.68 1.04 1.49 4.04 25.74 0.50 0.38 0.16 3.00 0.45
3TS I C2 111-164 35.8 16.3 47.9 0.29 1.11 1.11 4.44 3.07 3.97 11.07 27.73 1.70 1.09 0.28 8.00 0.90
3TS I C3 164-190 98.5 1.4 0.1 0.051 ns ns 4.73 0.14 0.29 0.34 41.18 0.10 0.02 0.02 0.20 0.15
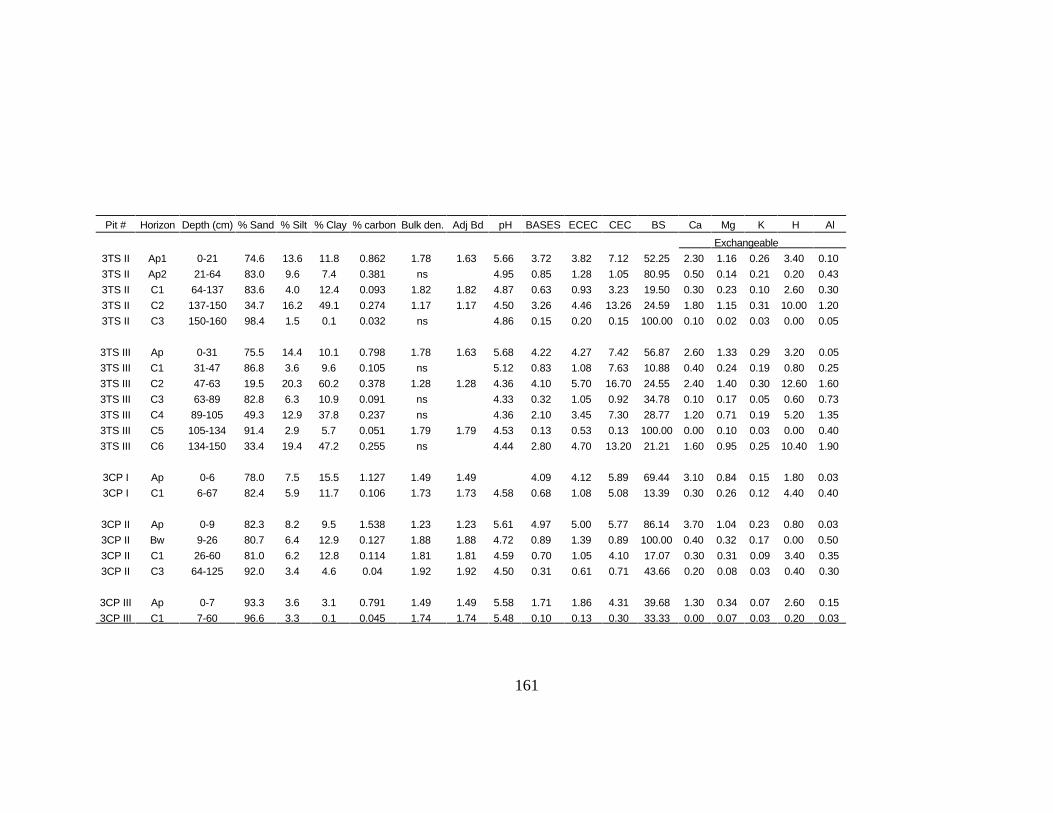
161
Pit # Horizon Depth (cm) % Sand % Silt % Clay % carbon Bulk den. Adj Bd pH BASES ECEC CEC BS Ca Mg K H Al
Exchangeable
3TS II Ap1 0-21 74.6 13.6 11.8 0.862 1.78 1.63 5.66 3.72 3.82 7.12 52.25 2.30 1.16 0.26 3.40 0.10
3TS II Ap2 21-64 83.0 9.6 7.4 0.381 ns 4.95 0.85 1.28 1.05 80.95 0.50 0.14 0.21 0.20 0.43
3TS II C1 64-137 83.6 4.0 12.4 0.093 1.82 1.82 4.87 0.63 0.93 3.23 19.50 0.30 0.23 0.10 2.60 0.30
3TS II C2 137-150 34.7 16.2 49.1 0.274 1.17 1.17 4.50 3.26 4.46 13.26 24.59 1.80 1.15 0.31 10.00 1.20
3TS II C3 150-160 98.4 1.5 0.1 0.032 ns 4.86 0.15 0.20 0.15 100.00 0.10 0.02 0.03 0.00 0.05
3TS III Ap 0-31 75.5 14.4 10.1 0.798 1.78 1.63 5.68 4.22 4.27 7.42 56.87 2.60 1.33 0.29 3.20 0.05
3TS III C1 31-47 86.8 3.6 9.6 0.105 ns 5.12 0.83 1.08 7.63 10.88 0.40 0.24 0.19 0.80 0.25
3TS III C2 47-63 19.5 20.3 60.2 0.378 1.28 1.28 4.36 4.10 5.70 16.70 24.55 2.40 1.40 0.30 12.60 1.60
3TS III C3 63-89 82.8 6.3 10.9 0.091 ns 4.33 0.32 1.05 0.92 34.78 0.10 0.17 0.05 0.60 0.73
3TS III C4 89-105 49.3 12.9 37.8 0.237 ns 4.36 2.10 3.45 7.30 28.77 1.20 0.71 0.19 5.20 1.35
3TS III C5 105-134 91.4 2.9 5.7 0.051 1.79 1.79 4.53 0.13 0.53 0.13 100.00 0.00 0.10 0.03 0.00 0.40
3TS III C6 134-150 33.4 19.4 47.2 0.255 ns 4.44 2.80 4.70 13.20 21.21 1.60 0.95 0.25 10.40 1.90
3CP I Ap 0-6 78.0 7.5 15.5 1.127 1.49 1.49 4.09 4.12 5.89 69.44 3.10 0.84 0.15 1.80 0.03
3CP I C1 6-67 82.4 5.9 11.7 0.106 1.73 1.73 4.58 0.68 1.08 5.08 13.39 0.30 0.26 0.12 4.40 0.40
3CP II Ap 0-9 82.3 8.2 9.5 1.538 1.23 1.23 5.61 4.97 5.00 5.77 86.14 3.70 1.04 0.23 0.80 0.03
3CP II Bw 9-26 80.7 6.4 12.9 0.127 1.88 1.88 4.72 0.89 1.39 0.89 100.00 0.40 0.32 0.17 0.00 0.50
3CP II C1 26-60 81.0 6.2 12.8 0.114 1.81 1.81 4.59 0.70 1.05 4.10 17.07 0.30 0.31 0.09 3.40 0.35
3CP II C3 64-125 92.0 3.4 4.6 0.04 1.92 1.92 4.50 0.31 0.61 0.71 43.66 0.20 0.08 0.03 0.40 0.30
3CP III Ap 0-7 93.3 3.6 3.1 0.791 1.49 1.49 5.58 1.71 1.86 4.31 39.68 1.30 0.34 0.07 2.60 0.15
3CP III C1 7-60 96.6 3.3 0.1 0.045 1.74 1.74 5.48 0.10 0.13 0.30 33.33 0.00 0.07 0.03 0.20 0.03
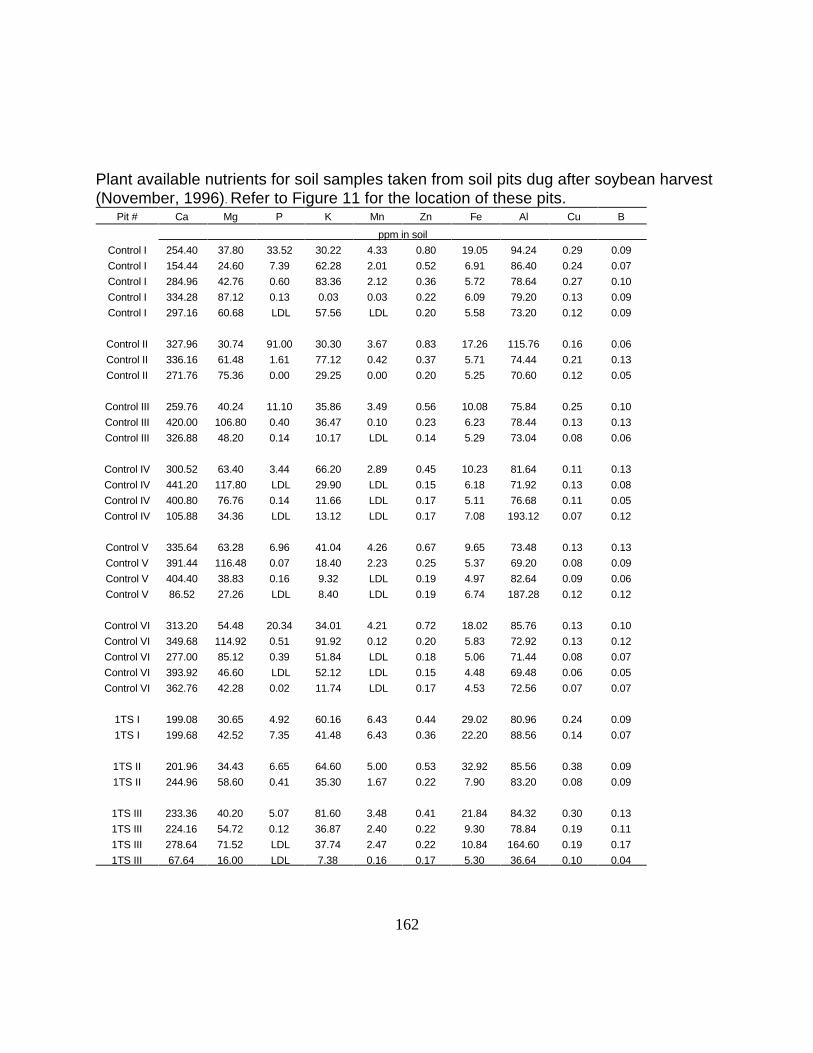
162
Plant available nutrients for soil samples taken from soil pits dug after soybean harvest(November, 1996). Refer to Figure 11 for the location of these pits.
Pit # Ca Mg P K Mn Zn Fe Al Cu B
ppm in soil
Control I 254.40 37.80 33.52 30.22 4.33 0.80 19.05 94.24 0.29 0.09
Control I 154.44 24.60 7.39 62.28 2.01 0.52 6.91 86.40 0.24 0.07
Control I 284.96 42.76 0.60 83.36 2.12 0.36 5.72 78.64 0.27 0.10
Control I 334.28 87.12 0.13 0.03 0.03 0.22 6.09 79.20 0.13 0.09
Control I 297.16 60.68 LDL 57.56 LDL 0.20 5.58 73.20 0.12 0.09
Control II 327.96 30.74 91.00 30.30 3.67 0.83 17.26 115.76 0.16 0.06
Control II 336.16 61.48 1.61 77.12 0.42 0.37 5.71 74.44 0.21 0.13
Control II 271.76 75.36 0.00 29.25 0.00 0.20 5.25 70.60 0.12 0.05
Control III 259.76 40.24 11.10 35.86 3.49 0.56 10.08 75.84 0.25 0.10
Control III 420.00 106.80 0.40 36.47 0.10 0.23 6.23 78.44 0.13 0.13
Control III 326.88 48.20 0.14 10.17 LDL 0.14 5.29 73.04 0.08 0.06
Control IV 300.52 63.40 3.44 66.20 2.89 0.45 10.23 81.64 0.11 0.13
Control IV 441.20 117.80 LDL 29.90 LDL 0.15 6.18 71.92 0.13 0.08
Control IV 400.80 76.76 0.14 11.66 LDL 0.17 5.11 76.68 0.11 0.05
Control IV 105.88 34.36 LDL 13.12 LDL 0.17 7.08 193.12 0.07 0.12
Control V 335.64 63.28 6.96 41.04 4.26 0.67 9.65 73.48 0.13 0.13
Control V 391.44 116.48 0.07 18.40 2.23 0.25 5.37 69.20 0.08 0.09
Control V 404.40 38.83 0.16 9.32 LDL 0.19 4.97 82.64 0.09 0.06
Control V 86.52 27.26 LDL 8.40 LDL 0.19 6.74 187.28 0.12 0.12
Control VI 313.20 54.48 20.34 34.01 4.21 0.72 18.02 85.76 0.13 0.10
Control VI 349.68 114.92 0.51 91.92 0.12 0.20 5.83 72.92 0.13 0.12
Control VI 277.00 85.12 0.39 51.84 LDL 0.18 5.06 71.44 0.08 0.07
Control VI 393.92 46.60 LDL 52.12 LDL 0.15 4.48 69.48 0.06 0.05
Control VI 362.76 42.28 0.02 11.74 LDL 0.17 4.53 72.56 0.07 0.07
1TS I 199.08 30.65 4.92 60.16 6.43 0.44 29.02 80.96 0.24 0.09
1TS I 199.68 42.52 7.35 41.48 6.43 0.36 22.20 88.56 0.14 0.07
1TS II 201.96 34.43 6.65 64.60 5.00 0.53 32.92 85.56 0.38 0.09
1TS II 244.96 58.60 0.41 35.30 1.67 0.22 7.90 83.20 0.08 0.09
1TS III 233.36 40.20 5.07 81.60 3.48 0.41 21.84 84.32 0.30 0.13
1TS III 224.16 54.72 0.12 36.87 2.40 0.22 9.30 78.84 0.19 0.11
1TS III 278.64 71.52 LDL 37.74 2.47 0.22 10.84 164.60 0.19 0.17
1TS III 67.64 16.00 LDL 7.38 0.16 0.17 5.30 36.64 0.10 0.04

163
Pit # Ca Mg P K Mn Zn Fe Al Cu B
ppm in soil
1CP I 767.60 116.04 26.57 37.66 11.18 0.34 22.15 95.52 0.27 0.22
1CP I 226.92 56.52 0.50 34.85 1.37 0.24 7.54 78.36 0.20 0.10
1CP I 118.76 39.57 LDL 25.04 0.97 0.25 7.37 85.00 0.19 0.05
1CP II 1109.20 152.80 44.76 57.56 15.58 2.59 23.58 116.16 0.36 0.33
1CP II 275.72 56.44 1.19 46.00 3.05 0.32 7.79 76.08 0.35 0.09
1CP II 44.56 9.39 0.24 6.31 0.06 0.26 6.16 18.80 0.08 0.04
1CP III 1104.40 148.16 61.16 86.28 13.17 2.78 22.35 117.32 0.28 0.32
1CP III 266.28 56.48 1.59 56.40 0.97 0.28 6.21 66.84 0.17 0.18
1CP III 58.48 12.99 0.00 11.96 0.09 0.13 4.24 25.52 0.05 0.06
3TS I 523.60 123.24 32.56 72.68 5.32 0.45 15.37 97.84 0.19 0.17
3TS I 190.40 32.30 4.58 64.80 6.80 0.43 26.07 86.72 0.28 0.10
3TS I 160.48 43.36 0.92 38.19 1.60 0.23 8.35 48.72 0.17 0.05
3TS I 312.52 93.04 LDL 52.72 5.15 0.35 57.12 107.24 0.40 0.15
3TS I 36.81 9.74 0.08 4.78 0.06 0.39 6.34 15.92 0.83 0.05
3TS II 544.00 133.88 9.03 58.00 5.12 0.51 8.85 86.92 0.22 0.16
3TS II 184.52 26.48 4.15 54.20 10.88 0.36 16.14 93.80 0.28 0.09
3TS II 159.76 38.06 1.41 35.84 4.62 0.21 0.77 44.32 0.16 0.10
3TS II 317.52 94.44 LDL 56.12 3.41 0.32 36.78 106.08 0.34 0.13
3TS II 32.15 8.07 0.58 3.79 LDL 0.10 12.84 25.13 0.08 0.02
3TS III 510.40 123.96 7.29 61.36 4.37 0.51 8.79 84.24 0.22 0.16
3TS III 187.56 42.16 4.64 54.24 0.68 0.23 11.30 48.16 0.18 0.06
3TS III 380.48 107.40 LDL 46.92 4.58 0.28 25.58 134.12 0.29 0.13
3TS III 105.36 29.45 0.03 12.87 0.55 0.19 6.32 67.16 0.20 0.04
3TS III 247.20 62.72 LDL 30.89 2.40 0.29 12.04 98.52 0.20 0.13
3TS III 76.84 18.92 0.08 8.12 0.34 0.31 4.79 39.42 0.15 0.04
3TS III 281.24 72.60 LDL 39.43 3.55 0.34 17.02 122.96 0.20 0.12
3Cp I 691.60 87.76 34.16 42.44 9.37 1.68 22.64 83.16 0.27 0.11
3CP I 152.24 37.05 1.45 36.62 0.50 0.20 7.12 46.12 0.17 0.06
3CP II 899.60 110.16 45.84 70.04 11.80 2.62 27.42 88.92 0.27 0.20
3CP II 165.56 41.80 2.17 47.48 0.66 1.03 8.68 51.52 0.18 0.13
3CP II 148.40 43.40 0.97 28.91 0.77 0.26 10.78 53.04 0.15 0.09
3CP II 64.52 17.03 0.06 12.12 0.27 0.28 4.80 37.03 0.26 0.04
3CP III 368.44 44.16 34.63 19.67 6.38 1.27 22.73 49.12 0.21 0.05
3CP III 88.64 19.25 17.30 11.26 0.10 0.17 6.56 30.12 0.09 0.04

164
Vita
The author, Philip D. Schroeder, was born in Philadelphia Pennsylvania in 1963 to a Naval
officer, Clyde Schroeder, and his wife, Louise Eichorn Schroder. Being a military brat, the author
moved several times before the family settled in Virginia Beach in 1971. After graduating from
Kempsville High School in 1981, he worked various jobs as an engineering technician, a
Transmission shop manager, and a salesman. In the fall of 1990, the author decided to go back to
school in hopes of finding some direction in his life. The decision to enroll at Virginia Tech was
motivated by family tradition; both of his brothers are alumni. In 1994, the author received his
Bachelor of Science degree in Crop and Soil Environmental Sciences, Suma Cum Laude. In the
fall of 1994, the author continued his education by enrolling as a graduate student in the Crop and
Soil Environmental Sciences department in pursuit of a Master of Science degree, under the
direction of Dr. W. Lee Daniels.