Embed Size (px)
Citation preview

Restoration of estuarine nature: luxury or essential
building blocks for a sustainable future.
Lippenbroek as an example
Prof. Dr. Patrick MeireUniversity of Antwerp Ecosystem management research group, Chair of Integrated Water Management

2
Intro
Nature Harbour
Ecology Economy?This conflict is clearly unsustainable, but unfortunately worldwide still very common!

3
Conceptual framework
The world consists of many different ecosystems, each characterised by complex interactions between organisms and with the abiotic environment.

4
Conceptual framework
• Each ecosystem is characterised by a certain carrying capacity for specific organisms.

5
Conceptual framework
• The carrying capacity depends on:- The amount of food and water,- The possibility to hide, nest, ….- The general conditions (eg climate)- ….

6
Conceptual framework
• Carrying capacity (CC) of an ecosystem (river basin, estuary or coastal sea,…) is the possibility to sustain a certain amount of human activities

7
Conceptual framework
• The development of man and its civilization over thousands of years was characterized by a gradual increase of the carrying capacity of our environment due to changes to our environment

8
Time
Numberofpeople
9
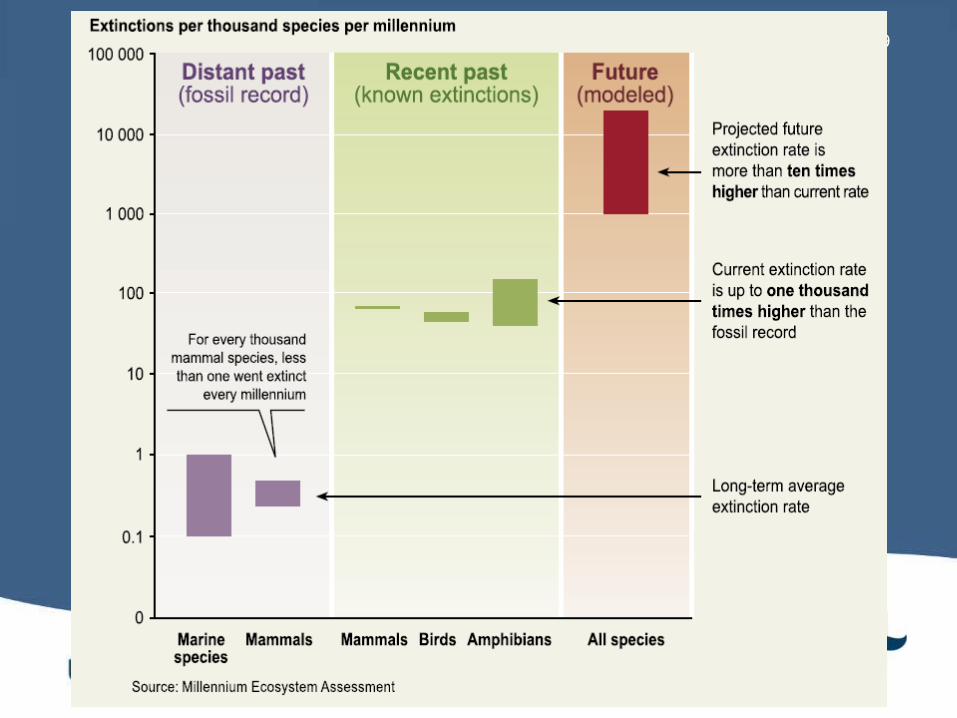
10Droughts
Floods
Pollution
health
Notwithstanding many billions of euro’s have been spend on watermanagement over a very long time span, society is still confronted with major floodings, droughts, water quality problems etc.
Habitat loss
overexploitation
global change
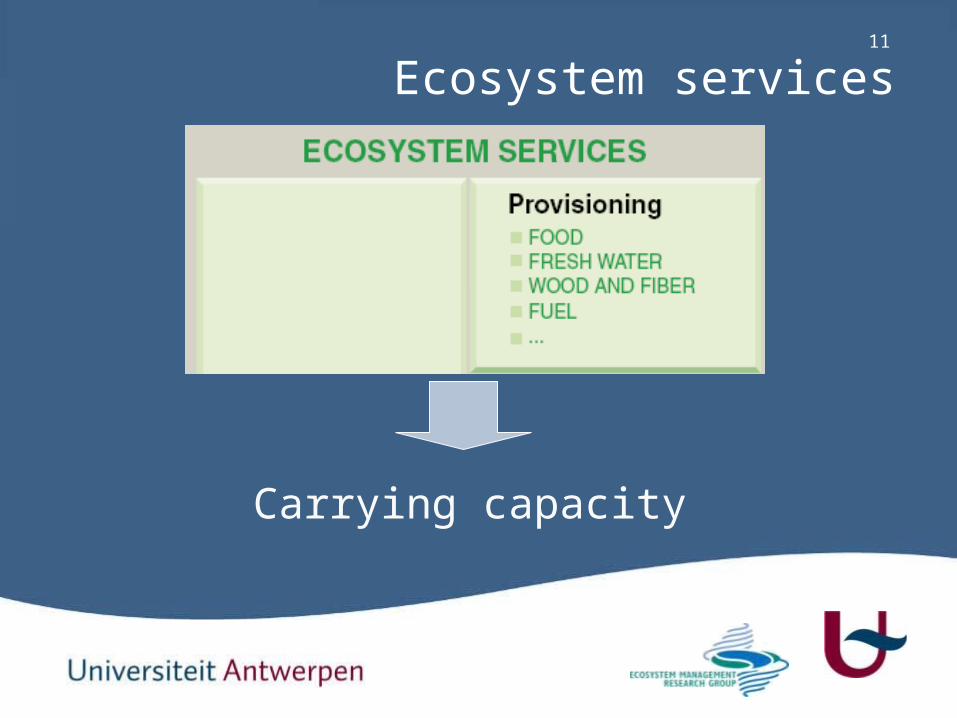
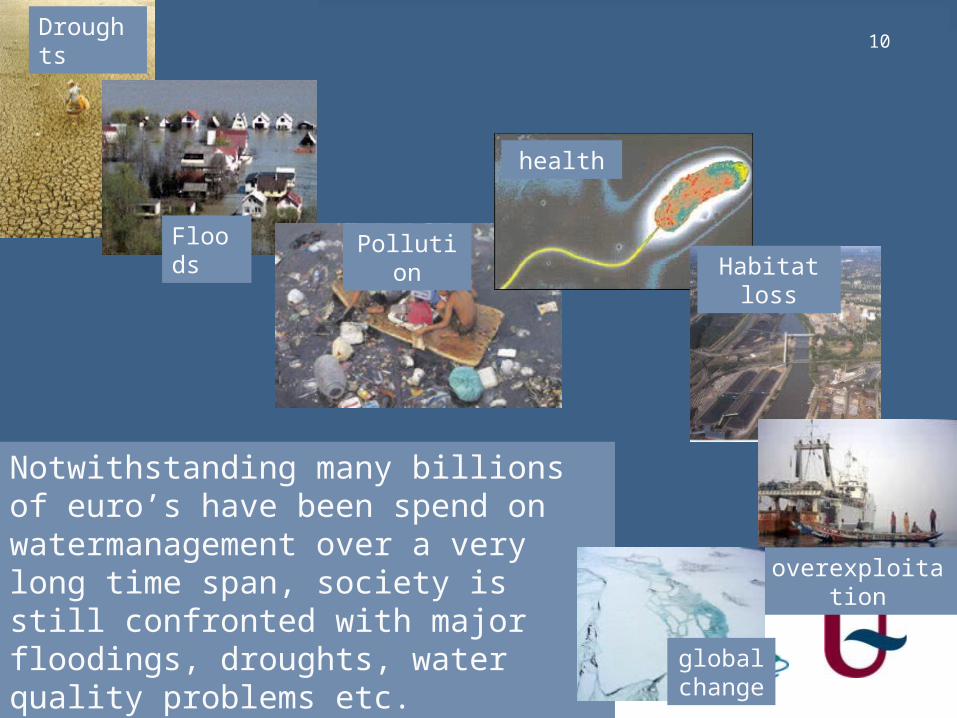
11
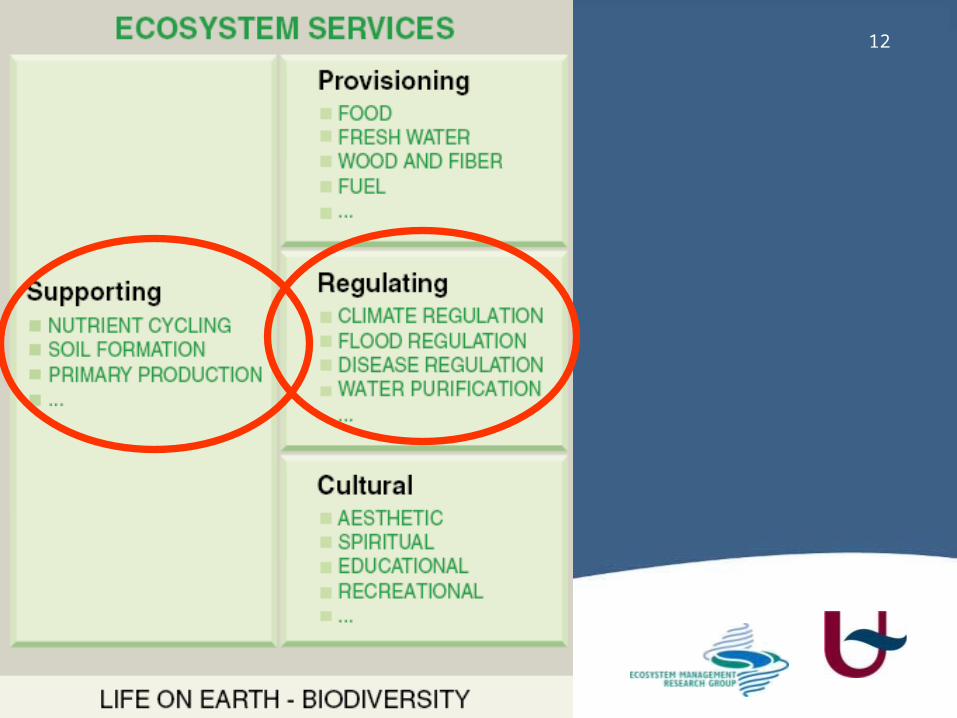
Carrying capacity
Ecosystem services
12

13
Salmon mousse with corn salad
Fillets of Norman Sole with puree of potatoes
Jaffa-fondant cake

14
Ingredients
1 cornsalad
2 coriander leaves
3 celery leaves
4 shallots
5 cucumber
6 lemon
7 black pepper
8 olive oil olives
9 smoked salmon
10 sour cream cows
Ingredients
11 fillets of sole
12 broth of fish different species
13 white wine grapes
14 mussels
15 shrimps
16 mushrooms
17 flour wheat
18 eggs chickens
19 lemon
20 parsley
21 potatoes
Ingredients
22 sugar sugarbeet
23 cacao
24 maizena
25 walnuts
26 oranges
Salmon mousse on cornsalad fillets of Norman Sole with
puree of potatoes Jaffa-fondantcake
+ aperitif, coffee, etc. at least 30 species necessary!!

15Ingredients Price/kg/L
1 cornsalad 12 €
2 coriander leaves 1,5 €
3 celery leaves 1 €
4 shallots 1,5 €
5 cucumber 1 €
6 lemon 2 €
7 Black pepper 15 €
8 olive oil olives 8 €
9 smoked salmon 25 €
10 sour cream cows 2,5 €
Ingredients Price/kg/l
11 fillets of sole 30 €
12 broth of fish different species
2 €
13 white wine grapes 5 €
14 mussels 10 €
15 shrimps 20 €
16 mushrooms 4 €
17 flour wheat 1 €
18 eggs chicken 0,20 €
19 lemon 2 €
20 parsley 5 €
21 potatoes 1 €
Ingredients
22 sugar sugerbeet 1,5 €
23 cacao 7 €
24 maïzena 1 €
25 walnuts 6 €
26 oranges 2 €

16
1 Day
2 days
19 days
6 days28 days
Sole

17
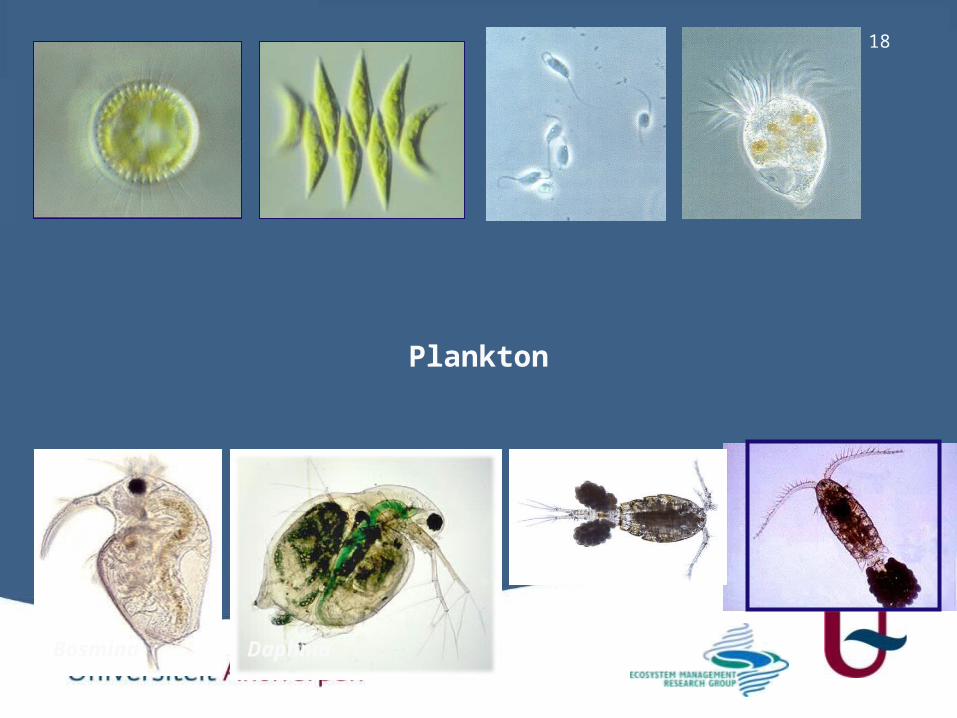
• During different growth phases, the sole needs different types of food
• From phytoplankton to worms, shells and crustaceans.
Ecosystem services
18
Plankton
DaphniaBosmina
19
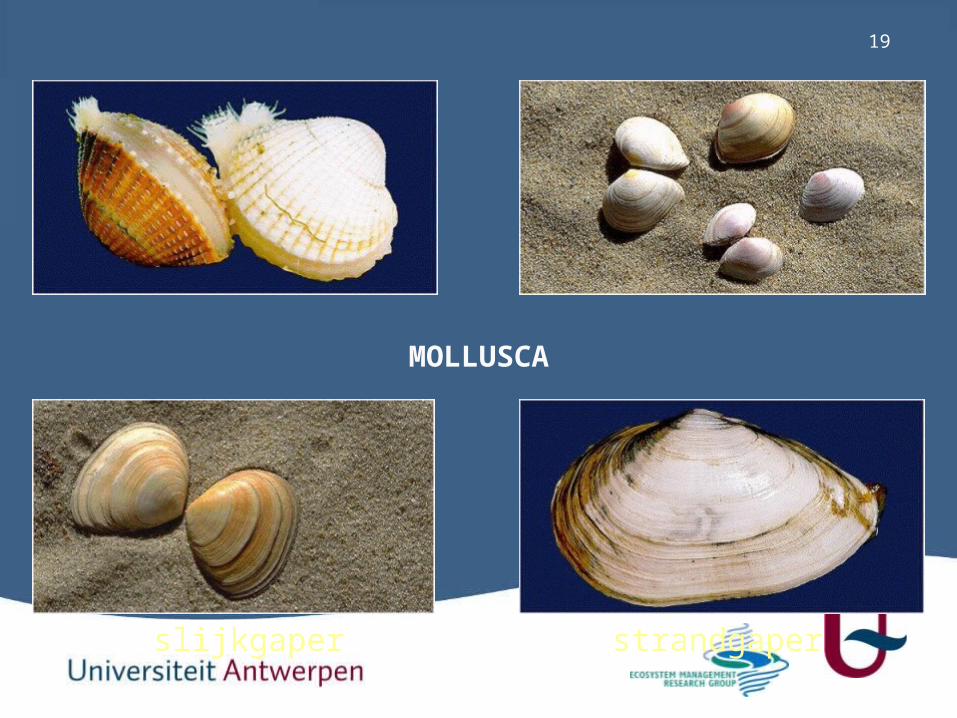
MOLLUSCA
slijkgaper strandgaper
20
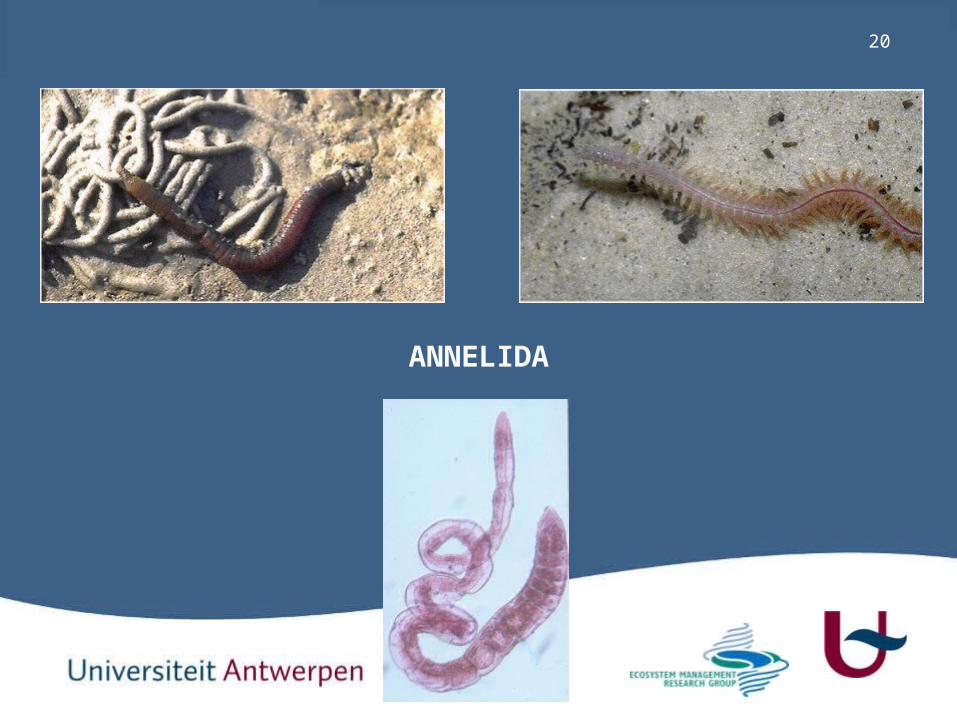
ANNELIDA

21
ARTHROPODA
vlokreeftje
22
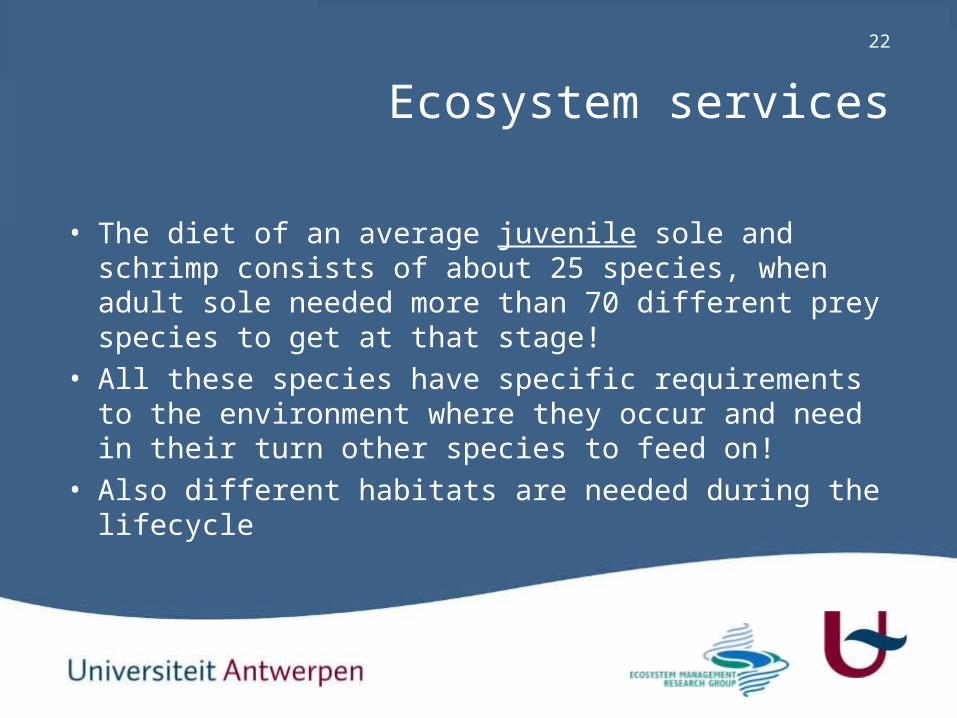
• The diet of an average juvenile sole and schrimp consists of about 25 species, when adult sole needed more than 70 different prey species to get at that stage!
• All these species have specific requirements to the environment where they occur and need in their turn other species to feed on!
• Also different habitats are needed during the lifecycle
Ecosystem services

23

24
• Products with a high market value (eg Sole) are dependent on species WITHOUT market value and on specific habitats as well without market value

25
26

27

28

29
Ecological functioning versus Economy
“Goods and services”
(Costanza et al., Nature 1997)
30
30

31
31
As we goggle at the fluttering financial figures, a different set of numbers passes us by. Last Friday, Pavan Sukhdev, the Deutsche Bank economist leading a European study on ecosystems, reported that we are losing natural capital worth between US$2 trillion and US$5 trillion every year as a result of deforestation alone. The losses incurred so far by the financial sector amount to between US$1 trillion and US$1.5 trillion. Sukhdev arrived at his figure by estimating the value of the services — such as locking up carbon and providing fresh water — that forests perform, and calculating the cost of either replacing them or living without them. The credit crunch is petty when compared to the nature crunch.

32
Ecosystem services
Nature Harbour
Ecology EconomyEcosystemservices

33
Conclusion 1
• The carrying capacity of the earth for men is based on the “provisioning services” that we increased due to many different management activities.
• These services are, however, completely dependent on the supporting and regulating services and these deteriorated due to the human activities. The consequences are much more far reaching than just the loss of habitat and species
• There is a clear link between ecosystem services and the economy
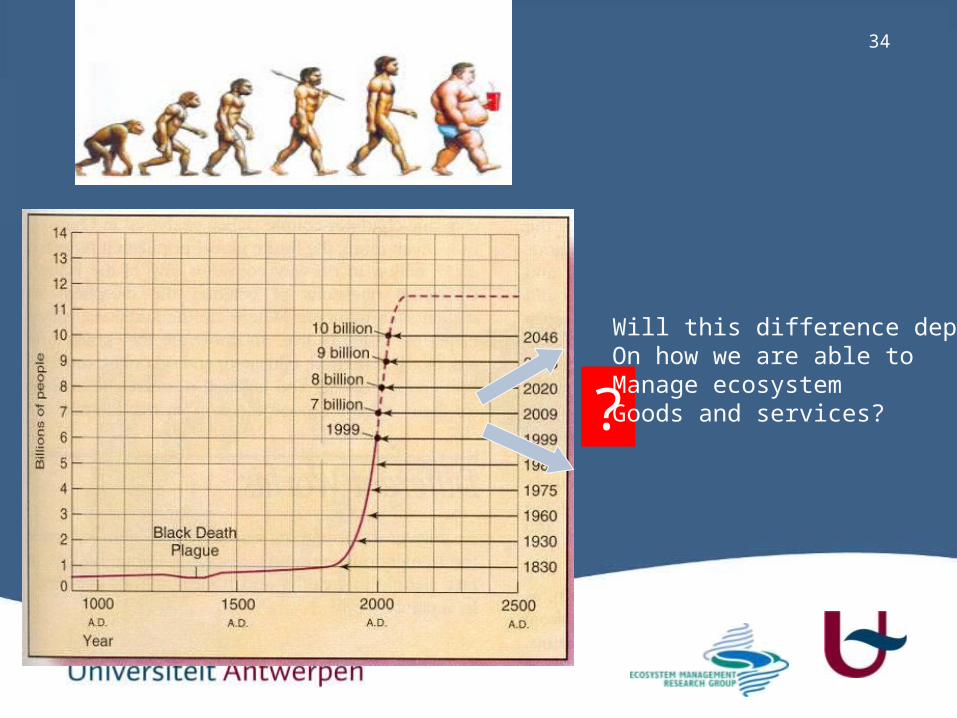
34
?
Will this difference depentOn how we are able toManage ecosystemGoods and services?

35
What does this mean for the Schelde?

36
Antwerpen
Gent
Vlissingen
BELGIUM
THE NETHERLANDS
WESTERSCHELDE
ZEESCHELDE

37
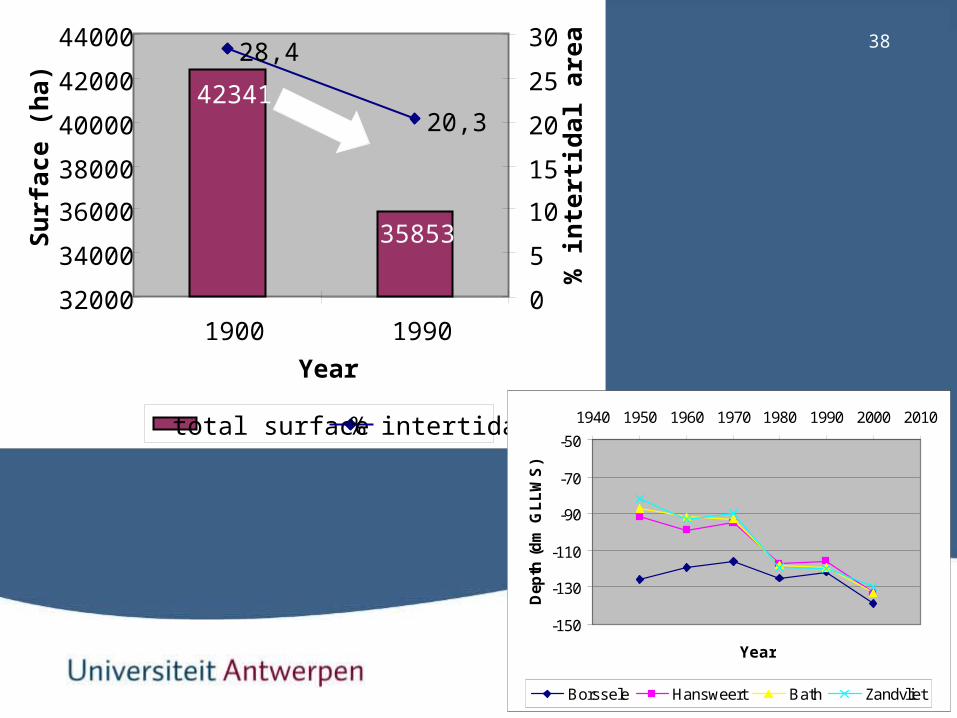
38
35853
42341
28,4
20,3
32000
34000
36000
38000
40000
42000
44000
1900 1990
Year
Su
rfac
e (h
a)
0
5
10
15
20
25
30
% in
tert
idal
are
a
total surface % intertidal
-150
-130
-110
-90
-70
-50
1940 1950 1960 1970 1980 1990 2000 2010
Year
Dep
th (
dm
GL
LW
S)
Borssele Hansweert Bath Zandvliet
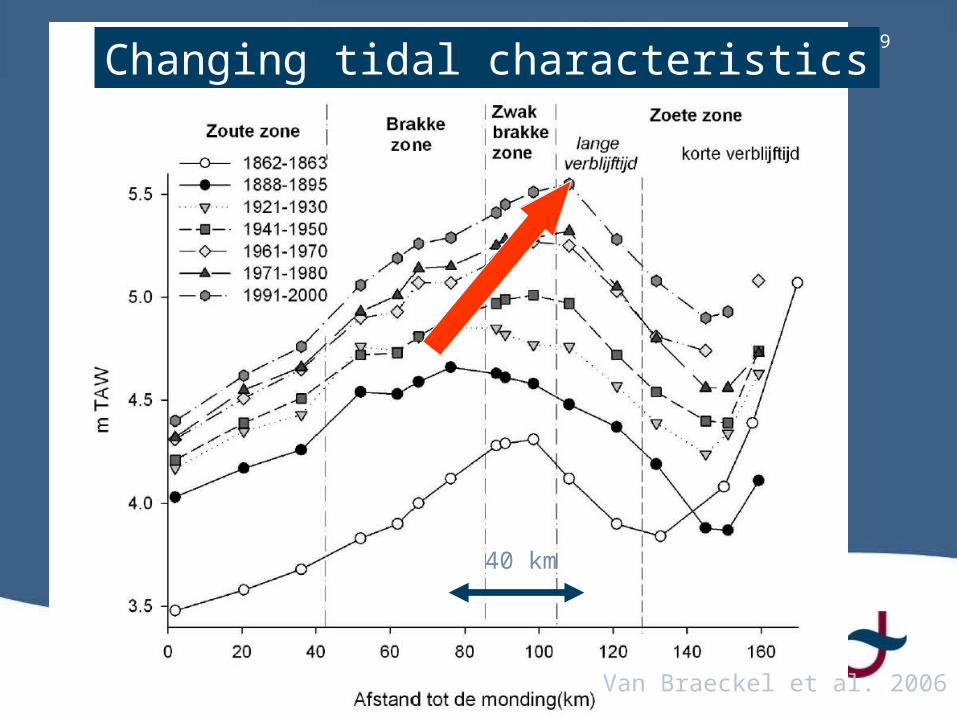
39
40 km
Van Braeckel et al. 2006
Changing tidal characteristics
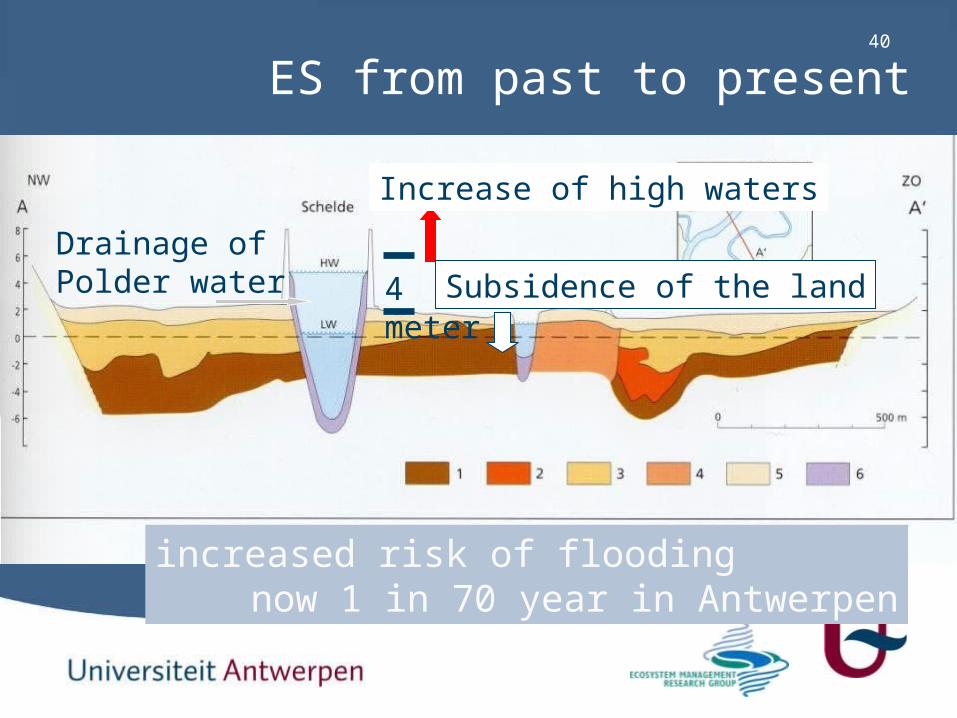
40
Drainage ofPolder water
Increase of high waters
Subsidence of the land
increased risk of floodingnow 1 in 70 year in Antwerpen
4 meter
ES from past to present

41Vigor Organisation Resilience
Supporting services
primary productivitynutrient cyclingwater cycling
biodiversityhabitat for rare species or for global population nursery functionmigration route
soil formation
Regulating services
Air quality regulationclimate regulationWater purification and waste treatmentRegulation of transport of nutrients and contaminants
disease regulationpest regulationpollinationTrophic-dynamic regulation
Waterregulation (protection against flooding)Erosion regulation and sediment trapMaintaining habitat structure and features (eg. tidal characteristics) natural hazard regulation
Provisioning services
fresh waterclean air
FoodFiberFuelgenetic resourcesbiochemicals, natural medicines and pharmaceuticalsornamental resources
fresh water
• water regulation and protection against flooding- Risks of flooding has increased significantly present management:
• Sigmaplan / Deltaplan- Heightening of dikes- Controlled inundation areas- Storm surge barrier
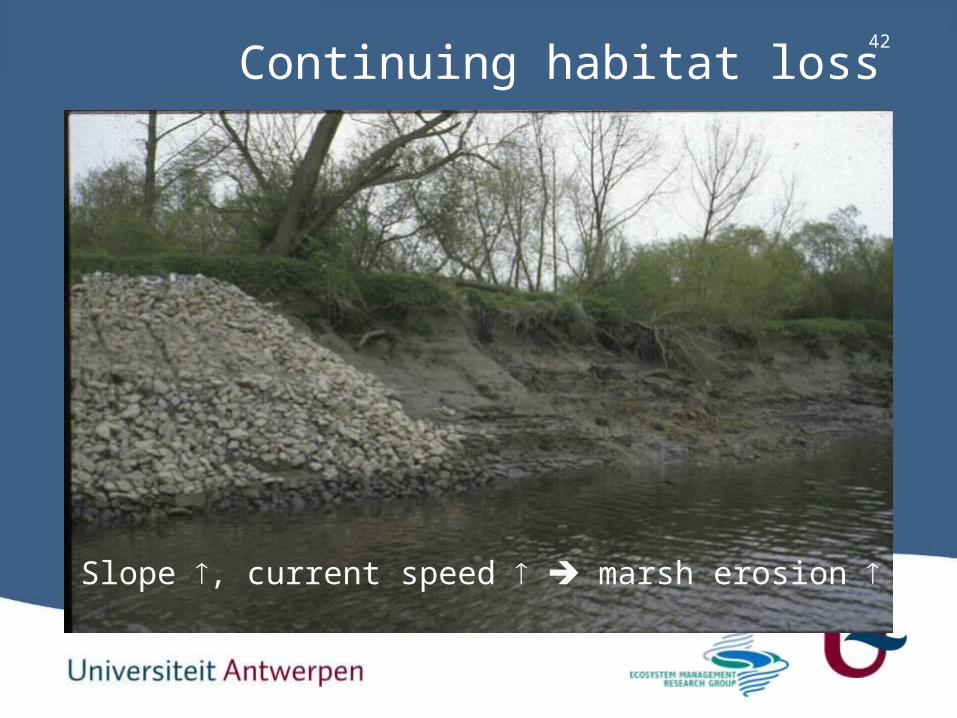
42
Slope , current speed marsh erosion
Continuing habitat loss

43
Coastal squeeze
44Vigor Organisation Resilience
Supporting services
primary productivitynutrient cyclingwater cycling
biodiversityhabitat for rare species or for global population nursery functionmigration route
soil formation
Regulating services
Air quality regulationclimate regulationWater purification and waste treatmentRegulation of transport of nutrients and contaminants
disease regulationpest regulationpollinationTrophic-dynamic regulation
Waterregulation (protection against flooding)Erosion regulation and sediment trapMaintaining habitat structure and features (eg. tidal characteristics) natural hazard regulation
Provisioning services
fresh waterclean air
FoodFiberFuelgenetic resourcesbiochemicals, natural medicines and pharmaceuticalsornamental resources
fresh water
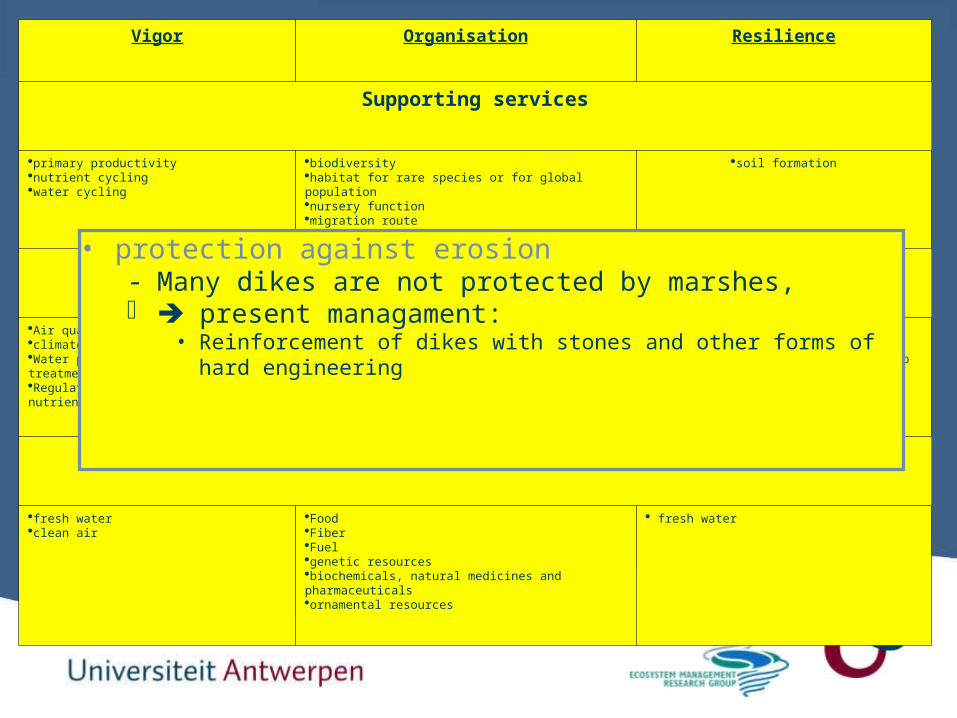
• protection against erosion- Many dikes are not protected by marshes, present managament:
• Reinforcement of dikes with stones and other forms of hard engineering

45Vigor Organisation Resilience
Supporting services
primary productivitynutrient cyclingwater cycling
biodiversityhabitat for rare species or for global population nursery functionmigration route
soil formation
Regulating services
Air quality regulationclimate regulationWater purification and waste treatmentRegulation of transport of nutrients and contaminants
disease regulationpest regulationpollinationTrophic-dynamic regulation
Waterregulation (protection against flooding)Erosion regulation and sediment trapMaintaining habitat structure and features (eg. tidal characteristics) natural hazard regulation
Provisioning services
fresh waterclean air
FoodFiberFuelgenetic resourcesbiochemicals, natural medicines and pharmaceuticalsornamental resources
fresh water
• sediment trap- Due to a lack of sedimentation areas, extremely high
rates present managament:
• Dredging (up to 500.000 ton DW.y-1 removed from the area)• NO link to sediment management in basin

0
10
20
30
40
50
60
Aan
tal
soorten
ben
th
os
Zoet Brak ZoutFresh Brackish Marine
Expected number of species
47Vigor Organisation Resilience
Supporting services
primary productivitynutrient cyclingwater cycling
habitat for rare species or for global population biodiversitynursery functionmigration route
soil formation
Regulating services
Air quality regulationclimate regulationWater purification and waste treatmentRegulation of transport of nutrients and contaminants
disease regulationpest regulationpollinationTrophic-dynamic regulation
Waterregulation (protection against flooding)Erosion regulation and sediment trapMaintaining habitat structure and features (eg. tidal characteristics) natural hazard regulation
Provisioning services
fresh waterclean air
FoodFiberFuelgenetic resourcesbiochemicals, natural medicines and pharmaceuticalsornamental resources
fresh water
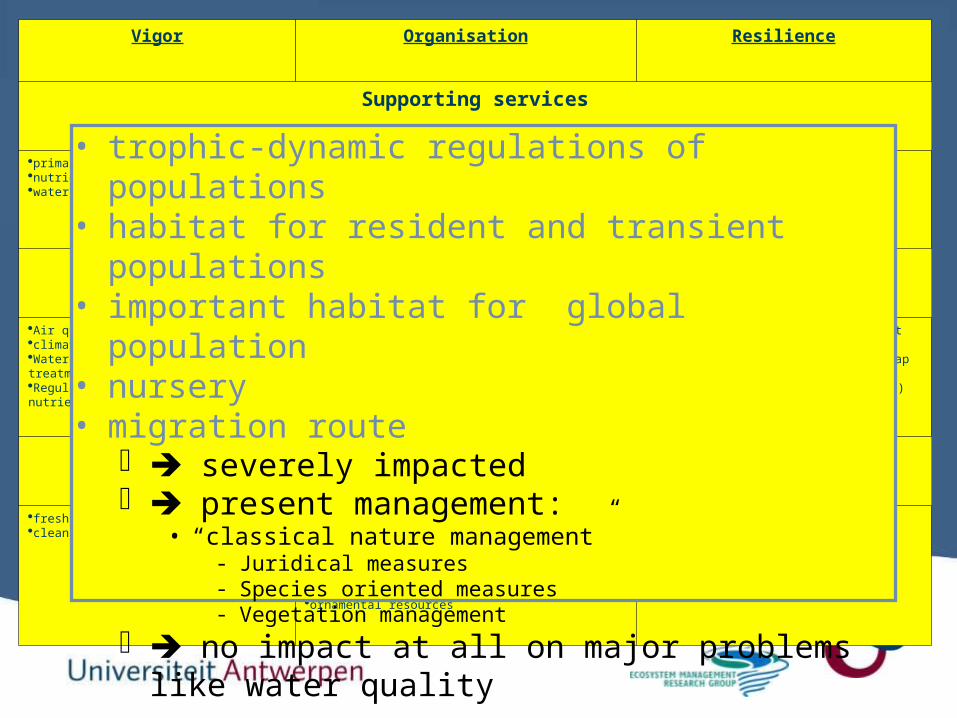
• trophic-dynamic regulations of populations• habitat for resident and transient populations• important habitat for global population• nursery• migration route
severely impacted present management:
• “classical nature management”- Juridical measures- Species oriented measures- Vegetation management
no impact at all on major problems like water quality
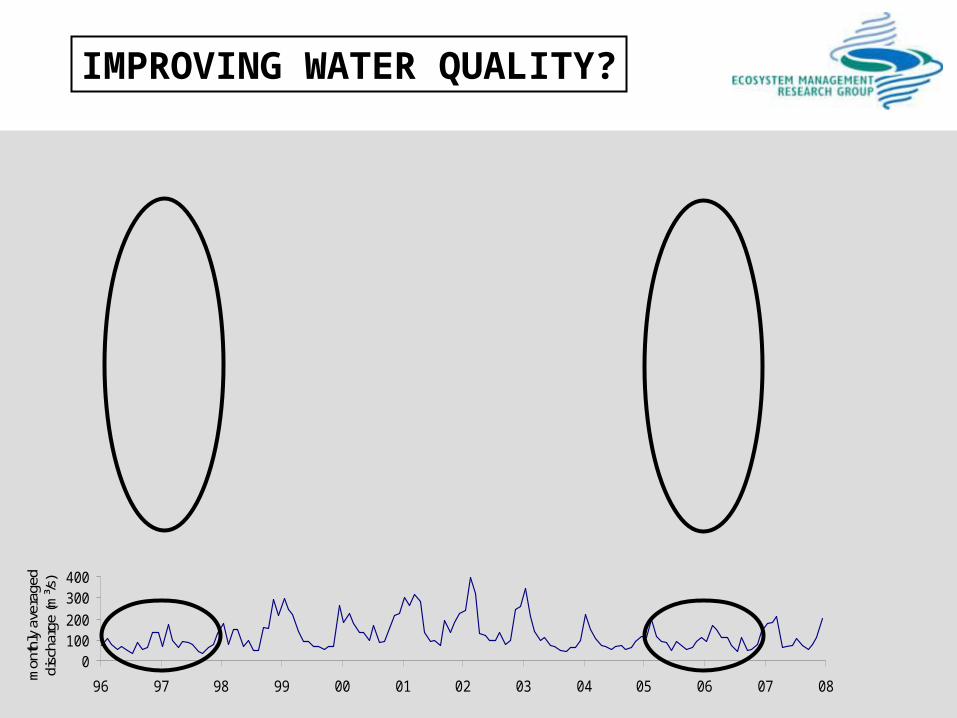
IMPROVING WATER QUALITY?
0100200
300400
96 97 98 99 00 01 02 03 04 05 06 07 08
mon
thly
ave
rage
d di
scha
rge
(m³/s
)

1996 1997 1998 1999 2000 2001 2002 2003 2004 2005 2006 2007 2008
chlorofyl a (µg/l)
6 0
8 0
1 0 0
1 2 0
1 4 0
afst
and
to
t V
lissi
ng
en (
km)
0
100
200
300
400
500
600
700
0
50
100
150
200
96 97 98 99 00 01 02 03 04 05 06 07
ma
an
dg
em
idd
eld
de
bie
t (m
³/s
)
less nutrientsbut
more algae
Hypothesis: suppression of algal blooms
Dis
tan
ce t
o m
ou
th (
km)

NEW PROBLEMS?
1996 1997 1998 1999 2000 2001 2002 2003 2004 2005 2006 2007 2008
Silicium (mg/l)
6 0
8 0
1 0 0
1 2 0
1 4 0
Afs
tan
d t
ot
Vlis
sin
gen
(km
)
0
2
4
6
8
10
12
14
16
18
20
Dis
tan
ce t
o m
ou
th (
km)
FREQUENT DSI DEPLETION

51
diatoms
DIATOMS

52
Eutrophication
Phaeocystis sp. blooms:
“foam algae”
Gonyaulax sp. blooms
Toxic “red tides”
ES from past to present

53Vigor Organisation Resilience
Supporting services
primary productivitynutrient cyclingwater cycling
habitat for rare species or for global population biodiversitynursery functionmigration route
soil formation
Regulating services
Air quality regulationclimate regulationWater purification and waste treatmentRegulation of transport of nutrients and contaminants
disease regulationpest regulationpollinationTrophic-dynamic regulation
Waterregulation (protection against flooding)Erosion regulation and sediment trapMaintaining habitat structure and features (eg. tidal characteristics) natural hazard regulation
Provisioning services
fresh waterclean air
FoodFiberFuelgenetic resourcesbiochemicals, natural medicines and pharmaceuticalsornamental resources
fresh water
• Primary productivity- Reduced- No management
54
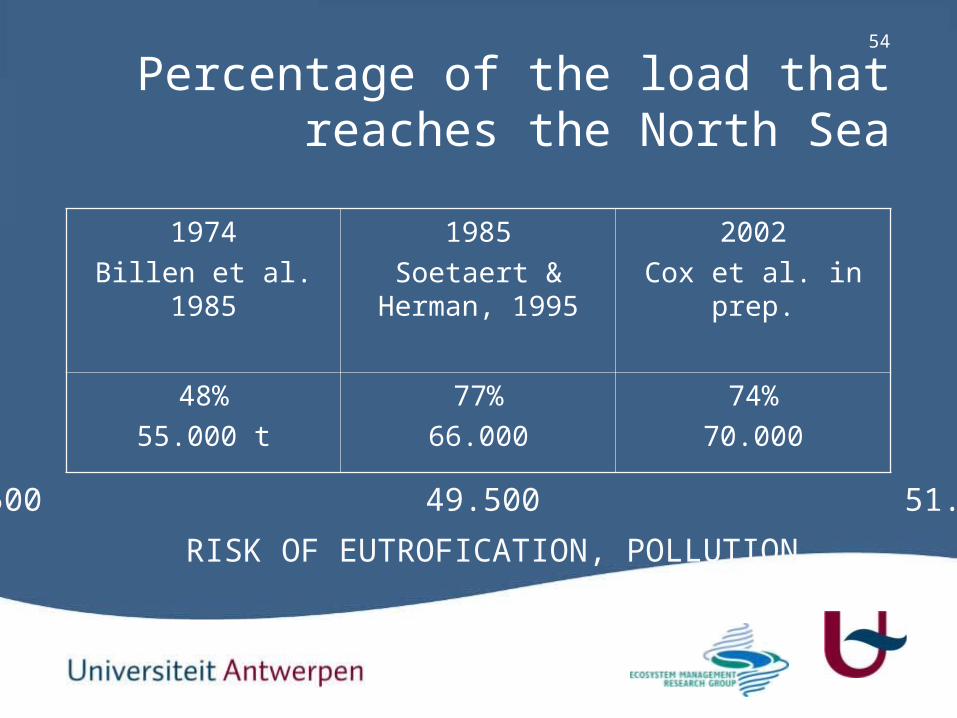
Percentage of the load that reaches the North Sea
1974Billen et al. 1985
1985Soetaert &
Herman, 1995
2002Cox et al. in prep.
48%55.000 t
77%66.000
74%70.000
RISK OF EUTROFICATION, POLLUTION
27.500 49.500 51.800
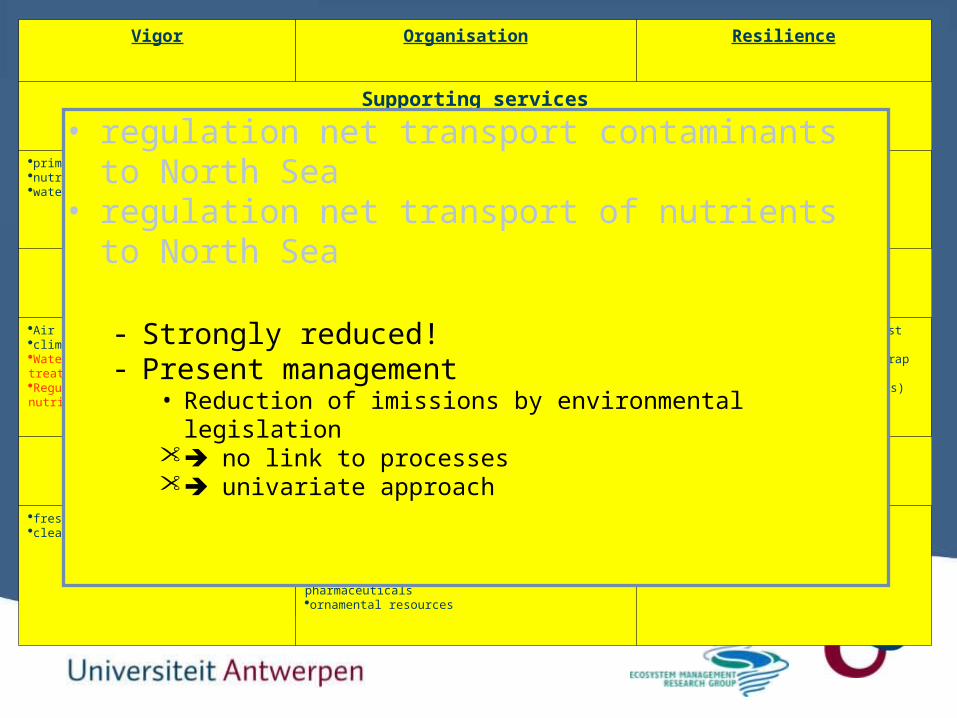
55Vigor Organisation Resilience
Supporting services
primary productivitynutrient cyclingwater cycling
habitat for rare species or for global population biodiversitynursery functionmigration route
soil formation
Regulating services
Air quality regulationclimate regulationWater purification and waste treatmentRegulation of transport of nutrients and contaminants
disease regulationpest regulationpollinationTrophic-dynamic regulation
Waterregulation (protection against flooding)Erosion regulation and sediment trapMaintaining habitat structure and features (eg. tidal characteristics) natural hazard regulation
Provisioning services
fresh waterclean air
FoodFiberFuelgenetic resourcesbiochemicals, natural medicines and pharmaceuticalsornamental resources
fresh water
• regulation net transport contaminants to North Sea
• regulation net transport of nutrients to North Sea
- Strongly reduced!- Present management
• Reduction of imissions by environmental legislation no link to processes univariate approach

56Vigor Organisation Resilience
Supporting services
primary productivitynutrient cyclingwater cycling
habitat for rare species or for global population biodiversitynursery functionmigration route
soil formation
Regulating services
Air quality regulationclimate regulationWater purification and waste treatmentRegulation of transport of nutrients and contaminants
disease regulationpest regulationpollinationTrophic-dynamic regulation
Waterregulation (protection against flooding)Erosion regulation and sediment trapMaintaining habitat structure and features (eg. tidal characteristics) natural hazard regulation
Provisioning services
fresh waterclean air
FoodFiberFuelgenetic resourcesbiochemicals, natural medicines and pharmaceuticalsornamental resources
fresh water
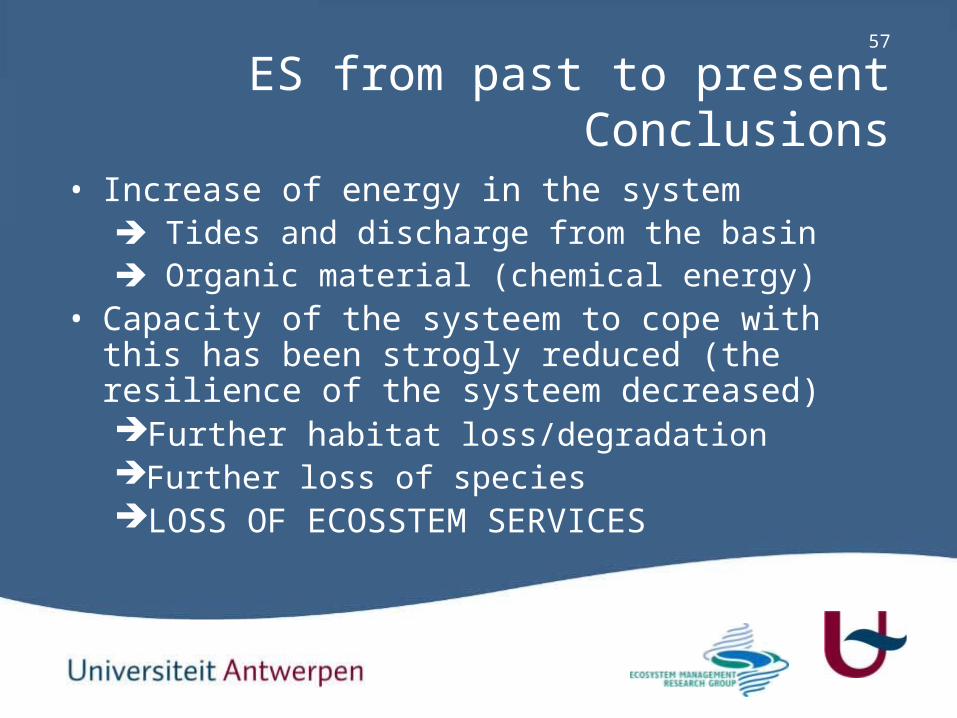
57
• Increase of energy in the system Tides and discharge from the basin Organic material (chemical energy)
• Capacity of the systeem to cope with this has been strogly reduced (the resilience of the systeem decreased) Further habitat loss/degradationFurther loss of speciesLOSS OF ECOSSTEM SERVICES
ES from past to presentConclusions

Measure
New Measure
New ProblemProblem
New measure
???
Present management is an endless vortex leading to a further decrease of the carrying capacity of the system from both an economic and ecological point of view.

59
• Environmental management is more or less like changing an aircraft to increase the size without adapting the motors! It is obvious that this will result in a crash….
• An aircraft is however seen as a system in which each part has its function and each part is adapted to that function, taking into account the overall performance of the system!
• This system approach is needed for our own environment!

60
An integrated strategy
• Requires:- Understanding of ecosystem services- Quantification of ES

61
HT
LT
Role of marshes
Tidalflat
Exchange betweenmarsh and pelagic
150 – 300 ton BSi
100 – 200 ton Si
Struyf et al. 2005
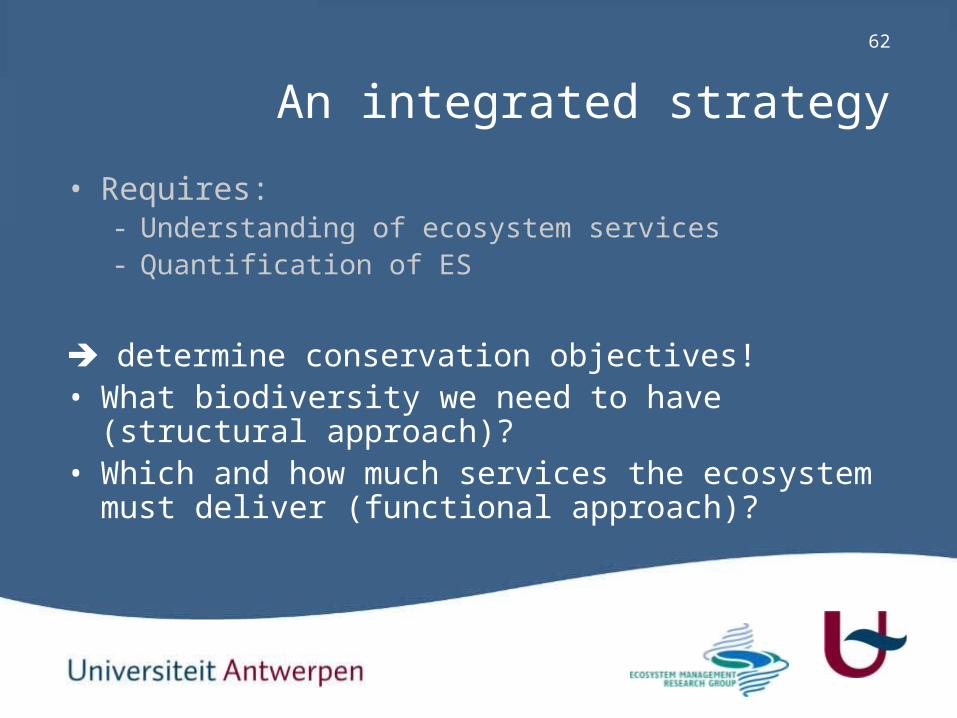
62
An integrated strategy
• Requires:- Understanding of ecosystem services- Quantification of ES
determine conservation objectives!• What biodiversity we need to have (structural
approach)?• Which and how much services the ecosystem
must deliver (functional approach)?
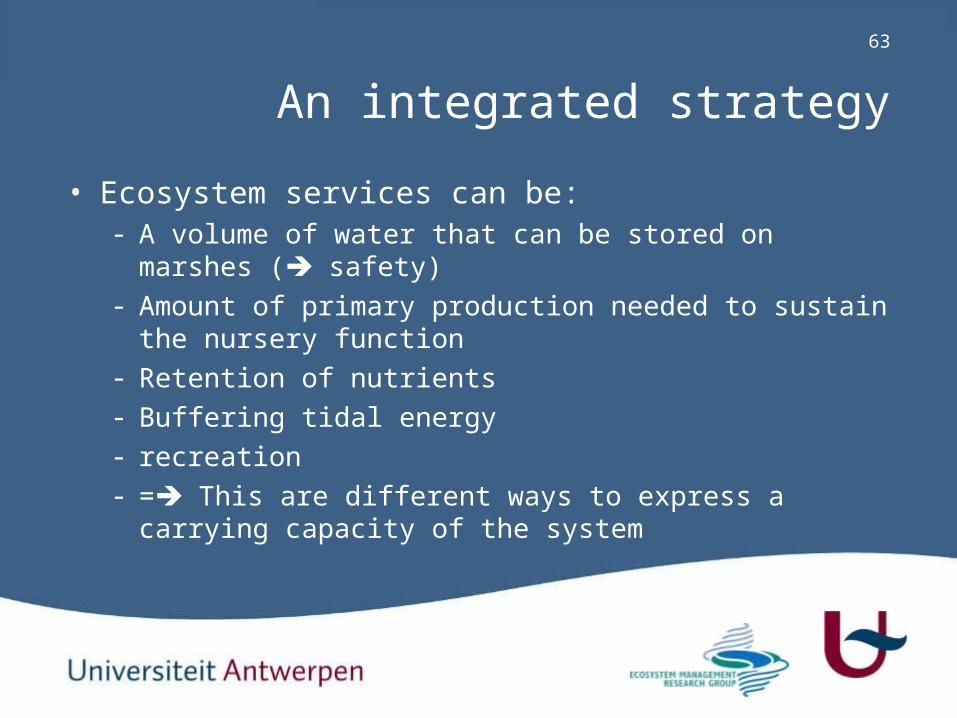
63
• Ecosystem services can be:- A volume of water that can be stored on marshes (
safety)- Amount of primary production needed to sustain the
nursery function- Retention of nutrients- Buffering tidal energy- recreation- = This are different ways to express a carrying
capacity of the system
An integrated strategy

64
Tidal marsh
mudflats
Shallow waterService :
Primary
Production
Si regeneration
Pelagic habitat
River
Zm/Zp
Phyto
plankton
Organic
Load/ Si
Regulation of nutrients
biodiversity
Habitat function
Regulation of nutrients
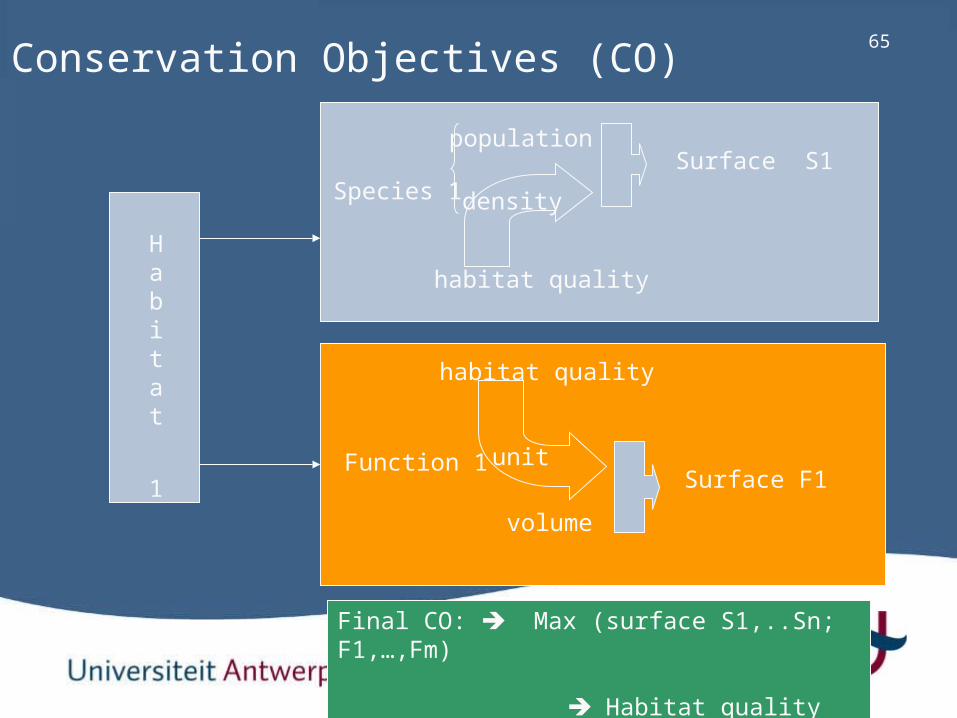
65
Final CO: Max (surface S1,..Sn; F1,…,Fm)
Habitat quality
Habitat
1
Conservation Objectives (CO)
Species 1
populationSurface S1
habitat quality
density
Function 1
habitat quality
volume
Surface F1unit

66
• Understanding and quantification of ES• Formulation of objectives• The calculation of habitats surface needed• Measures to maintain or restore habitats
An integrated strategy
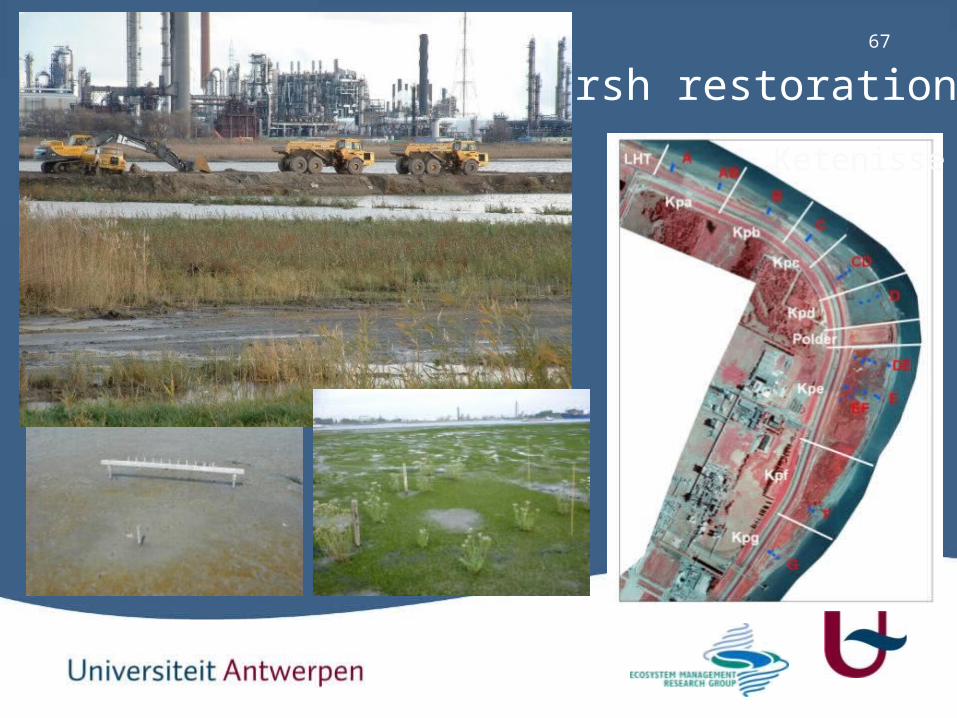
67
Ketenisse
Marsh restoration

Pilot studyLippenbroek

Lippenbroek
1: Ring Dike
2: FCA dike
3: Inlet sluice
4: Outlet sluice1
23
1
4
1
1
Management scenario Lippenbroek
10 ha of tidal nature developping since March 2006
Pilot project Lippenbroek
70
Ecology:
- Introducing estuarine ecosystem
- Tidal regime in area
- Two times a day!
Ring Dike Lowered FCA dike
FCA estuary
Outlet
polder
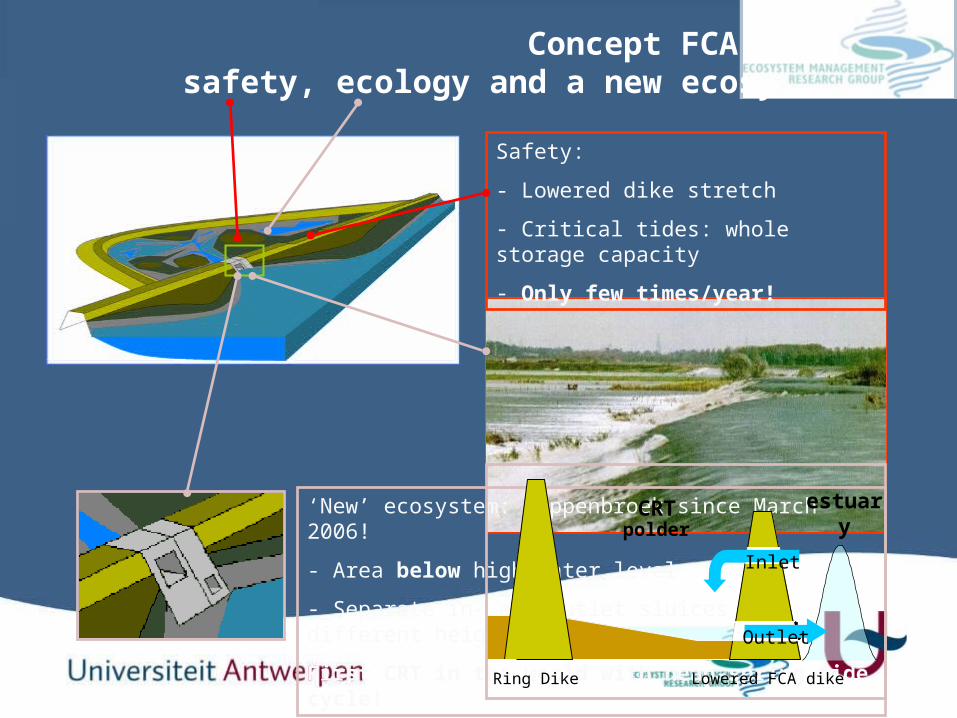
Concept FCA - CRTsafety, ecology and a new ecosystem
Safety:
- Lowered dike stretch
- Critical tides: whole storage capacity
- Only few times/year!
‘New’ ecosystem: Lippenbroek since March 2006!
- Area below high water level
- Separate in- and outlet sluices at different heights:
First CRT in the world with neap-spring tide cycle!
Ring Dike Lowered FCA dike
CRT estuary
Outlet
Inlet
polder

71

Pilot project Lippenbroek
10 ha of tidal nature developping: May 2008

0
1
2
3
4
5
6
7
7/04 12/04 17/04 22/04 27/04 2/05 7/05
date
leve
l (m
TA
W)
Schelde (De Plaat)
Lippenbroek
0
1
2
3
4
5
6
7
7/04 12/04 17/04 22/04 27/04 2/05 7/05
date
leve
l (m
TA
W)
Lippenbroek
Schelde (De Plaat)
0
1
2
3
4
5
6
7
7/04 12/04 17/04 22/04 27/04 2/05 7/05
date
leve
l (m
TA
W)
Lippenbroek
Schelde (De Plaat)
Introducing macrotidal regime
Reduction of high water level by 3 meter No reduction of spring – neap variation
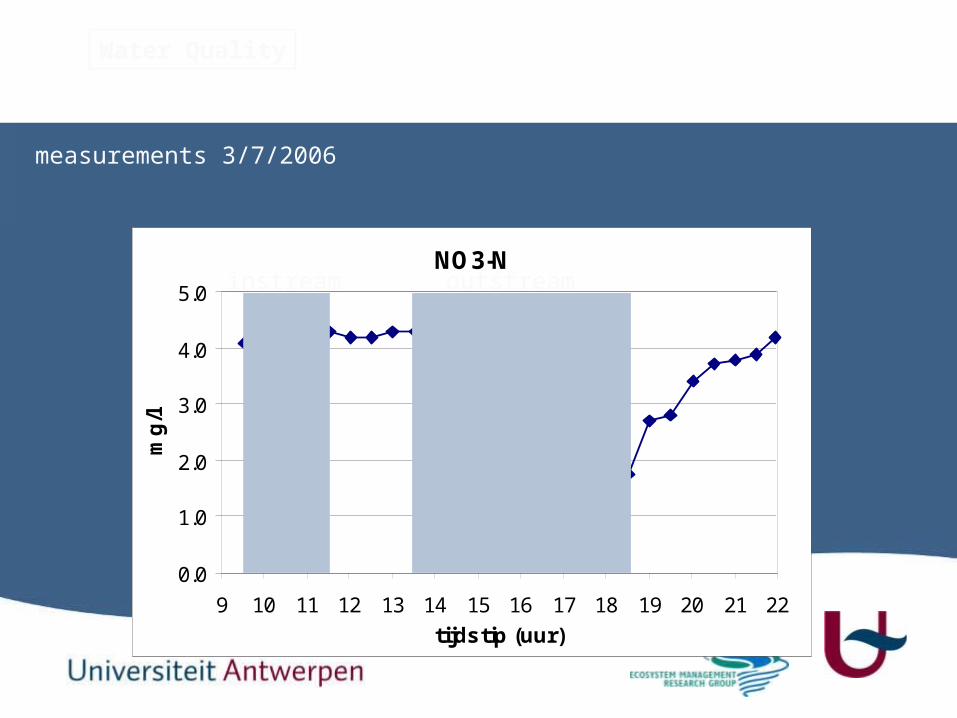
74Water Quality
NO3-N
0.0
1.0
2.0
3.0
4.0
5.0
9 10 11 12 13 14 15 16 17 18 19 20 21 22
tijdstip (uur)
mg
/lmeasurements 3/7/2006
instream outstream
75
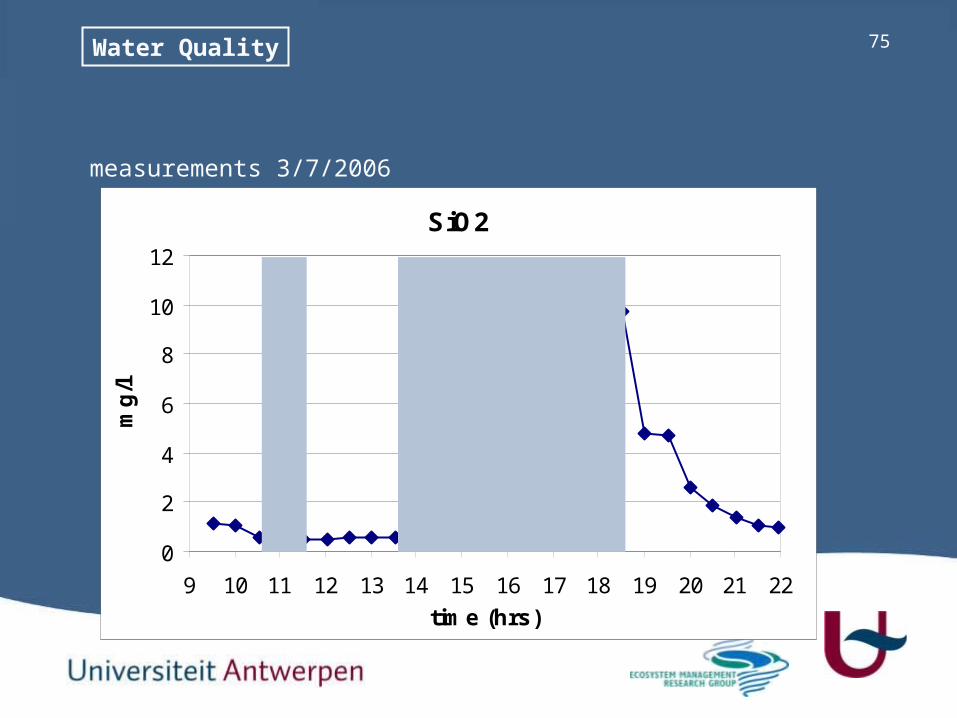
SiO2
0
2
4
6
8
10
12
9 10 11 12 13 14 15 16 17 18 19 20 21 22
time (hrs)
mg
/l
Water Quality
measurements 3/7/2006
76

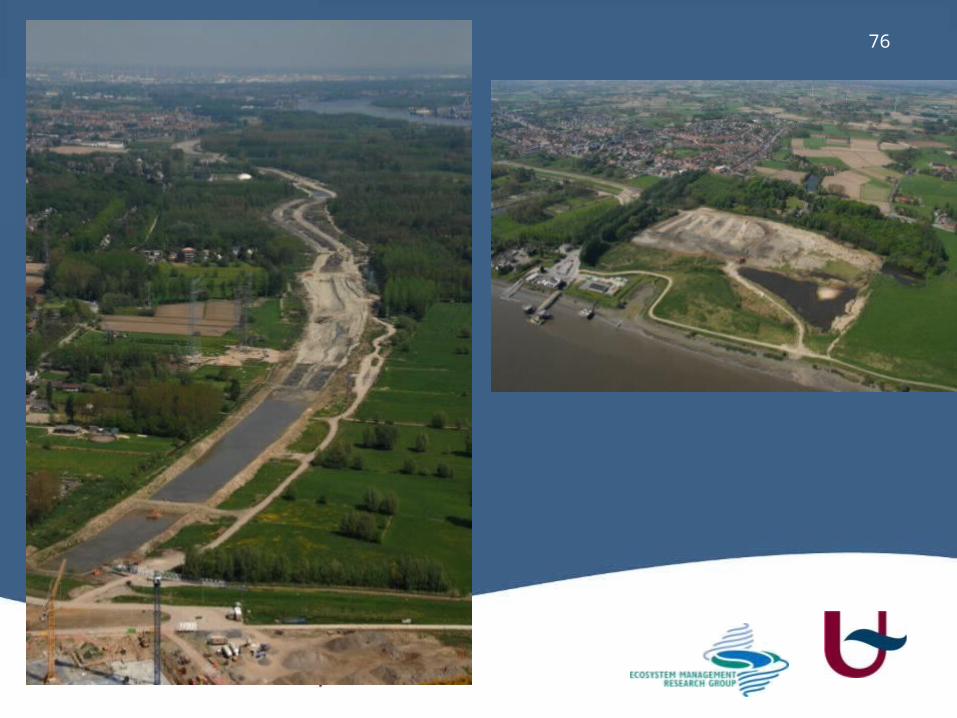
77Managed realignment
1990 1998

78
Required surface of different habitats
Habitattype opp (ha) Buitendijks brak 740 Buitendijks zoet 1040 Binnendijks bos alluviaal 570 Binnendijks anderen 370 Binnendijks grasland dotter (RBB) 840 Binnendijks grasland anderen 910 Binnendijks riet/ruigte 560 Binnendijks plas/oever 240
The integrated approach
Tidal habitats
Non tidal habitats

79
Spatial distribution of CO-Schelde:
The integrated approach
Structure
Fu
nct
ion
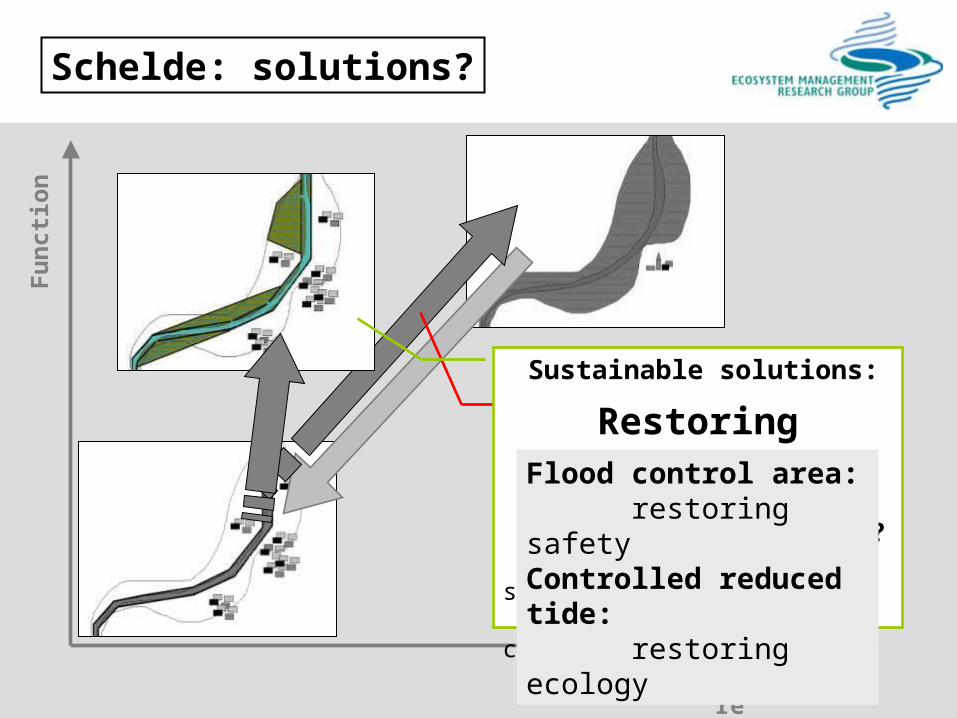
Return to pristine situationis impossible.
Sustainable solutions:
Restoring functions
Managed realignment? - Elevation often not suitable - Not always compatible with safetyplan
Flood control area: restoring safetyControlled reduced tide: restoring ecology
Schelde: solutions?

81
conclusions
• Ecosystems deliver services to society:- Ecosystem services
• But are therefore dependent on the presence of species and habitats and their performance.
not delivering these services has a high cost for society
82
• Ecosystem services determine the carrying capacity of the system for human use!
• Improving the estuarine functioning will also improve the possibilities for recreation
• A network of nature education centers along the estuary might also be crucial to inform the public about ecosystem services and create in this way the necessary public support for restoration measures

83
Thanks for your attention