Embed Size (px)
Citation preview

Uranium Resources
Restoration
La Rosita Mine
Duval County, Texas
Mark S. Pelizza
Uranium Resources, Inc.
NRC/NMA Uranium Recovery Workshop
May 27, 2010
Uranium Resources

Uranium Resources
LA ROSITA ISR MINE HISTORY
PA1 production from October 1990 through March
1992 1,073,000 pounds of U3O8. Restoration August
2005 through May 2008.
PA2 production from June 1995 through June 1999
1,569,000 pounds of U3O8. Restoration May 2001
through March 2005.
Discovered and
drilled in the mid-
1970's by Union
Carbide Corp.
Chevron Resources
Company purchased
in 1980.
URI acquired 1985.

Uranium Resources

Uranium Resources
IN-SITU URANIUM RECOVERY
In-situ recovery (“ISR”) is an non-
destructive mining process where
uranium is extracted from sandstone
aquifers by reversing the natural process
which deposited the uranium. Existing
groundwater fortified with oxygen is used
to leach the uranium from sands.
The uranium is then recovered by
passing the leach solution over ion
exchange resin, much like in a domestic
water softener. The loaded resin is then
processed. Finally, the groundwater is
restored consistent with is previous
quality and use.

Uranium Resources
O2 INJECTION/CARBONATE COMPLEX
U4 to U6
2UO2 + O2 → 2UO3
UO3 + 2NaHCO3 → NA2UO2(CO3)2 + H2O

Uranium Resources
INCREASE TRACE ELEMENTS/SALINITYOxidation, pH↓ and Ion Exchange
Oxidation of iron sulfides – Fe (ppt) SO4 ↑ pH ↓ FeS2 + 15/4 O2 + 7/2 H2O → Fe(OH)3 [ppt] + 4 H
+ + 2 SO4
=
Oxidation of ferroselite – Fe (ppt) Se ↑ pH ↓ FeSe2 + 11/4 O2 + 7/2 H2O → Fe(OH)3 [ppt] + 4 H
+ + 2 SeO3
=
Oxidation of molybdenum sulfide – Mo ↑ S ↑ pH ↓ 2 MoS2 + 9/2 O2 + 2 H2O → Mo2O5 + 4 H
+ + 2 S2O3
=
Thiosulfate
Dissolution of calcium carbonate from lowered pH caused by oxidation of one mole of FeS2 – CaSO4 (ppt) HCO3 ↑ pH ↑ [Ca ↑ further lowers CaSO4 & HCO3 solubility]
2 H2SO4 + 4 CaCO3 + 4NaCl → 4NaHCO3 +2 CaSO4 [ppt] +2 Ca ++
+ 2 Cl –
Ion Exchange Na2UO2(CO3)2 + 2RCl → R2 UO2(CO3)2 + 2NaCl

Uranium Resources
GROUNDWATER RESTORATION

Uranium Resources
1,000,000,000 gal.
6.8 Pore Volumes

Uranium Resources
LA ROSITA ISR – GROUNDWATER
RESTORATION STABILITY SUMMARY
PRODUCTION AREA 1
Below RT Below MCL No Standard Above RT & MCL
Parameter Units
EPA
Primary
MCL
EPA
Secondary
MCL
PA BL Well
Low
PA BL Well
High
PA
Restoration
Table
Lixiviant
5-15-1992
Stability
Sample 1
Dec. 2008
Stability
Sample 2
May 2009
Stability
Sample 3
Aug. 2009
Stability
AverageCODE
Calcium mg/l 116 205 155 826 112 134 129 125
Magnesium mg/l 32 76 53 177 22 27 28 26
Sodium mg/l 353 502 422 668 193 205 212 203
Potassium mg/l 17 42 26 42 17 18 19 18
Carbonate mg/l 0 8 0 0 0 0 0 0
Bicarbonate mg/l 10 278 204 504 204 167 201 191
Sulfate mg/l 250 122 318 196 1,730 153 211 233 199
Chloride mg/l 250 705 1,037 866 1,513 356 373 381 370
Nitrate mg/l 10 0.53 1.30 1.79 0.67 0.13 0.64 0.65 0.47
Fluoride * mg/l 4 2 <.01 5.50 0.81 0.67 0.66 0.80 0.73 0.73
Silica mg/l 23 67 50 31 24 23 25 24
TDS (180 c) mg/l 500 1,590 2,310 1,933 5,450 998 1,231 1,193 1,141
EC (25 c) μmho 2,950 3,990 3,388 6,900 1,596 1,876 1,890 1,788
ALK as CaCO3 mg/l 26 228 169 413 167 140 165 157
pH 6.5-8.5 7.52 9.15 7.45 7.49 7.33 7.46 7.43
Arsenic * mg/l 0.01 <.001 0.059 0.009 0.007 0.005 0.006 0.004 0.005
Cadmium * mg/l 0.005 0.0001 0.0015 0.0005 0.0007 0.0020 0.0020 0.0020 0.0020
Iron mg/l 0.3 0.010 0.480 0.105 0.510 0.018 0.013 0.010 0.014
Lead * mg/l 0.015 <.001 0.008 0.002 <0.001 0.004 0.004 0.004 0.004
Manganese mg/l 0.05 <.01 0.47 0.06 0.67 0.10 0.11 0.11 0.11
Mercury mg/l 0.002 <.0001 0.0020 0.0003 0.0001 0.0001 0.0001 0.0001 0.0001
Molybdenum mg/l 1.0 <.01 0.17 0.05 0.20 0.25 0.24 0.18 0.23
Selenium * mg/l 0.05 <.001 0.430 0.008 0.160 0.033 0.032 0.034 0.033
Uranium μg/l 30 42 1,200 350 17,400 576 637 639 617
Ammonia-N * mg/l 0.10 1.10 0.38 0.05 0.13 0.18 0.15
Radium 226 pCi/l 5.0 0.4 595.0 183.0 196.0 89.1 90.1 81.3 86.9

Uranium Resources
LA ROSITA ISR – GROUNDWATER
RESTORATION STABILITY SUMMARY
PRODUCTION AREA 2
Below RT Below MCL No Standard Above RT & MCL
Parameter Units
EPA
Primary
MCL
EPA
Secondary
MCL
PA BL Well
Low
PA BL Well
High
PA
Restoration
Table
Lixiviant
5-15-1992
Stability
Sample 1
Dec. 2008
Stability
Sample 2
May 2009
Stability
Sample 3
Aug. 2009
Stability
AverageCODE
Calcium mg/l 68 239 170 725 173 177 170 173
Magnesium mg/l 21 88 62 175 48 50 51 50
Sodium mg/l 285 638 420 515 285 268 297 283
Potassium mg/l 17 65 28 40 22 21 23 22
Carbonate mg/l 0 1 0 0 0 0 0
Bicarbonate mg/l 27 279 216 434 242 245 226 238
Sulfate mg/l 250 62 533 248 1,370 235 225 221 227
Chloride mg/l 250 663 1,032 870 1,290 606 633 631 623
Nitrate mg/l 10 0.50 1.40 1.30 0.22 1.22 1.38 0.96 1.19
Fluoride * mg/l 4 2 <.01 5.30 0.77 0.67 0.56 0.60 0.60 0.59
Silica mg/l 29 76 53 40 38 34 34 35
TDS (180 c) mg/l 500 1,430 2,600 2,045 4,640 1,546 1,837 1,753 1,712
EC (25 c) μmho 2,620 4,320 3,519 6,020 2,543 2,738 2,647 2,643
ALK as CaCO3 mg/l 24 229 177 356 198 203 186 196
pH 6.5-8.5 7.19 8.39 7.0-8.0 7.00 7.26 7.20 7.19 7.22
Arsenic * mg/l 0.01 <.001 0.061 0.014 0.006 0.004 0.004 0.004 0.004
Cadmium * mg/l 0.005 <.0001 0.0053 0.0002 0.0004 0.002 0.003 0.002 0.002
Iron mg/l 0.3 <.01 0.090 0.020 0.020 0.023 0.044 0.016 0.027
Lead * mg/l 0.015 <.001 0.006 0.001 0.001 0.004 0.005 0.005 0.005
Manganese mg/l 0.05 <.01 0.14 0.03 0.75 0.24 0.17 0.14 0.18
Mercury mg/l 0.002 <.0001 0.0001 0.0001 <.0001 0.0001 0.0001 0.0001 0.0001
Molybdenum mg/l 1.0 <.01 0.64 0.06 2.90 0.14 0.13 0.15 0.14
Selenium * mg/l 0.05 <.001 0.045 0.006 0.041 0.034 0.037 0.031 0.034
Uranium μg/l 30 12 2,890 547 23,700 650 933 680 755
Ammonia-N * mg/l <.01 0.56 0.08 <.01 0.13 0.13 0.13
Radium 226 pCi/l 5.0 1.0 642.0 130.3 463.0 64.17 56.04 62.11 60.78

Uranium Resources
POST RESTORATION
WATER QUALITY
↑ salinity from ion exchange fully mitigated. RO is
highly effective in that dissolved salts are reduced
below baseline mean.
↑ calcium and carbonates due to pH drop are
effectively mitigated. RO is effective with affected
parameters restored to baseline mean.
↑ uranium, trace elements due to oxidation are
greatly reduced but not eliminated. RO is partially
effective and residual concentrations may remain.
Parameters typically affect use quality of the water
similarly before mining and after restoration.

Uranium Resources
NELAC IMPLICATIONS
* For these parameters, today's TCEQ required
NELAC accredited and certified analytical methods
result in greater concentration LLD's than the
historic baseline analytical method provided for.
Rather than use zero (0) in the calculations, the LLD
values were used as the default measured value in
both the baseline and restoration stability statistical
calculations, resulting in a post restoration stability
averages that are greater than baseline simply
because the LLD is a greater concentration.

Uranium Resources
RESTORATION TABLE VALUES
NOT ACHIEVED - 331TAC107 (g)(1)
uses for which the groundwater was suitable at baseline levels
actual existing use of groundwater in the area prior to and during
mining
potential future use of baseline quality groundwater and of
proposed restoration quality
the effort made by the permittee to restore the groundwater to
baseline
technology available to restore groundwater for particular
parameters
the ability of existing technology to restore groundwater to
baseline quality in the area under consideration
the cost of further restoration efforts
the consumption of groundwater resources during further
restoration
the harmful effects of levels of particular parameter

Uranium Resources
RESTORATION PROGRESS ILLUSTRATION
0
2
4
6
8
10
12
1 2 3 4 5 6 7 8 9 10 11 12 13 14 15 16 17 18 19 20
PORE VOLUMES
PP
M U
RA
NIU
M
Baseline
EPA Primary MCL
Uranium
0
1000
2000
3000
4000
5000
6000
1 2 3 4 5 6 7 8 9 10 11 12 13 14 15 16 17 18 19 20
PORE VOLUMES
PP
M T
DS
Baseline
TDS
LA ROSITA ISR
1,000,000,000 gal. or
6.8 PV treated and
circulated

Uranium Resources
BASELINE WATER QUALITY
Naturally - uranium
and its decay
products, radium and
radon, cause
groundwater to
become radioactive
and to exceed federal
and state drinking
water limits making
the natural
groundwater present
near uranium ore
suitable only for
industrial purposes.
Exempt USDW
“Baseline”
“Background”
“Background”

Uranium Resources
LA ROSITA ISR PRE-MINING U-NATURAL
0
200
400
600
800
1,000
1,200
1,400
1
mic
ro
gra
ms
/L U
PA1 Restoration Table
PA2 Restoration Table
141 BL Well Average
EPA Primary MCL

Uranium Resources
LA ROSITA ISR PRE-MINING 226Ra
0
50
100
150
200
1
pic
oc
urie
s/L
Ra
PA1 Restoration Table
PA2 Restoration Table
141 BL Well Average
EPA Primary MCL

Uranium Resources
URANIUM ROLL FRONT DEPOSITION =
NATURAL ATTENUATION

Uranium Resources
MANGANESE
“Iron and manganese tend to be relatively
immobile under oxidizing conditions and more
mobile under reducing conditions.”
“The presence of significant concentrations of iron
and manganese in solution is generally a good
indicator of reducing conditions.”
FATE AND TRANSPORT OF POST-RESTORATION
GROUNDWATER CONSTITUENTS AT IN-SITU
URANIUM LEACH FACILITIES, May 10 2006,
Demuth & Schramke, (Petrotek Engineering
Corporation & Enchemica LLC), p29-30. Prepared
for Uranium Resources, Inc.

Uranium Resources
THE PUBLIC CONCERN
“To date, no remediation of an ISR operation in the
United States has successfully returned the aquifer
to baseline conditions.”
J.T. Otton, S. Hall, U.S. Geological Survey, In-Situ
Recovery Uranium Mining in the United States:
Overview of Production and Remediation Issues.
IAEA 2009.
Uranium Resources
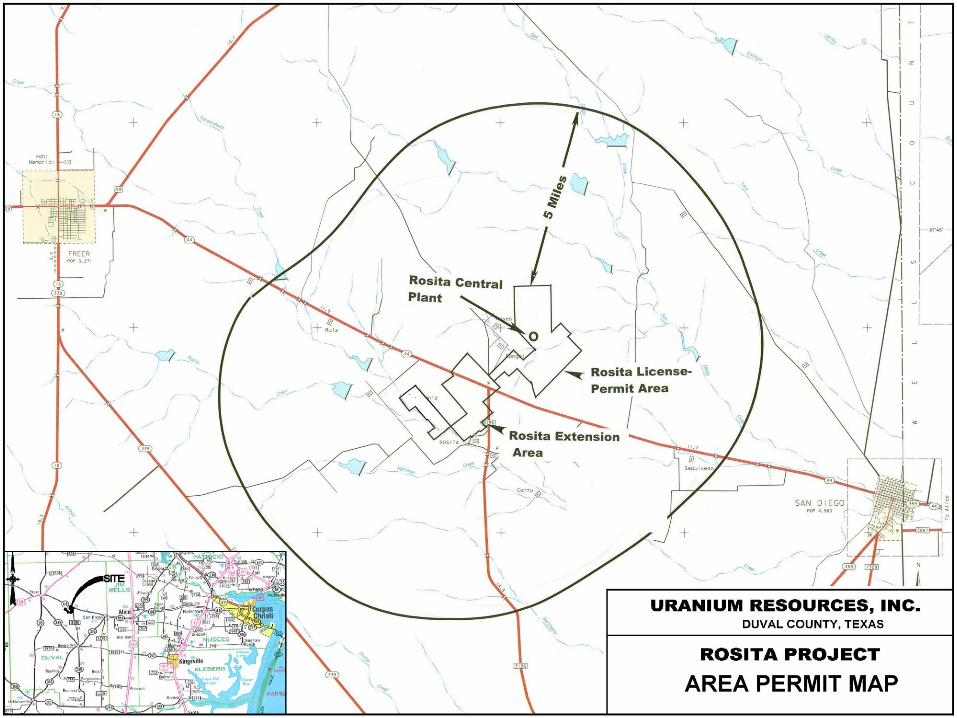
331TAC107(a)(2)
Achievement of restoration shall be determined
using one of the following methods:
(A) When all sample measurements from
groundwater samples from all baseline wells for
a restoration parameter are equal to or below the
restoration table value…; or
(B) A statistical analysis of information from
groundwater samples from baseline wells
proposed by the owner or operator and
approved by the executive director that
demonstrates that the groundwater quality is
representative of the restoration table values.
Uranium Resources
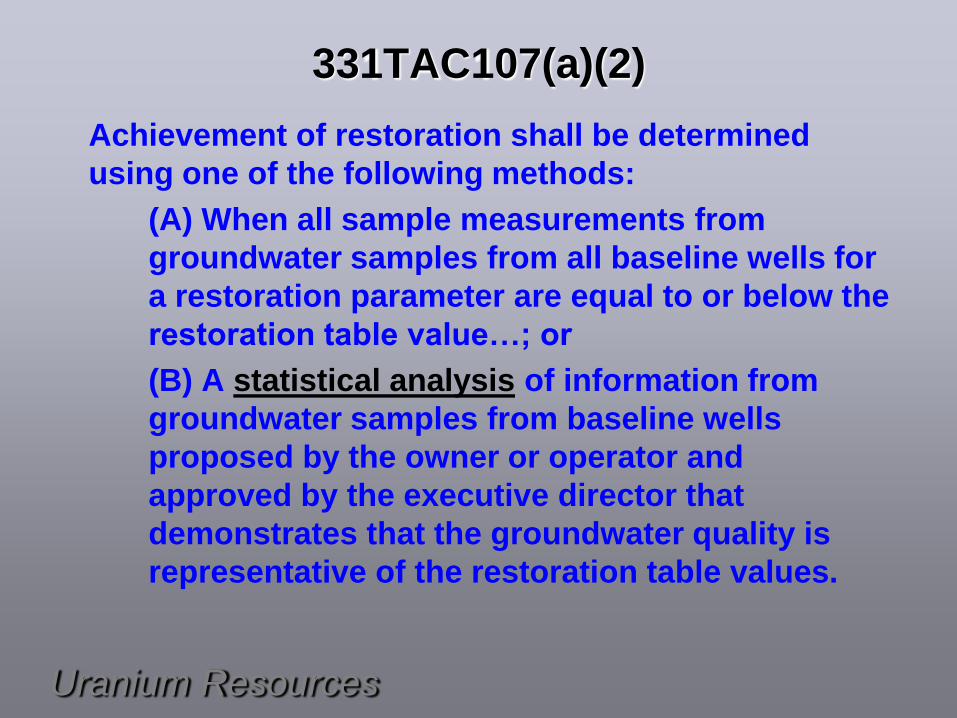
UTL Calculation MethodsThe Rosita data set was used to calculate Upper Tolerance Limits
(UTL95-95) for most constituents in PA1 and PA2. For large data sets
following normal distributions, this factor can be roughly estimated as
the mean plus two standard deviations.
ProUCL 4.00.04 (Singh et al., 2009)[1], an EPA-sponsored statistical
program is ideally suited for this purpose. ProUCL first determines if
the data for a given constituent follows a normal, gamma, or
logarithmic distribution. If the data follow one of these statistical
distributions, a relevant UTL is calculated. If the data follow no
discernible distribution a non-parametric UTL is calculated. In the
case of data with non-detects, the Kaplan-Meier non-parametric
method is used. Non-detect data are entered as the MDL with a
qualifier code indicating non-detect status. The K-M method is
deemed superior to simple substitution methods (MDL, MDL/2;Singh
et al., 2009).
[1] Singh, Anita, Maichle, R., Singh, A., Lee, S.E., and Armbya, N., 2009,
ProUCL Version 4.00.04 User Guide, Draft, prepared for the U.S.
Environmental Protection Agency, EPA/600/R-07/038

Uranium Resources
LANL MEAN vs. 95% UTL ANALYSIS
ValueDistribution
TypeValue
Distribution
Type
Calcium mg/l 155 235 Normal 125 170 264 Normal 173
Magnesium mg/l 53 85 Normal 26 62 103 Normal 50
Sodium mg/l 422 680 Nonparametric 203 420 580 Normal 283
Potassium mg/l 26 29 Nonparametric 18 28 45 Normal 22
Bicarbonate mg/l 204 344 Normal 191 216 260 Nonparametric 238
Sulfate mg/l 196 261 Normal 199 248 533 Nonparametric 227
Chloride mg/l 866 1,141 Normal 370 870 1,095 Normal 623
Nitrate mg/l 1.79 3.24 Gamma 0.47 1.30 5.55 Normal 1.19
Fluoride mg/l 0.81 1.35 Normal 0.73 0.77 1.01 Normal 0.59
Silica mg/l 50 58 Normal 24 53 70 Normal 35
TDS (180 c) mg/l 1,933 2,172 Normal 1,141 2,045 2,622 Normal 1,712
EC (25 c) μmho 3,388 3,818 Normal 1,788 3,519 4,383 Normal 2,643
ALK as CaCO3 mg/l 169 296 Normal 157 177 213 Nonparametric 196
Arsenic mg/l 0.009 0.023 Normal 0.005 0.014 0.261 Log normal 0.004
Cadmium mg/l 0.0005 0.0618 Normal 0.0020 0.0002 0.0012 Log normal 0.0022
Iron mg/l 0.105 0.48 Nonparametric 0.014 0.020 0.036 KM UTL 0.027
Lead mg/l 0.002 0.071 Log normal 0.004 0.001 Insf. Detects 0.005
Manganese mg/l 0.06 0.26 Log normal 0.11 0.03 0.03 KM UTL 0.18
Mercury mg/l 0.0003 Insf. Detects 0.0001 0.0001 Insf. Detects 0.0001
Molybdenum mg/l 0.05 0.16 Normal 0.23 0.06 0.2440 Log normal 0.14
Selenium mg/l 0.008 Insf. Detects 0.033 0.006 0.078 Log normal 0.034
Uranium μg/l 0.350 7.500 Log normal 0.617 0.547 8.418 Log normal 0.755
Uranium μg/l 0.350 1.200 Nonparametric 0.617 0.547 2.890 Nonparametric 0.755
Ammonia-N mg/l 0.38 0.80 Nonparametric 0.15 0.08 0.43 Nonparametric 0.13
Radium 226 pCi/l 183.0 617.1 Normal 86.9 130.3 1907.0 Log normal 60.8
Radium 226 pCi/l 130.3 548.0 Nonparametric 60.8
CODE
BL 95% UTL
CODE
PA
Restoration
Table
Stability
Average
Parameter UnitsPA
Restoration
Table
Stability
Average
PA1 PA2
BL 95% UTL
Below RT Below MCL No Standard Above RT & MCL Below 95% UTL

Uranium Resources

Uranium Resources
Uranium Resources
ACKNOWLEDGEMENTS
Ardyth Simmons, Ph.D.
Jeff Heikoop, Ph.D.
Liz Miller, Ph.D.
Los Alamos National Laboratory