Embed Size (px)
Citation preview

Romanian food and beverage market operations survey
November 18, 2009
Prepared by: Top HoReCa
Price: EUR 499
Dear Sirs, We hereby present you the first Report prepared about the Romanian food and beverage market. The present Report was determined by the scarcity of information available related to the food and beverage market in Romania. The need of real life data to fundament decisions on this market came as a direct conclusion of our long experience. The data for the Report was gathered through a national survey. At the beginning of the 4th quarter of 2009 Top HoReCa deployed the survey questionnaire to a number of 1,194 companies active on this market regarding the operations of the food and beverage entities for 2008. The survey summarizes the opinions of the Romanian companies that operate food and beverage units regarding their operational activity and focuses on the following main topics: type of property, main menu, average bill per client, average number of seats per F&B unit, turnover and profitability, employment details such as average number of employees and employees turnover. It is our intention to transform this survey into an yearly event with the purpose to keep the participants to this market informed about the main operational trends and statistics. I would like to thank to all the respondents to our survey and I hope that our Report will help you understand the essentials of the food and beverage market operations in Romania. Yours faithfully, Gabriel Iovu CEO, Top Horeca
Content
Content pg. 3
Glossary pg. 4
Key findings pg. 5
Overview of the Romanian HoReCa market pg. 8
F&B market operational analysis pg. 13
Survey methodology pg. 25
Appendix pg. 27
Appendix 1: Macroeconomic indices pg. 28
Appendix 2: Statistical sample variables pg. 29
Appendix 3: Statistical sample stratification by County pg. 30
Restaurant Operations Survey – Content 3 / 31

Glossary
Avg Average
F&B Food and Beverage
CAGR Compound Annual Growth Rate
FY06 Financial Year 2006 ended December 31, 2006
FY07 Financial Year 2007 ended December 31, 2007
FY08 Financial Year 2008 ended December 31, 2008
H&R Hotels and restaurants
6M09 Six months period 2009 ended June 30, 2009
K Thousand
mln Million
NBR National Bank of Romania
NIS National Institute of Statistics
No Number
NOCR (ONRC) National Office of the Commerce Register
Q Quarter
sqm Square meters
TH Top HoReCa
VAT Value added tax
vs Versus
Restaurant Operations Survey – Glossary 4 / 31

Key findings

Key findings
No Main findings identified from the analysis of the results of the survey
1 Approximately 40% of the total number of F&B entities in Romania are located in Bucharest.
2 Majority privately held F&B entities represent 99% of the total number of entities on the market.
3 72% of companies that operate F&B units operate only one location.
4 73% of the F&B market is represented by restaurants, cafes and bars. 8.7% of the F&B entities operate one form of franchise agreement (franchisors or franchisee).
5 The average check value paid by 76% of the clients that enter a restaurant is bellow 15 (RON 55), VAT included.
6 56% of the F&B units operate exclusively full services locations. Out of these only 6% have an average check value per person over EUR 30 (VAT included).
7 51% of the F&B units serve more than one main menu.
8 The report between F&B units that own and lease their premises is of 47% vs 41%.
9 40% of the F&B entities activate on the market for more than 5 years.
10 Auxiliary services (organization of events, catering and home delivery) are an important part of the activity of an F&B unit. 88% of these provide at lease one type of such service to its clients.
11 A relatively large number of F&B entities (38%) are located in or in the proximity a hotel.
Restaurant Operations Survey – Key findings 6 /31

Key findings
No Main findings identified from the analysis of the results of the survey
12 The average seat rotation for the Romanian F&B market is of 1.2 clients per seat.
13 79% of the F&B units in Romania have less than 10 full time employees.
14 83% of the F&B units on the market laid off less than 10 employees (both full time and part time) during FY08.
15 Only 14% of the F&B units on the market report gross sales over EUR 500K. 33% of them (5% of the market) earn more than 75% of their gross sales from food.
16 56% of the F&B units invest up to 3% of gross sales in marketing.
17 Salaries and utilities represent, for approximately half of the entities on the market, between 15-30% of gross sales, each.
18 Key F&B market financial indicators
Restaurant Operations Survey – Key findings 7 /31
RON EUR*
Avg Gross Sales/sqm per year 2,475 672
Avg Gross Sale/seat per year 5,966 1,620
Avg Gross Sales/employee per year 45,836 12,446

Overview of the Romanian HoReCa market

Overview of the Romanian HoReCa market
• For the purpose of the current analysis we use the term “F&B market” as referring to restaurants, bars and cafes, canteens and other food preparation units.
• According to publicly available information total turnover of the F&B market during 2008 reached approximately RON 5,469 million. The market followed a downward trend in FY08 as compared to FY07. Furthermore the descending trend continued during the 6M09 period.
Table 1: Turnover comparative evolution
• During the period under review (2006 to 6M09), approximately 60% of the turnover generated by the F&B market is coming from restaurants and the remaining 40% from other forms of F&B units (bars, cafes, canteens aso).
Source: NIS Source: NIS
Table 2: Turnover evolution on the F&B market
*Note: 6M09 figures are estimates based on the turnover index published by NIS for June 30, 2009
-
5,000
10,000
15,000
20,000
25,000
2004 2005 2006 2007 2008 6M09*
Services market (million RON) F&B market (million RON)
- million RON - 2004 2005 2006 2007 2008 6M09*
Restaurants
2,022
2,359
3,318
4,240
3,273 2,439
% yearly growth 17% 41% 28% -23% -26%
Bars, canteens and others
1,483
1,450
2,332
2,583
2,196 1,636
% yearly growth -2% 61% 11% -15% -26%
Total
3,505
3,808
5,650
6,824
5,469 4,075
Restaurant Operations Survey – Overview of the Romanian HoReCa Market 9 /31

• Due to the lack of specific information related only to the F&B market, the analysis for the number of employees was done for both hotels and restaurants.
• Total number of employees in the hotels and restaurants industry increased from an average of 93 thousand in FY06 (2.0% of total number of employees in the economy) to 108 thousand in FY07 (2.3% of total number of employees in the economy).
Source: National Institute of Statistics
Table 3: Number of employees in the industry as of December 31, 2008
• The number of employees continued to increase during FY08 and reached an average of 114 thousand.
• In correlation with the number of employees, the vacancy rate in the industry decreased from an average of 0.70% as of the end of FY07 to 0.45% as of the end of FY08.
• Over the period under review the number of employees for the hotels and restaurants industry had an upward trend. One of the determining factor was the increase in the number of HoReCa units over the last three years. This was the period when international hotels, restaurants and cafes chains entered the Romanian market. Local units also contributed to the increase through the expansion of their activities.
• For FY08 the industry contributed with 1.8% at the gross internal product. Total gross added value in basis prices, for the hotels and restaurants industry amounted to RON 9,158 million(*). The average profitability per employee at the level of 2008 was of RON 80,335.
2.4%
Total no of employees in the economy
Total no of employees in the hotels and restaurants industry
*Note: PIB data for FY08 are estimates as published by NIS.
Overview of the Romanian HoReCa market
Restaurant Operations Survey – Overview of the Romanian HoReCa Market 10 /31
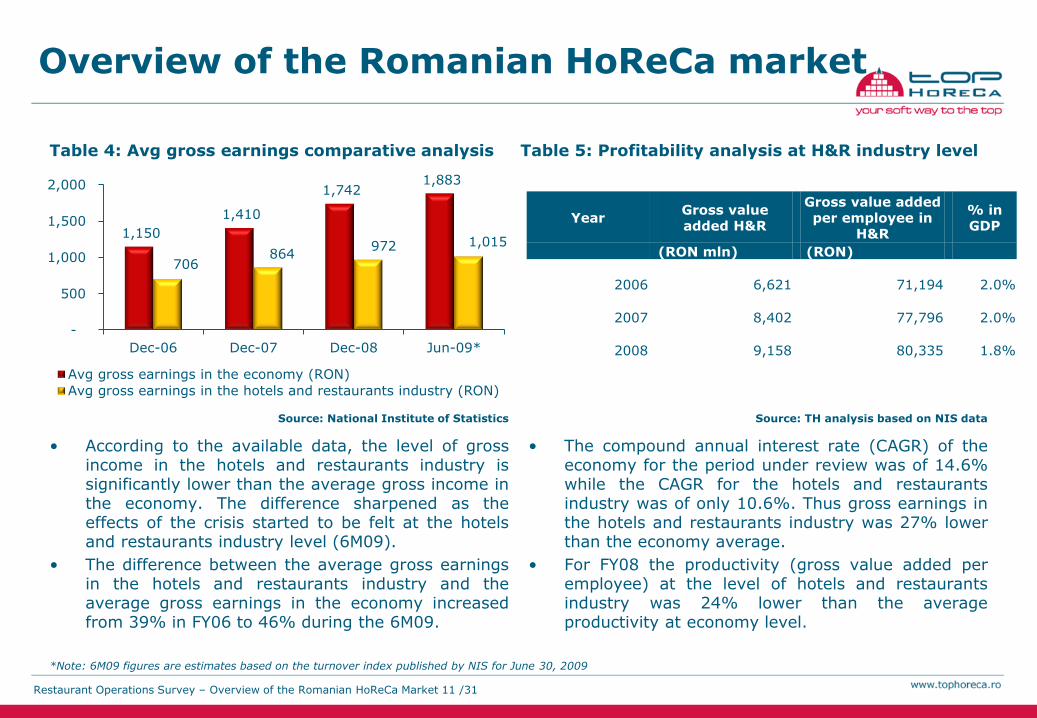
• The compound annual interest rate (CAGR) of the economy for the period under review was of 14.6% while the CAGR for the hotels and restaurants industry was of only 10.6%. Thus gross earnings in the hotels and restaurants industry was 27% lower than the economy average.
• For FY08 the productivity (gross value added per employee) at the level of hotels and restaurants industry was 24% lower than the average productivity at economy level.
Table 4: Avg gross earnings comparative analysis
Source: National Institute of Statistics
*Note: 6M09 figures are estimates based on the turnover index published by NIS for June 30, 2009
1,150
1,410
1,742 1,883
706 864
972 1,015
-
500
1,000
1,500
2,000
Dec-06 Dec-07 Dec-08 Jun-09*
Avg gross earnings in the economy (RON)
Avg gross earnings in the hotels and restaurants industry (RON)
Overview of the Romanian HoReCa market
Year Gross value added H&R
Gross value added per employee in
H&R
% in GDP
(RON mln) (RON)
2006
6,621
71,194 2.0%
2007
8,402
77,796 2.0%
2008
9,158
80,335 1.8%
Source: TH analysis based on NIS data
• According to the available data, the level of gross income in the hotels and restaurants industry is significantly lower than the average gross income in the economy. The difference sharpened as the effects of the crisis started to be felt at the hotels and restaurants industry level (6M09).
• The difference between the average gross earnings in the hotels and restaurants industry and the average gross earnings in the economy increased from 39% in FY06 to 46% during the 6M09.
Table 5: Profitability analysis at H&R industry level
Restaurant Operations Survey – Overview of the Romanian HoReCa Market 11 /31

F&B market in Romania
• A significant part of the HoReCa market in Romania is represented by the F&B market. When we refer to the F&B market we mainly refer to restaurants, cafes, bars and canteens and any other forms of F&B units.
• As of the date of this report there is no exact and reliable statistical data related to the operational activity of this market available. According to ONRC in 2008 a number of 34,233 restaurants and cafes was in its evidence. Out of the total number of units in the market 12,900 were registered as restaurants and 21,333 as bar and/or café or other F&B units.
*Note: Romanian Chamber of Commerce and Industry and the financial press.
• In terms of service type provided to clients, restaurants can be classified into full service and limited service restaurants (fast foods, canteens).
• In 2008 the main player on the limited service restaurants market was McDonald’s with a turnover of approximately RON 400 million (EUR 110 million)(*).
• The entrance of the main international chains on the cafes market boosted sales with 15% in 2008. The main players on this market are represented by national and international chains such as Turabo Cafe, Centro, Cafepedia, Costa Caffe, Starbucks, City Cafe(*).
• For the full services line of business two of the main players are La Mama (including the brand Cafepedia) with a turnover of RON 34 million (EUR 9.2 million) and City Grill with a turnover of RON 52 million (EUR 14 million) (*).
Table 6: Structure of the F&B market in 2008
62% Bars, cafes and other F&B units
38% Restaurants
Source: ONRC
Restaurant Operations Survey – F&B Market in Romania 12 /31

F&B market operational analysis

F&B market operational analysis
Source: TH analysis
Table 7: Structure of the market by form of property
• The majority of the of the companies that operate F&B units (72%) have only one location.
• Moreover, the majority of the units with only one operational location are from Bucharest, that being 45% of the total number of F&B units.
• Only 9% of the total number of companies that operate F&B units operate 4 or more locations.
44.5% Sole owner
55.0% Several owners
0.5% State owned
Source: TH analysis
72%
11%
8%
9%
0% 20% 40% 60% 80%
1 location
2 locations
3 locations
More than 3
locations
• According to the analysis of the responses to our survey approximately 99% of the companies operating F&B units are privately held and only 1% state owned.
• The results are also confirmed at the level of FY07 by the data published by the NIS (National Institute of Statistics). According to this data 99.1% of the hotels and F&B units at national level have majority private capital and 0.9% have majority state capital.
Table 8: Structure of the market by no of operational locations
Restaurant Operations Survey – F&B market operational analysis 14 /31
F&B market operational analysis
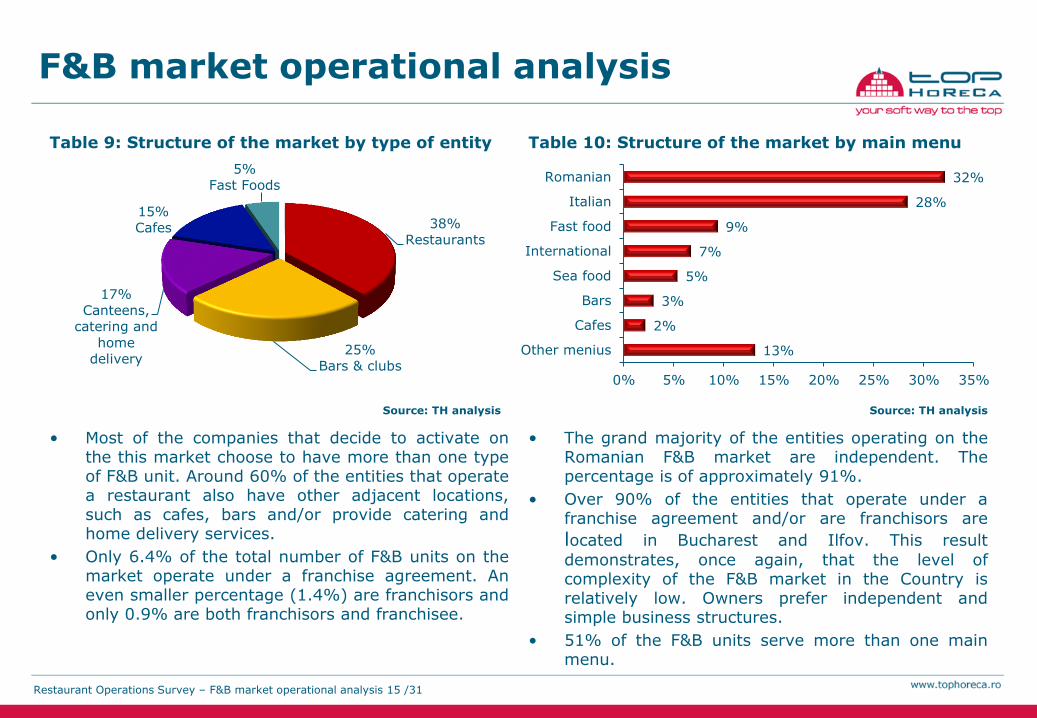
Table 9: Structure of the market by type of entity
Source: TH analysis
• Most of the companies that decide to activate on the this market choose to have more than one type of F&B unit. Around 60% of the entities that operate a restaurant also have other adjacent locations, such as cafes, bars and/or provide catering and home delivery services.
• Only 6.4% of the total number of F&B units on the market operate under a franchise agreement. An even smaller percentage (1.4%) are franchisors and only 0.9% are both franchisors and franchisee.
38%
Restaurants
25%
Bars & clubs
17%
Canteens, catering and
home
delivery
15%
Cafes
5%
Fast Foods
13%
2%
3%
5%
7%
9%
28%
32%
Other menius
Cafes
Bars
Sea food
International
Fast food
Italian
Romanian
0% 5% 10% 15% 20% 25% 30% 35%
• The grand majority of the entities operating on the Romanian F&B market are independent. The percentage is of approximately 91%.
• Over 90% of the entities that operate under a franchise agreement and/or are franchisors are
located in Bucharest and Ilfov. This result
demonstrates, once again, that the level of complexity of the F&B market in the Country is relatively low. Owners prefer independent and simple business structures.
• 51% of the F&B units serve more than one main menu.
Table 10: Structure of the market by main menu
Source: TH analysis
Restaurant Operations Survey – F&B market operational analysis 15 /31

F&B market operational analysis
Source: TH analysis
Table 11: Average check value per person
• In correlation with the relatively low purchasing power of the population (gross average income in the economy at the level of 2008 is of RON 1,742), the concentration of the average value of the check per person is in the area of lower values. 76% of the clients that enter a restaurant pay an average check bellow EUR 15 (RON 55) – VAT included.
20%
56%
15%
9%
0%
10%
20%
30%
40%
50%
60%
Under 5 EUR 5 - 15 EUR 15 - 30 EUR Over 30 EUR56% Only full service
5% Only limited service
16% None of the service
23% Full & limited services
• For the purpose of the analysis we have included in the “None of the services” category all bars, cafes and other entities that do not fit under either of the service type structures.
• In terms of type of service provided, 56% of the entities on the market operate only full service locations and 23% of them operate both full service and limited service locations.
• The average value of check per person depends on the type of service provided. Limited services locations usually have lower values per check.
Table 12: Structure of the market by type of service provided to clients
Source: TH analysis
Restaurant Operations Survey – F&B market operational analysis 16 /31

• For the full service line of business only 6% of total revenues come from bills with an average value per person over EUR 30 per person. Out of these 6%, more than half are from Bucharest and Ilfov.
F&B market operational analysis
Source: TH analysis
Table 13: Primary activity – FULL SERVICE
35%
42%
23%
0%
5%
10%
15%
20%
25%
30%
35%
40%
45%
Under 5 EUR* 5 - 10 EUR* Over 10 EUR*
Table 14: Primary activity – LIMITED SERVICE
Source: TH analysis
• Only 5% of the total F&B units on the market operate exclusively limited services locations. For 90% of these, the average check per person is bellow EUR 10.
• Only 23% of the F&B units on market that operate limited services restaurants have checks with an average value per person greater than EUR 10.
57%
37%
6%
0%
10%
20%
30%
40%
50%
60%
Under 15 EUR* 15 - 30 EUR* Over 30 EUR*
*Note: VAT included
Restaurant Operations Survey – F&B market operational analysis 17 /31

8%
41%
47%
4%
Leased land owned building Leased land leased building
Owned land owned building Owned land leased building
Table 15: Land and building property mix
Source: TH analysis
• Based on the type of property over land, 51% of the F&B locations own the land and the remaining 49% lease it.
• In respect of property over building 55% of the locations own it and 45% lease it.
• 25% of the entities that own both the land and the building are from Bucharest and another 15% are equally distributed among Brasov, Constanta and Bihor.
F&B market operational analysis
Table 16: Business age analysis
Source: TH analysis
10%
50%
22% 18%
0%
10%
20%
30%
40%
50%
60%
Under 1 year 1-5 years 5-10 years Over 10 years
• 40% of the F&B units on the market have a mature position on the market (more than 5 years).
Restaurant Operations Survey – F&B market operational analysis 18 /31
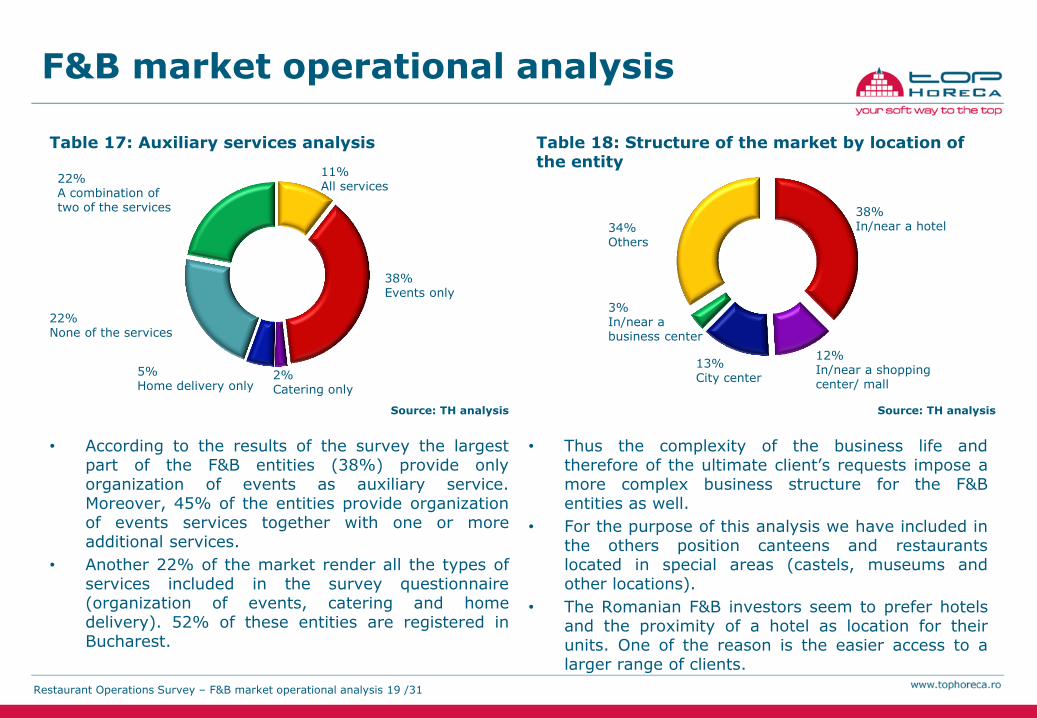
Table 17: Auxiliary services analysis
Source: TH analysis
• According to the results of the survey the largest part of the F&B entities (38%) provide only organization of events as auxiliary service. Moreover, 45% of the entities provide organization of events services together with one or more additional services.
• Another 22% of the market render all the types of services included in the survey questionnaire (organization of events, catering and home delivery). 52% of these entities are registered in Bucharest.
11% All services
22% A combination of two of the services
22% None of the services
38% Events only
2% Catering only
5% Home delivery only
F&B market operational analysis
Table 18: Structure of the market by location of the entity
Source: TH analysis
• Thus the complexity of the business life and therefore of the ultimate client’s requests impose a more complex business structure for the F&B entities as well.
• For the purpose of this analysis we have included in the others position canteens and restaurants located in special areas (castels, museums and other locations).
• The Romanian F&B investors seem to prefer hotels and the proximity of a hotel as location for their units. One of the reason is the easier access to a larger range of clients.
34% Others
38% In/near a hotel
3% In/near a business center
13% City center
12% In/near a shopping center/ mall
Restaurant Operations Survey – F&B market operational analysis 19 /31

Table 19: Area of the location vs number of available seats
Source: TH analysis
• The tendency on the market is towards medium to large restaurants with areas above 100 sqm and above 50 seats.
• Restaurants in Romania tend to build their locations with an average of 2.4 sqm per available seat.
No of seats Market %
<50 18%
50 - 100 29%
100 - 250 36%
250 - 500 11%
>500 5%
Total 100%
55% 27%
10% 6% 2%
Under 10,000 10,000 - 50,000 50,000 - 100,000
100,000 - 500,000 Over 500,000
• 55% of the F&B units on the market serve less than 10,000 clients per year. This represents an average of 27 clients per day.
• Based on the result of the survey, the average rotation per seat for an F&B unit on the market is of 1.2 clients/day.
Table 20: Structure of the market by number of clients served per year
Source: TH analysis
Area (sqm) Market %
<100 19%
100 - 250 36%
250 - 500 25%
500 – 1,000 11%
>1,000 10%
Total 100%
F&B market operational analysis
Restaurant Operations Survey – F&B market operational analysis 20 /31
vs

F&B market operational analysis
79%
10% 10% 2%
91%
9%
0%
20%
40%
60%
80%
100%
Under 10 10 - 50 50 - 100 Over 100
Full time Part time
Table 21: Full time and part time employees
Source: TH analysis
• At national level, 79% of the F&B units have less than 10 full time employees. Moreover 91% of these entities have also less than 10 part time employees.
• Only 2% of total number of F&B units operate with more than 100 full time employees.
• Personnel costs are a considerable cost item for F&B units. For 61% of the entities on the F&B market personnel costs represent between 15-30% of gross sales.
Source: TH analysis
• Thus during FY08 almost all the entities on the market were in the position to reduce the number of employees.
• According to the results of the survey 83% of the entities laid off less than 10 employees, 14% laid off between 10 and 50 employees and only 3% laid off more than 50 employees. These results consider both full time and part time employees
• Given that full time employees cost more, 77% of the entities that made redundancies chose to reduce only the number of full time employees.
Table 22: Redundancies - full time and part time
85%
12% 3%
97%
3%
0%
20%
40%
60%
80%
100%
120%
Under 10 10 - 50 Over 50
Full time Part time
Restaurant Operations Survey – F&B market operational analysis 21 /31

F&B market operational analysis
Table 23: Gross Sales analysis
Source: TH analysis
• Based on the analysis of the results of the survey, 24% of the F&B entities on the market earn more than 75% of their gross sales from food sales.
• F&B units with revenues bellow EUR 150K seem to choose a balanced report between food and beverage. Thus approximately 50% of revenues come from food and 50% from beverage.
37%
27%
22%
8%
6%
Under EUR 50K EUR 50K-150K EUR 150K-500KEUR 500K-1,000K Over EUR 1,000K
Table 24: Sales split between food and beverage
• Only 14% of the F&B entities on the market have total sales over EUR 500K. Out of these, 33% earn more than 75% of revenues from food.
• (*) The “Others” position includes canteens, catering and home delivery entities.
Source: TH analysis
91%
76%
25%
21%
62%
9%
24%
75%
79%
38%
0% 20% 40% 60% 80% 100%
Others (*)
Fast Foods
Cafes
Bars & clubs
Restaurants
Food Beverage
Restaurant Operations Survey – F&B market operational analysis 22 /31
F&B market operational analysis
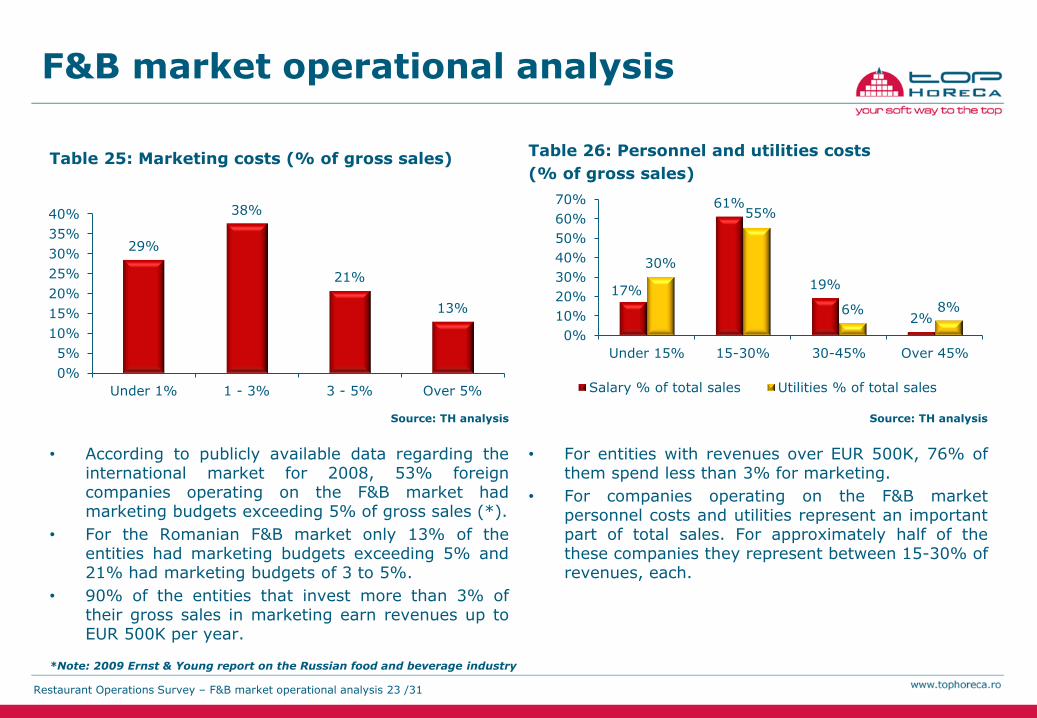
Table 25: Marketing costs (% of gross sales)
Source: TH analysis
• According to publicly available data regarding the international market for 2008, 53% foreign companies operating on the F&B market had marketing budgets exceeding 5% of gross sales (*).
• For the Romanian F&B market only 13% of the entities had marketing budgets exceeding 5% and 21% had marketing budgets of 3 to 5%.
• 90% of the entities that invest more than 3% of their gross sales in marketing earn revenues up to EUR 500K per year.
Table 26: Personnel and utilities costs
(% of gross sales)
Source: TH analysis
17%
61%
19%
2%
30%
55%
6% 8%
0%
10%
20%
30%
40%
50%
60%
70%
Under 15% 15-30% 30-45% Over 45%
Salary % of total sales Utilities % of total sales
• For entities with revenues over EUR 500K, 76% of them spend less than 3% for marketing.
• For companies operating on the F&B market personnel costs and utilities represent an important part of total sales. For approximately half of the these companies they represent between 15-30% of revenues, each.
29%
38%
21%
13%
0%
5%
10%
15%
20%
25%
30%
35%
40%
Under 1% 1 - 3% 3 - 5% Over 5%
*Note: 2009 Ernst & Young report on the Russian food and beverage industry
Restaurant Operations Survey – F&B market operational analysis 23 /31

F&B market operational analysis
Table 27: Profit % of gross sales in 2008
Source: TH analysis
• Profitability is the one of the key factors considered in the analysis of the efficiency of the operations of any company. Thus this is the main factor considered for the F&B units as well.
• Only 6% of the F&B units have a profit margin above 30%. Out of these only 22% earn gross sales above EUR 500K.
• Based on the data gathered during our survey we have computed several key indices for the F&B market.
42%
32%
20%
6%
0%
5%
10%
15%
20%
25%
30%
35%
40%
45%
Under 10% 10-20% 20-30% Over 30%
RON EUR* Avg Gross Sales/sqm per year
2,475
672
Avg Gross Sale/seat per year
5,966
1,620
Avg Gross Sales/employee per year
45,836
12,446
Source: TH analysis
Note: The exchange rate used for the EUR amounts was of 3.6827 RON/EUR which is the average exchange rate published for the FY08 by the NBR.
Table 28: Key F&B market indices
Restaurant Operations Survey – F&B market operational analysis 24 /31

Survey methodology
Survey methodology
• The object of the present survey is represented by the
analysis of the operations of the F&B market in Romania
• The subject of the survey was a number of 34,233
restaurants, bars, cafes and other F&B units located allover
Romania. The total number of entities considered for the
relevance of our survey was provided by the National Office
of the Trade Register.
• The survey was mainly designed to assess the quantitative
variables of the F&B market
• We have selected our representative sample on a random
basis. The survey was initially deployed via email to a
number of 1,194 contacts. Out of these 6 contacts declined
the participation from the beginning.
• The sample was designed with a 0.06 margin of error for a 90% level of confidence . The standard variation of the elected sample is of 345, representing the average variation from the mean of the sample.
• Please see Appendix 2 for details related to the computation of the minimum sample size and to the variables of the sample.
• The sample was stratified by County for the purpose of relevance of our analysis. 41% of the sample size was represented by Bucharest, the following two positions being held by Brasov and Constanta with approximately 6% each.
• The average response rate to the survey for the top 3 Counties ranged from 15% to 18%. For details about the sample distribution and the response rates per County please see Appendix 3.
• Out of the total 1,194 sampled units only 218 responded to the survey. This resulted in an average response rate of 19%.
• In respect to the response rate, Bucharest was the best represented County with a total number of 95 respondents out of 483 sampled units.
• Out of the total number of respondents, 154 answered to all questions of the survey (70%) and another 66 respondents (30%) skipped several questions. The average completion percentage of the unfinished surveys was of 70%.
• 92% of the respondents to our survey questionnaire gave the complete contact details of the F&B unit they represent.
Restaurant Operations Survey – Survey methodology 26 /31

Appendix

Appendix 1: Macroeconomic indices
Year Total no of unemployed
Unemployment rate
Inflation rate Overall consumer price index
F&B market consumer price index
FY06 460,495 5.2% 6.6% 106.56 107.16
FY07 367,838 4.0% 4.9% 104.84 105.81
FY08 403,441 4.4% 7.9% 106.30 107.25
6M09 548,930 6.0% 5.9% 103.14 101.39
Source: National Institute of Statistics
Note: Overall consumer price index is expressed related to December 31, previous year.
Restaurant Operations Survey – Appendix 1: Macroeconomic indices 28 /31
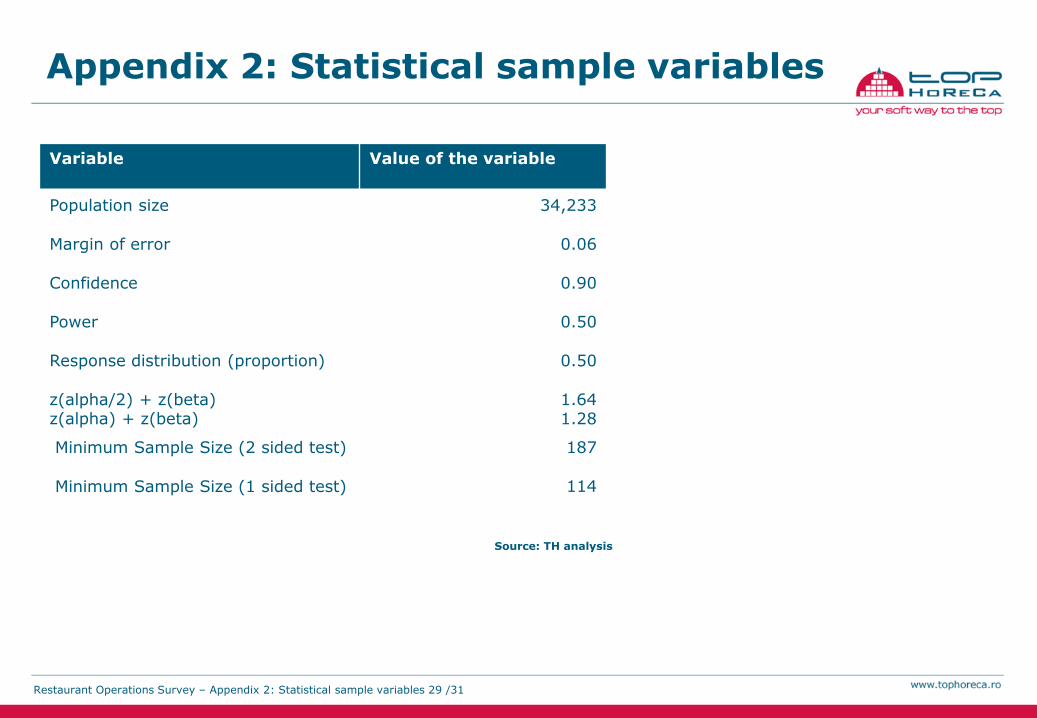
Appendix 2: Statistical sample variables
Variable Value of the variable
Population size 34,233
Margin of error 0.06
Confidence 0.90
Power 0.50
Response distribution (proportion) 0.50
z(alpha/2) + z(beta) z(alpha) + z(beta)
1.64 1.28
Minimum Sample Size (2 sided test) 187
Minimum Sample Size (1 sided test) 114
Source: TH analysis
Restaurant Operations Survey – Appendix 2: Statistical sample variables 29 /31

Appendix 3: Statistical sample stratification by County
County No of sample units per County
% County in total sample
Total no of respondents per County
% of respondents per County
Bucharest 493 41.3% 94 19.1%
Brasov 77 6.4% 12 15.6%
Constanta 73 6.1% 11 15.1%
Timis 51 4.3% 6 11.8%
Sibiu 49 4.1% 11 22.4%
Prahova 42 3.5% 7 19.0%
Mures 41 3.4% 3 7.3%
Harghita 40 3.4% 2 5.0%
Cluj 38 3.2% 4 10.5%
Arges 27 2.3% 6 22.2%
In constructie 26 2.2% - 0.0%
Caras Severin 24 2.0% 1 4.2%
Bihor 23 1.9% 8 34.8%
Arad 19 1.6% 8 42.1%
Ilfov 16 1.3% 3 18.8%
Hunedoara 15 1.3% 6 40.0%
Iasi 14 1.2% 4 28.6%
Neamt 14 1.2% 8 57.1%
Dambovita 10 0.8% 1 10.0%
Suceava 10 0.8% 3 30.0%
Galati 9 0.8% 2 22.2%
Dolj 8 0.7% 4 50.0%
Source: TH analysis
County No of sample units per County
% County in total sample
Total no of respondents per County
% of respondents per County
Valcea 8 0.7% - 0.0%
Calarasi 7 0.6% - 0.0%
Teleorman 7 0.6% 1 14.3%
Alba 5 0.4% 3 60.0%
Bacau 5 0.4% 2 40.0%
Ialomita 5 0.4% 1 20.0%
Zalau 5 0.4% -
Bistrita Nasaud 4 0.3% 2 50.0%
Satu Mare 4 0.3% 1 25.0%
Botosani 3 0.3% 1 33.3%
Braila 3 0.3% - 0.0%
Buzau 3 0.3% - 0.0%
Mehedinti 3 0.3% - 0.0%
Olt 3 0.3% 1 33.3%
Giurgiu 2 0.2% - 0.0%
Gorj 2 0.2% - 0.0%
Covasna 1 0.1% 1 100.0%
Maramures 1 0.1% 1 100.0%
Salaj 1 0.1% - 0.0%
Tulcea 1 0.1% - 0.0%
Vaslui 1 0.1% - 0.0%
Total 1,194 100% 218
Cont’d
Restaurant Operations Survey – Appendix 3: Statistical sample stratification by County 30 /31

We thank to all the participants to the survey.
S.C. TOP HoReCa S.R.L
Metav Business Park
Str. Biharia 67-77, Clădirea H, Et. 2
Sector 1, 013981 Bucureşti
Tel.: +40 21 201 11 02 Fax: +40 21 201 11 03
www.tophoreca.ro