Embed Size (px)
Citation preview

RESTAMAX PLCANNUAL REPORT
2017

Restamax Plc
RESTAMAX PLCANNUAL REPORT
2017
Images: Jukka Kaitala (Studio Skaala), Ahti Kaukoniemi, Jonathan Melartin (AfterSunset Photography), Pia Ropo, Nasdaq OMX, Teppo Kangas, Pyry Antero, Niki-Santeri Soukkio, Dorit Salutskij, Mikko Taivalkorpi, Erkka Lyytikkä (Who’s that? Photography), Bo Fledelius, Aapo Mattsson, Teppo Kangas

Annual Report 2017
4 | RESTAMAX IN BRIEF
8 | REVIEW BY THE CEO
10 | REVIEW BY THE CHAIRMAN OF THE BOARD OF DIRECTORS
12 | LABOUR HIRE OPERATIONS: REVIEW BY THE CEO
14 | HISTORY
16 | RESTAURANT PORTFOLIO
18 | SMILE HENKILÖSTÖPALVELUT
22 | THE GROUP’S BUSINESS OPERATIONS
24 | FINANCIAL FIGURES
30 | STRATEGY
33 | MISSION, VISION, VALUES
34 | MARKET SITUATION
36 | KEY EVENTS OF 2017
40 | EVENTS AND PROJECTS IN 2018
42 | PERSONNEL
46 | CORPORATE RESPONSIBILITY
48 | RAVINTOLA.FI
50 | RESTAMAX BOARD OF DIRECTORS
52 | RESTAMAX EXECUTIVE TEAM
54 | SMILE BOARD OF DIRECTORS
55 | SMILE EXECUTIVE TEAM
56 | CORPORATE GOVERNANCE STATEMENT
61 | REMUNERATION STATEMENT
CONTENTSRESTAMAX PLC
67 | TABLE OF CONTENTS
68 | CONSOLIDATED FINANCIAL STATEMENTS (IFRS)
130 | FINANCIAL STATEMENTS OF THE PARENT COMPANY (FAS)
FINANCIAL STATEMENTS
Restamax Plc’s 2017 annual report has been published in printed format at the Annual General Meeting on 25 April 2018. The 2017 annual report is available on the Group’s website at www.restamax.fi.
Restamax Plc’s official financial statements, annual report and auditor’s report for 2017 have been published on the Group’s website in Finnish and English.

Restamax Plc
4
The Group companies include more than 130 restau-rants, nightclubs and entertainment centres all over Finland. Well-known restaurant concepts of the Group include Stefan’s Steakhouse, Viihdemaailma Ilona, Classic American Diner and Colorado Bar & Grill.
In 2017, Restamax Plc’s turnover was MEUR 185.9 and EBITDA MEUR 22.4. Depending on the season, the Group employs approximately 2,250 people converted into full-time workers. Restamax’s subsidiary Smile Henkilöstöpalvelut Oy employs approximately 9,000 people per month.
Restamax company website: www.restamax.fiRestamax consumer website: www.ravintola.fiSmile Henkilöstöpalvelut: www.smilepalvelut.fi
RESTAMAX PLC IS A FINNISH GROUP ESTABLISHED IN 1996, SPECIALISING IN RESTAURANT
SERVICES AND LABOUR HIRE. THE COMPANY, WHICH WAS LISTED ON NASDAQ HELSINKI IN 2013
AND BECAME THE FIRST FINNISH LISTED RESTAURANT COMPANY,
HAS CONTINUED TO GROW STRONGLY THROUGHOUT
ITS HISTORY.
RESTAMAX PLC
Annual Report 2017
5
SMILE’S 2017 IN NUMBERS
RESTAMAX’S 2017 IN NUMBERS

Restamax Plc
6
RESTAMAX IN BRIEF
1
A STRONGLY GROWING FOOD AND ENTERTAINMENT RESTAURANT AND LABOUR
HIRE GROUP.
2
A STEADILY GROWING MARKET, THE DEVELOPMENT
OF WHICH IS SUPPORTED BY SEVERAL LONG-TERM DRIVERS OF GROWTH
FAVOURABLE TO RESTAMAX.
3
A LARGE-SCALE, FRAGMENTED MARKET ALSO OFFERS THE
CHANCE TO GROW OUR MARKET SHARE AND SUSTAIN GROWTH AT A SIGNIFICANTLY STRONGER RATE
THAN THE AVERAGES OF BOTH SECTORS IN FUTURE.

Annual Report 2017
7
5
EFFICIENCY AND PRACTICALLY IMPLEMENTED PROFIT RESPONSI-BILITY GUARANTEE PROFITABILITY
THAT IS CLEARLY HIGHER THAN THE SECTOR AVERAGES.
6
EXPERIENCED, PROFESSIONAL KEY MANAGEMENT WITH A SHARED EXPERIENCE OF MORE THAN 100 YEARS FROM THE RESTAURANT
BUSINESS.
4
THE COMPANY’S OPERATING MODEL, WHICH COMBINES
ENTREPRENEURSHIP WITH LARGE-SCALE ECONOMICS,
OFFERS A LOCAL COMPETITIVE EDGE.
Restamax Plc
8

Annual Report 2017
9
A record year for growth
The 2017 financial period will go down in our history as a year of strong growth. In January−December 2017, the turnover of our Group increased by almost 43 per cent, EBITDA by 15.5 per cent and operating profit by almost 20 per cent in comparison with the previous financial period.
The key figures for 2017 are rather positive. Once again we reached our long-term strategic goals, and during 2017 we already exceeded the turnover target of MEUR 180 that we set for 2018. Although the second and third quarters of 2017 with chilly and rainy summer weather were challenging, which affected our EBITDA and EBIT margins, we were able to keep our key efficiency figures, such as our staff expenses and material margin, at a good level. Increased focus on and additional invest-ment in sales, marketing and streamlining operating practices improved customer flow and increased average purchases.
In 2017, we served up to 7 million customers and our restaurant portfolio grew from 110 to more than 130 restaurants. The final quarter of the year was quite successful and culminated in the busiest-ever Christ-mas party season. In October–December, we opened more than 10 new restaurants and, despite their opening costs, we succeeded in catching up with the results of the second and third quarters that were influenced by poor summer weather.
In 2017, we strengthened our position in familiar cities and also expanded our market area to new cities. We duplicated our familiar and popular concepts and coloured up the restaurant field with completely new business ideas. We opened Run Out escape rooms in Tampere and Seinäjoki. At the beginning of 2018, we opened the Vihahuone and the completely dark escape room, Dark Room, in Tampere. To our knowledge, these are the first of their kind in Finland.
Smile Henkilöstöpalvelut grown into one of the major players in the sector
Smile Henkilöstöpalvelut Oy’s rate of growth acceler-ated in 2017 both organically and as a result of corporate acquisitions, and the company became a leading player in the field. As a result of corporate acquisitions, Smile’s market position strengthened significantly in South-west Finland, Satakunta, Kainuu, Helsinki and Pirkan-maa, especially in the fields of industry, construction and restaurant business. In March 2018, we announced that we would be evaluating the listing of Smile on the Nasdaq Helsinki Ltd Stock Exchange.
Towards new targets
At the end of 2017, we published the Group’s new long-term financial goals and strategy. Our goal is to reach a total turnover of approximately MEUR 400 by the end of 2020. Active work to reach this goal has begun. In January 2018, we announced that we would be revamp-
ing our organisation and management. We will invest more strongly in the management of business units, the boosting of acquisitions and the satisfaction of our customers and staff. We will, for example, expand the opportunities for training provided by Restamax Acad-emy for our staff. Sales, marketing and market knowl-edge will be given increasing value in our operations, and for this we will strengthen our Executive Team during 2018 with a Chief Commercial Officer (CCO).
Becoming a leading restaurant company in Northern Europe
In March 2018, we took a significant step in Restamax’s history. We expanded our restaurant business to Denmark. We bought over 90% of the popular Danish Cock’s & Cows and The Bird concepts, which currently include a total of 11 restaurants in key locations in Copenhagen. The founders of the restaurants, Lasse Wiwe and Daniel Knuttel, will act as partners in our Danish subsidiary and continue in the operative management of business operations. Their knowhow and market knowledge create a solid foundation for strong growth in Denmark. In addition to food restau-rants, we see great growth opportunities in the nightclub and entertainment restaurant business in Denmark. During summer 2018, both restaurant concepts will open new units in prime locations at the Copenhagen interna-tional airport.
Our internationalisation will be further supported by the joining of forces with Royal Ravintolat that we reported in April 2018. At the end of 2017, the Royal Ravintolat Group included 35 unique restaurants, 21 Hanko Sushi restaurants, 7 Pizzarium restaurants and 4 Sandro restaurants in different parts of Finland. Other well-known brands of the Group famous for its premium restaurants include Savoy, Löyly, Elite, Palace and Teatteri. Upon the realisation of the deal, I will take charge of our company’s operations abroad as the CEO of Restamax International. The CEO of Royal Ravintolat, Aku Vikström, will assume the position of the CEO of the Group with responsibility for the company’s domestic operations. We aim to be the leading restaurant operator in Northern Europe by 2020.
In accordance with our strategy, we expect the Group’s turnover to increase and profitability to remain on a good level in both segments in the 2018 financial period. In the restaurant segment, without Royal Ravintolat, our goal is to reach a turnover of approximately MEUR 140, and in labour hire a turnover of approximately MEUR 110, the total turnover being some MEUR 240, by the end of 2018.
REVIEW BY THE CEO
Juha HelminenCEO, Restamax Plc

Restamax Plc
10

Annual Report 2017
11
REVIEW BY THE CHAIRMAN OF THE BOARD OF DIRECTORSRecord-level rise in share price
There is strong confidence in Restamax among investors and the market. In 2017, the development of our Group’s share price was stronger than ever before: at the end of 2016, the share price was about EUR 6, and by the end of 2017, it had risen to above EUR 8. At the end of 2017, the share target price was EUR 8.80, and in April 2018 it rose to as high as EUR 12. In 2017, Kauppalehti ranked Restamax as the 14th most profitable listed company, based on its gross yield of 49.1 per cent.
Looking at the restaurant field generally, 2017 was a growth-oriented year. According to the Finnish Hospi-tality Association (MaRa), the turnover of the tourism and restaurant industries increased by 6.5 per cent in the period January–December 2017. Consumer confi-dence strengthened towards the end of the year and, in January 2018, rose to the highest measured value in its history. Finland attracted more tourists than before, and the increase of tourism naturally had a positive effect on the demand for restaurant services. Overnight stays by foreign tourists in hotels in Finland increased faster than in other Nordic countries: the increase was nearly 17 per cent from the previous year. The majority of our tourists are Chinese. In 2017, the number of Chinese tourists travelling to Finland increased by more than 35 per cent from the previous year.
The Alcohol Act, which fully entered into force at the beginning of March 2018, is a much-needed boost for the industry, allowing happy hour marketing and extended opening hours, among other things. We will take advan-tage of the reform in our operations, and we believe that it will both strengthen customer flows and increase the average size of customer purchases.
New step in labour hire
The 2017 financial period was also successful for our labour hire segment. Smile Henkilöstöpalvelut is now one of the largest companies in the sector in Finland. The geographic coverage and number of personnel at the branches of our labour hire segment are larger than ever. Smile’s organic growth has been supported by strong investment in marketing and brand work, among other things.
As a result of an increase in the demand of the economy and for labour hire services, the market in the sector also looks very positive. The rate of growth of our labour hire business has been much faster than the general devel-opment of the sector and our restaurant segment. Since 2014, when labour hire became part of our Group, the growth of the segment has been strong. Now the time is ripe for the next move. In March 2018, our Board of Directors announced that it would review and evaluate the listing of the labour hire business comprising Smile
Henkilöstöpalvelut Oy and its subgroup on the Nasdaq Helsinki Ltd Stock Exchange during the spring of 2018. Taking Finnish restaurant competence abroad
Our strategic objective has been to expand our restaurant operations abroad during 2018. In spring 2018, we took the first step to implement the strategy by expanding our restaurant business to Denmark. Our goal is to reach a key position in the Danish restaurant market. In addi-tion to this, we intend to expand to other parts of North-ern Europe where the restaurant market is fragmented and we therefore see significant potential in it. We will continue our internationalisation through corporate acquisitions and the export of our own concepts. We are currently negotiating actively in several countries.
We have strong competence that we can also export beyond the borders of Finland. Therefore, we will be able to offer our personnel versatile career opportunities abroad too.
Becoming one of the largest in the Nordic countries
Announced in April 2018, our planned joining of forces with Royal Ravintolat will create a platform for the econ-omy and competence that will also accelerate our growth abroad. With the deal, the size of the restaurant business of our company will reach a completely new level. Royal Ravintolat has a significant market position in Helsinki, and Restamax has a significant position elsewhere in Finland. Together we will be one of the largest restaurant groups in the Nordic countries listed on the Helsinki Stock Exchange. We want to build a restaurant company that combines an entrepreneurial approach, an attitude that emphasises the role of restaurateurs and the development resources of a big company. As companies, Restamax and Royal Ravintolat complement each other in terms of their product portfolios and competencies. The deal is expected to be realised in summer 2018, and the aim is to carry out the integration in late 2018 and early 2019.
In December 2017, we published a new long-term strategy and objectives. We have now begun to implement these with a positive mind. Our Group’s goal is to reach a turnover of approximately MEUR 400 by the end of 2020, restaurant business accounting for approximately MEUR 200 and labour hire approximately MEUR 220 of the total turnover. Restamax is a strong and profitable company.
Timo Laine Chairman of the Board of Directors, Restamax Plc

Restamax Plc
12

Annual Report 2017
13
Strong growth organically and through corporate acquisitions
The spectacular growth of Smile Henkilöstöpalvelut continued in the 2017 financial period. The company’s turnover reached MEUR 75.6, increasing by more than 121 per cent, EBITDA was MEUR 6.6, increasing by nearly 92 per cent, and operating profit was MEUR 3.8, increasing by 140 per cent from the previous year. In 2017, our profitability was among the best in the sector and our growth was clearly stronger than the general growth.
The comprehensive labour needs and growth of our current customers and our successful acquisition of new customers spurred on our growth. In addition to organic growth, corporate acquisitions played a significant role in this: for example, Banssi Henkilöstöpalvelut, Job Services One (now Smile Job Services Oy) and Active People became part of our company. Our position strengthened especially in the fields of construc-tion, industry and logistics. In addition to these fields, we supply professionals for hotels, restaurants and catering, events and promotions and medical services – currently for more than 400 companies around Finland. In 2017, we employed approximately 9,000 professionals on a monthly basis, which is twice the amount of 2016. We also established Smile Education Oy (Smile Edu), which provides training services with the mission of improving the availability of manpower in collaboration with educational institutes. Our new direct-recruitment service Smile Rekry also started its operations at the beginning of 2018.
During the 2017 financial period, we became one of the largest players in our field. The cornerstones of our success have been expertise of various fields and a diverse growth strategy. Internally, we have focused on the integration of the acquired companies. We have invested in marketing and brand work. Our slogan “Ilon kautta töihin” (Joy at work) can be seen in the streetscape and our daily activities. At the core of our operations is a uniform operating system. With its implementation, our operations will be harmonised, automated and more efficient than ever. We invest in our personnel’s well-being at work actively, and in 2017 the Motivire program was introduced to improve personal well-being.
Joining the change in the labour market
There is clearly a cultural change taking place in the labour market, and we want to be part of it. Employees
expect employers to be more and more understanding and flexible with their changing life situations. For us in the staffing service business, this is a great opportunity – and a responsibility. Although the staffing service sector in Finland is still young and developing, its growth potential appears rather bright. In 2017, labour hire was one of Finland’s strongest growing industries. In 2017, the 20 largest companies in the staffing service sector reached a total turnover of MEUR 1,281, with an increase of approximately 18 per cent from the previ-ous year. Of this group, the companies concentrating in labour hire reached a turnover of MEUR 1,077, with an increase of 22 per cent from the previous year. As much as over 80 per cent of the turnover of the leading players in the staffing service sector comes from labour hire services, which is why it is fair to say that labour hire nearly defines the direction of the staffing service sector.
Growth boost from stock exchange listing
Our journey together with Restamax has been great. The labour hire business became part of Restamax in August 2014, when Restamax acquired a majority holding in Staff Invest Oy. In 2015, the turnover of the labour hire business was MEUR 24.2, and in 2017 the turnover reached MEUR 75.6. In addition to the restau-rant sector, business operations have scaled diversely to different sectors.
In March 2018, Restamax announced that it had decided to review and evaluate the listing of the labour hire business comprising Smile Henkilöstöpalvelut Oy and its subgroup on the Nasdaq Helsinki Ltd Stock Exchange. The evaluation process will be carried out during spring 2018, and we will communicate on its progress later.
The potential listing enables us to strengthen our balance sheet and to grow even more quickly into one of Finland’s largest labour hire companies. In accord-ance with our renewed strategy, we will be targeting a turnover of MEUR 220 by the end of 2020. This is the way forward.
Sami AsikainenCEO, Smile Henkilöstöpalvelut Oy
LABOUR HIRE OPERATIONS:
REVIEW BY THE CEO

Restamax Plc
14
BOLD STEPS TOWARDS GROWTH SINCE 1996RESTAMAX PLC HAS MORE THAN 20 YEARS’ EXPERIENCE IN THE RES-
TAURANT BUSINESS. THE COMPANY’S ROOTS DATE BACK TO 1996. THE
LISTED COMPANY, WHICH HAS SPRUNG FROM THE PUB BUSINESS, IS
TARGETING A TURNOVER OF MEUR 180 AND THE EXPANSION OF THE
RESTAURANT BUSINESS ABROAD BY THE END OF 2018. AT THE SAME
TIME, RESTAMAX IS ALSO CONTINUING ITS PROFITABLE GROWTH IN
FINLAND IN THE RESTAURANT AND LABOUR HIRE BUSINESSES.

Annual Report 2017
15
KEY EVENTS IN THE COMPANY’S HISTORY
More than 130 restaurants in Finland. Reaching the turnover target of MEUR 180 set for 2018 already during 2017.
Expansion of the restaurant business to Oulu and Hanko and the labour hire business into medical and healthcare services.
Acquisition of Rengasravintolat Oy, adding 16 restaurants to the Group’s restaurant port-folio in Helsinki, Tampere, Jyväskylä and Pori.
Expansion of the restaurant business into the northern ski resorts of Ruka and Pyhä.
Expansion of the Group’s business operations into labour hire.
Transformation into a public limited company is registered in the Trade Register on 20 September 2013. Listing of Restamax Plc on the Helsinki Stock Exchange as the first restaurant company in Finland at the end of the year.
Expansion of ownership through a special issue; creation of the Restamax Group in its current form through corporate transactions.
Through corporate transactions, even stronger expansion into entertainment restaurants and pubs.
Start of operations; strong focus on entertainment restaurants and the pub business.
Expansion into the food restaurant business.
120 restaurants in Finland. Expansion of the restaurant business to Levi. Strengthening of the labour hire business in different fields and geographical expansion to Ostrobothnia and Northern Finland.
1996
2008
2013
2015
2017
2005
2010
2014
2016

Restamax Plc
16
RESTAURANTPORTFOLIO
FOOD RESTAURANTS
Ehdottomasti Rinneravintola
05: Passenger side logo
FOOD TRUCK
ENTERTAINMENT RESTAURANTS AND PUBS
C100 M85 Y10 K0
C70 M10 Y0 K0
PAKOHUONEET • ESCAPE ROOMS
WWW.RUNOUT.FI
PAKOHUONEET • ESCAPE ROOMS
WWW.RUNOUT.FI 2. krs
NIGHTCLUBS
yökerhoRINGO STARR

Annual Report 2017
17
HANKO • HELSINKI • HYVINKÄÄ • HÄMEENLINNA • JOENSUU JYVÄSKYLÄ • KOTKA • KUOPIO • LAPPEENRANTA • LEMPÄÄLÄ
LEVI • LOHJA • NOKIA • OULU • PIRKKALA • PORI • PYHÄ RAUMA • ROVANIEMI • RUKA • SEINÄJOKI • TAMPERE • TURKU
VAASA • VANTAA
The map indicates the places where one or more of the Group’s restaurants are located.
NIGHTCLUBS
ENTERTAINMENT RESTAURANTS AND PUBS
FOOD RESTAURANTS
MORE THAN 130 FOOD AND ENTERTAINMENT RESTAURANTS AROUND FINLAND IN 2017Restamax’s restaurant concepts are divided into three business units: food restaurants, nightclubs, and entertainment restaurants and pubs.
Read more about the concepts and restaurants of these units on the Restamax website:
WWW.RESTAMAX.FI
The majority of the Group’s restaurants are included in the Ravintola.fi loyal customer system. There are approxi-mately 134,000 loyal customers. The restaurants included in the system can be found on the Ravintola.fi website:
WWW.RAVINTOLA.FI

18
Restamax Plc
18
Established in 2002, Smile Henkilöstöpalvelut Oy is one of Finland’s largest labour hire companies. It supplies labour to hundreds of customers throughout Finland and employs some 9,000 professionals on a monthly basis. Smile joined Restamax Group in August 2014.
In the 2017 financial period, Smile Group’s turnover was MEUR 75.6, EBITDA MEUR 6.6 and operating profit MEUR 3.8. Compared to the previous year, the turnover increased by 121.5 per cent, EBITDA by 91.9 per cent and operating profit by 140.1 per cent.
Smile operates in several different fields and offers its employees and customers alike sector-specific and expert services. Smile’s operations are based on posi-tive thinking and, in line with its name, the company strives to improve working life in Finland through joy and develop the entire labour hire sector.
The company’s day-to-day operations are guided by values such as putting people first, professional pride, entrepreneurship and positivity. Smile Henkilöstö-palvelut offers its employees flexible opportunities to work as best suited to their life situation. The company provides service that puts people first, starting from job-seeking. To its customers, Smile offers compre-hensive labour hire and staffing services with profes-sional pride and an entrepreneurial approach. The service portfolio includes individual recruitment as well as larger recruitment commissions.
SMILEHENKILÖSTÖPALVELUT
SMILE OPERATES IN THE FOLLOWING BUSINESS AREAS:
Smile Hotel, Restaurants and Catering Smile HoReCa provides staffing services for hotel, restaurant and catering companies and professionals.
Smile Construction, Industry, Logistics and Maintenance Smile Industries provides staffing services for construction, industry, logistics and maintenance.
Smile Events, Promotion and VIP Smile Events & Promotions provides staffing solutions for event and promotion companies and professionals.
Smile Doctors Smile Doctors is a Finnish staffing company that provides highly-skilled medical doctors.
Training and direct recruitment From 2018, the company has also offered its customers and employees training and direct recruitment services.
SMILE HENKILÖSTÖPALVELUT OY IS A RESTAMAX SUBSIDIARY WHICH OFFERS LABOUR HIRE SERVICES, FOR THE NEEDS OF THE RESTAURANT FIELD, CONSTRUCTION, INDUSTRY, LOGISTICS, EVENT PRODUCTION AND HEALTH CARE.

19
Annual Report 2017
19
ESPOO • HELSINKI • IISALMI• JOENSUU • JYVÄSKYLÄKUOPIO • LAHTI • LAPPEENRANTA • MIKKELI • OULUROVANIEMI • SEINÄJOKI • TAMPERE • TURKU • VAASA VANTAA
SMILE OFFICES:

Restamax Plc
20

Annual Report 2017
21
SMILE HENKILÖSTÖPALVELUT’S VALUES:
Putting people first To us, every employee, job-seeker and customer is an individual. We hope that each and every one of them feels warmly welcomed by us and close to Smile. We want to know our employees as individuals and know what type of work they want to do in their field and at what kind of workplaces.
We empathise with our customers’ everyday activities. It is important to us to know the practices and culture of each workplace so that we can provide them the best service.
To job-seekers, we always offer a welcome that puts people first.
Professional pride You can take pride in your work and enjoy working, regardless of the type of work. To us at Smile, it is important to let the joy of work show. People should be proud of their work, and rewards can encompass more than just your wages, though those are of course vital. For example, you can find friends through work and a community where you can belong and improve your skills.
Motivation affects things, and improving yourself in working life and as a person is a part of professional pride. If we notice room for improvement which, if
fixed, could make us all more satisfied and efficient, we tackle it and adjust our operations accordingly. It is important to want to influence things and advance them. Developing yourself as an employee and person is a life-long project that we support and cherish. We want to be up-to-date in the changing working life and to offer our best expertise to our employees and customers alike.
Entrepreneurship We at Smile want to rise to every occasion with an entrepreneurial approach and see things through. It is important
to us to ensure that every job we accept gets done – it is our shared responsibility. We do our utmost to achieve the best possible results.
Positivity In line with our name, we are always positive, and that positivity must reflect in our work. We want to create a positive atmosphere around us and bring joy to our employees and customers in the busy working life.
Smile. Joy at Work.

Restamax Plc
22
GROUP’S BUSINESS ACTIVITIES2017 IN BRIEF Entire Group:
The Group’s turnover was MEUR 185.9 (MEUR 130.1), growth of 42.9 per cent. EBITDA was MEUR 22.4 (MEUR 19.4), growth of 15.5 per cent. Operating profit was MEUR 10.8 (MEUR 9.0), growth of 19.7 per cent.
Restaurant business:
The turnover of the restaurant business segment was MEUR 122.2 (MEUR 107.5), growth of 13.6 per cent. EBITDA was MEUR 16.3 (MEUR 16.5), decrease of 0.9 per cent. Operating profit was MEUR 6.9 (MEUR 7.4), decrease of 6.5 per cent.
Labour hire business:
The turnover of the labour hire business segment was MEUR 75.6 (MEUR 34.1), growth of 121.5 per cent. EBITDA was MEUR 6.6 (MEUR 3.4), growth of 91.9 per cent. Operating profit was MEUR 3.8 (MEUR 1.6), growth of 140.1 per cent.
Figures in parentheses refer to the same period last year, unless otherwise stated.
Summary
Restamax Plc’s result for January–December 2017 was clearly better than the previous year, as had been expected. The turnover of the entire Group increased by 42.9 per cent from last year, EBITDA by 15.5 per cent and operating profit by 19.7 per cent.
Abnormally cold and rainy weather in the summer put a strain on the Group’s restaurant business in the second and third quarter of the year, affecting the result and relative profitability of the 2017 financial period of the entire Group. The growth rate of business operations accelerated towards the end of the year, and with a successful Christmas party season the Group’s October–December 2017 result was rather good.
Turnover increased due to acquisitions and, especially in the last part of the year, the increased focus and investments in sales and marketing. The whole Group EBITDA and EBIT increased compared to last year.
Job Services One Oy (currently Smile Job Services Oy), which was acquired to the labour hire business in the last quarter, executed a stronger than expected result. This increased the purchase price of the company through the earn-out mechanism, leading to a significant non-recurring item of MEUR 1.7 in financial expenses. EBITDA for the labour hire segment also includes capital transfer taxes of EUR 300,000 as non-recurring costs related to the acquisition of the businesses.
In terms of the level of profitability, Restamax’s restaurant business and labour hire business are at the spearhead of their sectors. Due to the nature of the business, the relative profitability of the labour hire business is slightly lower than the restaurant business. As the labour hire business is growing relatively faster than the restaurant business, the overall group relative profitability is influenced due to this change.
Especially in the restaurant business, most of the prof-its are made in the second half of the year due to the seasonal nature of the business.
PROSPECTS FOR 2018 Profit guidance (as of 20 February 2018):
In accordance with its strategy, Restamax expects the Group’s turnover to increase and profitability to remain on a good level in both segments in the 2018 financial period. The restaurant segment is expected to reach a turnover of approximately MEUR 140 and in labour hire a turnover of approximately MEUR 110 is expected, the total turnover being some MEUR 240 after eliminations.
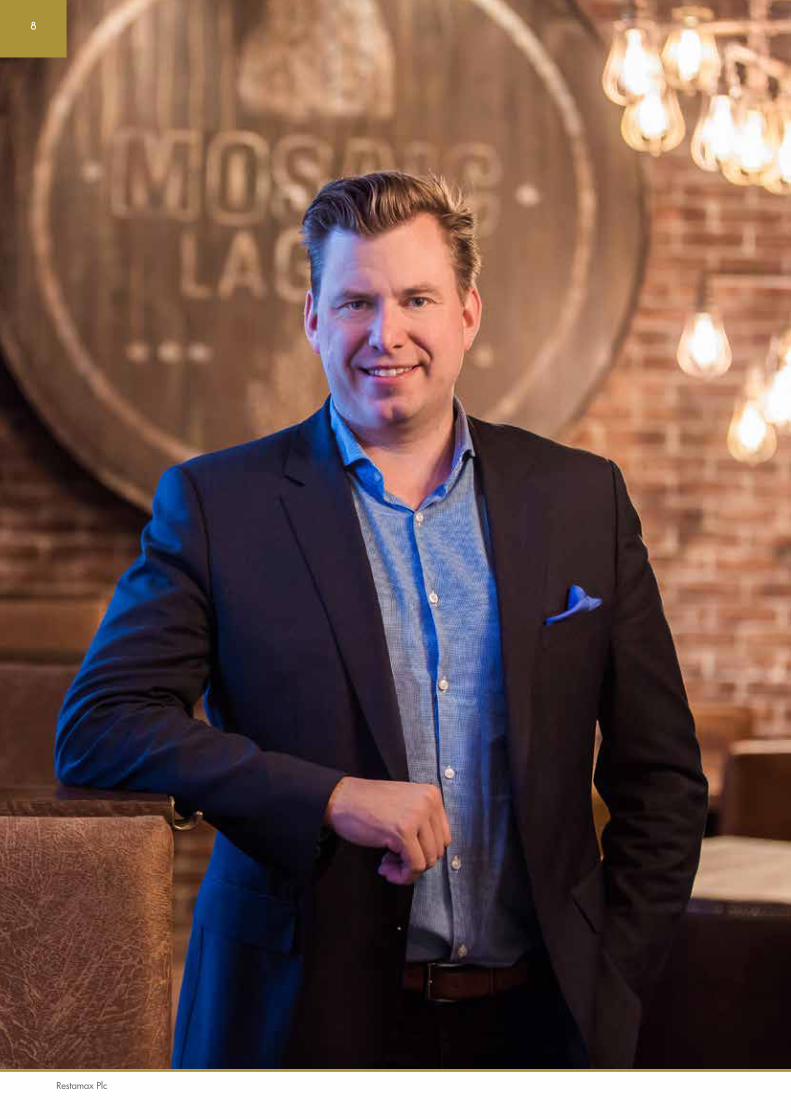
Restamax’s goal is to reach a turnover of approximately MEUR 400 by the end of 2020 after internal elimina-tions. The goal of the restaurant segment is to reach a turnover of approximately MEUR 200, and the goal of the labour hire segment is to reach a turnover of approximately MEUR 220, by the end of 2020.

Annual Report 2017
23

Restamax Plc
24
HISTORIC GROWTH OF TURNOVER (MEUR) AND DEVELOPMENT OF EBITDA %
NOTE: The figures for 2006−2010 are for the Mr Max Group.The current Restamax was born in 2010 as a result of a corporate transaction, and 2011 was the first full financial period.
The company’s annual EBITDA margin has been circa 10-20% throughout the review period
2006-2010 Mr Max Group 2011-2017 Restamax Group
65.0
8.6
15.9
27.731.3
34.2
47.3
60.8
KEY FIGURES – SUMMARY
Turnover, MEUR
Growth of turnover, CAGR
EBITDA %
Annual Report 2017
25
HISTORIC GROWTH OF TURNOVER (MEUR) AND DEVELOPMENT OF EBITDA %
130.1
86.7
113.6
185.9
2017 (IFRS)
12,1%
approx. 240
2018 (IFRS) 2019 (IFRS) 2020 (IFRS)
14.9%14.6%
approx. 400

Restamax Plc
26
KEY FIGURES (IFRS)
The labour hire business was incorporated into the Group in August 2014.The figures on the next page given in accordance with the new segment structure.
TEUR 2012 2013 2014 2015 2016 2017
Turnover 60 773 65 033 86 653 113 618 130 072 185 856
Annual growth, % 28,5 % 7,0 % 33,2 % 31,3 % 14,5 % 42,9 %
EBITDA 9 939 9 146 12 008 16 536 19 399 22 404
EBITDA, % 16,4 % 14,1 % 13,9 % 14,6 % 14,9 % 12,1 %
Operating profit 5 719 4 051 5 265 7 266 8 998 10 767
Operatingprofit,% 9,4% 6,2 % 6,1 % 6,4 % 6,9 % 5,8 %
Profit for the financial period 3 788 2 908 3 334 4 809 5 964 5 492
To shareholders of the parent company 3 076 2 565 3 451 5 050 5 608 5 058
To minority shareholders 712 344 -117 -241 256 434
Interest-bearing net liabilities 5 982 6 184 18 944 29 313 30 377 43 649
Gearing ratio 43,8 % 21,9 % 48,1 % 73,2 % 69,1 % 93,1 %
Equity ratio 38,1 % 60,9 % 47,2 % 44,4 % 45,2 % 35,3 %
Return on investment, % 24,2 % 10,7 % 10,5 % 10,8 % 11,9 % 10,7 %
Number of restaurants, net change 10 0 32 11 9 20
KEY FIGURES PER SEGMENT (IFRS)

Annual Report 2017
27
KEY FIGURES
Staff expenses, % 85,2 % 85,5 % 83,7 %
LABOUR HIRE OPERATIONS
(EUR thousand) 1–12/15 1-12/16 1-12/17
Turnover 24 151 34 129 75 612
EBITDA 2 161 3 441 6 603
EBITDA, % 8,9 % 10,1 % 8,7 %
Operating profit 775 1 597 3 834
Operating profit, % 3,2 % 4,7 % 5,1 %
RESTAURANT OPERATIONS(EUR thousand) 1-12/15 1-12/16 1-12/17
Turnover 100 315 107 544 122 174
EBITDA 14 801 16 475 16 325
EBITDA, % 14,8 % 15,3 % 13,4 %
Operating profit 6 492 7 401 6 920
Operating profit, % 6,5 % 6,9 % 5,7 %
KEY FIGURES
Material margin, % 74,3 % 74,6 % 74,1 %
Staff expenses, % 28,5 % 28,1 % 28,0 %
KEY FIGURES PER SEGMENT (IFRS)

Restamax Plc
28
DIVIDEND HISTORY
DIVIDEND On 31 December 2017, Restamax Plc’s distributable assets were EUR 54,569,557.59, of which the share from the profit for the financial period is EUR 6,529,099.62. There have been no significant changes to the company’s financial situation since the end of the financial period.
Restamax Plc’s Board of Directors proposes to the Annual General Meeting to be held on 25 April 2018 that EUR 0.33 (EUR 0.30) per share, a total of EUR 5,484,474.60 (16,619,620 shares), be paid as dividend for the financial period ended on 31 December 2017 based on the adopted balance sheet.
Paid on
8 May 2014Paid on
7 May 2015Paid on
9 May 2016Paid on
10 May 2017
Board of Directors’proposal
9 May 2018
0.09
0.22
0.270.30
0.33
2013
2014
20152016
2017Amount of dividends, EUR

Annual Report 2017
29

Restamax Plc
30
At the end of 2017, Restamax updated its strategy and financial goals for the 2018–2020 strategy period.
In the restaurant segment, the cornerstone of the strategy is profitable growth in growth centres organically, through new establishments, and via corporate acquisitions. The productivity of the existing business will be improved by investing in customer service, company sales, marketing and the commitment of personnel. Cost efficiency will continue to play a key role in executive management. Restamax’s goal is to expand its restau-rant business abroad during 2018.
In the labour hire segment, the strategic cornerstones are the acquisition of new customers, the continued development of existing business and profitable growth through corporate acquisitions. New service models will be developed in accordance with the growing and diversifying staffing needs of different customer groups. Another strategic focus is investment in the availability of labour with different cooperative parties.
Restamax’s goal is to reach a turnover of approximately MEUR 400 by the end of 2020 after internal elimina-tions.
The goal of the restaurant segment is to reach a turnover of approximately MEUR 200, and the goal of the labour hire segment is to reach a turnover of approximately MEUR 220, by the end of 2020.
The Group’s goal is to keep EBITDA at a good level that is better than the average of the sector in both segments.
Efforts will be made to improve operating profit margin in both segments.
The company will endeavour to increase dividend payments every year.
STRATEGY
PREVIOUS STRATEGIC GOALS MET
Strategy period 2013–2015
The company’s long-term goal was to reach a turnover of MEUR 100 by the end of 2015. The 2015 turnover was MEUR 113.6.
Strategy period 2016–2018
The company’s long-term goal was to reach a turnover of MEUR 180 by the end of 2018. The goal was reached already in 2017. The turnover in 2017 was MEUR 185.9.

Annual Report 2017
31
STRATEGIC GOALS FOR
2018–2020
INTERNATIONALISATION:EXPANSION TO NORTHERN EUROPE
RESTAURANT SEGMENT TURNOVER ABOUT MEUR 200
GROUP TURNOVER ABOUT MEUR 400
LABOUR HIRE SEGMENT TURNOVER ABOUT MEUR 220
GREATER FOCUS ON SALES, MARKETING AND MARKET KNOWLEDGE
INVESTMENT IN CUSTOMER AND EMPLOYEE SATISFACTION
CUSTOMER SATISFACTIONAVERAGE PURCHASECUSTOMER FLOW
EXPERIENTIAL RESTAURANT SERVICES IN ALL BUSINESS UNITS

Restamax Plc
32
CORNERSTONES OF RESTAMAX’S GROWTH STRATEGY
THE COMPANY SEEKS PROFITABLE GROWTH IN FINLAND’S LARGEST CITIES AND SKI RESORTS.
THE COMPANY SEEKS ORGANIC GROWTH BY OPENING NEW RESTAURANTS AND DEVELOPING CONCEPTS. Profitable concepts are duplicated and old/unproductive concepts are either renewed or sold.
CORPORATE ACQUISITIONS ARE A KEY PART OF THE GROWTH STRATEGY. Constant restaurant surveying. Corporate acquisitions are used to seek new business in both segments.
OUR GOAL IS TO EXPAND OUR RESTAURANT OPERATIONS ABROAD. We seek growth by expanding abroad, both through company acquisitions and organically.
AT ITS BEST, THE COMPANY OFFERS AN ENTIRE CHAIN OF EXPERIENCES FOR ALL TARGET GROUPS. At best, one city has several Restamax cafés, restaurants, nightclubs, pubs and gaming restaurants.
1
2
3
4
5

Annual Report 2017
33
VISION
WE CREATE INTERESTING NEW RESTAURANTS AND CONCEPTS FOR ALL TARGET GROUPS.
RESTAMAX’S MISSION, VALUES AND VISION
MISSION
VALUESOUR OPERATIONS AND DECISIONS ARE STEERED BY OUR ENTREPRE-NEURIAL APPROACH, PROFITABLE GROWTH, QUICKNESS, QUALITY, COURAGE AND PASSION.
WE CONTINUE OUR GROWTH AS FINLAND’S BIGGEST COMPANY PROVIDING HIGH QUALITY RESTAURANT EXPERIENCES. OUR COMPANY HAS THE BEST RESTAURANTS FOR ITS TARGET GROUPS IN FINLAND’S BIGGEST CITIES.

Restamax Plc
34
Bright outlook in the restaurant field
The outlook of the restaurant field has continued its positive development. 2017 started off with growth for restaurants licenced to serve alcohol, but the chilly summer halted it. However, the situation improved towards the end of the year, culminating in the Christ-mas party season. The turnover of the tourism and restaurant segment increased by 6.5 per cent in 2017. The positive change in turnover in the segment has continually increased in recent years: in 2014, turnover only increased by 0.8 per cent, in 2015 by 3.1 per cent and in 2016 by 4.9 per cent.
Growth was driven by fast food restaurants; their turnover increased by 8.2 per cent. It is noteworthy that the turnover of staff restaurants, which decreased by 2.5 per cent in 2016, turned positive in 2017 with a growth of 2.1 per cent.
At Restamax, the popularity of quick quality food reflected on the opening of several new restaurants in 2017: we opened Classic American Diners in Rovaniemi and Helsinki, a Colorado Bar & Grill in Tampere, a Colo-rado Express in Ruka, a Thai Papaya in Lempäälä’s Idea-park shopping centre, a Villisika in Ruka and a BeefKing in Tampere, to name some.
The increased demand for food delivery services is also linked to the combination of hectic everyday life and restaurant experiences. Restamax has worked in active cooperation with Wolt and Foodora for three years now. At many of our restaurants, such as in hamburger and chicken wings concepts, the use of delivery services multiplied in 2017.
The increase in the turnover of restaurants in Finland reflects on consumers’ general positive attitude to the economic situation. According to the confidence indi-cator, consumer confidence strengthened towards the end of the year and, in January 2018, rose to the high-est on record. All in all, the economy strengthened in autumn 2017. According to the latest preliminary infor-mation, Finland’s GDP grew by 2.7 per cent in 2017.
The turnover of accommodation businesses increased by 9.7 per cent in 2017, which also reflects on the increased demand for restaurant services. Foreign trav-ellers spent EUR 2.6 billion in Finland in 2017, which is almost EUR 0.5 billion more than the previous year. The greatest increase was in Chinese and Russian travel-lers. Foreign tourism has huge potential in the Finnish restaurant field.
Alcohol Act amendment boosting the field
As a whole, the Alcohol Act amendment, which entered into force in March 2018, allows restaurants to sell takeaway alcohol in addition to takeaway food. The amendment also brought another type of energy to the field by permitting longer opening and alcohol-service hours and relaxing the strict regulations on alcohol marketing by restaurants, for example permit-ting happy hour marketing. The amendment will play a significant role in the development of the entire segment, and our numerous restaurants have already started to take advantage of it.
Labour hire among the most strongly growing fields in Finland
The staffing services field is a strong growth indus-try of the future. Staffing services facilitate flexible and diverse employment contracts from both the employer’s and the employee’s viewpoint. The field is especially popular among young adults due to its quick ability to react. In 2017, labour hire was one of the most strongly growing fields in Finland.
The combined turnover of the 20 largest labour hire companies in Finland in 2017 was EUR 1.281 billion, a growth of approximately 18 per cent from the previ-ous year. Looking at the entire segment, the TOP 20 operators represent approximately one-half of the segment’s total turnover. Staffing services grew rapidly in the first half of the year. In the latter half, monthly growth halted, though turnover stabilised at a high level. Furthermore, looking at the 20 largest staffing services companies, over 80 per cent of their turnover comes from labour hire services. Their combined 2017 turnover amounted to EUR 1.077 billion. This means a growth of approximately 22 per cent from the previous year. The growth of Smile Henkilöstöpalvelut increased further in 2017, clearly exceeding the general growth in the field.
Sources: Finnish Hospitality Association (MaRa), Confedera-
tion of Finnish Industries (EK), Private Employment Agencies’
Association (HPL), Visit Finland Visitor Survey 2017 (Tutki-
mus- ja Analysointikeskus TAK Oy), Statistics Finland
MARKET SITUATION

Annual Report 2017
35

KEY EVENTS IN 2017JANUARY
The acquisition of Thai PapayaRestamax bought a majority holding in the Thai Papaya restaurants and opened a restaurant based on this concept at Ideapark in Lempäälä in March. The other Thai Papaya restaurants are located in Helsinki in Kallio, Herttoniemi and Hernesaaren Ranta.
Foodpark, Ideapark LempääläThe restaurant selection at the Ideapark shopping centre in Lempäälä was transformed during reno-vation. After the change, Coyote Bar & Grill, Sticky Wingers, Bella Roma, Daddy’s Diner, BeefKing and Daddy’s Gelato have operated in the Foodpark.
FEBRUARY
Hernesaaren Ranta, HelsinkiWith a contract of sale dated 27 January 2017, Restamax increased its 60 per cent ownership in Hernesaaren Ranta Oy to 80 per cent. Ownership of the shares was transferred to Restamax on 1 February 2017. The minority shareholder in Hernesaaren Ranta Oy is Seppo Koskinen.
The establishment of Rivermax Oy with KoskiravintolatIn February 2017, Restamax established a joint limited company, Rivermax Oy, together with Koskiravintolat Oy. The joint venture started operating the Tampere restaurants Poro (formerly Hullu Poro), Jackie Brown, Jackie Brown Gold, Restaurant von Nottbeck in Näsilinna and the summer restaurants Little Joe and Laituri and, in Pori, the Café Europa and Kirjuri summer restaurant.
BeefKing, LielahtiOn 11 February 2017, restaurant BeefKing, a second restaurant with the concept, replaced Chicago Food-park in Lielahti
Max-Siivouspalvelut Oy, sale of shareholdingRestamax sold its 70 per cent shareholding in Max-Siivouspalvelut Oy in February. Max-Siivouspalvelut Oy is a cleaning service company established in 2008 specialising in the cleaning of offices, restaurants and commercial premises.
MARCH
Yo-talo, TampereRestamax purchased the legendary Yo-talo venue in Tampere with a deed of sale dated 17 February 2017. The right of ownership and management was transferred to the company on 15 March 2017.
Gloria, JoensuuThe Joensuu-based nightclub Gloria was taken over by Restamax subsidiary Northmax Oy on 1 March 2017. The nightclub Viihdemaailma Ilona in Joensuu, which is part of Restamax’s restaurant portfolio, was also taken over by the company. Northmax Oy already owns Viihdemaailma Ilona in Oulu.
Run Out, TampereFinland’s first escape room game licensed to sell alcohol was opened on the premises of the Crazy Golf amusement centre (now Crazy amusement centre) in Tampere in March 2017.
Skohan, HelsinkiIn March 2017, Restamax opened the new Skohan nightclub on the premises of Namu and Club Show-room together with rap artist Jare Tiihonen and event producer Kalle Kallonen.
APRIL
Tillikka Oy, TampereIn March 2017, Rivermax Oy purchased a majority holding in the traditional restaurant complex Tillikka in Tampere. The ownership was transferred to the Group on 1 April 2017. Tommi Aaltonen became the CEO of Tillikka Oy and continued as a shareholder in the company.
Smile Henkilöstöpalvelut purchased Pasianssi OyRestamax Plc’s subsidiary Smile Henkilöstöpalvelut Oy, bought the entire shareholding of Pasianssi Oy (Banssi Henkilöstöpalvelut) with a deed of sale dated 5 April 2017. Founded in 2013, Banssi Henkilöstö-palvelut is a recruitment and labour hire service company.
Ruoveden Rantaravintola and Muroleen Kesäkahvila, RuovesiIn April 2017, Restamax subsidiary Somax Oy acquired the business operations of Ruoveden Rantaravintola and Muroleen Kesäkahvila. The acquisition encom-passed the buildings of the seasonal restaurants and the site of Muroleen Kesäkahvila.
Restamax Plc
36

Annual Report 2017
37
Decisions of the annual general meeting 2017
Restamax Plc’s Annual General Meeting was held on 26 April 2017 in Tampere.
DividendThe meeting decided that, based on the balance sheet confirmed for the financial period that ended on 31 December 2016, a dividend of EUR 0.30 per share will be paid. The balancing date of the dividend was 28 April 2017, and the payment date was 10 May 2017.
Board of DirectorsThe meeting decided that the number of members of the Board of Directors will be six (6). As members of the Board, the meeting re-elected all present members of the Board, Timo Laine, Petri Olkinuora, Mikko Aartio, Jarmo Viitala, Mika Niemi and Timo Everi, to serve until the end of the next Annual General Meeting. The meet-ing elected Timo Laine as Chairman of the Board and Petri Olkinuora as Vice-Chairman.
The Annual General Meeting decided that the payment of remuneration and travel expense reimbursements to the members of the Board of Directors would be as follows until the following Annual General Meeting: annual remuneration to the Chairman of the Board will be EUR 25,000, to the Vice-Chairman EUR 20,000 and to other members EUR 10,000. Separate attendance allow-ances are not paid. Travel expenses will be reimbursed in accordance with the Company’s travel rules.
AuditorThe Annual General Meeting reselected as audi-tor Deloitte & Touche Oy, a firm of authorised public accountants, until the end of the next Annual General Meeting. Hannu Mattila, APA, will act as the Company’s responsible auditor. In accordance with the Board’s proposal, the meeting decided that the auditor’s remu-neration will be paid based on a reasonable invoice approved by the Company.
Authorisation to purchase the Company’s own sharesThe Annual General Meeting decided to authorise the Board to decide on using the Company’s unre-stricted equity to purchase no more than 800,000 of the Company’s own shares in one or several tranches, taking into account the stipulations of the Limited Liability Companies Act regarding the maximum number of shares in possession of the Company and under the following terms:
The company’s own shares shall be purchased with the funds from the company’s unrestricted equity, decreas-ing the distributable profits of the company. The shares shall be purchased in trading on the regulated market in the Helsinki Stock Exchange, and therefore the purchase takes place by private placing and not in relation to the shares owned by the shareholders. The sum paid for the shares is the price announced on the acquisition day for Restamax Plc’s shares on the regulated market on the stock list of Helsinki Stock Exchange. The shares are purchased in trading organised by Nasdaq Helsinki Oy
in accordance with its rules and regulations. The shares can be purchased for financing or carrying out possible corporate acquisitions or other arrangements, to imple-ment incentive schemes within the company, or for other purposes decided upon by the Board of Directors. The maximum amount of the shares to be purchased is equivalent to approximately 4.8% of all the shares and votes of the company calculated using the share count on the publication date of the notice of the Annual General Meeting, so the purchase of the shares does not have a significant influence on the share ownership and the distribution of voting rights in the company.
The Board of Directors shall decide on the other matters related to the purchase of the company’s own shares.
The authorisation will expire at the end of the 2018 Annual General Meeting, however no later than 18 months of the Annual General Meeting’s authorisation decision.
Authorisation to decide on share issueThe meeting decided, as proposed by the Board of Directors, to authorise the Board of Directors to decide on a share issue under the following terms:
With this authorisation, the Board may decide to issue a maximum of 1,500,000 new shares, and to transfer no more than 800,000 of the company’s own shares held by the company (“Share Issue Authorisation”).
The new shares can be issued and the company’s own shares held by it can be assigned in one or more instal-ments, either with or without payment. The new shares can be issued and the company’s own shares held by it can be assigned to company shareholders in propor-tion to the company shares that they already own or, deviating from the shareholders’ pre-emptive right, in a special share issue if, from the company’s perspective, there is a justified financial reason for it, such as the financing or implementation of corporate acquisitions or other arrangements, development of the company’s equity structure, improvement of share liquidity or the implementation of company incentive schemes. The issue of new shares or transfer of the company’s own shares held by the company can also take place against apport property or by using a claim for the company held by the subscriber to redeem the amount to be paid for the issue price or the price to be paid for the shares. A special issue may only be arranged without payment if a justified financial reason exists in terms of the over-all benefit of the company and all of its shareholders.
The Board of Directors was authorised to decide on the other matters related to share issues.
The Share Issue Authorisation will expire at the end of the Annual General Meeting of 2018, however no later than 18 months from the Annual General Meeting’s Share Issue Authorisation decision.

Restamax Plc
38
MAY
Ale Pub Telakka, TurkuIn May 2017, Restamax opened the Ale Pub Telakka bar on Eerikinkatu in Turku.
Jarno Suominen appointed as temporary CEOAs of 22 May 2017, CFO Jarno Suominen was appointed as the temporary CEO of Restamax. The former CEO, Markku Virtanen, left Restamax on 30 June 2017.
JUNE
Juha Helminen steps in as the new CEOOn 6 June 2017, Restamax announced that Juha Helminen will assume the position of the Group's new CEO on 1 September 2017. Among other posts, Helminen has worked in Denmark in the Carlsberg Group as Vice President, Group Strategy 2015–2017, as Vice President, On-Trade Sales for Carlsberg’s Finn-ish subsidiary 2012–2015, as Vice President, Business Development, Northern Europe for Carlsberg Group 2008–2012, and as Financial Controller of Carlsberg Sweden 2002–2003.
Pub Harry’s, JyväskyläIn June 2017, Restamax Plc purchased a majority holding in Harry’s Ravintolat Oy. The company oper-ates the 2012 founded Pub Harry’s in Jyväskylä, which focuses on fostering English pub culture.
Ranta, TampereIn June 2017, the new Ranta restaurant entity was opened in the Ratinanniemi lakeside area in Tampere. The 1,200-seat restaurant features one of the largest summer terraces in the city as well as a nightclub.
Hook, TurkuIn June 2017, a Hook wings restaurant, whose branches in Tampere and Helsinki have been wildly popular, opened in Turku.
Colorado Bar & Grill, HelsinkiA Colorado Bar & Grill restaurant was opened by the Rautatientori square in Helsinki in June 2017. The restaurant is partially owned by film producer Markus Selin through Mikonkadun Keidas Oy.
JULY
Smile Henkilöstöpalvelut purchased Job Services One OySmile Henkilöstöpalvelut purchased the business operations of Job Services One Oy on 1 July 2017. This strengthened Smile’s market position in the regions of Pirkanmaa and Southwest Finland, especially in the fields of industry and construction.
Säm Asian Bar & Kitchen and Masu Asian Bistro, HelsinkiAt the turn of July and August 2017, Gastromax, the joint venture of Restamax and restaurateur Hans Välimäki, opened a three-storey restaurant complex for dining and socialising on Eteläesplanadi in Helsinki with a concept that draws heavily from Asian flavours. In addition to Säm and Masu, the premises hold a catering service.
SEPTEMBER
Changes in the Executive TeamTero Kaikkonen was appointed as Restamax’s Devel-opment Director and member of the Executive Team as of 1 September 2017 Kaikkonen has worked as Product Line Director for Restamax’s food restaurants since 2013, his area of responsibility focusing on diner restaurant operations and their development.
Yo-talo and Bar Pankki, TampereTampere’s iconic culture venue and multi-purpose building Yo-talo and its Bar Pankki were renovated and opened fully refurbished at the beginning of September 2017.
Bella Roma, LappeenrantaAt the end of September 2017, the restaurant selection at Shopping Centre IsoKristiina in Lappeenranta was transformed with the opening of Bella Roma, which specialises in Italian food. A large play area was also built adjacent to the restaurant.
OCTOBER
Restamax was selected as the restaurant services provider for the Central Deck and Arena project.On 3 October 2017, SRV announced that it had chosen

Annual Report 2017
39
Restamax to take charge of the restaurant services at the Central Deck and Arena planned for Tampere. The arena’s restaurant concepts will be designed for diverse customer segments.
Guru’s Kitchen & Bar, TampereGuru’s Kitchen & Bar, which is based on Mediterra-nean and Middle Eastern cuisine, opened its doors on 6 October 2017 in Tampere. As its name suggests, the restaurant offers not only food but also an evening programme.
Colorado Bar & Grill, TampereColorado Bar & Grill, which already operates in Helsinki, Ruka, Levi and Pyhä, also opened in Tampere on 20 October 2017.
Classic American Diner and Wayne’s Coffee, Easton HelsinkiOn 26 October 2017, Classic American Diner and fran-chising café Wayne’s Coffee opened their doors at the new Easton shopping centre in Eastern Helsinki.
Stefan’s Steakhouse and Teatro, VaasaRestamax expanded its market area to Vaasa by opening Stefan’s Steakhouse on 26 October 2017 and nightclub Teatro on 3 November 2017.
Hunaja nightclub, LappeenrantaRestamax opened the new Hunaja nightclub on Snellmaninkatu in Lappeenranta at the end of October 2017.
Purpur, TampereAt the turn of October and November 2017, Restamax and Ville Haapasalo’s joint venture Purmax Oy opened the Georgian restaurant Purpur in Tampere. There is already a Purpur restaurant operating in Helsinki.
NOVEMBER
Smile Henkilöstöpalvelut acquired the restaurant labour hire operations of Active PeopleOn 25 October 2017, Smile Services Oy, part of Smile Henkilöstöpalvelut, acquired the restaurant labour hire business operations of Active People Oy. The acquisition increased Smile’s foothold in the Helsinki
Metropolitan Area and strengthened its expertise in restaurant labour hire. The transaction was executed on 1 November 2017.
Stefan’s Steakhouse, LeviOn 8 November 2017, the seventh restaurant under the Stefan’s Steakhouse concept opened for the winter season in Levi.
Villisika, RukaIn November 2017, Restamax opened a Villisika restaurant at the Ruka ski resort. The first Villisika restaurant has operated in Tampere since 2011.
DECEMBER
Colorado Express, RukaIn December 2017, a Colorado Express restaurant, a sister restaurant of Colorado Bar & Grill, opened at the Ruka ski resort to serve quick but high-quality American meals and snacks.
Pyynikin Brewhouse, TampereIn December, Restamax and Pyynikin Craft Brewery opened the Pyynikin Brewhouse brewery restaurant, which is a modern combination of a brewhouse and a bistro. The selection covers all products of the Pyyni-kin Craft Brewery, and celebrity chef, Hans Välimäki, is in charge of the food menu.
Classic American Diner, RovaniemiAt the end of the year, Restamax opened a new restaurant in Rovaniemi under the Classic American Diner concept. There are eight existing restaurants under this concept in Tampere, Jyväskylä, Helsinki, Vantaa and Seinäjoki.
Restamax published new long-term financial goals and strategyOn 19 December 2017, Restamax announced the Group’s new long-term financial goals and strategy for the 2018–2020 strategy period. Restamax’s goal is to reach a turnover of approximately MEUR 400 by the end of 2020.

Restamax Plc
40
EVENTS AND PROJECTS IN 2018Organisational change On 22 January 2018, Restamax announced plans to revamp its organisation and the structure of its Executive Team. Restamax’s operational organisa-tion was divided into three business units: Nightclubs, Food restaurants, and Pubs & Entertainment, each with their own responsible director. The position of Chief Procurement Officer (CPO) was established to strengthen purchasing operations and the efficiency thereof. The roles of sales and marketing strat-egy were increased in the organisation and, for that purpose, the position of Chief Commercial Officer (CCO) will be established.
The acquisition of Kymppi Service Oy, Smile HenkilöstöpalvelutIn February 2018, Smile Henkilöstöpalvelut acquired the entire shareholding of Kymppi Service Oy, which operates in Southwest Finland, Satakunta and Kainuu. As a result of the corporate acquisition, Smile’s foothold as a national operator was strengthened, particularly in the sectors of industry, construction and logistics.
Mango Discobar, Oulu In February 2018, a new Mango Discobar nightclub was opened in Oulu.
Opening of adventure rooms, Tampere and SeinäjokiRestamax subsidiary Poolmax Oy opened several new adventure rooms. In February 2018, a Vihahuone rage room was opened at Crazy amusement centre in Tampere, and two Run Out escape rooms were opened in Seinäjoki. In March, the first known pitch black escape room in Finland, Dark Room: Ihmiskoe (“Human Experiment”), was opened at Crazy amuse-ment centre in Tampere.
Smile’s listing evaluationIn March 2018, Restamax communicated that the Board of Directors decided to review and evaluate the listing of the labour hire business comprising the subsidiary Smile Henkilöstöpalvelut Oy and its subgroup on the Nasdaq Helsinki Ltd Stock Exchange. The evaluation process will be carried out during spring 2018.
The acquisition of a majority shareholding in Adicio OyIn March, Smile Henkilöstöpalvelut bought a major-ity stake (80%) of construction-sector hired labour company Adicio Oy specialising in foreign manpower. A nationwide operator, Adicio has commercialised the import of foreign labour into Finland, all the way from the work permit application procedure to accommoda-tion and support services to facilitate living in Finland. The purchase price was MEUR 6, and ownership was transferred on 3 April 2018. Based on preliminary information, Adicio’s turnover at the end of 2017 was MEUR 8.772 and operating profit MEUR 1.692.
Expanding restaurant operations abroadIn March 2018, Restamax announced an expansion of its restaurant operations to Denmark. In Denmark, Restamax will operate through its subsidiary Restamax Operations Denmark. The company purchased over 90 per cent of the popular Danish Cock’s & Cows and The Bird companies, which operate a total of 11 restaurants and bars in Copenhagen. During summer 2018, both restaurant concepts will open new restaurants in prime locations at the Copenhagen international airport. Classic American Diner, TurkuRestamax will open its eleventh Classic American Diner restaurant in Turku in spring 2018.
Gaming restaurant, OuluRestamax subsidiary Poolmax will open a new gaming restaurant for adults in Oulu in 2018.
The acquisition of Royal RavintolatIn April 2018, Restamax announced its intention to purchase the entire shareholding of RR Holding Oy (Royal Ravintolat). The implementation of the deal is conditional on a share issue decision by Restamax’s General Meeting and on the organising of financing for the cash purchase price. Royal Ravintolat's best-known brands include Hanko Sushi, Pizzarium, Savoy, Löyly, Ravintola Palace and Ravintola Teatteri. The transaction will create one of the largest restaurant groups in the Nordic countries listed on the Helsinki Stock Exchange. The integration will be carried out in late 2018 and early 2019.

Annual Report 2017
41

Restamax Plc
42
NUMBER OF EMPLOYEES Restaurant business: In the period 1 January–31 December 2017, the restaurant operations of the Restamax Group employed on average 361 (270) full-time employees and 143 (110) part-time employees converted into full-time employees as well as 295 (271) rented employees converted into full-time employees.
Labour hire business: In 1 January–31 December 2017, Restamax Group’s labour hire business employed on average 116 (0) full-time and 1,641 (750) part-time employees converted into full-time employees.

Annual Report 2017
43
PERSONNELWe employ some 2,250 people on a monthly basis (converted into full-time workers), making us one of the biggest employers in the restaurant field in Finland. Our subsidiary Smile Henkilöstöpalvelut Oy helps us ensure the sufficient availability of skilled personnel now and in the future. Smile Henkilöstö-palvelut Oy employs some 9,000 people on a monthly basis in the fields of HoReCa, construction, industry, logistics, events and health care.
Restamax has solid competence in the restaurant business and also plenty of experience in part-time employment relationships that are typical in the industry. Professional, healthy and motivated staff are an essential resource. We aim to offer our employees opportunities to work flexibly at different locations and cities and to develop their skills and advance their careers according to their personal goals. We very much want to support employment by offering our employees flexible employment contracts and diverse, long-term career opportunities. We systematically invest in the well-being and competence development of our personnel, and good deeds are rewarded.
Our restaurant portfolio comprises over 130 restau-rants all over Finland. Our wide range of restaurants makes it possible for employees to keep working in the Group even if they move to a different city. Similarly, extra hours and many job opportunities at different restaurants in the same city can be arranged smoothly. This makes our operations more efficient and also enables us to offer full-time jobs to many of our employees. It is also possible to work for us in different localities depending on the season. One of the most important drivers of our profitability is the efficient use and allocation of human resources.
With our internationalisation, we will also be able to offer our personnel career opportunities abroad in the future.
We are very motivated to train our personnel and develop their skills. We strive to minimise employee turnover and offer employees opportunities for longer career development in the restaurant field, from customer service all the way to demanding executive positions. One significant demonstration of this is the Restamax Academy, which offers restaurant staff working in the Group opportunities to improve them-selves as professionals while working. The training programmes and study modules of Restamax Academy started in 2015. At the begin-ning of 2017, Restamax Academy started offering new supervisory training in cooperation with Tampere Vocational College Tredu. In spring 2018, 20 students will graduate with a HoReCa supervisor’s specialist vocational qualification. The results of the Academy’s training programmes have been rather positive, and a new training programme will start in late 2018. At the end of 2017, Smile established Smile Educa-tion Oy, which provides training services, in particu-lar focusing on producing training and recruitment services in cooperation with educational institutes. The goal of Smile Edu is to make it easier for employ-ees to find suitable job and training places, and to improve the availability of workforce.
Restamax Plc
44
ACTIONS TAKEN IN 2017:
- Restamax Academy training collaboration was carried out with Tampere Vocational College. Twenty students were selected for a HoReCa supervisor’s specialist vocational qualification. The training programme, which is aimed at Group employees with vocational upper secondary education and training in the field as well as diverse work experi-ence, started in January 2017. The students will graduate from the training programme in May 2018. Most of the training took place at the workplace, supplemented with classroom learning at Tampere Vocational College (approxi-mately 17 classroom days).
- In 2017, preparations were also made for a new supervisor training programme, for which application opened in April 2018. A 40-credit supervisor training programme will start in autumn 2018.
- First-aid training, rescue drills and occupational health and safety training were organised actively.
- In order to improve sales, sales coaching and product training was organised for the staff of food restaurants, nightclubs, pubs and entertainment venues. The training was organised in cooperation with expert partners special-ising in sales and customer service training.
- Information flow and reporting tools were further developed, for example through the Intranet.
- Staff perks were expanded through new cooperation agreements. For example, through an agreement with CapMan Group, permanent kitchen and waitstaff gained access to a joint staff perk programme with many benefits as of 1 March 2017. Other cooperation agreements were signed with McDonald’s, Silmäasema, Glohair, Rukakeskus, M Room, and others.
- The partner network was also expanded in the sports sector. The well-being of employees was supported with sports vouchers in the restaurant and labour hire segments. In addition to offering sports vouchers, Smile Henkilöstöpalvelut supported its employees by providing an hour of work time per week for a sports hobby.
- An annual occupational well-being survey was conducted, and the results were analysed to plan goals and actions for 2018.
- Smile Henkilöstöpalvelut conducted an annual occupational well-being survey, and the results were used to define goals and actions for 2018.
- In 2017, Smile Henkilöstöpalvelut adopted the Motivire programme for improving personal well-being.
- Recreational evenings and events were organised at various cities and units. The well-being of personnel was also supported through various sports events, in 2017 with the Restamax Open tennis tournament, disc golf tournament and Shrovetide winter carnival, for example.
- There was active cooperation with occupational health care.
- Four issues of the Restamax Staff News staff magazine were published in 2017.
- Each year, Restamax selects and rewards Employees of the Year who have demonstrated exemplariness in their work. In 2017, eight expert employees of the Group were awarded the title of Employee of the Year. The best unit of the year 2017 was also selected. The Employees of the Year were awarded with a study trip abroad, and the Restaurant of the Year was rewarded with a study trip to Northern Finland. Furthermore, Restamax selects Star Employees three times a year and, in 2017, thirty-three were selected.
- In 2017, Smile Henkilöstöpalvelut developed orientation materials and manuals and also improved its premises and their comfort for employees.
- At the end of 2017, Smile Henkilöstöpalvelut established the Smile Education service aimed at improving the avail-ability of workforce.

Annual Report 2017
45

Restamax Plc
46
CORPORATE SOCIAL RESPONSIBILITY – RESPONSIBILITY IN ALL AREAS OF BUSINESSRestamax strives to observe the principles of sustain-able development in all of its activities and projects. Compliance with responsible operating principles and laws, and the transparency of reporting and admin-istrative principles, create a strong foundation for Restamax’s business operations.
Restamax sells alcoholic beverages, which is a strictly regulated, licensed trade, requiring special responsibil-ity. We conduct our restaurant and labour hire busi-ness in accordance with all legislation and regulations governing the serving of alcohol and food products and labour agreements as well as all other legal provisions.
FINANCIAL RESPONSIBILITY
Financial responsibility is comprised of ensuring prof-itable growth, competitiveness and efficiency now and in the future. Our customers play the most significant role there; the restaurant services they purchase make our business operations possible. Our company’s result is the basis for shareholder’s yield expectations, jobs, payment of taxes and supporting the community. Our result secures the economic well-being of the share-holders, personnel, partners and suppliers of goods and services.
SOCIAL RESPONSIBILITY
Occupational well-beingSocial responsibility means having good operating principles in relations with all stakeholders: personnel, customers and partners. The restaurant business is hectic and it is undergoing changes, which highlights the importance of a meaningful work environment and recreational activities. As an employer, we want to improve the well-being, health and coping at work of all of our employees and to strengthen employee
commitment in long employment relationships. Thanks to our comprehensive restaurant portfolio that extends to many parts of Finland and, in future, also abroad, we can offer our employees shifts flexibly according to varying life situations and needs.
We conduct annual occupational well-being surveys that are analysed unit-specifically. With new part-ners, we have also introduced more staff perks and discounts on products and services for our employees. The aim of the company’s occupational health and safety activities is to ensure a safe work environment and support and maintain the occupational capacity of our employees. Workplaces use the early intervention model aimed at anticipating problems and supporting the well-being of employees. Customer satisfaction and sector developmentOur daily activities are guided by customer orientation and offering experiences. Through regular customer satisfaction surveys and monitoring, we can serve our customers even better. We actively collect feed-back in our restaurants and analyse data. The needs and wishes of each customer segment are taken into account in restaurant selection and marketing.
We want to contribute to the positive development and responsible operating principles of the restaurant and labour hire field. For example, we have increased our cooperation with the popular food delivery services Wolt and Foodora. This supports us in business because we want to offer our customers more diverse and easier ways to fit restaurant experiences into their everyday lives.
Smile Henkilöstöpalvelut also brings a positive atti-tude to the job market and, in line with its name, the company strives to improve working life in Finland

Annual Report 2017
47
through joy and well-being and develop the entire labour hire sector. Smile’s values – professional pride, entrepreneurship, positivity and putting people first – are a pledge to look after young employees in particu-lar and coach them for the job market.
Social activityThe company cooperates with several significant social organisations. For example, we have been a part-ner of the Elä täysii! (“Live fully!”) club for people with disabilities, reduced mobility or chronic diseases since 2015, hosting various meetings at restaurants in different parts of Finland. In 2017, the coopera-tion deepened further, and in future meetings will be organised more frequently and regularly.
ECOLOGICAL RESPONSIBILITY
Energy-efficiency and self-control In all of our business operations, we consider envi-ronmental aspects and take ecological responsibility. We pay special attention to the energy consumption of our restaurants in all matters ranging from equipment procurement and the design of facilities, lighting, heating and air-conditioning. In our new restaurants, in particular, preference is given to energy-efficient LED lighting system and kitchen appliances and systems. We have also investigated possibilities of remote monitoring of cold storage facilities and elec-trification of other self-control activities, and piloted an application for monitoring wastage.
Quality control, procurement partners, recycling and wastageFood quality, its origin and traceability are the corner-stones of our restaurant operations and also important values to our customers. We cooperate with carefully selected and reliable partners and suppliers who have committed to responsible operations. Over 90 per cent of our food ingredient procurement is done through established partners, and with beverage wholesalers the figure is up to 95 per cent. We also prefer local businesses in procurement, such as local bakeries and microbreweries. This enables appropriate product pric-ing and careful quality control.
In our procurement, we emphasise domestic ingre-dients and take advantage of each season, although
some of our concepts necessitate imported products. Our international partners have also passed quality audits. Our poultry is mainly domestic, and our red meat comes from Finland or the EU. We are also going to increase and regularise our internal activities, such as customer service audits, through mystery shoppers for example.
Our units have efficient and monitored waste and wastage sorting and recycling. Waste sorting at each business location has been organised to be as envi-ronmentally efficient as possible. Oil, grease, glass, cardboard and biowaste are carefully separated, and the generation of mixed waste is minimised.
SMILE HENKILÖSTÖPALVELUT REFORMS FINNISH WORKING LIFE
As a large operator, our labour hire segment plays a significant role in society. Smile Henkilöstöpalvelut employs up to 9,000 people on a monthly basis in various fields. Our subsidiary acts responsibly, offer-ing diverse jobs for flexible life situations and always handling the payment of wages and other employer obligations on time.
Smile Henkilöstöpalvelut has campaigned for positive discourse: there are many good job opportunities and jobs available. The company has also actively high-lighted the responsibility of labour hire service provid-ers to adjust to the constantly changing and evolving working life.
In all its operations, Smile also considers environmen-tal and social responsibility. In 2017 for example, the company supported the exercise activities of children and young people at SOS Children’s Villages for the second time and participated in the Charity Run event.

Restamax Plc
48
– THE BIGGEST RESTAURANT IN FINLANDDigital marketing plays a key role at Restamax in creating future growth. Most of the food restaurants, pubs and nightclubs
of Restamax Group are included in the Ravintola.fi loyal customer system. The Ravintola.fi website features city-specific restaurant information, menus, events, campaigns, special offers, news, contact information and other important
information. Customers can also reserve tables and give feedback through the website.
Through the Ravintola.fi loyal customer system, Restamax can market its products and services in a targeted manner and strengthen customer commitment with permanent and one-time benefits. The system facilitates better customer service and increases interaction between the company and its customers.
Some 134,000 people have subscribed to the Ravintola.fi loyal customer system and downloaded the mobile application, and the number is growing quickly.
- The Ravintola.fi website has 10 million visitors per year
- The loyal customer card entitles to many benefits and special offers
- The downloadable mobile app brings the benefits directly to phones
- The All Access card gives VIP benefits for corporate customers
www.ravintola.fi
UNIFORM LOYAL CUSTOMER SYSTEM

THE RAVINTOLA.FI SALES SERVICE – PERSONAL SERVICE TO EACH CUSTOMERThe Ravintola.fi sales service is Restamax’s sales organisation responsible for customer events organised at restaurants, such as recreational days, meetings, seminars, product launches and various private parties from birthdays to weddings. This means that the customer can call one number for comprehensive service ranging from table reservations to organising large events all over Finland.
Our professional staff and quality restaurants in key locations help ensure an unforgettable event. Our sales service helps choose the right restaurant for every occasion from over 130 options and takes care of the prac-ticalities from planning to the finishing touches. Our team works in active cooperation with various partners, which enables us to organise many types of additional programming.
Our corporate sales are handled by Sales Director Kati Ehrola (pictured middle) and her energetic team of sales rep-resentatives, including Veera Virkorinne, Johanna Ahlgren, Daniela Mandelin, Marika Niskanen and Elisa Supperi.
Annual Report 2017
49

Restamax Plc
50
TIMO LAINE
Chairman of the Board
• Founder of Restamax
• Dependent on the company and on its major shareholder (Laine Capital Oy)
PETRI OLKINUORA Vice-Chairman
• Managing Director of Forbia Oy, Board member at several real estate and construction companies
• Independent member
MIKKO AARTIO Permanent Board member
• Founder of Restamax
• Dependent on the company and on its major shareholder (PIMU Capital Oy)
RESTAMAX BOARD OF DIRECTORS

Annual Report 2017
51
JARMO VIITALA Permanent Board member
• Chairman of the Board of Teräselementti Oy and Neontekniikka Oy, and a member of the Board of Koy Ideapark
• Independent member
MIKA NIEMI Permanent Board member
• CEO of Rengasravintolat Oy
• Dependent on the company and on its major shareholder
TIMO EVERI Permanent Board member
• Member of the Board of Directors of Hasan & Partners Oy
• Independent member

Restamax Plc
52

Annual Report 2017
53
EERO AHO
CPO since 2018
• Working for the company since 2014
JUHA HELMINEN
CEO since 2017
• Working for the company since 2017
PERTTU PESONEN
Development Director since 2012
• Working for the company since 2006
PAUL MELI
CBO, Nightclubs and Pubs & Entertainment since 2018
• Working for the company since 2008
TANJA VIRTANEN
Product Line Director, Premium concept restaurants since 2018
• Working for the company since 2005
MIKO HELANDER
Product Line Director, Youth nightclubs since 2018
• Working for the company since 2008
JARNO SUOMINEN
CFO since 2005
• Working for the company since 2005
TERO KAIKKONEN
CBO, Food restaurants since 2018
• Working for the company since 2011
RESTAMAX EXECUTIVE TEAM

Restamax Plc
54
SMILE BOARD OF DIRECTORS
SEPPO NIVAChairman of the Board of Directors• Director of Accountor Group
PASI ETELÄAHOPermanent Board member• Director of Smile Banssi Oy
PEKKA VIHMAPermanent Board member• CEO of Vanajanlinna Oy
JARNO SUOMINENPermanent Board member• CFO of Restamax Plc
TIMO LAINEPermanent Board member• Chairman of the Board and founder of Restamax Plc

Annual Report 2017
55
SMILE EXECUTIVE TEAMSAMI ASIKAINENCEO
JARNO VILPONENCFO
PASI MAJAKANGASDevelopment Director
MIRA JANTUNENHR and Administrative Director
JUSPE LAAKSOMarketing Director
JIMI HELINSector Director, HoReCa and Events
RIKU RAHIKAINENSector Director, Construction and Industry
KATRI ROSLUNDSector Director, Smile Doctors
MIKKO TÖRMÄSector Director, Training

Restamax Plc
56
The Corporate Governance Statement has been prepared in accordance with Chapter 7, Section 7 of the Finnish Securities Markets Act and the section on Corporate Governance in the Finnish Corporate Governance Code. The company complies with the Corporate Governance Code 2015, published by the Securities Market Associa-tion, with some exceptions. The Corporate Governance Code is publicly available, for example at the Securities Market Association website at www.cgfinland.fi.
This statement has been compiled as a separate report from the annual report of the Board of Directors. The statement will not be updated during the financial period, but up-to-date information of the topics included will be presented in the company’s website at www.restamax.fi.
ANNUAL GENERAL MEETING
The tasks of the Annual General Meeting as the highest decision-making body of the company have been deter-mined in the Limited Liability Companies Act and in the Articles of Association. At the Annual General Meeting, the shareholders exercise their decision-making power in matters related to the company. The Annual General Meeting is held within six months from the end of the fi-nancial period. The Board summons the Annual General Meeting and decides where and when it will be held. The Articles of Association state that the notice of the An-nual General Meeting is published for the shareholders’ information at least at the company’s website no earlier than three months and no later than three weeks prior to the Annual General Meeting. However, the notice must be published at least nine days before the record date of the Annual General Meeting.
The Annual General Meeting is attended by the CEO, the auditor, the Chairman of the Board of Directors and, when possible, the other members of the Board of Directors. In addition, the persons proposed for the first time as members of the Board of Directors shall participate in the Annual General Meeting, unless there are well founded reasons for their absence. The Annual General Meeting selects Restamax Plc’s Board of Direc-tors and the auditors, decides on their remuneration and discharges the company management from liability. Matters to be discussed at the Annual General Meeting as well as the shareholders’ right to participate are defined
in Restamax Plc’s Articles of Association and in the no-tice of the Annual General Meeting.
The Board of Directors summons an Extraordinary General Meeting when it considers it necessary or when required by the law.
BOARD OF DIRECTORS
The Board of Directors has general authority in all the company’s matters that have not been designated by law or the Articles of Association to be decided or implement-ed by other bodies. The Board of Directors is responsible for the company’s administration and the proper organi-sation of its operations. The Board of Directors confirms the company’s strategy, risk management principles and values observed in the company’s operations, approves its business plan and decides on significant investments.
The operations of the Board of Directors follow current legislation, guidelines issued by the stock exchange, other official regulations and the company’s Articles of As-sociation.
According to the Articles of Association, the Annual Gen-eral Meeting selects between five and seven members for Restamax Plc’s Board of Directors. The term of office of the members of the Board of Directors ends when the fol-lowing Annual General Meeting is concluded. The Board of Directors or Annual General Meeting elects the Chairman. In the composition of the Board of Directors, the goal is to appoint members with diverse and complimentary back-grounds, experience, expertise and from both genders, so that the diversity of the Board of Directors supports Restamax’s business and future in the best possible way. For the present, the company’s Board of Directors has not considered it necessary to establish audit, nomina-tion or remuneration committees, since it is not required by the scope of the company’s business operations or the discharge of duties of the Board of Directors.
Since 2005, the Chairman of the Board of Directors has been Timo Laine. The work of the Board of Directors is organised in accordance with the currently valid rules of procedure of the Board of Directors. The rules of proce-dure are available on the company’s website.
CORPORATE GOVERNANCE STATEMENT 2017

Annual Report 2017
57
SELECTION, TERM OF OFFICE AND COMPOSITION OF THE MEMBERS OF THE BOARD OF DIRECTORS
The Annual General Meeting selects the members of the Board of Directors annually. According to the Articles of Association, the Board of Directors consists of no less than five and no more than seven members. The term of office of the members of the Board of Directors ends when the following Annual General Meeting is con-cluded.
In addition to the Board members, meetings are at-tended by the CEO, CFO, the secretary of the Board and, when necessary, separately invited persons.
The Board of Directors evaluates the independence of its members annually and reports which Board members it defines as independent of the company and of signifi-cant shareholders.
In 2017, the members of the Board of Directors of the company were:
Timo Laine, b. 1966, diploma in marketing, Chairman of the Board Direct and controlling interest 4,698,844 shares
Mikko Aartio, b. 1969, vocational qualification in business and administration for upper-secondary school graduates Direct and controlling interest 3,560,163 shares
Jarmo Viitala, b. 1960, M. Sc. in Economy Direct and controlling interest 24,900 shares
Petri Olkinuora,b. 1957, M. Sc. (Tech.), MBA, Vice-Chairman of the Board Direct and controlling interest 12,500 shares
Mika Niemi, b. 1966, vocational qualification in business and administration Direct and controlling interest 2,236,789 shares
Timo Everi, b. 1963, BBA, eMBA Direct and controlling interest 0 shares
Jarmo Viitala, Petri Olkinuora and Timo Everi are the Board members independent of the company and of significant shareholders. The composition of Restamax’s Board of Directors deviates from the independence recommendation of the Corporate Governance Code, according to which the majority of the Board mem-bers shall be independent of the company and at least two of the persons representing this majority shall be independent of significant shareholders of the com-pany. Three members of the Board (Laine, Aartio and Niemi) are dependent on the company, which is why the composition of the Board of Directors does not meet Recommendation 10 of the Corporate Governance Code in this respect. This deviation is still justified by the Rengasravintolat corporate acquisition carried out in the
2014 financial period, and Mika Niemi served as the CEO of Rengasravintolat Oy.
During the financial period, the Board of Directors had seventeen (17) meetings. Some of the meetings were held by e-mail or telephone.
The attendance of the members of the Board at the 2017 meetings:
Timo Laine 17/17 Mikko Aartio 15/17 Jarmo Viitala 14/17 Petri Olkinuora 16/17 Mika Niemi 15/17 Timo Everi 15/17
The composition of the Board of Directors does not meet Recommendation 9 of the Finnish Corporate Govern-ance Code concerning diversity, in that both genders are not represented on the Board. However, the company’s objective is to include both genders in the composition of the Board of Directors.
REMUNERATION FOR THE MEMBERS OF THE BOARD OF DIRECTORS
The Annual General Meeting decides on the remunera-tion paid to the members of the Board of Directors. In 2017, the annual remuneration of the Chairman of the Board of Directors was €25,000, for the Vice-Chairman it was €20,000, and for the members of the Board €10,000. A separate meeting attendance allowance is not paid.
CEO AND THE EXECUTIVE TEAM
Restamax Plc’s Board of Directors appoints the CEO of the company, supervises his or her work and decides on the remuneration and benefits to be paid and the conditions of the post. The CEO is not a member of the Board of Directors. He or she is in charge of the parent company’s and the Group’s operative management and control in accordance with legislation and the guide-lines given by the Board of Directors.
Markku Virtanen served as the company’s CEO un-til 21 May 2017. CFO Jarno Suominen served as the acting CEO between 22 May 2017 and 31 August 2017. M.Sc. (Tech.) Juha Helminen (born 1977) has served as the company’s CEO from 1 September 2017 on. On 31 December 2017, Helvest Oy, which is controlled by Juha Helminen, owned 23,400 shares in Restamax Plc.
The CEO manages the administration of routine mat-ters of the company and of the Group in accordance with the instructions and orders issued by the Board of Directors. The CEO is directly responsible for the

Restamax Plc
58
planning and implementation of the strategy and the corresponding investments, for ensuring that the bookkeeping is carried out as required by the law and that the company’s financial management has been organised in a reliable manner. Restamax Plc’s inves-tor relation communications and marketing functions operate directly under the command of the CEO. The CEO monitors the decisions related to the persons at the executive level, as well as other important operative decisions. He or she also ensures that the subsidiar-ies of the Group operate in the interests of the parent company and endorse the Group’s strategy.
Operative business operations are the responsibility of the CEO, with the help of the Executive Team. The Ex-ecutive Team prepares and makes decisions in matters within the CEO’s decision-making power.
THE EXECUTIVE TEAM
The tasks of the Executive Team include planning and implementing the company’s strategy, management of business operations, result monitoring, annual planning, and the management of investments, corporate acquisi-tions and operational change plans. The Executive Team meets on a weekly basis.
On 31 December 2017, the Group’s Executive Team comprised:
Juha Helminen, b. 1977, CEO Direct and controlling interest 23,400 shares
Jarno Suominen, b. 1972, CFO Direct and controlling interest 249,347 shares
Tanja Virtanen, b. 1977, Product Line Director, Food Direct and controlling interest 200 shares
Paul Meli, b. 1977, Product Line Director, Nightclubs and other entertainment Direct and controlling interest 181,670 shares
Perttu Pesonen, b. 1976, Development Director Direct and controlling interest 80,000 shares
Eero Aho, b. 1978, Product Line Director, Food Direct and controlling interest 0 shares
Miko Helander, b. 1979, Product Line Director, Nightclubs and other entertainment Direct and controlling interest 0 shares
Tero Kaikkonen, b. 1976, Development Director Direct and controlling interest 100 shares
INSIDER ADMINISTRATION
Restamax’s insider rules apply the insider guidelines of
Nasdaq Helsinki Oy. The insider rules prohibit insiders and entities in which insiders have a controlling inter-est, as well as persons participating in the preparation of financial reports, from trading in the company’s finan-cial instruments, such as shares, 30 days before result publication (so-called closed window).
The company has defined as permanent insiders the persons working in the Restamax Group who by virtue of their position or tasks have access to all insider informa-tion pertaining to Restamax. In addition to a permanent insiders list, project-specific insider lists will be drafted, as prescribed by Nasdaq Helsinki Ltd’s insider guidelines.
As soon as possible, Restamax publishes any insider in-formation which directly concerns Restamax or its finan-cial instruments, unless the prevailing conditions result in the fulfilment of the prerequisites for postponing the publication of the insider information in question.
Under the market abuse regulation, Restamax has an obligation to publish transactions in Restamax’s financial instruments by the company’s management personnel and their related parties.
The person in charge of Restamax’s insider issues is CFO Jarno Suominen.
AUDITING
The Articles of Association state that the Annual General Meeting selects the auditor for Restamax Plc.
The 2017 Annual General Meeting selected authorised public accountants company Deloitte & Touche Oy as the auditor. Hannu Mattila, APA, acts as the responsible auditor.
Auditing is carried out in accordance with the relevant acts and the Articles of Association. In practice, the auditing work is carried out during the financial period by inspecting the business operations and administra-tion, and as an actual financial statements audit after the financial period has ended.
In 2017, the auditors of the Restamax Group were paid TEUR 215.9 for auditing tasks (in 2016: TEUR 204.4) and TEUR 54.4 for other guidance and consultation services (in 2016: TEUR 56.2).
INTERNAL CONTROL
Restamax Plc’s internal management and control proce-dures are based on the Limited Liability Companies Act, the Articles of Association and the internal policies of the company. The company’s management and control are distributed between the Annual General Meeting, the Board of Directors, and the CEO. Internal control refers to all the procedures, systems and methods that the

Annual Report 2017
59
company’s management employs to ensure efficient, economical and reliable operations.
Restamax Plc’s Board of Directors is responsible for or-ganising the internal control. The Board of Directors has the highest responsibility of the company’s visions, stra-tegic goals and the commercial goals set based on them. The Board of Directors also bears the highest responsibil-ity for the supervision of the bookkeeping and financial management and the proper arrangement of operations. The Board of Directors approves the common guidelines for the entire internal control of the Group.
The CEO is directly responsible for the implementation of the strategy and the corresponding investments, for ensuring that the bookkeeping is carried out as required by the law, and that the financial management has been organised in a reliable manner. Operative business oper-ations are the responsibility of the CEO, with the help of the Executive Team. The company’s senior management is responsible for internal control, while the auditors take care of external auditing.
Taking the quality and scope of the business operations into consideration, the company has not deemed it nec-essary to establish a special internal audit organisation. Instead, its duties are included in the business organisa-tion’s tasks in all the units of the Group.
Methods and procedures of internal control
The CEO is responsible for organising the bookkeeping and control mechanisms in practice. The CEO monitors decisions related to executive level persons, as well as important operative decisions. The CEO also ensures that the Group subsidiaries operate in the interests of the parent company and endorse the Group’s strategy. The Group’s Executive Team controls business opera-tions and monitors the administration in the Group’s daily operations.
The Group has defined clear authorisations for approving investments and matters related to the personnel. The main tasks of the Group’s Executive Team:
1. supervision of business operations and finances, and
2. handling investments, corporate acquisitions and ex-panding and restriction plans significant for the Group.
Internal control is an essential part of the company’s administration and management systems. It covers Restamax’s all units and operations. Among other things, internal control must evaluate the sufficiency and ef-ficiency of the risk positions related to the company’s management and administrative systems, operations and data systems that apply to:
– the creativity and integrity of financial and operational data
– the profitability and efficiency of operations
– securing assets
– compliance with laws, orders, and agreements.
RISK MANAGEMENT
Restamax strives to increase the shareholder value within the limits set by legislation and the obligations of society.
Restamax divides the risk factors influencing business operations, result and stock exchange value into five main categories: market and business operation risks, risks related to the personnel, technology and data secu-rity risks, financing risks and juridical risks.
Restamax strives to protect itself against other risks by taking out extensive insurance contracts. These include statutory insurances, liability and property insurances, and legal protection ownership insurances. The scope of the insurances, values insured and excesses are checked annually together with the company’s insurance com-pany.
The Group’s risk management and market change antici-pation constitute an integral part of the management’s everyday work in order to guarantee the continuity of the business operations. Restamax carries out continuous risk mapping related to its operations and aims to protect itself from identified risk factors in the best possible way.
REPORTING AND CONTROL SYSTEMS
The Group employs reporting systems required to ef-ficiently monitor its operations. Internal control is con-nected to the company’s vision, strategic goals and the business goals defined based on them. The realisation of business goals and the Group’s financial development are monitored monthly with a control system covering the entire Group. As an essential part of the control system, the realisation data and up-todate estimates are exam-ined by the Group’s Executive Team on a monthly basis. The control system includes extensive sales reporting, a profit and loss account, estimates for turnover and profit, and operational key figures.

Restamax Plc
60
Annual Report 2017
61
Remuneration for the members of the Board of Directors
The Annual General Meeting of Restamax Plc decides on the remuneration paid to the members of the Board of Directors. The Annual General Meeting of 2017 set the annual remuneration of the Chairman of the Board of Direc-tors at EUR 25,000, that of the Vice-Chairman of the Board of Directors at EUR 20,000, while the remuneration paid to the members of the Board of Directors was set at EUR 10,000. Separate attendance allowances are not paid.
Remuneration of the CEO
The Board approves of the level of the CEO’s remuneration. In addition to a fixed salary and in line with the company’s currently valid practices, the CEO of Restamax Plc, Juha Helminen, receives the following fringe bene-fits: company car, company mobile phone and occupational health care in accordance with the company’s policies.
As a short-term incentive to the CEO, a performance reward is also paid, which is determined based on the finan-cial result of the company’s monitoring-period financial period, and on the achievement of certain operational goals.
The CEO’s contract can be terminated without special grounds by the CEO with a term of notice of three (3) months and by the company with a term of notice of six (6) months. The retirement age of the CEO is regulated by the law. The CEO is entitled to a supplementary pension insurance paid by the company. The supplementary pension insurance is payment-based, which is why no additional liabilities can be incurred to the company in addition to the insurance contribution already paid.
Remuneration of the Executive Team
The Executive Team receives a total remuneration, which includes monetary salary as well as taxable telephone and other benefits. As a short-term incentive, the Executive Team can also be paid a performance reward, which is based on the financial and operational goals set by the Board of Directors. The Board of Directors of the company decides on the general principles of remuneration, while the CEO makes the decisions on related details.
Salaries paid to the CEO of the parent company Restamax Plc and other members of the Executive Team in 2017 (2016) (T€)
CEO’s salary with fringe benefits 175.7 (156.1)*.Salaries of other members of the Executive Team with fringe benefits 624.0 (518.8).
*CEO Markku Virtanen 1 January–21 May 2017, acting CEO Jarno Suominen 22 May–31 August 2017, andCEO Juha Helminen 1 September–31 December 2017
REMUNERATION STATEMENT 2017

Restamax Plc
62

Annual Report 2017
63


65CONSOLIDATED FINANCIAL STATEMENTS
Restamax Plc
FINANCIALSTATEMENTS
31. 12. 2017
Restamax Plc Hatanpään valtatie 1 B 33100 Tampere
Business ID 1952494-7Domicile Tampere

66

67CONSOLIDATED FINANCIAL STATEMENTS
ContentsA. Consolidated financial statements
Annual report from the Board of Directors ................................................................................................ 68Group income statement (IFRS) ................................................................................................................ 77Group balance sheet (IFRS) ...................................................................................................................... 78Consolidated statement of changes in equity ............................................................................................. 79Group cash flow statement (IFRS) ............................................................................................................ 80 1 Notes to consolidated financial statements ..................................................................................... 81 Basic company information ........................................................................................................... 81 Accounting principles .................................................................................................................... 81 New standards and interpretations applied ..................................................................................... 81 2 Accounting principles requiring the management’s consideration and key factors of uncertainty related to values ............................................................................... 82 3 Accounting principles of the consolidated financial statements ........................................................ 83 Consolidation principles ................................................................................................................ 83 Segment reporting ........................................................................................................................ 83 Items denominated in a foreign currency ........................................................................................ 84 Property, plant and equipment ...................................................................................................... 84 Intangible assets ........................................................................................................................... 84 Impairment of tangible and intangible assets .................................................................................. 84 Lease agreements ......................................................................................................................... 85 Inventories ................................................................................................................................... 85 Pension obligations ....................................................................................................................... 85 Income recognition principles ........................................................................................................ 85 Non-current asset items classified as held for sale and discontinued operation ................................. 85 EBITDA and operating profit .......................................................................................................... 86 Provisions and contingent liabilities ............................................................................................... 86 Income taxes ................................................................................................................................ 86 Financial assets and liabilities ........................................................................................................ 87 Borrowing costs ............................................................................................................................ 87 Share capital ................................................................................................................................ 87 Dividend distribution .................................................................................................................... 88 New and revised standards and interpretations to be applied later .................................................... 88 4 Management of financial risks ....................................................................................................... 89 5 Acquired business operations ......................................................................................................... 91 6 Sold business operations ............................................................................................................... 97 7 Earnings per share ........................................................................................................................ 98 8 Operating segments ...................................................................................................................... 99 9 Intangible assets ........................................................................................................................... 100 10 Property, plant and equipment ...................................................................................................... 103 11 Shares in associated companies and joint ventures .......................................................................... 104 12 Inventories ................................................................................................................................... 104 13 Receivables ................................................................................................................................... 105 14 Financial assets available for sale ................................................................................................... 106 15 Cash and cash equivalents ............................................................................................................. 106 16 Equity .......................................................................................................................................... 107 17 Deferred tax assets and liabilities ................................................................................................... 108 18 Provisions .................................................................................................................................... 110 19 Financial liabilities ........................................................................................................................ 111 20 Trade payables and other liabilities ................................................................................................ 112 21 Turnover ...................................................................................................................................... 112 22 Other operating income ................................................................................................................. 112 23 Materials and services ................................................................................................................... 113 24 Costs related to employment benefits ............................................................................................. 113 25 Depreciations, amortisations and impairment ................................................................................. 114 26 Other operating expenses .............................................................................................................. 114 27 Financial income and expenses ...................................................................................................... 115 28 Income taxes ................................................................................................................................ 115 29 Events of related entities ............................................................................................................... 116 30 Auditor’s fees ............................................................................................................................... 117 31 Subsidiaries and associated companies ........................................................................................... 118 32 Other lease agreements ................................................................................................................. 121 33 Conditional liabilities and assets and commitments ......................................................................... 122 34 Classification of financial assets and liabilities ................................................................................ 122 35 Adjustments to operating cash flows .............................................................................................. 123 36 Net liabilities balancing calculation ................................................................................................ 124 37 Fair values of financial instruments ............................................................................................... 124 38 Key events occurring after the closing date ..................................................................................... 126 39 Calculation formulas for key figures ............................................................................................... 127
B. Financial statements for parent company (FAS)
Income statement for parent company (FAS) ....................................................................................... 130 Balance sheet for parent company (FAS) .............................................................................................. 131 Notes ................................................................................................................................................ 133 Statement of cash flows (FAS) ............................................................................................................ 143 Signatures of the Board of Directors and CEO ....................................................................................... 144 Auditor’s note ................................................................................................................................... 144 Books and records .............................................................................................................................. 145

68
A. CONSOLIDATED FINANCIAL STATEMENTS
Restamax Plc is the parent company of the Restamax Group. In addition to the parent company, the consoli-dated financial statements include 83 subsidiaries.
In the 2017 financial period, Restamax’s strong growth continued, with profitability remaining at a good level. Improvement in the general financial situation in Finland had a positive impact on the restaurant business and labour hire.
ANNUAL REPORT FROM THE BOARD OF DIRECTORS
Key events during the financial period
In 2017, the overall market of the restaurant field and labour hire grew in Finland. During the financial period, the Group strengthened the presence of both segments in many cities and also expanded its operations to new locations. Labour hire expanded and strengthened its operations particularly in the construction, industrial and logistics sectors. During the financial period, the Group concluded several corporate acquisitions espe-cially in labour hire, and opened new restaurants.
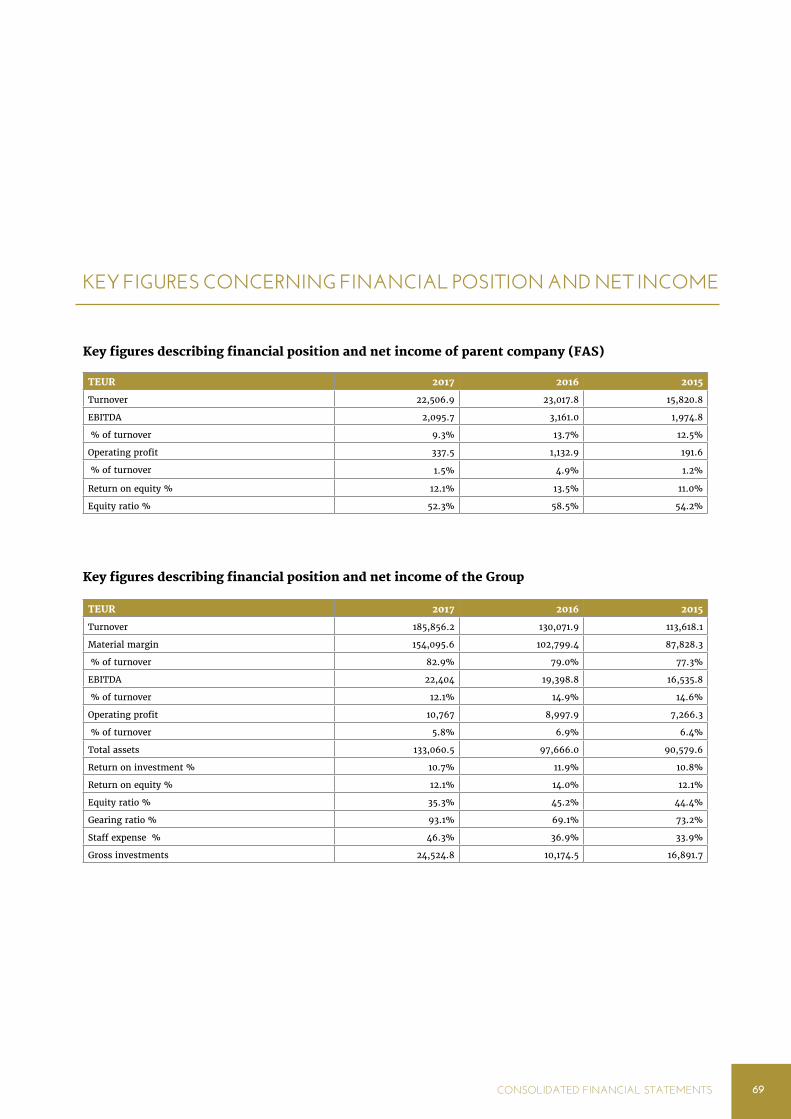
69CONSOLIDATED FINANCIAL STATEMENTS
KEY FIGURES CONCERNING FINANCIAL POSITION AND NET INCOME
Key figures describing financial position and net income of parent company (FAS)
Key figures describing financial position and net income of the Group
TEUR 2017 2016 2015
Turnover 22,506.9 23,017.8 15,820.8
EBITDA 2,095.7 3,161.0 1,974.8
% of turnover 9.3% 13.7% 12.5%
Operating profit 337.5 1,132.9 191.6
% of turnover 1.5% 4.9% 1.2%
Return on equity % 12.1% 13.5% 11.0%
Equity ratio % 52.3% 58.5% 54.2%
TEUR 2017 2016 2015
Turnover 185,856.2 130,071.9 113,618.1
Material margin 154,095.6 102,799.4 87,828.3
% of turnover 82.9% 79.0% 77.3%
EBITDA 22,404 19,398.8 16,535.8
% of turnover 12.1% 14.9% 14.6%
Operating profit 10,767 8,997.9 7,266.3
% of turnover 5.8% 6.9% 6.4%
Total assets 133,060.5 97,666.0 90,579.6
Return on investment % 10.7% 11.9% 10.8%
Return on equity % 12.1% 14.0% 12.1%
Equity ratio % 35.3% 45.2% 44.4%
Gearing ratio % 93.1% 69.1% 73.2%
Staff expense % 46.3% 36.9% 33.9%
Gross investments 24,524.8 10,174.5 16,891.7

70
Segment-specific key figures
The calculation formulae for the key figures are presented in note 39.
Operating profit % 2017 2016 2015
Operating profit, % restaurant % 5.7 6.9 6.5
Operating profit, % labour hire % 5.1 4.7 3.2
EBITDA % 2017 2016 2015
EBITDA %, restaurant % 13.4 15.3 14.8
EBITDA %, labour hire % 8.7 10.1 8.9
Material margin % 2017 2016 2015
Material margin %, restaurant % 74.1 74.6 74.3
Staff expense % 2017 2016 2015
Staff expense %, restaurant % 28.0 28.1 28.5
Staff expense %, labour hire % 83.7 85.5 85.2
Key figures per share
2017 2016 2015
Earnings per share, undiluted EUR 0.30 0.35 0.31
Earnings per share, diluted EUR 0.30 0.35 0.31
Equity per share EUR 2.7 2.65 2.48
Dividend per share EUR 0.33,(*) 0.30 0.27
Dividend/earnings per share % 108.4 85.7 87.1
Effective dividend yield % 3.9 5.0 5.4
Price-to-earnings ratio (P/E) 28.57 17.2 16.2
Share price 31 December EUR 8.57 6.01 5.01
Average share price EUR 7.55 5.10 4.00
Highest share price during financial period EUR 9.16 6.32 5.09
Lowest share price during financial period EUR 5.71 4.28 3.48
Market value for shares MEUR 142.43 99.88 82.06
Exchange of shares during financial period pcs 2,624,943 7,501,446 4,134,568
Proportionate exchange of shares % 15.79 45.14 25.24
Adjusted average number of shares during financial period pcs 16,619,620 16,235,842 16,203,745
Adjusted average number of shares on 31 December pcs 16,619,620 16,619,620 16,379,620
(*) Board of Directors’ proposal.

71CONSOLIDATED FINANCIAL STATEMENTS
PERSONNEL INFORMATION
Key figures describing the personnel of the parent company
Key figures describing the personnel of the Group
Segment-specific key figures describing the personnel
Proposal from the Board of Directors concerning actions to be taken regarding the profit of the parent company
The Board of Directors proposes to the Annual General Meeting that a dividend of EUR 0.33 per share (16,619,620 shares) be distributed from the profit for the financial period of EUR 6,529,099.62, amounting to EUR 5,484,474.60. According to the current understanding of the Board of Directors, the proposed distribution of dividends will not endanger the company’s solvency.
Shares in the company
At the time of the closing of the accounts, the company had 16,619,620 shares. All shares have an equal right to dividends and the company assets. One share equals one vote at the general meeting. The company’s shares are listed at NASDAQ Helsinki Oy.
Organisation, management and auditor of parent company
During the financial period, the parent company’s Board of Directors had the following permanent members: Timo Laine, Mikko Aartio, Mika Niemi , Petri Olkinuora, Jarmo Viitala and Timo Everi.
Markku Virtanen was the CEO of the company up to 21 May 2017, Jarno Suominen performed the duties of the acting CEO from 22 May until 31 August 2017, and Juha Helminen was CEO from 1 September 2017. The auditors for the parent company and Group were Deloitte Oy, Authorised Public Accountants, with APA Hannu Mattila as the responsible auditor.
2017 2016 2015
Average number of employees 104 99 72
Salaries and fees for financial period 3,887.6 3,940.5 2,967.6
2017 2016 2015
Average number of employees
Full-time staff 477 270 268
Part-time staff 1784 860 644
Salaries and fees 67,869.4 36,851.9 29,342.6
Average staff, restaurant 2017 2016 2015
Full-time staff 361 270 268
Part-time staff translated into full-time staff 143 110 103
Salaries and fees 16,127.9 13,266.4 12,625.5
Average staff, labour hire 2017 2016 2015
Full-time staff 116 0 0
Part-time staff translated into full-time staff 1641 750 541
Salaries and fees 51,741.9 23,585.5 16,717.1
Unrestricted equity fund EUR 37,541,513.54
Profit funds from previous years EUR 10,498,944.43
Profit for the financial period EUR 6,529,099.62
Unrestricted equity EUR 54,569,557.59
of which distributable EUR 54,569,557.59

72
SUBORDINATED LOANS
The company has received a subordinated loan defined in Chapter 12 of the Limited Liability Companies Act.
In the event of the dissolution, liquidation and bankruptcy of the debtor, the subordinated loan can be repaid at a lower priority compared to all other creditors, but before the proportional share of the shareholders.
During the debtor’s operations, the subordinated loan can only be repaid in part or in full to the extent where the total amount of the debtor’s unrestricted equity and subordi-nated loans at the time of payment exceeds the debtor’s loss confirmed for the last completed financial period or the loss included on the balance sheet of a later financial statement.
This subordinated loan has a higher priority to the debtor’s assets than subordinated loans that have been issued to the debtor after the date of signing this agreement. The debtor undertakes to adhere to the order of priority described above in all financing activities.
The repayment of the subordinated loan does not have a due date, and it will only be repaid to the creditor upon the decision of the debtor. The creditor does not have the right to demand the repayment of the subordinated loan.
However, if Restamax Plc’s holding in the debtor company falls under 50 per cent, the subordinated loan capital will become due and payable immediately.
No interest will be paid on the subordinated loan, and the repayment of the loan has not been secured with collateral.
Changes in Group structure in 2017
In January 2017, Restamax Plc purchased 60% of the share capital of a company called Thai Papaya Oy engaged in the restaurant business, with a deed of sale dated 29 December 2016. The ownership of the shares was trans-ferred to Restamax Plc on 1 January 2017. Also in January, Rivermax Oy was established in which Restamax Plc has a 72% shareholding.
In January 2017, Smile Industries Jyväskylä Oy and Smile Industries Kuopio Oy were established. Restamax Plc’s subsidiary Smile Industries Oy owns 100% of Smile Industries Jyväskylä Oy and 90% of Smile Industries Kuopio Oy.
In February 2017, Restamax Plc sold its entire share-holding of 70% of Max Siivouspalvelut Oy. Control of the shares was transferred on 28 February 2017. In February, the companies Skohan Oy and Somax Oy were estab-lished. Restamax Plc owns 75% of Skohan Oy and 70% of Somax Oy. Also in February, a 20% minority share-
Subordinated loans, TEUR 31/12/2017 31/12/2016
Parent company 0.0 77.0
Group 220.0 297.0
holding in Restamax Plc subsidiary Hernesaaren Ranta Oy was bought. This increases Restamax Plc’s share-holding in Hernesaaren Ranta Oy to 80%.
In February 2017, Smile Industries Tampere Oy was established with Restamax Plc subsidiary Smile Indus-tries Oy owning a 76.50% shareholding.
In March 2017, a 10% minority shareholding in Restamax Plc subsidiary Smile Palvelut Ilo Oy was bought. This increased the shareholding of Restamax Plc subsidiary Smile Henkilöstöpalvelut Oy in Smile Palvelut Ilo Oy to 90 %. In March, Smile ICT Oy was established with Restamax Plc subsidiary Smile Henkilöstöpalvelut Oy owning a 55 % shareholding.
In April 2017, Restamax Plc’s subsidiary engaging in the restaurant business bought 80% of the shares in Tillikka Oy with a deed of sale dated 31 March 2017. The ownership of the shares was transferred on 1 April 2017.
In April 2017, Restamax Plc’s subsidiary engaging in the labour hire business, Smile Henkilöstöpalvelut Oy, bought the entire shareholding of Smile Banssi Oy (formerly Pasianssi Oy) with a deed of sale dated 5 April 2017. The business and ownership of the object of the transaction were transferred to the Group on 5 April 2017. Smile Banssi Oy’s subsidiaries are Smile Banssi Etelä Oy (formerly Banssi etelä Oy), Smile Banssi Pohjoinen Oy (formerly Banssi pohjoinen Oy), Smile Banssi Häme Oy (formerly Banssi häme Oy), Smile Banssi Uusimaa Oy (formerly Banssi uusimaa Oy), Smile Banssi Itä Oy (formerly Banssi itä Oy), Smile Banssi Länsi Oy (formerly Banssi länsi Oy), Smile Banssi Keski Oy (formerly Banssi keski Oy), Smile Banssi Kaakko Oy (formerly Banssi kaakko Oy), Smile Banssi Lappi Oy (formerly Banssi lappi Oy), Smile Banssi Helsinki Oy (formerly Banssi Helsinki Oy), Smile Banssi Safety Oy (formerly Banssi Safety Oy), Smile Rmax Oy (formerly Banssi Hoiva Oy) and Talous Bandora Oy.
In April 2017, a private offering of shares was carried out in Restamax Plc’s subsidiary Smile Henkilöstöpalvelut Oy. As a result of the offering, Restamax Plc’s share-holding in Smile Henkilöstöpalvelut Oy is 80.77 %. Also in April, a share exchange was carried out in Smile MMS Oy, as a result of which Restamax Plc subsidiary Smile Henkilöstöpalvelut Oy owns 100% of shares in Smile MMS Oy. In May 2017, Mikonkadun keidas Oy was established in which Restamax Plc has a 90% shareholding.
In June 2017 with a deed of sale dated 2 June 2017, Restamax Plc purchased 90% of the shares in Harry’s Ravintolat Oy. The ownership of the shares was trans-

73CONSOLIDATED FINANCIAL STATEMENTS
ferred on 2 June 2017. In June, Restamax Plc bought a 20% minority holding in its subsidiary Roska Yhtiöt Oy. As a result of the transaction, Roska Yhtiöt Oy is now a wholly-owned subsidiary of Restamax Plc.
In June 2017, a 10% minority shareholding in Restamax Plc subsidiary Smile Palvelut Ilo Oy was bought. This increased the shareholding of Restamax Plc subsidiary Smile Henkilöstöpalvelut Oy in Smile Palvelut Ilo Oy to 100 %.
In July 2017 with a deed of sale dated 1 July 2017, Restamax Plc’s subsidiary engaging in the labour hire business purchased 100% of the shares in Smile Job Services One Oy (formerly Job Services One Oy). The right of ownership of the shares was transferred on 1 July 2017. In July, a private offering of shares was carried out in Smile Henkilöstö-palvelut Oy, as a result of which Restamax Plc’s holding in Smile Henkilöstöpalvelut Oy is 78.35%.
In August 2017, Restamax Plc’s wholly-owned subsidiary Ravintola Bodega Salud Oy was merged with its wholly-owned subsidiary Rengasravintolat Oy. Also in August, a 15% minority shareholding in Restamax Plc subsid-iary Talous Bandora Oy was bought. This increases the shareholding of Restamax Plc subsidiary Smile Banssi Oy in Talous Bandora Oy to 66%.
In September 2017, Smile Education Oy was established, with Restamax Plc subsidiary Smile Henkilöstöpalvelut Oy owning a 51% shareholding.
In October 2017, Pyynikin Brewery Restaurants Oy was established, with Restamax Plc subsidiary Gastromax Oy owning a 85% shareholding. In October, Smile Industries Manse Oy and Smile Botnia Oy were also established. Restamax Plc subsidiary Smile Industries Tampere Oy owns 100% of Smile Industries Manse Oy and Smile Henkilöstöpalvelut Oy owns 90% of Smile Botnia Oy.
In November 2017, Restamax Plc bought an 18.18% minority shareholding in Smile Banssi Etelä Oy, a 20% minority shareholding in Smile Banssi Häme Oy, an 18.18% minority shareholding in Smile Banssi Uusimaa Oy, a 20% minority shareholding in Smile Banssi Itä Oy, a 20% minority shareholding in Smile Banssi Länsi Oy, a 20% minority shareholding in Smile Banssi Keski Oy, a 20% minority shareholding in Smile Banssi Lappi Oy, a 20% minority shareholding in Smile Banssi Helsinki Oy, a 30% minority shareholding in Smile Banssi Safety Oy, a 20% minority shareholding in Smile Banssi Kaakko Oy, a 20% minority shareholding in Smile Hoiva Oy an a 44% minority shareholding in Talous Badora Oy. As a result of the transactions, Restamax Plc subsidiary Smile Banssi Oy owns 90.91% of Smile Banssi Etelä Oy, 100% of Smile Banssi Häme Oy, 90.91% of Smile Banssi Uusimaa Oy, 100% of Smile Banssi Itä Oy, 100% of Smile Banssi Länsi Oy, 90% of Smile Banssi Keski Oy, 90% of Smile Banssi Lappi Oy, 100% of Smile Banssi Helsinki Oy, 100% of Smile Banssi Safety Oy, 90% of Smile Banssi Kaakko Oy, 100% of Smile Hoiva Oy and 100% of Talous Bandora Oy.
Account on the scope of research and develop-ment activities
The company is not engaged in any actual research activities. The company’s research activities mainly
consist of developing new restaurant concepts and the further development of existing concepts.
Corporate governance statement
Restamax has prepared a separate corporate governance statement for 2017, in accordance with the recommen-dations of the Corporate Governance Code for Finnish listed companies. The statement is available at the company website at www.restamax.fi.
Assessment of risks and uncertainties related to the company’s operations
Generally negative financial development may adversely affect the company’s operating activities and net income. Recession affects the purchasing behaviour and purchasing power of consumers and companies.
Changes in the competitive environment and other competitive risks within the company’s segment may adversely affect the company’s operating activities. The restaurant business is a highly competitive industry segment. The company competes with thousands of other parties offering restaurant services across its geographical areas of operation.
Changes in the competing environment, and the company’s potential failure to adapt to or manage these changes, as well as other competitive risks, should they be realised, may materially affect the operating activi-ties, financial position, operating income and future outlook of the company or a unit thereof, and the share price of the company.
Anticipating the needs, preferences and behaviour of consumers is one of the greatest challenges in the restau-rant industry. These needs are affected by changes in society, such as the general increase in purchasing power and the overall age structure. Restamax aims to develop its service concept in a manner that can anticipate the needs and preferences of consumers. In the labour hire business, the ageing of the Finnish population and the decreasing of the relative number of people of working age will probably hamper the availability of labour.
General leasing level developments and increases in lease costs, the price of alcohol and foodstuffs as well as salary expenses may adversely affect the company’s operating activities. The cost of premises, in particular, makes up a significant part of Restamax’s operating expenses. Restamax’s premises are primarily leased, so the general level of rent and development thereof have a major impact on the company’s operations. Although Restamax aims to carefully select the premises that it leases, and to sign long-term, low-cost lease agreements, lease costs may increase due to the general development of the leasing level and due to reasons attributable to lessors. A significant increase in salary expenses may also adversely affect the company’s operating income. Furthermore, an increase in the price of alcohol and foodstuffs may reduce Restamax’s profit margins.

74
Changes in the regulation environment, especially changes in laws related to serving alcoholic beverages and foodstuffs, labour legislation or variations in their interpretation, may adversely affect the company’s operating activities. The restaurant and night club business that Restamax is involved in is heavily regulated in Finland. The administrative and regulatory authorities interpret the laws and stipulations applied to Restamax; these are related to alcohol, rights to serve alcohol, and foodstuffs, food safety and hygiene. The interpretations and practices of the authorities may also vary greatly between different regions. The laws and stipulations often impose fairly strict, and sometimes even retroactive, responsibilities for costs and damages. Restamax strives to practise its operations in accordance with all applicable decrees and regulations and other legal provisions.
A significant share of Restamax’s business operations is subject to licences and closely controlled. Unexpected regulatory changes may adversely affect the company’s operating activities, since Restamax’s operating activi-ties are significantly dependant on matters subject to a licence, such as licences to serve alcohol. A significant portion of Restamax’s turnover is created by the sale of alcoholic beverages; therefore, the company’s sales may be materially affected by the temporary or permanent withdrawal of its licences to serve alcohol.
A ruling in any trial or authoritative process that is negative to the company may adversely affect the company’s operating activities. Restamax has extensive operations all over Finland, and Group companies may become a party to or an object of a trial, authoritative process or legal action that is related to their operations. Due to the nature of trials, authoritative processes and other adversarial processes and claims, their outcome is difficult to anticipate, and no reliable predictions can be made concerning such processes or claims that are currently pending or that can be expected in the future. Any ruling that is negative to Restamax in any trial, authoritative process or legal action may have a materially adverse effect on the operating activities, financial position, operating income and future outlook of Restamax or one of its units, and the share price.
The primary financial risks for the company are liquidity, interest and credit risks. The company finances its operating activities and growth using income from oper-ations as well as equity and credit capital. The financial position and liquidity of the company are affected by its future cash flows and related risk factors, and the avail-ability of financing. The majority of the Group’s labour hire business is targeted at the restaurant industry. Therefore, any changes on the restaurant market and in the level of employment in the field will also affect the Group’s labour hire business. The labour hire business may increase the Group’s credit losses.
Damage risks, sich as the fire risk, are covered with appro-priate insurances, and they cover property risks, inter-ruption risks and liability for damage risks. An external partner is used to take care of insurance issues. The intention of taking out insurance policies is to cover, at a sufficient protection level, all risks which it is sensible to protect against financially or for some other reason.
Goodwill has been tested during the last quarter of 2017. According to the impairment tests of these asset items, goodwill has not been impaired.
Shareholders
At the end of the 2017 financial period, Restamax Plc’s share capital stood at EUR 150,000 (EUR 150,000) and the total number of shares stood at 16,619,620 (16,619,620). At the end of the financial period, the company did not possess any shares in Restamax Plc. Restamax Plc’s subsidiary Smile Huippu Oy held 43,500 shares (43,500) on 31 December 2017, which is equivalent to approxi-mately 0.26% of the company’s entire share capital.
According to the list of shareholders, the company had 2,781 (2,052) shareholders on 29 December 2017.
On 29 December 2017, the company’s ten largest shareholders were as follows:
Shareholder Shares (pcs) ....... %Pimu Capital Oy ** 3,500,000 .......... 2.1Laine Capital Oy * 3,036,000 .......... 18.3Niemi Mika Rainer 2,236,789 .......... 13.5Mr Max Oy* 1,574,064 .......... 9.5Evli Suomi Pienyhtiöt 831,248 ............. 5.0Sign Systems Finland Oy 751,540.............. 4.5Niemi Hanna-Stiina 414,822 ............. 2.5Mutual Pension Insurance Company Ilmarinen 395,000 ............. 2.4Laakkonen Mikko Kalervo 340,000 ............ 2.0Elo Mutual Pension Insurance Company 271,566 ............. 1.6Total 3,351,029 ........... 80.3
* Entity controlled by Board member Timo Laine.
** Entity controlled by Board member Mikko Aartio.
Non-financial information
Description of business model
Restamax’s head office is in Tampere and the company also has regional offices at many locations around Finland. The Group has restaurants at many locations around Finland.
Restamax’s business mainly comprises the produc-tion and provision of restaurant services and labour hire services. Purchases by Restamax Group from producers of products and services from outside the Group constitute approximately 19% of the Group’s turnover. Restamax has approximately 520 producers and suppliers of products/goods and services from outside the Group
Approximately 44.6% of the Group’s turnover is spent on employee salaries and social security. Labour at the Group’s branches is strongly local.
Environmental matters
In its operations, Restamax endeavours to take into account and reduce its environmental impact and to promote recycling. Restamax Group’s restaurants comply

75CONSOLIDATED FINANCIAL STATEMENTS
with valid decrees concerning the recycling and sorting of waste. The Group estimates that the amount of food waste in its entire restaurant segment is approximately 0.1-0.2% of turnover per year. In 2018, Restamax Group has introduced the Hävikkimestari (waste master) programme together with L&T, by which it aims to minimise food waste.
In purchasing for Restamax’s restaurant operations, different packaging material accumulates and efforts are made to recycle it. Restamax’s environmental impact also concerns energy consumption on its premises, among other things. According to an estimate by Restamax, its own operations involve no fundamental risks to the envi-ronment. In 2017, electricity consumption was approxi-mately €1.6 million in the entire Group.
Social and personnel matters
In personnel policy, Restamax aims to provide equal opportunities for all employees, ensure equal treatment and pay, as well as good working conditions. During spring 2018, Restamax will commission an even more extensive job satisfaction survey of personnel than before. Occupational well-being and recreational activi-ties for personnel are an essential part of employee comfort and ability to cope. Restamax encourages and supports its personnel to cope better at work and to maintain their working capacity through partner benefits, among other things.
Restamax’s restaurant segment annually employs approximately 800 people converted into full-time employees, as a result of which the equal treatment and maintenance of occupational well-being of personnel are important values for the Group.
In cooperation with Tredu (Tampere Vocational College), Restamax also organises the Restamax Academy. The aim of the Academy is to maintain the skills and constant development of personnel. The aim is also to offer personnel development opportunities and more diverse career paths. At Group level, the aim is to construct career paths more systematically.
Respect of human rights
Restamax supports human rights and principles concerning the development of working conditions. Respect of human rights concerns, among other things, the company’s personnel and procurement policy. Restamax Group does not buy products or services from suppliers that violate or neglect national or international human rights conventions. Restamax’s aim is to provide all employees with equal opportunities and treatment.
Prevention of corruption and bribery
Restamax does not accept bribery in any form in its oper-ations. All the Group’s financial transactions are entered in the accounts. The Group’s financial transactions are audited through internal controls and in the annual audit. The Group’s accounts are transparent for the financial management.
Board of Directors’ authorisations
On 26 April 2017, the Annual General Meeting author-ised the Board to decide on using the company’s unre-stricted equity to purchase no more than 800,000 of the company’s own shares in one or several tranches, taking into account the stipulations of the Limited Liability Companies Act regarding the maximum number of shares in possession of the company and under the following terms: The company’s own shares shall be purchased with the funds from the company’s unrestricted equity, decreasing the distributable profits of the company. The shares shall be purchased in trading on the regulated market in the Helsinki Stock Exchange, and therefore the purchase takes place by private placing and not in relation to the shares owned by the shareholders. The sum paid for the shares is the price announced on the acquisition day for Restamax Plc’s shares on the regulated market on the stock list of Helsinki Stock Exchange. The shares are purchased in trading organised by Nasdaq Helsinki Oy in accordance with its rules and regulations. The shares can be purchased for financing or carrying out possible corporate acquisitions or other arrangements, to implement incentive schemes within the company, or for other purposes decided upon by the Board of Directors. The maximum amount of the shares to be purchased is equivalent to approximately 4.8% of all the shares and votes of the company calculated using the share count on the publication date of the notice of the Annual General Meeting, so the purchase of the shares does not have a significant influence on the share ownership and the distribution of voting rights in the company. The Board of Directors shall decide on the other matters related to the purchase of the company’s own shares. The authorisation will expire at the end of the 2018 Annual General Meeting, however no later than 18 months of the Annual General Meeting’s authorisa-tion decision.
The Annual General Meeting of 26 April 2017 authorised the Board of Directors to decide upon a share issue on the following terms: With this authorisation, the Board may decide to issue a maximum of 1,500,000 new shares, and to transfer no more than 800,000 of the company’s own shares held by the company (“Share Issue Authorisa-tion”). The new shares can be issued and the company’s own shares held by it can be assigned in one or more instalments, either with or without payment. The new shares can be issued and the company’s own shares held by it can be assigned to company shareholders in proportion to the company shares that they already own or, deviating from the shareholders’ pre-emptive right, in a special share issue if, from the company’s perspective, there is a justified financial reason for it, such as the financing or implementation of corporate acquisitions or other arrangements, development of the company’s equity structure, improvement of share liquidity or the implementation of company incentive schemes. The issue of new shares or transfer of the company’s own shares held by the company can also take place against apport property or by using a claim for the company held by the subscriber to redeem the amount to be paid for the issue price or the price to be paid for the shares. A special issue may only be arranged without payment if a justified financial reason exists in

76
terms of the overall benefit of the company and all of its shareholders. The Board of Directors was authorised to decide on the other matters related to share issues. The Share Issue Authorisation will expire at the end of the Annual General Meeting of 2018, however no later than 18 months from the Annual General Meeting’s Share Issue Authorisation decision.
Key events occurring after the closing date
Restamax Plc’s subsidiary engaging in the labour hire business purchased the entire shareholding of Kymppi Service Oy with a deed of sale dated 18 January 2018. The right of ownership and management was transferred on 1 February 2018.
On 22 January 2018, Restamax announced plans to revamp its organisation and the structure of its Executive Team. Restamax’s operational organisation was divided into three business units: Nightclubs, Food restaurants, and Pubs&Entertainment, each with their own responsible director. The position of Chief Procurement Officer (CPO) was established to strengthen purchasing operations and the efficiency thereof. The roles of sales and marketing strategy were increased in the organisation and, for that purpose, the position of Chief Commercial Officer (CCO) will be established.
On 13 March 2018, Restamax communicated that the Board of Directors has decided to review and evaluate the listing of the labour hire business comprising its subsid-iary Smile Henkilöstöpalvelut Oy and its subgroup on the Nasdaq Helsinki Ltd Stock Exchange. The evaluation process will be carried out during spring 2018.
Restamax Plc’s subsidiary engaging in the labour hire business, Smile Henkilöstöpalvelut Oy, bought 80% of the share capital of Adicio Oy. The right of ownership and management will transferred on 3 April 2018.
On 23 March 2018, Restamax communicated that it will expand its restaurant business operations to Denmark, where it will operate through its subsidiary Restamax Operations Denmark. The company will buy over 90% of the Danish Cock’s & Cows and The Bird companies. Ownership will be transferred on 4 April 2018.
Prospects for 2018
In accordance with its strategy, Restamax expects the Group’s turnover to increase and profitability to remain on a good level in both segments in the 2018 financial period. The restaurant segment is expected to reach a turnover of approximately MEUR 140 and in labour hire a turnover of approximately MEUR 110 is expected, the total turnover being some MEUR 240 after eliminations.
Restamax’s goal is to reach a turnover of approximately MEUR 400 by the end of 2020 after internal elimina-tions. The goal of the restaurant segment is to reach a turnover of approximately MEUR 200, and the goal of the labour hire segment is to reach a turnover of approx-imately MEUR 220, by the end of 2020.

77CONSOLIDATED FINANCIAL STATEMENTS
The notes on pages 81–128 are a material part of the financial statements.
GROUP INCOME STATEMENT (IFRS)
EUR thousand Note 1 January– 31 December 2017
1 January–31 December 2016
Turnover 21 185,856.2 130,071.9
Other operating income 22 1,809.7 2,533.9
Materials and services 23 -35,774.4 -30,070.7
Staff expenses 24 -82,966.1 -45,311.7
Other operating expenses 26 -46,521.2 -37,824.6
EBITDA 22,404.2 19,398.8
Depreciations, amortisations and impairment 25 -11,637.4 -10,400.9
Operating profit 10,766.7 8,997.9
Share of associated company profit 68.3 -151.2
Financial income 27 42.9 186.6
Financial expenses 27 -2,853.2 -1,139.4
Financial expenses (net) 27 -2,810.3 -952.8
Profit/loss before taxes 8,024.8 7,893.9
Income taxes 28 -3,081.3 -1,933.8
Change in deferred taxes 17,28 548.2 -95.7
Profit for the financial period 5,491.6 5,864.4
Attributable to
Parent company shareholders 5,057.8 5,608.1
Minority shareholders 433.8 256.3
Total 5,491.6 5,864.4
Earnings per share calculated from the profit to parent company shareholders
Earnings per share (euros), undiluted, profit from the financial period 7 0.30 0.35
Earnings per share (euros), diluted, profit from the financial period 7 0.30 0.35
Comprehensive consolidated income statement
Profit for the financial period 5,491.6 5,864.4
Other comprehensive income for the financial period (after taxes):
Financial assets available for sale 14 2.9 0.0
Total comprehensive income for the period 5,494.5 5,864.4
Attributable to:
Parent company shareholders 5,060.7 5,608.1
Minority shareholders 433.8 256.3
Total 5,494.5 5,864.4

78
The notes on pages 81–128 are a material part of the financial statements.
GROUP BALANCE SHEET (IFRS)
EUR thousand Note 31/12/2017 31/12/2016
ASSETS
Non-current assets
Intangible assets 9 66,219.7 47,435.8
Property, plant and equipment 10 32,391.2 28,834.3
Shares in associated companies and joint ventures 11 2,938.0 1,178.8
Financial assets available for sale 14 685.1 620.2
Interest-bearing loans receivable 13 125.3 168.2
Non-interest-bearing other receivables 13 717.2 1,030.7
Deferred tax assets 17 594.9 142.1
Non-current assets total 103,671.5 79,410.2
Current assets
Inventories 12 2,971.8 2,317.6
Interest-bearing loans receivable 13 0.0 30.0
Trade and other receivables 13 23,847.2 14,037.2
Cash and cash equivalents 15 2,570.0 1,871.1
Current assets total 29,389.0 18,255.9
Assets in total 133,060.5 97,666.0
EQUITY AND LIABILITIES
Equity attributable to parent company shareholders
Share capital 16 150.0 150.0
Invested unrestricted equity fund 16 40,510.2 36,586.1
Fair value fund 16 -4.5 -13.3
Own shares 16 -191.4 -191.4
Retained earnings 16 4,237.5 6,541.4
Equity loan 16 220.0 220.0
Total equity attributable to parent company shareholders 44,921.7 43,292.8
Minority shareholders 16 1,971.2 669.0
Equity, total 46,892.9 43,961.8
Non-current liabilities
Deferred tax liabilities 17 1,928.5 703.0
Provisions 18 0.0 183.2
Financial liabilities 19 34,643.0 24,369.9
Trade payables and other liabilities 20 3,674.8 796.4
Non-current liabilities total 40,246.2 26,052.5
Current liabilities
Financial liabilities 19 11,682.5 8,193.0
Trade payables and other liabilities 20 34,238.9 19,458.8
Current liabilities total 45,921.4 27,651.7
Liabilities total 86,167.6 53,704.2
Equity and liabilities in total 133,060.5 97,666.0
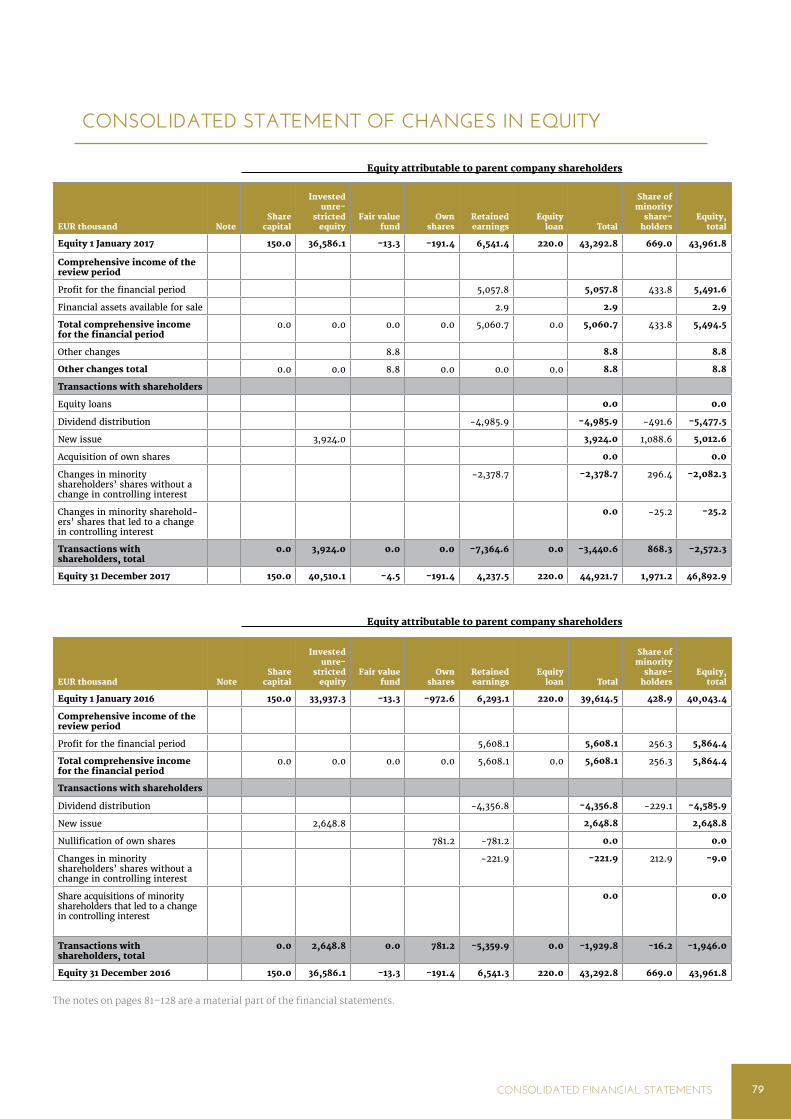
79CONSOLIDATED FINANCIAL STATEMENTS
CONSOLIDATED STATEMENT OF CHANGES IN EQUITY
The notes on pages 81–128 are a material part of the financial statements.
EUR thousand NoteShare
capital
Invested unre-
stricted equity
Fair value fund
Own shares
Retained earnings
Equity loan Total
Share of minority
share-holders
Equity, total
Equity 1 January 2017 150.0 36,586.1 -13.3 -191.4 6,541.4 220.0 43,292.8 669.0 43,961.8
Comprehensive income of the review period
Profit for the financial period 5,057.8 5,057.8 433.8 5,491.6
Financial assets available for sale 2.9 2.9 2.9
Total comprehensive income for the financial period
0.0 0.0 0.0 0.0 5,060.7 0.0 5,060.7 433.8 5,494.5
Other changes 8.8 8.8 8.8
Other changes total 0.0 0.0 8.8 0.0 0.0 0.0 8.8 8.8
Transactions with shareholders
Equity loans 0.0 0.0
Dividend distribution -4,985.9 -4,985.9 -491.6 -5,477.5
New issue 3,924.0 3,924.0 1,088.6 5,012.6
Acquisition of own shares 0.0 0.0
Changes in minority shareholders’ shares without a change in controlling interest
-2,378.7 -2,378.7 296.4 -2,082.3
Changes in minority sharehold-ers’ shares that led to a change in controlling interest
0.0 -25.2 -25.2
Transactions with shareholders, total
0.0 3,924.0 0.0 0.0 -7,364.6 0.0 -3,440.6 868.3 -2,572.3
Equity 31 December 2017 150.0 40,510.1 -4.5 -191.4 4,237.5 220.0 44,921.7 1,971.2 46,892.9
Equity attributable to parent company shareholders
EUR thousand NoteShare
capital
Invested unre-
stricted equity
Fair value fund
Own shares
Retained earnings
Equity loan Total
Share of minority
share-holders
Equity, total
Equity 1 January 2016 150.0 33,937.3 -13.3 -972.6 6,293.1 220.0 39,614.5 428.9 40,043.4
Comprehensive income of the review period
Profit for the financial period 5,608.1 5,608.1 256.3 5,864.4
Total comprehensive income for the financial period
0.0 0.0 0.0 0.0 5,608.1 0.0 5,608.1 256.3 5,864.4
Transactions with shareholders
Dividend distribution -4,356.8 -4,356.8 -229.1 -4,585.9
New issue 2,648.8 2,648.8 2,648.8
Nullification of own shares 781.2 -781.2 0.0 0.0
Changes in minority shareholders’ shares without a change in controlling interest
-221.9 -221.9 212.9 -9.0
Share acquisitions of minority shareholders that led to a change in controlling interest
0.0 0.0
Transactions with shareholders, total
0.0 2,648.8 0.0 781.2 -5,359.9 0.0 -1,929.8 -16.2 -1,946.0
Equity 31 December 2016 150.0 36,586.1 -13.3 -191.4 6,541.3 220.0 43,292.8 669.0 43,961.8
Equity attributable to parent company shareholders
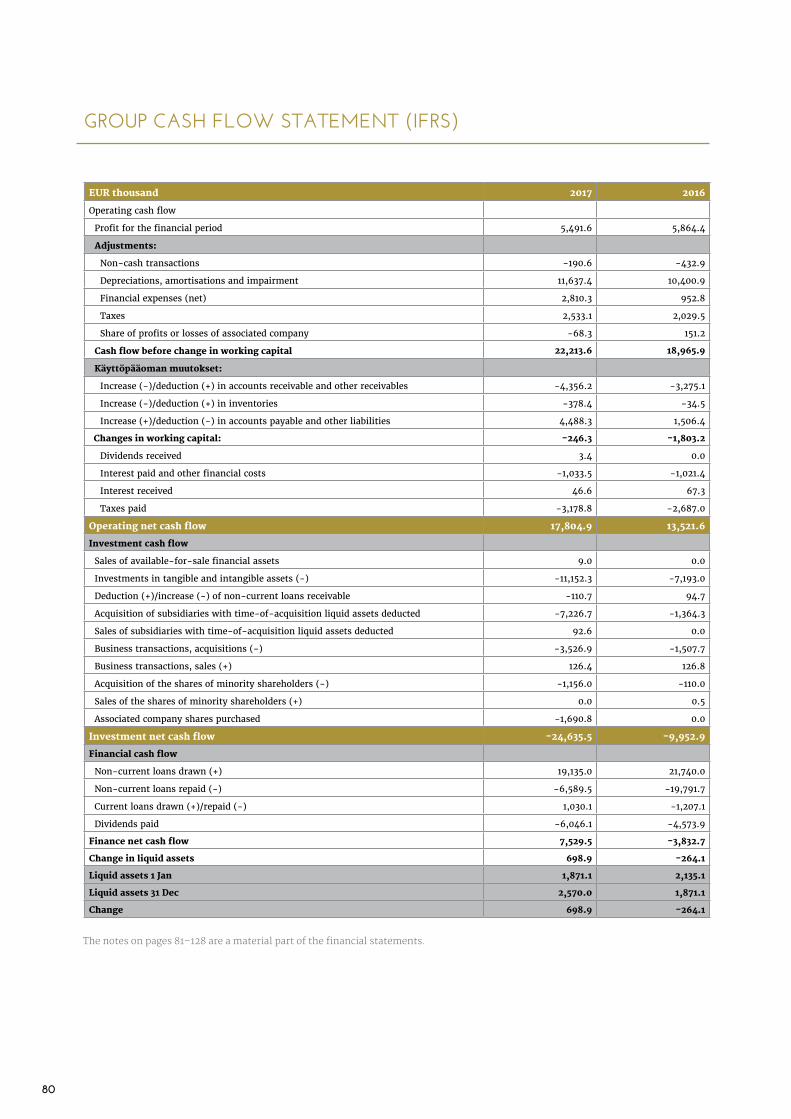
80
GROUP CASH FLOW STATEMENT (IFRS)
The notes on pages 81–128 are a material part of the financial statements.
EUR thousand 2017 2016
Operating cash flow
Profit for the financial period 5,491.6 5,864.4
Adjustments:
Non-cash transactions -190.6 -432.9
Depreciations, amortisations and impairment 11,637.4 10,400.9
Financial expenses (net) 2,810.3 952.8
Taxes 2,533.1 2,029.5
Share of profits or losses of associated company -68.3 151.2
Cash flow before change in working capital 22,213.6 18,965.9
Käyttöpääoman muutokset:
Increase (-)/deduction (+) in accounts receivable and other receivables -4,356.2 -3,275.1
Increase (-)/deduction (+) in inventories -378.4 -34.5
Increase (+)/deduction (-) in accounts payable and other liabilities 4,488.3 1,506.4
Changes in working capital: -246.3 -1,803.2
Dividends received 3.4 0.0
Interest paid and other financial costs -1,033.5 -1,021.4
Interest received 46.6 67.3
Taxes paid -3,178.8 -2,687.0
Operating net cash flow 17,804.9 13,521.6
Investment cash flow
Sales of available-for-sale financial assets 9.0 0.0
Investments in tangible and intangible assets (-) -11,152.3 -7,193.0
Deduction (+)/increase (-) of non-current loans receivable -110.7 94.7
Acquisition of subsidiaries with time-of-acquisition liquid assets deducted -7,226.7 -1,364.3
Sales of subsidiaries with time-of-acquisition liquid assets deducted 92.6 0.0
Business transactions, acquisitions (-) -3,526.9 -1,507.7
Business transactions, sales (+) 126.4 126.8
Acquisition of the shares of minority shareholders (-) -1,156.0 -110.0
Sales of the shares of minority shareholders (+) 0.0 0.5
Associated company shares purchased -1,690.8 0.0
Investment net cash flow -24,635.5 -9,952.9
Financial cash flow
Non-current loans drawn (+) 19,135.0 21,740.0
Non-current loans repaid (-) -6,589.5 -19,791.7
Current loans drawn (+)/repaid (-) 1,030.1 -1,207.1
Dividends paid -6,046.1 -4,573.9
Finance net cash flow 7,529.5 -3,832.7
Change in liquid assets 698.9 -264.1
Liquid assets 1 Jan 1,871.1 2,135.1
Liquid assets 31 Dec 2,570.0 1,871.1
Change 698.9 -264.1

81CONSOLIDATED FINANCIAL STATEMENTS
1 NOTES TO CONSOLIDATED FINANCIAL STATEMENTS
Basic information about the Group
The Group’s main industry segment is the production of restaurant services and labour hire services.
The Group’s parent company is Restamax Plc. The parent company’s domicile is Tampere, its home state is Finland and its registered address is Hatanpään valtatie 1 B, 33100 Tampere.
Restamax Plc and its subsidiaries (collectively referred to as “Restamax” or the “Group”) are a Finnish Group that operates in the fields of restaurant and labour hire business. The Group has 144 bars, restaurants and night clubs in different parts of the country; of these, 131 are operated by the Group, 9 are franchising outlets and 4 are sublet. The Group also engages in other activi-ties that support the restaurant industry. The Group’s restaurant concepts include Viihdemaailma Ilona, Classic American Diner, Colorado Bar & Grill, Stefan’s Steakhouse and entertainment centres Galaxie Center and Space Bowling & Billiards.
A copy of the consolidated financial statements is available at the website www.restamax.fi or in the main office of the Group’s parent company at the above address.
Restamax Plc’s Board of Directors has approved the publi-cation of these financial statements in its meeting on 27 March 2018. According to the Finnish Limited Liability Companies Act, shareholders are authorised to approve or reject the financial statements in a general meeting held after its publication. The general meeting can also decide on the amendment of the financial statements.
Accounting principles
These are the sixth financial statements of the Restamax Group that have been drawn up under the International Financial Reporting Standards (IFRS), and they have been drawn up following the IAS and IFRS standards in force as of 31 December 2017, as well as the SIC and IFRIC interpretations issued in relation to them. The International Financial Reporting Standards refer to the standards and their interpretations approved for application in the EU in accordance with the procedure stipulated in the EU’s regulation (EC) No. 1606/2002 and embodied in the Finnish Accounting Act and provisions issued under it. The notes to the consolidated financial statements have also been prepared in accordance with the requirements in Finnish accounting legislation and Community law that complement the IFRS regulations.
The information in the consolidated financial state-ments is based on original acquisition costs, except where otherwise stated in the accounting principles.
Monetary figures in the financial statements are expressed in thousands of euros unless otherwise stated. The company’s functional currency is the euro.
New standards and interpretations applied
The following standards and amendments to standards have been adopted for the first time in the Group as of the financial period that begun on 1 January 2017:
- Recording deferred tax assets from unrealised losses – amendments to IAS 12,
- Project concerning the information to be presented in financial statements – amendments to IAS 7.

82
2 ACCOUNTING PRINCIPLES REQUIRING THE MANAGEMENT’S CONSID-ERATION AND KEY FACTORS OF UNCERTAINTY RELATED TO ESTIMATES
Use of estimates
Consolidation under the IFRS standards requires the use of specific estimates and assumptions that affect the figures reported. The estimates and assumptions included in the financial statements are based on the management’s best possible opinion on the closing date. These estimates and assumptions affect the assets and liabilities on the balance sheet, the presentation of contingent assets and liabili-ties in the notes, and the income and expenses from the financial period. The estimates are based on earlier experi-ence, market information and several other assumptions that may be considered reasonable, but the actual figures may differ from these values due to different assump-tions or conditions. The management must employ its judgment when following the accounting principles, and it must prepare estimates concerning income tax, goodwill impairment tests, reservations and contingent liabili-ties, for example. These policies and estimates require the management to make subjective and complicated, judgment-based estimates, such as those concerning the effects of factors that are uncertain by nature.
Income taxes
The tax costs in the income statement are based on the taxable income from the financial period and deferred tax. Taxes are recorded through profit or loss, except in cases where they are directly related to items registered as equity or other items in the total comprehensive income. In these cases, their tax effects are also recorded as equity in these items. Tax based on the taxable income from the financial period is calculated using the taxable income and the appli-cable tax rate in each country. The taxes are adjusted by any taxes related to previous financial periods.
Deferred tax is calculated for any temporary differences between carrying amounts and tax bases. The largest temporary differences are generated by the differences between the carrying amounts and tax bases of property, plant and equipment, fair value adjustments of assets and liabilities during business combinations, and unused tax losses. Deferred taxes have been calculated using the tax rates that have been enacted or substantively enacted on the date of the closing of the books.
Deferred tax assets are recorded up to the probable amount of future taxable income against which the temporary difference can be utilised. The prerequisites for recording deferred tax assets are estimated in this respect on each closing date.
However, deferred tax liabilities are not recorded when the asset item or liability in question is one that would be origi-nally entered into bookkeeping, there is no combination of business activities involved, and the entry of such an asset item or liability does not affect the result of the bookkeeping or the taxable income at the time when the business trans-action takes place.
Deferred tax assets and liabilities are offset when the Group has a legally enforceable right to offset the current
tax assets and liabilities, and when the deferred tax assets and liabilities are related to taxes on income collected by the same recipient, either from the same taxpayer or different taxpayers, when the aim is to realise the asset and liability in their net amounts.
Provisions and contingent liabilities
A provision is recorded when the Group has a judicial and constructive obligation for payment on the basis of a past event, the realisation of the obligation is probable and the size of the obligation can be reliably estimated.
Provisions are measured at the present value required to cover the obligation. The discount factor used for calcu-lating the present value is selected in a manner where it is representative of the market opinion of the value of money over time and the risks related to the obligation. If a part of the liability can be received as reimbursement from a third party, the reimbursement will be registered as a separate asset item when the reimbursement has been practically ensured. The provision amounts are estimated on each closing date, and their amounts are adjusted to correspond to the best possible estimate at the moment of inspection. Changes in the provisions are entered in the income statement under the same item as the one where the provision was originally recorded.
A provision will be recorded for a contract that generates a loss when the necessary expenditures required to fulfil the obligations outweigh the benefits received from the contract.
A contingent liability is a possible liability arising from past events whose existence will only be confirmed when an uncertain event outside the Group’s control is realised. A present obligation that is not likely to cause a payment obli-gation, or whose size cannot be reliably determined, is also considered to be a contingent liability. Contingent liabilities are presented in the notes to the financial statements.
Estimated goodwill impairment
Impairment testing compares the book value of a group of units including goodwill and generating cash flow to its recoverable amount per year, and determines its possible impairment. The recoverable amount from the group of units generating cash flow is based on utility value calcula-tions. The discount rate takes industry-specific factors into account.
In the testing, the recoverable amount is estimated using budgets, forecasts and terminal periods, and the sensitivity of the calculations is analysed in terms of changes to the discount rate, profitability and residual values. Changes to these estimates or the structure or number of the units or unit groups may cause impairment of the fair values of commodities or goodwill. The estimates concern the expected selling prices of the products, the expected price development of the product costs, and the discount rate.

83CONSOLIDATED FINANCIAL STATEMENTS
3 ACCOUNTING PRINCIPLES OF THE CONSOLIDATED FINANCIAL STATEMENTS
Consolidation principles
Subsidiaries are companies where the Group has a control-ling interest. Control is created when the Group, through involvement in the entity, is exposed to the entity’s variable returns or is entitled to them, and can influence these returns by exercising its power on the entity.
The acquisition method has been used to eliminate mutual share ownership between the Group’s companies. Subsidi-aries are consolidated into the consolidated financial statements starting from the date when control is trans-ferred to the Group; assigned subsidiaries are retained in the consolidated financial statements until the date when control ceases to exist. The amount by which the acquisi-tion cost exceeds the Group’s share of the fair value of the purchased net identifiable assets is recorded as goodwill. If the acquisition cost is lower than the net assets of the acquired subsidiary, the difference is marked as income in the income statement.
Acquisition-related expenditure, excluding the expendi-ture from issuing current liability and equity convertible securities, has been recorded as expense. Any conditional additional purchase price has been measured at fair value at the moment of acquisition, and has been classified as liability or equity. Additional purchase price classified as liability is measured at fair value on each closing date, and the generated profit or loss is recorded through profit or loss. Additional purchase price classified as equity is not re-measured. Any non-controlling interests in the object acquired are measured at either fair value or an amount corresponding to the proportion of the non-controlling interests in the net identifiable assets of the object acquired. The measurement principle is defined separately for each business acquisition.
Intragroup transactions, receivables and payables as well as unrealised gains are eliminated when drawing up the consolidated financial statements. Unrealised losses are not eliminated if the loss is caused by impairment. Where necessary, the accounting principles of the financial state-ments of subsidiaries have been amended to correspond to those of the Group.
The distribution of the profit or loss for the financial period between the owners of the parent company and the minority shareholders is presented in the income statement. The distribution of the comprehensive income between the owners of the parent company and the minority share-holders is presented together with the comprehensive income statement. Comprehensive income is directed at minority shareholders, even if this would lead to the non-controlling interest becoming negative. The portion of equity belonging to minority shareholders is presented as a separate item on the balance sheet, as part of equity. Changes to the parent company’s holding in a subsidiary that will not lead to a loss of control are recorded as trans-actions concerning equity. If an acquisition is completed in stages, the earlier holding is measured at fair value, and the
generated profit or loss is recorded. When the Group loses its controlling interest in a subsidiary, the remaining portion is measured at fair value on the date of the loss of control, and the difference is recorded through profit or loss.
Associated companies are companies where the Group exercises a significant influence over the voting rights. A significant influence is mainly generated when the Group owns over 20 per cent of the company’s voting rights, or when the Group exercises a significant influence but does not have a controlling interest. Associated companies are consolidated into the consolidated financial statements using the equity method. If the Group’s share of the losses of an associated company exceeds the book value of the investment, the investment is recorded at zero value on the balance sheet; losses exceeding the book value are not consolidated unless the Group is committed to fulfilling the liabilities of the associated company. Any investment in an associated company includes the goodwill accrued from its acquisition. Unrealised gains between the Group and an associated company have been eliminated in accord-ance with the Group’s holding. The portion of the associ-ated companies’ income from the financial period corre-sponding to the Group’s holding is presented as a separate item after operating profit. Correspondingly, the Group’s share of the changes recorded in the other items of the associated company’s comprehensive income is entered in the other items of the Group’s comprehensive income.
The consolidated financial statements include the parent company Restamax Plc and its subsidiaries with their subsidiaries. The subsidiaries and associated companies consolidated into the consolidated financial statements are itemised in note 31.
Segment reporting
The Group’s operating segments, which are also reported segments, are the Group’s strategic business units: restau-rants and labour hire. These business units produce different products and services and they are managed as separate units, since their business requires applying a different strategy. The Group’s Executive Team has been named as the top operative decision-maker responsible for resource allocation and income estimates. The Group operates solely on the domestic market.
The segment information presented by the Group is based on the management’s internal reporting that is prepared in accordance with the IFRS standards. The pricing between segments is based on a fair market price. The Group’s assets and liabilities are not focused or monitored per segment in internal financial reporting.
The Group’s evaluation of profitability and decisions concerning the resources to be allocated to a segment are based on the segments’ EBITDA. It is the understanding of the management that this is the most suitable benchmark for comparing the profitability of the segments to other companies in their respective fields.

84
Items denominated in a foreign currency
The consolidated financial statements are presented in euros, which is the operating and presentation currency of the Group’s parent company.
Business transactions denominated in a foreign currency have been recorded in the functional currency, using the exchange rate in force on the date of the transaction. Monetary items denominated in a foreign currency have been converted into the functional currency using the exchange rates on the end date of the reporting period. Profits and losses generated by business transactions denominated in a foreign currency and conversion of monetary items have been recorded through profit of loss. Foreign exchange gains and losses are included in the corresponding items above operating profit. The Group has minor items denominated in a foreign currency.
Property, plant and equipment
Property, plant and equipment have been measured at their original acquisition cost less the accumulated depre-ciations and devaluations. The original acquisition cost includes the immediate costs for the purchase. Expendi-ture accumulated later is only included in the book value or recorded as a separate commodity if it is likely that the future economic benefit related to the commodity will be to the benefit of the Group, and if the acquisition cost of the commodity can be reliably defined. Repair and main-tenance costs are recorded through profit or loss for the period during which they were realised. If a fixed asset commodity consists of several parts with useful lives of different lengths, each part is processed as a separate commodity. As is typical for the segment, property, plant and equipment also includes periodic modification and renovation costs of the rental premises of restaurants; these consist of the interior finishing work of rental premises, for example.
Depreciation of property, plant and equipment is calcu-lated as degressive depreciations from the book value, or as straight-line depreciations, where the acquisition cost is recorded as expense over the useful lives as follows:
Machinery and equipment, residual value depreciation 25.0 per cent
Modification and renovation expenses for rental premises 5–10 years
Buildings 30 years
The residual values of tangible assets and their useful lives are verified at least once per year on the closing date, and adjusted by impairment when necessary. On each closing date, the Group evaluates whether there are signs that the value of an asset item has degraded. If the book value of an asset item is higher than its recov-erable amount, the book value of the asset item will be immediately lowered to match the recoverable amount. When property, plant and equipment are classified as available for sale in accordance with the IFRS 5 standard, the recording of depreciations is discontinued.
The profits and losses from the sales of tangible assets are included in the income statement as other operating income or expenses.
Intangible assets
The Group’s intangible assets mainly consist of goodwill generated from the combination of business operations as well as other intangible assets resulting from the same, such as the rights to use names, non-competition agreements and beneficial lease agreements.
Goodwill generated from the combination of business operations is recorded at the amount by which the assigned purchase consideration, the share of non-controlling interests in the object acquired and the previ-ously owned share combined exceed the fair value of the acquired net assets.
Depreciations of goodwill or other intangible assets with unlimited useful lives are not recorded; instead, they are tested for possible impairment each year. Non-compe-tition agreements that are valid until further notice are considered to have an unlimited useful life. Goodwill and the non-competition agreements mentioned above are measured according to their original acquisition cost less impairment.
Other intangible assets with a limited useful life that have been specified during the combination of business operations are recorded separately from goodwill on the balance sheet if they fit the definition of a commodity and can be itemised, or if they are created by agreements or legal rights and their fair value can be reliably defined. Such intangible assets are measured at their original acquisition cost and depreciated as straight-line depre-ciations during their known or estimated useful life as follows:
Right to use a name 5-10 yearsNon-competition agreement (limited) 2-3 yearsBeneficial lease agreements 2-10 yearsCustomer agreements 3-10 years
The Group did not have any research and development costs in 2016-2017.
Impairment of tangible and intangible assets
On each closing date, the Group evaluates whether there are signs that the value of an asset item has degraded. If these signs should appear, the recoverable amount for the asset item is estimated. Furthermore, recoverable amounts are estimated each year for the following asset items, regardless of whether there are signs that their value has degraded: goodwill, intangible assets with unlimited useful lives, and incomplete intangible assets. The need to record any impairment is examined on the level of the cash-flow generating unit or units; that is, the lowest level that is mostly independent of the other units and whose cash flow can be separated from the other cash flows.
The recoverable amount is the fair value of the asset item less the costs to sell, or the utility value, if it is higher. The utility value refers to the estimated deferred net cash flows that are available from the asset item or cash-flow

85CONSOLIDATED FINANCIAL STATEMENTS
generating unit, discounted to their present value. The discount rate is the rate before tax that presents the market’s view of the value of money over time, and the special risks related to the asset item or cash-flow gener-ating unit.
An impairment loss is recorded when the book value of an asset item is lower than its recoverable amount. The impairment loss is immediately recorded in the income statement. The impairment loss of a cash-flow gener-ating unit is primarily allocated to reduce the goodwill of the cash-flow generating unit, and secondly it is used to impair the unit’s other asset items on a pro rata basis. The useful life of a depreciable asset item is reassessed when an impairment loss is recorded. An impairment loss recorded for an asset item is reversed whenever a change occurs in the estimates that have been used to determine the recoverable amount of the asset item.
However, impairment loss is only reversed up to the book value of the commodity without any impairment loss. Impairment loss for goodwill is not reversed under any circumstances.
Lease agreements
The Group as a lessee
Lease agreements concerning property, plant and equipment where the Group has a material part of the risks and benefits of ownership are classified as finance lease agreements. Asset items acquired by means of such an agreement are recorded on the balance sheet at the commencement of the lease term at the fair value of the commodity, or at the present value of the minimum lease payments, whichever is lower. Commodities acquired using finance lease agreements are depreciated over the useful life of the commodity, or, whenever there is no certainty that ownership rights will be transferred to the lessee after the lease term, over a lease term that is shorter than the useful life. The lease payments paid are divided between finance charges and repayment of debt over the lease term, so that the remaining debt for each period will have the same interest rate. The lease liabili-ties are included in financial liabilities.
Lease agreements where the lessor is responsible for the risks and benefits of ownership are processed as other lease agreements. Lease payments on the basis of other lease agreements are recorded in the income statement as annuities over the lease term.
The Group as a lessor
Commodities leased out with agreements other than finance lease agreements are included in the property, plant and equipment on the balance sheet. They are depreciated over their useful life, similarly to property, plant and equipment used by the Group for similar purposes. Lease income is recorded into the income statement as annuities over the lease term.
Inventories
Inventories are measured according to their acquisition cost or their net realisable value, whichever is lower. Acquisition cost is defined using a weighted average
price method. Acquisition cost includes the immediate expenses for the purchase, with value added tax deducted. The net realisable value is the estimated selling price that can be achieved during ordinary course of business less the costs to sell.
Inventories include ingredients for restaurant food as well as alcohol and tobacco products.
Pension obligations
Pension obligations are defined as benefit-based or defined contribution plans. The Group’s pension plans in Finland, as required by legislation, have been classi-fied as defined contribution plans. In a defined contribu-tion plan, the Group pays fixed fees for a pension plan to a pension insurance company. The Group is not legally or constructively obligated to make additional payments if the recipient of the payments does not have sufficient funds to pay the pension benefits that the employees have earned for the current period or periods preceding it. In a defined contribution plan, the payments made are recorded into the income statement for the financial period that the charge applies to.
Income recognition principles
Sale of goods
The Group’s turnover is mostly generated from the sale of drinks, food and cigarettes within its restaurant business.
The amount of profit recorded at the time of sale consists of the fair value of the compensation that is or will be received for the sold item, less any value added tax as well as volume discounts and other discounts. Most of the Group’s income is generated from retail sales, where the payment instruments are cash and credit cards.
Sale of services
Sale of services is recorded as income for the financial period during which the service is performed and during which the financial benefits from the service will probably be received. The sale of services is also included in the Group’s turnover.
The Group’s service sales income is formed by the sales of labour hire operations, advertising space, marketing space or other similar space, as well as tickets.
Rental income
Rental income is recorded as annuities over the lease period.
Interest and dividends
Interest income is recorded using the effective interest method, and dividend yield is recorded for the period during which the right to the dividend has been generated.
Non-current asset items classified as held for sale and discontinued operation
Non-current asset items (or disposal groups) and assets and liabilities related to discontinued operation are classi-fied as held for sale if the amount corresponding to their

86
book value will mostly be generated by the sale of the asset item instead of continued use. The prerequisites for clas-sification as held for sale are considered to be met when the sale is highly probable and the asset item (or disposal group) can be immediately sold in its present condition using common terms, and when the management is committed to the sale and the sale is expected to take place within one year from the classification.
Immediately before the classification, the asset items classified as held for sale or the asset and liabilities of the disposal groups are measured according to the applicable IFRS standards. Starting from the classification, the asset items held for sale (or the disposal group) are measured at book value or fair value less the costs to sell, whichever is lower. The depreciation of these asset items is discontinued at the moment of classification.
Asset items in the disposal group that are not within the scope of the measurement rules of the IFRS 5 standard, as well as liabilities, are measured according to the applicable IFRS standards even after the moment of classification. .
Discontinued operation refers to a part of the Group that has been discontinued or classified as held for sale and that meets the classification criteria for discontinued operation under IFRS 5.
Net income for discontinued operations is presented as a separate item in the Group’s statement of comprehensive income. Asset items held for sale, disposal groups, items related to asset items held for sale that are recorded in other items of the comprehensive income and liabilities included in the disposal group are presented separately from the other items on the balance sheet.
EBITDA and operating profit
The standard IAS 1 Presentation of Financial Statements does not define the concepts of EBITDA or operating profit. The Group has defined them in the following way: EBITDA is the net sum created when other operating income is added to turnover, and the acquisition costs of materials and services adjusted by the changes in the inventory, staff expenses and other operating costs are deducted.
All income statement assets other than those mentioned above are presented below EBITDA; operating profit is the resulting net sum when depreciations and any impair-ment loss is deducted from EBITDA. Exchange differences are included in EBITDA, if they are due to items related to operating activities; otherwise, they are entered under financial items.
Provisions and contingent liabilities
A provision is entered when the Group has a judicial or constructive obligation for payment on the basis of a past event, the realisation of the obligation is probable and the size of the obligation can be reliably estimated. Provisions are measured at the present value required to cover the obligation. The discount factor used for calculating the present value is selected in a manner where it is repre-sentative of the market opinion of the value of money over time and the risks related to the obligation. If a part of the liability can be received as reimbursement from a third party, the reimbursement will be registered as a
separate asset item when the reimbursement has been practically ensured. The provision amounts are estimated on each closing date, and their amounts are adjusted to correspond to the best possible estimate at the moment of inspection. Changes in the provisions are entered in the income statement under the same item as the one where the provision was originally recorded.
A provision will be recorded for a contract that generates a loss when the necessary expenditures required to fulfil the obligations outweigh the benefits received from the contract.
A contingent liability is a possible liability arising from past events whose existence will only be confirmed when an uncertain event outside the Group’s control is realised. A present obligation that is not likely to cause a payment obligation, or whose size cannot be reliably determined, is also considered to be a contingent liability. Contingent liabilities are presented in the notes.
Income taxes
The tax costs in the income statement are based on the taxable income from the financial period and deferred tax. Taxes are recorded through profit or loss, except in cases where they are directly related to items regis-tered as equity or other items in the total comprehensive income. In these cases, their tax effects are also recorded as equity in these items. Tax based on the taxable income from the financial period is calculated using the taxable income and the applicable tax rate in each country. The taxes are adjusted by any taxes related to previous financial periods.
Deferred tax is calculated for any temporary differences between carrying amounts and tax bases. The largest temporary differences are generated by the differences between the carrying amounts and tax bases of property, plant and equipment, fair value adjustments of assets and liabilities during business combinations, and unused tax losses. Deferred taxes have been calculated using the tax rates that have been enacted or substantively enacted on the date of the closing of the books.
Deferred tax assets are recorded up to the probable amount of future taxable income against which the temporary difference can be utilised. The prerequisites for recording deferred tax assets are estimated in this respect on each closing date.
However, deferred tax liabilities are not recorded when the asset item or liability in question is one that would be originally entered into the bookkeeping, there is no combination of business operations involved, and the entry of such an asset item or liability does not affect the result of the bookkeeping or the taxable income at the time when the business transaction takes place.Deferred tax assets and liabilities are offset when the Group has a legally enforceable right to offset the current tax assets and liabilities, and when the deferred tax assets and liabilities are related to taxes on income collected by the same recipient, either from the same taxpayer or different taxpayers, when the aim is to realise the asset and liability in their net amounts.

87CONSOLIDATED FINANCIAL STATEMENTS
Financial assets and liabilities
Financial assets
According to the IAS 39 standard, the Group’s financial assets are classified into the following groups: financial assets recorded at fair value through profit or loss, loans and receivables and available-for-sale financial assets. The classification is performed on the basis of the purpose of the acquisition of the financial assets, and they are classified during their original acquisition.
Transaction expenses are included in the original book value of the financial assets mentioned above whenever the item is not measured at fair value through profit or loss. All purchases and sales of financial assets are entered on their trade date, which is the date when the Group commits to purchasing or selling the asset item.
An item belonging to financial assets is removed from the balance sheet whenever the Group waives its contractual rights to the item, the rights are dissolved or the Group loses control of the item.
The group of financial assets recorded at fair value through profit or loss includes financial assets that have been acquired to be held for trading, such as derivatives and interest funds, or that are classified to be recorded at fair value through profit or loss during their original recording. Unrealised and realised gains and losses are recorded into the income statement for the financial period during which they are generated.
Loans and other receivables are non-derivative financial assets that are generated by handing over goods, services or money to the debtor. Loans and receivables are not quoted on the marketplace, and the payments related to them are either fixed or they can be determined. Their measurement basis is the amortised acquisition cost using the effective interest method. On the balance sheet, they are included in the trade and other receivables group as current or non-current assets according to their nature; they are non-current, if they fall due no sooner than in 12 months’ time.
Available-for-sale financial assets are non-derivative assets that have been expressly classified into this group or that have not been classified into any others. They are non-current assets, unless the intention is to retain them for less than 12 months after the closing date; in this case, they are included in current assets. Available-for-sale financial assets may consist of shares and holdings. They are measured at fair value, or, whenever fair value cannot be reliably defined, at their acquisition cost. Changes in the fair value of available-for-sale financial assets are recorded as equity in the fair value fund in the other items of the comprehensive income statement, taking the tax effects into account. Accumulated changes in fair value are moved from equity into the income statement when the investment is sold or whenever its value has degraded to the point where an impairment loss must be entered for the investment.
Financial liabilities
According to IAS 39 standard, the Group’s financial liabil-ities are included in the financial liabilities measured at
amortised acquisition cost; they consist of loans from financial institutions, trade payables and other financial liabilities. Financial liabilities are originally recorded in bookkeeping at fair value. Transaction expenses are included in the original book value of the financial liabilities. Later, all financial liabilities are measured at amortised acquisition cost using the effective interest method. Financial liabilities are included in both the non-current and current liabilities.
Impairment of financial assets
On each closing date, the Group estimates whether objective evidence exists of the impairment of an indi-vidual financial asset or a group thereof. If the fair value of share investments has fallen substantially below their acquisition cost for a period defined by the Group, this is considered evidence of impairment of an available-for-sale share. If evidence of impairment exists, the loss accumulated in the fair value fund is moved to the income statement. The impairment loss of equity convertible investments classified as available-for-sale financial assets is not reversed by means of the income statement, whereas a later reversal of an impairment loss that involves interest instruments is recoded through profit or loss.
The Group will record an impairment loss for trade receiv-ables or other receivables when objective evidence exists that the counterparty will be unable to fulfil its obligation. Substantial financial difficulties on part of the debtor, probability of bankruptcy or default of payment constitute evidence of impairment. The size of the impairment loss recorded in the income statement is defined as the differ-ence between the book value of the receivable and the current value of the deferred cash flows discounted by the effective rate. If the amount of impairment loss is reduced during a later financial period, and the reduction can be objectively considered to be related to an event that took place after recording the impairment, the loss recorded is reversed and the reversal is recorded through profit or loss. Cash and cash equivalents
Cash and cash equivalents consist of cash money, money on bank accounts, bank deposits that may be withdrawn upon request, as well as other current and highly liquid investments that can be easily converted into a prede-termined cash amount and that carry a low risk of value changes. Items classified as cash and cash equivalent have at most three months’ maturity from the date of acquisition. Cash and cash equivalents are recorded at fair value on the balance sheet.
Borrowing costs
Borrowing costs are recorded as an expense for the period during which they were generated. Transaction costs accrued from the acquisition of loans are recognised as interest expenses using the effective interest method.
Share capital
Share capital consists solely of ordinary shares. The immediate expenditure from the issue or acquisition of new shares or other equity instruments, exclusive of tax, is recorded as equity, wherein it reduces the purchase consid-

88
eration received for the issue. If the company buys back its equity instruments, the acquisition cost of the instruments is deducted from equity.
Dividend distribution
Liability for dividend distribution to the Group’s share-holders is recorded for the period during which the general meeting approved the distribution of dividends.
New and revised standards and interpreta-tions to be applied later
IASB has published the following new and revised standards that the Group has not yet applied. The Group will be applying them starting from the effective date of each standard or interpretation, or, whenever the effective date is not the first day of the financial period, starting from the financial period following the effective date. (* The amendments have not yet been approved for application within the EU.)
· IFRS 15 Revenue from Contracts with Customers (effective in the EU for financial periods beginning on or after 1 January 2018). IFRS 15 defines a single revenue recognition model according to which a company must apply for the recognition of all customer contracts. The customer is a party that has entered into a contract with the company to receive goods and services produced by the company’s normal operations in exchange for a compensation. The basic principle of the standard is that the company must recognise revenue in such a way that they entries describe the provision of the promised goods and services to the customer, and the monetary amount must reflect the compensation to which the company expects to be entitled in exchange for the goods and services in question. The standard contains a signif-icant number of requirements concerning notes. IFRS 15 replaces the present standards concerning revenue recognition IAS 18 Revenue and IAS 11 Construction contracts and their related interpretations. The Group’s payment obligations consist of the supply of hired labour, individual goods and services in restaurants and sales revenue from advertising and marketing facilities. Primarily, the Group’s restaurant business is retail trade, and labour hire is hour-based service activity. In the Group’s franchise business, the contractual party makes an initial payment at the beginning of the contrac-tual relationship. According to the Group’s analysis, under the IFRS 15 standard the initial payment from a franchise contract should be recognised throughout the contractual period, which is five years in all contracts. As a result of the introduction of the new credit loss model, the adjustment to be recorded in the opening balance of accumulated earnings on 1 January is not material.
· Clarifications IFRS 15 Revenue from Contracts with Customers* (effective for financial periods beginning on or after 1 January 2018) was published in April 2016. The clarifications give additional guidance (a) for the recog-nition of contractual obligations, (b) for the assessment of the client-agent relationship and (c) for the appli-cation of licensing. The clarifications are not expected to have a significant impact on the Group. The Group
is examining the clarifications in connection with the introduction of the IFRS 15 standard.
· On 1 January 2018, Restamax will adopt the IFRS 9 Financial Instruments standard. IFRS 9 Financial Instruments and the amendments thereto replace the current IAS 39 standard. The new standard includes renewed guidelines for the recognition and measure-ment of financial instruments. This also covers the new accounting process model concerning expected credit losses, to be applied to determine the impair-ment recorded for financial assets. The most significant impact of the adoption of IFRS 9 is caused by the new credit loss model. The new model is based on expected credit losses, whereas the current model is based on realised credit losses. This results in the growth of the credit loss provision upon the implementation of the new guidelines. IFRS 9 contains a procedure, simplified from the general credit loss model, for trade receiva-bles, and for asset items which are based on customer contracts. According to this, the credit loss provision is recorded over the period of validity of the entire asset item to the amount of the expected credit losses, when the financial asset is recorded on the balance sheet for the first time. A majority of Restamax’s financial assets falling within the sphere of the new credit loss model are processed in accordance with the simplified procedure described above, with the help of a provision matrix. With the adoption of the new credit loss model, an adjustment of MEUR 0.6 will be recorded in the opening balance of equity on 1 January 2018.
· IFRS 16 Leases was published in January 2016 (effective for financial periods beginning on or after 1 January 2019). IFRS 16 establishes the requirements for recog-nition, measurement, presentation and disclosure of leases. According to the standard, all leases of the lessee are processed in the same way such that the lessee records the asset items and liabilities of all leases on the balance sheet, unless the rental period is 12 months or shorter, or unless the value of the leased property is low. The lessors further categorise the leases into finance leases and other leases. The implementation of the new standard will affect how leases are presented in the consolidated financial statements. The standard will have a material impact on Restamax Plc’s consolidated financial statements, and it will significantly change the Group’s operative EBITDA level. At the same time, the new recording practice will result in the deterioration of the Group’s equity ratio. Restamax Plc will not adopt the standard before 1 January 2019. Restamax Plc will adjust the reference figures to meet the requirements of the standard. In the 2017 financial statements, the Group has some MEUR 73 of lease liabilities
No other already published but not yet valid new standard, standard revision or IFRIC interpretation is expected to have an impact on the Group’s reporting.

89CONSOLIDATED FINANCIAL STATEMENTS
4 MANAGEMENT OF FINANCIAL RISKS
31/12/2017
EUR thousand Note Balance sheet value
Cash flow Less than 1 year
1 to less than 2 years
2–5 years over 5 years
Financial liabilities 19 46,283.6 48,391.7 12,922.6 11,140.0 22,565.5 1,763.6
31/12/2016
EUR thousand Note Balance sheet value
Cash flow Less than 1 year
1 to less than 2 years
2–5 years over 5 years
Financial liabilities 19 32,562.9 34,505.5 8,504.4 14,038.1 8,180.4 3,782.6
Risk management principles and process
The Group’s operating activities expose it to certain financial risks, such as the effects of changes in interest rates. A key principle of the Group’s risk management is the unpredictability of the financial markets and the aim to minimise their adverse effects on the Group’s net income. The Group’s financial management identifies and estimates the risks and, whenever necessary, acquires the instruments to protect the Group against the risks.
The Group’s financing policy guides all of its financing transactions. The main risks on the financing market are explained below.
Interest rate risk
The Group’s interest rate risk is mainly caused by non-current loans that have been taken out with a variable interest rate. The Group is not presently hedging against the interest rate risk. The interest rates for the loans vary between the 1- and 6-month Euribor rates plus margins of 1.65–2.00%.
The Group’s income and operative cash flows are mostly independent of the variations in the market rates of interest. The Group’s main exposure to interest rate risk is a result of the variable interest rates, and the risk is mainly considered to relate to the loan portfolio. On the closing date, 100.0% of the Group’s loans had variable interest rates.
Liquidity risk
The Group aims to continuously estimate and follow up on the financing required for the operating activities, such as by performing a monthly analysis of the utilisation rate of the restaurants, the development of sales and investment needs, in order to ensure that the Group has sufficient liquid assets to finance its operations and pay back due loans. The CFO analyses the need for possible additional financing.
The aim is to ensure the availability and flexibility of Group financing by using sufficient credit limit reserves, a balanced loan maturity distribution and sufficiently long loan periods, and using several financial institutions and forms of financing when necessary. The Group’s financing activities determine the optimum cash liquidity.
The Group’s liquidity remained good throughout 2017. At the end of the year, cash and cash equivalents amounted to TEUR 2,570.0 (1,871.1 on 31 December 2016), in addition to which the Group had access to undrawn confirmed account credit limits totalling some MEUR 9.3 (31 December 2016: MEUR 4.9).
During the year, the Group drew TEUR 19,135.0 of new non-current financing for its investments. The loan period for these financing arrangements is 5–6 years. The average annual interest rate for the Group’s gross interest-bearing liabil-ities in 2017 was approximately 2.01% (2.3% in 2016).
The most important loan covenants are reported to the creditors each quarter. If the Group violates the terms of the loan covenant, the creditor may require faster repayment for the loans. The management regularly monitors the fulfilment of the loan covenant terms. During the 2017 financial period, the Group has been able to fulfil all the loan covenant terms related to specific operative cash flow objectives, equity ratio and amount of investment.
The Group’s management has not identified any significant accumulation or liquidity risk in financial assets or sources of financing.
The following table presents the maturity analysis. Negative numbers indicate incoming cash. The numbers are undis-counted and include interest payments, capital amortisation and repayments.

90
Credit risk
The Group’s course of action defines the creditworthiness requirements for the customers’ counterparties. The primary method of payment within the Group is cash. The business operations of the labour hire segment are based on invoice sales. The credit risk management and credit control have been centralised to be handled by the Group’s financial management.
As regards the receivables of the restaurant segment, the Group does not have any material credit risk accumulation, since the receivables consist of several items. Risks related to trade receivables and other receivables of the restaurant segment are minimised using short payment terms, customer-specific monitoring of trade receivables, and effective collection.
As concerns trade receivables, the labour hire segment has a credit loss risk typical of the nature of its business and the field. In addition, certain big customers of the labour hire segment have been paid marketing support, the earning of which is based on customers’ future purchases and the payment of the trade receivables generated from them. In the labour hire segment, the trade receivables and marketing supports of certain big customers together form significant credit risk concentrations. The risks linked with the trade receivables and other receivables of the labour hire segment are minimised by means of terms of payment of the receivables, customer-specific monitoring of trade receivables, effective collecting and checking of customers’ creditworthiness requirements, and in part also through various collat-eral arrangements.
The labour hire business may increase the Group’s credit losses or the need for making credit loss reservations.
The maturity distribution of the receivables is presented in note 13, Receivables.
During the financial period, the Group had TEUR 423.2 in credit losses recorded through profit or loss (TEUR 72.1 in 2016).
Capital management
The aim of the Group’s capital management (equity vs. liabilities) is to create an optimal capital structure that can support business operations by ensuring normal operational prerequisites, and to increase shareholder value in the long term. The capital structure can be mainly affected by means of dividend distribution, subordinated loans and equity issues. The Group can also decide to sell its asset items in order to reduce its liabilities. The managed capital is the equity indicated in the consolidated balance sheet. An optimal capital structure also reduces capital costs.
The Group’s gearing ratios were as follows:
EUR thousand 2017 2016
Interest-bearing liabilities 46,344.8 32,562.9
Interest-bearing receivables -125.3 -125.3
Cash and cash equivalents -2,570.0 -1,871.1
Net liabilities 43,649.5 30,566.5
Equity, total 46,892.9 43,961.8
Gearing ratio 93.1,% 69.5,%
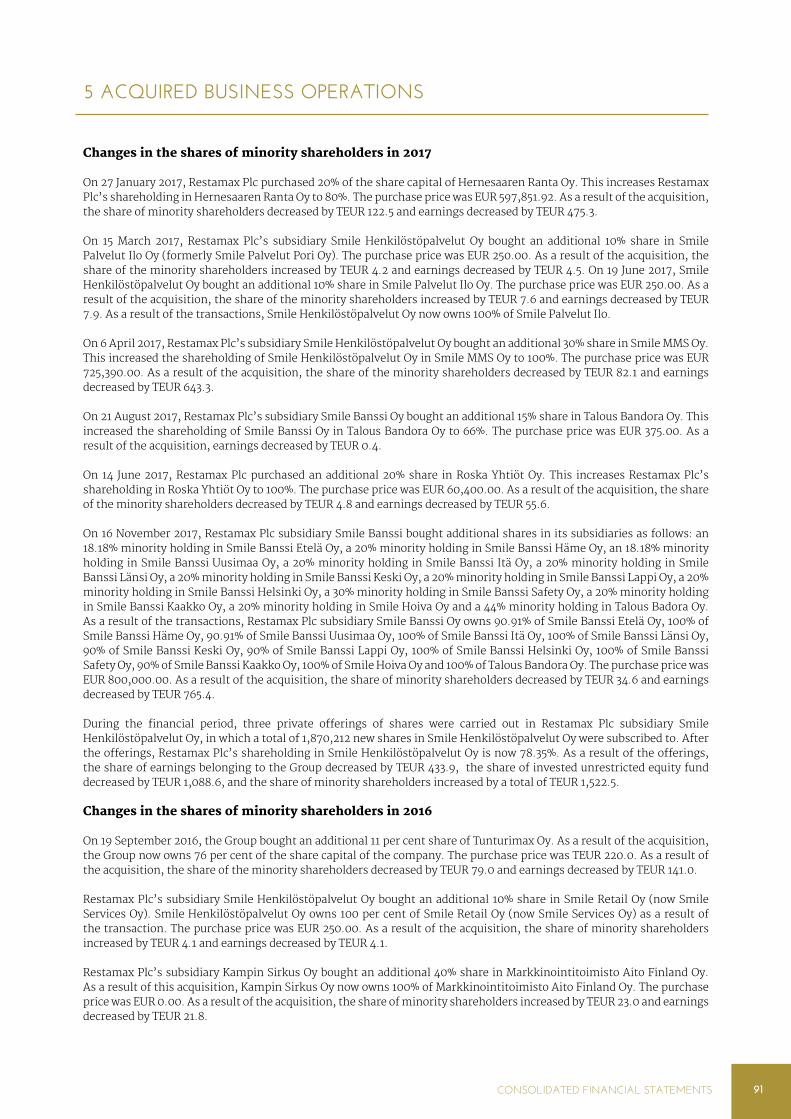
91CONSOLIDATED FINANCIAL STATEMENTS
5 ACQUIRED BUSINESS OPERATIONS
Changes in the shares of minority shareholders in 2017
On 27 January 2017, Restamax Plc purchased 20% of the share capital of Hernesaaren Ranta Oy. This increases Restamax Plc’s shareholding in Hernesaaren Ranta Oy to 80%. The purchase price was EUR 597,851.92. As a result of the acquisition, the share of minority shareholders decreased by TEUR 122.5 and earnings decreased by TEUR 475.3.
On 15 March 2017, Restamax Plc’s subsidiary Smile Henkilöstöpalvelut Oy bought an additional 10% share in Smile Palvelut Ilo Oy (formerly Smile Palvelut Pori Oy). The purchase price was EUR 250.00. As a result of the acquisition, the share of the minority shareholders increased by TEUR 4.2 and earnings decreased by TEUR 4.5. On 19 June 2017, Smile Henkilöstöpalvelut Oy bought an additional 10% share in Smile Palvelut Ilo Oy. The purchase price was EUR 250.00. As a result of the acquisition, the share of the minority shareholders increased by TEUR 7.6 and earnings decreased by TEUR 7.9. As a result of the transactions, Smile Henkilöstöpalvelut Oy now owns 100% of Smile Palvelut Ilo.
On 6 April 2017, Restamax Plc’s subsidiary Smile Henkilöstöpalvelut Oy bought an additional 30% share in Smile MMS Oy. This increased the shareholding of Smile Henkilöstöpalvelut Oy in Smile MMS Oy to 100%. The purchase price was EUR 725,390.00. As a result of the acquisition, the share of the minority shareholders decreased by TEUR 82.1 and earnings decreased by TEUR 643.3.
On 21 August 2017, Restamax Plc’s subsidiary Smile Banssi Oy bought an additional 15% share in Talous Bandora Oy. This increased the shareholding of Smile Banssi Oy in Talous Bandora Oy to 66%. The purchase price was EUR 375.00. As a result of the acquisition, earnings decreased by TEUR 0.4.
On 14 June 2017, Restamax Plc purchased an additional 20% share in Roska Yhtiöt Oy. This increases Restamax Plc’s shareholding in Roska Yhtiöt Oy to 100%. The purchase price was EUR 60,400.00. As a result of the acquisition, the share of the minority shareholders decreased by TEUR 4.8 and earnings decreased by TEUR 55.6.
On 16 November 2017, Restamax Plc subsidiary Smile Banssi bought additional shares in its subsidiaries as follows: an 18.18% minority holding in Smile Banssi Etelä Oy, a 20% minority holding in Smile Banssi Häme Oy, an 18.18% minority holding in Smile Banssi Uusimaa Oy, a 20% minority holding in Smile Banssi Itä Oy, a 20% minority holding in Smile Banssi Länsi Oy, a 20% minority holding in Smile Banssi Keski Oy, a 20% minority holding in Smile Banssi Lappi Oy, a 20% minority holding in Smile Banssi Helsinki Oy, a 30% minority holding in Smile Banssi Safety Oy, a 20% minority holding in Smile Banssi Kaakko Oy, a 20% minority holding in Smile Hoiva Oy and a 44% minority holding in Talous Badora Oy. As a result of the transactions, Restamax Plc subsidiary Smile Banssi Oy owns 90.91% of Smile Banssi Etelä Oy, 100% of Smile Banssi Häme Oy, 90.91% of Smile Banssi Uusimaa Oy, 100% of Smile Banssi Itä Oy, 100% of Smile Banssi Länsi Oy, 90% of Smile Banssi Keski Oy, 90% of Smile Banssi Lappi Oy, 100% of Smile Banssi Helsinki Oy, 100% of Smile Banssi Safety Oy, 90% of Smile Banssi Kaakko Oy, 100% of Smile Hoiva Oy and 100% of Talous Bandora Oy. The purchase price was EUR 800,000.00. As a result of the acquisition, the share of minority shareholders decreased by TEUR 34.6 and earnings decreased by TEUR 765.4.
During the financial period, three private offerings of shares were carried out in Restamax Plc subsidiary Smile Henkilöstöpalvelut Oy, in which a total of 1,870,212 new shares in Smile Henkilöstöpalvelut Oy were subscribed to. After the offerings, Restamax Plc’s shareholding in Smile Henkilöstöpalvelut Oy is now 78.35%. As a result of the offerings, the share of earnings belonging to the Group decreased by TEUR 433.9, the share of invested unrestricted equity fund decreased by TEUR 1,088.6, and the share of minority shareholders increased by a total of TEUR 1,522.5. Changes in the shares of minority shareholders in 2016
On 19 September 2016, the Group bought an additional 11 per cent share of Tunturimax Oy. As a result of the acquisition, the Group now owns 76 per cent of the share capital of the company. The purchase price was TEUR 220.0. As a result of the acquisition, the share of the minority shareholders decreased by TEUR 79.0 and earnings decreased by TEUR 141.0.
Restamax Plc’s subsidiary Smile Henkilöstöpalvelut Oy bought an additional 10% share in Smile Retail Oy (now Smile Services Oy). Smile Henkilöstöpalvelut Oy owns 100 per cent of Smile Retail Oy (now Smile Services Oy) as a result of the transaction. The purchase price was EUR 250.00. As a result of the acquisition, the share of minority shareholders increased by TEUR 4.1 and earnings decreased by TEUR 4.1.
Restamax Plc’s subsidiary Kampin Sirkus Oy bought an additional 40% share in Markkinointitoimisto Aito Finland Oy. As a result of this acquisition, Kampin Sirkus Oy now owns 100% of Markkinointitoimisto Aito Finland Oy. The purchase price was EUR 0.00. As a result of the acquisition, the share of minority shareholders increased by TEUR 23.0 and earnings decreased by TEUR 21.8.

92
Acquisitions during the 2017 financial period
Acquired subsidiaries and businesses
Restamax Plc purchased 60% of the share capital of a company called Thai Papaya Oy engaged in the restaurant business, with a deed of sale dated 29 December 2016. The ownership of the shares was transferred to Restamax Plc on 1 January 2017.
With a deed of sale dated 10 February 2017, Restamax Plc’s subsidiary engaging in the restaurant business bought the businesses and equipment of Hullu Poro, Jackie Brown, Jackie Brown Gold, von Nottbeck in Näsilinna and the Laituri summer restaurant as well as the Kirjuri summer restaurant in Pori. The right of ownership and possession of the object of the transaction was transferred to the Group on 1 March 2017.
Restamax Plc’s subsidiary engaging in the restaurant business purchased the restaurant business of restaurant Gloria operating in Joensuu with a deed of sale dated 27 January 2017. The right of ownership and management of Gloria was transferred to the Group on 1 March 2017.
With a deed of sale dated 17 February 2017, Restamax Plc bought the business of Yo-Talo, which is engaged in the restaurant and event business. The right of ownership and possession of the object of the transaction was transferred to Restamax Plc on 15 March 2017.
Restamax Plc’s subsidiary engaging in the restaurant business purchased the restaurant business of restaurant Sinisoihtu with a deed of sale dated 31 March 2017. The right of ownership and possession of the object of the transac-tion was transferred upon the signing of the deed of sale.
With a deed of sale dated 5 April 2017, Restamax Plc bought the business and equipment of a restaurant in Eerikinkatu in Turku. The right of ownership of the object of the transaction was transferred on 11 April 2017.
With a deed of sale dated 27 January 2017, Restamax Plc bought the business and fixed assets of a restaurant situated at Eteläesplanadi 22. The right of ownership of the object of the transaction was transferred on 1 April 2017.
With a deed of sale dated 4 April 2017, Restamax Plc’s subsidiary engaging in the restaurant business bought a café-restaurant business in the area of Ruovesi Harbour, with all related buildings and movable property. The right of ownership of the object of the transaction was transferred on 3 May 2017.
Restamax Plc’s subsidiary engaging in the restaurant business purchased the business and fixed assets of a restaurant situated in Pori with a deed of sale dated 5 May 2017. The right of ownership of the object of the transaction was trans-ferred on 5 May 2017.
With a deed of sale dated 2 June 2017, Restamax Plc purchased 90% of the shares in Harry’s Ravintolat Oy. The ownership of the shares was transferred on 2 June 2017.
With a deed of sale dated 31 March 2017, Restamax Plc’s subsidiary engaging in the restaurant business bought 80% of the shares in Tillikka Oy. The ownership of the shares was transferred on 1 April 2017.
With a deed of sale dated 25 October 2017, Restamax Plc’s subsidiary engaging in the labour hire business purchased the restaurant labour hire business operations of Active People Oy. The right of ownership and possession of the object of the transaction was transferred on 31 October 2017. In connection with the transaction, a long customer contract was signed on restaurant labour hire services with Ravintola Santa Fé Oy.

93CONSOLIDATED FINANCIAL STATEMENTS
Note Values recorded
Intangible assets 976.9
Tangible assets 1,325.2
Inventories 279.5
Current receivables 188.4
Cash and cash equivalents 559.8
Assets in total 3,329.8
Deferred tax liabilities 68.3
Financial liabilities 200.4
Other payables 527.7
Liabilities total 796.4
Net assets 2,533.4
Generation of goodwill through acquisitions:
Total purchase consideration 6,187.8
Minority shareholders’ share -79.1
Net identifiable assets of the acquired entity 2,533.4
Goodwill 3,733.5
At the moment of transfer of control, the values of the businesses acquired were as follows:
Note Values recorded
Intangible assets 2,412.1
Tangible assets 42.3
Inventories 112.4
Investments 0.9
Non-current receivables 1.0
Current receivables 2,552.7
Cash and cash equivalents 970.5
Assets in total 6,092.0
Deferred tax liabilities 482.4
Financial liabilities 61.2
Other payables 3,306.3
Liabilities total 3,849.9
Net assets 2,242.1
Generation of goodwill through acquisitions:
Total purchase consideration 7,609.8
Net identifiable assets of the acquired entity 2,242.1
Goodwill 5,367.7
Restamax Plc’s subsidiary engaging in the labour hire business, Smile Henkilöstöpalvelut Oy, bought the entire share capital of Smile Banssi Oy (formerly Pasianssi Oy) with a deed of sale dated 5 April 2017. The business and ownership of the object of the transaction were transferred to the Group on 5 April 2017. Smile Banssi Oy’s subsidiaries are Smile Banssi Etelä Oy (formerly Banssi etelä Oy), Smile Banssi Pohjoinen Oy (formerly Banssi pohjoinen Oy), Smile Banssi Häme Oy (formerly Banssi häme Oy), Smile Banssi Uusimaa Oy (formerly Banssi uusimaa Oy), Smile Banssi Itä Oy (formerly Banssi itä Oy), Smile Banssi Länsi Oy (formerly Banssi länsi Oy), Smile Banssi Keski Oy (formerly Banssi keski Oy), Smile Banssi Kaakko Oy (formerly Banssi kaakko Oy), Smile Banssi Lappi Oy (formerly Banssi lappi Oy), Smile Banssi Helsinki Oy (formerly Banssi Helsinki Oy), Smile Banssi Safety Oy (formerly Banssi Safety Oy), Smile Rmax Oy (formerly Banssi Hoiva Oy) and Talous Bandora Oy.
The sale value of assets regarding the shareholding of Smile Banssi Oy has been adjusted in the financial period. The adjustment has been recorded through profit or loss by reducing the sale price by TEUR 75.1.
At the moment of transfer of control, the values of the businesses acquired were as follows:

94
With a deed of sale dated 1 July 2017, Restamax Plc’s subsidiary engaging in the labour hire business purchased 100% of the shares in Smile Job Services One Oy (formerly Job Services One Oy). The right of ownership of the shares was transferred on 1 July 2017. A part of the sale price has been paid with Restamax Plc subsidiary’s shares involving a fixed-term repurchase obligation. At the time of the closing of the accounts, the recorded sale price includes a share, which includes an assessment by the management on the future, final sale price to materialise.
The estimated additional purchase price regarding the shareholding of Smile Job Services One Oy has been adjusted in the financial period. The adjustment has been recorded through profit or loss by increasing the sale price by TEUR 1,711.1.
At the moment of transfer of control, the values of the businesses acquired were as follows:
Note Values recorded
Intangible assets 3,718.2
Tangible assets 9.9
Current receivables 2,564.7
Cash and cash equivalents 865.6
Assets in total 7,158.5
Deferred tax liabilities 743.6
Other payables 2,674.2
Liabilities total 3,417.9
Net assets 3,740.6
Generation of goodwill through acquisitions:
Total purchase consideration 11,188.4
Net identifiable assets of the acquired entity 3,740.6
Additional purchase price under the earn-out arrangement 1,711.1*
Goodwill 5,736.7
* The additional purchase price under the earn-out arrangement has been recorded in the financial period through profit or loss in financing costs.
The acquisitions generated a total of TEUR 14,838.0 in goodwill based on expected synergy benefits, establishment into new market areas and expected gains from combining the acquired restaurants and labour hire operations with the Group's other restaurant concepts and services. TEUR 7,107.3 of the intangible rights generated from the fair value allocation recorded are tax-deductible. The effect of the acquisitions on the Group's turnover for 2017 was TEUR 39,676.6, and the effect on the result of the financial period was TEUR 670.1.
The effect of the acquisitions on the Group's turnover for the entire financial period 1 January-31 December 2017 was TEUR 59,617.0, and the effect on the result of the financial period was TEUR 1,693.0.

95CONSOLIDATED FINANCIAL STATEMENTS
Acquisitions during the 2016 financial period
Acquired subsidiaries and businesses
Restamax Plc’s subsidiary engaging in the restaurant business purchased the restaurant business of Food Bar & Kitchen operating in Jyväskylä through a deed of sale dated 2 January 2016.
Restamax Plc’s subsidiary engaging in the labour hire business purchased the labour hire business of TOR through a deed of sale dated 1 January 2016.
Restamax Plc’s subsidiary engaging in the restaurant business purchased the restaurant business of restaurant Namu and Showroom located in Helsinki through a deed of sale dated 24 March 2016. The business operations were transferred to Restamax Group on 1 April 2016.
Restamax Plc’s subsidiary engaging in the labour hire business purchased 70% of the share capital of limited liability company Make My Solutions Oy with a deed of sale dated 23 March 2016 (the name of the company was changed to Smile MMS Oy on 2 May 2015). Smile MMS Oy owns 70% of the share capital of Smile MMS Työllistämispalvelut Oy, which engages in the labour hire business. The ownership of the shares which the transaction concerns was transferred to Restamax Group on 1 May 2016.
Restamax Plc purchased 80 per cent of the share capital of Urban Group Oy with a deed of sale dated 29 April 2016. Urban Group Oy owns 100% of the share capital of Cholo Oy, which engages in the restaurant business, and 100% of the share capital of Sabor a México Oy, which engages in the restaurant business. The ownership of the shares which the transac-tion concerns was transferred to Restamax Group on signing the deed of sale.
At the moment of transfer of control, the values of the business operations and assets of the subsidiary acquired were as follows:
Note Values recorded
Tangible assets 10 753.5
Intangible assets 9 1,345.3
Inventories 12 30.7
Trade and other receivables 666.7
Cash and cash equivalents 596.2
Assets in total 3,392.4
Financial liabilities -42.0
Deferred tax liabilities 17 -76.0
Other payables -949.5
Liabilities total -1,067.6
Net assets 2,324.8
Generation of goodwill through acquisitions:
Total purchase consideration
Cash assets 2,643.0
Liabilities 404.7 3,047.7
Minority shareholders’ share 263.7
Net identifiable assets of the acquired entity 2,324.8
Goodwill 1,299.5
Negative goodwill from one acquisition, which has been recorded as revenue in other operating income
-312.8
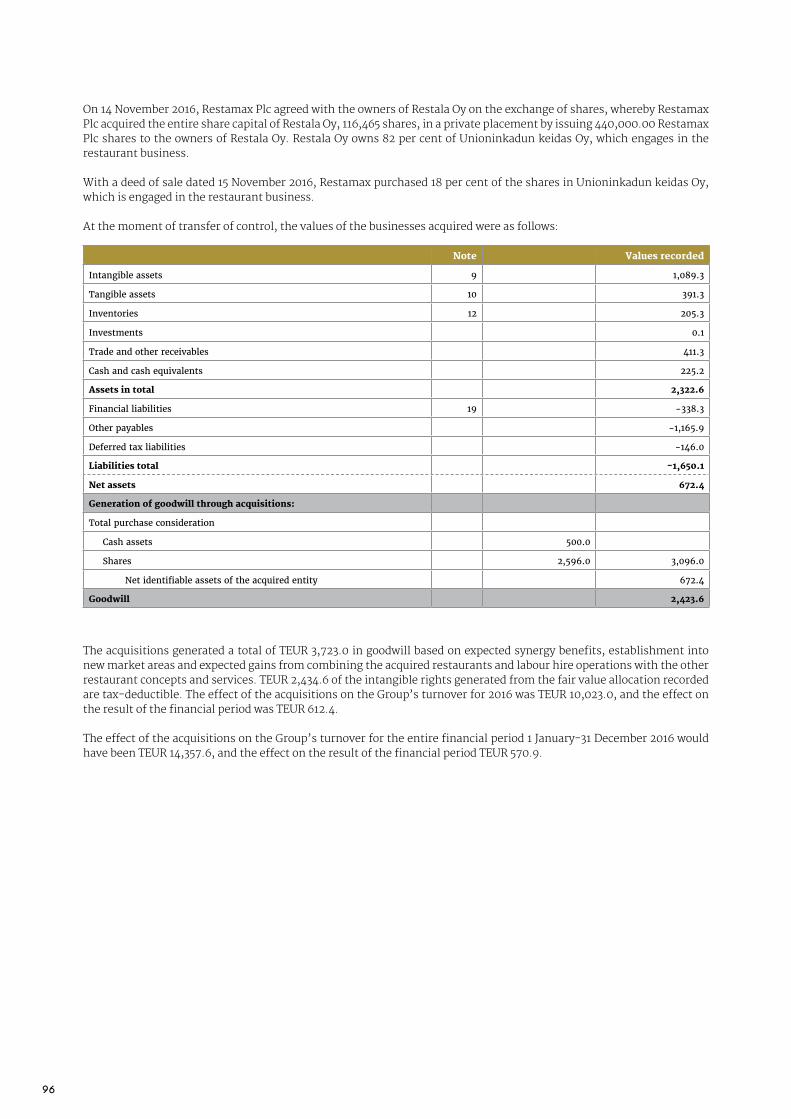
96
On 14 November 2016, Restamax Plc agreed with the owners of Restala Oy on the exchange of shares, whereby Restamax Plc acquired the entire share capital of Restala Oy, 116,465 shares, in a private placement by issuing 440,000.00 Restamax Plc shares to the owners of Restala Oy. Restala Oy owns 82 per cent of Unioninkadun keidas Oy, which engages in the restaurant business.
With a deed of sale dated 15 November 2016, Restamax purchased 18 per cent of the shares in Unioninkadun keidas Oy, which is engaged in the restaurant business.
At the moment of transfer of control, the values of the businesses acquired were as follows:
Note Values recorded
Intangible assets 9 1,089.3
Tangible assets 10 391.3
Inventories 12 205.3
Investments 0.1
Trade and other receivables 411.3
Cash and cash equivalents 225.2
Assets in total 2,322.6
Financial liabilities 19 -338.3
Other payables -1,165.9
Deferred tax liabilities -146.0
Liabilities total -1,650.1
Net assets 672.4
Generation of goodwill through acquisitions:
Total purchase consideration
Cash assets 500.0
Shares 2,596.0 3,096.0
Net identifiable assets of the acquired entity 672.4
Goodwill 2,423.6
The acquisitions generated a total of TEUR 3,723.0 in goodwill based on expected synergy benefits, establishment into new market areas and expected gains from combining the acquired restaurants and labour hire operations with the other restaurant concepts and services. TEUR 2,434.6 of the intangible rights generated from the fair value allocation recorded are tax-deductible. The effect of the acquisitions on the Group’s turnover for 2016 was TEUR 10,023.0, and the effect on the result of the financial period was TEUR 612.4.
The effect of the acquisitions on the Group’s turnover for the entire financial period 1 January-31 December 2016 would have been TEUR 14,357.6, and the effect on the result of the financial period TEUR 570.9.

97CONSOLIDATED FINANCIAL STATEMENTS
6 SOLD BUSINESS OPERATIONS
Business operations sold during the 2017 financial period
During the financial period, the Group sold shares in subsidiaries and restaurant businesses as follows:
Name Shareholding sold Location Date of control transfer
Max Siivouspalvelut Oy 70% Tampere 28/02/2017
Restaurant, Helsinginkatu 11 100% Helsinki 01/09/2017
Restaurant, Suupantie 6 100% Pirkkala 01/11/2017
Restaurant, Lönnrotinkatu 9 100% Helsinki 12/12/2017
At the moment of transfer of control, the values of the assets sold were in total as follows:
Property, plant and equipment 65,386.86
Other asset items 229,695.57
Liabilities -106,579.25
Net assets, total 188,503.18
At completed sales, there was impairment targeted at the goodwill recorded for the units. Goodwill impairment targeted at sales has been recorded as deduction of goodwill as follows:
Of completed sales, sales profit of TEUR 95.0, loss from the assignment of fixed assets of TEUR 2.2, and impairment loss of TEUR 24.7 were targeted at the comprehensive income statement.
Business operations sold during the 2016 financial period
During the financial period, the Group sold shares in restaurant businesses as follows:
The assets of the sold restaurant at the time of the transfer of control were as follows:
Name Sold Location Date of control transfer
Ravintola Minibaari 100% Tampere 18/04/2016
Property, plant and equipment 43.6
There was impairment targeted at this transaction, at the goodwill recorded for the unit. Impairment losses have been recorded in the extensive consolidated income statement in the line “Depreciations, amortisations and impairment” as follows:
Intangible rights, goodwill 158,340.85
Intangible rights, goodwill 15.0

98
7 EARNINGS PER SHARE
The undiluted earnings per share is calculated by dividing the profit for the financial period belonging to the share-holders of the parent company by the weighted average of the shares outstanding during the financial period.
2017 2016
Profit for the financial period belonging to the shareholders of the parent company (TEUR)
5,060.7 5,608.1
Weighted average of the number of outstanding shares during the financial period
16,619,620 16,235,842
Earnings per share (euros), undiluted 0.30 0.35
Earnings per share (euros), diluted 0.30 0.35
The Group does not have any diluting instruments, i.e. instruments that increase the number of ordinary shares.

99CONSOLIDATED FINANCIAL STATEMENTS
8 OPERATING SEGMENTS
The Group has two reported operating segments, which are its strategic business units.
The Group’s reported operating segments are as follows:
Restaurants Production of restaurant services
Labour hire Production of labour hire services
The restaurants segment operates in all sectors of the restaurant business, offering different types of restaurant expe-riences to customers’ needs; the segment operates on the principle of “from the morning until late at night”, offering both restaurants and nightclubs. The segment has a total of 70 concepts, approximately half of which are designed for duplication. Well-known restaurant concepts of the Group include Viihdemaailma Ilona, Classic American Diner, Daddy’s Diner, Stefan’s Steakhouse, Galaxie Center and Space Bowling & Billiards.
The labour hire segment offers labour hire services to companies operating in several different fields. The majority of the turnover of the segment is generated from the HoReCa and construction fields. The earnings from the segment are derived from labour hire activities.
2017
Net income Restaurants Labour hire Eliminations Group
Turnover 122,173.5 75,612.2 -11,929.5 185,856.2
Other operating income 2,188.3 231.7 -610.3 1,809.7
EBITDA 16,325.0 6,602.6 -523.5 22,404.2
Depreciations -9,405.3 -2,768.7 536.5 -11,637.4
Operating profit 6,919.7 3,834.0 13.0 10,766.7
Profit/loss before taxes 6,344.1 1,680.6 0.0 8,024.8
Assets 2017
Assets of the reported segment 101,037.8 44,728.5 -12,705.8 133,060.5
Liabilities
Liabilities of the reported segment 60,025.0 39,353.2 -13,210.5 86,167.6
In 1 January–31 December 2017, the labour hire segment includes as a cost non-recurring asset transfer tax in the total amount of EUR 299,569.34 resulting from the subsidiary transactions concluded.
In the financial period 1 January-31 December 2017, the financial costs of the Labour hire segment included the non-recurring item of the adjustment of TEUR 1,711.1 to the estimated additional sales price related to the share acquisition of Smile Job Service One Oy (now Smile Job Services Oy).
2016
Net income Restaurants Labour hire Eliminations Group
Turnover 107,544.2 34,129.4 -11,601.7 130,071.9
Other operating income 3,036.2 69.2 -571.5 2,533.9
EBITDA 16,475.1 3,441.5 -517.8 19,398.8
Depreciations -9,074.1 -1,844.6 517.8 -10,400.9
Operating profit 7,401.0 1,596.9 0.0 8,997.9
Profit/loss before taxes 6,547.2 1,358.4 -11.7 7,893.9
Assets 2016
Assets of the reported segment 91,114.9 18,244.6 -11,693.4 97,666.0
Liabilities
Liabilities of the reported segment 48,649.0 18,456.2 -13,401.0 53,704.2
Henkilöstövuokraussegmentissä tehtiin 1.1.-31.12.2016 ylimääräinen liikevoittoa rasittava kertaluontoinen poisto 338.416,67 euroa seurauksena aiemmin 2014 henkilöstöpalveluiden hankinnan yhteydessä arvostettuihin aineet-tomiin hyödykkeisiin, jotka nyt konsernin ostaman Namun hankinnasta johtuen ovat konsernin sisäisiä.

100
9 INTANGIBLE ASSETS
31/12/2017EUR,thousand Note Goodwill Intangible,rights Total
Acquisition,cost,1,January,2017 38,067.5 15,821.7 53,889.0
Business,combination 14,838.0 7,107.4 21,945.4
Additions 0.0 517.7 517.7
Deductions -158.3 -0.5 -158.9
Transfers,between,items 0.0 369.0 369.0
Acquisition,cost,31,January,2017 52,747.2 23,815.2 76,562.2
Accumulated,depreciations,and,impairments, 1,January,2017 -175.9 -6,277.6 -6,453.3
Impairments -24.7 0.0 -24.7
Depreciations 0.0 -3,864.6 -3,864.6
Accumulated,depreciations,and,impairments,31,December,2017 -200.6 -10,142.2 -10,342.6
Book,value,31,December,2017 52,546.6 13,673.2 66,219.7
Book,value,1,January,2017 37,891.6 9,544.3 47,435.8
31/12/2016EUR thousand Note Goodwill Intangible rights Total
Acquisition cost 1 January 2017 34,350.8 13,095.7 47,446.4
Business combination 3,723.0 2,075.3 5,798.3
Additions 0.0 1,037.9 1,037.9
Deductions -6.4 -387.2 -393.6
Acquisition cost 31 January 2016 38,067.5 15,821.7 53,889.0
Accumulated depreciations and impairments 1 January 2016 -160.9 -3,484.2 -3,644.9
Impairments -15.0 0.0 -15.0
Depreciations 0.0 -2,793.4 -2,793.4
Accumulated depreciations and impairments 31 December 2016 -175.9 -6,277.7 -6,453.3
Book value 31 December 2016 37,891.6 9,544.2 47,435.9
Book value 1 January 2016 34,189.9 9,611.7 43,801.7

101CONSOLIDATED FINANCIAL STATEMENTS
Impairment testing
Impairment testing takes a group of units and other intangible assets with unlimited useful life that contains goodwill and generates cash flow and compares its book value to its recoverable amount. The judgement and future estimates of the company’s management are central to the drafting of the impairment calculations. If the recoverable amount is lower than the book value entered on the balance sheet, the difference is recorded as an impairment loss decreasing income. The recoverable amount is the fair value of the group of cash-flow generating units deducted by the costs to sell, or the utility value, whichever is higher. For the impairment testing, the recoverable amount used has been the value in use calculated by means of the discounted cash flow (DCF) method.
Goodwill and non-competition agreements with unlimited durations are allocated as follows within the Group:
31/12/2017 31/12/2016
Restaurants Labour hire Restaurants Labour hire
Goodwill 34,618.7 17,927.9 31,677.5 6,214.1
Non-competitionagreements
422.1 - 426.5 -
Impairment tests are performed for goodwill and non-competition agreements each year and whenever an external or internal factor can be expected to cause changes that may potentially lead to impairment. Impairment tests were performed on 31 December 2017 and 31 December 2016, using the then-current book values and calculations of future cash flows.
The impairment calculations are based on cash flow predictions in the budget drafted by the Group’s Executive Team and approved by its Board of Directors, added by the forecast and terminal period. The length of the forecast period used for the impairment calculations is 4 years.
Drawing up calculations using the DCF model requires forecasts and assumptions, the most significant of which involve turnover growth, cost development, level of maintenance investments and changes in the discount rate. It is possible that the assumptions related to the cash flow forecasts are not realised, and the resulting impairments of goodwill or non-competition agreements may have a materially adverse effect on the income derived from the company’s opera-tions and on its financial position during the present review period and future review periods.
The forecast cash flows are based on the capacity of the group of cash-flow generating units that the Group owned on the testing date. In other words, expansion investments have not been taken into account in the cash flow estimates. The Group’s cash-flow generating units or groups thereof mainly engage in the restaurant business and the labour hire business. The expansion of operating activities into new areas inside Finland is capacity expansion, and the investing activities related to it or gains derived from it have not been included in the calculations.
The company has two groups of cash-flow generating units, which are used to monitor goodwill, and, therefore, all goodwill and non-competition agreements with unlimited durations are allocated to this group. According to the company’s strategy, its restaurant network forms a unified group of cash-flow generating units due to their central-ised management, service marketing, service production methods, significant centralised purchases and other group services. Correspondingly, the labour hire operations acquired late in the summer of 2014 form a single group of cash-flow generating units.
The impairment tests on 31 December 2017 and 31 December 2016 did not indicate a need for impairment of goodwill or non-competition agreements.

102
31/12/2017 31/12/2016
Restaurants Labour hire Restaurants Labour hire
Turnover growth, first year 17.9% 40.7% -0.9% -9.8%
Turnover growth, other years 0.0% 0.0% 0.0% 0.0%
EBITDA 15.1% 11.5% 15.0% 10.4%
Terminal growth assumption 0.0% 0.0% 0.0% 0.0%
Discount rate before taxes 9.4% 9.5% 6.8% 6.8%
Change in net working capital 0.0% 0.0% 0.0% 0.0%
31/12/2017 31/12/2016
Restaurants Labour hire Restaurants Labour hire
Annual turnover reduction 1.5% 1.8% 1.3% 1.9%
Annual increase in operating costs 1.6% 2.2% 1.4% 2.0%
EBITDA 7.8% 2.8% 7.8% 1.7%
The assumptions used in calculating utility value, by testing date:
Based on the sensitivity analysis, the following changes in the key items of the calculations may occur at testing time without creating a need to impair the existing goodwill or non-competition agreements (assuming that no changes occur in the other key assumptions of the calculations):
The company’s utility value is not particularly sensitive to changes in the discount rates used in the calculations. According to the assessment of the management, when estimated conservatively, no reasonably possible change in any of the assumptions of the Restaurants and Labour Hire segment will lead to a situation where the recoverable amount might fall below the book value of the cash-flow generating units.
However, maintaining the levels of utility value calculated requires that, in accordance with the company strategy, turnover and EBITDA are kept at an acceptable level, competitiveness is retained, new restaurant concepts are developed, the customer base of labour hire operations is expanded and competitive pricing and reasonable cost management are maintained through constant supervision.

103CONSOLIDATED FINANCIAL STATEMENTS
10 PROPERTY, PLANT AND EQUIPMENT
31/12/2017EUR thousand Note
Machines and equipment
Improvement costs for rental
premises Buildings
Civil en-gineering
areas
Prepayments and incomplete
acquisitions Total
Acquisition cost 1 January 2017 22,277.9 40,235.4 2,447.4 0.0 147.1 65,108.2
Additions 3,605.5 6,836.1 10.0 6.0 135.3 10,593.0
Business combination 936.6 40.9 250.0 150.0 0.0 1,377.4
Deductions -143.1 -152.9 0.0 0.0 0.0 -296.0
Transfers between items 0.0 -369.0 0.0 0.0 0.0 -369.0
Acquisition cost 31 January 2017 26,676.9 46,590.4 2,707.4 156.0 282.4 76,413.6
Accumulated depreciations and impairments 1 January 2017 -12,768.6 -23,319.1 -186.3 0.0 0.0 -36,274.0
Impairments 0.0 0.0 0.0 0.0 0.0
Depreciations -2,629.0 -5,032.3 -86.8 0.0 -7,748.1
Accumulated depreciations and impairments 31 December 2017 -15,397.6 -28,351.4 -273.1 0.0 0.0 -44,022.1
Book value 31 December 2017 11,279.3 18,239.0 2,434.4 156.1 282.4 32,391.4
Book value 1 January 2017 9,509.3 16,916.3 2,261.1 0.0 147.1 28,834.3
31/12/2016EUR thousand Note
Machines and equipment
Improvement costs for rental
premises Buildings
Civil en-gineering
areas
Prepayments and incomplete
acquisitions Total
Acquisition cost 1 January 2016 19,266.6 35,946.4 2,421.6 0.0 49.7 57,684.7
Additions 2,072.7 4,299.7 25.8 0.0 97.4 6,495.6
Business combination 1,098.9 46.0 0.0 0.0 0.0 1,144.9
Deductions -160.2 -56.7 0.0 0.0 0.0 -216.9
Acquisition cost 31 January 2016 22,277.9 40,235.4 2,447.4 0.0 147.1 65,108.3
Accumulated depreciations and impairments 1 January 2016 -10,264.7 -18,336.9 -79.8 0.0 0.0 -28,681.4
Impairments 0.0 -11.3 0.0 0.0 0.0 -11.3
Depreciations -2,503.9 -4,970.9 -106.5 0.0 0.0 -7,581.3
Accumulated depreciations and impairments 31 December 2016 -12,768.6 -23,319.1 -186.3 0.0 0.0 -36,274.0
Book value 31 December 2016 9,509.3 16,916.3 2,261.1 0.0 147.1 28,834.3
Book value 1 January 2016 9,001.9 17,609.5 2,341.8 0.0 49.7 29,003.3
Finance lease agreements
Property, plant and equipment includes commodities leased with finance lease agreements as follows:
EUR thousand 2017 2016
Acquisition cost entered on the basis of finance lease agreements 487.5 707.3
Addition 0.0 132.3
Deduction 0.0 -352.1
Accumulated depreciations and impairments -376.3 -301.1
Book value 111.3 186.5

104
11 SHARES IN ASSOCIATED COMPANIES AND JOINT VENTURES
EUR thousand Note 2017 2016
Book value 1 Jan 1,178.8 1 330.0
Additions 31 1,690.8 0.0
Share of the income of the financial period 172.3 -47.2
Intangible depreciation -104.0 -104.0
Book value on 31 December 2,938.0 1,178.8
EUR thousand 2017 2016
Undepreciated goodwill in the associated company 749.0 749.0
Intangible rights in the associated company 520.0 520.0
- intangible depreciations with its tax effects -208.0 -104.0
1,061.0 1,165.0
EUR thousand Assets Liabilities Turnover Profit/loss
Share of ownership %
1 June 2017–31 December 2017
Superpark Oy, domicile Sotkamo 18,612.4 15,096.2 8,379.2 112.9 30.29
Total 18,612.4 15,096.2 8,379.2 112.9
1 June 2016–31 May 2017
Superpark Oy, kotipaikka Sotkamo 16,267.6 13,305.5 10,588.6 0.4 19.96 *
Total 16,267.6 13,305.5 10,588.6 0.4
EUR thousand 2017 2016
Restaurant goods inventory 2,831.1 2,317.6
Labour hire goods inventory 140.8 0.0
Total 2,971.8 2,317.6
The financial year of the associated company is 1 June-31 May. The result of the associated company has been combined with the Group for the period 1 January-31 December 2017.
Financial information about the associated company
Restamax Plc’s previous holding in the company was 19.0% and, as a result of the transaction of 28 April 2017, 30.29%. The company is consolidated as an associated company into Restamax’s consolidated financial statements, even though the Group has less than 20% of the shares and votes, as the Group has considerable influence in the company through a contractual right to appoint one of the five Board members.
During the reporting period, TEUR 32,005.0 was recorded in the income statement for materials and supplies and through stock value changes (TEUR 27,398.8 in 2016). In addition, TEUR 280.0 was recorded as expenses in the reporting period (TEUR 221.6 in 2016), which was used to reduce the book value of inventories.
12 INVENTORIES
* average

105CONSOLIDATED FINANCIAL STATEMENTS
The most significant accrued income items consist of pension insurance, income tax, discount amortisation and advance items.
The book value of trade and other receivables corresponds to their fair value. As concerns certain big labour hire customers, significant credit risk concentrations for the Group are related to receivables. The balance sheet values correspond to the monetary amount that is the maximum credit risk if the counterparties cannot fulfil their obligations related to the receivables. The fair values of receivables are presented in note 37.
13 RECEIVABLES
EUR thousand 2017 2016
Loans and other receivables (non-current)
Interest-bearing loans receivable 125.3 168.2
Non-interest-bearing other receivables 717.2 1,030.7
Loans and other receivables (non-current), total 842.5 1,198.9
Trade and other receivables (current)
Loans and other receivables (current)
Trade receivables 17,302.0 9,417.3
Interest-bearing other receivables 0.0 30.0
Loans and other receivables (current), total 17,302.0 9,447.2
Prepayments and accrued income 4,510.6 3,364.1
Other non-interest-bearing receivables 2,034.6 1,255.8
6,545.2 4,619.9
Trade and other receivables (current), total 23,847.2 14,067.2
Trade receivables
EUR thousand 2017 2016
Trade receivables 17,302.0 9,417.3
17,302.0 9,417.3
Age distribution of trade receivables
Not due 13,546.4 6,662.2
due, less than 3 months 1,982.9 1,390.9
due, more than 3 months 1,772.6 1,364.2
Total 17,302.0 9,417.3

106
14 FINANCIAL ASSETS AVAILABLE FOR SALE
EUR thousand Note 2017 2016
Value at the beginning of the financial period 620.1 622.1
Business combination 0.0 0.0
Additions 65.0 0.1
Deductions -0.1 -2.0
Changes in fair value recorded in equity 0.0 0.0
Value at the end of the financial period 685.1 620.1
Non-current portion 685.1 620.1
EUR thousand Note 2017 2016
Cash in hand and bank accounts (Financial assets in the funds statement) 2,570.0 1,871.1
Financial assets include shares and other investments. At present, all investments have been classified as available for sale.
Financial assets available for sale
The available-for-sale financial assets are non-current and they consist of unquoted shares and holdings in euros that are measured at fair value, or at acquisition cost whenever the fair value cannot be reliably determined.
The fair values of available-for-sale financial assets are presented in note 36. No financial assets are due. Impairments targeting financial assets totalling EUR 0.0 have been recorded (0.0 in 2016).
15 CASH AND CASH EQUIVALENTS
There is no significant credit risk accumulation related to cash and cash equivalent. The balance sheet values corre-spond to the monetary amount that is the maximum credit risk if the counterparties cannot fulfil their obligations related to the receivables.

107CONSOLIDATED FINANCIAL STATEMENTS
pcs 2017 2016
1/1 16,576,120 16,136,120
Own shares acquired - -
Share issue - 440,000
31/12 16,576,120
EUR thousand 2017 2016
1/1 36,586.1 33,937.3
Share issue 3,924.0 2,648.8
31/12 40,510.1 36,586.1
EUR thousand 2017 2016
Fair value fund -4.5 -13.3
16 EQUITY
Restamax Plc has one series of shares where all shares are equally entitled to dividends. One share equals one vote at the general meeting. Restamax Plc has 16,619,620 shares. A share has no nominal value.
The invested unrestricted equity fund includes other equity convertible investments and the portion of the share subscription price that is not recorded in the share capital according to a specific decision.
The value changes of the available-for-sale financial assets from the moment of acquisition are recorded in the fair value fund, deducted by deferred taxes.
Own shares include the acquisition cost of own shares in possession of the Group. Smile Huippu Oy, a company under the control of the Group, owns the own shares presented as deducted in the Group’s equity.
All of the issued shares have been paid for.
EUR thousandShares,
1,000 pcsShare
capital
Invested unrestricted equity fund
Fair value fund
Equity convertible
loanOwn
sharesRetained earnings
Share of minority
shareholdersEquity,
total
01/01/2016 16,380.0 150.0 33,937.3 -13.3 220.0 -972.6 6,293.1 428.9 40,043.4
31/12/2016 16,620.0 150.0 36,586.1 -13.3 220.0 -191.4 6,541.4 669.0 43,961.8
01/01/2017 16,620.0 150.0 36,586.1 -13.3 220.0 -191.4 6,541.4 669.0 43,961.8
31/12/2017 16,619.6 150.0 40,510.2 -4.5 220.0 -191.4 4,237.5 1,971.2 46,892.9
Outstanding shares
Invested unrestricted equity fund
Fair value fund
Own shares
2017 pcs
2017 TEUR
2016 pcs
2016 TEUR
1/1 43,500 -191.4 243,500 -972.6
Nullification of own shares - - 200,000 781.2
31/12 43,500 -191.4 43,500 -191.4

108
17 DEFERRED TAX ASSETS AND LIABILITIES
EUR thousand 01/01/2017
Entered in income
statement
Entered in other items of compre-
hensive income statement
Business operations
bought/sold 31/12/2017
Deferred tax assets:
Temporary differences
From confirmed losses 465.4 21.4 486.8
From consolidated eliminations 174.3 118.6 292.9
From launch marketing expenses 37.5 28.1 65.6
From intangible rights 462.4 165.2 627.6
From finance lease liabilities 0.9 0.7 1.6
Other items 70.8 12.0 82.8
Netting from deferred tax liabilities -1,069.0 -962.2
Deferred tax assets, total 142.1 346.0 0.0 0.0 595.0
EUR thousand 01/01/2017
Entered in income
statement
Entered in other items of compre-
hensive income statement
Business operations
bought/sold 31/12/2017
Deferred tax liabilities:
Temporary differences
Amortisation of loan expenses using the effective interest method
3,8 4,8 8,6
From reversal of goodwill depreciation 725,0 231,5 956,5
From intangible rights 783,1 -449,4 1,294,4 1,628,1
From combination of business operations 115,5 0,6 116,1
Financial leasing 7,1 -2,0 5,1
Other items 137,3 38,9 176,2
Adjustment -26,5
Netting from deferred tax assets -1,069,0 -962,2
Deferred tax liabilities, total 703,0 -202,1 0,0 1,294,4 1,928,5
Deferred taxes have been recorded for all temporary differences. The changes in deferred taxes during 2017 are as follows:
Equity loan
Equity convertible loans include the interest-free capital loans with no maturity that the owners have granted to the Group. Equity convertible loans have no due date, but the Group has the right (not an obligation) to redeem the loan if so desired.
Dividends
In 2017, dividends were distributed at EUR 0.30 per share, totalling TEUR 4,985.9 (in 2016, EUR 0.27 per share, totalling TEUR 4,356.8). After the end of the reporting period, the Board of Directors has proposed a dividend of EUR 0.33 per share, totalling TEUR 5,484.5 be distributed. The debt from the dividend proposed has not been entered into these financial statements.

109CONSOLIDATED FINANCIAL STATEMENTS
EUR thousand 01/01/2016
Entered in income
statement
Entered in other items of compre-
hensive income statement
Business operations
bought/sold 31/12/2016
Deferred tax assets:
Temporary differences
From confirmed losses 821.0 -355.6 465.4
From consolidated eliminations 160.9 13.4 174.3
From launch marketing expenses 45.1 -7.6 37.5
From intangible rights 225.3 237.1 462.4
From finance lease liabilities 2.3 -1.4 0.9
Other items 66.1 4.7 70.8
Netting from deferred tax liabilities -752.4 -1,069.0
Deferred tax assets, total 568.1 -109.4 0.0 0.0 142.1
Deferred tax assets and liabilities have been given as net amounts whenever the entity has a legally enforceable right to mutually offset the items recorded, and the deferred tax assets are related to the same tax recipient.
On 31 December 2017, the Group had TEUR 4,868.5 in confirmed losses (TEUR 3,129.31 on 31 December 2016) for which a deferred tax asset has not been recorded, since the realisation of the tax benefit included in them is not probable in the near future. These losses will expire in 2019-2026.
EUR thousand 01/01/2016
Entered in income
statement
Entered in other items of compre-
hensive income statement
Business operations
bought/sold 31/12/2016
Deferred tax liabilities:
Temporary differences
Amortisation of loan expenses using the effective interest method
10.6 -6.8 3.8
From reversal of goodwill depreciation 502.9 222.1 725.0
Reconstruction of destroyed restaurant 22.8 -22.8 0.0
From intangible rights 813.4 -252.3 222.0 783.1
From combination of business operations 114.8 0.7 115.5
Financial leasing 9.5 -2.4 7.1
Other items 89.5 47.8 137.3
Netting from deferred tax assets -752.4 -1,069.0
Laskennalliset verovelat yhteensä 811.2 -13.6 0.0 222.0 703.0
Deferred tax assets
Deferred tax liabilities
EUR thousand 2017 2016
Deferred tax assets due in over 12 months 566.6 114.8
Deferred tax assets due in 12 months 28.3 27.3
Total 595.0 142.1
EUR thousand 2017 2016
Deferred tax liabilities due in over 12 months 1 914.8 691.7
Deferred tax liabilities due in 12 months 13.6 11.2
Total 1 928.5 703.0

110
18 PROVISIONS
EUR thousand 2017 2016
Value at the beginning of the financial period 183.2 93.2
Additions 0.0 183.2
Provisions used -68.7 -93.2
Cancellations of unused provisions -114.5 0.0
Value at the end of the financial period 0.0 183.2
Of which current 0.0 91.6
Non-current portion 0 91.6
The provisions include the rent of the still leased premises.
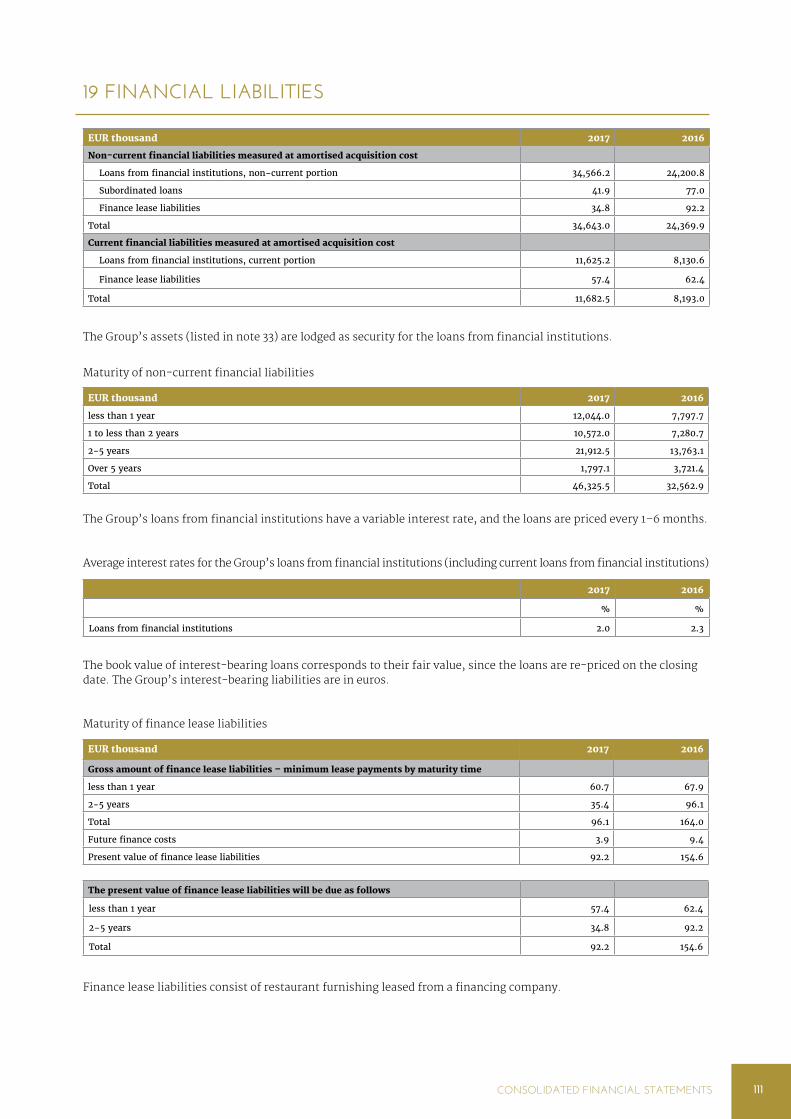
111CONSOLIDATED FINANCIAL STATEMENTS
2017 2016
% %
Loans from financial institutions 2.0 2.3
19 FINANCIAL LIABILITIES
EUR thousand 2017 2016
Non-current financial liabilities measured at amortised acquisition cost
Loans from financial institutions, non-current portion 34,566.2 24,200.8
Subordinated loans 41.9 77.0
Finance lease liabilities 34.8 92.2
Total 34,643.0 24,369.9
Current financial liabilities measured at amortised acquisition cost
Loans from financial institutions, current portion 11,625.2 8,130.6
Finance lease liabilities 57.4 62.4
Total 11,682.5 8,193.0
The Group’s assets (listed in note 33) are lodged as security for the loans from financial institutions.
The Group’s loans from financial institutions have a variable interest rate, and the loans are priced every 1–6 months.
EUR thousand 2017 2016
less than 1 year 12,044.0 7,797.7
1 to less than 2 years 10,572.0 7,280.7
2-5 years 21,912.5 13,763.1
Over 5 years 1,797.1 3,721.4
Total 46,325.5 32,562.9
Maturity of non-current financial liabilities
Maturity of finance lease liabilities
Finance lease liabilities consist of restaurant furnishing leased from a financing company.
EUR thousand 2017 2016
Gross amount of finance lease liabilities – minimum lease payments by maturity time
less than 1 year 60.7 67.9
2-5 years 35.4 96.1
Total 96.1 164.0
Future finance costs 3.9 9.4
Present value of finance lease liabilities 92.2 154.6
The present value of finance lease liabilities will be due as follows
less than 1 year 57.4 62.4
2–5 years 34.8 92.2
Total 92.2 154.6
Average interest rates for the Group’s loans from financial institutions (including current loans from financial institutions)
The book value of interest-bearing loans corresponds to their fair value, since the loans are re-priced on the closing date. The Group’s interest-bearing liabilities are in euros.

112
20 TRADE PAYABLES AND OTHER LIABILITIES
EUR thousand 2017 2016
Non-current
Advances received 80.6 136.3
Other non-interest-bearing liabilities 3,594.2 660.2
Non-current trade and other payables, total 3,674.8 796.4
Current
Accounts payable 10,894.0 7,563.5
Advances received 91.7 254.9
Accruals and deferred income
Salary debt 2,887.1 1,596.7
Holiday salary liabilities 4,532.9 2,689.9
Pension insurance 1,460.3 910.8
Taxes based on the taxable income from the financial period 1,237.7 706.6
Other accruals and deferred income 7,511.1 2,463.6
Accrued expenses, total 17,629.1 8,367.5
Other non-interest-bearing liabilities 5,624.1 3,272.8
Current trade and other payables, total 34,238.9 19,458.7
The fair values of trade and other payables are presented in note 37.
The sale of goods includes restaurant sales.
The sale of services includes restaurant service sales and labour hire sales, see note 8.
21 TURNOVER
EUR thousand 2017 2016
Sale of goods 105,203.2 92,083.5
Sale of services 80,653.0 37,988.3
Total 185,856.2 130,071.9
22 OTHER OPERATING INCOME
EUR thousand 2017 2016
Sales profit 4.6 0.0
Insurance compensation 100.0 882.0
Rental income 803.8 860.4
Other operating income 901.3 791.5
Total 1,809.7 2,533.9
Rental income includes the rental of flats. Other operating income mainly comprised income from hired personnel in the restaurant segment, payments received from employment and apprenticeships and negative goodwill that has been entered as income.

113CONSOLIDATED FINANCIAL STATEMENTS
23 MATERIALS AND SERVICES
24 COSTS RELATED TO EMPLOYMENT BENEFITS
EUR thousand 2017 2016
Acquisitions 31,760.6 27,272.5
External services 4,013.9 2,798.2
Total 35,774.4 30,070.7
External services consist of hired restaurant employees.
The management’s employment benefits are presented in note 29, Events of related entities.
EUR thousand 2017 2016
Salaries 67,869.4 36,851.9
Pension costs – defined contribution plans 12,778.7 6,901.7
Social security costs 2,318.0 1,558.1
Total 82,966.1 45,311.7
2017 2016
Group personnel on average over financial period 2,261 1,130
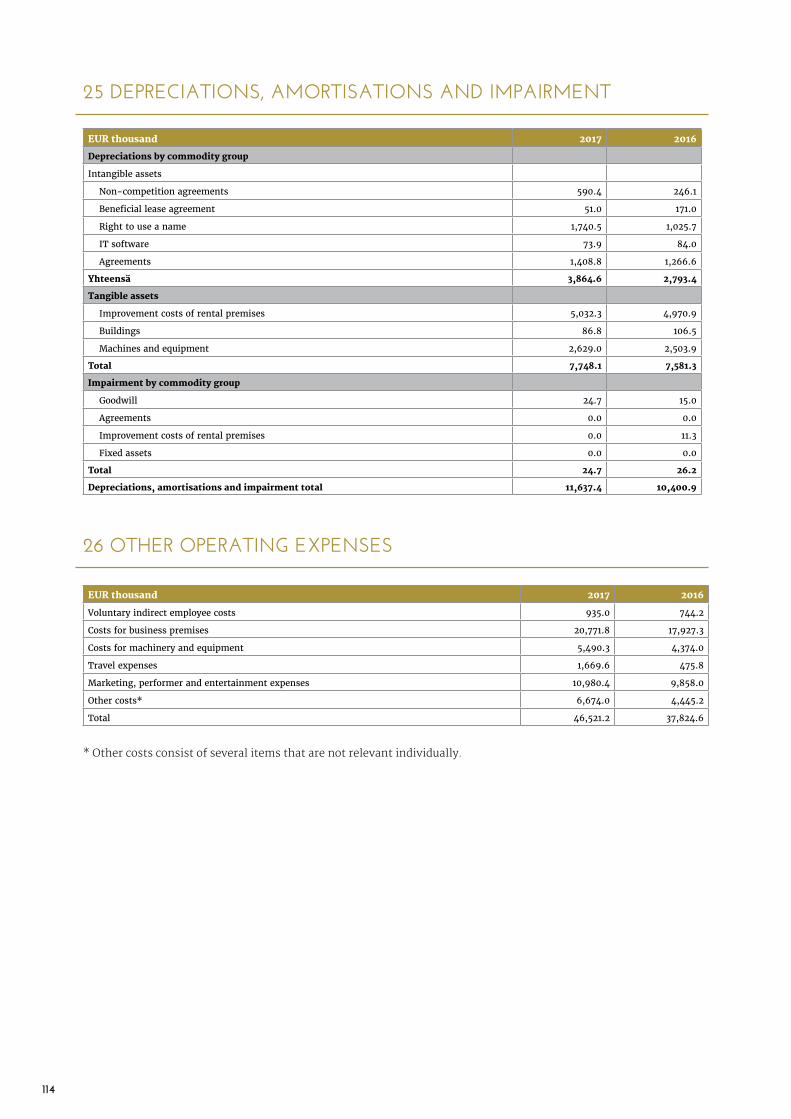
114
25 DEPRECIATIONS, AMORTISATIONS AND IMPAIRMENT
EUR thousand 2017 2016
Depreciations by commodity group
Intangible assets
Non-competition agreements 590.4 246.1
Beneficial lease agreement 51.0 171.0
Right to use a name 1,740.5 1,025.7
IT software 73.9 84.0
Agreements 1,408.8 1,266.6
Yhteensä 3,864.6 2,793.4
Tangible assets
Improvement costs of rental premises 5,032.3 4,970.9
Buildings 86.8 106.5
Machines and equipment 2,629.0 2,503.9
Total 7,748.1 7,581.3
Impairment by commodity group
Goodwill 24.7 15.0
Agreements 0.0 0.0
Improvement costs of rental premises 0.0 11.3
Fixed assets 0.0 0.0
Total 24.7 26.2
Depreciations, amortisations and impairment total 11,637.4 10,400.9
26 OTHER OPERATING EXPENSES
EUR thousand 2017 2016
Voluntary indirect employee costs 935.0 744.2
Costs for business premises 20,771.8 17,927.3
Costs for machinery and equipment 5,490.3 4,374.0
Travel expenses 1,669.6 475.8
Marketing, performer and entertainment expenses 10,980.4 9,858.0
Other costs* 6,674.0 4,445.2
Total 46,521.2 37,824.6
* Other costs consist of several items that are not relevant individually.

115CONSOLIDATED FINANCIAL STATEMENTS
27 FINANCIAL INCOME AND EXPENSES
EUR thousand 2017 2016
Financial income
Other financial income 42.9 186.6
Total 42.9 186.6
Items recorded through profit or loss
Impairment of shares in associated companies 0.0 -2.0
Impairment of receivables -73.5 -78.0
Interest expense from financial liabilities measured at amortised acquisition cost -1,002.1 -948.4
Other finance costs * -1,777.6 -111.0
Total -2,853.2 -1,139.4
Finance costs – net -2,810.3 -952.8
Other comprehensive income items
Financial assets available for sale 2.9 0.0
Total 2.9 0.0
28 INCOME TAXES
EUR thousand 2017 2016
Tax based on the taxable income from the financial period 3,081.3 1,933.8
Change in deferred taxes -548.2 95.7
Total 2,533.1 2,029.5
Tax constituents
Tax cost balancing calculation
Deferred tax assets and tax liabilities have been calculated using the Finnish tax rate of 20.0 per cent.
Taxes related to other items in the comprehensive income statement
EUR thousand 2017 2016
Profit/loss before taxes 8,024.8 7,893.9
Tax calculated at the rate of 20% 1,605.0 1,578.8
Non-deductible expenses 382.6 225.0
Use of tax losses not recorded previously -43.8 -22.9
Recorded deferred tax assets from confirmed losses of previous years 24.0 0.0
Non-recorded deferred tax assets from tax losses 575.1 335.7
Share of associated company's profits, deducted by taxes 13.7 -30.2
Tax-free income -26.0 -72.5
Goodwill impairment 4.9 3.0
Taxes from earlier financial periods -2.3 12.7
Tax expenses in income statement 2,533.1 2,029.5
2017 2016
EUR thousand Before taxes Effect of tax After taxes Before taxes Effect of tax After taxes
Assets available for sale 0.0 0.0 0.0 0.0 0.0 0.0
* In the financial period 1 January-31 December 2017, an adjustment of TEUR 1711.1 on the estimated additional sales price related to the share acquisition of Smile Job Services One Oy (formerly Job Services One Oy) was recorded as a non-recurring item under other financing costs.

116
29 EVENTS OF RELATED ENTITIES
Parties are considered to be related when one party can exercise control, shared control or significant influence over the other in decision-making involving its economy and operating activities. The Group’s related entities are the parent company, subsidiaries, associated company, the parent company’s subsidiaries and the key management personnel. Key management personnel covers the members of the Board of Directors, the Group’s Executive Team and the Chief Executive Officer and his/her deputy, as well as their close family members. Furthermore, Restamax’s related entities include any owners who can exercise control or significant influence in Restamax, the companies where the said owners have a controlling interest, and companies where a person exercising control over Restamax exercises significant influence or works in the management of the company or its parent company.
The management’s employee benefits have been presented on a cash basis.
EUR thousand 2017 2016
Salaries to the Executive Team (incl. CEO) with associated costs and other short-term employee benefits 983.2 841.4
Fees for the Board of Directors 85.0 83.8
Fees and benefits for Chief Executive Officer and other Executive Team members
EUR thousand 2017 2017 2017 2016 2016 2016
Salaries and feesSalary with
benefits
Attendance allowances
for the Board of
Directors TotalSalary with
benefits
Attendance allowances
for the Board of
Directors Total
*CEO Markku Virtanen, up to 22 May 109.8 0.0 109.8 156.1 0.0 156.1
Acting CEO Jarno Suominen, 22 May - 36.7 0.0 36.7 0.0 0.0 0.0
CEO Juha Helminen, 1 September - 52.9 0.0 52.9 0.0 0.0 0.0
Other Executive Team members 600.2 0.0 600.2 518.8 0.0 518.8
Total 799.6 0.0 799.6 674.9 0.0 674.9
The Chief Executive Officer is covered by the Employees Pensions Act that offers pension security based on the time of service and earnings in the manner defined in the Act. No separate retirement age provisions are included in the Chief Executive Officer’s contract. The Chief Executive Officers’ accrued pension costs for the financial period were TEUR 37.8.
For the company, the CEO’s term of notice is six (6) months; for the CEO, it is three (3) months. In addition to the pay for the term of notice, the Chief Executive Officer is not entitled to any separate termination compensation.
Fees for the Board of Directors
EUR thousand 2017 2016
Attendance allowances
Timo Laine, Chairman of the Board of Directors 25.0 23.8
Mikko Aartio, member of the Board of Directors 10.0 10.0
Jarmo Viitala, member of the Board of Directors 10.0 10.0
Petri Olkinuora, member of the Board of Directors 20.0 20.0
Mika Niemi, member of the Board of Directors (from 23 April 2014) 10.0 10.0
Timo Everi, member of the Board of Directors (from 22 April 2015) 10.0 10.0
Total 85.0 83.8
Management’s employee benefits

117CONSOLIDATED FINANCIAL STATEMENTS
Transactions with associated companies
EUR thousand Sales Interest expenses
Rental expenses
Acquisitions Rental income
Receivables Liabilities
2017 1,732.8 0.9 1,167.9 3,791.1 1.4 479.4 522.3
2016 827.0 0.0 1,194.8 1,210.6 5.1 385.1 161.1
Transactions with associates have been completed applying the same terms as transactions with independent parties.
30 AUDITOR’S FEES
EUR thousand 2017 2016
Deloitte Oy, Authorised Public Accountants
Audit 215.9 204.4
Other services 54.4 56.2
Total 270.3 260.6

118
31 SHARES IN SUBSIDIARIES AND ASSOCIATED COMPANIES 31 DECEMBER 2017
Subsidiaries consolidated into the consolidated financial statements Share of ownership Domicile
Beaniemax Oy 60.0% Tampere
Dinnermax Oy 70.0% Tampere
Gastromax Oy (Group) 70.0% Tampere
Pyynikin Brewery Restaurants Oy 85.0% Tampere
Harry's Ravintolat Oy 90.0% Helsinki
Hernesaaren Ranta Oy 80.0% Helsinki
Italpal Oy 100.0% Tampere
Kampin Sirkus Oy (Group) 90.0% Tampere
Markkinointitoimisto Aito Finland Oy 100.0% Tampere
Koskimax Oy 59.6% Tampere
Levin Ravintolakatu Oy 100.0% Helsinki
Max Consulting Oy (Group) 100.0% Tampere
Suomen Ravintolatoimi Oy (Group) 42.1% Jyväskylä
Bistromax oy 70.0% Tampere
Mikonkadun keidas Oy 90.0% Tampere
Northmax Oy 70.0% Tampere
Poolmax Oy 80.0% Tampere
Priima Ravintolat Oy (Group) 63.8% Tampere
Rock Hard Catering Oy 88.0% Tampere
Tampereen Satamaravintolat Oy 100.0% Tampere
Purmax Oy 60.0% Tampere
Rengasravintolat Oy 100.0% Tampere
Restala Oy (Group) 100.0% Helsinki
Unioninkadun keidas Oy 82.0% Helsinki
Rivermax Oy (Group) 72.0% Tampere
Tillikka Oy 80.0% Tampere
Roska Yhtiöt Oy 100.0% Tampere
Skohan Oy 75.0% Tampere
Somax Oy 70.0% Tampere
Soolo Max Oy 70.0% Tampere
SRMax Oy 85.0% Tampere
Suomen Diner Ravintolat Oy 80.0% Tampere
Suomen Ravintolatoimi Oy 57.9% Jyväskylä
Suomen Siipiravintolat Oy 70.0% Tampere
Thai Papaya Oy 60.0% Helsinki
Tunturimax Oy 76.0% Tampere
Unioninkadun keidas Oy 18.0% Helsinki
Urban Group Oy (Group) 80.0% Helsinki
Cholo Oy 100.0% Helsinki
Sabor a México Oy 100.0% Helsinki

119CONSOLIDATED FINANCIAL STATEMENTS
Subsidiaries consolidated into the consolidated financial statements Share of ownership Domicile
Smile Henkilöstöpalvelut Oy (Group) 78.4% Tampere
Happy Henkilöstöpalvelut Oy 100.0% Tampere
Job Services One Oy 100.0% Tampere
Max Henkilöstöpalvelut Oy 100.0% Tampere
Resta Henkilöstöpalvelut Oy 100.0% Tampere
RM Henkilöstöpalvelut Oy 100.0% Tampere
Smile Botnia Oy 90.0% Tampere
Smile Doctors Oy 71.3% Tampere
Smile Education Oy 51.0% Tampere
Smile Events & Promotions Oy 100.0% Tampere
Smile Huippu Oy (Group) 75.0% Kuopio
Smile Pavelut Jyväskylä Oy 100.0% Tampere
Smile ICT Oy 55.0% Tampere
Smile MMS Oy (Group) 100.0% Kuortane
Smile Industries Oy (Group) 100.0% Kuortane
Smile Industries Jyväskylä Oy 100.0% Tampere
Smile Industries Kuopio Oy 90.0% Tampere
Smile Industries Tampere Oy (Group) 76.5% Tampere
Smile Industries Manse Oy 100.0% Tampere
Smile MMS Työllistamispalvelut Oy 70.0% Kuortane
Smile Pohjanmaa Oy 72.0% Kuortane
Smile Palvelut Helsinki Oy 100.0% Tampere
Smile Palvelut Hämeenlinna Oy 100.0% Hämeenlinna
Smile Palvelut Pohjoinen Oy 100.0% Tampere
Smile Palvelut Ilo Oy 100.0% Tampere
Smile Palvelut Turku Oy 100.0% Tampere
Smile Railways Oy 100.0% Tampere
Smile Services Oy 100.0% Tampere
Smile Super Oy 100.0% Tampere
Smile Tampere Oy 100.0% Tampere
Smile Banssi Oy (Group) 100.0% Tampere
Smile Banssi Etelä Oy 90.9% Espoo
Smile Banssi Pohjoinen Oy 100.0% Espoo
Smile Banssi Häme Oy 100.0% Espoo
Smile Banssi Uusimaa Oy 90.9% Vantaa
Smile Banssi Itä Oy 100.0% Joensuu
Smile Banssi Länsi Oy 100.0% Turku
Smile Banssi Keski Oy 90.0% Jyväskylä
Smile Banssi Lappi Oy 90.0% Rovaniemi
Smile Banssi Helsinki Oy 100.0% Helsinki
Smile Banssi Safety Oy 100.0% Espoo
Smile Banssi Kaakko Oy 90.0% Lappeenranta
Smile Hoiva Oy 100.0% Espoo
Talous Bandora Oy 100.0% Espoo
Associated companies consolidated into the consolidated financial statements
SuperPark Oy 30.3% Sotkamo

120
Share of the most significant minority shareholders:
EUR thousandMinority shareholders’
share
Minority shareholders’ share of profit from the
financial periodMinority shareholders’
share of capital
Company and domicile 2017 2016 2017 2016 2017 2016
Priima-Ravintolat Oy Tampere 36.2% 36.2% -50.5 -40.9 64.7 115.1
Gastromax Oy Tampere 30.0% 30.0% -378.2 -359.9 1325.1 -946.8
Tunturimax OyTampere 24.0% 35.0% 48.6 18.7 92.5 63.0
Smile Henkilöstöpalvelut Oy - Group 78.4% 93.0% 568.4 224.1 2,391.5 484.5
EUR thousand
Priima-Ravintolat Oy 2017 2016
Turnover 3,305.9 4,322.3
Profit for the financial period -139.3 -112.8
Non-current assets 1,949.7 2,351.1
Current assets 374.6 471.2
Non-current liabilities 1,026.3 1,323.6
Current liabilities 1,119.4 1,180.7
Operating cash flow 513.1 329.3
Investment cash flow -87.9 -72.0
Financial cash flow -454.6 -266.1
Gastromax Oy 2017 2016
Turnover 3,953.1 3,710.8
Profit for the financial period -1,260.7 -1,199.7
Non-current assets 2,014.1 3,356.0
Current assets 1,483.1 317.6
Non-current liabilities 4,416.9 3,812.9
Current liabilities 3,497.2 3,016.8
Operating cash flow -330.7 -697.5
Investment cash flow -621.1 -188.2
Financial cash flow 950.2 880.5
Tunturimax Oy 2017 2016
Turnover 4,110.4 4,954.5
Profit for the financial period 202.7 78.0
Non-current assets 855.2 923.8
Current assets 817.8 743.6
Non-current liabilities 229.2 187.1
Current liabilities 1,058.4 1,217.7
Operating cash flow 351.5 462.0
Investment cash flow -142.5 -41.3
Financial cash flow -211.5 -442.4
Smile Henkilöstöpalvelut Oy - Group 2017 2016
Turnover 75,612.2 34,129.4
Profit for the financial period 392.8 833.9
Non-current assets 27,828.5 10,896.6
Current assets 16,900.0 7,348.0
Non-current liabilities 14,932.3 7,205.6
Current liabilities 24,420.8 11,250.5
Operating cash flow 4,543.6 1,176.6
Investment cash flow -8,505.3 -1,363.6
Financial cash flow 3,803.5 366.7
Financial information:

121CONSOLIDATED FINANCIAL STATEMENTS
32 OTHER LEASE AGREEMENTS
The Group has leased many of the restaurant and office premises that it uses. The lease terms are on average between two to fifteen years, and often include the option of continuing the agreement past the original termination date. The lease agreements often have a fixed lease with an index condition or are turnover-based. Some of the lease agreements are valid until further notice, with a notice period of 2 months.
The Group as a lessor
Minimum deferred lease payments to be made based on other rental agreements that cannot be annulled:
Minimum lease payments to be made based on other rental agreements that cannot be annulled:
In 2017, lease expenses of TEUR 15,951.0 (TEUR 14,002.6 in 2016) paid based on lease agreements were recorded through profit or loss.
The Group has sublet 15 restaurant premises. Lease expenses of TEUR 699.3 in 2017 (TEUR 945.4 in 2016) were recorded for these premises. Based on the sublease agreements, the future minimum lease payments will amount to TEUR 1,334.1 at the end of 2017 (TEUR 1,699.4 at the end of 2016).
EUR thousand 2017 2016
In one year 15,987.8 13,271.1
In over one year and within five years maximum 41,559.9 32,893.9
In over five years 15,709.4 14,016.6
Total 73,257.1 60,181.6
EUR thousand 2017 2016
In one year 678.8 990.6
In over one year and within five years maximum 1,022.5 1,516.7
In over five years 138.2 38.6
Total 1,839.5 2,546.0

122
33 CONDITIONAL LIABILITIES AND ASSETS AND COMMITMENTS
34 CLASSIFICATION OF FINANCIAL ASSETS AND LIABILITIES
EUR thousand 2017 2016
Liabilities with guarantees included on the balance sheet
Loans from financial institutions, non-current 34,168.1 24,010.5
Loans from financial institutions, current 11,634.4 8,139.8
Total 45,802.5 32,150.3
Guarantees given on behalf of the Group
Collateral notes secured by a mortgage 54,350.0 34,150.0
Real estate mortgage 4,096.8 4,096.8
Subsidiary shares 37,613.1 31,596.6
Other shares 164.8 164.8
Bank guarantees 3,414.9 3,717.8
Other guarantees 7,000.0 1,000.0
Total 106,639.5 74,726.0
EUR thousand 2017 2016
Commitments:
Purchase commitment 600.0 200.0
31/12/2017
EUR thousand
Measured at fair value
through profit or loss
Available for sale
Loans and receivables
Into amortised acquisition cost Fair value
Financial assets
Interest-bearing loans receivable 125.3 125.3
Non-interest-bearing other receivables 1,222.0 1,222.0
Trade and other receivables 23,342.4 23,342.4
Unquoted shares 685.1 685.1
Cash and cash equivalents 2,570.0 2,570.0
Total 685.1 27,259.7 27,944.8
Book value, total 685.1 27,259.7 27,944.8
Financial liabilities
Non-current financial liabilities 34,643.0 34,643.0
Non-current trade payables and other liabilities 3,674.8 3,674.8
Current financial liabilities 11,682.5 11,682.5
Current trade payables and other liabilities 34,238.9 34,238.9
Fair value, total 84,239.2 84,239.2
Book value, total 84,239.2 84,239.2
Restamax Plc has committed to financing, when necessary, an associated company with a subordinated loan of a maximum of TEUR 2,000. After the end of the financial period, TEUR 500 of the loan is drawn.
With a deed of sale dated 1 July 2017, Restamax Plc’s subsidiary engaging in the labour hire business purchased 100% of the shares in Smile Job Services One Oy (formerly Job Services One Oy). A part of the sale price has been paid with Restamax Plc subsidiary’s shares involving a fixed-term repurchase obligation.

123CONSOLIDATED FINANCIAL STATEMENTS
35 ADJUSTMENTS TO OPERATING CASH FLOWS
EUR thousand 2017 2016
Non-cash transactions
Recognition of advertising space sales and contract compensation -218.9 -232.2
Changes in provisions -183.2 89.9
Accounts receivable write-off 430.0 22.2
Sale of fixed assets -6.4 0.0
Other adjustments -212.2 -312.8
Total -190.6 -432.9
31/12/2016
EUR thousand
Measured at fair value
through profit or loss
Available for sale
Loans and receivables
Into amortised acquisition cost Fair value
Financial assets
Interest-bearing loans receivable 198.2 198.2
Non-interest-bearing other receivables 1,095.7 1,095.7
Trade and other receivables 13,972.2 13,972.2
Unquoted shares 620.2 620.2
Cash and cash equivalents 1,871.1 1,871.1
Total 620.2 17,137.2 17,757.4
Book value, total 620.2 17,137.2 17,757.4
Financial liabilities
Non-current financial liabilities 24,369.9 24,369.9
Non-current trade payables and other liabilities 796.4 796.4
Current financial liabilities 8,193.0 8,193.0
Current trade payables and other liabilities 19,458.8 19,458.8
Fair value, total 52,818.1 52,818.1
Book value, total 0.0 0.0 0.0 52,818.1 52,818.1

124
36 NET LIABILITIES BALANCING CALCULATION
Net liabilities
EUR thousand 2017
Cash and cash equivalents 2,570.0
Liquid investments 0.0
Loans - repayable within one year (incl. credit accounts) -12,044.0
Loans - repayable within more than one year (incl. -34,281.5
Net liabilities -43,755.5
Cash and cash equivalents and liquid investments 2,570.0
Gross liabilities and variable-interest -46,325.5
Net liabilities -43,755.5
EUR thousand Other assets Liabilities related to financing
Cash and cash equivalents/
credit Accounts
Liquid investments
Loans within one year
Loans in more than one year
Total
Net liabilities 31 December 2016 1,871.1 -7,797.7 -24,765.2 -30,691.8
Cash flows 698.9 -4,246.2 -9,254.8 -12,802.1
Acquisitions of subsidiaries - loans -261.6 -261.6
Net liabilities 31 December 2017 2,570.0 0.0 -12,044.0 -34,281.5 -43,755.5
37 FAIR VALUES OF FINANCIAL INSTRUMENTS
The fair value definition principles used by the Group for all financial instruments are presented below. The table also presents in detail the values and book values for each item; these correspond to the values in the consolidated balance sheet.
2017 2016
MEUR Note Book value Fair value Book value Fair value
Financial assets
Financial assets available for sale 14 685.1 685.1 620.2 620.2
Interest-bearing loans receivable 13 125.3 125.3 198.2 198.2
Trade and other receivables 13 24,564.4 24,564.4 15,067.9 15,067.9
Cash and cash equivalents 15 2,570.0 2,570.0 1,871.1 1,871.1
Financial liabilities
Non-current financial liabilities 19 34,643.0 34,643.0 24,369.9 24,369.9
Non-current trade payables and other liabilities 20 3,674.8 3,674.8 796.4 796.4
Current financial liabilities 19 11,682.5 11,682.5 8,193.0 8,193.0
Current trade payables and other liabilities 20 34,238.9 34,238.9 19,458.8 19,458.8
The following price quotations, assumptions and measurement models have been used when determining the fair values of the financial assets and liabilities presented in the table:
Financial assets available for sale
Financial assets available for sale mostly consist of Finnish holdings and Finnish unquoted shares. Unquoted share invest-ments have been measured at fair value or acquisition cost, since it has been impossible to measure them at fair value using measurement techniques. It has been impossible to determine the fair value of investments and the estimate varies greatly, or the probabilities of different estimates within the range of variation cannot be reasonably determined and used to determine the fair value. Financial assets measured at fair value are either sellable on the secondary market or their measurement uses the bid price on the counterparty’s closing date.

125CONSOLIDATED FINANCIAL STATEMENTS
EUR thousand Other assets Liabilities related to financing
Cash and cash equivalents/
credit Accounts
Liquid investments
Loans within one year
Loans in more than one year
Total
Net liabilities 31 December 2016 1,871.1 -7,797.7 -24,765.2 -30,691.8
Cash flows 698.9 -4,246.2 -9,254.8 -12,802.1
Acquisitions of subsidiaries - loans -261.6 -261.6
Net liabilities 31 December 2017 2,570.0 0.0 -12,044.0 -34,281.5 -43,755.5
Trade and other receivables
The original book value of the receivables corresponds to their fair value, since the effect of discounting is not relevant when considering the maturity of the receivables.
Financial assets recorded at fair value through profit or loss
Financial assets recorded at fair value through profit or loss include financial asset items that have been acquired to be held for trading or that are classified to be recorded at fair value through profit or loss upon original recording.
Financial liabilities
The fair values of liabilities are based on discounted cash flows. The discount rate used has been the rate at which the Group could take out a similar external loan on the closing date. The total interest consists of the risk-free interest and a company-specific risk premium. The re-pricing date for the loans is 31 December, which means that the book values for the loans correspond to their market values.
Trade payables and other liabilities
The original book value of the trade and other receivables corresponds to their fair value, since the effect of discounting is not relevant when considering the maturity of the receivables.
Fair value hierarchy for financial assets measured at fair value
31/12/2017
EUR thousand Level 1 Level 2 Level 3 Total
Assets
Financial assets available for sale
- equity securities 0.0 0.0 0.0 0.0
Assets in total 0.0 0.0 0.0 0.0
31/12/2016
EUR thousand Level 1 Level 2 Level 3 Total
Assets
Financial assets available for sale
- equity securities 0.0 0.0 0.0 0.0
Assets in total 0.0 0.0 0.0 0.0
During the financial period which has ended, there were no transfers between the fair value hierarchy levels 1, 2 or 3.
The fair values at hierarchy level 1 are based on the quoted prices of similar asset items or liabilities on the market. The shares and holdings of the Group consist of unquoted items.
The fair values for instruments at level 2 are based on significantly different input information than the quoted prices at level 1, but are nevertheless based on information (i.e. prices) or indirect information (i.e. derived from prices). In determining the fair value of these instruments, the Group uses generally accepted measurement models whose input information is largely based on verifiable market data.
The fair values of instruments at level 3 are based on input information concerning the asset item or liability that is not based on verifiable market data; instead, they are largely based on the management’s estimates and their use in generally accepted measurement models.
Other available-for-sale financial assets have been measured at acquisition cost, since the fair value cannot be reliably determined.

126
38 KEY EVENTS OCCURRING AFTER THE CLOSING DATE
Restamax Plc’s subsidiary engaging in the labour hire business purchased the entire shareholding of Kymppi Service Oy with a deed of sale dated 18 January 2018. The right of ownership and management was transferred on 1 February 2018.
On 22 January 2018, Restamax announced plans to revamp its organisation and the structure of its Executive Team. Restamax’s operational organisation was divided into three business units: Nightclubs, Food restaurants, and Pubs&Entertainment, each with their own responsible director. The position of Chief Procurement Officer (CPO) was established to strengthen purchasing operations and the efficiency thereof. The roles of sales and marketing strategy were increased in the organisa-tion and, for that purpose, the position of Chief Commercial Officer (CCO) will be established.
On 13 March 2018, Restamax communicated that the Board of Directors has decided to review and evaluate the listing of the labour hire business comprising its subsidiary Smile Henkilöstöpalvelut Oy and its subgroup on the Nasdaq Helsinki Ltd Stock Exchange. The evaluation process will be carried out during spring 2018.
Restamax Plc’s subsidiary engaging in the labour hire business, Smile Henkilöstöpalvelut Oy, bought 80% of the share capital of Adicio Oy. The right of ownership and management will transferred on 3 April 2018.
On 23 March 2018, Restamax communicated that it will expand its restaurant business operations to Denmark, where it will operate through its subsidiary Restamax Operations Denmark. The company will buy over 90% of the Danish Cock’s & Cows and The Bird companies. Ownership will be transferred on 4 April 2018.
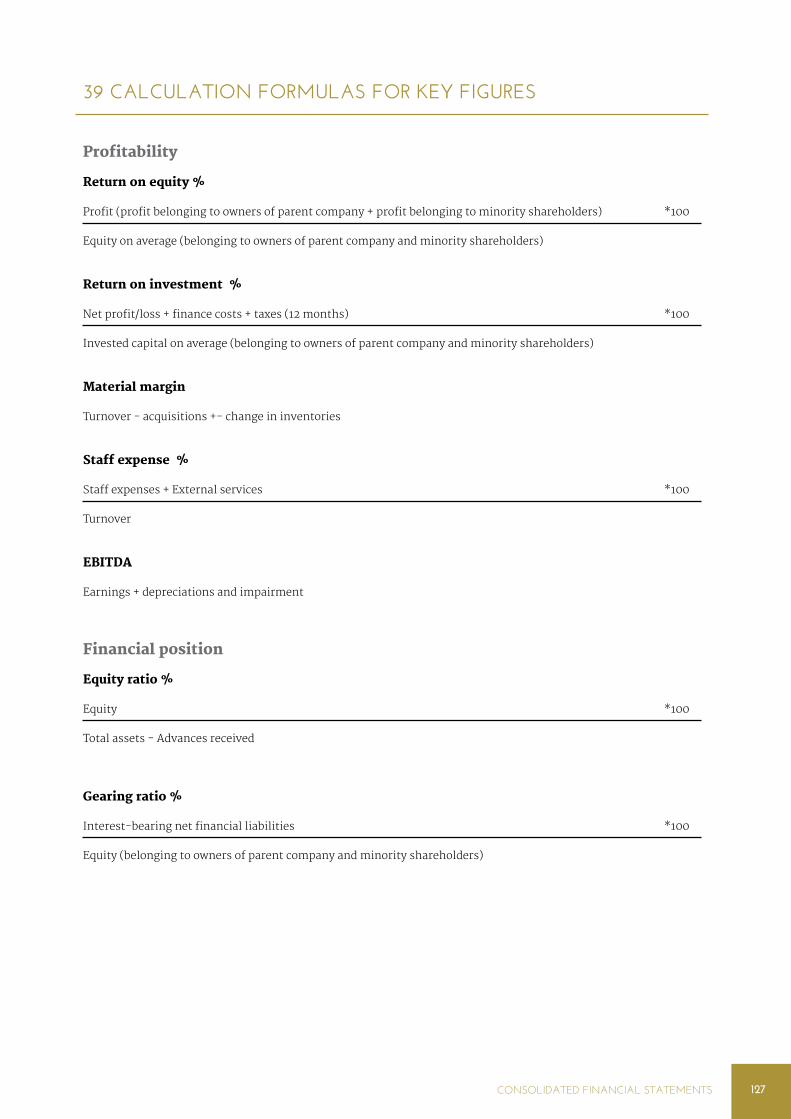
127CONSOLIDATED FINANCIAL STATEMENTS
39 CALCULATION FORMULAS FOR KEY FIGURES
Profitability
Return on equity %
Profit (profit belonging to owners of parent company + profit belonging to minority shareholders) *100
Equity on average (belonging to owners of parent company and minority shareholders)
Return on investment %
Net profit/loss + finance costs + taxes (12 months) *100
Invested capital on average (belonging to owners of parent company and minority shareholders)
Material margin
Turnover - acquisitions +- change in inventories
Staff expense %
Staff expenses + External services *100
Turnover
EBITDA
Earnings + depreciations and impairment
Financial position
Equity ratio %
Equity *100
Total assets - Advances received
Gearing ratio %
Interest-bearing net financial liabilities *100
Equity (belonging to owners of parent company and minority shareholders)

128
Key figures per share
Dividends per share
Distribution of dividends for financial period
Undiluted number of shares on closing date
Earnings per share
Net income for financial period - non-controlling interests
Number of shares, excluding shares controlled by company itself, on average over financial period
Dividend/earnings per share %
Dividend *100
Earnings per share
Equity per share, EUR
Equity attributable to parent company shareholders
Number of shares at the of financial period, excluding shares controlled by company itself
Dividend payout ratio, %
(Dividend per share) *100
Earnings per share
Effective dividend yield, %
Dividends per share *100
Share price on closing date
Price-to-earnings ratio (P/E)
Share price on closing date
Earnings per share
Average share price
Total trading in share in euros
Number of traded shares on average over financial period
Market value of share capital, EUR
Closing-date share price x number of shares

129CONSOLIDATED FINANCIAL STATEMENTS

130
B. FINANCIAL STATEMENTS FOR PARENT COMPANY (FAS)
INCOME STATEMENT (EUR) 1 January 2017–31 December 2017
1 January 2016–31 December 2016
TURNOVER 22,506,866.56 23,017,768.84
Other operating income 5,584,396.01 4,820,148.34
Materials and services
Materials, supplies and goods
Purchases during the financial period -5,546,486.20 -5,091,454.88
Addition/reduction of stock 187,038.07 -21,091.66
External services -3,080,443.24 -3,068,967.09
-8,439,891.37 -8,181,513.63
Staff expenses
Salaries and fees -3,887,630.09 -3,940,485.50
Indirect employee costs
Pension costs -743,462.79 -753,365.62
Other indirect employee costs -157,074.19 -233,531.07
-4,788,167.07 -4,927,382.19
Depreciations, amortisations and impairment
Scheduled depreciations -1,758,255.28 -2,026,739.16
Impairment of non-current assets 0.00 -1,412.78
-1,758,255.28 -2,028,151.94
Other operating expenses -12,767,476.92 -11,567,994.40
OPERATING PROFIT (LOSS) 337,471.93 1,132,875.02
Financial income and expenses
Income from shares in companies of the same Group 1,161,800.00 636,200.00
From others 1,140.00
Other interest and financial income
From companies in the same Group 1,141,485.10 1,002,552.83
From others 3,598.60 5,976.02
Impairments of cash equivalents in current assets -64,240.00 -78,000.00
Interest expenses and other finance costs
To companies in the same Group -148.42 -9,673.19
To others -773,749.01 -801,888.35
1,469,886.27 755,167.31
PROFIT (LOSS) BEFORE APPROPRIATIONS AND TAXES 1,807,358.20 1,888,042.33
Appropriations
Addition/reduction of depreciation difference -90,825.26 1,230.29
Group contributions received/given 6,140,519.33 6,040,370.00
6,049,694.07 6,041,600.29
Taxes for financial period -1,327,952.65 -1,115,300.57
PROFIT (LOSS) 6,529,099.62 6,814,342.05

131FINANCIAL STATEMENTS FOR PARENT COMPANY (FAS)
B. FINANCIAL STATEMENTS FOR PARENT COMPANY (FAS)
BALANCE SHEET (EUR) 31/12/2017 31/12/2016
A S S E T S
NON-CURRENT ASSETS
Intangible assets
Goodwill 498,304.26 737,052.74
Other long-term expenditure 4,684,222.08 2,562,364.46
Advance payments 139,622.02 36,401.29
5,322,148.36 3,335,818.49
Tangible assets
Buildings and structures 2,180,419.08 2,261,139.77
Machines and equipment 2,923,674.73 2,481,730.33
Other tangible assets 1,393.44 1,393.44
Prepayments and incomplete acquisitions 126,529.31 0.00
5,232,016.56 4,744,263.54
Investments
Holdings in Group companies 37,613,128.43 34,965,324.91
Holdings in associated companies 3,047,895.23 1,330,000.00
Other shares and holdings 422,658.84 434,342.84
41,083,682.50 36,729,667.75
NON-CURRENT ASSETS TOTAL 51,637,847.42 44,809,749.78
CURRENT ASSETS
Inventories
Finished goods/Items 569,500.65 382,462.58
569,500.65 382,462.58
Non-current
Non-current trade receivables 261,947.37 14,171.60
Receivables from Group companies 24,616,944.12 22,593,553.38
Loan assets 125,325.09 653,925.09
Other receivables 189,038.46 100,000.00
25,193,255.04 23,361,650.07
Current
Trade receivables 1,350,905.48 1,085,161.85
Receivables from Group companies 24,016,880.93 20,326,322.85
Loan assets 500,000.00 26,400.00
Other receivables 222,841.79 22,322.27
Prepayments and accrued income 806,264.71 636,046.59
26,896,892.91 22,096,253.56
Cash and cash in bank 420,531.84 315,152.86
CURRENT ASSETS TOTAL 53,080,180.44 46,155,519.07
ASSETS TOTAL 104,718,027.86 90,965,268.85

132
BALANCE SHEET (EUR) 31/12/2017 31/12/2016
L I A B I L I T I E S
EQUITY
Share capital 150,000.00 150,000.00
150,000.00 150,000.00
Other reserves
Invested unrestricted equity fund 37,541,513.54 37,541,513.54
37,541,513.54 37,541,513.54
Profit (loss) from previous financial periods 10,498,944.43 8,670,488.38
Profit (loss) from financial period 6,529,099.62 6,814,342.05
EQUITY TOTAL 54,719,557.59 53,176,343.97
APPROPRIATIONS
Depreciation difference 224,231.73 133,406.47
TOTAL APPROPRIATIONS 224,231.73 133,406.47
COMPULSORY PROVISIONS
Other compulsory provisions 0.00 183,151.52
COMPULSORY PROVISIONS TOTAL 0.00 183,151.52
CREDIT CAPITAL
Non-current
Subordinated loans 0.00 76,954.40
Loans from financial institutions 29,496,450.00 23,981,568.00
Liabilities to companies in the same Group 1,683,786.77 774,501.96
Other payables 0.00 460,164.05
31,180,236.77 25,293,188.41
Current
Loans from financial institutions 10,419,872.51 7,461,309.84
Advances received 1,635.51 12,575.31
Accounts payable 2,548,840.73 1,462,816.24
Liabilities to companies in the same Group 3,473,731.00 1,133,786.75
Other payables 596,063.11 413,244.98
Accruals and deferred income 1,553,858.91 1,695,445.36
18,594,001.77 12,179,178.48
CREDIT CAPITAL TOTAL 49,774,238.54 37,472,366.89
LIABILITIES TOTAL 104,718,027.86 90,965,268.85

133FINANCIAL STATEMENTS FOR PARENT COMPANY (FAS)
NOTES TO THE FINANCIAL STATEMENTS 31 DECEMBER 2017
Commodity group Estimated service life Depreciation percentage Depreciation method
Buildings 30 years straight-line depreciation
Goodwill 5-7 years straight-line depreciation
Other intangible assets 3-10 years straight-line depreciation
Machines and equipment 25 residue cost depreciation
NOTES CONCERNING THE PREPARATION OF THE PARENT COMPANY’S FINANCIAL STATEMENTS
Restamax Plc’s financial period is 1 January–31 December. The financial statements have been prepared in accord-ance with the Finnish Accounting Act (FAS).
Principles and methods of measurement and recognition
Measurement of non-current assets
Non-current assets are measured at their acquisition cost less the accrued depreciation.The notes for the non-current assets only present the acquisition costs for those non-current assetswhose acquisition costs have not been completely depreciated as scheduled depreciations.
Basis of and changes to scheduled depreciations
Measurement of current assets
Inventories are measured at their varying acquisition cost in accordance with the FIFO principleand the lowest value principle defined in Section 6(1) of Chapter 5 of the Accounting Act.
The sale receivables and other receivables marked under non-current assets are measured at their nominal value ortheir probable value, whichever is lowest.
Pension coverage for personnel
The pension coverage for the company’s personnel has been arranged in external pension insurance companies. Pension insurance payments have been recognised to correspond with the accruals-based salaries in the financial statements.
Measurement of credit capital
Liabilities are measured at their nominal value.
Own shares
Own shares purchased are recorded as deductions from the accumulated earnings from previous financial periods.

134
NOTES TO THE INCOME STATEMENT
31/12/2017 31/12/2016
Distribution of turnover
Restaurant business 22,223,676.83 22,662,539.99
Other business 283,189.73 355,228.85
22,506,866.56 23,017,768.84
31/12/2017 31/12/2016
Other operating income
Sales profit 376,026.69 0.00
Rental income 251,996.46 161,422.58
Other miscellaneous operating income 145,573.19 835,298.09
Other miscellaneous operating income, Group 4,810,799.67 3,823,427.67
Total 5,584,396.01 4,820,148.34
31/12/2017 31/12/2016
Materials and services
Materials and supplies
Purchases during the financial period 5,546,486.20 5,091,454.88
Changes in inventories -187,038.07 21,091.66
External services 3,080,443.24 3,068,967.09
8,439,891.37 8,181,513.63
31/12/2017 31/12/2016
Staff expenses
Number of staff
Average number of staff 104 99
Total number of staff 104 99
Salaries and fees 3,887,630.09 3,940,485.50
Pension costs 743,462.79 753,365.62
Other indirect employee costs 157,074.19 233,531.07
Total 4,788,167.07 4,927,382.19
Fringe benefits (taxable value) 76,795.65 58,301.07
31/12/2017 31/12/2016
Other operating expenses
Voluntary indirect employee costs 234,773.35 237,781.31
Costs for business premises 7,131,972.97 6,661,586.65
Costs for machinery and equipment 1,068,058.84 906,562.60
Travel expenses 206,351.71 172,490.51
Marketing, performer and entertainment expenses 2,186,431.57 2,131,910.44
Other operating expenses 1,939,888.48 1,457,662.89
12,767,476.92 11,567,994.40
31/12/2017 31/12/2016
Auditor services
Auditor's fee 80,850.00 50,750.00
Other services 41,598.28 86,862.00
Total 122,448.28 137,612.00

135FINANCIAL STATEMENTS FOR PARENT COMPANY (FAS)
31/12/2017 31/12/2016
Financial income and expenses
Income from shares
From companies in the same Group 1,161,800.00 636,200.00
From others 1,140.00 0.00
Impairment of investments in non-current assets
From others -64,240.00 -78,000.00
Interest and other financial income
From companies in the same Group 1,141,485.10 1,002,552.83
From others 3,598.60 5,976.02
Interest and other financing expenses
To companies in the same Group -148.42 -9,673.19
To others -773,749.01 -801,888.35
Total 1,469,886.27 755,167.31
31/12/2017 31/12/2016
Appropriations
Difference of scheduled depreciations and depreciations made in taxation
-90,825.26 1,230.29
Group contributions received 6,140,519.33 6,199,000.00
Group contributions given 0.00 -158,630.00
Total 6,049,694.07 6,041,600.29
31/12/2017 31/12/2016
Income taxes
Income taxes from actual operations 1,327,864.19 1,115,300.57
Taxes from previous financial periods 88.46 0.00
1,327,952.65 1,115,300.57
In 2016, the company received EUR 70,000.00 from Restala Oy as advance dividends.

136
NOTES CONCERNING ASSETS ON THE BALANCE SHEET
Non-current assets
Tangible assets BuildingsMachines and
equipmentOther tangible
assets
Prepayments and incomplete
acquisitions Total
Book value 1 Jan 2,261,139.77 2,481,730.33 1,393.44 0.00 4,744,263.54
Additions 0.00 1,124,865.24 0.00 126,529.31 1,251,394.55
Deductions 0.00 -117,352.92 0.00 0.00 -117,352.92
Depreciation during the financial period -80,720.69 -565,567.92 0.00 0.00 -646,288.61
Book value on 31 December 2,180,419.08 2,923,674.73 1,393.44 126,529.31 5,232,016.56
Intangible assets Goodwill Other intangible assets Total
Book value 1 Jan 737,052.74 2,598,765.74 3,335,818.49
Additions 33,500.00 3,064,851.43 3,098,351.43
Deductions 0.00 -54.89 -54.89
Depreciation during the financial period -272,248.48 -839,718.19 -1,111,966.67
Book value on 31 December 498,304.26 4,823,844.10 5,322,148.36
InvestmentsHoldings in
Group companiesHoldings in associated
companiesOther shares and
holdings Total
Book value 1 Jan 34,965,324.91 1,330,000.00 434,342.84 36,729,667.75
Additions 2,649,553.52 1,717,895.23 0.00 4,367,448.75
Deductions -1,750.00 0.00 -11,684.00 -13,434.00
Book value on 31 December 37,613,128.43 3,047,895.23 422,658.84 41,083,682.50
NOTES TO THE BALANCE SHEET

137FINANCIAL STATEMENTS FOR PARENT COMPANY (FAS)
Company’s shares in other companies where its ownership exceeds 20 per cent
Company name and type Domicile Share %
Beaniemax Oy Tampere 60.0%
Dinnermax Oy Tampere 70.0%
Gastromax Oy (Group) Tampere 70.0%
Pyynikin Brewery Restaurants Oy Tampere 85.0%
Harry's Ravintolat Oy Helsinki 90.0%
Hernesaaren Ranta Oy Helsinki 80.0%
Italpal Oy Tampere 100.0%
Kampin Sirkus Oy (Group) Tampere 90.0%
Markkinointitoimisto Aito Finland Oy Tampere 100.0%
Koskimax Oy Tampere 59.6%
Levin Ravintolakatu Oy Helsinki 100.0%
Max Consulting Oy (Group) Tampere 100.0%
Suomen Ravintolatoimi Oy (Group) Jyväskylä 42.1%
Bistromax oy Tampere 70.0%
Mikonkadun keidas Oy Tampere 90.0%
Northmax Oy Tampere 70.0%
Poolmax Oy Tampere 80.0%
Priima Ravintolat Oy (Group) Tampere 63.8%
Rock Hard Catering Oy Tampere 88.0%
Tampereen Satamaravintolat Oy Tampere 100.0%
Purmax Oy Tampere 60.0%
Rengasravintolat Oy Tampere 100.0%
Restala Oy (Group) Helsinki 100.0%
Unioninkadun keidas Oy Helsinki 82.0%
Rivermax Oy (Group) Tampere 72.0%
Tillikka Oy Tampere 80.0%
Roska Yhtiöt Oy Tampere 100.0%
Skohan Oy Tampere 75.0%
Somax Oy Tampere 70.0%
Soolo Max Oy Tampere 70.0%
SRMax Oy Tampere 85.0%
Suomen Diner Ravintolat Oy Tampere 80.0%
Suomen Ravintolatoimi Oy Jyväskylä 57.9%
Suomen Siipiravintolat Oy Tampere 70.0%
Thai Papaya Oy Helsinki 60.0%
Tunturimax Oy Tampere 76.0%
Unioninkadun keidas Oy Helsinki 18.0%
Urban Group Oy (Group) Helsinki 80.0%
Cholo Oy Helsinki 100.0%
Sabor a México Oy Helsinki 100.0%
Holdings in Group companies

138
Company name and type Domicile Share %
Smile Henkilöstöpalvelut Oy (Group) Tampere 78.4%
Happy Henkilöstöpalvelut Oy Tampere 100.0%
Job Services One Oy Tampere 100.0%
Max Henkilöstöpalvelut Oy Tampere 100.0%
Resta Henkilöstöpalvelut Oy Tampere 100.0%
RM Henkilöstöpalvelut Oy Tampere 100.0%
Smile Botnia Oy Tampere 90.0%
Smile Doctors Oy Tampere 71.3%
Smile Education Oy Tampere 51.0%
Smile Events & Promotions Oy Tampere 100.0%
Smile Huippu Oy (Group) Kuopio 75.0%
Smile Pavelut Jyväskylä Oy Tampere 100.0%
Smile ICT Oy Tampere 55.0%
Smile MMS Oy (Group) Kuortane 100.0%
Smile Industries Oy (Group) Kuortane 100.0%
Smile Industries Jyväskylä Oy Tampere 100.0%
Smile Industries Kuopio Oy Tampere 90.0%
Smile Industries Tampere Oy (Group) Tampere 76.5%
Smile Industries Manse Oy Tampere 100.0%
Smile MMS Työllistamispalvelut Oy Kuortane 70.0%
Smile Pohjanmaa Oy Kuortane 72.0%
Smile Palvelut Helsinki Oy Tampere 100.0%
Smile Palvelut Hämeenlinna Oy Hämeenlinna 100.0%
Smile Palvelut Pohjoinen Oy Tampere 100.0%
Smile Palvelut Ilo Oy Tampere 100.0%
Smile Palvelut Turku Oy Tampere 100.0%
Smile Railways Oy Tampere 100.0%
Smile Services Oy Tampere 100.0%
Smile Super Oy Tampere 100.0%
Smile Tampere Oy Tampere 100.0%
Smile Banssi Oy (Group) Tampere 100.0%
Smile Banssi Etelä Oy Espoo 90.9%
Smile Banssi Pohjoinen Oy Espoo 100.0%
Smile Banssi Häme Oy Espoo 100.0%
Smile Banssi Uusimaa Oy Vantaa 90.9%
Smile Banssi Itä Oy Joensuu 100.0%
Smile Banssi Länsi Oy Turku 100.0%
Smile Banssi Keski Oy Jyväskylä 90.0%
Smile Banssi Lappi Oy Rovaniemi 90.0%
Smile Banssi Helsinki Oy Helsinki 100.0%
Smile Banssi Safety Oy Espoo 100.0%
Smile Banssi Kaakko Oy Lappeenranta 90.0%
Smile Hoiva Oy Espoo 100.0%
Talous Bandora Oy Espoo 100.0%
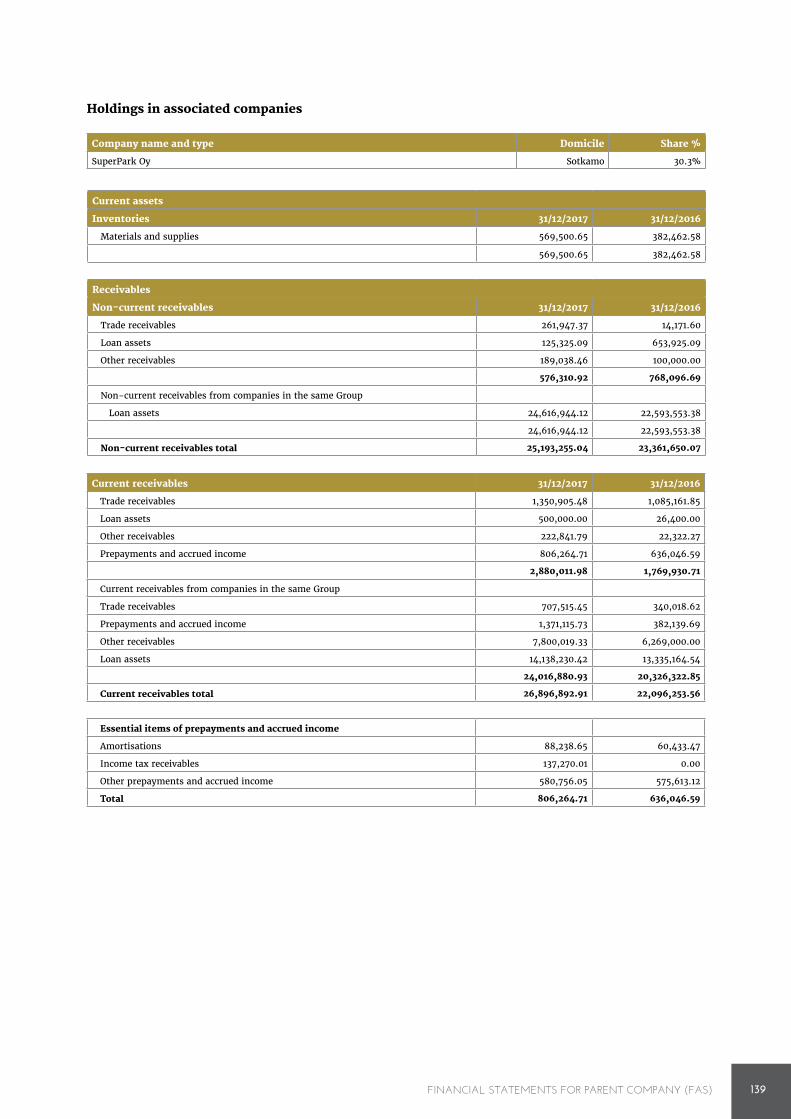
139FINANCIAL STATEMENTS FOR PARENT COMPANY (FAS)
Company name and type Domicile Share %
SuperPark Oy Sotkamo 30.3%
Holdings in associated companies
Current assets
Inventories 31/12/2017 31/12/2016
Materials and supplies 569,500.65 382,462.58
569,500.65 382,462.58
Receivables
Non-current receivables 31/12/2017 31/12/2016
Trade receivables 261,947.37 14,171.60
Loan assets 125,325.09 653,925.09
Other receivables 189,038.46 100,000.00
576,310.92 768,096.69
Non-current receivables from companies in the same Group
Loan assets 24,616,944.12 22,593,553.38
24,616,944.12 22,593,553.38
Non-current receivables total 25,193,255.04 23,361,650.07
Current receivables 31/12/2017 31/12/2016
Trade receivables 1,350,905.48 1,085,161.85
Loan assets 500,000.00 26,400.00
Other receivables 222,841.79 22,322.27
Prepayments and accrued income 806,264.71 636,046.59
2,880,011.98 1,769,930.71
Current receivables from companies in the same Group
Trade receivables 707,515.45 340,018.62
Prepayments and accrued income 1,371,115.73 382,139.69
Other receivables 7,800,019.33 6,269,000.00
Loan assets 14,138,230.42 13,335,164.54
24,016,880.93 20,326,322.85
Current receivables total 26,896,892.91 22,096,253.56
Essential items of prepayments and accrued income
Amortisations 88,238.65 60,433.47
Income tax receivables 137,270.01 0.00
Other prepayments and accrued income 580,756.05 575,613.12
Total 806,264.71 636,046.59
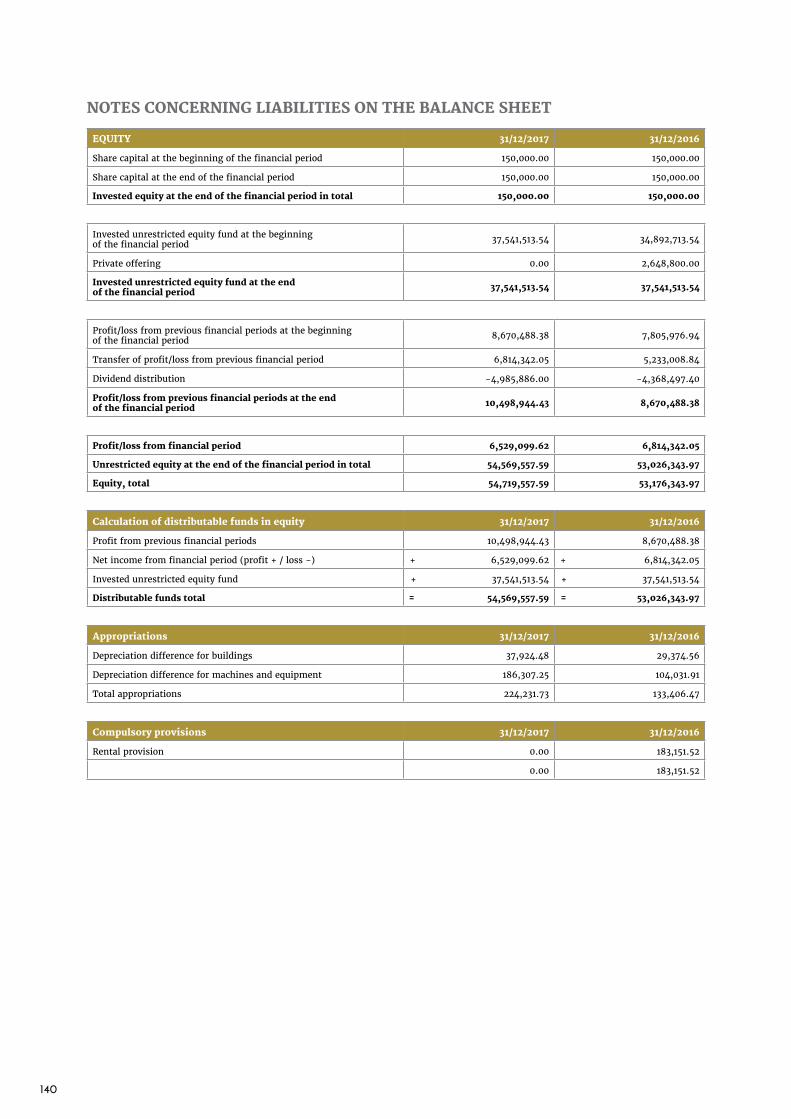
140
NOTES CONCERNING LIABILITIES ON THE BALANCE SHEET
EQUITY 31/12/2017 31/12/2016
Share capital at the beginning of the financial period 150,000.00 150,000.00
Share capital at the end of the financial period 150,000.00 150,000.00
Invested equity at the end of the financial period in total 150,000.00 150,000.00
Invested unrestricted equity fund at the beginning of the financial period 37,541,513.54 34,892,713.54
Private offering 0.00 2,648,800.00
Invested unrestricted equity fund at the end of the financial period 37,541,513.54 37,541,513.54
Profit/loss from previous financial periods at the beginning of the financial period 8,670,488.38 7,805,976.94
Transfer of profit/loss from previous financial period 6,814,342.05 5,233,008.84
Dividend distribution -4,985,886.00 -4,368,497.40
Profit/loss from previous financial periods at the end of the financial period 10,498,944.43 8,670,488.38
Profit/loss from financial period 6,529,099.62 6,814,342.05
Unrestricted equity at the end of the financial period in total 54,569,557.59 53,026,343.97
Equity, total 54,719,557.59 53,176,343.97
Calculation of distributable funds in equity 31/12/2017 31/12/2016
Profit from previous financial periods 10,498,944.43 8,670,488.38
Net income from financial period (profit + / loss -) + 6,529,099.62 + 6,814,342.05
Invested unrestricted equity fund + 37,541,513.54 + 37,541,513.54
Distributable funds total = 54,569,557.59 = 53,026,343.97
Appropriations 31/12/2017 31/12/2016
Depreciation difference for buildings 37,924.48 29,374.56
Depreciation difference for machines and equipment 186,307.25 104,031.91
Total appropriations 224,231.73 133,406.47
Compulsory provisions 31/12/2017 31/12/2016
Rental provision 0.00 183,151.52
0.00 183,151.52

141FINANCIAL STATEMENTS FOR PARENT COMPANY (FAS)
CREDIT CAPITAL 31/12/2017 31/12/2016
Non-current credit capital
Subordinated loans 0.00 76,954.40
Loans from financial institutions 29,496,450.00 23,981,568.00
Liabilities to companies in the same Group
Other liabilities to Group companies 1,683,786.77 774,501.96
Advances received 0.00 0.00
1,683,786.77 774,501.96
Other non-current liabilities 0.00 460,164.05
Non-current credit capital total 31,180,236.77 25,293,188.41
Liabilities that mature later than within five years 31/12/2017 31/12/2016
Loans from financial institutions 1,755.14 3,721.40
Current credit capital 31/12/2017 31/12/2016
Loans from financial institutions 10,419,872.51 7,461,309.84
Advances received 1,635.51 12,575.31
Accounts payable 2,548,840.73 1,462,816.24
Liabilities to companies in the same Group
Accounts payable 1,039,282.06 402,094.85
Liabilities 2,422,524.51 674,964.66
Advances received 0.00 43,264.00
Accruals and deferred income 11,924.43 13,463.24
3,473,731.00 1,133,786.75
Other payables 596,063.11 413,244.98
Accruals and deferred income 1,553,858.91 1,695,445.36
Current credit capital total 18,594,001.77 12,179,178.48
Essential items of accrued charges and deferred credits 31/12/2017 31/12/2016
Salary debt 256,108.63 266,215.36
Holiday salary debt 628,659.25 596,093.12
Pension insurance 193,945.97 178,441.73
Income tax liabilities 0.00 173,300.57
Other accruals and deferred income 475,145.06 481,394.58
Accrued expenses, total 1,553,858.91 1,695,445.36
The total balance of the consolidated account is presented in current liabilities. The parent company’s receivable or liability is presented as a receivable from Group companies or a liability to Group companies.
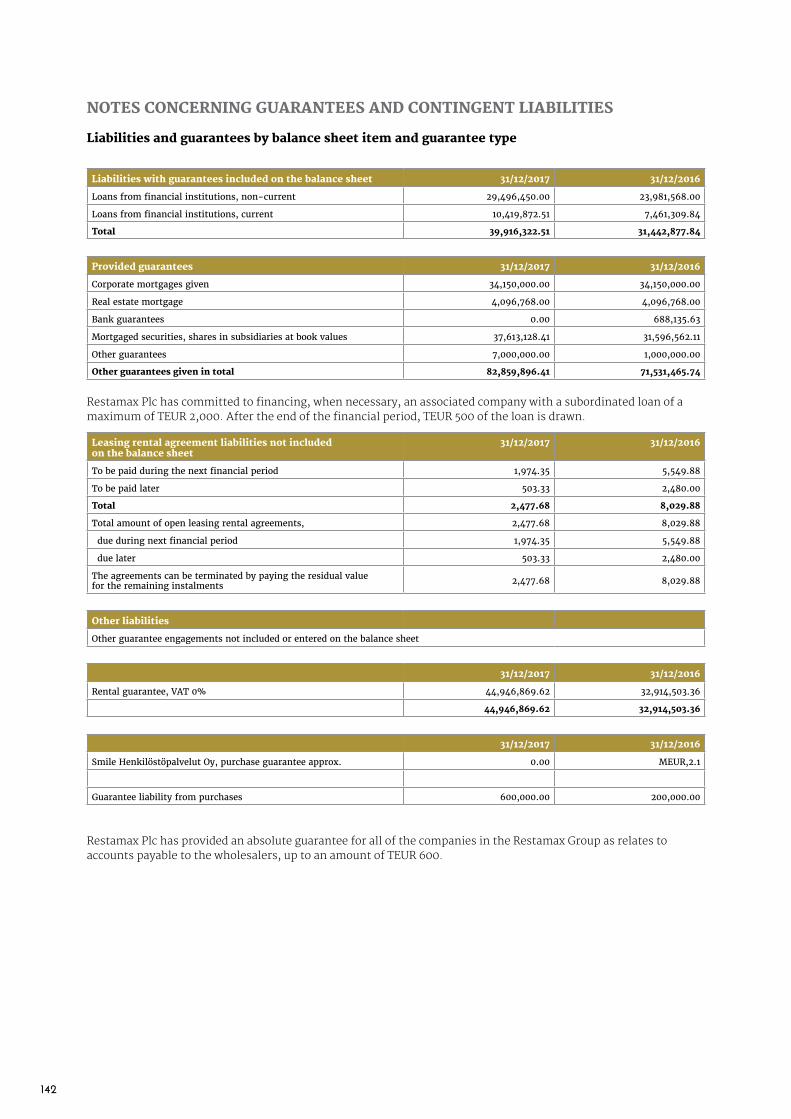
142
NOTES CONCERNING GUARANTEES AND CONTINGENT LIABILITIES
Liabilities and guarantees by balance sheet item and guarantee type
Liabilities with guarantees included on the balance sheet 31/12/2017 31/12/2016
Loans from financial institutions, non-current 29,496,450.00 23,981,568.00
Loans from financial institutions, current 10,419,872.51 7,461,309.84
Total 39,916,322.51 31,442,877.84
Provided guarantees 31/12/2017 31/12/2016
Corporate mortgages given 34,150,000.00 34,150,000.00
Real estate mortgage 4,096,768.00 4,096,768.00
Bank guarantees 0.00 688,135.63
Mortgaged securities, shares in subsidiaries at book values 37,613,128.41 31,596,562.11
Other guarantees 7,000,000.00 1,000,000.00
Other guarantees given in total 82,859,896.41 71,531,465.74
Leasing rental agreement liabilities not included on the balance sheet
31/12/2017 31/12/2016
To be paid during the next financial period 1,974.35 5,549.88
To be paid later 503.33 2,480.00
Total 2,477.68 8,029.88
Total amount of open leasing rental agreements, 2,477.68 8,029.88
due during next financial period 1,974.35 5,549.88
due later 503.33 2,480.00
The agreements can be terminated by paying the residual value for the remaining instalments 2,477.68 8,029.88
Other liabilities
Other guarantee engagements not included or entered on the balance sheet
31/12/2017 31/12/2016
Rental guarantee, VAT 0% 44,946,869.62 32,914,503.36
44,946,869.62 32,914,503.36
31/12/2017 31/12/2016
Smile Henkilöstöpalvelut Oy, purchase guarantee approx. 0.00 MEUR,2.1
Guarantee liability from purchases 600,000.00 200,000.00
Restamax Plc has committed to financing, when necessary, an associated company with a subordinated loan of a maximum of TEUR 2,000. After the end of the financial period, TEUR 500 of the loan is drawn.
Restamax Plc has provided an absolute guarantee for all of the companies in the Restamax Group as relates to accounts payable to the wholesalers, up to an amount of TEUR 600.

143EMOYHTIÖN TILINPÄÄTÖS (FAS)
CASH FLOW STATEMENT FOR 1 JANUARY–31 DECEMBER 2017
€ thousand 1 January–31 December 2017 1 January–31 December 2016
Operating cash flow:
Profit (loss) before appropriations and taxes 1,807 1,888
Adjustments:
Scheduled depreciations and impairment 1,758 2,028
Other income and expenses that do not incur payments -54 -889
Financial income and expenses -1,470 -755
Other adjustments -307 83
Cash flow before change in working capital 1,734 2,355
Change in working capital:
Increase (-)/deduction (+) in current interest-free receivables -1170 319
Increase (-)/deduction (+) in inventories -187 21
Increase (-)/deduction (+) in current interest-free liabilities 1914 -948
Operating cash flow before financial items and taxes 2,291 1,746
Interest and fees paid for other operating finance costs -755 -757
Dividends received from business operations 1,233 1,516
Interest received from business operations 151 896
Immediate taxes paid -1,636 -1,914
Cash flow before extraordinary items 1,285 1,488
Operating cash flow (A) 1,285 1,488
Investment cash flow:
Investments in tangible and intangible assets -4,709 -984
Income from assignment of tangible and intangible assets 55 1,082
Investments in other investments -4,367 -779
Income from assignment of other investments 199 0
Deduction (+)/increase (-) of non-current loans receivable -2,826 -2,245
Investment cash flow: (B) -11,649 -2,926
Finance cash flow:
Current loans drawn (+)/repaid (-) 3,565 -1,367
Non-current loans drawn (+) 13,560 21,740
Non-current loans repaid (-) -7,673 -20,960
Dividends paid and other distribution of profits -4,986 -4,368
Group contributions received (+) 6,162 6,424
Group contributions given (-) -159 0
Finance cash flow: (C) 10,469 1,469
Change in cash and cash equivalents (A+B+C), increase (+)/deduction (-)
105 30
Cash and cash equivalents at the beginning of the financial period 315 158
Cash and cash equivalents transferred in merger 0 126
Cash and cash equivalents at the end of the financial period 421 315
Cash and cash equivalents at the end of the financial period, excluding the merger
105 30
Change 0 0

144
SIGNATURES FOR FINANCIAL STATEMENTS AND ANNUAL REPORT 31 DECEMBER 2017
Date and signatures
Tampere, 27 March 2018
Auditor’s note
An audit report has been provided today.
Date and signature
Tampere, 27 March 2018
Deloitte Oy Authorised Public Accountants
Timo Laine hallituksen puheenjohtaja
Timo Everi
Petri Olkinuora
Hannu Mattila APA
Mikko Aartio
Mika Niemi
Juha Helminen CEO
Jarmo Viitala
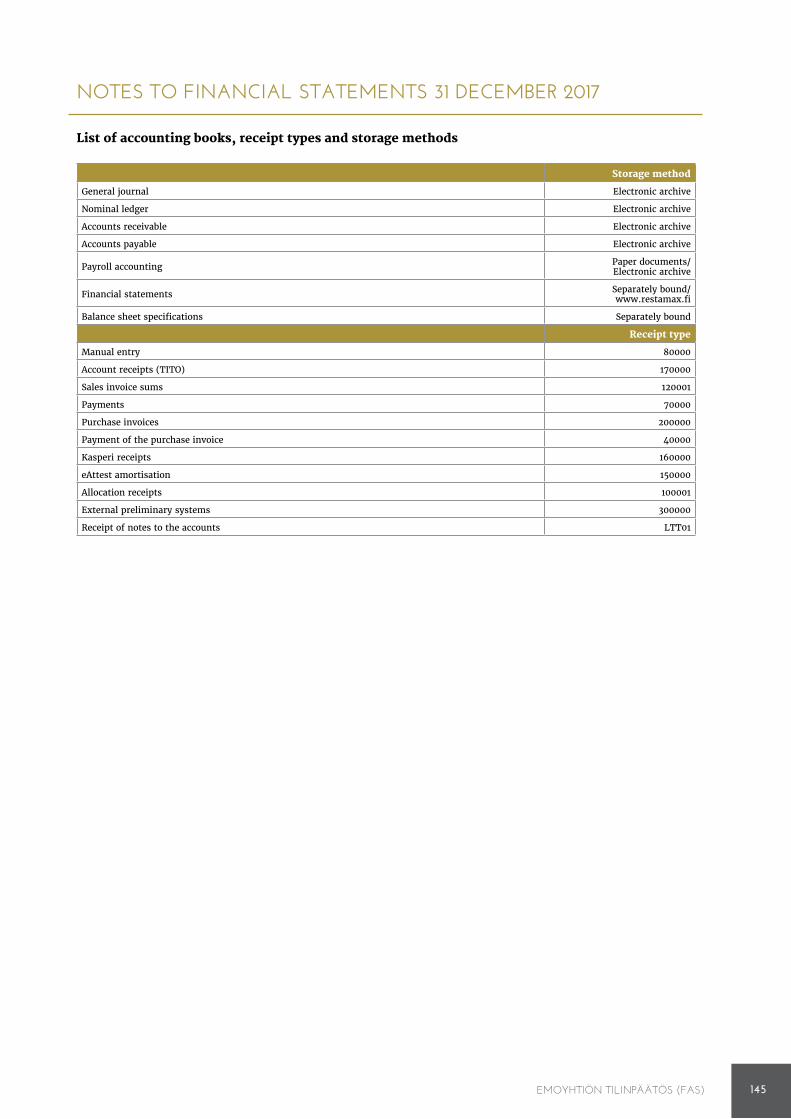
145EMOYHTIÖN TILINPÄÄTÖS (FAS)
NOTES TO FINANCIAL STATEMENTS 31 DECEMBER 2017
Storage method
General journal Electronic archive
Nominal ledger Electronic archive
Accounts receivable Electronic archive
Accounts payable Electronic archive
Payroll accounting Paper documents/Electronic archive
Financial statements Separately bound/www.restamax.fi
Balance sheet specifications Separately bound
Receipt type
Manual entry 80000
Account receipts (TITO) 170000
Sales invoice sums 120001
Payments 70000
Purchase invoices 200000
Payment of the purchase invoice 40000
Kasperi receipts 160000
eAttest amortisation 150000
Allocation receipts 100001
External preliminary systems 300000
Receipt of notes to the accounts LTT01
List of accounting books, receipt types and storage methods


RESTAMAX PLC
HATANPÄÄN VALTATIE 1 B, 33100 TAMPERE
WWW.RESTAMAX.FI • WWW.RAVINTOLA.FI