Embed Size (px)
Citation preview
IMF YJMBI-64867; No. of pages: 9; 4C: 4, 6
Communication
Jianyi Yang1, 2
0022-2836/© 2015 Elsevi
Please cite this article asStructure Prediction, J.
ResQ: An Approach to Unified Estimation ofB-Factor and Residue-Specific Error inProtein Structure Prediction
, Yan Wang2, 3 and Yang Z
hang2, 41 - School of Mathematical Sciences, Nankai University, Tianjin 300071, China2 - Department of Computational Medicine and Bioinformatics, University of Michigan, Ann Arbor, MI 48109, USA3 - School of Life Science and Technology, Huazhong University of Science and Technology, Wuhan, Hubei 430074, China4 - Department of Biological Chemistry, University of Michigan, Ann Arbor, MI 48109, USA
Correspondence to Yang Zhang: Department of Computational Medicine and Bioinformatics, University of Michigan,Ann Arbor, MI 48109, USA. [email protected]://dx.doi.org/10.1016/j.jmb.2015.09.024Edited by M. Sternberg
Abstract
Computer-based structure prediction becomes a major tool to provide large-scale structure models forannotating biological function of proteins. Information of residue-level accuracy and thermal mobility (orB-factor), which is critical to decide how biologists utilize the predicted models, is however missed in moststructure prediction pipelines. We developed ResQ for unified residue-level model quality and B-factorestimations by combining local structure assembly variations with sequence-based and structure-basedprofiling. ResQ was tested on 635 non-redundant proteins with structure models generated by I-TASSER,where the average difference between estimated and observed distance errors is 1.4 Å for the confidentlymodeled proteins. ResQ was further tested on structure decoys from CASP9-11 experiments, where the errorof local structure quality prediction is consistently lower than or comparable to other state-of-the-art predictors.Finally, ResQ B-factor profile was used to assist molecular replacement, which resulted in successfulsolutions on several proteins that could not be solved from constant B-factor settings.
© 2015 Elsevier Ltd. All rights reserved.
Introduction
With the rapidly increasing gap between the numberof protein sequences and the number of experimentallycharacterized structures, computer-based structureprediction becomes a major means for the molecularand cellular biologists to obtain three-dimensionalstructure models of proteins for interpreting thebiological function or designing new biochemicalexperiments. Although progress has been constantlywitnessed on structure predictions in the community-wideCASP experiments [1], a reliable estimation of thequality of predicted structure models, in particular, theresidue-level local accuracy that is critical to thestructure-based functional analyses (such as active-site recognition, ligand docking and drug screening), isoften missed in most of the state-of-the-art structureprediction pipelines [2].Another highly relevant but often-missed local
feature in structure prediction is the inherent thermal
er Ltd. All rights reserved.
: J. Yang, et al., ResQ: An Approach to UnifMol. Biol. (2015), http://dx.doi.org/10.1016/j.
mobility of protein atoms. At the absolute zero oftemperature, protein atoms are assumed to stay atthe equilibrium position of the lowest energy.However, as the temperature increases, the ambientthermal energy causes the atoms to oscillate aroundthe equilibrium positions, the extent of which oftenvaries depending on the three-dimensional structureand the interaction with ligand and solvent atoms.The atomic motion can be experimentally measured inthe X-ray crystallography as B-factor (or temperaturefactor), which was introduced as an amendment factorof the structure factor calculations since the scatteringeffect of X-ray is reduced on the oscillating atomscompared to the atomsat rest [3]. TheB-factor of the j thatom can be formally written as Bj = 8π2⟨rj
2⟩, where rjcorresponds to the displacement of the jth atom from itsequilibrium position. The thermalmotion andmobility ofprotein atoms are closely linked to how the protein foldsto the native state and how it interacts with specificbinding partners in the cellular environment [4].
J Mol Biol (2015) xx, xxx–xxx
ied Estimation of B-Factor and Residue-Specific Error in Proteinjmb.2015.09.024
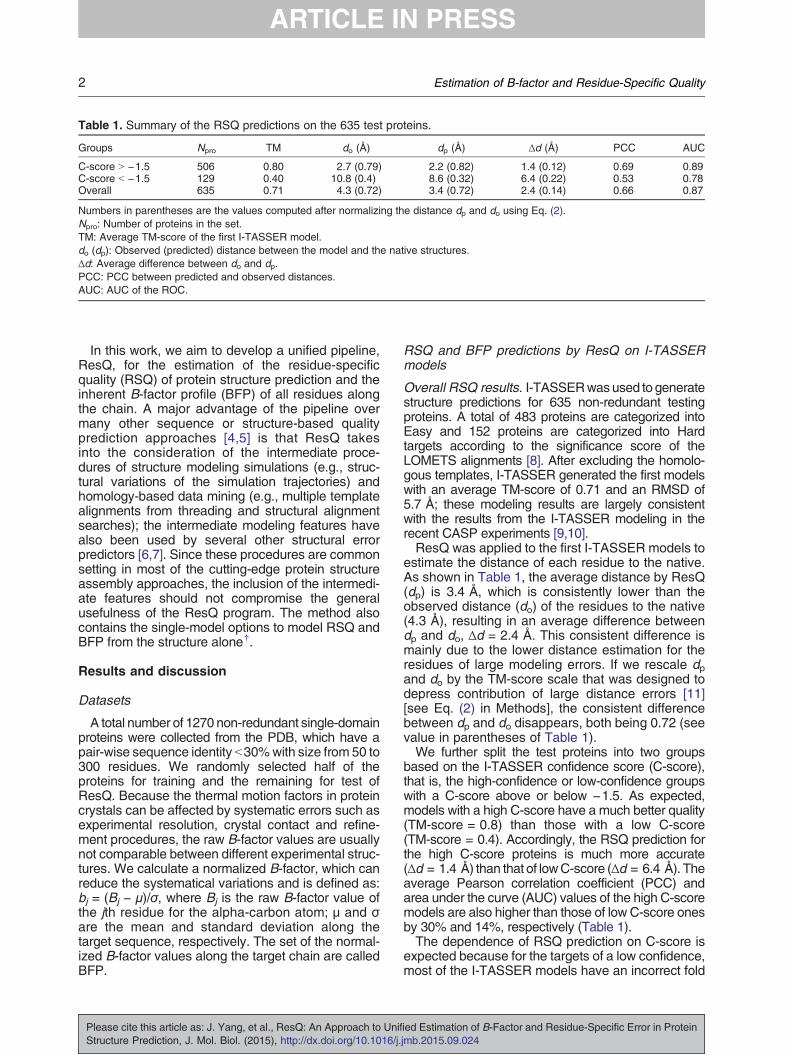
Table 1. Summary of the RSQ predictions on the 635 test proteins.
Groups Npro TM do (Å) dp (Å) Δd (Å) PCC AUC
C-score N −1.5 506 0.80 2.7 (0.79) 2.2 (0.82) 1.4 (0.12) 0.69 0.89C-score b −1.5 129 0.40 10.8 (0.4) 8.6 (0.32) 6.4 (0.22) 0.53 0.78Overall 635 0.71 4.3 (0.72) 3.4 (0.72) 2.4 (0.14) 0.66 0.87
Numbers in parentheses are the values computed after normalizing the distance dp and do using Eq. (2).Npro: Number of proteins in the set.TM: Average TM-score of the first I-TASSER model.do (dp): Observed (predicted) distance between the model and the native structures.Δd: Average difference between do and dp.PCC: PCC between predicted and observed distances.AUC: AUC of the ROC.
2 Estimation of B-factor and Residue-Specific Quality
In this work, we aim to develop a unified pipeline,ResQ, for the estimation of the residue-specificquality (RSQ) of protein structure prediction and theinherent B-factor profile (BFP) of all residues alongthe chain. A major advantage of the pipeline overmany other sequence or structure-based qualityprediction approaches [4,5] is that ResQ takesinto the consideration of the intermediate proce-dures of structure modeling simulations (e.g., struc-tural variations of the simulation trajectories) andhomology-based data mining (e.g., multiple templatealignments from threading and structural alignmentsearches); the intermediate modeling features havealso been used by several other structural errorpredictors [6,7]. Since these procedures are commonsetting in most of the cutting-edge protein structureassembly approaches, the inclusion of the intermedi-ate features should not compromise the generalusefulness of the ResQ program. The method alsocontains the single-model options to model RSQ andBFP from the structure alone†.
Results and discussion
Datasets
A total number of 1270 non-redundant single-domainproteins were collected from the PDB, which have apair-wise sequence identity b30%with size from 50 to300 residues. We randomly selected half of theproteins for training and the remaining for test ofResQ. Because the thermal motion factors in proteincrystals can be affected by systematic errors such asexperimental resolution, crystal contact and refine-ment procedures, the raw B-factor values are usuallynot comparable between different experimental struc-tures. We calculate a normalized B-factor, which canreduce the systematical variations and is defined as:bj = (Bj − μ)/σ, where Bj is the raw B-factor value ofthe jth residue for the alpha-carbon atom; μ and σare the mean and standard deviation along thetarget sequence, respectively. The set of the normal-ized B-factor values along the target chain are calledBFP.
Please cite this article as: J. Yang, et al., ResQ: An Approach to UnifStructure Prediction, J. Mol. Biol. (2015), http://dx.doi.org/10.1016/j.
RSQ and BFP predictions by ResQ on I-TASSERmodels
Overall RSQ results. I-TASSERwasused to generatestructure predictions for 635 non-redundant testingproteins. A total of 483 proteins are categorized intoEasy and 152 proteins are categorized into Hardtargets according to the significance score of theLOMETS alignments [8]. After excluding the homolo-gous templates, I-TASSER generated the first modelswith an average TM-score of 0.71 and an RMSD of5.7 Å; these modeling results are largely consistentwith the results from the I-TASSER modeling in therecent CASP experiments [9,10].ResQ was applied to the first I-TASSER models to
estimate the distance of each residue to the native.As shown in Table 1, the average distance by ResQ(dp) is 3.4 Å, which is consistently lower than theobserved distance (do) of the residues to the native(4.3 Å), resulting in an average difference betweendp and do, Δd = 2.4 Å. This consistent difference ismainly due to the lower distance estimation for theresidues of large modeling errors. If we rescale dpand do by the TM-score scale that was designed todepress contribution of large distance errors [11][see Eq. (2) in Methods], the consistent differencebetween dp and do disappears, both being 0.72 (seevalue in parentheses of Table 1).We further split the test proteins into two groups
based on the I-TASSER confidence score (C-score),that is, the high-confidence or low-confidence groupswith a C-score above or below −1.5. As expected,models with a high C-score have a much better quality(TM-score = 0.8) than those with a low C-score(TM-score = 0.4). Accordingly, the RSQ prediction forthe high C-score proteins is much more accurate(Δd = 1.4 Å) than that of lowC-score (Δd = 6.4 Å). Theaverage Pearson correlation coefficient (PCC) andarea under the curve (AUC) values of the high C-scoremodels are also higher than those of low C-score onesby 30% and 14%, respectively (Table 1).The dependence of RSQ prediction on C-score is
expected because for the targets of a low confidence,most of the I-TASSER models have an incorrect fold
ied Estimation of B-Factor and Residue-Specific Error in Proteinjmb.2015.09.024
3Estimation of B-factor and Residue-Specific Quality
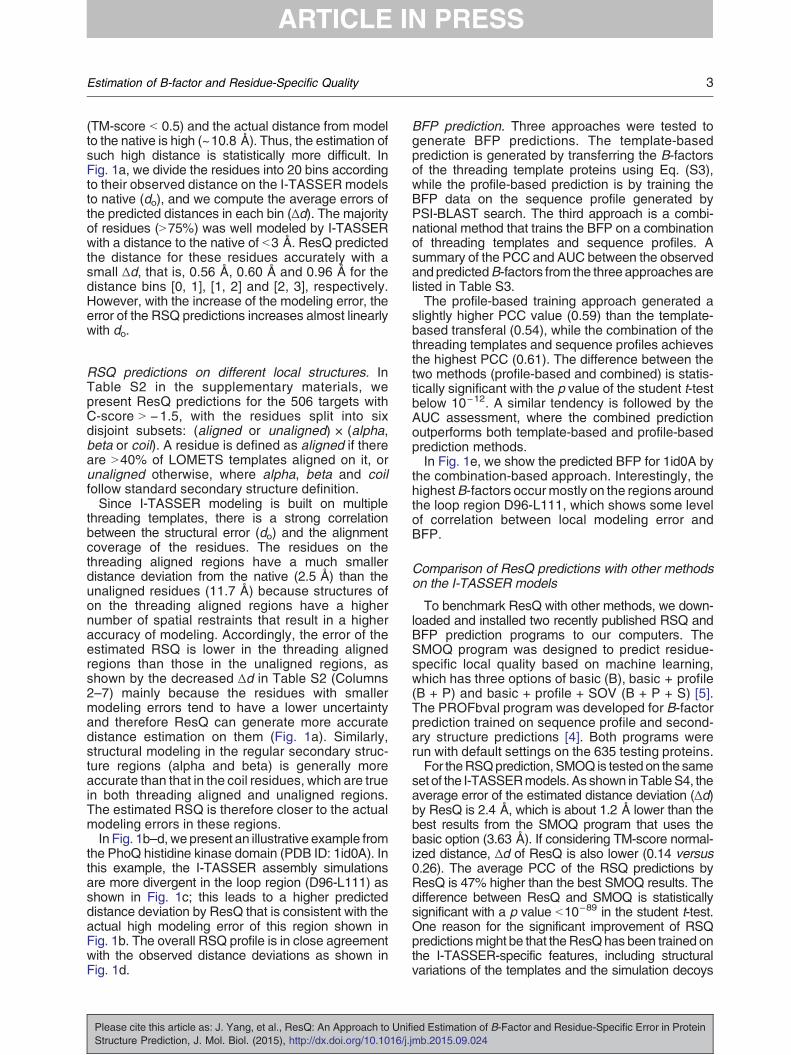
(TM-score b 0.5) and the actual distance from modelto the native is high (~10.8 Å). Thus, the estimation ofsuch high distance is statistically more difficult. InFig. 1a, we divide the residues into 20 bins accordingto their observed distance on the I-TASSER modelsto native (do), and we compute the average errors ofthe predicted distances in each bin (Δd). The majorityof residues (N75%) was well modeled by I-TASSERwith a distance to the native of b3 Å. ResQ predictedthe distance for these residues accurately with asmall Δd, that is, 0.56 Å, 0.60 Å and 0.96 Å for thedistance bins [0, 1], [1, 2] and [2, 3], respectively.However, with the increase of the modeling error, theerror of the RSQ predictions increases almost linearlywith do.
RSQ predictions on different local structures. InTable S2 in the supplementary materials, wepresent ResQ predictions for the 506 targets withC-score N −1.5, with the residues split into sixdisjoint subsets: (aligned or unaligned) × (alpha,beta or coil). A residue is defined as aligned if thereare N40% of LOMETS templates aligned on it, orunaligned otherwise, where alpha, beta and coilfollow standard secondary structure definition.Since I-TASSER modeling is built on multiple
threading templates, there is a strong correlationbetween the structural error (do) and the alignmentcoverage of the residues. The residues on thethreading aligned regions have a much smallerdistance deviation from the native (2.5 Å) than theunaligned residues (11.7 Å) because structures ofon the threading aligned regions have a highernumber of spatial restraints that result in a higheraccuracy of modeling. Accordingly, the error of theestimated RSQ is lower in the threading alignedregions than those in the unaligned regions, asshown by the decreased Δd in Table S2 (Columns2–7) mainly because the residues with smallermodeling errors tend to have a lower uncertaintyand therefore ResQ can generate more accuratedistance estimation on them (Fig. 1a). Similarly,structural modeling in the regular secondary struc-ture regions (alpha and beta) is generally moreaccurate than that in the coil residues, which are truein both threading aligned and unaligned regions.The estimated RSQ is therefore closer to the actualmodeling errors in these regions.In Fig. 1b–d, wepresent an illustrative example from
the PhoQ histidine kinase domain (PDB ID: 1id0A). Inthis example, the I-TASSER assembly simulationsare more divergent in the loop region (D96-L111) asshown in Fig. 1c; this leads to a higher predicteddistance deviation by ResQ that is consistent with theactual high modeling error of this region shown inFig. 1b. The overall RSQ profile is in close agreementwith the observed distance deviations as shown inFig. 1d.
Please cite this article as: J. Yang, et al., ResQ: An Approach to UnifStructure Prediction, J. Mol. Biol. (2015), http://dx.doi.org/10.1016/j.
BFP prediction. Three approaches were tested togenerate BFP predictions. The template-basedprediction is generated by transferring the B-factorsof the threading template proteins using Eq. (S3),while the profile-based prediction is by training theBFP data on the sequence profile generated byPSI-BLAST search. The third approach is a combi-national method that trains the BFP on a combinationof threading templates and sequence profiles. Asummary of the PCC and AUC between the observedand predictedB-factors from the three approachesarelisted in Table S3.The profile-based training approach generated a
slightly higher PCC value (0.59) than the template-based transferal (0.54), while the combination of thethreading templates and sequence profiles achievesthe highest PCC (0.61). The difference between thetwo methods (profile-based and combined) is statis-tically significant with the p value of the student t-testbelow 10−12. A similar tendency is followed by theAUC assessment, where the combined predictionoutperforms both template-based and profile-basedprediction methods.In Fig. 1e, we show the predicted BFP for 1id0A by
the combination-based approach. Interestingly, thehighestB-factors occur mostly on the regions aroundthe loop region D96-L111, which shows some levelof correlation between local modeling error andBFP.
Comparison of ResQ predictions with other methodson the I-TASSER models
To benchmark ResQ with other methods, we down-loaded and installed two recently published RSQ andBFP prediction programs to our computers. TheSMOQ program was designed to predict residue-specific local quality based on machine learning,which has three options of basic (B), basic + profile(B + P) and basic + profile + SOV (B + P + S) [5].The PROFbval program was developed for B-factorprediction trained on sequence profile and second-ary structure predictions [4]. Both programs wererun with default settings on the 635 testing proteins.For theRSQprediction, SMOQ is tested on the same
set of the I-TASSERmodels. As shown inTableS4, theaverage error of the estimated distance deviation (Δd)by ResQ is 2.4 Å, which is about 1.2 Å lower than thebest results from the SMOQ program that uses thebasic option (3.63 Å). If considering TM-score normal-ized distance, Δd of ResQ is also lower (0.14 versus0.26). The average PCC of the RSQ predictions byResQ is 47% higher than the best SMOQ results. Thedifference between ResQ and SMOQ is statisticallysignificant with a p value b10−89 in the student t-test.One reason for the significant improvement of RSQpredictionsmight be that theResQhas been trained onthe I-TASSER-specific features, including structuralvariations of the templates and the simulation decoys
ied Estimation of B-Factor and Residue-Specific Error in Proteinjmb.2015.09.024

Fig. 1. RSQ and BFP predictions by ResQ. (a) Histogram and RSQ distribution at different modeling errors (do) basedon I-TASSER models from 506 test proteins with C-score N −1.5. Open circles connected by broken curve show thepercentageof residues. Filled circleswith continuous curve are the average prediction error (Δd) in each distance bin. (b–e)Anillustrative example from1id0Ashowing theResQpredictions. (b)Superposition of theX-ray structure (red) and the I-TASSERmodel (blue). (c) The ensemble of superimposed structure decoys in I-TASSER modeling. Alpha, beta and loop regions areshown in red, yellow and green, respectively. Structure regions with a high variation are highlighted by broken circle. (d) Thepredicted and observed distance errors. (e) The predicted and observed BFPs. The bottom panel shows secondary structureof the protein.
4 Estimation of B-factor and Residue-Specific Quality
Please cite this article as: J. Yang, et al., ResQ: An Approach to Unified Estimation of B-Factor and Residue-Specific Error in ProteinStructure Prediction, J. Mol. Biol. (2015), http://dx.doi.org/10.1016/j.jmb.2015.09.024

5Estimation of B-factor and Residue-Specific Quality
(see Table S1), which were not included in the SMOQprogram. In fact, wehave re-runResQby turningoff theimmediate features from I-TASSER simulations. Theresult of ResQ becomes much worse, which onlymarginally outperforms the best results from SMOQ(see Tables S1 and S4). Although the degradation ispartly due to the fact that ResQ has been trained on thefull set of sequence and structure features, this resultindeed highlights the importance of the intermediatemodeling features in model quality evaluations.The last row in Table S4 lists the result of the
B-factor prediction, where the PCC of ResQ (0.61) is17% higher than that by PROFbval (0.52). Again, thedifference is statistically significant, which corre-sponds to a p value in the student t-test below 10−70.
Comparison of RSQ prediction with other methodson CASP decoys
In this section, we test ResQ for the local structurequality prediction using the decoys that were gener-ated in the recent CASP experiments, which gives usan opportunity to compare ResQ with many state-of-the-art model quality assessment programs(MQAPs). Because the structural decoys weregenerated by different methods from multiple labora-tories, these testing data should also allow examiningthe robustness of the ResQ method, which wasprimarily trained on the I-TASSER decoys. Since theintermediate features from structure assembly simu-lation are not available on the CASP decoys, ResQwill skip these features to generate RSQ predictions.However, other features, including sequence-basedand structured-based database searches, are stillimplemented.The detailed comparisons of ResQ with the top
CASP predictors are listed in Table S5 (for CASP9decoys), Tables S6 and S7 (CASP10) and TablesS8 and S9 (CASP11), with analysis and discussionpresented in Text S4. In general, local distance errorprediction of ResQ consistently outperforms most oftheCASPMQAPpredictors, where the PCCandAUCscores by ResQ are among the top but often slightlyoutperformed by the best predictors (in particular, forAUC). The overall data suggest that the predictionresults of the ResQ are comparable to or better thanthe state-of-the-art MQAP methods in CASP.
Application of ResQ B-factor prediction to molecularreplacement
One of the important uses of the B-factorprediction is for assisting the molecular replacement(MR)-based structure determination in X-ray crystal-lography. In MR, close homologous structure modelsare used to replace the unknown targets for decidingthe phase of the diffraction waves so that the electrondensity of the target protein can be calculated using
Please cite this article as: J. Yang, et al., ResQ: An Approach to UnifStructure Prediction, J. Mol. Biol. (2015), http://dx.doi.org/10.1016/j.
Fourier transformations from the diffraction patterndata. Recently, a closely related study suggests thatlocal error estimates improve MR dramatically [12].Different from the local error estimates that evaluatethe quality of target models, thermal mobility of proteinatoms candirectly the intensity of the reflectionwaves.Therefore, appropriate B-factor estimations, whichroughly reflect the atomic thermal mobility, should beimportant for correct structure factor calculation andMR solution.To test the effect of ResQ B-factor prediction on
MR, we collected 100 non-redundant proteins fromthe PDB, which have both X-ray structure andelectron density data available and with fewer than300 residues and ≤4 copies in the asymmetric unit.The I-TASSER models without using homologoustemplates are then used as the probe for MR. Aprogressive model truncation and editing procedurebased on structural deviation score [13] was appliedto generate up to 40 truncated models for eachtarget, which are submitted to PHENIX [14] forautomated phase determination and model recon-struction. It was shown that correct MR solutionscould be obtained for 54 out of the 100 proteins if weuse an optimal constant B-factor (20). Here, an MRsolution is defined as correct if more than 25% of thetarget sequence can be built by the automated MRprocedure with the final structure models beingcloser to the experimental structure than the startingmodel.When we applied the predicted B-factor by ResQ
to the MR program, three additional proteins (PDBIDs: 1i12, 2ra9 and 2tnf) have the MR solutionsuccessfully obtained. Figure 2 shows a comparisonof the final models for the three proteins overlaid onthe experimental electron density maps, which wereobtained using the ResQ B-factor prediction and theoptimal constant B-factor, respectively. Even thoughthe same I-TASSER model and the model editingprocedure were applied, the use of the ResQ B-factorprediction resulted in much closer fits of the finalmodels with the electron density maps. The averageRfree value, which measures how well the simulateddiffraction data match with the experimentally ob-served diffraction pattern, was significantly reducedfrom 0.53 to 0.27.We note that the current strategy, that is, using
RSQ to truncate structural models and then usingBFP to scale atomic motion, generated the best MRresults with 57 successful targets in our test. Simplyreplacing B-factor by RSQ does not improve theresults, probably due to the fact that the RSQinformation was already used in the model truncationprocedure. We also tested the procedure with usingRSQ as B-factor on the full-length models withouttruncation, which could result in slightly better MRresults than that using constant B-factor; however,the overall results are much worse than the optimalresults with model truncations [13].
ied Estimation of B-Factor and Residue-Specific Error in Proteinjmb.2015.09.024
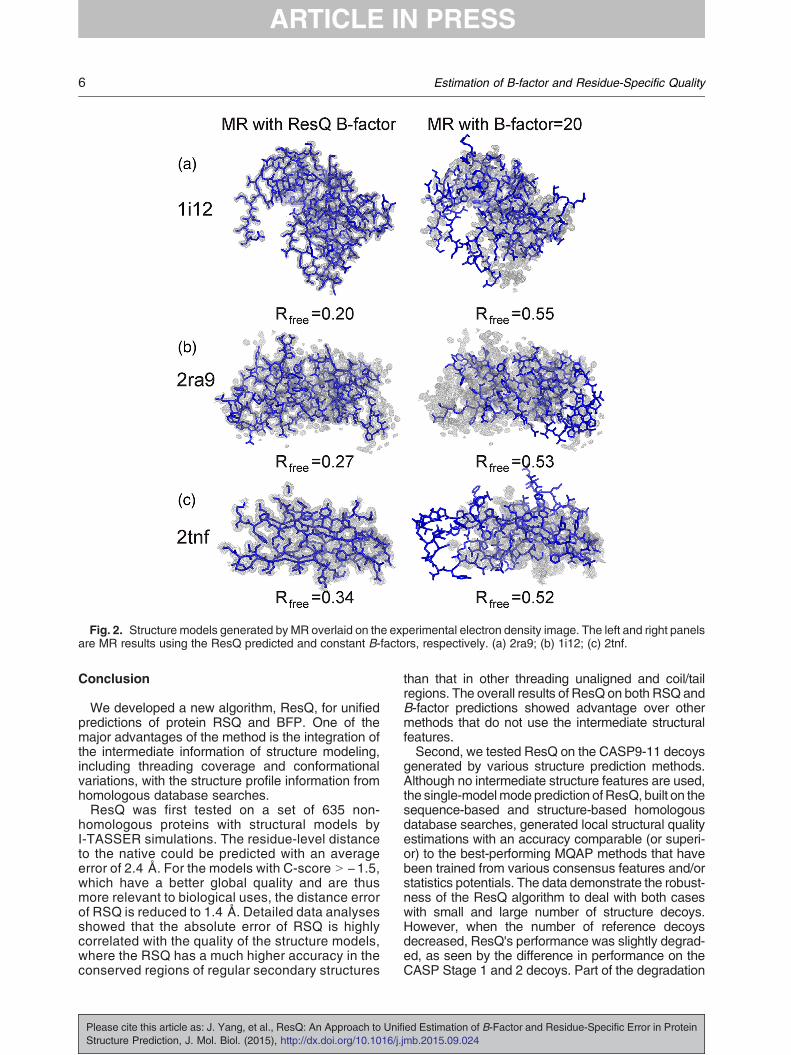
Fig. 2. Structure models generated byMR overlaid on the experimental electron density image. The left and right panelsare MR results using the ResQ predicted and constant B-factors, respectively. (a) 2ra9; (b) 1i12; (c) 2tnf.
6 Estimation of B-factor and Residue-Specific Quality
Conclusion
We developed a new algorithm, ResQ, for unifiedpredictions of protein RSQ and BFP. One of themajor advantages of the method is the integration ofthe intermediate information of structure modeling,including threading coverage and conformationalvariations, with the structure profile information fromhomologous database searches.ResQ was first tested on a set of 635 non-
homologous proteins with structural models byI-TASSER simulations. The residue-level distanceto the native could be predicted with an averageerror of 2.4 Å. For the models with C-score N −1.5,which have a better global quality and are thusmore relevant to biological uses, the distance errorof RSQ is reduced to 1.4 Å. Detailed data analysesshowed that the absolute error of RSQ is highlycorrelated with the quality of the structure models,where the RSQ has a much higher accuracy in theconserved regions of regular secondary structures
Please cite this article as: J. Yang, et al., ResQ: An Approach to UnifStructure Prediction, J. Mol. Biol. (2015), http://dx.doi.org/10.1016/j.
than that in other threading unaligned and coil/tailregions. The overall results of ResQ on both RSQ andB-factor predictions showed advantage over othermethods that do not use the intermediate structuralfeatures.Second, we tested ResQ on the CASP9-11 decoys
generated by various structure prediction methods.Although no intermediate structure features are used,the single-modelmode prediction ofResQ, built on thesequence-based and structure-based homologousdatabase searches, generated local structural qualityestimations with an accuracy comparable (or superi-or) to the best-performing MQAP methods that havebeen trained from various consensus features and/orstatistics potentials. The data demonstrate the robust-ness of the ResQ algorithm to deal with both caseswith small and large number of structure decoys.However, when the number of reference decoysdecreased, ResQ's performance was slightly degrad-ed, as seen by the difference in performance on theCASP Stage 1 and 2 decoys. Part of the degradation
ied Estimation of B-Factor and Residue-Specific Error in Proteinjmb.2015.09.024
7Estimation of B-factor and Residue-Specific Quality
is due to the reduction of the overall decoys in Stage 1;this suggests the room for further improving ResQ, forexample, by exploring multiple statistical potentials[15], in particular, for the low-quality decoys.As a test of the usefulness of the ResQ predictions,
the predicted BFP was applied to 100 medium-size tolarge-size proteins for assisting MR in X-ray crystal-lography. Starting from the same set of the I-TASSERmodels, the use of the ResQ predicted B-factorresulted in successful MR solutions on three proteins(PDB IDs: 1i12, 2ra9 and 2tnf) that were not able tosolve from the constant B-factor setting, whereby theaverage Rfree value was dramatically reduced from0.53 to 0.27 in the three examples.The ResQ algorithm has been successfully inte-
grated with the I-TASSER pipeline, including onlineserver and standalone package, for the RSQandBFPestimations. AlthoughResQwas primarily trainedwiththe I-TASSER decoys, the program can be used formodels generated by other structure predictionmethods since the intermediate features, includingquery-to-template alignment and structure decoyclustering, are standard output in the pipelines ofmost state-of-the-art structure prediction approaches.Asan illustration,we list in TableS10 theapplication ofResQ to the models generated by QUARK-based abinitio simulation [16] on a set of 50 non-redundantproteins. Although the average RSQ error is higherthan that for the I-TASSER models due to therelatively lower accuracy of the global models, forthe top 20 proteins, most having a TM-score above0.5, the average RSQ error is 1.6 Å for the QUARKmodels, comparable to the results for the confidentlypredicted I-TASSER models.
Methods
ResQ method
Support vector regressions, with the implementa-tion provided in the SVM-light package‡, are used totrain the RSQ and BFP data, with parameters andcombinations of features optimized on the 635training proteins. The I-TASSER simulations [17]are conducted to generate structure predictions forthe training proteins, where homologous templateshave been excluded from the threading templatelibrary. A brief outline of the I-TASSER pipeline isdescribed in Text S1 in the supplementary materials.For RSQ prediction, a total of 12 features are used
to represent each residue: 3 from structural assem-bly simulations [i.e., average variation and standarddeviation in Eq. (S1) and relative size of SPICKERcluster], 1 from threading templates distance varia-tion [Eq. (S2)], 1 from TM-align structure alignmenttemplates distance variation, 2 from threadingalignment coverage computed from the top 200 and10 templates, respectively, and5 from the consistencybetween model and sequence-based feature predic-
Please cite this article as: J. Yang, et al., ResQ: An Approach to UnifStructure Prediction, J. Mol. Biol. (2015), http://dx.doi.org/10.1016/j.
tions (i.e., three probabilities in alpha-helix, beta-strand and coil states; one for secondary structurestate; and one for relative solvent accessibility). Adetailed description of the RSQ features and theirrespective contributions to the predictions are provid-ed in Text S2 and Table S1.For the BFP prediction, by using the window size of
9, a total of 72 (8 × 9) features are used to representeach residue. For each residue, the 8 features include2 from template-based assignments based onLOMETS and TM-align, respectively [see Eq. (S3)];1 from alignment coverage with the top 200 LOMETStemplates, 2 from relative solvent accessibility andsecondary structure predictions and 3 from secondarystructure profile including probabilities in alpha-helix,beta-strand and random-coil states (see Text S3).After trials and errors on the training dataset, we
found that the best results are generated using thelinear support vector regressions in SVM-light withthe parameters “−z r −c 0.5 −w 0.5”, for both RSQand BFP predictions.Although ResQ has been designed to generate
both RSQ and BFP prediction, we note that RSQ andBFP are two distinct concepts, as RSQ is closelyrelated with model construction methods whileB-factor reflects inherent motions of atoms in thephysiological environment that are independent fromthe modeling process. In fact, we collected the dataof all the 1270 training and testing proteins and foundthat the PCC between B-factor and the local error ofI-TASSER models is only 0.38§. This weak correla-tion is probably due to the fact that the sequenceregions with a high B-factor are often less conservedand thus models generated by template-basedmethods (such as I-TASSER) tend to have a higherlocal error on these regions. However, a determinaterelation between these two qualities does not exist.Nevertheless, a combined prediction on RSQ andBFP is feasible since both request training on multiplelocal sequence and structure features. Such combi-nation should helpmakeResQconvenient formultipleuses on, for example, local accuracy estimation andMR.
Assessment criteria of the RSQ and BFP predictions
Three measures are used to evaluate the accura-cy of the RSQ prediction, where each measure isfirst computed per model and then presented as anaverage over all models. The first measure is theaverage difference (Δd) between the predicted (dp)and observed (do) distances of the model relative tothe native, that is,
Δd ¼ 1L
XL
i¼1d io−d
ip
������ ð1Þ
where L is the length of the protein and the distancesare calculated based on the TM-score superposition
ied Estimation of B-Factor and Residue-Specific Error in Proteinjmb.2015.09.024
8 Estimation of B-factor and Residue-Specific Quality
[11]. One flaw of this metric is that Δd can bedominated by the large distance pairs, where distin-guishing distance errors beyond some cutoffs can bemeaningless (e.g., an error of 10 Å is not necessarilybetter than20 Å). Thus,wealsouseametric based ona normalized distance to depress the contribution oflarge distance errors in RSQ evaluation, that is,
Δd 0 ¼ 1L
XL
i¼1d 0 i
o−d0 ip
������ ð2Þ
where do,p′ = 1/[1 + (do,p/ds)2] and ds ¼ 1:24
ffiffiffiffiffiffiffiffiffiffiffiL−153
p−
1:8are a TM-score-like scale to rule out protein lengthdependence of the distances [11].The second measure is the PCC between dp and
do. The third measure is the AUC of the receiver-operating characteristic (ROC), designed to evaluatethe ability of ResQ in discriminating between welland badly modeled regions, where a residue isdefined as “well modeled” (positive) if the distancefrom model to the native is b3.8 Å upon theTM-score superposition, otherwise as “badly mod-eled” (negative). PCC and AUC are the same asused by the CASP assessors for evaluating theaccuracy of model quality estimation [18]. FollowingKryshtafovych et al., we converted dp into the rangeof (0, 1) by dpn = 1/[1 + (dp/5)
2] in the AUCcalculation so that a fixed number of divisions canbe used for different data samples to draw the ROCcurves. Here, the selection of 3.8 Å as a cutoff isfrom the CASP assessors, which may be too high inthis study since the AUC values are generally highfor most predictions. We tested the impact of thedistance cutoff on the AUC calculations using 635test proteins. As expected, the AUC value decreasesslightly with reduced distance cutoff, that is, theaverage AUC decreases from 0.88 to 0.87, 0.86,0.84 and 0.79, respectively, when the distance cutoffreduced from 5 to 4, 3, 2 and 1 Å.The BFP prediction is evaluated by the Pearson's
correlation between the predicted and the experi-mental B-factors, which was also used in previousB-factor prediction studies [4]. Similar to the RSQevaluation, we also use AUC for measuring theability in discriminating between stable and flexibleresidues in structures, where a residue is definedas stable (positive) if the normalized B-factor isbelow 0 or as flexible (negative) otherwise. Foruniform ROC division, we have normalized thepredicted B-factor values (b) to the range of (0, 1) by1/[1 + exp(−b)].
Acknowledgements
We are grateful to Baoji He for providing theQUARK models. The project is supported in part by
Please cite this article as: J. Yang, et al., ResQ: An Approach to UnifStructure Prediction, J. Mol. Biol. (2015), http://dx.doi.org/10.1016/j.
the National Institute of General Medical Sciences(GM083107 and GM084222), National NaturalScience Foundation of China (NSFC) Grant(11501306), and Nankai University Start-up Grant(ZB15006103).
Appendix A. Supplementary data
Supplementary data to this article can be foundonline at http://dx.doi.org/10.1016/j.jmb.2015.09.024.
Received 23 June 2015;Received in revised form 23 August 2015;
Accepted 28 September 2015Available online xxxx
Keywords:protein structure prediction;
model quality evaluation;local error estimation;
B-factor profile
†An online server and the source code of the ResQprogram are freely available at http://zhanglab.ccmb.med.
umich.edu/ResQ/.‡http://svmlight.joachims.org/.
§http://zhanglab.ccmb.med.umich.edu/ResQ/benchmark/RB_cc.txt.
Abbreviations used:RSQ, residue-specific quality; BFP, B-factor profile; PCC,
Pearson correlation coefficient; AUC, area under thecurve; MQAP, model quality assessment program; MR,
molecular replacement; ROC, receiver-operatingcharacteristic.
References
[1] J. Moult, A decade of CASP: Progress, bottlenecks andprognosis in protein structure prediction, Curr. Opin. Struct.Biol. 15 (2005) 285–289.
[2] Y. Zhang, Protein structure prediction: When is it useful?Curr. Opin. Struct. Biol. 19 (2009) 145–155.
[3] D. Sherwood, Cooper J. Crystals, X-rays and Proteins:Comprehensive Protein Crystallography, Oxford UniversityPress, Oxford, UK, 2011.
[4] A.Schlessinger,G.Yachdav,B.Rost,PROFbval: Predict flexibleand rigid residues in proteins, Bioinformatics 22 (2006) 891–893.
[5] R. Cao, Z. Wang, Y. Wang, J. Cheng, SMOQ: A tool forpredicting the absolute residue-specific quality of a single proteinmodel with support vectormachines, BMCBioinf. 15 (2014) 120.
[6] B. Wallner, ProQM-resample: Improved model qualityassessment for membrane proteins by limited conformationalsampling, Bioinformatics 30 (2014) 2221–2223.
[7] L.J. McGuffin, M.T. Buenavista, D.B. Roche, The ModFOLD4server for the quality assessment of 3D protein models,Nucleic Acids Res. 41 (2013) W368–W372.
ied Estimation of B-Factor and Residue-Specific Error in Proteinjmb.2015.09.024
9Estimation of B-factor and Residue-Specific Quality
[8] S. Wu, Y. Zhang, LOMETS: A local meta-threading-server forprotein structure prediction, Nucleic Acids Res. 35 (2007)3375–3382.
[9] Y. Zhang, Interplay of I-TASSER and QUARK for template-based and ab initio protein structure prediction in CASP10,Proteins 82 (2014) 175–187.
[10] D. Xu, J. Zhang, A. Roy, Y. Zhang, Automated protein structuremodeling in CASP9 by I-TASSER pipeline combined withQUARK-based ab initio folding and FG-MD-based structurerefinement, Proteins 79 (2011) 147–160.
[11] Y. Zhang, J. Skolnick, Scoring function for automatedassessment of protein structure template quality, Proteins 57(2004) 702–710.
[12] G. Bunkoczi, B. Wallner, R.J. Read, Local error estimatesdramatically improve the utility of homology models for solvingcrystal structures bymolecular replacement, Structure 23 (2015)397–406.
[13] Y.Wang, Z. Xue, J. Virtanen, Y. Zhang, Molecular replacementfor distant-homology proteins using iterative fragment assem-
Please cite this article as: J. Yang, et al., ResQ: An Approach to UnifStructure Prediction, J. Mol. Biol. (2015), http://dx.doi.org/10.1016/j.
bly and progressive sequence truncation, 2015 (submitted forpublication).
[14] P.D. Adams, P.V. Afonine, G. Bunkoczi, V.B. Chen, I.W.Davis,N. Echols, et al., PHENIX: A comprehensive Python-basedsystem formacromolecular structure solution, ActaCrystallogr.Sect. D: Biol. Crystallogr. 66 (2010) 213–221.
[15] P. Benkert, S.C. Tosatto, D. Schomburg, QMEAN: A compre-hensive scoring function for model quality assessment,Proteins 71 (2008) 261–277.
[16] D. Xu, Y. Zhang, Ab initio protein structure assembly usingcontinuous structure fragments and optimized knowledge-based force field, Proteins 80 (2012) 1715–1735.
[17] J. Yang, R. Yan, A. Roy, D. Xu, J. Poisson, Y. Zhang, The I-TASSER Suite: Protein structure and function prediction,Nat. Methods 12 (2015) 7–8.
[18] A. Kryshtafovych, A. Barbato, K. Fidelis, B. Monastyrskyy, T.Schwede, A. Tramontano, Assessment of the assessment:Evaluation of the model quality estimates in CASP10, Proteins82 (2014) 112–126.
ied Estimation of B-Factor and Residue-Specific Error in Proteinjmb.2015.09.024