Embed Size (px)
Citation preview

International Journal of Applied Agricultural Sciences 2016; 2(2): 21-31 http://www.sciencepublishinggroup.com/j/ijaas doi: 10.11648/j.ijaas.20160202.11 ISSN: 2469-7877(Print); ISSN: 2469-7885(Online)
Response of Some Soybean Cultivars to Low Light Intensity under Different Intercropping Patterns with Maize
Tamer Ibrahim Abdel-Wahab1, Rehab Ahmed Abd El-Rahman
2
1Crop Intensification Research Department, Field Crops Research Institute, Agricultural Research Center, Giza, Egypt 2Food Legumes Research Department, Field Crops Research Institute, Agricultural Research Center, Giza, Egypt
Email address:
[email protected] (T. I. Abdel-Wahab)
To cite this article: Tamer Ibrahim Abdel-Wahab, Rehab Ahmed Abd El-Rahman. Response of Some Soybean Cultivars to Low Light Intensity under Different
Intercropping Patterns with Maize. International Journal of Applied Agricultural Sciences. Vol. 2, No. 2, 2016 pp. 21-31.
doi: 10.11648/j.ijaas.20160202.11
Received: February 15, 2016; Accepted: March 11, 2016; Published: April 14, 2016
Abstract: A two-year study was carried out at Mallawi Agricultural Experiments and Research Station, A.R.C., El-Minia
governorate, Egypt, during 2014 and 2015 seasons to determine the compatible soybean cultivar with high maize plant density
to achieve farmer's benefit under intercropping conditions. Alternating ridges (70 cm width) between maize and soybean were
used as 1:3, 2:4, 2:2, 3:3 and 4:2, respectively, in addition to sole culture of both crops. Local maize cultivar T.W.C. 310 was
grown in one plant per hill distanced at 30 cm under intercropping and sole cultures, meanwhile local soybean cultivars (Giza
22, Giza 82 and Giza 111) were drilled in both sides of the ridge (two plants/hill distanced at 15 cm) under intercropping and
sole cultures. A split plot distribution in randomized complete block design with three replications was used. The results
indicated that maize yield attributes were increased significantly by decreasing maize plant density from 67 to 25% of sole
maize under intercropping conditions, meanwhile the converse was true for plant height and grain yield per ha. All the studied
maize traits were not affected by soybean cultivars. Also, all the studied maize traits were not affected the interaction between
intercropping patterns and soybean cultivars. Soybean yield and its attributes were increased significantly by decreasing maize
plant density from 67 to 25% of sole maize under intercropping conditions except plant height. The late-maturing soybean
cultivar Giza 22 recorded the highest values of intercepted light intensity within soybean canopy, number of pods per plant,
seed index, seed yields per plant and per ha, meanwhile, the highest values of biological yield per ha, plant height and number
of branches per plant were recorded for soybean cultivar Giza 111. Soybean cultivar Giza 22 gave the highest seed yield per
plant compared to the other cultivars under all the intercropping patterns. Relative yield of soybean showed that the early-
maturing soybean cultivar Giza 82 is better adapted to low light intensity than the other cultivars. Land equivalent ratio and
area time equivalent ratio values for intercrops were greater than 1.00 indicating less land requirements of intercropping
patterns than sole maize. Growing four maize ridges alternating with two ridges of soybean cultivar Giza 82 achieved the
highest net return compared to sole maize.
Keywords: Intercropping Patterns, Maize, Soybean Cultivars, Low Light Intensity, Net Return
1. Introduction
In Egypt, there is the need to expand the scope of soybean
[Glycine max. (L.) Merr.] cultivation through intercropping
system. Egyptian farmer suffering from increased costs of
soybean production when planted and eventually gets a lower
net returns as compared with the other strategic summer
crops such as maize (Zea mays L.) where demand for the
maize grains in the Egyptian market is intensively increasing.
Maize cultivated area reached about 814435 ha in 2013 with
an average yield of 7.64 ton per ha, meanwhile, the soybean
acreage reached about 9270 ha in 2013 with an average yield
of 3.61 ton per ha [1].
Over the past few decades, increasing attention has been
given to intercropping in Egypt. Several studies have
reported that maize – soybean intercropping is more
productive than the individual sole crops [2, 3, 4, 5 and 6].
In general, maize yield was not affected by the presence of
soybean while soybean yield was reduced specially under

22 Tamer Ibrahim Abdel-Wahab and Rehab Ahmed Abd El-Rahman: Response of Some Soybean Cultivars to Low Light Intensity under Different Intercropping Patterns with Maize
high maize population [7]. Adjusting planting density is an
important tool to optimize crop growth and the time required
for canopy closure, and to achieve maximum biomass and
grain yield [8]. Recently, the practice of intercropping
soybean with maize is common, particularly amongst
smallholder farmers who have to optimize their use of
limited land. Generally, intercropping legumes with cereals is
usually done to maximize productivity in many parts of the
Mediterranean region [9].
However, crop species in intercropping pattern must be
carefully chosen to minimize competition and enhance the
efficient use of water, light and nutrients [10]. Success of
intercropping pattern depends on the ability of the second
crop to become established under the canopy of the first crop
in variable midsummer conditions. Intercropping of
incompatible species can result in one crop completely
suffocating the other; that is adverse effects [11]. It is known
that the light plays an important role in the vegetative
development of soybeans. There are two types of plant
response to light, firstly' the plant responds to the duration of
the light period and this response is cal1ed the photoperiodic
response. Secondly, plants respond to the intensity of the
light source. Seed yield of soybean reduced under the low
light because of reduction in dry matter production [12]. To
obtain the maximum seed yield of intercropped soybean
under shading effects of adjacent maize plants, selection of
suitable soybean cultivar could play an important role for
intercropping system. The cultivars may respond to shading
stress differently in terms of growth and yield. Seed yield of
soybean consists of several components, including the
number of plants per unit area, pods number per plant, seeds
per pod, and seed size [13]. Therefore, the main objective of
the present research was to determine the compatible soybean
cultivar with high maize plant density to achieve farmer's
benefit under intercropping conditions.
2. Material and Methods
A research was carried out at Mallawi Agricultural
Experiments and Research Station, El-Minia governorate
(31°06'42" N, 30°56'45" E, 17 m a.s.l.), Egypt, during 2014
and 2015 seasons. Wheat was the preceding winter crop in
both seasons. The experimental soil texture was clay. Table
(1) shows pedigree, flower color, leaf shape, country of
origin and maturity of the tested soybean cultivars.
Table 1. Pedigree, flower color, leaf shape and country of origin of the three soybean cultivars.
Soybean cultivar Pedigree Flower color Leaf shape Country of origin Maturity
Giza 22 Giza 21 x 186 k – 73 White Heart Egypt Late
Giza 82 Crawford x Maple presto Purple Heart Egypt Early
Giza 111 Crawford x Celeste Purple Heart Egypt Late
Data from Food Legumes Research Department, Field Crops Research Institute, Agricultural Research Center, Egypt.
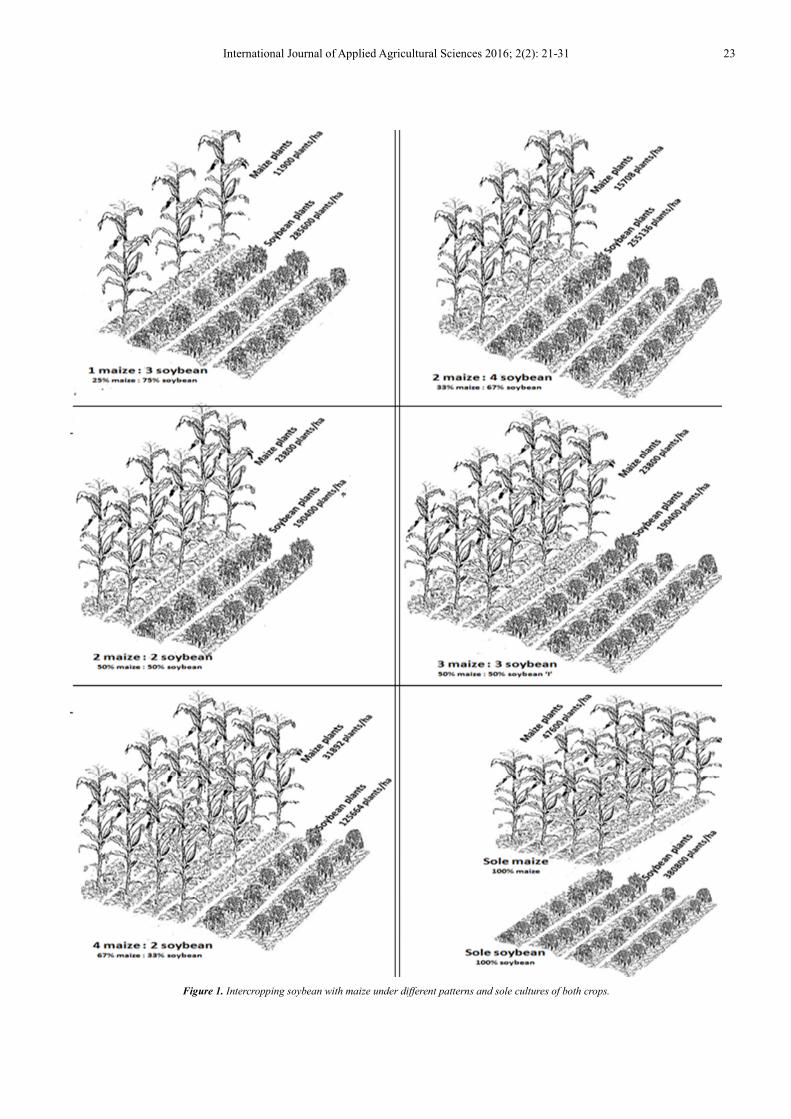
The experiment included fifteen treatments which were the
combination between five intercropping patterns (alternating
ridges; 1 maize : 3 soybean, 2 maize : 4 soybean, 2 maize : 2
soybean, 3 maize : 3 soybean and 4 maize : 2 soybean were
expressed as 25% maize : 75% soybean, 33% maize : 67%
soybean, 50% maize : 50% soybean, 50% maize : 50%
soybean 'I' and 67% maize : 33% soybean, respectively) and
three soybean cultivars (early – maturing cultivar Giza 82
and late – maturing cultivars; Giza 22 and Giza 111). The
treatments were shown in Figure (1) as follows:
1. One maize ridge alternating with another three of
soybean. This pattern resulted in 11900 and 285600
plants of maize and soybean/ha, respectively.
2. Two maize ridges alternating with another four of
soybean. This pattern resulted in 15708 and 255136
plants of maize and soybean/ha, respectively.
3. Two maize ridges alternating with another two of
soybean. This pattern resulted in 23800 and 190400
plants of maize and soybean/ha, respectively.
4. Three maize ridges alternating with another three of
soybean. This pattern resulted in 23800 and 190400
plants of maize and soybean/ha, respectively.
5. Four maize ridges alternating with another two of
soybean. This pattern resulted in 31892 and 125664
plants of maize and soybean/ha, respectively.
Maize was grown in one row/ridge by leaving one
plant/hill spaced at 30 cm, meanwhile soybean seeds were
drilled in two rows/ridge and thinned to two plants /hill
spaced at 15 cm), in addition to:
1. Sole maize: pure stand of maize ridges by growing
one plant/hill spaced at 30 cm (recommended pattern).
This pattern resulted in 47600 maize plants/ha.
2. Sole soybean: pure stand of soybean ridges by
drilling soybean seeds in two rows/ridge and soybean
was thinned to two plants/hill spaced at 15 cm
(recommended pattern). This pattern resulted in
380800 plants of soybean/ha.
Calcium super phosphate (15.5% P2O5) at rate of 357
kg/ha and potassium sulfate (48.0% K2O) at rate of 119 kg/ha
were applied during soil preparation for planting maize and
soybean in the two summer seasons. Mineral N fertilizer of
maize was applied at rate of 285.6 divided into two equal
doses at 15 and 30 days from maize sowing.
Water was supplied by furrow irrigation. Seeds of soybean
were inoculated with Bradyrhizobium japonicum and Arabic
gum was used as a sticking agent. Soybean seeds were sown
on May 13th and 9th in 2014 and 2015 seasons,
International Journal of Applied Agricultural Sciences 2016; 2(2): 21-31 23
Figure 1. Intercropping soybean with maize under different patterns and sole cultures of both crops.
24 Tamer Ibrahim Abdel-Wahab and Rehab Ahmed Abd El-Rahman: Response of Some Soybean Cultivars to Low Light Intensity under Different Intercropping Patterns with Maize
respectively, meanwhile maize grains were sown on May 19th
and 15th in 2014 and 2015 seasons, respectively. Soybean
cultivar Giza 82 was harvested on August 18th and 14th in
2014 and 2015 seasons, respectively, meanwhile soybean
cultivars Giza 22 and Giza 111 were harvested on September
15th and 10th in 2014 and 2015 seasons, respectively. Maize
plants were harvested on September 18th and 15th in 2014 and
2015 seasons, respectively. The treatments were laid out in
split plot design with three replications. Intercropping
patterns were randomly assigned to the main plots and
soybean cultivars were devoted to sub plots. The area of sub
plot was 25.2 m2, each sub plot consisted of 12 ridges and
each ridge was 3.0 m in length and 0.7 m in width.
2.1. The Studied Traits
2.1.1. Maize Traits
The following traits were measured on ten guarded plants
from each sub plot at harvest; plant height (cm) and, stem
diameter (cm), number of ears/plant, ear length (cm), ear
diameter (cm), ear weight (g) and grain yield per plant (g).
Grain yield/ha (ton) was recorded on the basis of
experimental plot area by harvesting all plants of each sub
plot.
2.1.2. Soybean Traits
Light intensity (lux) inside soybean canopy at middle and
bottom of the plant was recorded by Lux-meter apparatus at
mid – day on five plants from each sub plot at 75 days from
soybean sowing and expressed as percentage from full
sunlight intensity (100%) measured above the plants. The
following traits were measured on ten guarded soybean
plants from each sub plot at harvest; plant height (cm),
numbers of branches and pods per plant, seed index (g) and
seed yield/plant (g). Biological and seed yields/ha (ton) were
recorded on the basis of experimental sub plot area by
harvesting all plants of each sub plot.
2.1.3. Competitive Relationships
2.1.3.1. Land Equivalent Ratio (LER)
LER defines as the ratio of area needed under sole
cropping to one of intercropping at the same management
level to produce an equivalent yield [15]. It is calculated as
follows: LER = (Yab / Yaa) + (Yba / Ybb), where Yaa = Pure
stand yield of crop a (maize), Ybb = Pure stand yield of crop b
(soybean), Yab = Intercrop yield of crop a (maize) and Yba =
Intercrop yield of crop b (soybean).
2.1.3.2. Area Time Equivalent Ratio (ATER)
Area time equivalent ratio provides more realistic
comparison of the yield advantage of intercropping over
monocropping in terms of time taken by component crops in
the intercropping systems. ATER was calculated by formula:
ATER = LER x Dc / Dt [16], Where LER is land equivalent
ratio of crop, Dc is time taken by crop, Dt is time taken by
whole system.
2.1.4. Farmer's Benefit
It was calculated by determining the total costs and net
return of intercropping culture as compared to recommended
sole culture of maize
1) Total return of intercropping cultures = Price of maize
yield + price of soybean yield (US$). To calculate the
total return, the average of maize and soybean prices
presented by Bulletin of Statistical Cost Production and
Net Return [1] was used.
2) Net return per ha = Total return – (fixed costs of maize
+ variable costs of soybean according to intercropping
pattern).
2.2. Statistical Manipulation
Analysis of variance of the obtained results of each season
was performed. The homogeneity test was conducted of error
mean squares and accordingly, the combined analysis of the
two experimental seasons was carried out. The measured
variables were analyzed by ANOVA using MSTATC
statistical package [17]. Mean comparisons were done using
least significant differences (L.S.D) method at 5 % level of
probability to compare differences between the means [18].
3. Results and Discussion
3.1. Maize Traits
3.1.1. Intercropping Patterns
Plant height, stem diameter, number of ears/plant, ear length,
ear diameter, ear weight, grain yields per plant and per ha were
affected significantly by intercropping patterns in the
combined data across 2014 and 2015 seasons (Table 2).
Intercropping pattern 67% maize : 33% soybean had the
highest values (P ≤ 0.05) of plant height and grain yield per ha,
meanwhile intercropping pattern 25% maize : 75% soybean
produced the shortest plant with the highest values of stem
diameter, number of ears/plants, ear length, ear diameter, ear
weight and grain yield per plant as compared with the other
intercropping patterns. These data may be due to maize plants
of intercropping pattern 67% maize : 33% soybean suffered
from mutual shading than those of the other intercropping
patterns. Mutual shading is known to increase the proportion
of invisible radiation, which has a specific elongating effect
upon plants [18]. Consequently, there was more shading inside
maize plants of intercropping pattern 67% maize : 33%
soybean which formed more amounts of plant hormones and
resulted in an increase of inter node elongation of maize plant
that reflected negatively on stem diameter. The increased
maize plant height of intercropping pattern 67% maize : 33%
soybean was due to thick plant stand compared to the other
patterns. Stem diameter is strongly influenced by
environmental conditions during stem elongation [19]. Also,
the results show that the ear length and diameter decreased
with increase in maize plant density per unit area, probably due
to variable plant competition. However, it is expected that all
International Journal of Applied Agricultural Sciences 2016; 2(2): 21-31 25
leaves of maize plants are not light saturated even at high
maize plant density within intercropping pattern. Therefore,
maize plant had high ability for acclimation by increasing
number of maize plants per unit area to reach 67% of pure
stand which contributed mainly in increase in grain yield/ha.
These results are in accordance with those obtained by
Konuskan [20] and Mobaser et al. [21] who reported that stem
diameter were lower in higher plant densities as a consequence
of inter plant competition.
3.1.2. Soybean Cultivars
Plant height, stem diameter, number of ears/plant, ear
length, ear diameter, ear weight, grain yields per plant and
per ha were not affected by soybean cultivars in the
combined data across 2014 and 2015 seasons (Table 2).
These data may be primarily attributed to the ability of maize
plant to be grown successfully during growth and
development. Consequently, all the investigated soybean
cultivars exerted the same kind of depressant effects (P>
0.05) on maize plant under intercropping culture. Only a
small fraction of the genetic diversity available is currently
used in soybean breeding worldwide, especially the genetic
base of soybean in the U.S. and Canada is narrow [22].
Therefore, genetic variation of the Egyptian soybean
cultivars does not have sufficient capacity to influence the
growth and development of intercropped maize plant.
Accordingly, yielding ability of maize plant was not affected
by the soybean cultivars. These results are in harmony with
those obtained by Metwally et al. [23] and Abdel-Galil et al.
[24] who revealed that there was vegetative vigour of maize
plants more than soybean cultivars.
Table 2. Effect of intercropping patterns, soybean varieties and their interaction on maize grain yield and its attributes, combined data across 2014 and 2015
seasons.
Treatments Plant height (cm) Stem diameter (cm) Ears/plant (no.) Ear length (cm)
G.22 G.82 G.111 Mean G.22 G.82 G.111 Mean G.22 G.82 G.111 Mean G.22 G.82 G.111 Mean
25% maize:75% soybean 223.33 225.66 225.32 224.77 2.46 2.42 2.43 2.43 1.18 1.15 1.18 1.17 21.56 21.53 21.57 21.55
33% maize:67% soybean 232.33 233.00 233.67 233.00 2.35 2.30 2.31 2.32 1.12 1.10 1.10 1.10 21.24 21.22 21.19 21.21
50% maize:50% soybean 249.66 247.00 248.91 248.52 2.14 2.10 2.11 2.11 1.09 1.09 1.10 1.09 20.50 20.44 20.42 20.45
50% maize:50% soybean 'I' 254.00 252.33 252.52 252.95 2.06 2.05 2.08 2.06 1.05 1.06 1.05 1.05 20.15 20.05 20.09 20.09
67% maize:33% soybean 268.66 267.00 269.02 268.22 1.83 1.80 1.83 1.82 1.01 1.01 1.01 1.00 19.91 19.87 19.92 19.90
Mean 245.59 244.99 245.88 245.48 2.16 2.13 2.15 2.14 1.08 1.07 1.08 1.07 20.67 20.62 20.63 20.64
L.S.D. 0.05 Intercropping patterns 8.17 0.33 0.16 0.72
L.S.D. 0.05 Soybean cultivars N.S. N.S. N.S. N.S.
L.S.D. 0.05 Interaction N.S. N.S. N.S. N.S.
Sole maize 272.33 1.75 1.01 19.85
Table 2. Continued.
Treatments Ear diameter (cm) Ear weight (g) Grain yield/plant (g) Grain yield/ha (ton)
G.22 G.82 G.111 Mean G.22 G.82 G.111 Mean G.22 G.82 G.111 Mean G.22 G.82 G.111 Mean
25% maize:75% soybean 5.33 5.24 5.32 5.29 273.66 275.23 273.42 274.10 216.38 220.54 219.69 218.87 2.53 2.52 2.53 2.52
33% maize:67% soybean 5.10 5.05 5.06 5.07 271.49 273.33 272.01 272.27 208.61 216.77 214.13 213.17 3.26 3.30 3.29 3.28
50% maize:50% soybean 4.88 4.80 4.89 4.85 230.18 228.17 228.83 229.06 196.56 195.01 196.24 195.93 4.62 4.61 4.55 4.59
50% maize:50% soybean 'I' 4.60 4.56 4.56 4.57 205.46 207.06 207.49 206.67 195.20 196.84 195.46 195.83 4.56 4.63 4.49 4.56
67% maize:33% soybean 4.50 4.45 4.51 4.48 185.14 182.78 184.32 184.08 184.43 181.03 183.30 182.92 5.64 5.73 5.60 5.65
Mean 4.88 4.82 4.86 4.85 233.18 233.31 233.21 233.23 200.23 202.03 201.76 201.34 4.12 4.15 4.09 4.12
L.S.D. 0.05 Intercropping patterns 0.36 86.99 32.43 1.73
L.S.D. 0.05 Soybean cultivars N.S. N.S. N.S. N.S.
L.S.D. 0.05 Interaction N.S. N.S. N.S. N.S.
Sole maize 4.39 150.34 148.40 7.01
3.1.3. Response of Intercropping Patterns to Soybean
Cultivars
Plant height, stem diameter, number of ears/plant, ear
length, ear diameter, ear weight, grain yields per plant and
per ha were not affected by interaction between intercropping
patterns and soybean cultivars in the combined data across
2014 and 2015 seasons (Table 2). These data show that each
of these two factors act independently on all the studied traits
of maize plant meaning that soybean cultivars responded
similarly (P> 0.05) to intercropping patterns for the studied
maize traits. These results are confirmed with those obtained
by Metwally et al. [23] and Abdel-Galil et al. [24] who found
that maize traits were not affected by cropping systems x

26 Tamer Ibrahim Abdel-Wahab and Rehab Ahmed Abd El-Rahman: Response of Some Soybean Cultivars to Low Light Intensity under Different Intercropping Patterns with Maize
soybean cultivars.
3.2. Soybean Traits
3.2.1. Intercropping Patterns
Intercepted light intensity within soybean canopy,
biological yield per ha, plant height, numbers of branches
and pods per plant, seed index, seed yields per plant and per
ha were affected significantly by intercropping patterns in the
combined data across 2014 and 2015 seasons (Table 3).
Soybean plants of intercropping pattern 25% maize : 75%
soybean had the highest values (P ≤ 0.05) of intercepted light
intensity within soybean canopy, number of branches and
pods per plant, seed index, seed yields per plant and per ha as
compared to those of the other intercropping patterns.
Conversely, soybean plants of intercropping pattern 25%
maize : 75% soybean gave the shortest soybean plant as
compared to those of the other intercropping patterns. This
pattern could be decreased internode elongation of soybean
plant as a result of decreasing plant hormones. There were
differential responses achieved increases in light interception
indirectly by decreasing plant density of the cereal
component, thereby modifying light intensity intercepted by
the canopy of the legume component under intercropping
conditions. Clearly, percentage of light intensity at middle
and bottom of soybean canopy was decreased gradually by
increasing maize plant density from 25 to 67% of sole maize.
Table 3. Effect of intercropping patterns, soybean cultivars and their interaction on soybean seed yield and its attributes, combined data across 2014 and 2015
seasons.
Treatments
Percentage of light intensity (lux) at Biological yield/ha (ton)
Middle of the canopy Bottom of the canopy
G.22 G.82 G.111 Mean G.22 G.82 G.111 Mean G.22 G.82 G.111 Mean
25% maize:75% soybean 9.94 9.82 9.38 9.71 5.28 5.17 4.91 5.12 10.54 10.35 11.06 10.65
33% maize:67% soybean 9.77 9.68 9.20 9.55 5.13 5.01 4.78 4.97 9.48 9.24 9.35 9.35
50% maize:50% soybean 9.24 9.10 8.83 9.05 4.69 4.60 4.16 4.48 7.21 7.17 7.64 7.34
50% maize:50% soybean 'I' 9.16 9.03 8.78 8.99 4.61 4.47 4.09 4.39 6.83 6.58 7.54 6.98
67% maize:33% soybean 8.62 8.54 8.11 8.42 4.37 4.25 3.92 4.18 4.72 4.58 5.26 4.85
Average of soybean cultivars 9.34 9.23 8.86 9.14 4.81 4.70 4.37 4.62 7.75 7.58 8.17 7.83
L.S.D. 0.05 Cropping systems 0.87 0.41 0.43
L.S.D. 0.05 Soybean cultivars 0.44 0.27 0.32
L.S.D. 0.05 Interaction 1.16 0.46 0.54
Sole soybean 10.71 10.63 10.26 10.53 5.52 5.43 5.18 5.37 13.92 13.73 14.00 13.88
Treatments Plant height (cm) Branches/plant (no.) Pods/plant (no.)
G.22 G.82 G.111 Mean G.22 G.82 G.111 Mean G.22 G.82 G.111 Mean
25% maize:75% soybean 93.47 89.80 99.17 94.14 3.42 3.22 3.83 3.49 37.94 35.21 36.04 36.39
33% maize:67% soybean 94.58 90.62 101.02 95.40 3.18 3.01 3.67 3.28 37.64 34.72 35.56 35.97
50% maize:50% soybean 97.15 92.68 104.53 98.12 2.91 2.77 3.58 3.08 37.22 34.11 35.41 35.58
50% maize:50% soybean 'I' 97.65 92.82 105.11 98.52 2.91 2.72 3.49 3.04 37.07 34.01 35.32 35.46
67% maize:33% soybean 103.71 96.33 111.29 103.77 2.68 2.44 3.11 2.74 36.77 33.83 35.02 35.20
Average of soybean cultivars 97.31 92.45 104.22 97.99 3.02 2.83 3.53 3.12 37.32 34.37 35.47 35.72
L.S.D. 0.05 Cropping systems 0.87 0.41 0.33
L.S.D. 0.05 Soybean cultivars 0.44 0.27 0.24
L.S.D. 0.05 Interaction 1.16 0.46 0.38
Sole soybean 90.02 85.30 97.44 90.92 3.46 3.30 3.92 3.56 38.18 35.54 36.85 35.85
Treatments Seed index (g) Seed yield/plant (g) Seed yield/ha (ton)
G.22 G.82 G.111 Mean G.22 G.82 G.111 Mean G.22 G.82 G.111 Mean
25% maize:75% soybean 12.99 12.63 11.16 12.26 8.61 8.29 7.72 8.20 2.55 2.36 2.29 2.40
33% maize:67% soybean 12.62 12.39 10.74 11.91 8.35 8.01 7.55 7.97 2.19 2.01 1.94 2.04
50% maize:50% soybean 12.19 11.88 10.21 11.42 8.12 7.78 7.39 7.76 1.58 1.54 1.35 1.49
50% maize:50% soybean 'I' 11.74 11.31 10.03 11.02 8.01 7.62 7.35 7.66 1.48 1.49 1.31 1.42
67% maize:33% soybean 11.29 9.96 9.77 10.34 7.87 7.48 7.28 7.54 0.98 1.04 0.87 0.96
Average of soybean cultivars 12.16 11.63 10.40 11.39 8.19 7.83 7.45 7.82 1.75 1.68 1.55 1.66
L.S.D. 0.05 Cropping systems 0.34 0.16 0.12
L.S.D. 0.05 Soybean cultivars 0.25 0.13 0.07
L.S.D. 0.05 Interaction 0.41 0.18 0.18
Sole soybean 13.11 12.82 11.36 12.43 8.70 8.42 7.92 8.34 3.30 3.22 3.01 3.17
Accordingly, shading effects of intercropping pattern 67%
maize : 33% soybean formed unfavorable conditions for
soybean plant during the early stages of soybean growth and
development, consequently more amounts of plant hormones.
Moreover, as the soybean plant becomes taller, self-shading
is enhanced and there may be an exceedingly steep light
gradient between the top and bottom of the plant [25]. These
results were reported by Undie et al. [26] who revealed that
soybean plant height was increased above its sole crop height
at all intercrop arrangements.
It is important to note that increasing maize plant density
from 25 to 67% of sole maize increased shading intensity
around soybean plants and consequently little dry matter
accumulation of soybean plant. Obviously, pod number per
plant as the yield component was most influenced by change
in cultural and environmental conditions [27]. It is known
that light enrichment and shading imposed during early
flowering stage would change assimilates availability to the
International Journal of Applied Agricultural Sciences 2016; 2(2): 21-31 27
developing reproductive structures, influence flowering, and
flower and pod abscission number with a resultant change in
final pod number at harvest [13].
These results are in the same context of those obtained by
Egbe [28] who showed that intercropped soybean produced
lower seed yield than their sole crop counterparts. Also,
Metwally et al. [29] showed that soybean solid plantings had
the highest weight of 100 seeds, seed yields per plant and per
ha as compared to those grown with maize under
intercropping cultures. Moreover, Ijoyah et al. [30] showed
that intercropping soybean with maize reduced (P ≤ 0.05)
soybean yield by 43.8 and 55.6% in 2011 and 2012,
respectively.
3.2.2. Soybean Cultivars
Soybean cultivars differed significantly for intercepted
light intensity with soybean canopy, biological yield per ha,
plant height, numbers of branches and pods/plant, seed index,
seed yields per plant and per ha in the combined data across
2014 and 2015 seasons (Table 3). The late maturing soybean
cultivar Giza 22 recorded the highest values (P ≤ 0.05) of
intercepted light intensity within soybean canopy, number of
branches/plant, number of pods/plant, seed index, seed yields
per plant and per ha compared to the other soybean cultivars.
Soybean cultivar Giza 22 or Giza 82 intercepted more light
intensity at middle and bottom of the canopy than Giza 111
cultivar. Middle of soybean cultivars Giza 22 and Giza 82
canopies received 9.34 and 9.23 % of full sunlight,
respectively. Also, Giza 22 and Giza 82 intercepted 4.81 and
4.70 % of full sunlight, respectively, at bottom of the plant.
Obviously, the penetration of solar radiation to either the
canopy of Giza 22 or Giza 82 cultivar was better than the
other cultivar. However, soybean cultivar Giza 111
produced the highest biological yield per ha, plant height and
number of branches per plant compared with the others.
Also, soybean cultivar Giza 111 gave the maximum plant
height and number of branches per plant (104.22 cm and 3.53)
followed by Giza 22 (97.31 cm and 3.02) then Giza 82 (92.45
cm and 2.83), respectively. This result could be due to the
longer vegetative growth period of the late maturity cultivars
(Table 1). The two late soybean cultivars (Giza 22 and Giza
111) had greater growth and yield performance than the early
Giza 82 cultivar because the late cultivars were able to utilize
the environmental resources more than the early cultivar.
However, soybean cultivar Giza 22 produced the highest
number of pods/plant, seed index, seed yield per plant and
per ha compared to the others. These results may be due to
canopy structure of soybean cultivar Giza 22 had narrow
leaves [29] that permitted more solar radiation to the other
leaves of the plant and increased accumulation of dry matter
in different organs of the plant which reflected on seed yield
per plant as compared with the others. On the other hand,
canopy structure of soybean cultivar Giza 111 had broad
leaves [29] that decreased light penetration into the canopy
and hence seed index and seed yield of this cultivar was not
improved under the low light intensity condition as compared
with the others. So, it may be possible that morphological
traits of Giza 111 increased self-shading intensity compared
with the others. Moreover, the difference in number of pods
per plant can be attributed to differences in genetic makeup
of the cultivars [31]. Obviously, soybean cultivar Giza 22 had
high ability to overcome the severe conditions of
intercropping culture as compared with the other cultivars
[32].
Similar results were observed by Abd El-Mohsen et al. [31]
who investigated that the lowest of number of branches and
pods per plant was achieved in Giza 82 compared to the
others. Also, Abdel-Galil et al. [32] indicated that Giza 111
had the lowest values of seed index and seed yields per plant
and per ha.
3.2.3. Response of Intercropping Patterns to Soybean
Cultivars
Intercepted light intensity within soybean canopy,
biological yield per ha, plant height, numbers of branches
and pods per plant, seed index, seed yields per plant and per
ha were affected significantly by intercropping patterns x
soybean cultivars in the combined data across 2014 and 2015
seasons (Table 3). Soybean cultivar Giza 22 of intercropping
pattern 25% maize : 75% soybean recorded the highest
values of intercepted light intensity within soybean canopy,
number of pods per plant, seed index, seed yields per plant
and per ha, meanwhile, soybean cultivar Giza 111 of the
same pattern gave the highest values of biological yield per
ha, plant height and number of branches per plant. Moreover,
soybean cultivar Giza 82 ranked second cultivar with
intercropping pattern 25% maize : 75% soybean for
intercepted light intensity within soybean canopy, number of
pods per plant, seed index, seed yields per plant and per ha.
These results may be due to intercropping pattern 25%
maize : 75% soybean interacted positively with canopy
structure of soybean cultivar Giza 22 which permit more
solar radiation to the other leaves of this cultivar compared to
the other treatments. These data reveal that there was
significant effect (P ≤ 0.05) of the interaction between
intercropping patterns and soybean cultivars on the studied
soybean traits.
3.3. Competitive Relationships
3.3.1. Land Equivalent Ratio (LER)
The values of LER were estimated by using data of
recommended solid cultures of both crops. Intercropping
maize with soybean increased LER as compared to sole
cultures of both crops in the combined data across 2014 and
2015 seasons (Figure 2). It ranged from 1.07 (by
intercropping 67% of maize plants with 33% of soybean
cultivar Giza 111) to 1.13 (by intercropping 25% of maize
plants with 75% of soybean cultivar Giza 22 or by
intercropping 67% of maize plants with 33% of soybean
cultivar Giza 82) with an average of 1.09. LER was affected
significantly by intercropping patterns in the combined data
across 2014 and 2015 seasons. The advantage of the highest
LER by intercropping soybean with maize over sole cultures
could be due to minimize intra – specific competition

28 Tamer Ibrahim Abdel-Wahab and Rehab Ahmed Abd El-Rahman: Response of Some Soybean Cultivars to Low Light Intensity under Different Intercropping Patterns with Maize
between the two species for basic growth resources.
Obviously, increasing maize plant density per unit area
increased relative yield of maize and decreased relative yield
of soybean. Consequently, LER depended on intercropping
pattern. These results are in accordance with those obtained
by Hayder et al. [33] who reported that the total relative yield
of corn and soybean was greater in intercropping than
monoculture. Also, Abdel-Galil et al. [32] found that
intercropping culture increased LER as compared to sole
cultures of both crops.
LER was affected significantly by soybean cultivars in the
combined data across 2014 and 2015 seasons (Figure 2).
Soybean cultivars Giza 22 and Giza 82 gave the highest LER,
meanwhile the lowest LER was obtained by soybean cultivar
Giza 111. It seems that relative yield of maize was constant
under all the studied soybean cultivars. Accordingly, the
fundamental reason to change the values of LER was relative
yield of soybean cultivars. Clearly, the late-maturing cultivar
Giza 22 had narrow leaves that increased intercepted light
intensity during growth and development which reflected
positively seed yield per plant. On the other hands, the early-
maturing cultivar Giza 82 was the shortest cultivar (Table 3)
and completed its life cycle quickly. It worthy to mention that
the late-maturing cultivar Giza 111 was the tallest cultivar
(Table 3) with broad leaves that enhanced self-shading and
consequently little dry matter accumulation which reflected
negatively on the economic yield. These differences among
the three cultivars were attributed to the fact that the cultivars
were developed for growth in different climates. The late-
maturing cultivar Giza 22 or Giza 111 was developed for a
warmer climate than the early-maturing cultivar Giza 82 and
consequently shows an adaptation for low shading intensity.
Figure 2. Relative yields of maize and soybean and land equivalent ratio (LER) as affected by intercropping patterns, soybean cultivars and their interaction,
combined data across 2014 and 2015 seasons.
LER was affected negatively by the interaction between
intercropping patterns and soybean cultivars in the combined
data across 2014 and 2015 seasons (Figure 2). Relative yields
of soybean cultivars Giza 22 and Giza 111 were increased by
increasing number of soybean plants per unit area from 50 to
75% of sole culture with decreasing maize plant density from
50 to 25% of sole culture. Conversely, relative yield of
soybean cultivar Giza 82 was increased by increasing number
of maize plants per unit area from 50 to 67% of sole culture
with decreasing soybean plant density from 50 to 33% of sole
culture. These results show that the relative yields of three
soybean cultivars could be related more to number of maize
plants per unit area under intercropping conditions. Relative
yield of soybean cultivar Giza 22 or Giza 111 was higher
than the other cultivar under intercropping condition.
Soybean cultivar Giza 82 seems to be better adapted to
increase in number of maize plants per unit area compared to
the other cultivars (Figure 2). Seed yield reduction in Giza 82
cultivar due to shading effects of maize plants was lower than
that of other cultivars. Therefore, it is likely that soybean
cultivar Giza 82 was more adapted to low light intensity
compared to the others under intercropping conditions. These
results may be due to soybean cultivar Giza 82 had self
regulation mechanism of redistributing the available
assimilates to components, in an attempt to maintain or
improve yield under low light intensity. One of these
mechanisms of soybean cultivar Giza 82 was cross
pollination of soybean cultivar Crawford and soybean
cultivar Maple Presto (Table 1). It is known that soybean
cultivar Maple Presto was intended to provide an
agronomically suitable cultivar for production in areas of
Canada with short and cool growing seasons [34].
The other mechanism of soybean cultivar Giza 82 was due
to this cultivar was earlier matured than Giza 22 or Giza 111
cultivar. In this concern, Gourdon and Planchon [35] showed
that Maple Presto cultivar has a shorter vegetative growth
phase and a substantially shorter reproductive phase, shading
on seeds yield per area depends on duration of shading [36].
International Journal of Applied Agricultural Sciences 2016; 2(2): 21-31 29
This implies that single plant nutrient area of three soybean
cultivars is different and is also helpful for making decision
on optimum density of both crops under intercropping culture.
These results are in parallel with those obtained by Metwally
et al. [37] who indicated that good yielding ability of
soybean cultivar Giza 82 under intercropping culture may be
due to least effect of intercropping on individual plant
characters. They added that soybean cultivar Giza 82 may be
more adapted to low light intensity.
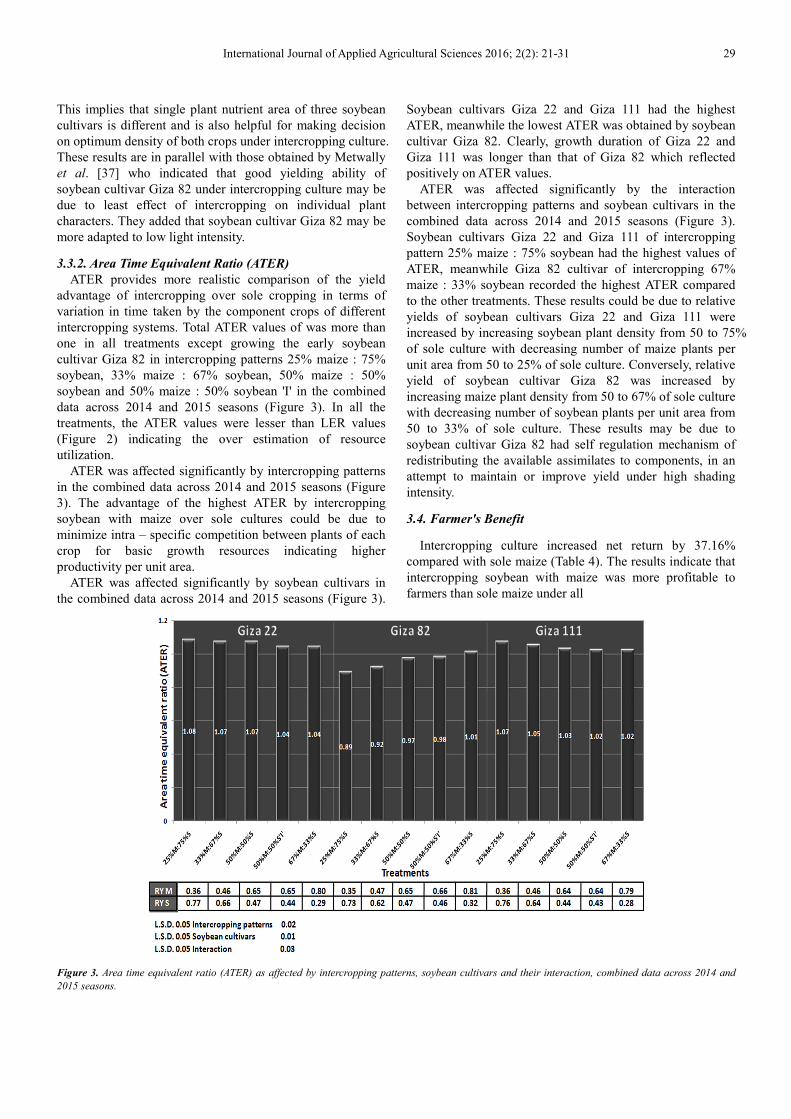
3.3.2. Area Time Equivalent Ratio (ATER)
ATER provides more realistic comparison of the yield
advantage of intercropping over sole cropping in terms of
variation in time taken by the component crops of different
intercropping systems. Total ATER values of was more than
one in all treatments except growing the early soybean
cultivar Giza 82 in intercropping patterns 25% maize : 75%
soybean, 33% maize : 67% soybean, 50% maize : 50%
soybean and 50% maize : 50% soybean 'I' in the combined
data across 2014 and 2015 seasons (Figure 3). In all the
treatments, the ATER values were lesser than LER values
(Figure 2) indicating the over estimation of resource
utilization.
ATER was affected significantly by intercropping patterns
in the combined data across 2014 and 2015 seasons (Figure
3). The advantage of the highest ATER by intercropping
soybean with maize over sole cultures could be due to
minimize intra – specific competition between plants of each
crop for basic growth resources indicating higher
productivity per unit area.
ATER was affected significantly by soybean cultivars in
the combined data across 2014 and 2015 seasons (Figure 3).
Soybean cultivars Giza 22 and Giza 111 had the highest
ATER, meanwhile the lowest ATER was obtained by soybean
cultivar Giza 82. Clearly, growth duration of Giza 22 and
Giza 111 was longer than that of Giza 82 which reflected
positively on ATER values.
ATER was affected significantly by the interaction
between intercropping patterns and soybean cultivars in the
combined data across 2014 and 2015 seasons (Figure 3).
Soybean cultivars Giza 22 and Giza 111 of intercropping
pattern 25% maize : 75% soybean had the highest values of
ATER, meanwhile Giza 82 cultivar of intercropping 67%
maize : 33% soybean recorded the highest ATER compared
to the other treatments. These results could be due to relative
yields of soybean cultivars Giza 22 and Giza 111 were
increased by increasing soybean plant density from 50 to 75%
of sole culture with decreasing number of maize plants per
unit area from 50 to 25% of sole culture. Conversely, relative
yield of soybean cultivar Giza 82 was increased by
increasing maize plant density from 50 to 67% of sole culture
with decreasing number of soybean plants per unit area from
50 to 33% of sole culture. These results may be due to
soybean cultivar Giza 82 had self regulation mechanism of
redistributing the available assimilates to components, in an
attempt to maintain or improve yield under high shading
intensity.
3.4. Farmer's Benefit
Intercropping culture increased net return by 37.16%
compared with sole maize (Table 4). The results indicate that
intercropping soybean with maize was more profitable to
farmers than sole maize under all
Figure 3. Area time equivalent ratio (ATER) as affected by intercropping patterns, soybean cultivars and their interaction, combined data across 2014 and
2015 seasons.

30 Tamer Ibrahim Abdel-Wahab and Rehab Ahmed Abd El-Rahman: Response of Some Soybean Cultivars to Low Light Intensity under Different Intercropping Patterns with Maize
intercropping patterns. Net return of intercropping soybean
with maize was varied between treatments from US$ 655 to
858 per ha compared with sole maize (US$ 557 per ha).
Soybean cultivar Giza 22 of intercropping patterns 50% maize :
50% soybean had the highest net return (US$ 858 per ha)
followed by soybean cultivar Giza 82 of intercropping pattern
4 maize : 2 soybean (US$ 847 per ha). These findings are
parallel with those obtained by Metwally et al. [23], Abdel-
Galil et al. [32] and Lamlom et al. [38] who reported that
intercropping system gave higher net return over sole maize.
Table 4. Total and net returns as affected by intercropping patterns, soybean cultivars and their interaction, combined data across 2014 and 2015 seasons.
Treatments Soybean Maize Total Net
G.22 G.82 G.111 Mean G.22 G.82 G.111 Mean G.22 G.82 G.111 Mean G.22 G.82 G.111 Mean
25% maize:75% soybean 1532 1418 1376 1442 782 778 782 780 2314 2196 2158 2222 841 723 685 749
33% maize:67% soybean 1316 1208 1165 1229 1007 1020 1016 1014 2323 2228 2181 2244 835 740 693 756
50% maize:50% soybean 949 925 811 895 1428 1424 1406 1419 2377 2349 2217 2314 858 830 698 795
50% maize:50% soybean 'I' 889 895 787 857 1409 1431 1387 1409 2298 2326 2174 2266 779 807 655 747
67% maize:33% soybean 588 625 522 578 1743 1771 1730 1748 2331 2396 2252 2326 782 847 703 777
Mean 1054 1014 932 1000 1273 1284 1264 1274 2328 2299 2196 2274 819 789 686 764
Sole maize --- 2166 2166 557
Prices of main products are that of 2013: US$ 601.0 for ton of soybean; US$ 309.1 for ton of maize; intercropping soybean with maize increased variable costs
of intercropping culture from US$ 190 – 238 per ha over those of sole maize.
4. Conclusion
Our results concluded that the availability of low light
intensity due to shading effect of maize was the critical factor
in determining intercropped soybean cultivar. Relative yield
could be beneficial for estimating the shade tolerance of
soybean germplasm and choosing the special soybean
cultivars for the intercropping. Giza 82 was the compatible
soybean cultivar with increasing maize plant density from 50
to 67% of sole maize. Conversely, Giza 22 was the
compatible soybean cultivar with increasing maize plant
density from 25 to 50% of sole maize.
References
[1] Bulletin of Statistical Cost Production and Net Return. 2014. Summer and Nili Field Crops and Vegetables and Fruit,
Agriculture Statistics and Economic Sector, Ministry of Egyptian Agriculture and Land Reclamation, Part (2), August 2014.
[2] Sayed Galal Jr and Metwally AA. 1982. The variability in
intercropping tolerance of 18 soybean varieties when grown with a newly developed maize stock. Res. Bull., Ain Shams
Univ., Cairo, 2101: 1 – 15.
[3] Shafshak SE, Shokr El-S, Seif SAA and Shafie H. 1984. Intercropping maize and soybean as affected by various
nitrogen levels. 2- Yield and yield components. Agric. Res. Rev. Abst., 62 (7): 78 p.
[4] El-Habbak KED. 1985. Studies on competition and intercropping in maize and soybean. Ph.D. Thesis, Fac. Agric.
Moshtohor, Zagazig Univ.
[5] Sayed Galal Jr and Metwally AA. 1986. Science in practice. In: Proc.2nd Conf. Agron., Alexandria Univ., 1: 489-503, Egypt.
[6] El-Douby KA, El-Habbak KED, Khalil HE and Attia Zahira
M. 1996. Effect of some intercropping patterns on growth and yield of maize and soybean. Ann. Agric. Sci., Moshtohor, 34
(3): 919 – 933, Egypt.
[7] Weil RR and McFadden ME. 1991. Fertility and weed stress
effects on performance of maize/soybean intercrop. Agron. J., 83: 717–721.
[8] Liu XB, Jin J, Wang GH, Herbert S.J. 2008. Soybean yield
physiology and development of high-yielding practices in Northeast China. Field Crops Res., 105: 157–171.
[9] Aynehband A, Behrooz M and Afshar AH. 2010. Study of intercropping agroecosystem productivity influenced by
different crops and planting ratios. American-Eurasian J. Agric. and Environ. Sci., 7 (2): 163 – 169.
[10] Sayed Galal Jr, Abdalla MMF and Metwally AA. 1983.
Intensifying land and nutrient equivalent ratios by intercropping corn and soybean in Egypt. Soybean in tropical
and subtropical cropping systems. In: Proc. Symposium, Tsukubo, Japan, pp. 101 – 106.
[11] Abdel-Galil AM, Abdel-Wahab ShI and Abdel-Wahab TI.
2014a. Compatibility of some maize and soybean varieties for intercropping under sandy soil conditions. Proc. 1stConf. of
Int. Soybean Res., Indore, 22 – 24 February, India.
[12] Kakiuchi J and Kobata T. 2004. Shading and thinning effects
on seed and shoot dry matter increase in determinate soybean during the seed-filling period. Agron. J., 96: 398 – 405.
[13] Liu B, Liu XB, Wang C, Li YS, Jin J and Herbert SJ. 2010.
Soybean yield and yield component distribution acrossthe main axis in response to light enrichment and shading under
different densities. Plant Soil Environ., 56 (8): 384–392.
[14] Mead R and Willey RW. 1980. The concept of a "land equivalent ratio" and advantages in yields from intercropping.
Exp. Agric., 16: 217 – 28.
[15] Hiebsch CK. 1980. Principles of Intercropping. "Effect of N
fertilization and crop duration on equivalency ratios in intercrops versus monoculture comparisons." PhD Thesis.
North Carolina State University, Raleigh, N. C., USA.
[16] Freed RD. 1991. MSTATC Microcomputer Statistical Program. Michigan State University, East Lansing, Michigan,
USA.
International Journal of Applied Agricultural Sciences 2016; 2(2): 21-31 31
[17] Gomez KA and Gomez AA. 1984. Statistical Procedures for Agricultural Research. 2nd ed., John Willey and Sons, Toronto,
ON, Canada.
[18] Chang JH. 1974. Radiation balance. Climatic and Agriculture. An ecological survey, pp. 4 – 22. Aldine Publishing Company,
Chicago, Illinois, USA.
[19] Sharifi RS, Sedghi M and Gholipouri A. 2009. Effect of Population Density on Yield and Yield Attributes of Maize
Hybrids. Res. J. Biological Sci., 4 (4): 375 – 379.
[20] Konuskan O. 2000. Effects of plant density on yield and yield
related characters of some maize hybrids grown in hatay conditions as 2nd crop. M.Sc. Thesis, Sci. Inst. M.K.U., 71p.
[21] Mobaser HR, Delarestaghi Khorgami MM, Tari A and
Pourkalhor DB. 2007. Effect of planting density on agronomical characteristics of rice (Oryza sativa) varieties in
North of Iran. Pak J. Biol. Sci., 10 (18): 3205 – 3209.
[22] Burton JW, Carter TE and Bowman DT. 2005. Registration of ‘NC-Roy’ soybean. Crop Sci., 45: 2654.
[23] Metwally AA, Shafik MM, El-Habbak KE and Abdel-Wahab ShI. 2009. Step forward for increasing intercropped soybean
yield with maize. The 4th Conference, Recent Technologies in Agriculture, 3–5 Nov., Cairo Univ., 2: 256-269, Egypt.
[24] Abdel-Galil AM, Abdel-Wahab TI and Abdel-Wahab ShI.
2014b. Maize productivity under intercropping with four soybean varieties and maize planting geometry. Middle East J.
Agric. Res., 3 (2): 346 – 352.
[25] Addo-Quaye AA, Darkwa AA and Ocloo GK. 2011. Growth analysis of component crop in a maize-soybean intercropping
system as affected by time of planting and spatial arrangement. ARPN J. Agric. and Biological Sci., 6 (6):34 – 44.
[26] Undie UL, Uwah DF and Attoe EE. 2012. Growth and development of late season maize/soybean intercropping in
response to nitrogen and crop arrangement in the forest agro-ecology of South Southern Nigeria. Int. J. Agric. Res., 7(1): 1.
[27] Board JE. and Harville BG. 1992. Explanations for greater
light interception in narrow- vs. wide-row soybean. Crop Sci., 32: 198 –202.
[28] Egbe OM. 2010. Effects of plant density of intercropped soybean with tall sorghum on competitive ability of soybean
and economic yield at Otobi, Benue State, Nigeria. J. Cereals and Oilseeds 1(1): 1–10.
[29] Metwally AA, Shafik MM, El-Habbak KE and Abdel-Wahab
ShI. 2012. Yield and soybean characters under some intercropping patterns with corn. Soybean Res., 10: 24- 42
[30] Ijoyah MO, Ogar AO and Ojo GOS. 2013. Soybean-maize
intercropping on yield and system productivity in Makurdi, Central Nigeria. Scientific J. Crop Sci., 2 (4): 49 – 55.
[31] Abd El-Mohsen AA, Mahmoud Gamalat O and Safina SA. 2013. Agronomical evaluation of six soybean cultivars using
correlation and regression analysis under different irrigation regime conditions. J. Plant Breed. Crop Sci., 5 (5): 91 – 102.
[32] Abdel-Galil AM, Abdel-Wahab TI and Abdel-Wahab ShI.
2014c. Productivity of four soybean varieties as affected by intercropping and corn planting geometry. Soybean Res., 12
(1): 36 – 58.
[33] Hayder G, Mumtaz SS, Khan A and Khan S. 2003. Corn and soybean intercropping under various levels of soybean seed
rates. Asian J. Plant Sci., 2: 339 – 241.
[34] Voldeng HD, Seitzer JF and Donovan LS.1982. Maple presto
soybeans. Can. J. Plant Sci., 62: 501 – 503.
[35] Gourdon F and P1anchon C. 1982. Responses of photosynthesis to irradiance and temperature in soybean,
Glycine max. Photosynthesis Res., 3: 31 – 42.
[36] Jiang H and Egli DB. 1993. Shade induced changes in flower and pod number and flower and fruit abscission in soybean.
Agron. J., 85: 221 – 225
[37] Metwally AA, Shafik MM; El-Metwally El-MA and Safina
SA. 2003. Tolerance of some soybean varieties to intercropping. Proc. 10th Conf. Agron., Suez Canal Univ., Fac.
Environ. Sci., EL-Arish, Egypt. P.: 279 – 293.
[38] Lamlom MM, Abdel-Wahab ShI, Abdel-WahabTI and Gendy EK. 2015. Residual effects of some preceded winter field
crops on productivity of intercropped soybean with three maize cultivars. American J. BioSci., 3(6): 226 – 242.


![nyp.nypost.comnyp.nypost.com/classifieds/20160202/classifieds.pdf · do8 xc?i bc=;-]:o=pt6-nor?:t?6](https://img.dokumen.tips/doc/110x75/5d5d158988c99338588b5947/nyp-do8-xci-bc-opt6-nort6-.jpg)