Embed Size (px)
Citation preview
Draft
DAMAGE LEVEL ASSESSMENT OF RESPONSE LIMITS IN
LIGHT-FRAME WOOD STUD WALLS SUBJECTED TO BLAST
LOADING
Journal: Canadian Journal of Civil Engineering
Manuscript ID cjce-2015-0418.R2
Manuscript Type: Article
Date Submitted by the Author: 03-Sep-2016
Complete List of Authors: Viau, Christian; University of Ottawa, Civil Engineering
Lacroix, Daniel; University of Ottawa, Civil Engineering Doudak, Ghasan; University of Ottawa,
Keyword: response-blast loading < Struct.Eng. & Constr.Mate, structure - wood < Struct.Eng. & Constr.Mate, shock tube, light frame, CSA S850
https://mc06.manuscriptcentral.com/cjce-pubs
Canadian Journal of Civil Engineering
Draft
DAMAGE LEVEL ASSESSMENT OF RESPONSE LIMITS IN LIGHT-
FRAME WOOD STUD WALLS SUBJECTED TO BLAST LOADING
Christian Viau1, Daniel N. Lacroix
2, and Ghasan Doudak
3
1,2
PhD students, Dept. of Civil Engineering, Univ. of Ottawa, ON, Canada K1N 6N5. 3 Associate Professor, Dept. of Civil Engineering, Univ. of Ottawa, Ottawa, ON, Canada K1N 6N5
(corresponding author). E-mail: [email protected]
Page 1 of 32
https://mc06.manuscriptcentral.com/cjce-pubs
Canadian Journal of Civil Engineering

Draft
Abstract: Currently, no systematic approach exists for damage evaluation of light-frame wood
structures subjected to blast loading. This paper presents a detailed assessment of the behaviour of
thirty-three full-scale light-frame wood stud walls subjected to a total of forty-eight shots of simulated
blast loading. Detailed documentation of the observed damage allowed for the development of an
accurate evaluation strategy of the response limits. The observed response limits are compared to
limits derived from single-degree-of-freedom modelling using scaled pressure-impulse diagrams and
to current code performance levels. It was concluded that the assumption made in contemporary blast
design codes overestimates the ductility ratios for light-frame wood stud walls, and that using a
maximum ductility of 2 is more appropriate and safer for blast design. Based on the observed damage
levels obtained from the experimental study, the authors propose new ductility ratios corresponding to
four damage regions.
Key words: blast, light-frame, walls, CSA S850, response limits, scaled PI, pressure-impulse,
timber, single degree-of-freedom, shock tube.
Page 2 of 32
https://mc06.manuscriptcentral.com/cjce-pubs
Canadian Journal of Civil Engineering

Draft
Introduction
The development of blast guidelines has mainly focused on materials such as reinforced concrete and
steel due to their widespread use in blast resistant design. Blast design provisions have been enacted
in design standards in the United States (Department of Defense 2008; ASCE/SEI 59 2011), Canada
(CSA S850 2012), and the United Kingdom (Office of the Deputy Prime Minister 2004) as a result of
events such as deliberate attacks (e.g. Oklahoma City 1995; World Trade Center 2001) and accidental
explosions (e.g. Ronan Point 1968; BP Texas City 2005; Lac-Mégantic 2013) causing loss of lives
and high property damage. Subsequently, provisions correlating potential building damage levels to
expected levels of protection (LOP) have been defined for design and assessment purposes. Each
LOP, corresponding to potential building performance, is in turn associated with a response limit
defining the component’s damage level. The response limits, denoted in the design standards as B1
through B4, correlate to specific values of support rotation or ductility ratio, which is the final
deflection of the component divided by its elastic limit. By considering the damage level descriptions,
as defined in blast design codes in North America (PDC-TR 06-08 2008; ASCE/SEI 59 2011; CSA
S850 2012) and presented in Table 1, it can be noted that damage descriptions such as “component
has not failed, but it has significant permanent deflections causing it to be unrepairable” and
“component has some permanent deflection. It is generally repairable” are not applicable to light-
frame wood structural elements. In such complex systems consisting of components that are known to
have variability in their stiffness and strengths, the damage of one component (e.g. stud) may not
accurately reflect the subsystem (wall) or overall building damage.
Light-frame wood stud walls consist of ribbed plates acting together in partial composite action
through metallic fasteners (usually nails) joining the sheathing panels to the framing members. The
slip in these joints, caused by the wall bending, provides some ductility in the wall system
(McCutcheon 1986; Liu and Bulleit 1995a, 1995b; Lacroix 2013). One noticeable aspect of these
systems is their ability to share the load through a distribution which is based on the studs’ stiffness,
as well as load redistribution when individual elements such as studs or nails experience different
Page 3 of 32
https://mc06.manuscriptcentral.com/cjce-pubs
Canadian Journal of Civil Engineering

Draft
levels of damage. Design under static load takes system effects into account indirectly by employing a
factor which accounts for the load sharing between the individual studs. When this failure criteria was
developed, it was recognized that basing the failure of light-frame wood floor or wall systems on the
weakest element was too conservative in representing the failure of the subsystem as a whole
(Vanderbilt, Goodman and Bodig 1974). The failure of a single stud, especially if debris is limited or
contained, would not cause hazardous risk to the occupants and therefore should not be considered as
the ultimate resistance of the wall subsystem. Several proposed approaches attempting to define the
subsystem-level failure (i.e. entire floor/wall) have been developed, varying from failures based on
first member rupture (Foschi 1982, 1984; Bulleit 1985; Folz and Foschi 1989) to multiple-member
failure (Gromala 1983; Rosowsky and Ellingwood 1991; Liu and Bulleit 1995a, 1995b). It was shown
that the ultimate lateral capacity of a subsystem is higher than that coinciding with rupture of the first
member (Liu and Bulleit 1995b). Therefore, a more comprehensive approach at the system level
considering multiple member failure would need to be considered.
Currently, the blast design standards (PDC-TR 06-08 2008; ASCE/SEI 59 2011; CSA S850 2012) use
ductility ratios of 1, 2, 3, and 4 which correlate to response limits B1, B2, B3, and B4, respectively,
for light-frame wood stud walls in flexure (see Table 1). The response limits in the blast standards
correspond to superficial (less than B1), moderate (between B1 and B2), heavy (between B2 and B3),
hazardous (between B3 and B4), and blowout (more than B4). These blast provisions for wood
structures are based on limited data obtained primarily through live-explosive testing conducted by
Marchand (2002). While no systematic approach for damage evaluation of light-frame wood
structures exists, the test data available in the literature was reviewed by Oswald (2005) and an overall
damage assessment was proposed based on the limited available information in form of damage
photos and pressure-impulse combinations. In-situ properties of the structural members were not
available and therefore published data was used to obtain the strength and stiffness of the specimens
in order to conduct the assessment (Oswald 2005). Although the specific damage descriptors were not
explicitly defined in Oswald’s study, it is assumed that the maximum ductility ratio of 4 was chosen
because this limit defined the most severe damage observed during the assessment. A “blow-out”
Page 4 of 32
https://mc06.manuscriptcentral.com/cjce-pubs
Canadian Journal of Civil Engineering

Draft
region is notoriously difficult to estimate, because if there is a lack of data points representing the
onset of collapse or ultimate failure, the limit is likely to be overestimated.
A comprehensive research program was established at the University of Ottawa’s blast laboratory
with the aim to mitigate hazards associated with blast loads on light-frame wood structures. Presented
in the current paper is a detailed assessment of the behaviour of thirty-three full-scale light-frame
wood stud walls subjected to a total of forty-eight shots of simulated blast loading. Detailed
documentation of the observed damage allowed for the development of an accurate evaluation
strategy of the response limits. To assess the validity of the proposed approach, the observed response
limits are compared to limits derived from single-degree-of-freedom (SDOF) modelling using scaled
pressure-impulse (P-I) diagrams. The developed approach is also compared to current code
performance levels for wood light-frame structures, and implications on the code are discussed.
Description of specimens and dynamic test setup
The data used to evaluate the damage levels stems from three separate experimental programs,
denoted in Table 2 as test groups A, B, and C, all of which were conducted at the University of
Ottawa’s Blast facility. The tested walls consisted of the structural elements (i.e. studs, exterior
sheathing panels, and sheathing-to-stud fasteners) only. Omitted from the construction of the
specimens are non-structural components (e.g. exterior cladding, insulation, and interior sheathing) in
order to isolate structural performance.
The walls were 2108 mm in width, with a clear span of 2032 mm. The wall segments tested were
slightly shorter than typical light-frame walls, due to the limitation imposed by the 2032 mm x 2032
mm opening of the blast simulator. This deviation from typical stud wall sizes would have been of
concern if the observed failure mode changed to be governed by, for example, shear. Since the
governing failure in the tests was flexure, it is anticipated that using longer walls would yield similar
behaviour.
Page 5 of 32
https://mc06.manuscriptcentral.com/cjce-pubs
Canadian Journal of Civil Engineering

Draft
The blast loads were simulated using a shock tube, a test apparatus capable of producing shock waves
similar to those stemming from far-field detonation of high-explosives. The shock tube generates
shock waves with reflected pressures and impulses of up to 100 kPa and 2200 kPa-ms, respectively. A
sketch of the end-frame, located at the end of the expansion section of the shock tube, is shown in
Figure 1. Depending on driver pressure and length, the positive phase of the blast wave can vary from
5 ms to 70 ms. For the purpose of this study, the range of reflected pressures consisted of 6.6 kPa to
70.9 kPa, which correlates to reflected impulses varying from 25.1 kPa-ms to 813.2 kPa-ms.
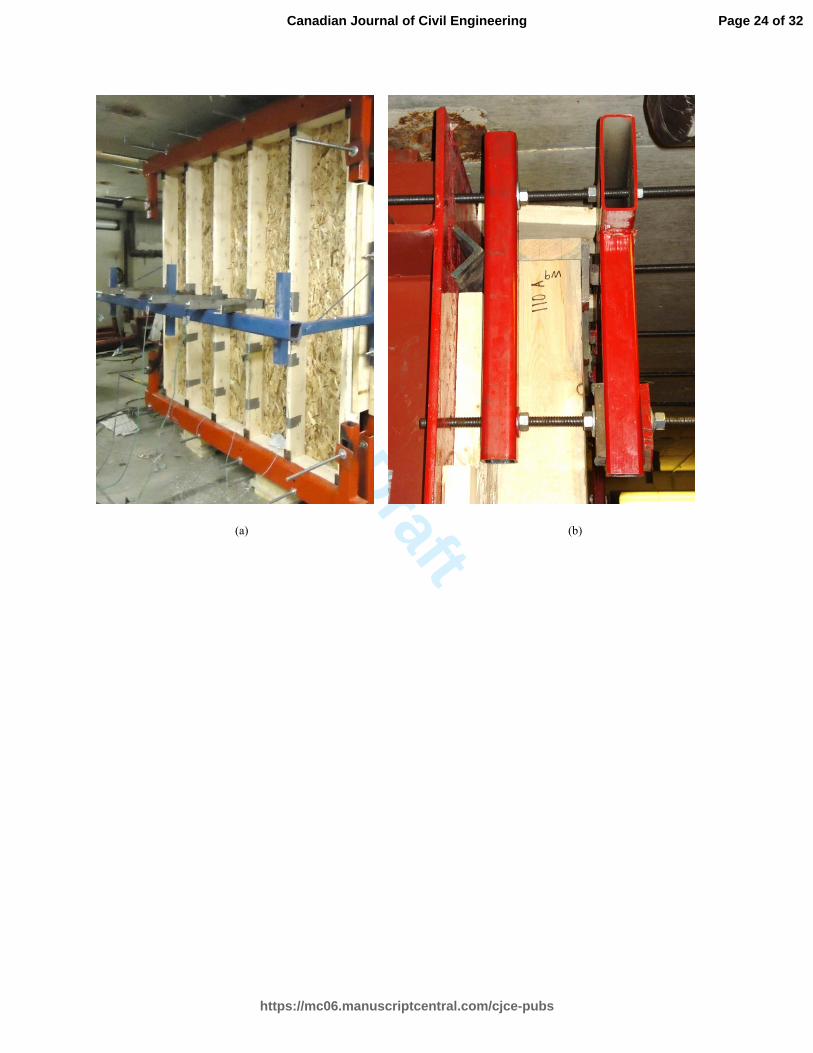
The walls were attached to the end frame of the shock tube (Figure 2a) with support details simulating
idealized simply-supported boundary conditions (Figure 2b). Steel angles were attached to the shock
tube frame using 6.35 mm thick 76 mm x 76 mm hollow steel sections (HSS) and allowed for free
rotation at the outside face of the wall. Steel plates with rollers were fixed to each studs in order to
avoid crushing of the wood at the point of contact. These rollers were in contact with a rectangular
6.35 mm thick 76 mm x 152 mm HSS which clamped the wall to the shock tube frame. While these
support conditions are not representative of typical (toe-nailed) or designed boundary connections, the
idealization of pin-ended boundary conditions allows for the development and verification of
analytical expressions. The effects of connections on the performance of light-frame wood stud walls
to blast is outside the scope of the current study. The reflected pressure for each test was measured
using two dynamic piezoelectric pressure sensors, and strain gauges were installed on both the tension
and compression face of the four middle studs of each wall. Coincidentally, the reflected impulse was
determined by calculating the area under the pressure-time history up until the end of the positive
phase. Linear variable differential transducers (LVDTs) were used to measure the mid-span stud
deflections relative to a stiff steel bracket attached to the shock tube’s end frame, as seen in Figure 2.
A data acquisition system with a sampling rate of 100,000 samples per second and a high-speed
camera, capable of recording videos at 500 frames per second, were used to collect the data output.
Complementing the dynamic tests presented in this paper are static full-scale bending tests conducted
on both individual studs (Lacroix 2013; Viau 2016) and walls (Lacroix 2013). The static tests were
Page 6 of 32
https://mc06.manuscriptcentral.com/cjce-pubs
Canadian Journal of Civil Engineering
Draft
conducted in accordance with the ASTM D198 standard (2009). A total of 380 studs and ten walls
with 38 mm x 140 mm studs were tested statically. Five walls were sheathed with 11 mm OSB and
the other five with 18.5 mm plywood. While the latter is not typically used in construction, the use of
18.5 mm plywood was meant to simulate a retrofit option in an attempt to improve on the wall
performance. Future studies will be dealing with the effect of varying sheathing thickness.
Results and Discussion
Evaluation of ductility ratios for light-frame wood stud walls
Static full-scale bending tests were conducted on both individual studs and walls prior to testing the
walls dynamically. The predominant observed failure mode for both the studs and walls was flexural
failure at the mid-span of the studs. Depending on the relative strength of the tensile fibres versus the
compressive fibres, the failure mode was either initiated on the tension side, where a sudden failure
took place, or in the compression zone, where crushing of the wood fibres permitted the stud to
exhibit additional ductility.
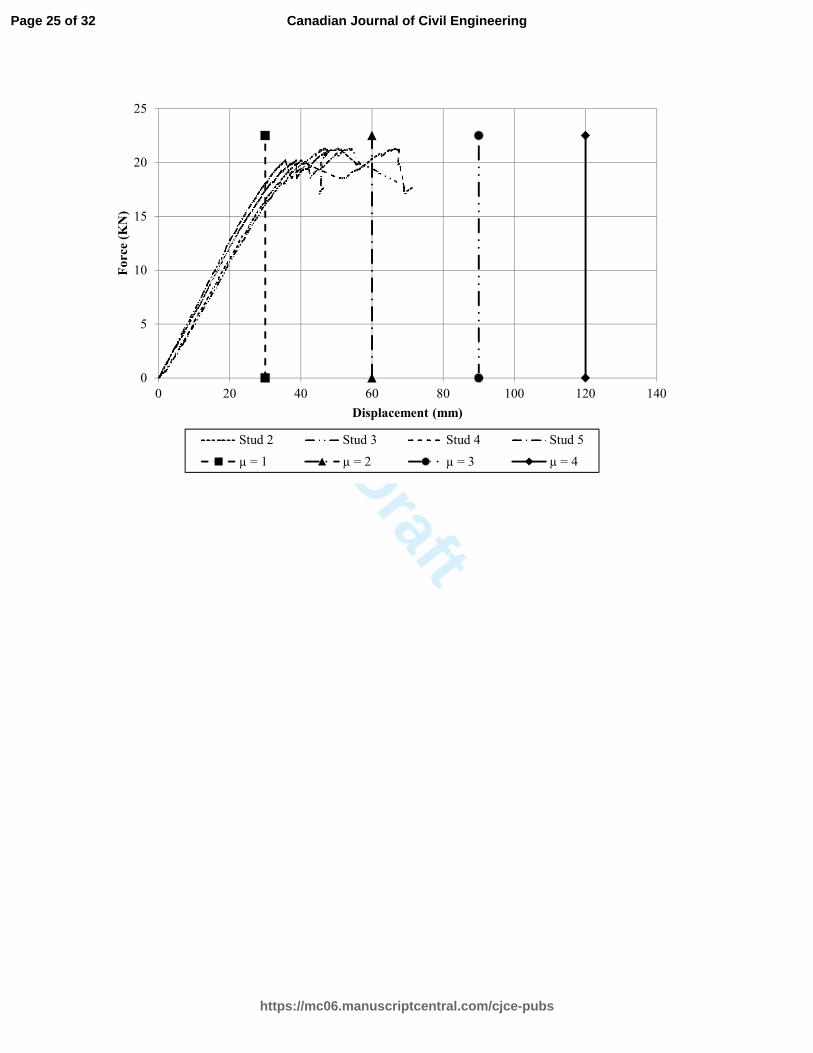
The static wall test results yielded average ductility ratios of 2.0 and 1.7 for the OSB and plywood
walls, respectively (Lacroix 2013). These observations are consistent with the findings from other
published studies (Gromala 1983; Foschi 1985; Wheat et al. 1986; Liu and Bulleit 1995b; Bulleit et
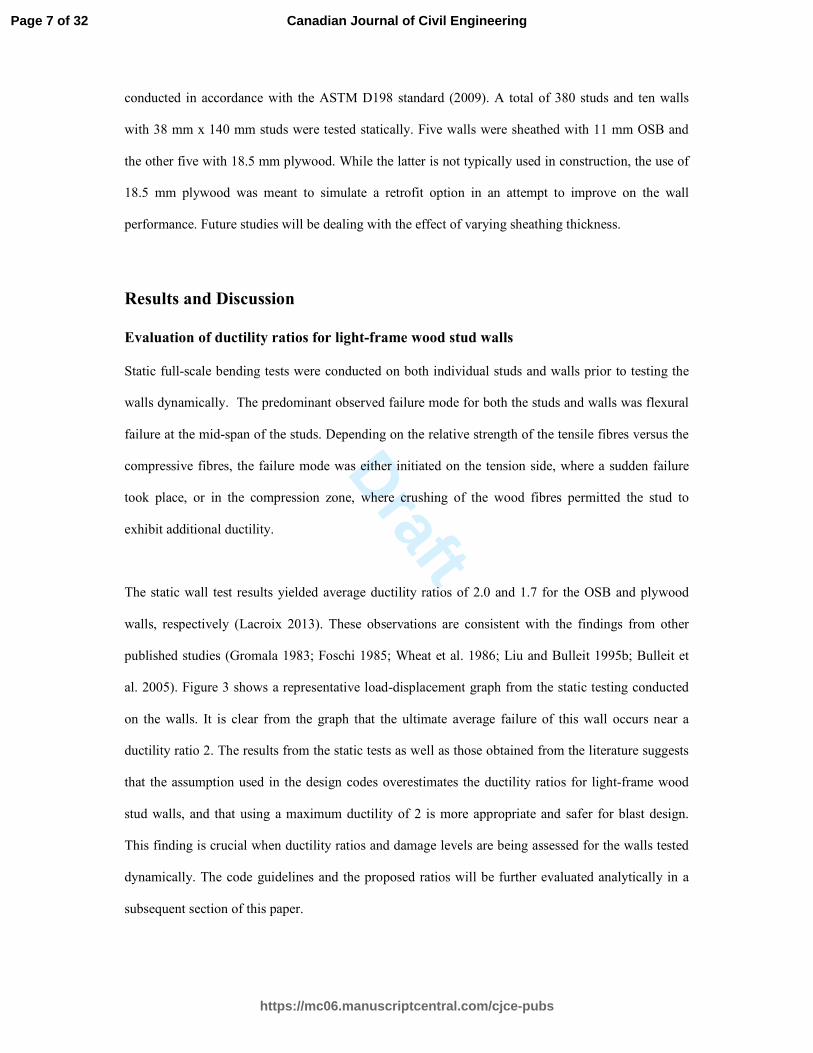
al. 2005). Figure 3 shows a representative load-displacement graph from the static testing conducted
on the walls. It is clear from the graph that the ultimate average failure of this wall occurs near a
ductility ratio 2. The results from the static tests as well as those obtained from the literature suggests
that the assumption used in the design codes overestimates the ductility ratios for light-frame wood
stud walls, and that using a maximum ductility of 2 is more appropriate and safer for blast design.
This finding is crucial when ductility ratios and damage levels are being assessed for the walls tested
dynamically. The code guidelines and the proposed ratios will be further evaluated analytically in a
subsequent section of this paper.
Page 7 of 32
https://mc06.manuscriptcentral.com/cjce-pubs
Canadian Journal of Civil Engineering

Draft
Failure modes and wall behaviour under dynamic loading
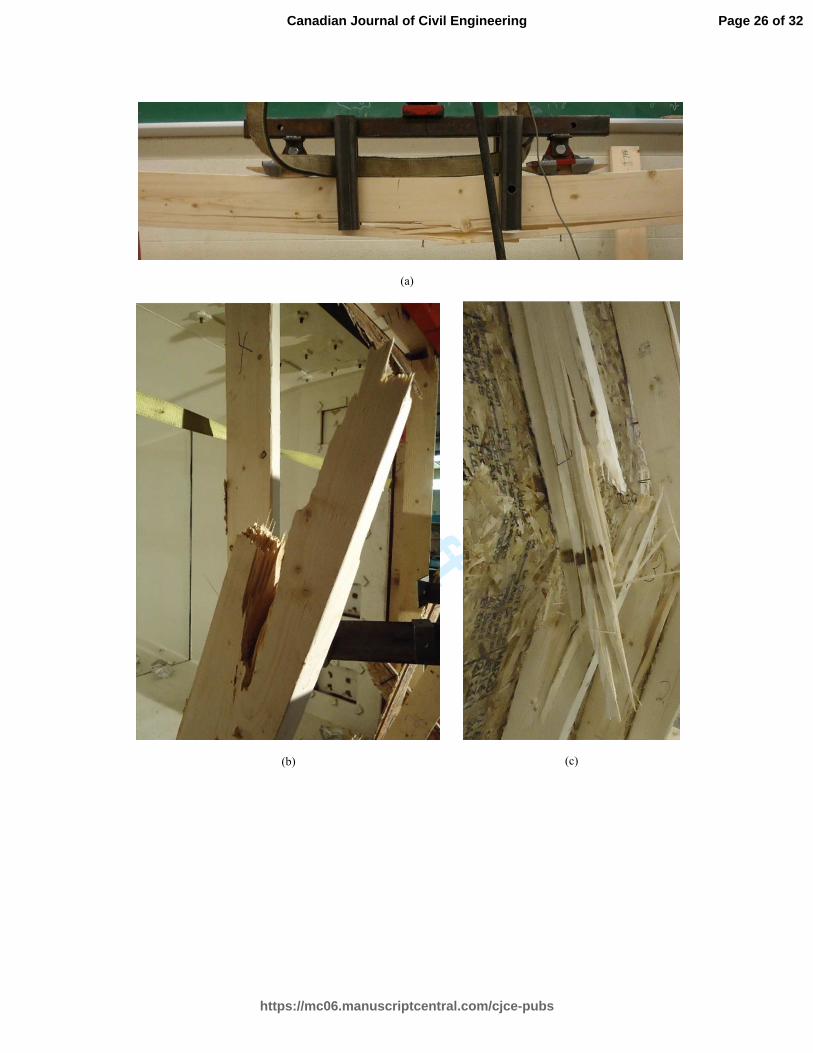
Similar to static testing, the failure mode of walls subjected to simulated blast loading was
predominantly flexural failure of the studs at mid-span. Compared to the failure observed in static
tests (Figure 4a), the dynamic failure was dominated by a brash failure, with a noticeable “cut-
through” the cross-section on studs with weak tension fibres (Figure 4b). Studs with stronger tension
fibres experienced a more “fibrous” type of failure mode (Figure 4c), where the failed fibres tended to
be longer and thicker than those found in weaker studs. This observation is consistent with that
reported in a previous study on impact loading on clear wood specimens (Johnson 1986).
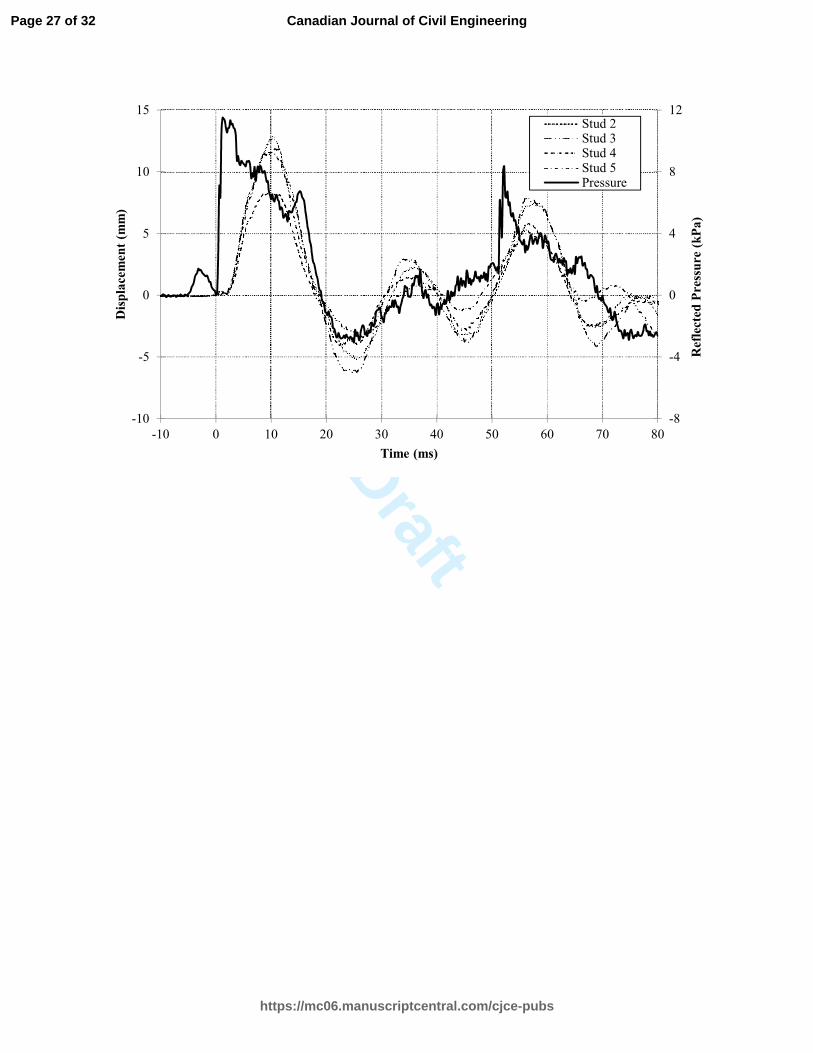
The deflections of the four middle studs can be seen to reach their peak at the same time due to the
sheathing panel pushing on the studs and allowing for load distribution to occur between the studs, as
seen in Figure 5. In the rebound phase, the sheathing-to-stud connection does not seem to have
sufficient withdrawal capacity to maintain constant displacement and the studs no longer move in
unison.
In the case of elastic shots, where the walls returned to their original position, the maximum
displacement was easily identified as the actual peak displacement, while in destructive shots it was
taken as the displacement corresponding to maximum strain recorded using the strain gauges. Strain-
and displacement-time histories correlated well and the peaks in strains and displacements were
observed to occur at approximately the same time.
Quantification of damage levels
The proposed evaluation criteria were developed based on the overall performance of the wall system
and its estimated post-blast axial residual capacity. Typically, the lowest damage level corresponds to
that of no observable damage on the structural elements. Due to the strength and stiffness variability
between studs, a loading of relatively low magnitude may potentially cause cracking in the weakest
studs. As mentioned in the introduction section, even though this is a permanent damage, it has little
Page 8 of 32
https://mc06.manuscriptcentral.com/cjce-pubs
Canadian Journal of Civil Engineering

Draft
to no impact on the post-blast axial capacity of the wall or the structure as a whole, and therefore, the
proposed descriptor for “superficial damage” allows for limited splitting in an individual stud. Figure
6a shows an example of what the authors have characterized as “superficial” damage, where one stud
experienced minor cracks on the tension face while the other studs did not experience any damage.
This clearly does not meet the intent of the current damage level description in the blast design codes
(ASCE/SEI 59 2011; CSA S850 2012), where a superficial damage level entails “no visible
permanent damage”. Since the wall (and the “failed” stud) has no permanent deflection, the
“moderate” and “heavy” damage description from Table 1 would also not apply. If the assessment
was made based on the failure of a single stud (weakest member within the wall subsystem) then the
description for “hazardous” damage, defined as “Component has failed with no significant velocities”,
would apply to this wall. This was deemed, by the authors, as too conservative, and it reiterates the
need for different and more appropriate descriptors specifically developed for light-frame wood stud
walls. It is assumed here that the inherent variability in wood, which may lead to a stud with inferior
capacity to experience some damage, should not mean that the level of damage of the entire wall is
characterized for a higher damage level.
During the documentation of observed damage in the experimental phase, it was deemed very difficult
to differentiate between moderate and heavy damage. For practical reasons, a merging of these two
damage regions is proposed for the purpose of assessing wood stud walls. The proposed wording for
the moderate-heavy range is based on observed wall failure being more appropriately defined by
failure of two adjacent studs or any three studs. This is based on the assumption that overall wall
failure is unlikely to occur when two adjacent studs or any three studs have completely failed in the
wall system (Liu and Bulleit 1995b). Although the current study is based on the damage assessment of
walls with six studs only, Liu and Bulleit (1995b) showed, through reliability analyses, that similar
limit-state failure criteria could be applicable to walls with up to 32 members. Figure 6b shows a
representative example of the moderate-heavy damage.
Page 9 of 32
https://mc06.manuscriptcentral.com/cjce-pubs
Canadian Journal of Civil Engineering
Draft
The proposed “hazardous” damage is defined by the failure of three or more adjacent studs where
debris has no significant velocity. At this damage level it is assumed that the wall segment would be
at the onset of structural collapse. An example is shown in Figure 6c. Finally, the blowout region is
described by the structural component being overwhelmed by the load and where the debris have
significant velocities. Figure 6d shows a representative observed damage level for what has been
characterize as “blowout”.
The damage assessment of light-frame wood stud walls described above has been summarized in
Table 3 in a format that resembles that currently found in the blast design codes (see Table 1). Table 4
shows the evaluation of all the test results based on the proposed damage level description. The table
includes the test names, scaled pressures (Pbar), scaled impulses (Ibar), and assessments of the damage.
The nomenclature of the test names allows for the identification of the specimen group, wall number,
and shot sequence to which the specimen was exposed. For example, B3-2 refers to group B, was the
third wall of that group, and was exposed to a second combination of pressure and impulse. These
assessments are based on the criteria proposed in Table 3 and in line with damage levels presented in
Figure 6. For example, the initial damage of wall B3-2 is defined by the damage assessment of wall
B3-1. Detailed damage descriptions for all forty-eight tests can be found in Lacroix and Doudak
(2012), Viau (2016), and Lacroix (2013).
It is noteworthy to mention that gypsum wallboard (GWB) has been intentionally omitted from this
study. It is recognized that adding GWB to the tested walls would have an effect on the walls’
behaviour as well as the damage level description. It is conceivable that flying debris from GWB
panels may be generated when subjected to a blast load which correlates to moderate-to-heavy
damage. On the other hand, adding GWB on the tension side of the studs may have a reinforcing
effects and may help reduce the overall displacement and thereby damage of the wall studs.
Since this study constitutes the first step in the comprehensive evaluation of damage levels in light-
frame wood stud walls, it was decided that the focus should be on the main structural elements only.
Future studies will address the effect of non-structural elements, including cladding, insulation, and
GWB panels, or other interior finishes, on the dynamic behaviour of the stud wall systems.
Page 10 of 32
https://mc06.manuscriptcentral.com/cjce-pubs
Canadian Journal of Civil Engineering

Draft
Implications of design and retrofitting were briefly investigated through the use of WWM. As per
Table 3, the “blowout” damage level can be reached if the greater majority of structural components
are overwhelmed by the blast load, or if failure of the sheathing creates debris with significant
velocities. The latter damage criteria would tend to govern in the assessment of the damage level of
walls with typical sheathing (i.e. 7/16 in. OSB), which has shown to fail prior to stud response and
produce significant amounts of sheathing debris (Viau 2016). The addition of WWM has shown to
adequately reinforce the sheathing, as observed in test C1-1 (see Table 4), and thereby reducing the
damage level to hazardous.
In order to evaluate whether the proposed damage description and ductility ratios are consistent with
the applied pressure and impulse imparted on the walls, analysis using SDOF is used as described in
the next section.
Validation of observed damage
Scaled Pressure-Impulse Diagrams
A common method to describe the performance characteristics for a range of blast loading for a
specific type of element and failure mode is through the use of pressure-impulse (P-I) diagrams. The
different curves in a P-I diagram indicate different damage levels or levels of protection (i.e. iso-
damage curves). These can be obtained using a SDOF analysis method, from experimental results, or
from actual blast events. While useful, its main drawback is that if not normalized, P-I diagrams
cannot be generalized and can only be used to assess the behaviour of structural elements of identical
properties, geometries, loading and end conditions. To expand the applicability of P-I diagrams to a
broader range of specimens, normalized pressure-impulse combinations can be used to directly
compare results of similar specimens with different geometries and properties. The specimen
stiffness, resistance, mass, and loaded-area are all taken into account and each data point is
normalized by removing the direct effects of each of these properties. Curve fitting factors that take
into account the effects of the negative phase of the blast wave are also available in the literature
(Oswald 2005; PDC-TR 06-01 2008).
Page 11 of 32
https://mc06.manuscriptcentral.com/cjce-pubs
Canadian Journal of Civil Engineering

Draft
Scaled P-I diagrams contain non-dimensional scaled peak blast pressure (Pbar) and scaled positive
blast impulse (Ibar) terms, which are obtained by dividing the pressure and impulse by the component
properties using the conservation of energy principle (Oswald 2005; PDC-TR 06-01 2008;
Krauthammer et al. 2008; Dragos and Wu 2013). Rather than describing a deflection limit, the scaled
P-I diagram reflects a non-dimensional response criterion, which is often described as a ductility ratio
or a support rotation. For wood, the common approach to relate the response limits to damage levels is
through the use of the ductility ratio, µ, which consists of the ultimate deflection, xmax, divided by the
elastic deflection of the system, xe, as shown in Equation (1).
(1) μ = x���x�
The difference between the static deformed shape and the first mode approximations is insignificant
for blast loading, thus allowing the use of the static shape, which is more convenient (Department of
Defense 2008). Most importantly, the time-scale between the real and equivalent systems is not
altered; therefore, at any instance during the displacement-time history, the displacement of the
equivalent system is equal to that of the real structure at the equivalent ordinate. Equations (2) and (3),
reproduced from Oswald (2005), describe the non-dimensional response criterion of ductility ratio for
a component with an elastic, perfectly plastic flexural response.
(2) P� = P�R
(3) I� = I�R � KK��m
Where PR is the reflected peak positive pressure, Ru is the ultimate flexural resistance of the
component obtained from static testing and modified for strain rate effects, IR is the reflected impulse
associated with the positive phase, K is the stiffness of the system, KLM is the load-mass factor, and m
is the mass of the system. Based on the findings of a wall behaving in an approximate elastic-perfectly
plastic flexural response, equations (2) and (3) can therefore be used to scale the data points of the
forty-eight tests.
Page 12 of 32
https://mc06.manuscriptcentral.com/cjce-pubs
Canadian Journal of Civil Engineering

Draft
By scaling the pressure and impulse combinations, it is possible to include walls with different
properties and geometries into the same P-I diagram, as shown in Figure 7. Figure 7 clearly shows
the clustering of points identified with each damage level. Iso-damage curves could be developed to
distinguish between these groups and each iso-damage curve would correspond to a well-defined
damage level.
Implications on blast design codes
Figure 8 shows the response limits based on the current provisions of the Canadian blast design
standard (CSA S850 2012). It is clearly shown that data points characterized as “superficial” and
“moderate-heavy” fit reasonably well within the regions proposed by the code, however, damage
regions for “hazardous” and “blowout” are non-conservative. The need to reduce the ductility ratio
corresponding to response limit B3 and B4 is apparent when comparing the fit between the data points
and the respective response limits.
Based on the observed damage levels obtained from the experimental study, the authors propose the
use of only four damage regions, separated by three response limits, denoted B1, B2, and B3,
corresponding to ductility ratios of 1, 1.5, and 2, respectively (see Table 3). Figure 9 shows the same
data as in Figure 8 but with the proposed damage regions. It can be observed that test walls
characterized as “blowout” fit well within the proposed blowout region, located to the right of the iso-
curve corresponding to response limit B3 (i.e. µ = 2). The damage region corresponding to
“hazardous” can be seen to be relatively small, because it is often difficult to attain flexural failure of
several load-bearing elements without any hazardous debris. This observation may imply that for all
practical purposes and given the uncertainty associated with defining damage in the hazardous region,
only three regions, namely superficial, moderate/heavy/hazardous, and blowout, may be adequate to
describe the behaviour of light-frame wood stud walls. More data points are needed in the hazardous
region before such recommendations can be made. The “superficial” region has not been changed,
since it is based on the elastic limits.
Page 13 of 32
https://mc06.manuscriptcentral.com/cjce-pubs
Canadian Journal of Civil Engineering

Draft
In general, it can be concluded that the proposed damage assessment method and the proposed
ductility ratios seem appropriate when compared with observations of actual damage and measured
pressure and impulse combinations from the experimental program.
Conclusions
New damage assessment methodologies and ductility ratios, reflective of the behaviour of wood light-
frame wood stud walls subjected to blast loads, are proposed. The proposed response limits were
based on a series of experimental investigations and include observed damage using system level
failure criteria. Scaled P-I diagrams were effectively used to demonstrate the proposed damage level
descriptions and ductility ratios using walls from different tests. Simply-supported end conditions
were utilized throughout the testing in order to investigate the behaviour of the wall in isolation.
Damage descriptions and associated response limits, suitable for damage observed in light-frame
wood stud walls were proposed for “superficial”, “moderate-heavy”, “hazardous”, and “blowout”
regions. The study also showed that current blast design code response limits overestimate the
ductility found in light-frame wood stud wall systems, especially for the hazardous and blow-out
regions. New ductility limits of 1, 1.5 and 2 are proposed and found to better describe the damage
regions.
The effect of end fixities and other non-structural components as well as axial loads are currently
under investigation by the authors and are outside the scope of the current paper.
Page 14 of 32
https://mc06.manuscriptcentral.com/cjce-pubs
Canadian Journal of Civil Engineering

Draft
References
ASCE/SEI. 2011. Blast Protection of Buildings. ASCE/SEI 59-11. American Society of Civil
Engineers. Reston, VA
ASTM. 2009. Static Tests of Lumber in Structural Sizes. ASTM D198-09, West Conshohocken, PA.
Bulleit. W.M. 1985. Relative reliability of dimension lumber in bending. Journal of Structural
Engineering, 111(9): 1948-1963.
Bulleit, W.M., Pang, W.C., and Rosowsky, D.V. 2005. Modeling wood walls subjected to combined
transverse and axial loads. Journal of Structural Engineering, 131(5): 781-793.
CSA. 2012. Design and assessment of buildings subjected to blast loads. CSA standard S850-12.
Canadian Standards Association, Mississauga, Ont.
Department of Defense. 2008. Unified Facilities Code (UFC) 03-340-02: Structures to Resist the
Effects of Accidental Explosions, United States of America Department of Defense, Washington,
D.C.
Dragos, J., and Wu, C. 2013. A new general approach to derive normalised pressure impulse curves.
International Journal of Impact Engineering, 62: 1-12.
Folz, B., and Foschi, R.O. 1989. Reliability-based design of wood structural systems. Journal of
Structural Engineering, 115(7): 1660-1680.
Foschi, R.O. 1982. Structural analysis of wood floor systems. Journal of Structural Engineering,
108(7): 1557-1574.
Foschi, R.O. 1984. Reliability of wood structural systems. Journal of Structural Engineering, 110(12):
2995-3015.
Foschi, R.O. 1985. Wood floor behavior: Experimental study. Journal of Structural Engineering,
111(11): 2497-2508
Gromala, D.S. 1983. Light-frame wall systems: Performance and predictability. USDA Research
Paper FPL 442, Forest Products Laboratory, Madison, Wis.
Johnson, W. 1986. Historical and Present-Day References Concerning Impact on Wood. International
Journal on Impact Engineering, 4(3): 161-174.
Krauthammer, T., Astarlioglu, S., Blasko, J., Soh, T.B., and Ng, P.H. 2008. Pressure-impulse
diagrams for the behavior assessment of structural components. International Journal of Impact
Engineering, 35(8): 771-783.
Lacroix, D.N. 2013. Behaviour of light-frame wood stud walls subjected to blast loading. MASc
thesis, Department of Civil Engineering, University of Ottawa, Ottawa, ON.
Page 15 of 32
https://mc06.manuscriptcentral.com/cjce-pubs
Canadian Journal of Civil Engineering

Draft
Lacroix, D., and Doudak, G. 2012. Behaviour of typical light-frame wood stud walls subjected to
blast loading. World Conference on Timber Engineering, New Zealand Timber Design Society
(NZTDS), Auckland, New-Zealand: 561–569.
Lacroix, D., and Doudak, G. 2015. Experimental and Analytical Evaluation of the Flexural Capacity
of Light-Frame Wood Stud Walls Under Blast Loading - An Assessment of the Canadian Blast
Design Standard Provisions. 11th International Conference on Shock & Impact Loads on Structures,
Ottawa, ON: 213-221.
Liu, W.F., and Bulleit, W.M. 1995. Approximate reliability analysis of wood structural systems,
Journal of Structural Safety, 17(2): 59-78.
Liu, W.F., and Bulleit, W.M. 1995. Overload behavior of sheathed lumber systems. Journal of
Structural Engineering, 121(7): 1110-1118.
Marchand, K.A. 2002. BAIT, BASS & RODS Testing Results. USAF Protection Battlelab, The
Technical Support Working Group, Defense Threat Reduction Agency.
McCutcheon, W.J. 1986. Stiffness of Framing Members with Partial Composite Action. Journal of
Structural Engineering, 112(7): 1623-1637.
Office of the Deputy Prime Minister. 2004. The Building Regulations 2000, Part A, Schedule 1: A3,
Disproportionate Collapse, London, UK.
Oswald, C.J. 2005. Component Explosive Damage Assessment Workbook (CEDAW) Methodology
Manual V1.0. BakerRisk Project No. 02-0752-001, Protective Design Center, US Army Corps of
Engineers (Omaha District), San Antonio, TX.
PDC-TR 06-08.2008. Single Degree of Freedom Structural Response Limits for Antiterrorism Design
(PDC-TR 06-08). U.S. Army Corps of Engineers, Protective Design Center. Omaha, NE.
PDC-TR 06-01 Revision 1. 2008. Methodology Manual for Single-Degree-of-Freedom Blast Effects
Design Spreadsheets (SBEDS) (PDC TR-06-01). U.S. Army Corps of Engineers, Protective Design
Center. Omaha, NE.
Rosowsky, D., and Ellingwood, B. 1991. System reliability and load-sharing effects in light-frame
wood construction. Journal of Structural Engineering, 117(4): 1096-1114.
Vanderbilt, M.D., Goodman, J.R., and Bodig, J. 1974. A rational analysis and design procedure for
wood joist floor systems. Final report to the National Science Foundation for Grant GK-30853.
Colorado State University, Dept. of Civ. Eng., Fort Collins, CO.
Viau, C. 2016. Investigating the Response of Light-Frame Wood Stud Walls with and Without
Boundary Connections to Blast Loads. MASc thesis, Department of Civil Engineering, University of
Ottawa, Ottawa, ON.
Wheat, D.L., Gromala, D.S., and Moody, R.C. 1986. Static behavior of wood joist floors at various
limit states. Journal of Structural Engineering, 112(7): 1677-1691.
Page 16 of 32
https://mc06.manuscriptcentral.com/cjce-pubs
Canadian Journal of Civil Engineering

Draft
Page 17 of 32
https://mc06.manuscriptcentral.com/cjce-pubs
Canadian Journal of Civil Engineering
Draft
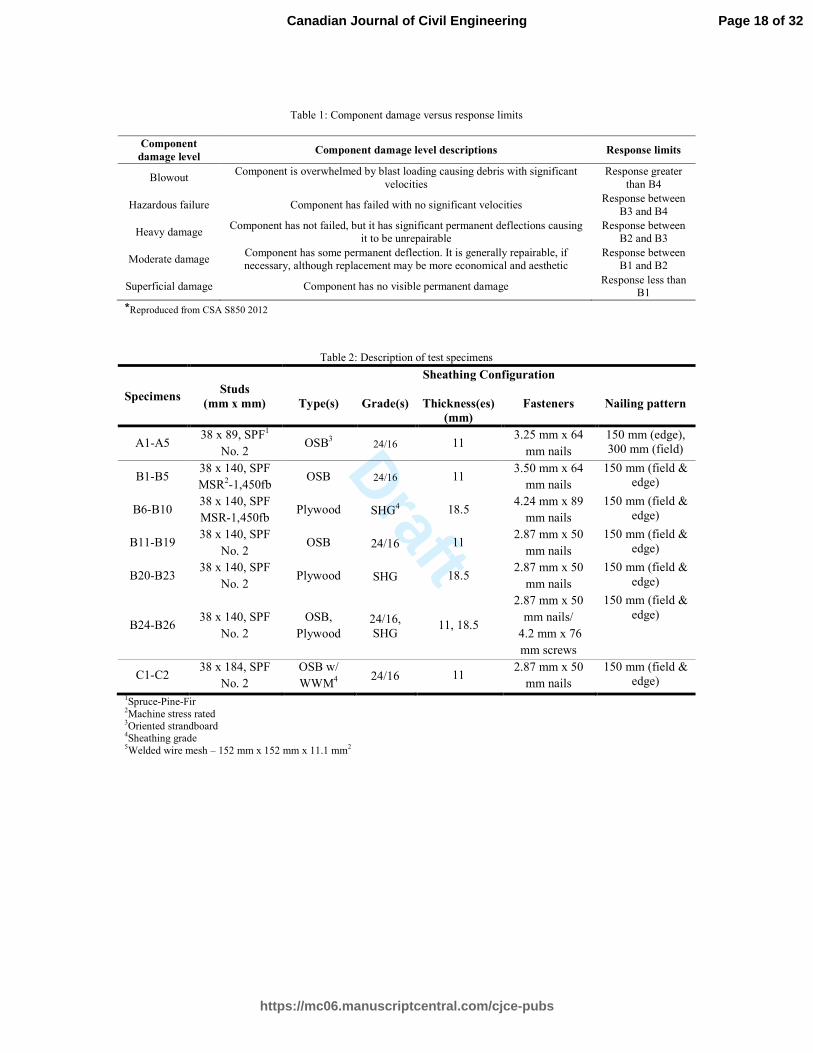
Table 1: Component damage versus response limits
Component
damage level Component damage level descriptions Response limits
Blowout Component is overwhelmed by blast loading causing debris with significant
velocities
Response greater
than B4
Hazardous failure Component has failed with no significant velocities Response between
B3 and B4
Heavy damage Component has not failed, but it has significant permanent deflections causing
it to be unrepairable
Response between
B2 and B3
Moderate damage Component has some permanent deflection. It is generally repairable, if
necessary, although replacement may be more economical and aesthetic
Response between
B1 and B2
Superficial damage Component has no visible permanent damage Response less than
B1
*Reproduced from CSA S850 2012
Table 2: Description of test specimens
Specimens Studs
(mm x mm)
Sheathing Configuration
Type(s)
Grade(s)
Thickness(es)
(mm)
Fasteners
Nailing pattern
A1-A5 38 x 89, SPF1
No. 2 OSB
3 24/16 11
3.25 mm x 64
mm nails
150 mm (edge),
300 mm (field)
B1-B5 38 x 140, SPF
MSR2-1,450fb OSB 24/16 11 3.50 mm x 64
mm nails
150 mm (field &
edge)
B6-B10 38 x 140, SPF
MSR-1,450fb Plywood SHG4 18.5
4.24 mm x 89
mm nails
150 mm (field &
edge)
B11-B19 38 x 140, SPF
No. 2 OSB 24/16 11
2.87 mm x 50
mm nails
150 mm (field &
edge)
B20-B23 38 x 140, SPF
No. 2 Plywood SHG 18.5
2.87 mm x 50
mm nails
150 mm (field &
edge)
B24-B26 38 x 140, SPF
No. 2
OSB,
Plywood
24/16,
SHG 11, 18.5
2.87 mm x 50
mm nails/
4.2 mm x 76
mm screws
150 mm (field &
edge)
C1-C2 38 x 184, SPF
No. 2
OSB w/
WWM4
24/16 11 2.87 mm x 50
mm nails
150 mm (field &
edge)
1Spruce-Pine-Fir
2Machine stress rated
3Oriented strandboard
4Sheathing grade
5Welded wire mesh – 152 mm x 152 mm x 11.1 mm
2
Page 18 of 32
https://mc06.manuscriptcentral.com/cjce-pubs
Canadian Journal of Civil Engineering

Draft
Table 3: Proposed damage level criteria for light-frame wood stud walls
Component
damage level Proposed component damage level descriptions
Response
limits
Blowout
-Sheathing overwhelmed, and sheathing debris detached from the structure with
significant velocities. Studs may or may not be damaged
-Majority of studs failed. Complete loss of axial capacity. Debris with significant
velocities created.
Response greater than B3
Hazardous
-Three or more adjacent stud failure with cracks extending to 50% or more of the stud
depth. Debris is limited to small sized pieces of sheathing and/or stud fragments that
have detached from the structural system with no significant velocities.
Response
between B2 and
B3
Moderate-heavy -No more than two adjacent or three non-adjacent studs with cracks extending to 50%
or more of the stud depth.
Response
between B1 and
B2
Superficial -No more than one stud with cracks extending to 50% of the stud depth. No debris. Response less
than B1
Page 19 of 32
https://mc06.manuscriptcentral.com/cjce-pubs
Canadian Journal of Civil Engineering

Draft
Table 4: Normalized dynamic test results
Test name Pbar
Ibar
Damage level Test name Pbar
Ibar
Damage level
A1-1 0.70 1.03 Superficial B9-1 0.24 0.92 Superficial
A2-1 1.13 1.46 Moderate-Heavy B9-2 0.92 3.67 Moderate-Heavy
A3-1 0.63 0.90 Superficial B10-1 0.29 1.12 Superficial
A3-2 0.68 1.00 Superficial B10-2 0.71 2.11 Superficial
A4-1 0.61 0.76 Superficial B10-3 0.89 3.25 Moderate-Heavy
A4-2 1.20 1.53 Moderate-Heavy B11-1 0.40 1.46 Superficial
A5-1 0.90 1.51 Superficial B11-2 1.57 4.63 Blowout
B1-1 N/A* N/A* Superficial B12-1 1.35 4.02 Blowout
B1-2 0.74 3.00 Moderate-Heavy B13-1 1.46 4.24 Blowout
B2-1 0.88 3.12 Moderate-Heavy B14-1 1.63 4.62 Blowout
B3-1 0.25 0.20 Superficial B15-1 1.28 4.39 Blowout
B3-2 1.32 1.38 Moderate-Heavy B16-1 1.08 3.87 Blowout
B4-1 0.15 0.57 Superficial B17-1 1.14 3.88 Blowout
B4-2 0.65 2.10 Superficial B18-1 1.17 4.13 Blowout
B4-3 0.95 3.13 Moderate-Heavy B19-1 1.13 5.56 Blowout
B5-1 0.25 1.45 Superficial B20-1 1.34 4.56 Blowout
B5-2 0.66 3.76 Superficial B21-1 1.32 4.65 Blowout
B6-1 0.25 1.04 Superficial B22-1 1.34 4.61 Blowout
B6-2 0.72 2.92 Superficial B23-1 1.39 4.94 Blowout
B6-3 0.75 3.32 Moderate-Heavy B24-1 1.33 4.16 Blowout
B7-1 0.25 1.76 Superficial B25-1 1.75 5.39 Blowout
B7-2 0.79 6.33 Moderate-Heavy B26-1 1.90 5.65 Blowout
B8-1 0.27 0.23 Superficial C1-1 1.02 4.20 Hazardous
B8-2 1.54 1.60 Moderate-Heavy C2-1 1.26 4.97 Blowout
* Data acquisition malfunctioned during testing
Page 20 of 32
https://mc06.manuscriptcentral.com/cjce-pubs
Canadian Journal of Civil Engineering

Draft
List of Figures
Figure 1: Shock tube test setup with specimen
(a): Front view
(b): Side view
Figure 2: Dynamic test setup
(a): Test specimen mounted on shock tube end frame
(b): Close-up of boundary conditions
Figure 3: Representative full-scale OSB wall static test
Figure 4: Different flexural failure modes
(a): Static loading
(b): Brash dynamic failure
(c): Dynamic of specimen with strong tension side
Figure 5: Typical displacement and pressure-time history
Figure 6: Representative damage level
(a): Superficial
(b): Moderate-Heavy
(c): Hazardous
(d): Blowout
Figure 7: Scaled data from experimental tests
Figure 8: Scaled pressure-impulse diagram with CSA S850 response limits
Figure 9: Scaled pressure-impulse diagram with proposed response limits
Page 21 of 32
https://mc06.manuscriptcentral.com/cjce-pubs
Canadian Journal of Civil Engineering

Draft
(a)
(b)
Page 22 of 32
https://mc06.manuscriptcentral.com/cjce-pubs
Canadian Journal of Civil Engineering

Draft
Page 23 of 32
https://mc06.manuscriptcentral.com/cjce-pubs
Canadian Journal of Civil Engineering
Draft
(a) (b)
Page 24 of 32
https://mc06.manuscriptcentral.com/cjce-pubs
Canadian Journal of Civil Engineering
Draft
0
5
10
15
20
25
0 20 40 60 80 100 120 140
Force (KN)
Displacement (mm)
Stud 2 Stud 3 Stud 4 Stud 5
µ = 1 µ = 2 µ = 3 µ = 4
Page 25 of 32
https://mc06.manuscriptcentral.com/cjce-pubs
Canadian Journal of Civil Engineering
Draft
(a)
(b) (c)
Page 26 of 32
https://mc06.manuscriptcentral.com/cjce-pubs
Canadian Journal of Civil Engineering
Draft
-8
-4
0
4
8
12
-10
-5
0
5
10
15
-10 0 10 20 30 40 50 60 70 80
Reflected Pressure (kPa)
Displacement (mm)
Time (ms)
Stud 2
Stud 3
Stud 4
Stud 5
Pressure
Page 27 of 32
https://mc06.manuscriptcentral.com/cjce-pubs
Canadian Journal of Civil Engineering

Draft
(a) (b)
(c) (d)
Page 28 of 32
https://mc06.manuscriptcentral.com/cjce-pubs
Canadian Journal of Civil Engineering

Draft
0.1
1
10
0.1 1 10
Pbar
Ibar
Superficial
Moderate/Heavy
Hazardous
Blowout
Page 29 of 32
https://mc06.manuscriptcentral.com/cjce-pubs
Canadian Journal of Civil Engineering

Draft
0.1
1
10
0.1 1 10
Pb
ar
Ibar
B1
B2
B3
B4
Superficial
Moderate/Heavy
Hazardous
Blowout
Page 30 of 32
https://mc06.manuscriptcentral.com/cjce-pubs
Canadian Journal of Civil Engineering

Draft
0.1
1
10
0.1 1 10
Pbar
Ibar
B1
B2
B3
Superficial
Moderate/Heavy
Hazazrdous
Blowout
Page 31 of 32
https://mc06.manuscriptcentral.com/cjce-pubs
Canadian Journal of Civil Engineering

Draft
Table A.1: Dynamic test results 1
Test name Pr
(kPa)
Ir
(kPa-ms)
K
(kN/m)
Ru
(kN)
m
(kg)
Test name Pr
(kPa)
Ir
(kPa-ms)
K
(kN/m)
Ru
(kN)
m
(kg)
A1-1 8.0 62.7 226 9.5 9.7 B9-1 11.0 122.2 1175 37.8 12.8
A2-1 13.0 89.5 226 9.5 9.7 B9-2 42.1 450.4 1175 37.8 12.8
A3-1 7.2 55.3 226 9.5 9.7 B10-1 12.5 160.3 925 36.0 12.8
A3-2 7.8 61.3 226 9.5 9.7 B10-2 31.0 302.0 925 36.0 12.8
A4-1 7.0 46.4 226 9.5 9.7 B10-3 38.7 427.9 925 36.0 12.8
A4-2 13.8 93.8 226 9.5 9.7 B11-1 13.7 140.0 1084 28.5 10.7
A5-1 13.7 100.9 329 12.5 9.7 B11-2 54.2 408.1 1084 28.5 10.7
B1-1 N/A* N/A* 1125 42.5 11.6 B12-1 46.5 354.5 1084 28.5 10.7
B1-2 38.3 403.0 1125 42.5 11.6 B13-1 50.5 373.5 1084 28.5 10.7
B2-1 38.2 384.9 940 35.7 11.6 B14-1 56.4 407.0 1084 28.5 10.7
B3-1 9.8 25.1 875 33.0 11.6 B15-1 44.3 387.3 1084 28.5 10.7
B3-2 52.6 163.0 875 33.0 11.6 B16-1 37.3 341.5 1084 28.5 10.7
B4-1 6.6 76.1 980 36.5 11.6 B17-1 39.5 342.2 1084 28.5 10.7
B4-2 28.9 282.3 980 36.5 11.6 B18-1 40.3 364.4 1084 28.5 10.7
B4-3 41.9 386.5 980 36.5 11.6 B19-1 39.1 377.4 1830 28.5 10.7
B5-1 11.6 207.0 985 39.0 11.6 B20-1 48.1 429.0 1145 29.7 11.9
B5-2 31.3 495.1 985 39.0 11.6 B21-1 47.3 437.0 1145 29.7 11.9
B6-1 11.5 128.1 1350 37.5 12.8 B22-1 48.3 434.0 1145 29.7 11.9
B6-2 32.6 331.5 1350 37.5 12.8 B23-1 49.8 465.0 1145 29.7 11.9
B6-3 34.1 377.6 1350 37.5 12.8 B24-1 49.7 481.0 1200 30.8 17.5
B7-1 12.6 245.7 1325 42.0 12.8 B25-1 65.1 623.0 1200 30.8 17.5
B7-2 40.1 813.2 1325 42.0 12.8 B26-1 70.9 654.0 1200 30.8 17.5
B8-1 9.5 27.3 925 29.5 12.8 C1-1 51.2 483.0 1881 41.5 15.0
B8-2 55.0 172.6 925 29.5 12.8 C2-1 63.4 572.0 1881 41.5 15.0
* Data acquisition malfunctioned during testing 2
Page 32 of 32
https://mc06.manuscriptcentral.com/cjce-pubs
Canadian Journal of Civil Engineering