Embed Size (px)
Citation preview
RESPONSE ACTION CONTRACT FORREMEDIAL, ENFORCEMENT OVERSIGHT, AND
NONTIME-CRITICAL REMOVAL ACTIVITIESIN REGION 6
MARION PRESSURE TREATING COMPANY SUPERFUND SITEFEASIBILITY STUDY
TECHNICAL MEMORANDUM
Prepared for
U.S. Environmental Protection Agency1445 Ross Avenue
Dallas, TX 75202-2733
Work Assignment No.EPA RegionDate PreparedContract No.Prepared byTelephoneEPA Remedial Project ManagerTelephone
031-RICO-067Z6July 3, 200168-W6-0037Tetra Tech EM me.(214) 740-2029Mr. Bartolome J. Canellas(214) 665-6662
S:\RAC\ODA031 \TECH_MEMO\tech_4.wpd
CONTENTS
Section
ACRONYMS AND ABBREVIATIONS . . . . . . . . . . . . . . . . . . . . . . . . . . . . . . . . . . . . . . . . . . . . . . . . . v
1.0 I N T R O D U C T I O N . . . . . . . . . . . . . . . . . . . . . . . . . . . . . . . . . . . . . . . . . . . . . . . . . . . . . . . . . . . . . 1
1.1 PURPOSE AND ORGANIZATION OF THE REPORT . . . . . . . . . . . . . . . . . . . . . . . . 11.2 SITE BACKGROUND . . . . . . . . . . . . . . . . . . . . . . . . . . . . . . . . . . . . . . . . . . . . . . . . . . 2
1.2.1 Site Location and Description . . . . . . . . . . . . . . . . . . . . . . . . . . . . . . . . . . . . . . 31.2.2 Site Ownership . . . . . . . . . . . . . . . . . . . . . . . . . . . . . . . . . . . . . . . . . . . . . . . . . . 61.2.3 Site History . . . . . . . . . . . . . . . . . . . . . . . . . . . . . . . . . . . . . . . . . . . . . . . . . . . . . 6
1.3 SITE PHYSICAL CHARACTERISTICS . . . . . . . . . . . . . . . . . . . . . . . . . . . . . . . . . . . . 8
1.3.1 G e o g r a p h y . . . . . . . . . . . . . . . . . . . . . . . . . . . . . . . . . . . . . . . . . . . . . . . . . . . . . . 81.3.2 Demography . . . . . . . . . . . . . . . . . . . . . . . . . . . . . . . . . . . . . . . . . . . . . . . . . . . . 81.3.3 Land Use . . . . . . . . . . . . . . . . . . . . . . . . . . . . . . . . . . . . . . . . . . . . . . . . . . . . . . . 91.3.4 Meteorology . . . . . . . . . . . . . . . . . . . . . . . . . . . . . . . . . . . . . . . . . . . . . . . . . . . . 91.3.5 Surface-Water Hydrology . . . . . . . . . . . . . . . . . . . . . . . . . . . . . . . . . . . . . . . . . 101.3.6 Local Ground Water Usage . . . . . . . . . . . . . . . . . . . . . . . . . . . . . . . . . . . . . . . 10
1.3.6.1 Registered Water Well Inventory . . . . . . . . . . . . . . . . . . . . . . . . . . . . 111.3.6.2 Door-to-Door Water Well Survey . . . . . . . . . . . . . . . . . . . . . . . . . . . . 11
1.3.7 Regional Geology/Hydrogeology . . . . . . . . . . . . . . . . . . . . . . . . . . . . . . . . . . . 11
1.3.7.1 Site Geology . . . . . . . . . . . . . . . . . . . . . . . . . . . . . . . . . . . . . . . . . . . . 111.3.7.2 Site Hydrogeology . . . . . . . . . . . . . . . . . . . . . . . . . . . . . . . . . . . . . . . . 121.3.7.3 hi Situ Hydraulic Conductivity Tests . . . . . . . . . . . . . . . . . . . . . . . . . 121.3.7.4 Ground Water Flow Velocity Estimates . . . . . . . . . . . . . . . . . . . . . . . 12
1.3.8 Soils . . . . . . . . . . . . . . . . . . . . . . . . . . . . . . . . . . . . . . . . . . . . . . . . . . . . . . . . . 131.3.9 Ecology . . . . . . . . . . . . . . . . . . . . . . . . . . . . . . . . . . . . . . . . . . . . . . . . . . . . . . . 13
2.0 NATURE AND EXTENT OF CONTAMINATION . . . . . . . . . . . . . . . . . . . . . . . . . . . . . . . . . 13
3.0 HUMAN HEALTH RISK ASSESSMENT CONCLUSIONS . . . . . . . . . . . . . . . . . . . . . . . . . . 15
3.1 NONCANCER RISK . . . . . . . . . . . . . . . . . . . . . . . . . . . . . . . . . . . . . . . . . . . . . . . . . . . 183.2 CANCER RISK . . . . . . . . . . . . . . . . . . . . . . . . . . . . . . . . . . . . . . . . . . . . . . . . . . . . . . . 183.3 HUMAN HEALTH RISK ASSESSMENT SUMMARY . . . . . . . . . . . . . . . . . . . . . . . 21
S:\RAC\ODA031 \TECH_MEMO\tech_4.wpd 1

CONTENTS (Continued)
Section Page
3.4 PRELIMINARY REMEDIATION GOALS . . . . . . . . . . . . . . . . . . . . . . . . . . . . . . . . . 23
3.4.1 Direct Exposure PRGs . . . . . . . . . . . . . . . . . . . . . . . . . . . . . . . . . . . . . . . . . . . 233.4.2 Site-Specific Ground Water Protection PRGs . . . . . . . . . . . . . . . . . . . . . . . . . 25
3.4.2.1 Approach . . . . . . . . . . . . . . . . . . . . . . . . . . . . . . . . . . . . . . . . . . . . 253.4.2.2 Findings Regarding Big Creek Residual Source Area . . . . . . . . . 293.4.2.3 Findings Regarding Grid System Residual Source Area . . . . . . . 323.4.2.4 Findings Regarding Consolidation Area Residual Source Area . . 33
3.5 OTHER FINDINGS . . . . . . . . . . . . . . . . . . . . . . . . . . . . . . . . . . . . . . . . . . . . . . . . . . . . 34
3.5.1 Backfilled Impoundment Area . . . . . . . . . . . . . . . . . . . . . . . . . . . . . . . . . . . . . 343.5.2 Debris Contained Within the Consolidation Area . . . . . . . . . . . . . . . . . . . . . . 343.5.3 Surface Debris Containing Creosote . . . . . . . . . . . . . . . . . . . . . . . . . . . . . . . . 343.5.4 Surface Debris—Vegetation and Logging Debris . . . . . . . . . . . . . . . . . . . . . . 343.5.5 Surface Debris—Metal Scrap and Abandoned Equipment . . . . . . . . . . . . . . . 353.5.6 Former Site Office and Storage Sheds . . . . . . . . . . . . . . . . . . . . . . . . . . . . . . . 35
4.0 PRESUMPTIVE REMEDY APPROACH FOR WOOD TREATER SITES . . . . . . . . . . . . . . 35
5.0 REMEDIAL ACTION OBJECTIVES AND ARARS . . . . . . . . . . . . . . . . . . . . . . . . . . . . . . . . 36
5.1 REMEDIAL ACTION OBJECTIVES . . . . . . . . . . . . . . . . . . . . . . . . . . . . . . . . . . . . . 365.2 APPLICABLE OR RELEVANT AND APPROPRIATE REQUIREMENTS . . . . . . . 37
6.0 IDENTIFICATION OF GENERAL RESPONSE ACTIONS AND TECHNOLOGIES . . . . . . 40
6.1 GENERAL RESPONSE ACTIONS . . . . . . . . . . . . . . . . . . . . . . . . . . . . . . . . . . . . . . . 416.2 TECHNOLOGY IDENTIFICATION . . . . . . . . . . . . . . . . . . . . . . . . . . . . . . . . . . . . . . 41
7.0 SCREENING OF TECHNOLOGIES . . . . . . . . . . . . . . . . . . . . . . . . . . . . . . . . . . . . . . . . . . . . . 47
7.1 EVALUATION CRITERIA . . . . . . . . . . . . . . . . . . . . . . . . . . . . . . . . . . . . . . . . . . . . . 477.2 TECHNOLOGY EVALUATION . . . . . . . . . . . . . . . . . . . . . . . . . . . . . . . . . . . . . . . . . 48
7.2.1 Soil, Sediment, and Sludge Treatment General Response ActionTechnologies . . . . . . . . . . . . . . . . . . . . . . . . . . . . . . . . . . . . . . . . . . . . . . . . . . . 48
7.2.1.1 Bioremediation . . . . . . . . . . . . . . . . . . . . . . . . . . . . . . . . . . . . . . . 487.2.1.2 Thermal Desorption . . . . . . . . . . . . . . . . . . . . . . . . . . . . . . . . . . . 527.2.1.3 Incineration . . . . . . . . . . . . . . . . . . . . . . . . . . . . . . . . . . . . . . . . . . 53
S:\RAC\ODA03 l\TECH_MEMO\tech_4.wpd ii

CONTENTS (Continued)
Section Page
7.2.2 Soil, Sediment, and Sludge Containment General Response ActionTechnologies . . . . . . . . . . . . . . . . . . . . . . . . . . . . . . . . . . . . . . . . . . . . . . . . . . . 54
7.2.3 DNAPL Containment General Response Action Technologies . . . . . . . . . . . . 557.2.4 DNAPL Treatment General Response Action Technologies . . . . . . . . . . . . . . 56
7.2.4.1 Bioremediation . . . . . . . . . . . . . . . . . . . . . . . . . . . . . . . . . . . . . . . 567.2.4.2 In Situ Thermal Desorption . . . . . . . . . . . . . . . . . . . . . . . . . . . . . . 587.2.4.3 Extraction and Off-Site Incineration . . . . . . . . . . . . . . . . . . . . . . . 58
7.2.5 Debris Disposal General Response Action Technology . . . . . . . . . . . . . . . . . . 61
8.0 SUMMARY . . . . . . . . . . . . . . . . . . . . . . . . . . . . . . . . . . . . . . . . . . . . . . . . . . . . . . . . . . . . . . . . 62
REFERENCES . . . . . . . . . . . . . . . . . . . . . . . . . . . . . . . . . . . . . . . . . . . . . . . . . . . . . . . . . . . . . . . . . . . . . 63
Appendix
A CALCULATIONS SHOWING SITE-SPECIFIC SOIL^i VALUES
Attachments
A STORK SOUTHWESTERN LABORATORY REPORTS SOIL CHARACTERISTICS
B LDEQ RECAP GUIDANCE FOR DETERMINING SOIL CONCENTRATIONS PROTECTIVEOF GROUND WATER
C LDEQ RECAP STANDARDS FOR GROUND WATER
S:\RAC\ODA03 l\TECH_MEMO\tech_4.wpd iii

TABLES
Table
1 RECEPTOR AND EXPOSURE MEDIA/PATHWAYS ADDRESSED IN HUMAN HEALTHRISK ASSESSMENT . . . . . . . . . . . . . . . . . . . . . . . . . . . . . . . . . . . . . . . . . . . . . . . . . . . . . . . . . 17
2 NONCANCER HAZARD INDEX SUMMARY . . . . . . . . . . . . . . . . . . . . . . . . . . . . . . . . . . . . 193 CARCINOGENIC RISK SUMMARY . . . . . . . . . . . . . . . . . . . . . . . . . . . . . . . . . . . . . . . . . . . . 204 DIRECT EXPOSURE PRELIMINARY REMEDIATION GOALS . . . . . . . . . . . . . . . . . . . . . 245 DIRECT EXPOSURE PRELIMINARY REMEDIATION GOAL, REMEDIAL LOCATIONS,
AND DEPTHS . . . . . . . . . . . . . . . . . . . . . . . . . . . . . . . . . . . . . . . . . . . . . . . . . . . . . . . . . . . . . . 266 SITE-SPECIFIC GROUND WATER PROTECTION PRELIMINARY REMEDIATION
GOALS . . . . . . . . . . . . . . . . . . . . . . . . . . . . . . . . . . . . . . . . . . . . . . . . . . . . . . . . . . . . . . . . . . . . 277 GROUND WATER PROTECTION PRELIMINARY REMEDIATION GOAL, REMEDIAL
LOCATIONS, AND DEPTHS . . . . . . . . . . . . . . . . . . . . . . . . . . . . . . . . . . . . . . . . . . . . . . . . . . 288 ESTIMATED QUANTITIES OF MEDIA TO BE REMEDIATED . . . . . . . . . . . . . . . . . . . . . 389 EVALUATION OF PROCESS OPTIONS . . . . . . . . . . . . . . . . . . . . . . . . . . . . . . . . . . . . . . . . 42
FIGURES
Figure Page
1 SITE LOCATION MAP . . . . . . . . . . . . . . . . . . . . . . . . . . . . . . . . . . . . . . . . . . . . . . . . . . . . . . . . 42 SITE PLAN MAP . . . . . . . . . . . . . . . . . . . . . . . . . . . . . . . . . . . . . . . . . . . . . . . . . . . . . . . . . . . . . 53 PROPERTY OWNERSHIP MAP . . . . . . . . . . . . . . . . . . . . . . . . . . . . . . . . . . . . . . . . . . . . . . . . 74 MONITORING WELL LOCATION MAP . . . . . . . . . . . . . . . . . . . . . . . . . . . . . . . . . . . . . . . . 145 SOIL AND SEDIMENT SAMPLE LOCATIONMAP . . . . . . . . . . . . . . . . . . . . . . . . . . . . . . . 166 GROUND WATER PROTECTION MAP . . . . . . . . . . . . . . . . . . . . . . . . . . . . . . . . . . . . . . . . . 227 B(A)P EQUIVALENT EXCEEDING DIRECT EXPOSURE PRGs MAP . . . . . . . . . . . . . . . . 308 PROPOSED EXCAVATION PLAN . . . . . . . . . . . . . . . . . . . . . . . . . . . . . . . . . . . . . . . . . . . . . 31
S:\RAC\ODA031 \TECH_MEMO\tech_4.wpd iv

ACRONYMS AND ABBREVIATIONS
AAEE American Academy of Environmental EngineersAPC Air pollution controlARAR Applicable or relevant and appropriate requirementB(a)P Benzo(a)pyrenebgs Below ground surfaceCERCLA Comprehensive Environmental Response, Compensation, and Liability ActCOPC Contaminant of potential concerncy Cubic yardDCLGS Department of Conservation, Louisiana Geological SurveyDNAPL Dense nonaqueous-phase liquidDVECO Degree of Vulnerability Economic StatusDVMAV Degree of Vulnerability Minority StatusE&E Ecology and Environment, me.EJ Environmental JusticeEPA U.S. Environmental Protection AgencyERA Ecological risk assessmentFS Feasibility studyESI Expanded site investigationft Footft/ft Foot per footGRA General response actionHHRA Human health risk assessmentHRW Horizontal recovery wellIASD Inactive and Abandoned Sites DivisionLAC Louisiana Administrative CodeLDEQ Louisiana Department of Environmental QualityLDOTD Louisiana Department of Transportation and DevelopmentLTTD Low-temperature thermal desorptionmg/kg Milligram per kilogramMNA Monitored natural attenuationMPTC Marion Pressure Treating CompanyNAPL Non aqueous-phase liquidNCP National Oil and Hazardous Substances Pollution Contingency PlanNPL National Priorities ListPAH Polycyclic aromatic hydrocarbonPF Population factorPRG Preliminary remediation goalPOTW Publicly-owned treatment worksPPE Personal protective equipmentPVC Polyvinyl chlorideRAO Remedial action objectiveRCRA Resource Conservation and Recovery ActRECAP Risk evaluation/corrective action programRF Radio frequencyRI Remedial investigationRI/FS Remedial investigation/feasibility study
S:\RAC\ODA031 \TECH_MEMO\tech_4.wpd V

ACRONYMS AND ABBREVIATIONS (Continued)
RME Reasonable maximum exposureSARA Superfund Amendments and Reauthorization ActSITE Superfund Innovative Technology EvaluationSLERA Screening level ecological risk assessmentSOW Statement of workSTART Superfund Technical Assessment and Response TeamSVE Soil vapor extractionSVOC Semivolatile organic compoundTAL Target analyte listTAT Technical Assistance TeamTetra Tech Tetra Tech EM me.UCL Upper confidence levelUSDA U.S. Department of AgricultureU.S. DoD U.S. Department of DefenseUSGS U.S. Geological SurveyVOC Volatile organic compoundVRW Vertical recovery well
S:\RAC\ODA03 l\TECH_MEMO\tech_4.wpd VI

1.0 INTRODUCTION
Under the Response Action Contract (68-W6-0037), the U.S. Environmental Protection Agency (EPA)issued work assignment number 031-RICO-067Z to Tetra Tech EM Inc. (Tetra Tech). The EPA
statement of work (SOW) required a feasibility study (FS) for the Marion Pressure Treating Company
(MPTC) Superfund site in Marion, Union Parish, Louisiana. The first deliverable in the FS process isthis technical memorandum, which presents the framework for the subsequent FS report.
1.1 PURPOSE AND ORGANIZATION OF THE REPORT
The purpose of the remedial investigation and feasibility study (RI/FS) process is to (1) characterize thenature and extent of contamination at the particular site, (2) evaluate potential risks to human health and
the environment, and (3) evaluate potential remedial alternatives. The FS portion of the process
evaluates the feasibility of potential presumptive remedy remedial alternatives to achieve risk-basedremedial action levels for the contaminants of potential concern (COPC) at the site.
The FS for the MPTC site will be developed in accordance with the Comprehensive Environmental
Response, Compensation, and Liability Act (CERCLA) as promulgated under the National Oil andHazardous Substances Pollution Contingency Plan (NCP) of November 20, 1985 (50 Federal
Register 47973); the Superfund Amendments and Reauthorization Act (SARA) of October 17, 1986; andthe amended NCP of March 8, 1990 (55 Federal Register 8666). The general framework of thisdocument is based on EPA policy directives: "Presumptive Remedies: Policies and Procedures"(EPA 1993); "Presumptive Remedies for Soils, Sediments, and Sludges at Wood Treater Sites"(EPA 1995); and the guidance document entitled "Guidance for Conducting Remedial Investigations andFeasibility Studies Under CERCLA" (EPA 1988a).
According to the NCP, the primary objectives of the FS are as follows:
• Develop appropriate remedial action levels based on federal and state chemical-specificand location-specific applicable or relevant and appropriate requirements (ARAR).
• Identify presumptive remedy remedial technologies and alternatives, when appropriate,that are available to (1) reduce concentrations ofCOPCs based on known site
S:\RAC\ODA031 \TECH_MEMO\tech_4.wpd 1

characteristics, and (2) target remedial action objectives (RAO) and preliminaryremediation goals (PRG).
• Screen the identified technologies and assemble and conduct a detailed evaluation of theremedial alternatives.
• Identify action-specific ARARs for the implementation of the retained alternatives.
• Identify technologically feasible and cost-effective remedial alternatives that attaininstitutional and regulatory requirements.
This technical memorandum provides a conceptual review of alternatives and is intended to develop arepresentative framework for evaluating the potential presumptive remedy remedial alternatives
applicable to the MPTC site. The FS report will include a detailed analysis of the presumptive remedy
remedial alternatives.
This technical memorandum is organized according to the requirements ofEPA's SOW and followingthe format suggested by EPA (EPA 1988a). Section 1.2 summarizes information regarding the sitebackground. Section 1.3 summarizes information regarding the site physical characteristics. Section 2.0summarizes the nature and extent of contamination at the site. Section 3.0 presents the human health risk
assessment (HHRA) conclusions. Section 4.0 presents the rationale and documentation for implementingthe EPA presumptive remedy approach for wood treater sites. Section 5.0 presents RAOs and ARARs.Section 6.0 presents the identification of general response actions and technologies applicable to the
MPTC site. Section 7.0 presents the screening of the technologies identified in Section 6.0.
1.2 SITE BACKGROUND
The background information for the MPTC site was obtained from the RI report and associated
references previously submitted by Tetra Tech. The site background includes the site location anddescription, and a summary of the site, the site history, and investigations conducted prior to the RI.
S:\RAC\ODA03 l\TECH_MEMO\tech_4.wpd 2

1.2.1 Site Location and Description
The MPTC site covers approximately 22 acres and is located in a rural area northwest of Marion,
Union Parish, Louisiana (Figure 1). The site is located about 14 miles northeast of Farmersville and
35 miles northwest ofMonroe, Louisiana.
The site is located on the east side of State Highway 551 about 0.5 mile north of the intersection of State
Highway 551 and State Highway 33. It is in the northwest quarter of the southwest quarter of Section 10,
Township 22 North, Range 2 East, Union Parish, Louisiana. The geographical coordinates of the site arelatitude 32°54' 29" and longitude 92°15'14".
The property is surrounded by forest to the north, west, and south. Wetlands are located to the east andsoutheast. Residential properties are located west and south of the site along State Highway 551.
Big Creek is located east of the property, and an unnamed tributary to Big Creek is west of the property.
The former wood treating operational area drains (1) to the east towards Big Creek through drainage
gullies collectively called the East Drainage Ditch, and (2) to the west towards the gullies collectivelycalled the West Drainage Ditch.
An abandoned building, tanker trailer, and wastewater treatment sump are the only known structures
remaining from past wood treating operations. During an EPA removal action, polycyclic aromatic
hydrocarbon (PAH)-contaminated soil was consolidated in an on-site area (Consolidation Area) and
capped. The Consolidation Area measures about 280 feet by 210 feet and is surrounded by a fence
(Ecology and Environment, me. [E&E] 1999). m addition, two PAH-contaminated waste piles are
located 200 to 300 feet south of the property boundary (Louisiana Department of Environmental Quality[LDEQ] 1999). These features are shown on Figure 2, which presents the current site layout. During the
RI, a fence was constructed around the perimeter of the site to restrict access to the site. The location of
the fence is also shown on Figure 2.
S :\RAC\ODA031 \TECH_MEMO\tech_4.wpd 3

500_____0_____500____1000 Feet
MARION PRESSURE TREATING COMPANY_______MARION, LOUISIANA
FIGURE 1SITE LOCATION MAP
PREPARED FOR: BY ^^^^
J2.FPA S3^UF —— • 1^' Tetni TeA EM Inc

100______0______100_____200 Feet
MARION PRESSURE TREATING COMPANY_______MARION, LOUISIANA
FIGURE 2SITE PLAN
J2.FPA S3W Sum • ^^k Trta Tacli EM Inc

1.2.2 Site Ownership
MPTC was owned and operated by Mr. Bobby L. Green from November 1, 1964, to May 8, 1990.
Mr. Green also served as MPTC's president. Between 1964 and 1984, partial ownership of the original
site had been divided between H.D. Green, Daniel Green, Bobby L. Green, and Brooks Jones.
Mr. Bobby L. Green sold the original site property to MPTC on August 17, 1984. Through property tax
forfeiture and sales, the original site has passed through various owners. Currently the original site is
owned by Daniel Green, Mary Virginia Green Jones, and Bobby L. Green. The current owners and
surrounding property owners are depicted on Figure 3.
1.2.3 Site History
MPTC began operations on November 1, 1964. MPTC produced pressure-treated wood products,
including poles, bridge pilings, fence posts, and other lumber. The former site layout is shown on
Figure 2. Creosote was reported to be the only wood preservative used during the wood treatment
process (E&E 1995a and 1995b).
From 1964 to 1985, a 15,000-square-foot, unlined surface impoundment (the former impoundment) was
used to dispose of process wastewater. The former impoundment was regulated under the Resource
Conservation and Recovery Act (RCRA) and was described as a two-celled, hourglass-shaped unit,
approximately 80 feet wide by 240 feet long. The depth of the former impoundment is not known, but is
estimated to have been between 2.5 to 10 feet deep. During closure of the unit in 1985, (1) water in the
former impoundment was pumped to the on-site wastewater treatment system, (2) sediments were
excavated and transported off site for disposal, and (3) the former impoundment was backfilled with
approximately 1,450 cubic yards of loamy sand and graded to conform with the general topography of
the area (E&E 1995c). The impoundment was closed due to several unresolved LDEQ enforcement
actions against MPTC, including the lack ofpostclosure plans and ground water sampling plans, invalid
certification of clean closure, and other items (Roy F. Weston 1995).
Between September 1996 and March 1997, EPA performed a removal action at the MPTC site. These
activities included the off-site disposal of fluids and sludge stored in the tanks, decontamination,
dismantling and off-site disposal of the tanks and retort vessels at the site, excavation of contaminated
S:\RAC\ODA031 \TECH_MEMO\tech_4.wpd 6


soil, and placement of the contaminated soil in a capped Consolidation Area. Approximately
10,000 cubic yards of contaminated soil were excavated and placed into the Consolidation Area. The
contaminated soil was capped with a 2-foot thick clay cover and an 18-inch thick topsoil layer.
1.3 SITE PHYSICAL CHARACTERISTICS
This section discusses the physical characteristics of the site and surrounding areas, including geography,demography, land use, meteorology, surface-water hydrology, local ground water usage, geology and
hydrogeology, soils, and ecology.
1.3.1 Geography
The geographic coordinates of the site are latitude 32°54' 29" and longitude 92°15' 14". Big Creek, ashallow, perennial stream, meanders just east of the MPTC site through a corridor of old bottomlandhardwood forest that has been extensively logged (see Figure 2). The Unnamed Tributary, a shallow,
intermittent stream, flows through a forested (pine) area, then through a stretch of logged habitat, and
then through the old bottomland hardwood forest habitat. In 1999, the LDEQ performed an expandedsite investigation (ESI) that included a determination that the southern portion of the site, including the
Big Creek drainage area, is considered a wetland (LDEQ 1999).
1.3.2 Demography
The estimated population of Union Parish was 22,165 in 1999 (U.S. Census Bureau 2000). Thepopulation of Union Parish has increased 6.6 percent since 1990. m 1999, the estimated percentage of
the population under 18 years old was 26.4 percent, and the estimated percentage of the population65 years old and over was 14.2 percent. The City of Marion has an estimated population of 775
(EPA 2000a).
The MPTC site is located in a rural area of Union Parish. Residences are scattered along primary andsecondary roadways. Residences are also located west of the site on the west side of State Highway 551.
S:\RAC\ODA031 \TECH_MEMO\tech_4.wpd 8

1.3.3 Land Use
Union Parish has a total area of 578,900 acres, of which 16,200 acres is lakes, reservoirs, streams, and
other waterways (U.S. Department of Agriculture [USDA] 1997). Land use is 95 percent woodland and
5 percent agriculture or cropland (USDA 1997). The City of Marion has a total area of 2,056 acres.
MPTC is a former industrial facility with residential and rural property located adjacent to the site.
Undeveloped land is located north, east, and south of the site.
Reuse assessments/reuse plans are used to provide sufficient information in supporting and determining
reasonable anticipated future land uses at CERCLA sites. A reuse assessment generally results in the
identification of potential reuse (that is, residential, recreational, commercial, or industrial).
The City of Marion has expressed an interest in possibly converting the site into a public park in the
future. Although the potential for redevelopment as residential use can not be ignored, based on the prior
and current use of the site and the wishes of the City of Marion, the most likely future land use is either
for recreational purposes or industrial redevelopment.
1.3.4 Meteorology
A description of the climatic conditions for the site vicinity is based on data recorded for the town of
Bastrop, Louisiana, from 1949 to 1987 (USDA 1997). Bastrop, Louisiana, is located approximately
20 miles southeast of Marion.
The average total annual precipitation is 53 inches. Of this, 24.92 inches, or 47 percent, usually falls in
April through September. The heaviest 1-day rainfall during the period of record was 6 inches on
May 1, 1954. Thunderstorms occur about 60 days each year, and most occur in summer.
Prevailing winds are from the south. Average wind speed is highest (10 miles per hour) in the spring.
S:\RAC\ODA03 l\TECH_MEMO\tech_4.wpd 9

1.3.5 Surface-Water Hydrology
The main sources of surface water in Union Parish are the Ouachita River, Little Comey Bayou,
Bayou D'Arbonne, and Bayou de Loutre (USDA 1997). The average flow rate for Little Comey Bayouis 194 cubic feet per second, and the average flow rate for Bayou de Loutre is 171 cubic feet per second.The Ouachita River has an average flow rate of 17,600 cubic feet per second.
Surface water in Union Parish is mainly used for recreation. The portion of the Ouachita River below
Sterlington, Louisiana, is also used for industrial purposes and the transportation of cargo (USDA 1997).
The surface water features at the site consist of a drainage ditch on the east side of the site, which flows
to Big Creek, and a drainage ditch on the west side of the site, which flows to an unnamed tributary ofBig Creek (see Figure 2). Big Creek is a fresh water creek that flows to the south-southeast and parallelsthe MPTC eastern boundary. The Unnamed Tributary of Big Creek flows in a southerly direction,
parallel to the west property boundary, and enters Big Creek approximately 1,000 feet south of the site.
Big Creek intersects Bayou de Loutre approximately 7.5 miles south of the site. Bayou de Loutre isclassified as a natural and scenic stream and is used for recreational fishing.
1.3.6 Local Ground Water Usage
Residents of the City of Marion obtain drinking water from a public water supply system. The City ofMarion water system is supplied by two water wells that are approximately 600 feet deep and located
within a 1-mile radius of the MPTC site. The pubic supply wells are reported to be completed in the
Sparta Sand and Wilcox Sand Formation (Tetra Tech 2000a). The public supply wells are consideredhydraulically upgradient of the site. No organic or inorganic COPCs were detected in drinking water
samples collected during RI sampling events. As such, the City of Marion public water supply does not
appear to be impacted by the COPCs present at the MPTC site.
S:\RAC\ODA03 l\TECH_MEMO\tech_4.wpd 10

1.3.6.1 Registered Water Well Inventory
During the RI, Tetra Tech reviewed the registered water wells records of the Louisiana Department of
Transportation and Development (LDOTD), Water Resources Section to determine the location of
registered water wells within a '/2-mile radius of the site. No active water wells were found within the
area of interest.
1.3.6.2 Door-to-Door Water Well Survey
During the RI, Tetra Tech conducted a door-to-door water well survey within a '/2-mile radius of the site
to inventory water wells that may not have been registered with the LDOTD. Forty six private homes
were identified within a '/2-mile radius of the site, and 11 businesses were identified just beyond the
'/2-mile radius. No privately-owned water wells were identified during the door-to-door survey.
1.3.7 Regional Geology/Hydrogeology
Tetra Tech obtained information concerning the regional geology from the Department of Conservation
Louisiana Geological Survey (DCLGS) and Louisiana Department of Public Works, Water Resources of
Union Parish, Louisiana, Water Resources Bulletin No. 17 dated 1972 (DCLGS 1972). Based on a
review of this document, fresh water extends to a maximum depth of about 700 feet below sea level in
Union Parish. The fresh water-bearing units are Tertiary (Eocene) and Quaternary (Pleistocene and
Holocene) ages and are part of the D'Arbonne platform, a structural feature of slight regional dip. The
Tertiary formations containing freshwater are, in descending order, the Cockfield Formation, the Cook
Mountain Formation, and the Sparta Sand. The Quaternary beds consist of upland terrace deposits and
valley alluvium.
1.3.7.1 Site Geology
The site geology information was obtained from the previously installed monitoring wells and the RI
field activities (Tetra Tech 200 la). Based on the available data, the stratigraphy encountered generally
consists of a silty clay to clay from the ground surface to a depth varying from 9 to 43 feet below ground
surface (ft bgs) underlain by a silty sand to sand with discontinuous clay layers (Tetra Tech 200 la). The
S:\RAC\ODA031 \TECH_MEMO\tech_4.wpd 11

depth of the bottom of the silty sand to sand strata was not determined during the RI field activities. Themaximum depth of the site borings was 70 ft bgs.
1.3.7.2 Site Hydrogeology
To assess ground water potentiometric elevations and ground water flow direction, water level elevationdata was collected from the site monitoring wells during the RI (Tetra Tech 200 la).
Potentiometric elevations for the uppermost water-bearing zone indicate that ground water flows to the
west-southwest, with an average hydraulic gradient of approximately 0.005 foot per foot (ft/ft)(Tetra Tech 200 la).
1.3.7.3 In Situ Hydraulic Conductivity Tests
In situ hydraulic conductivity values were calculated for three site monitoring wells (MW-12, MW-13,and MW-14) using data from slug tests performed during the RI (Tetra Tech 200 la).
The calculated hydraulic conductivity values were as follows:
Hydraulic Conductivity
Monitoring Well ID Feet/Minute Centimeters/Second
MW-12 6.0 xl0-4 3.1xl0-4
MW-13 5.4 xl0-4 2.7 xl0-4
MW-14 4.8 xl0-4 2.4 xl0-4
1.3.7.4 Ground Water Flow Velocity Estimates
During the RI, the average linear ground water velocity was calculated for the uppermost water-bearing
zone monitored at the site (Tetra Tech 200 la).
Using Darcy's law, with an average hydraulic conductivity of 0.78 foot per day, an average hydraulicgradient of 0.005, and an assumed porosity of 0.35, the estimated linear ground water velocity of the
S:\RAC\ODA03 l\TECH_MEMO\tech_4.wpd 12

uppermost water-bearing zone is 0.01 foot per day or 4.1 feet per year. Application of this approach is
consistent with the literature (Freeze 1979).
1.3.8 Soils
According to the USDA Soil Survey of Union Parish, Louisiana (USDA 1997), site soils predominantly
consist of the Sawyer silt loam. The Sawyer silt loam is gently sloping and moderately well drained.
The Sawyer soil typically has a brown silt loam surface layer about 9 inches thick underlain by about
22 inches of a strong brown, mottled loam. The mottled loam is underlain by a yellowish brown, mottled
silty clay loam to a depth of approximately 35 inches. The lower portion of the subsoil (to a depth of
approximately 60 inches) is gray and light brownish gray, mottled silty clay.
During the 1996 to 1997 EPA removal action large portions of the site surface soil were removed to the
consolidation area. Excavated areas were reportedly backfilled with bank sand.
1.3.9 Ecology
Tetra Tech determined the types and locations of habitats, and assessed physical perturbation by logging
operations on habitat quality (Tetra Tech 2000b). A screening level ecological risk assessment (SLERA
[Tetra Tech 2000d]) and ecological risk assessment (ERA) of the MPTC site has been conducted
(Tetra Tech 2001c). The habitats at the site include flowing water bodies, patches of riparian vegetation,
upland forest, and shrub/scrub. The aquatic ecosystem provides habitat for small fish, phytoplankton,
juvenile amphibians, and crayfish. The terrestrial areas provide foraging, roosting, nesting, and hunting
habitat for mammals, birds, amphibians, and small reptiles.
2.0 NATURE AND EXTENT OF CONTAMINATION
COPCs detected in soil, sediment, and ground water included metals, PAH, and volatile organic
compounds (VOC). Dense nonaqueous-phase liquid (DNAPL) was identified as free phase creosote at
monitoring wells MW-2, MW-3, and MW-14, all located east of the consolidation area (see Figure 4).
DNAPL has not been recorded in monitoring wells north, south, or west of the consolidation area. The
S:\RAC\ODA031 \TECH_MEMO\tech_4.wpd 13

100_____0_____100_____200 Feet
MARION PRESSURE TREATING COMPANYMARION, LOUISIANA
FIGURE 4MONITORING WELL LOCATION MAP
PREPARED FOR: BT
&EPA u3W —— • J^^ Tetra Tech EM Inc.

presence ofDNAPL east of the consolidation area and in the immediate vicinity of the formerimpoundment would imply a release from one or both of these areas.
The consolidation area covers former operational units that included retorts, piping, and storage vessels,
all of which have had documented creosote releases. In addition, the contaminated soil and debris
contained within the consolidation unit reportedly contained visible amounts of creosote. The formerlyunlined impoundment area was reportedly closed in March of 1987. However, the quality and
completeness of the closure activities have been questioned by LDEQ. The apparent lack of run-on and
run-off control, the impermeable layers in the consolidation area, and the unknown closure quality of the
former impoundments imply that one or all of these units are potential sources of, and contributors to, the
DNAPL pool. The presence ofDNAPL was not revealed during the 1984 installation of monitoring
wells MW-2 and MW-3 nor during subsequent sampling events up to 1997. DNAPL was first mentionedin MW-2 during the 1997 sampling event.
The presence of contaminated debris piles, including treated wood, brush, and demolition materials, wasnoted in the RI. In addition, remaining structures and abandoned equipment (for example, an old tanker
and wastewater sump) will require removal, possible treatment, and disposal.
During the RI, soil, sediment, ground water, surface water, and crayfish tissue samples were collected at
the MPTC site to determine the nature and extent of contamination (see Figure 5) (Tetra Tech 200 la).Data generated during the investigation was sufficient to determine the nature and extent ofon-site
contamination, with the exception of the extent of the DNAPL identified as free phase creosote. For
purposes of the FS, the extent of contamination denotes areas exceeding COPC-specific PRGs (see
Section 3.3).
3.0 HUMAN HEALTH RISK ASSESSMENT CONCLUSIONS
This section summarizes the conclusions presented in the HHRA and the PRGs for the remedial action
based upon these conclusions. Pursuant to EPA guidance (EPA 1989a), the HHRA focused on assessingrisks associated with reasonable maximum exposure (RME) for potential current and future receptors
(Tetra Tech 200 Ib). Table 1 presents the receptors and exposure media/pathways addressed in the
S:\RAC\ODA031\TECH_MEMO\tech_4.wpd 15

——— RESIDENCES
———— DEBRIS PILES
100_____0_____100_____200 Feet
MARION PRESSURE TREATING COMPANY_______MARION, LOUISIANA_______
FIGURE 5SOIL AND SEDIMENT
SAMPLE LOCATION MAP______PREPARED FOR BY ^^^^
JS.FPA V&^Sy l^~ • ^ » Tetta Teed I-M Inc

TABLE 1
RECEPTOR AND EXPOSURE MEDIA/PATHWAYSADDRESSED IN HUMAN HEALTH RISK ASSESSMENT
ReceptorCurrent/Future Trespasser/Recreational Visitor(Adolescent)
Current/Future Off-Site Resident(Adult & Child)
Future On-Site Resident(Adult & Child)
Future On-Site Industrial Worker(Adult)
Exposure Media/PathwaySurface soil (ingestion, inhalation, dermal)Surface water (ingestion, dermal)Sediment (ingestion, dermal)Crayfish (ingestion)
Surface soil (inhalation ofparticulates and vapors)
Surface soil (ingestion, inhalation, dermal)Ground water (ingestion, dermal)
Surface soil (ingestion, inhalation, dermal)Ground water (ingestion, dermal)
S:\RAC\ODA03 l\TECH_MEMO\tech_4.wpd 17
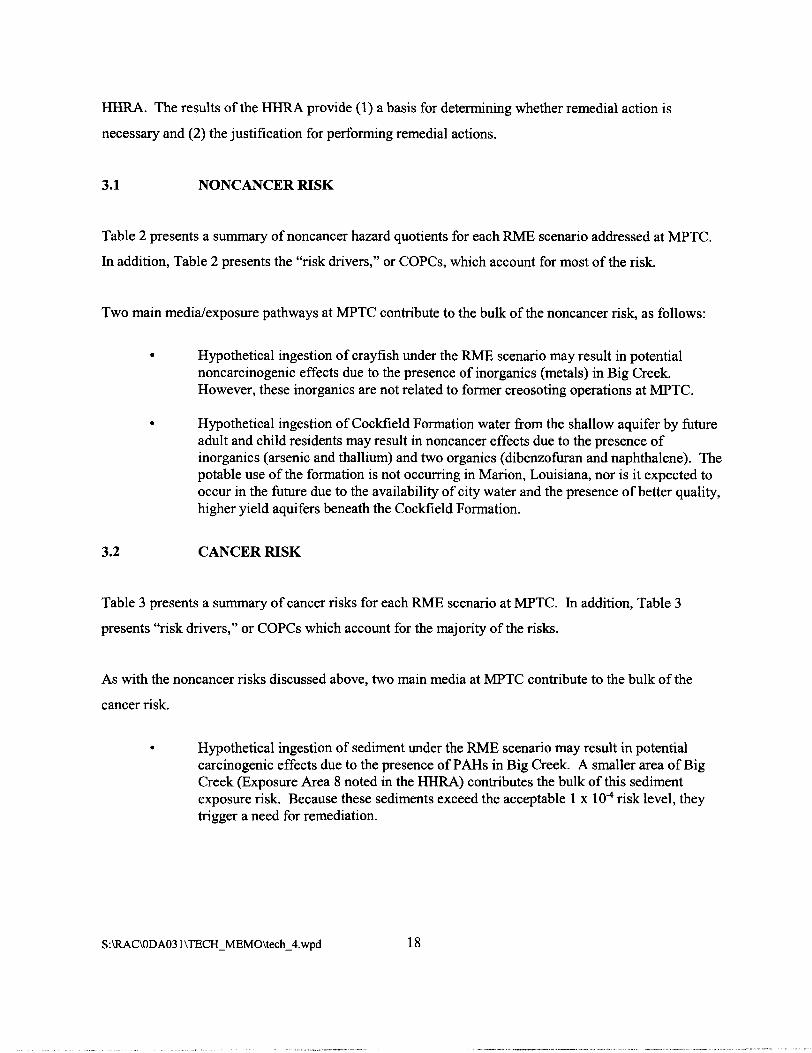
HHRA. The results of the HHRA provide (1) a basis for determining whether remedial action is
necessary and (2) the justification for performing remedial actions.
3.1 NONCANCER RISK
Table 2 presents a summary ofnoncancer hazard quotients for each RME scenario addressed at MPTC.In addition. Table 2 presents the "risk drivers," or COPCs, which account for most of the risk.
Two main media/exposure pathways at MPTC contribute to the bulk of the noncancer risk, as follows:
• Hypothetical ingestion of crayfish under the RME scenario may result in potentialnoncarcinogenic effects due to the presence ofinorganics (metals) in Big Creek.However, these inorganics are not related to former creosoting operations at MPTC.
• Hypothetical ingestion of Cockfield Formation water from the shallow aquifer by futureadult and child residents may result in noncancer effects due to the presence ofinorganics (arsenic and thallium) and two organics (dibenzofuran and naphthalene). Thepotable use of the formation is not occurring in Marion, Louisiana, nor is it expected tooccur in the future due to the availability of city water and the presence of better quality,higher yield aquifers beneath the Cockfield Formation.
3.2 CANCER RISK
Table 3 presents a summary of cancer risks for each RME scenario at MPTC. In addition, Table 3presents "risk drivers," or COPCs which account for the majority of the risks.
As with the noncancer risks discussed above, two main media at MPTC contribute to the bulk of thecancer risk.
• Hypothetical ingestion of sediment under the RME scenario may result in potentialcarcinogenic effects due to the presence ofPAHs in Big Creek. A smaller area of BigCreek (Exposure Area 8 noted in the HHRA) contributes the bulk of this sedimentexposure risk. Because these sediments exceed the acceptable 1 x 10'4 risk level, theytrigger a need for remediation.
S:\RAC\ODA03 l\TECH_MEMO\tech_4.wpd 18

TABLE 2
NONCANCER HAZARD INDEX SUMMARY
ReceptorTrespasser/RecreationalVisitor(Adolescent)
Off-Site Resident(Adult)
Off-Site Resident(Child)
Industrial Worker
On-Site Resident(Adult)
On-Site Resident(Child)
MediaSurface water (Big Creek)Surface water (Unnamed Tributary)Surface soil (Grid System)Surface soil (Consolidation Area)Airborne paniculate and vaporsSediment (Big Creek)Sediment (Unnamed Tributary)CrayfishTotal (all media, all routes)Sediment (Big Creek hot spots)Total (all media, all routes, hot spot scenario)
Airborne particulate and vapors
Airborne particulate and vapors
Surface soil (Grid System)Surface soil (Consolidation Area)Airborne particulate and vaporsGround waterTotal (all media, all routes)
Surface soil (Grid System)Surface soil (Consolidation Area)Airborne particulate and vaporsGround waterTotal (all media, all routes)
Surface soil (Grid System)Surface soil (Consolidation Area)Airborne particulate and vaporsGround waterTotal (all media, all routes)
NoncancerHQ"0.0360.0310.0043
0.0000560.000320.005
0.003310103.713.7
0.0011
0.0017
0.00750.00010.001
3.23.2
0.020.000170.0011
1111
0.140.00140.0017
2424
RiskDriver(s)1'(media)
Arsenic (crayfish)Barium (crayfish)Manganese (crayfish)
N/A
N/A
Thallium (groundwater)
Arsenic (ground water)Dibenzofuran (groundwater)Naphthalene (groundwater)Thallium (groundwater)
Arsenic (ground water)Dibenzofuran (groundwater)Naphthalene (groundwater)Thallium (groundwater)
Notes:
a A hazard index (HI) greater than 1 is considered an excess risk for non-carcinogenic health effects.b Constituents with a combined exposure route HI greater than 1.0.
N/A As the HI for this receptor was less than 1.0, no constituents were identified as risk drivers.
S :\RAC\ODA031 \TECH_MEMO\tech_4.wpd 19
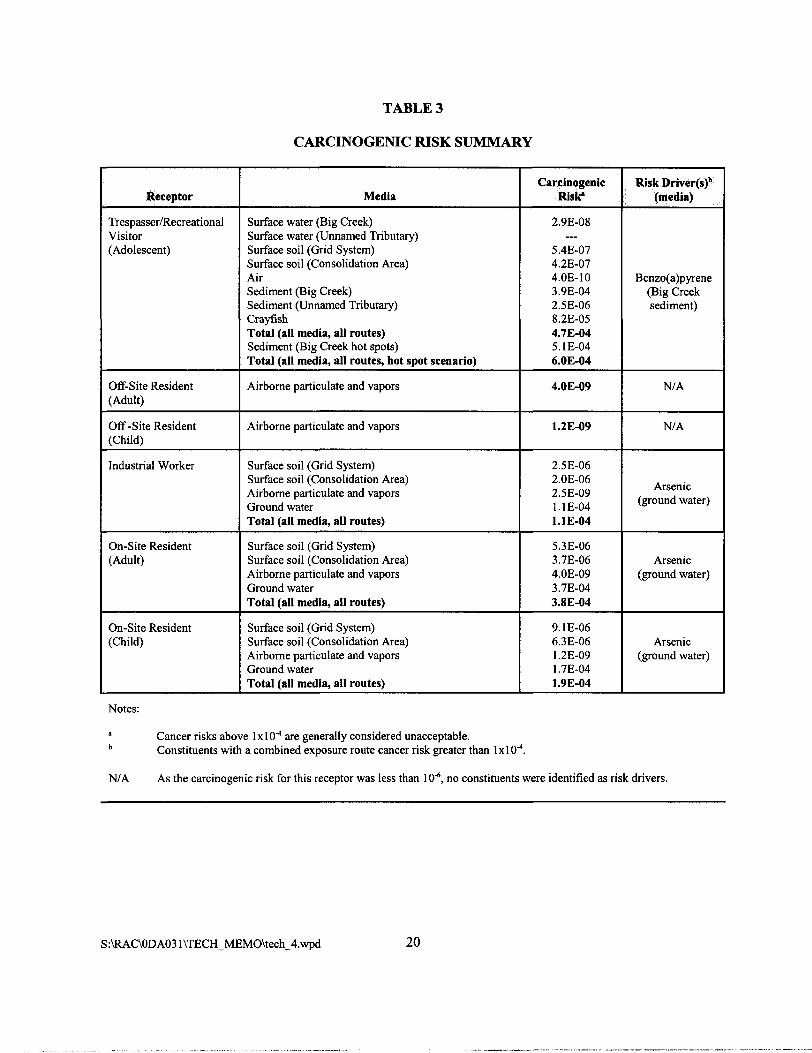
TABLE 3
CARCINOGENIC RISK SUMMARY
Receptor
Trespasser/RecreationalVisitor(Adolescent)
Off-Site Resident(Adult)
Off-Site Resident(Child)
Industrial Worker
On-Site Resident(Adult)
On-Site Resident(Child)
Media
Surface water (Big Creek)Surface water (Unnamed Tributary)Surface soil (Grid System)Surface soil (Consolidation Area)AirSediment (Big Creek)Sediment (Unnamed Tributary)CrayfishTotal (all media, all routes)Sediment (Big Creek hot spots)Total (all media, all routes, hot spot scenario)
Airborne particulate and vapors
Airborne particulate and vapors
Surface soil (Grid System)Surface soil (Consolidation Area)Airborne particulate and vaporsGround waterTotal (all media, all routes)
Surface soil (Grid System)Surface soil (Consolidation Area)Airborne particulate and vaporsGround waterTotal (all media, all routes)
Surface soil (Grid System)Surface soil (Consolidation Area)Airborne particulate and vaporsGround waterTotal (all media, all routes)
CarcinogenicRisk*
2.9E-08
5.4E-074.2E-074.0E-103.9E-042.5E-068.2E-054.7E-045.1E-046.0E-04
4.0E-09
1.2E-09
2.5E-062.0E-062.5E-091.1E-041.1E-04
5.3E-063.7E-064.0E-093.7E-043.8E-04
9.1E-066.3E-061.2E-091.7E-041.9E-04
Risk Drivers)"(media)
Benzo(a)pyrene(Big Creeksediment)
N/A
N/A
Arsenic(ground water)
Arsenic(ground water)
Arsenic(ground water)
Notes:
' Cancer risks above lxl0"4 are generally considered unacceptable.b Constituents with a combined exposure route cancer risk greater than 1 x 10"4.
N/A As the carcinogenic risk for this receptor was less than 10'6, no constituents were identified as risk drivers.
S:\RAC\ODA031 \TECH_MEMO\tech_4.wpd 20

• Hypothetical ingestion ofCockfield Formation water from the shallow aquifer by futureadult and child residents may result in potential carcinogenic effects due to the presenceof arsenic. The potable use of the formation is not currently in place in Marion,Louisiana, nor is it expected to occur in the future due to the availability of city waterand the presence of better quality, higher yield aquifers beneath the Cockfield Formation.
3.3 HUMAN HEALTH RISK ASSESSMENT SUMMARY
HHRA results indicate that the major noncarcinogenic risks are due to (1) ingestion of arsenic, barium,and manganese in crayfish tissue and (2) ingestion and dermal absorption of arsenic, thallium,
dibenzofuran, naphthalene, and phenanthrene in ground water. The majority of the carcinogenic risk are
due to (1) incidental ingestion and dermal contact with PAHs in Big Creek sediments near Exposure
Area 8, and (2) ingestion and dermal absorption of arsenic, dibenzofuran, naphthalene, and thallium inground water. Arsenic, barium, and thallium are not related to former operations at MPTC.
In addition to the noncarcinogenic and carcinogenic risks due to direct contact with site-related COPCs insurface/subsurface soil (0 to 2 ft bgs) and surface sediment (0 to 0.5 ft bgs), PAHs have been detected at
depth in several soil, deep soil, and sediment locations at MPTC. DNAPL is also present in three wells.
Therefore, the potential for continued leaching of COPCs from contaminated soils and sediments to
ground water was also evaluated in the HHRA. Figure 6 indicates those locations at the site that exceedsoil-to-ground water protection screening values.
These locations include:
Five Big Creek locations (SDO 1, SD02, SD03, SD26, and SD27)
Eight grid node locations (Ell, H09,108,115, J14, K15, L08, and 016)
• Six consolidation area borings (CA01 through CA06)
• One judgmental sample (JS04)
The five Big Creek locations were deep soil boring samples.
S:\RAC\ODA031\TECH_MEMO\tech_4.wpd 21

100_____0_____100_____200 Feet
MARION PRESSURE TREATING COMPANYMARION, LOUISIANA
FIGURE 6BAP EQUIVALENTS EXCEEDING
______DIRECT EXPOSURE PRGS______PREPARED FOR: BY ^^^^
J2.FPA usW L • ^^ TetraTeAEMInc

3.4 PRELIMINARY REMEDIATION GOALS
After considering past operations at MPTC, the analytical results for soil and sediment samples collectedduring the RI, and the results of the HHRA, two types ofPRGs have been identified:
• PRGs based upon an unacceptable cancer risk for direct exposure to PAHs incontaminated Big Creek sediments and isolated surface soil "hot spots."
• PRGs based upon COPC concentrations projected to be a continuing source ofcontamination to underlying ground water.
Each type ofPRG is described in detail in the following subsections.
3.4.1 Direct Exposure PRGs
The HHRA (Tetra Tech 200 Ib) evaluated potential current and future exposures at MPTC within10 exposure areas. This evaluation was completed using benzo(a)pyrene (B[a]P) equivalentconcentrations. B(a)P equivalents are calculated values based on the concentrations of the carcinogenicPAHs (benzo[a]anthracene, benzo[a]pyrene, benzo[b]fluoranthene, benzo[k]fluoranthene, chrysene,dibenzo[a,h] anthracene, and indeno[l,2,3-c,d]pyrene) present in each sample. Table 4 presents the PRGsthat correspond to 10'4, 10"5, and 10'6 excess cancer risk for two exposure scenarios: the current/future
trespasser recreational visitor and the potential future industrial worker. While a future hypothetical
residential scenario was evaluated in the HHRA, future residential land use is unlikely. Therefore, thesefuture use scenarios formed the basis of the PRG development.
EPA Region 6 has reviewed the findings in the HHRA and determined the most appropriate directexposure PRGs for the industrial worker scenario shall be 26 milligrams per kilogram (mg/kg) B(a)P
equivalent and 42 mg/kg B(a)P equivalent for the trespasser/recreational visitor scenario (EPA 2001).
For human health direct contact considerations, the PRG set to protect the trespasser/visitor is the most
applicable based on the most likely future use of the MPTC site as a recreational area. A PRG of42 mg/kg B(a)P equivalent was determined for the trespasser/recreational visitor for the upper end of theacceptable risk range (IxlO"6 to IxlO"4 excess cancer risk). Although future industrial use is unlikely,should the site be used for industrial purposes in the future, a PRG protective of an on-site industrial
S:\RAC\ODA031 \TECH_MEMO\tech_4.wpd 23

TABLE 4
DIRECT EXPOSURE PRELIMINARY REMEDIATTON GOALS
Exposure ScenarioCurrent Trespasser/Recreational VisitorFuture Trespasser/Recreational Visitor
Future Industrial Worker
Excess Cancer RiskB(a)P Equivalent Concentrations
1 in 1,000,0000.42 mg/kg
0.26 mg/kg
1 in 100,0004.2 mg/kg
2.6 mg/kg
1 in 10,00042 mg/kg
26 mg/kg
Notes:
B(a)Pmg/kg
Benzo(a)pyreneMilligram per kilogram
S:\RAC\ODA03 l\TECH_MEMO\tech_4.wpd 24

worker would be 26 mg/kg B(a)P equivalent for the upper range of the acceptable risk range. Only
Exposure Area 8, which includes locations JS04, N16, N17, 016, 017, SD02, SD03, SD28, SD30,SD31, SD34, and SD35, resulted in exposures exceeding the 1 x \0~4 acceptable risk level. In otherwords, the calculated 95 percent upper confidence level (UCL) B(a)P equivalent of 669.4 mg/kg
(Tetra Tech 2001b) for Exposure Area 8 exceeds the 1 x 10"4 risk-based level of 42 mg/kg B(a)P
equivalent determined for the trespasser/recreational visitor scenario. Therefore, a removal action of 0 to2 feet for soil and 0 to 0.5 feet for sediments in Exposure Area 8 is recommended to address direct
contact at MPTC.
Table 5 summarizes the locations that must be remediated to meet the direct exposure PRGs.
3.4.2 Site-Specific Ground Water Protection PRGs
Site-specific ground water protection PRGs are established by calculating the soil or sediment
concentration of specific COPCs that may, based upon site-specific soil and hydrogeologic parameters,
leach to the ground water in concentrations exceeding the COPC-specific maximum contaminant level.
Calculations are shown in the appendix, with the relevant site-specific data given in Attachment A. Therelevant risk evaluation/corrective action program (RECAP) methodology and lookup tables are provided
in Attachments B and C, respectively.
Table 6 presents a summary of the site-specific ground water protection PRGs for each COPC. Table 7
presents a summary of the soil and sediment locations that must be remediated based upon site-specificground water protection PRGs.
The approach and findings for each of the three potential continuing source areas are discussed below.
3.4.2.1 Approach
Using the site-specific soil information (see Attachment A) and other geological information (such asboring logs) presented in the RI report (Tetra Tech 200 la), the RECAP guidance (see Attachments B
and C) was applied to calculate site-specific soil concentrations protective of ground water for each of
S:\RAC\ODA03 l\TECH_MEMO\tech_4.wpd 25

TABLE 5
DIRECT EXPOSURE PRELIMINARY REMEDIATION GOAL,REMEDIAL LOCATIONS, AND DEPTHS
Area
Exposure Area 8
Exposure Area 8
Sample Locations
JS04,N16,N17,016,017
SD02, SD03, SD28,SD30,SD31,SD34,SD35
Excess Cancer Risk B(a)PEquivalent Concentration
u (mg/kg)
42
42
Remedial Location
JS04,N16,N17,016,017
SD02, SD03, SD28, SD30,SD31,SD34,SD35
RemedialDepth(Feet)
2
0.5
Notes:
' Backfill soils will need to be below a maximum value of 26 milligram per kilogram (mg/kg) (preliminaryremediation goal for future industrial worker at lO^risk level).
2 This concentration equates to an excess cancer risk of 1 in 10,000 for the current/future trespasser (recreationalvisitor exposure scenario).
3 Remedial depths proposed herein are for direct exposure only. Depths may increase following consideration ofground water protection PRGs.
B(a)P Benzo(a)pyrenemg/kg Milligram per kilogram
S:\RAC\ODA03 l\TECH_MEMO\tech_4.wpd 26

TABLE 6
SITE-SPECIFIC GROUND WATER PROTECTION PRELIMINARY REMEDIATION GOALS
Contaminant ofPotential Concern
Benzo(a)anthracene
Benzo(a)pyrene
Benzo(b)fluoranthene
Benzo(k)fluoranthene
Chrysene
Dibenzo(a,h)anthracene
Indeno(l ,2,3-cd)pyrene
Acenaphthene
Anthracene
Biphenyl
Carbazole
Dibenzofiiran
Fluoranthene
Fluorene
Naphthalene
2-Methylnaphthalene
Phenanthrene
Pyrene
Big Creek Exposure Area 8Sediment Concentrations
(mg/kg)
RECAPValue
8.6
23
29
120
76
540
9.2
410
120
190-
4.6
24
1200
230
1.5
170
420
1,100
Site-SpecificValue
19.34
52.35
66.45
302.34
978.34
4,835.10
374.92
491.21
11,384.44
418.04
20.00
50.66
19,899.94
500.78
3.26
1,785.02
4,195.67
3,306.92
Grid Surface, Subsurface,and Deep Soil
Concentrations (mg/kg)
RECAPValue
8.6
23
29
120
76
540
9.2
410
120
190"
4.6
24
1200
230
1.5
170°
420"
1,100
Site-SpecificValue
9.47
25.62
32.52
147.96
478.78
2,366.13
183.47
241.01
5,574.15
205.46
9.85
24.83
9,740.80
245.47
1.61
878.86
2,055.65
1,618.58
Consolidation Area DeepSoil Concentrations (mg/kg)
RECAPValue
8.6
23
29
120
76
540
9.2
410
120
190"
4.6
24
1200
230
1.5
NA
420'
1,100
Site-SpecificValue
9.47
25.62
32.52
147.96
478.78
2,366.13
183.47
241.00
5,574.12
205.45
9.85
24.83
9,740.77
245.46
1.61
NA
2,055.62
1,618.58
Notes:
' This value was calculated using RECAP methodology and chemical-specific parameters from the Texas NaturalResource Conservation Commission Risk Reduction Rule (TNRCC 1999). Chemical-specific parameters for thiscompound are not available in RECAP.
mg/kg Milligram per kilogramNA Not a contaminant of potential concern in this mediaRECAP Risk evaluation/corrective action program
S:\RAC\ODA03 l\TECH_MEMO\tech_4.wpd 27
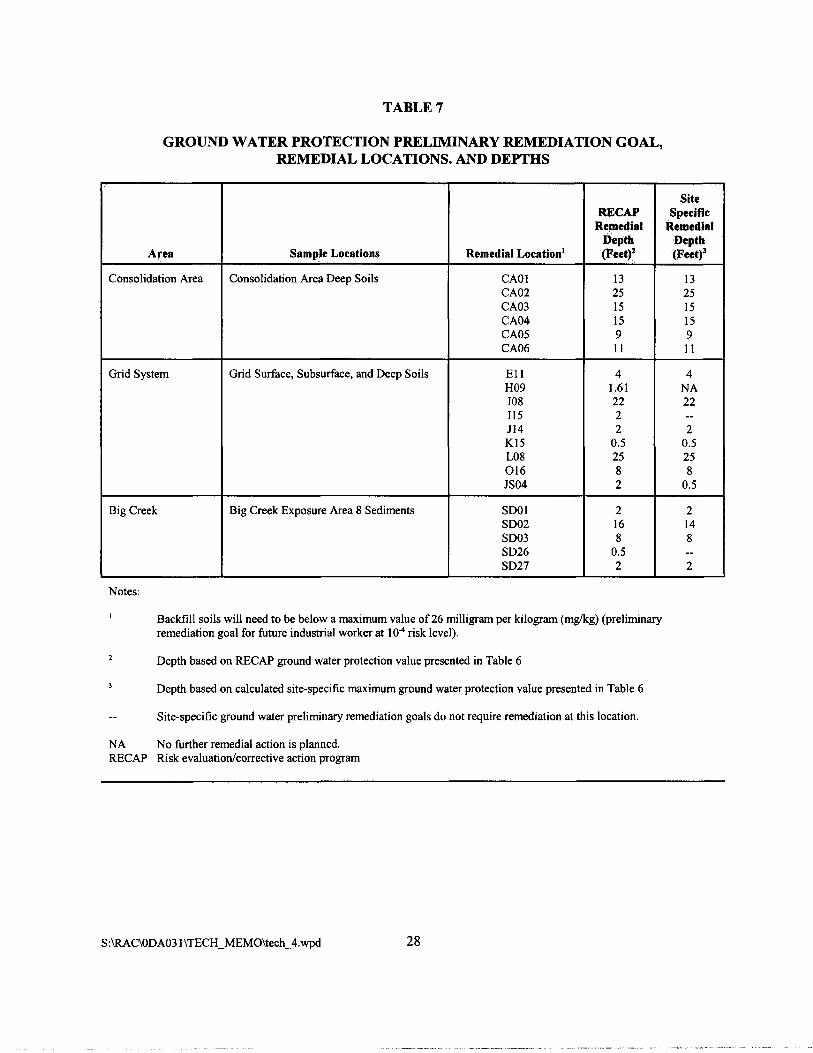
TABLE 7
GROUND WATER PROTECTION PRELIMINARY REMEDIATION GOAL,REMEDIAL LOCATIONS. AND DEPTHS
Area
Consolidation Area
Grid System
Big Creek
Sample Locations
Consolidation Area Deep Soils
Grid Surface, Subsurface, and Deep Soils
Big Creek Exposure Area 8 Sediments
Remedial Location'
CA01CA02CA03CA04CA05CA06
EllH09108115J14K15LOS016JS04
SD01SD02SD03SD26SD27
RECAPRemedial
Depth(Feet)2
13251515911
41.612222
0.52582
2168
0.52
SiteSpecific
RemedialDepth(Feet)3
13251515911
4NA22—2
0.5258
0.5
2148—2
Notes:
' Backfill soils will need to be below a maximum value of 26 milligram per kilogram (mg/kg) (preliminaryremediation goal for future industrial worker at 10"4 risk level).
2 Depth based on RECAP ground water protection value presented in Table 6
3 Depth based on calculated site-specific maximum ground water protection value presented in Table 6
Site-specific ground water preliminary remediation goals do not require remediation at this location.
NA No further remedial action is planned.RECAP Risk evaluation/corrective action program
S:\RAC\ODA03 l\TECH_MEMO\tech_4.wpd 28

the seven carcinogenic PAHs that comprise the B(a)P equivalents for human health protection. Because
not all chemicals leach in the same way (due to their different chemical and physical properties),
additional contaminants were also evaluated to determine whether all site-related contamination iscollocated with the seven carcinogenic PAHs. The approach was designed to further evaluate the
concentrations shown on Figure 6 with site-specific data to determine a relevant PRG for protection of
the underlying water table. Table 6 shows the site-specific concentrations calculated for each site-relatedcontaminant.
3.4.2.2 Findings Regarding Big Creek Residual Source Area
The HHRA (Tetra Tech 200 Ib) identified five sample locations (SD01, SD02, SD03, SD26, and SD27)
as exceeding screening-level concentrations protective of ground water (see Figure 6). The first threelocations fall within the footprint (for surface sediments/soils, 0 to 0.5 ft bgs) that are above the 42 mg/kgB(a)P equivalent concentrations for direct contact (see Figures 7 and 8). These same three locations(SD01, SD02, and SD03) are also toxic to ecological receptors (Tetra Tech 200 Ic), and therefore havebeen recommended for removal to the ecologically relevant depth (0.5 ft bgs). However, residual
concentrations below these depths may be a continuing source area. Based on Big Creek sediment
characteristics from samples collected during the RI/FS field mobilization (Attachment A), thesite-specific Soilcwi values (which assume the shallow water table to be a future source of drinking water)
indicate that (for average sediment characteristic values reported in Attachment A) the sevenchemical-specific PRGs (based on continuing source protection) shown in Table A-l of the Appendix are
exceeded in the following locations:
• Excavation at SD01, SD02, and SD03 to (a depth of 6 inches)' to remove both humanhealth direct contact and ecological risks. See also location 016 below, which should beremoved to a depth of 2 ft bgs.
• While SD26 and SD27 do not fall within the footprint shown on Figure 7, these areas areoutside of the site fence; therefore, human access is not restricted. Thus, exposure maybe greater in these areas, m addition, concentrations ofbenzo(a)anthracene andbenzo(b)fluoranthene still exceed the site-specific soil concentration protective of groundwater. Therefore, removal of the top 6 inches of sediment is prudent in this area.
'During the RI, free phase creosote was observed in post holes dug to relocate the perimeter fence near S001, SD02,and SD03. The depth of the post holes was reported to exceed 4 ft bgs. Therefore, it appears prudent to consider removal ofsediments and soil along the Big Creek channel to a depth of at least 6 ft bgs.
S:\RAC\ODA031 \TECH_MEMO\tech_4.wpd 29

1GO________0________WO________200 Feel
MARION PRESSURE TREATING COMPANYMARION, LOUISIANA
FIGURE 7GROUND WATER PROTECTION MAP
PREPAfiED FOR BY: ^^^^
.S.FPA Ua^Sly •̂ • l^k Tetal Tech EM Inc

MARION PRESSURE TREATING COMPANYMARION, LOUISIANA
FIGURE 8PROPOSED EXCAVATION PLAN
__~~~WPA \A.~

In addition to the human health direct contact and ecological risks addressed above, Table 7 denotes thedepths that need to be addressed to remove residual source concentrations.
3.4.2.3 Findings Regarding Grid System Residual Source Area
The HHRA (Tetra Tech 2001b) identified nine grid system soil sample locations (El 1, H09,108,115,
J14, JS04, K15, LOS, and 016) as exceeding screening-level concentrations protective of ground water(see Figure 6).
Residual concentrations below the surface may be a continuing source area. Based on grid node
characteristics from soil samples collected during the RI/FS field mobilization (Attachment A), the
site-specific Soilowi^h^s (which assume the shallow water table to be a future source of drinking water)
indicate that (for average grid node soil characteristic values reported in Attachment A) findings for eachof the nine locations with regard to the chemical-specific PRGs (based on continuing source protection)shown in Table A-2 of the Appendix are as follows:
At El 1, naphthalene at 2 to 4 ft bgs is 54 mg/kg. This exceeds the site-specific Soilcwivalue of 1.61 mg/kg using the site-specific values in Attachment A (see Table A-l).
• At H09, only naphthalene slightly exceeded a screening-level Soilcwi value at 2.1 mg/kgin the 0 to 0.5 ft bgs interval. Because of naphthalene's volatile nature, and the absenceof any site-related contaminant in this area, no action is needed in the H09 area.
• At 108, which is at the edge of the consolidation area, site-specific Soilgwi are exceededin the 0.5 to 2 ft bgs interval for three of the carcinogenic PAHs. At 22 ft bgs,benzo(a)anthracene, carbazole, and dibenzofuran also exceeded their site-specificSoilow, values. Therefore, removal to 22 ft bgs is recommended.
• At 115, benzo(b)fluoranthene was detected at 32 mg/kg at 0.5 to 2 ft bgs (Figure 6).However, this value falls below the calculated Soilo^i using the site-specific values inAttachment A (see Table A-l), which is 32.52 mg/kg. Because this is a protective value,no action is needed in the 115 area.
• At J14, benzo(a)anthracene was detected at 16 mg/kg at 0.5 to 2 ft bgs (Figure 6). Thisvalue falls slightly above the calculated Soilcwi of 9.47 using the site-specific values inAttachment A (see Table A-l). Removal to 2 ft bgs is recommended.
• JS04 potential for direct contact is 0 to 0.5 ft bgs. Soil to ground water in this location ispossible, but cannot be confirmed due to a lack of samples at 0 to 2 ft bgs.
S:\RAC\ODA031\TECH_MEMO\tech_4.wpd 32

• At K15, three carcinogenic PAHs were detected slightly above their calculated Soilg^ivalues (Figure 6) at a depth ofOto 0.5 ft bgs. Surface removal to 6 inches is proposed inthe K15 area. This surface removal is part of an overall removal of debris andabandoned creosote treated wood poles in the southern area of the site.
• At LOS, exceedances of several PAHs and other site related compounds to a depth of23.5 ft bgs were reported (Figure 6). While the surface and near surface soils (0 to2 ft bgs) at the site are "clean" due to placement of fill after the 1997 removal action, thesubsurface still may act as a continuing source. The LOS area should be added forremoval to a depth of 25 ft bgs, with potential reuse of "clean" surface soils pendingconfirmation sampling.
• The 016 location already falls within the Big Creek sediment footprint (Figure 8) forremoval. Because it has a concentration ofdibenzofuran in excess of the site-specificSoilcwi value at a depth of 8 feet, the removal in this area should reach a depth of at least8 ft bgs.
Therefore, plans to excavate to the depths discussed above should be included in the volume estimates.
3.4.2.4 Findings Regarding Consolidation Area Residual Source Area
The HHRA (Tetra Tech 200 Ib) identified six consolidation area sample locations (CA01 through CA06)
as exceeding screening-level concentrations protective of ground water. Based on consolidation area soilcharacteristics from samples collected during the RI/FS field mobilization (Attachment A), the
site-specific SoilGwi^l11051 (which assume the shallow water table to be a future source of drinking water)indicate that (for consolidation area soil characteristic values reported in Attachment A), thechemical-specific PRGs (based on continuing source protection) shown in Table A-3 of the Appendix are
exceeded in all consolidation area sampling locations sampled.
The consolidation area is scheduled for excavation to address the following concerns:
• Remove creosote-soaked debris.
• Protect ground water.
S:\RAC\ODA03 l\TECH_MEMO\tech_4.wpd 33

3.5 OTHER FINDINGS
The following additional areas and materials of concern were identified during the FS.
3.5.1 Backfilled Impoundment Area
Section 1.4 discusses the closure activity undertaken at the former impoundment area. It appears prudent
to consider removal of potential source soils underlying this unit. It is estimated that the bottom of the
impoundment was 10 ft bgs. Therefore, excavation and treatment of soil under the clean backfill isrecommended.
3.5.2 Debris Contained Within the Consolidation Area
The RI indicates that the bottom area of the consolidation area contains debris that includes treated
lumber products. Discussions with the EPA on-site coordinator who conducted the removal action that
constructed the consolidation area indicates this material includes treated railroad ties and other debris
impacted with creosote. There are also concrete pads and foundations that supported former process
equipment. These are anticipated to have been contaminated with spills from former operations and from
material placed above them during the construction of the consolidation area. These materials will be
revealed during the proposed excavation of the consolidation area. Removal and disposal of this material
is recommended.
3.5.3 Surface Debris Containing Creosote
Section 1.2 discusses the presence of surface piles containing creosote treated wood, brush, anddemolition materials. The location of these piles are depicted on Figure 2. Removal and disposal of this
material is recommended.
3.5.4 Surface Debris—Vegetation and Logging Debris
The RI described logging operations that have left slash, tree stumps, and non-commercial tree refuse.Much of this material has come in contact with creosote contaminated surface soils and/or scattered
S:\RAC\ODA031\TECH_MEMO\tech_4.wpd 34

treated wood products that are ubiquitous to the site. Removal and disposal of this material is
recommended.
3.5.5 Surface Debris—Metal Scrap and Abandoned Equipment
The RI identified the presence of metal scrap and abandoned equipment. Removal and disposal of these
materials is recommended.
3.5.6 Former Site Office and Storage Sheds
The former site office and storage sheds are described in the RI as abandoned and in severe disrepair.
Because they contribute nothing to the future economic value of the site, are attractive nuisances, and areeither in, or in close proximity to, anticipated excavated areas as depicted on Figure 8, their removal and
disposal is recommended.
4.0 PRESUMPTIVE REMEDY APPROACH FOR WOOD TREATER SITES
In 1990, EPA began developing the concept of presumptive remedies as a method for accelerating the
remedial process at certain types of waste sites, including wood treater sites. According to EPA's policy
directive, "presumptive remedies are preferred technologies for common categories of sites based onhistorical patterns of remedy selection and EPA's scientific and engineering evaluation of performance
data on technology implementation. The objective of the presumptive remedies initiative is to use theprogram's past experience to streamline site investigation and speed up selection of cleanup actions"(EPA 1995). Thus, the presumptive remedy approach limits the number of candidate technologies,
thereby expediting the FS process. These technologies include bioremediation, thermal desorption,
incineration, and immobilization. Bioremediation, thermal desorption, and incineration are primarily
used to treat chlorinated and nonchlorinated organic contaminants. Immobilization is primarily used totreat inorganic contaminants; however, it can also be used to treat organic wastes. Because the
contamination at the MPTC site consists of nonchlorinated organics (creosote), each of these
technologies is applicable (EPA 1995).
The FS for the MPTC site will use the presumptive remedy approach.
S:\RAC\ODA03 l\TECH_MEMO\tech_4.wpd 35

5.0 REMEDIAL ACTION OBJECTIVES AND ARARS
RAOs identify the remediation goals, and are derived from the risk assessment findings, site-specific
chemicals of concern, media of concern, potential exposure pathways, and the evaluation of potential
ARARs. A summary of the risk assessment was presented in Section 3.0. The following subsections
present the development of the RAOs for the MPTC site and the ARARs considered during theirdevelopment.
5.1 REMEDIAL ACTION OBJECTIVES
RAOs are "medium-specific" (for example, ground water or soil) or "operable unit-specific" goals for
protecting human health and the environment (EPA 1988a). For wood treater sites being addressed
through the presumptive remedy approach, EPA guidance (1988a) recommends that RAOs should be
developed to (1) minimize further release of contaminants from the soil and limit further spreading ofsubsurface DNAPLs to off-site media, and (2) reduce the quantity of source material present in the non
aqueous-phase liquid (NAPL) zone. To accomplish these objectives, EPA recommends the use of
treatment technologies to control principal threats and containment technologies to control low-levelthreats (EPA 1995).
RAOs for the MPTC site have been developed based upon the potential future development of the site as
a recreational or industrial area, pursuant to EPA guidance (EPA 1995). As directed by EPA, the FS willalso have to consider the potential that the site will be used as a public park in the future in developing
the RAOs and PRGs. Principal media of concern at the MPTC site include the contaminated on-site and
off-site soil and sediments. As discussed in Section 3.0, the principal media of concern at the MPTC siteinclude the contaminated soil and sediments. Contaminated debris, soils, and DNAPL also provide a
potential continuing source of ground water contamination.
The RAOs for the site include the following:
• Treat soils that are above acceptable risk levels to prevent contact by receptors.
• Prevent further contamination of ground water by removing contaminant sources andrecover DNAPL to the greatest extent possible.
• Monitor the ground water to determine the effectiveness of the source removal.
S:\RAC\ODA03 l\TECH_MEMO\tech_4.wpd 36

The technologies evaluated in the FS will meet both the PRGs and the RAOs. Technologies to address
these concerns are discussed in Sections 6.0 and 7.0. Estimated quantities of material requiring
remediation to meet these RAOs are presented in Table 8. Locations of areas requiring potentialremediation can be seen on Figure 8.
5.2 APPLICABLE OR RELEVANT AND APPROPRIATE REQUIREMENTS
In order to achieve NCP compliance, remedial action conducted at the MPTC site must comply with
ARARs derived from both federal and state environmental or facility siting laws. State standards thatmay constitute ARARs are those laws that are promulgated, substantive in nature, more stringent than
federal requirements, consistently applied, and identified by the state in a timely manner.
In addition to ARARs, other criteria are identified. Other criteria may include non-promulgated
advisories, criteria, or guidance developed by EPA, other federal agencies, or states that may be useful indeveloping CERCLA remedies for a particular release. This criteria is not legally binding and does nothave the status of ARARs.
There are certain circumstances under which an ARAR may be waived. However, these waivers apply
only to meeting ARARs with respect to remedial actions on site. Other promulgated requirements—for
example, the NCP requirement that remedies be protective of human health and the environment—cannot
be waived (EPA 1988a).
ARARs may be classified as either action-specific, location-specific, or chemical-specific.
EPA requested that LDEQ identify contaminant and location-specific ARARs (EPA 2000b). LDEQ
responded by furnishing ARARs it considered appropriate (LDEQ 2000), which include:
Louisiana Administrative Code (LAC) Title 33, Part IX, 2
• Water quality regulations, Chapter 3, Part III
Air quality regulations, Chapter 7 and Part V
S :\RAC\ODA031 \TECH_MEMO\tech_4.wpd 3 7

TABLE 8
ESTIMATED QUANTITIES OF MEDIA TO BE REMEDIATED
MediaSoil andsediments
Debris
LocationConsolidation area
Former impoundment
108
L08
CA01, CA02, CA03, CA04, CA05, CA06
Ell
J14
K15
SD02
SD03
016
Exposure Area 8
Big Creek sediments
Surface piles
Consolidation area
Vegetation and logging debris
Metal scrap and abandoned equipment
Site office and storage sheds
UnitCubic yards
Cubic yards
Cubic yards
Cubic yards
Cubic yards
Cubic yards
Cubic yards
Cubic yards
Cubic yards
Cubic yards
Cubic yards
Cubic yards
Cubic yards
Cubic yards
Cubic yards
Cubic yards
Cubic yards
Cubic yards
Estimated Quantity96,335
Included in Consolidation Area
Included in Consolidation Area
Included in Consolidation Area
Included in Consolidation Area
255
103
10
Included in Exposure Area 8
Included in Exposure Area 8
Included in Exposure Area 8
14,397
2,176
155
2,500
2,000
70
150
Notes:
Volume estimates for the Consolidation Area were determined by comparing computer-generated models of the existingtopographical surface and a composited excavated surface that included the engineering impacts of removing the following:
1) Former Impoundment to 10 feet below ground surface (ft bgs)2) Consolidation Area to 10 ft bgs3) CA01 to 13ft bgs4) CA02 to 25 ft bgs5) CA03 to 15ft bgs6) CA04 to 15ft bgs7) CA05 to 9 ft bgs8) CA06 to l i f t bgs9) Grid node location 108 to 25 ft bgs10) Grid node location 108 to 22 ft bgs
S:\RAC\ODA03 l\TECH_MEMO\tech_4.wpd 38
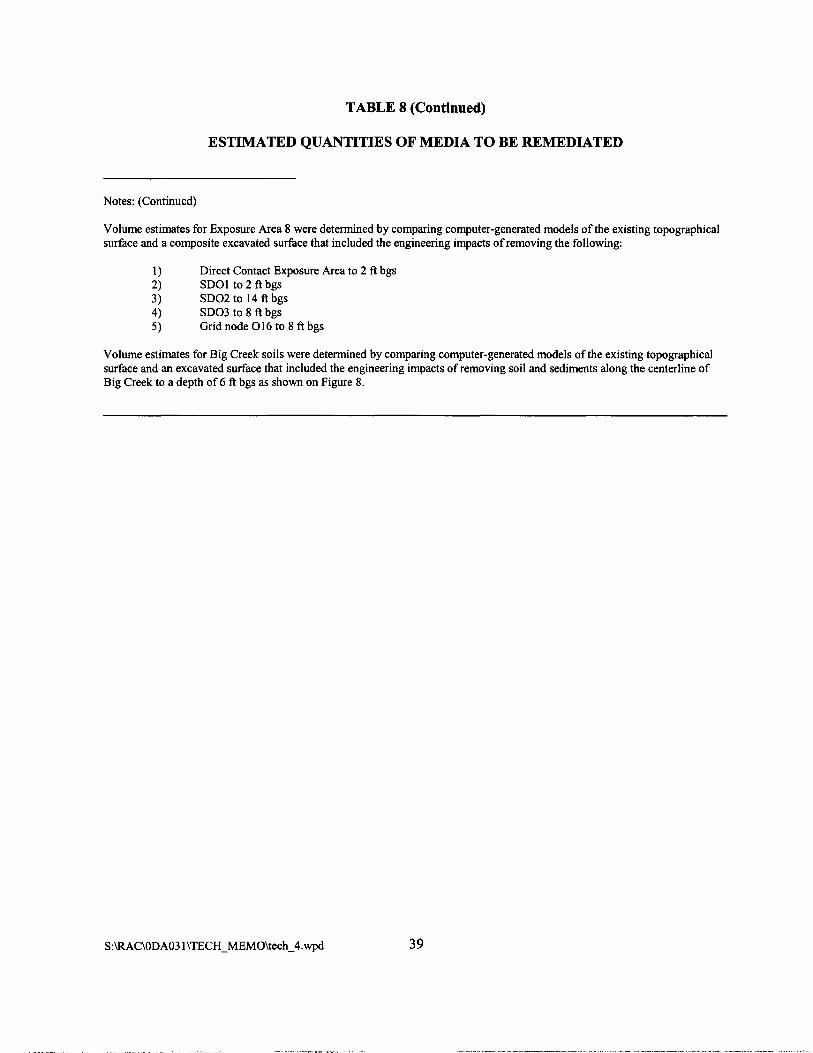
TABLE 8 (Continued)
ESTIMATED QUANTITIES OF MEDIA TO BE REMEDIATED
Notes: (Continued)
Volume estimates for Exposure Area 8 were determined by comparing computer-generated models of the existing topographicalsurface and a composite excavated surface that included the engineering impacts of removing the following:
1) Direct Contact Exposure Area to 2 ft bgs2) SD01to2ftbgs3) SD02 to 14 ft bgs4) SD03 to 8 ft bgs5) Grid node 016 to 8 ft bgs
Volume estimates for Big Creek soils were determined by comparing computer-generated models of the existing topographicalsurface and an excavated surface that included the engineering impacts of removing soil and sediments along the centerline ofBig Creek to a depth of 6 ft bgs as shown on Figure 8.
S:\RAC\ODA03 l\TECH_MEMO\tech_4.wpd 39

• Hazardous waste and hazardous materials regulations, Chapter 11
RECAP, LAC 33:1, Chapter 13
In addition, LDEQ specifically requested that any cleanup anticipated comply with the clean-upstandards of RECAP.
6.0 IDENTIFICATION OF GENERAL RESPONSE ACTIONS AND TECHNOLOGIES
As discussed in Section 4.0, EPA began developing the concept of presumptive remedies in 1990 as amethod for accelerating the remedial process at certain types of waste sites, including wood treater sites.
The presumptive remedy approach limits the number of candidate technologies for the remediation ofsoils, sediments, and sludges, thereby expediting the FS process. For wood treater sites, these
technologies include bioremediation, thermal desorption, incineration, and immobilization.
Bioremediation, thermal desorption, and incineration are used primarily to treat organic contaminants.
Immobilization is primarily used to treat inorganic contaminants; however, it can also be used to treatorganic wastes. The contamination at the MPTC site consists primarily of organic wastes; therefore,
each of these technologies is applicable (EPA 1995). Using the presumptive remedy approach, theseremedies advance through the FS process directly to the detailed analysis of alternatives.
m addition to the evaluation of presumptive remedies for soils, sediments, and sludges, presumptive
remedies for DNAPL and affected ground water containment and treatment technologies are also
evaluated in accordance with EPA guidance (EPA 1996). The MPTC site has documented the presenceof free phase creosote and creosote constituent contaminated ground water. The presumptive response
strategy allows for streamlining the selection and screening of technologies applicable to such sites. The
strategy considers containment, source control, and reduction to the extent practicable for DNAPL.General ground water remedies must satisfy these requirements and restore ground water to its beneficial
use wherever practicable unless the ground waters are not currently, or are not expected to be, future
sources of beneficial use. This is the case at the MPTC site.
The following subsections present general response actions (GRAs) that will achieve the RAOs for thesite. Applicable technologies are then identified based on past experience at similar sites, demonstrated
S:\RAC\ODA03 l\TECH_MEMO\tech_4.wpd 40

technologies at similar sites, a literature review of technical publications and EPA guidance, and a review
ofEPA remedial technology databases. In Section 7.0, the remedial technologies identified are screenedon the basis of effectiveness, implementability, and cost.
6.1 GENERAL RESPONSE ACTIONS
GRAs are media-specific actions that will attain the RAOs. As discussed in Section 4.0, EPApresumptive remedy guidance establishes treatment and containment of contaminated soils, sediments,
and sludges as the GRAs for wood treatment sites (EPA 1995). Treatment can be combined with otherappropriate general actions (for example, institutional control) to accomplish the RAOs. EPApresumptive remedy guidance establishes treatment and containment ofDNAPL as the GRAs for
contaminated ground water at CERCLA sites. Remedial technologies needed to accomplish the DNAPL
treatment GRAs include extraction and thermal destruction. Remedial technologies needed to
accomplish the DNAPL containment GRAs include barrier systems.
6.2 TECHNOLOGY IDENTIFICATION
Remedial technologies needed to accomplish the treatment GRAs for soils, sediments, and sludges
include bioremediation (ex situ and in situ), thermal desorption, and incineration. Immobilization
(solidification/stabilization) is the only technology that the EPA guidance presents as a containment GRA
for soils, sediments, and sludges.
The contaminated soil, sediment, and sludge treatment technologies, except in situ bioremediation,require excavation. The volume of materials to be excavated is based on (1) the results of the riskassessment, (2) ARARs and other criteria, and (3) the intended future use of the site.
Remedial technologies needed to accomplish the treatment GRAs for DNAPL include bioremediation
(ex situ and in situ) and extraction and off-site incineration. Barrier systems are the only technology thatthe EPA guidance presents as a containment GRA for DNAPL.
S:\RAC\ODA031\TECH_MEMO\tech_4.wpd 41
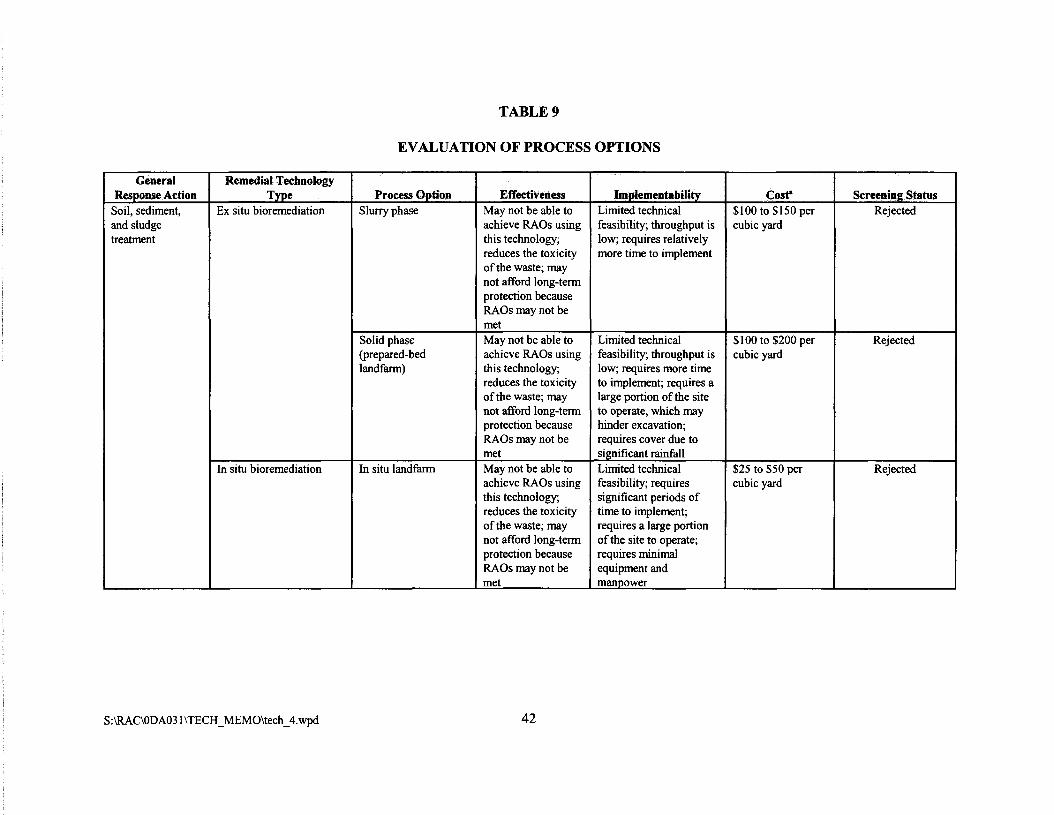
TABLE 9
EVALUATION OF PROCESS OPTIONS
GeneralResponse Action
Soil, sediment,and sludgetreatment
Remedial TechnologyType
Ex situ bioremediation
In situ bioremediation
Process OptionSlurry phase
Solid phase(prepared-bedlandfann)
In situ landfann
EffectivenessMay not be able toachieve RAOs usingthis technology;reduces the toxicityof the waste; maynot afford long-termprotection becauseRAOs may not bemetMay not be able toachieve RAOs usingthis technology;reduces the toxicityof the waste; maynot afford long-termprotection becauseRAOs may not bemetMay not be able toachieve RAOs usingthis technology;reduces the toxicityof the waste; maynot afford long-termprotection becauseRAOs may not bemet
ImplementabilityLimited technicalfeasibility; throughput islow; requires relativelymore time to implement
Limited technicalfeasibility; throughput islow; requires more timeto implement; requires alarge portion of the siteto operate, which mayhinder excavation;requires cover due tosignificant rainfallLimited technicalfeasibility; requiressignificant periods oftime to implement;requires a large portionof the site to operate;requires minimalequipment andmanpower
Cosf$100 to $150 percubic yard
$100 to $200 percubic yard
$25 to $50 percubic yard
Screening StatusRejected
Rejected
Rejected
S:\RAC\ODA03 l\TECH_MEMO\tech_4.wpd 42

TABLE 9 (Continued)
EVALUATION OF PROCESS OPTIONS
GeneralResponse Action
Contaminated soil,sediment, andsludge treatment(continued)
Remedial TechnologyType
In situ bioremediation(continued)
Thermal destruction
Process OptionPhytoremediation
Thermal desorption
Incineration
EffectivenessMay not be able toachieve RAOs usingthis technology;reduces the toxicityof the waste; maynot afford long-termprotection becauseRAOs may not bemetAble to achieveRAOs using thistechnology;reduceswaste toxicity andvolume; minimizesshort-term impacts;affords long-termprotectionAble to achieveRAOs using thistechnology; reduceswaste toxicity andvolume; minimizesshort-term impacts;affords long-termprotection
ImplementabilityRequires significantperiods of time toimplement; plants maynot grow in heavilycontaminated, clayey,low-nutrient soil; simpletechnology; equipmentand resources readilyavailableTechnically feasible;equipment and resourcesreadily available;throughput is high;implementation time isrelatively short
Technically feasible;equipment and resourcesreadily available;throughput is high
Cost"Low cost
$150 to $400 perton of soil,sediment, orsludge, excludingexcavation,material handling,or disposal costs
$150 to $400 perton of soil,sediment, orsludge, excludingexcavation,material handling,or disposal costs
Screening StatusRejected
Retained
Retained
S:\RAC\ODA03 l\TECH_MEMO\tech_4.wpd 43

TABLE 9 (Continued)
EVALUATION OF PROCESS OPTIONS
GeneralResponse Action
Contaminated soil,sediment, andsludgecontainment
DNAPLcontainment
DNAPL treatment
Remedial TechnologyType
Ex situsolidification/stabilization
Barrier systems
Bioremediation
Process OptionCement/reagent-basedsolidification
Slurry Wall
In situ
Ex situ (Prepared bedlandfill)
EffectivenessMay not be able toachieve RAOs usingthis technology;technologyprimarily used totreat inorganicwastes aftertreatment of organicwastes has beenaccomplishedMay not be able toachieve RAOs.Inhibits mobility.Does not preventfurthercontamination ofground waterMay not be able toachieve RAOs.Reduces toxicitylevels in saturatedzone. Does notreduce volume offree productefficientlyMay not be able toachieve RAOs.Reduces toxicitylevels. May notafford long-termprotection
ImplementabilityNot applicable at MPTCsite as metals are not anissue
Technically feasible;equipment and resourcesreadily available (depthdependent)
Limited technicalfeasibility. Requiresmore time to implement.Time dependent;requires speciallydevelopedmicroorganisms
Limited technicalfeasibility requiressignificant periods oftime. Requires largeportion of the site tooperate. Requires coverdue to significantrainfall
Cosf$75 to $400 perton (withlandfilling on site)and $100 to $500per ton (withlandfilling200 miles off site)
Moderate to high
Low
Low
Screening StatusRejected
Rejected
Rejected
Rejected
S:\RAC\ODA03 l\TECH_MEMO\tech_4.wpd 44

TABLE 9 (Continued)
EVALUATION OF PROCESS OPTIONS
GeneralResponse Action
DNAPL treatment(continued)
Remedial TechnologyType
Extraction
Thermal destruction
Process OptionRecovery Wells
Recovery trench
Incineration
In situ thermal
EffectivenessMay be able toachieve RAOs;reduces the volumeof waste; minimizesresidual risk;affords long-termprotectionAble to achieveRAOs; reduces thevolume of waste;minimizes residualrisk; affordslong-termprotectionAble to achieveRAOs; reduces thevolume of waste;minimizes residualrisk; affordslong-termprotectionMay not be able toachieve RAOs.Effective on mobilevolatile organicDNAPLs.Mobilizes DNAPLsusing subsurfaceheat. Useful onsites where deepground watercontamination is anissue
ImplementabilityTechnically feasible;equipment and resource?readily available.Limited in applicabilityto very mobile DNAPL
Technically feasible;equipment and resource?readily available
Only off-site treatmenttechnology allowed bylaw; technically feasible;equipment and resource?readily available
Technically feasiblelimited demonstration,emerging technology,complicated installation,and O&M.
CosfLow to moderate
Moderate
High
Moderate to high
Screening StatusRetained
Retained
Retained
Rejected
S:\RAC\ODA03 l\TECH_MEMO\tech_4.wpd 45

TABLE 9 (Continued)
EVALUATION OF PROCESS OPTIONS
GeneralResponse Action
Debris disposal
Institutionalcontrols
Remedial TechnologyType
Off-site disposal
Access restrictions
Process OptionRCRA landfill
Deed notices, fencing,and signs
EffectivenessAble to achieveRAOs; reduces thevolume of waste;minimizes residualrisk; affordslong-termprotectionWill not achieveRAOs withoutadditional treatmentmeasures. Providesa measure of shortand long-termprotection; restrictssite access; provideswarning
ImplementabilitySimple technology withhigh throughput;equipment and resourcesreadily available
Simple technology;rapid implementation;equipment and resourcesreadily available
Cosf$110 per ton
Low to moderate
Screening StatusRetained
Retained
Notes:
a Unit costs include treatment costs of media only and are not inclusive of ancillary tasks, which may include design fees, construction oversight,mobilization/demobilization, permit fees, etc.
DNAPL Dense nonaqueous-phase liquidMPTC Marion Pressure Treating CompanyO&M Operations and maintenanceRAO Remedial action objective
S:\RAC\ODA03 l\TECH_MEMO\tech_4.wpd 46

7.0 SCREENING OF TECHNOLOGIES
This section first presents the criteria used to evaluate the potentially applicable remedial technologies
and summarizes those technologies that satisfied the criteria. This is followed by a detailed evaluation of
the technologies identified in Section 3.2 using these criteria. Table 9 summarizes the screening of
technologies described throughout the rest of this section.
7.1 EVALUATION CRITERIA
Using the elements of the effectiveness criterion, each technology is evaluated and compared among
similar technologies. Alternatives that are significantly less effective than other, more promising
technologies are eliminated.
miplementability addresses both the technical and institutional feasibility of applying a technology.
Technologies are elevated based on technical feasibility, availability of resources and equipment, and the
administrative feasibility of implementing the technologies. The technology should be able to be
implemented in a cost-effective and timely manner. In addition, the implementation of the technology
should not cause substantial public concerns. Site accessibility, available area, and potential future use
of the property may also affect the implementation of certain technologies.
Technologies that are unworkable under site-specific conditions, including waste volumes and
concentrations, are omitted from consideration. Mobilization and permitting requirements, where
applicable, must be workable and previously demonstrated at similar sites. Preliminary consideration is
also given to regulatory constraints, such as handling, disposal, and treatment requirements that will
affect the implementation of certain remedial technologies. Technologies that are not technically or
administratively feasible or that would require equipment, specialists, or facilities that are not available
in a reasonable period of time are removed from further consideration.
Any technology that delivers levels of effectiveness and implementability similar to other technologies,
but at a significantly greater cost, is eliminated. Technologies that are equivalent in cost but are clearly
less effective than other retained technologies also are rejected. Otherwise, cost is not used as a criterion
to screen technologies at this point in the process.
S:\RAC\ODA031\TECH_MEMO\tech_4.wpd 47

7.2 TECHNOLOGY EVALUATION
This section presents a detailed evaluation of the technologies identified for each GRA in Section 6.1using the criteria presented in Section 7.1.
7.2.1 Soil, Sediment, and Sludge Treatment General Response Action Technologies
The treatment technologies identified for contaminated soil, sediment, and sludge includebioremediation, thermal desorption, and incineration.
7.2.1.1 Bioremediation
Microbial communities in soil typically have a high potential to degrade a wide range of organic
compounds, including creosote and associated hydrocarbon wastes (American Academy of
Environmental Engineers [AAEE] 1995). Biological degradation can occur in the presence of oxygen
(aerobic) or in the absence of oxygen (anaerobic). Aerobic processes ultimately convert the organiccontaminants into carbon dioxide, humic materials, and microbial biomass. Anaerobic degradation
produces carbon dioxide, methane, and microbial biomass (EPA 1995).
In general, bioremediation processes are limited by the soil type. These processes are more difficult toapply to clayey and other low-permeability soil. Sites containing biodegradable compounds might not be
suitable for bioremediation if the contaminant concentrations are high and RAOs are low. This isparticularly true of a contaminant that is at least moderately resistant to biodegradation, such as the
carcinogenic PAHs. Bioremediation also can be precluded when the contaminant is unavailable to thebacteria, such as when PAHs are strongly sorbed to the soil particles (AAEE 1995).
Contaminated media may be treated by ex situ or in situ processes. The ex situ processes evaluatedinclude slurry-phase (bioreactor) and solid-phase (composting and prepared-bed landfarming)
technologies. Landfarming and phytoremediation were the only in situ processes evaluated.
Ex situ methods usually require less time for treatment than in situ methods. However, theimplementation of either bioremediation method requires much more time than other technologies such
S:\RAC\ODA031\TECH_MEMO\tech_4.wpd 48

as thermal desorption. The main advantage ofbioremediation is its low cost in comparison to that of
other technologies. Bioremediation effectively treats two-, three-, and four-ring PAHs; however, it doesnot effectively treat five- and six-ring PAH compounds. As well, it does not effectively treat high levels
of residual creosote (EPA 1995). The following sections describe and evaluate ex situ and in situbioremediation processes.
Ex Situ Bioremediation Technologies—Slurry-Phase Treatment
The slurry-phase treatment technology maintains contaminated soil as an aqueous slurry in a bioreactorvessel during biodegradation. Basic features of the process include soil-handling equipment, a reactor
vessel, aeration equipment, mechanical mixing equipment, dewatering equipment, and an emissioncontrol system. Soil is mixed with nutrient-amended water to form a slurry. Residence time in the
reactor is determined by the type of contaminant. Following treatment, the mixture is dewatered, and thesoil is reconstituted. Process water is reused. The system is operated to maximize mass transfer rates
and contact time between the contaminants and microorganisms.
This technology can treat creosote wastes effectively; however, it may not be able to attain the RAOs.Adverse impacts from operating a slurry reactor would be minimal. Typical short-term impacts wouldinvolve health and safety concerns for workers excavating and handling contaminated soil. Becauseemission controls would be used, impacts to nearby residents would be slight-
Technical implementability of this technology at the MPTC site is limited. For example, the
biodegradation rate in a slurry reactor is fairly high, but the throughput is relatively low. This low
throughput would require several years to treat large volumes of contaminated soil. Slurry reactors arecomplex and require constant supervision. Their effectiveness may be limited by the high influentconcentrations of free-phase DNAPL, which might require pretreatment.
Treatment costs range from $100 to $150 per cubic yard (cy). Consequently, this treatment technology is
not retained for detailed analysis.
S:\RAC\ODA03 l\TECH_MEMO\tech_4.wpd 49

Ex Situ Bioremediation Technologies—Solid-Phase Treatment
The composting technology uses a batch biological process that treats material containing high
concentrations of biodegradable organic compounds. Waste destruction and conversion are achieved
with thermophilic, aerobic microorganisms that occur naturally in the soil. The composting process
involves excavating contaminated soil and mixing it with bulking agents and organic amendments.
Maximum degradation efficiency is achieved by maintaining moisture content, pH, oxygenation,temperature, and carbon-to-nitrogen ratio (AAEE 1995; U.S. Department of Defense [DoD 1994]).
Typical composting systems include in-vessel, aerated static pile, and windrow. The in-vessel
composting process involves placing compost in a reactor vessel in which it is mixed and aerated. The
aerated static pile process involves forming the compost into piles and aerating these piles with blowers
or vacuum pumps. The Windrow composting process involves placing compost in long piles and mixing
it periodically using mobile equipment. The static pile and Windrow composting systems require (1) alarge concrete surface for maintenance of the compost and (2) a covered area to prevent rainfall fromaffecting the moisture content of the compost (AAEE 1995; U.S. DoD 1994).
The prepared-bed landfarm technology requires an above-grade area surrounded by berms. The area islined and contains a leachate recovery system. Contaminated soil is applied and mixed with the
uncontaminated surface soil. Nutrients are applied regularly to enhance the natural organic degradation
of the contaminants (AAEE 1995). Landfarming is limited by the large amount of space that is required
and the long time periods required for maximum biodegradation (U.S. DoD 1994).
Solid-phase treatment processes can treat creosote wastes effectively. However, these processes may notbe able to attain the RAOs. Adverse impacts from composting or landfarming would be slight, togeneral, short-term impacts would involve health and safety concerns for workers excavating andhandling soil and treating leachate from the operation of the landfarm. Because these processes would
destroy organic contaminants, long-term impacts to residents would be minimal.
Costs for the Windrow composting system average $190 per cy; the static pile composting system isslightly more expensive. Costs for the prepared-bed landfarming technology range from $100 to
$200 per cy (U.S. DoD 1994).
S:\RAC\ODA031\TECH_MEMO\tech_4.wpd 50
The technical implementability of these technologies at the MPTC site would be limited by their slow
biodegradation rates and by the lack of available area on the site. The slow degradation rates would
require a great deal of time to treat large volumes of contaminated soil. The site receives considerable
rainfall, which can adversely affect degradation rates. Therefore, adequate cover over a significantportion of the site would be necessary to prevent the rainfall from saturating the compost or landfarm.These processes require large areas, potentially limiting the excavation of contaminated soil. Theireffectiveness may also be limited by the high influent concentrations of free-phase DNAPL, which mightrequire pretreatment (AAEE 1995; U.S. DoD 1994; EPA 1993). Consequently, these treatmenttechnologies are not retained for detailed analysis.
In Situ Bioremediation Technologies—Landfarming
In situ land farming involves either (1) applying contaminated soil to uncontaminated surface soil,followed by tilling, or (2) tilling contaminated surface soil. Organic wastes are metabolized by nativemicrobial populations. Inorganic wastes are immobilized by the clay particles in the surface soil.
Initially, nutrient application may enhance the organic degradation rates. In subsequent years, these
applications may be unnecessary (AAEE 1995; EPA 1995).
Conditions advantageous for biodegradation of contaminants are largely uncontrolled; this increases thelength of time required to complete remediation, particularly for compounds that are resistant tobiodegradation (EPA 1993). As well, native microbial populations may not be able to adequatelydegrade carcinogenic PAHs.
Implementation of the landfanning technology is limited by the amount of open space required for land
application of excavated soil. A landfarm operation would require minimal equipment and manpower.
The landfanning technology is probably the cheapest treatment technology evaluated for use at theMPTC site; unit costs range from $25 to $50 per cy (U.S. DoD 1994). However, this technology requiresseveral years to treat contaminated soil. Therefore, it is not retained for detailed analysis.
S:\RAC\ODA031 \TECH_MEMO\tech_4.wpd 51

In Situ Bioremediation Technologies—Phytoremediation
Plants can be used to remediate contaminants through a process called phytoremediation, which is
exclusively an in situ remediation technology. Phytoremediation is an effective alternative toconventional remediation technologies for several reasons (Boyajian 1997):
• Because of the extensive surface area of plant root systems (about 300 million kilometersof roots per hectare), uptake and degradation of contaminants are highly effective.
• Enzymes isolated in certain plant species have been proven to degrade organic moleculesinto required nutrients for the plant, as opposed to conventional remediation technologiesthat concentrate contaminants or transfer them from one media to another.
• Implementation of phytoremediation is natural and cost effective.
At the MPTC site, phytoremediation may not be feasible because plants are frequently unable to grow inheavily contaminated soil such as those found at the site. Phytoremediation is only applicable to
contaminants in the upper few feet of the subsurface. Much of the free-phase DNAPL is located below a
depth of 10 ft bgs. Also, phytoremediation requires more time than conventional treatment technologies;
several years are needed to establish plant communities. Other factors that may hinder effectivephytoremediation include compaction of the clayey soil and the low nutrient content of the soil.
Consequently, phytoremediation is not retained for detailed analysis.
7.2.1.2 Thermal Desorption
The thermal desorption treatment technology is an ex situ means of physically separating organic
contaminants from soil. The on-site, direct-fired, low-temperature thermal desorption (LTTD) processwas evaluated for this FS. For this process, the contaminated soil is excavated and delivered to the
desorber. Large objects are screened from the soil, which is then fed into the desorber by augers and afeed hopper. Inside the desorber, the soil is heated, volatilizing the water and organic contaminants.Wastes are typically heated to temperatures of 600 to 1,000 °F. The soil temperatures and residencetimes are designed to volatilize, but not oxidize, selected contaminants. Negative pressure is used to
sweep gases and dust from the desorber. Organics in the off-gas are collected and burned in an
afterburner. Particulates are removed by conventional air pollution control (APC) methods. The treatedsoil is cooled and reconstituted in a pug mill. Water is added to control dust emissions. The soil is then
S:\RAC\ODA031 \TECH_MEMO\tech_4.wpd 5 2

stored and sampled to assess the efficacy of treatment. Because the soil must be stored, dust and rainfallnmon and runoff controls are employed (AAEE 1995; U.S. DoD 1994).
At the MPTC site, thermal desorption would treat creosote-contaminated soils successfully and achieve
the RAOs. The LTTD process would destroy the contaminants, thereby eliminating their toxicity and
reducing their volume. This would minimize long-term impacts to residents. Short-term risks to site
workers would include potential exposures to contaminants via skin contact and air emissions, whichcould be mitigated by using the appropriate personal protective equipment (PPE) (EPA 1993).
Sufficient capacity could be designed into an on-site LTTD system to treat contaminated soil within 1 to2 years. Technical limitations include process residuals and problems with caking of cohesive soil. Theprocess may generate waste streams that must be treated, including condensed water and APC wastes
depending on the type of unit employed. Clayey soil might cake during treatment, thereby slowing
processing rates (AAEE 1995; EPA 1995). m addition, debris screened from the preprocessing of soilswill require treatment and disposal by other means.
LTTD costs are moderate to high, about $150 to $400 per ton of contaminated soil (EPA 1995).Consequently, this technology is retained for detailed analysis.
7.2.1.3 Incineration
The incineration technology is used to destroy organic components in a waste stream. By transformingthe organic component into carbon dioxide and water vapor, an incineration system reduces the volume
and toxicity of the waste. Different system designs have been developed to incinerate liquid, solid, andgaseous hazardous wastes. Because most of the wastes at the MPTC site are solid, this section describesan example of an on-site incineration system applicable to soil.
The solid hearth incinerator is a common system for incinerating solid hazardous wastes. This type of
incinerator is also known as the rotary kiln incinerator. It consists of a refractory-lined cylinder that restson trunnions and rotates slowly on its longitudinal axis. The kiln within the cylinder is sloped 1 to
2 degrees from the feed end to the ash discharge end so that the waste moves horizontally and radiallythrough the cylinder. Wastes are burned as they move toward the ash discharge end. While the ash is
S:\RAC\ODA031 \TECH_MEMO\tech_4.wpd 5 3

being discharged at the low end, the flue gases from the kiln pass into a secondary combustion chamberand are heated to an even higher temperature for complete destruction. Combinations of wastes can be
burned in this type of incinerator, and the liquid component can be used as auxiliary fuel (LaGrega and
others 1994).
During incineration, volatilization and combustion convert the organic contaminants to carbon dioxide,water, hydrogen chloride, and sulfur oxides. Incinerator off-gas requires treatment by an APC system to
remove particulates and neutralize acid gases (EPA 1995). Particulates are removed by baghouses,venturi scrubbers, and wet electrostatic precipitators; acid gases are removed by packed-bed scrubbersand spray dryers (U.S. DoD 1994).
At the MPTC site, contaminated soil would be excavated and transported to an on-site incinerator fortreatment. Free-phase creosote that is collected during excavation activities would also be incinerated.Treated soil and ash would be used on site as backfill.
Incineration of creosote-contaminated wastes would easily achieve RAOs. Because the contaminants
would be destroyed, their toxicity would be eliminated, and their volume would be reduced. Short-term
risks would include those associated with the excavation and handling of contaminated soil. Appropriate
PPE for site workers would minimize potential exposure by skin contact or inhalation.
Incineration is a full-scale technology. Significant experience with this technology has demonstrated thatit is technically implementable. The unit costs for incineration are comparable to those forLTTD—about $150 to $400 per ton of contaminated soil (U.S. DoD 1994). Consequently, this treatmenttechnology is retained for detailed analysis (EPA 1995).
7.2.2 Soil, Sediment, and Sludge Containment General Response Action Technologies
The containment technology identified includes ex situ solidification/stabilization.
The mobility and toxicity of certain contaminants may be reduced by solidification or stabilizationtechniques. Solidification is a process by which sufficient quantities of reagents are added to a waste toresult in a solidified mass of material. Reagents are added in order to (1) increase the strength of the
S:\RAC\ODA03 l\TECH_MEMO\tech_4.wpd 54
mixture, (2) decrease the compressibility of the mixture, and (3) decrease the permeability of the mixture.
Stabilization is a process that uses additives to reduce the hazardous nature of a waste by converting the
waste and its hazardous constituents into a form that minimizes the rate of contaminant migration orreduces the level oftoxicity (EPA 1995; LaGrega and others 1994).
The most common solidification/stabilization reagents are cement, pozzolans (fly ash or kiln dust), lime,organophilic clay, and powdered carbon. Some organic constituents can interfere with the pozzolanicreactions, rendering the process ineffective.
Solidification and stabilization is primarily used to treat inorganic wastes after treatment of the organic
wastes has been accomplished. Treatment of organic wastes through solidification/stabilization is much
less effective on organic contaminants than on inorganic contaminants. Because inorganic wastes arenot contaminants of concern at this site, this process was not retained for further evaluation.
7.2.3 DNAPL Containment General Response Action Technologies
The DNAPL containment technology identified was a slurry wall.
A slurry wall is a subsurface barrier consisting of vertically-excavated trenches filled with slurry. The
slurry hydraulically shores the trench to prevent collapse and retards ground water flow whileimpermeable material is placed in the trench displacing the slurry.
A slurry wall is used to contain contaminated ground water and DNAPL and provide a physical barrier.
It is used where waste mass is too large for treatment and where soluble and mobile constituents pose a
threat to water resources.
Slurry walls are typically placed at depths up to 100 feet and are generally 2 to 4 feet thick. The mosteffective application of the slurry wall is to base (or key) the slurry wall 2 to 3 feet into a low
permeability layer, such as a clay or bedrock.
Slurry walls contain contamination but do not treat the contamination.
S:\RAC\ODA03 l\TECH_MEMO\tech_4.wpd 55

Factors that limit applicability and effectiveness include the following:
• Uses heavy construction equipment and methods
• Some backfills are not able to withstand an attack by strong acids, bases, salts, and someorganic chemicals
• Potential for slurry wall to degrade over time
• Use of technology does not guarantee that further remediation in the future may not benecessary
Slurry walls have been used for decades. The equipment and methodology are readily available and well
known; however, the process of designing the proper mix of wall materials is less well developed.Excavation and installation requires experienced contractors.
Costs likely to be incurred in the design and installation range from $5.00 to $7.00 per square foot(1991 dollars).
This technology was rejected for use at the MPTC site as it will not attain RAOs for removal of sources.
7.2.4 DNAPL Treatment General Response Action Technologies
The DNAPL treatment technologies identified included bioremediation, in situ thermal desorption, and
extraction with off-site incineration.
7.2.4.1 Bioremediation
Bioremediation is a process in which indigenous or inoculated microorganisms degrade organiccontaminants found in soil and ground water.
Bioremediation processes are grouped as to where they are applied, either in situ or ex situ.
S:\RAC\ODA031 \TECH_MEMO\tech_4.wpd 56
In Situ Bioremedation
In situ bioremediation processes treat contaminated media in place. Enhanced processes deliver nutrients
to biological communities to stimulate growth and accelerate the capacity to breakdown contamination
into less toxic constituents.
Identified characteristics of the ideal candidate site for successful implementation of in situbioremediation (Sulfita 1989) include:
• Homogeneous and permeable aquifer
• Contaminant originating from a single source
• A low ground water gradient
• No free product
• No soil contamination
• An easily degraded, extracted, or immobilized contaminant
Cost can be as high as $150 per pound of contaminant removed.
This technology was rejected based on the indeterminate extent ofDNAPL, the resistance of creosote tobiological degradation, the length of time to implement the technology, and the high cost.
Ex Situ Bioremediation
Ex situ bioremediation technologies are those in which a waste that has been removed from the site is
treated in a closed or open bioreactor. Liquids and solids are amenable to ex situ treatment.
The technology relies on the ability of microorganisms to metabolize the contaminant of concern. Theprocess runs 24 hours a day, 7 days a week, and the system cannot be turned off and on.
The organisms do not respond well to environmental upsets and operate best within optimum ranges ofmoisture, temperatures, and pH.
S:\RAC\ODA03 l\TECH_MEMO\tech_4.wpd 57

The process requires extensive handling and monitoring.
This technology was rejected because of similar limitations noted in Section 7.2.1.1, the resistance ofcreosote to biological degradation, and the length of time required to implement the technology.
7.2.4.2 In Situ Thermal Desorption
m situ thermal desorption uses an array of subsurface heat sources to volatilize contaminants. Soil
temperatures are raised to 1,000 °F and above. Vapors liberated from the soil and ground water arecaptured and treated.
This technology is applicable to sites with permeable soils and contaminants that lend themselves tovaporization. The technology runs 24 hours a day and is fuel/energy intensive. Site contamination mustbe well defined and delineated. Operation and maintenance is intensive.
Full-scale operation costs can approach $120 to $200 per cy soil treated and up to $130 per galloncontaminant recovered.
This technology was rejected because of the implementation cost and technical challenges of installation,
operation, and maintenance.
7.2.4.3 Extraction and Off-Site Incineration
Physical extraction of free phase DNAPL is a technology that is well known and readily available.
Off-site incineration destroys the source of contamination once it is extracted.
Once the DNAPL pool has been defined, extraction of DNAPL can be accomplished by use of anextraction well or interceptor trenches.
S :\RAC\ODA031 \TECH_MEMO\tech_4.wpd 5 8
Recovery Trenches
Recovery trenches, also known as interceptor trenches, are widely used to control the flow of subsurfacefluids and to recover contaminants, including DNAPL. A recovery trench provides a long horizontal
zone with which to collect fluids. The advantage of this linear feature is its ability to increase the rate ofrecovery from low-permeability formations (EPA 1994a).
A recovery trench typically consists of the following components (Wagner and others 1986):
• Drain pipe and gravel bed—used to convey fluids to a wet sump
• Filter—used to prevent fine particles from clogging the system
• Backfill—used to bring the trench to grade and prevent surface ponding
• Wet sump—used to collect fluids and transfer them to storage tanks
Standard construction equipment (typically a backhoe) is used to install a DNAPL recovery trench. Thetrench would be keyed into the underlying clay confining layer. Shoring would be used during
excavation, if needed. The drain pipe, gravel bed, and filter would be installed along the trench walls.Each drain pipe would be connected to a lateral that would discharge into the wet sump.
In some systems, the use of two drain pipes may enhance DNAPL recovery: one drain in the DNAPL
itself and one drain in ground water above the DNAPL drain. The act of pumping ground water from theupper drain produces drawdown of the water and upwelling or mounding of the product. By pumpingboth drains, drawdown of both ground water and DNAPL is achieved (EPA 1994a).
To enhance DNAPL recovery, water removed from the upper drain of the two-drain system can be
reintroduced to the system through a nearby trench or drain. The reintroduction of the water to the
aquifer system enhances the hydraulic gradient, further driving the mobile DNAPL (EPA 1994a).
However, at the MPTC site, the shallow ground water is not used as an aquifer and its capacity to movethrough subsurface media is not high. Therefore, a recovery trench that concentrates solely on DNAPL
recovery would be proposed.
S:\RAC\ODA03 l\TECH_MEMO\tech_4.wpd 59

Recovery trenches would effectively reduce the volume of free-phase DNAPL. This technology would
afford protection by providing a means of removing DNAPL, thereby reducing the risk of contamination
to the underlying aquifers. This technology could be implemented easily at the MPTC site. Equipmentand supplies would be readily available. Costs for this technology would be moderate; therefore, it wasretained for inclusion in the suite of alternatives retained.
Vertical Recovery Wells
Vertical recovery wells (VRW) are similar to recovery trenches in their function, except that they can beinstalled at a much lower cost and provide removal at distinct points. The VRW system relies on
overlapping hydraulic radii to cover the area of concern rather than a continuous removal trench. VRWs
may be difficult to use for DNAPL recovery in some cases due to the difficulty in locating the pool andin lowering the gradient of the DNAPL so that it can be drawn toward the well. However, in DNAPLpools that are sufficiently contained within a lower confining layer, VRWs can be a cost-effectivemethod of source removal. In, addition, VRWs can be installed to much lower depths than can becost-effectively reached by other technologies.
The VRW consists of the following components:
• Well casing and well screen (either polyvinyl chloride [PVC] or stainless steel)
• Filter pack around the screened portion of the well
• Concrete backfill between the well casing and well bore
• Concrete pad at the surface with locking well cover
This technology, although limited in its use, was retained for inclusion in the alternative packages
pending the delineation of the DNAPL pool and associated lower confining layer(s).
Horizontal Recovery Wells
Horizontal recovery wells (HRW) are similar to both recovery trenches and VRWs. The HRW normallystarts off as a VRW but is "kicked off at some predetermined depth and horizontally drilled above theconfining layer. Its primary benefit is its enhanced removal of DNAPL from tight subsurface formations
S:\RAC\ODA031\TECH_MEMO\tech_4.wpd 60

along a well defined confining layer. It is also used in areas that may be inaccessible to VRWs andtrenches such as under buildings, roadways, and water courses. HRWs are technically difficult to install,require a well-defined DNAPL pool and confining layer, and are more expensive than VRWs.
This technology, although limited in use, was retained for inclusion in the alternative packages pending
the delineation of the DNAPL pool and associated lower confining layer(s).
Off-Site Incineration
Incineration is the combustion of excavated soils, sludges, and liquids that thermally destroyscontaminants. It is used in conjunction with an air emissions control system. This technology would be
applied off site.
A more detailed description of the general technology is included in Section 7.2.1.3. Additional costs
would be incurred in transporting the DNAPL from the site to the incinerator.
This technology was retained for inclusion in the suite of alternatives retained.
7.2.5 Debris Disposal General Response Action Technology
This technology includes excavating debris in on- and off-site areas and transporting it to either a RCRA
Subtitle C or Subtitle D landfill, depending on the whether it is hazardous or nonhazardous.
On-site and off-site debris soil could be excavated using trackhoes or rubber-tired loaders. Contaminateddebris would be transported by dump truck to a RCRA-permitted landfill in either Carlyss, Louisiana, or
Monroe, Louisiana.
Excavation and off-site landfilling would achieve RAOs by reducing the volume of contaminated debris
on site. This technology would minimize residual risks by removing all contaminated debris from thesite. However, disposal does not treat the wastes; it merely transfers them from one location to another.
S:\RAC\ODA031\TECH_MEMO\tech_4.wpd 61

This remedy could be implemented easily at the MPTC site. Workers would require minimal training,and the equipment would be readily available. Implementation would require many trips to the landfill.
This drastic increase in truck traffic could heighten the chances of accidents and accelerate wear of local
roads.
Costs for this technology are similar to those for treatment technologies. Transportation and disposal
costs are $130 per ton. Consequently, this technology is retained for inclusion in the alternativepackages.
8.0 SUMMARY
The presumptive remedy approach for wood treater sites identified bioremediation, LTTD, incineration,
and stabilization as technologies worthy of consideration. Review of site-specific constraints, RI,HHRA, and ERA findings and technical limitations eliminated all but LTTD and incineration for a moredetailed analysis in the FS. These technologies will be combined with (1) the treatment extraction andoff-site incineration technology retained for the DNAPL source area and (2) the excavation and off-sitedisposal technology retained for surface and subsurface debris. Together, these technologies will meet
the RAOs and PRGs for the MPTC site.
S:\RAC\ODA03 l\TECH_MEMO\tech_4.wpd 62

REFERENCES
American Academy of Environmental Engineers (AAEE). 1995. Innovative Site RemediationTechnology. Volumes 1 to 8.
Bagchi, A. 1990. Design, Construction, and Monitoring of Sanitary Landfill. John Wiley and Sons, me.
Bouwer, Herman. 1978. Ground Water Hydrology. McGraw-Hill Book Company. New York, NewYork.
Boyajian, George E., Ph.D. 1997. "Phytoremediation: It Grows on You." Soil and Ground WaterCleanup. March.
Conklin, Alfred R. Jr., Ph.D. 1997. "The Growing Importance of Plants in Remediation." Soil andGround Water Cleanup. June.
Department of Conservation Louisiana Geological Survey (DCLGS). 1972. "Water Resources of UnionParish, Louisiana" Water Resources Bulletin No. 17.
Ecology & Environment, me. (E&E). 1995a. "Site Assessment Report for Marion Pressure Treating."January 20.
E&E. 1995b. "Preliminary Assessment Report for Marion Pressure Treating Company." April 28.
E&E. 1995c. "Site Assessment Report for Marion Pressure Treating Company." October 20.
E&E. 1997a. "Site Inspection Report for the Marion Pressure Treating Company." January.
E&E. 1997b. "Removal Assessment Report for the Marion Pressure Treating Company." January.
E&E. 1999. "HRS Documentation and References 1-29 for the Marion Pressure Treating CompanySite." October.
Freeze, R. Allan, and John A. Cherry. 1979. "Groundwater." Prentice-Hall, Inc.
LaGrega, M.D., and others. 1994. Hazardous Waste Management. McGraw-Hill, me.
Louisiana Department of Environmental Quality (LDEQ). 1999. "Expanded Site Investigation Reportfor Marion Pressure Treating Company." September.
LDEQ. 2000. Letter "Request for Applicable or Relevant and Appropriate Requirements (ARARS),Marion Pressure Treating Superfund Site. ADD #01482, LAD 008 473 142. Marion, UnionParish, Louisiana." From Keith Casanova, LDEQ, to Wren Stenger, EPA Region 6. June 28.
Sulfita, J.M. 1989. "Microbal Ecology and Pollutant Biodegradation in Subsurface Ecosystems: mTransport and Fate of Contaminants in the Subsurface. EPA/625/4-89/019, Robert S. Ken-Environmental Research Laboratory, U.S. EPA, ADA, Oklahoma.
S:\RAC\ODA031\TECH_MEMO\tech_4.wpd 63
REFERENCES (Continued)
Tetra Tech EM Inc. (Tetra Tech). 2000a. "Site Management Plan for the Marion Pressure TreatingCompany Remedial Investigation/Feasibility Study." Response Action Contract for Remedial,Enforcement Oversight, and Nontime-Critical Removal Action in U.S. Environmental ProtectionAgency (EPA) Region 6. March.
Tetra Tech. 2000b. "Field Sampling Plan for the Marion Pressure Treating Company RemedialInvestigation/Feasibility Study." Response Action Contract for Remedial, EnforcementOversight, and Nontime-Critical Removal Action in EPA Region 6. July.
Tetra Tech. 200 la. "Draft Remedial Investigation Report for Marion Pressure Treating Company."Prepared for EPA. Conducted under Contract No. 68-W6-0037. April 6.
Tetra Tech. 200 Ib. "Marion Pressure Treating Company Human Health Risk Assessment." Preparedfor EPA. Conducted under Contract No. 68-W6-0037. April 13.
Tetra Tech. 200 Ic. "Marion Pressure Treating Company Baseline Ecological Risk Assessment."Prepared for EPA. Conducted under Contract No. 68-W6-0037. May 25.
Tetra Tech. 2001d. "Marion Pressure Treating Company Screening Level Ecological Risk Assessment."Prepared for EPA. Conducted under Contract No. 68-W6-0037. May 7.
Texas Natural Resource Conservation Commission (TNRCC). 1999. Risk Reduction Rule.
U.S. Census Bureau. 2000. Website - http://www.census.gov/population. November.
U.S. Department of Agriculture (USDA). 1997. "Soil Survey of Union Parish, Louisiana." SoilConservation Service. November.
U.S. Department of Defense (U.S. DoD). 1994. Remediation Technologies Screening Matrix andReference Guide. Second edition. Environmental Technology Transfer Committee. October.
EPA. 1988a. "Guidance for Conducting Remedial Investigations and Feasibility Studies UnderCERCLA, Interim Final. OSWER Directive 9355.3-01. October.
EPA. 1988b. "CERCLA Compliance With Other Laws Manual: Interim Final." Office of Emergencyand Remedial Response (OERR). EPA/540/G-89/006. August.
EPA. 1989a. "Risk Assessment Guidance for Superfund (RAGS), Volume I, Human Health EvaluationManual, Part A." EPA/540/1-89/002. OERR. Washington, DC. December.
EPA. 1989b. "CERCLA Compliance With Other Laws Manual: PartIL Clean Air Act and OtherEnvironmental Statutes and State Requirements." OSWER Directive 9234.1-02. August.
EPA. 1991. "Design and Construction of RCRA/CERCLA Final Covers." Office of Research andDevelopment (ORD). EPA/625/4-91/025. May.
EPA. 1992. "Contaminants and Remedial Options at Wood Preserving Sites." Risk ReductionEngineering Laboratory, ORD. EPA/600/R-92/182.
S:\RAC\ODA03 l\TECH_MEMO\tech_4.wpd 64
REFERENCES (Continued)
EPA. 1993. "Presumptive Remedies: Policies and Procedures." OERR Publication 9355.0-47.September.
EPA. 1994a. "Alternative Methods for Fluid Delivery and Recovery." ORD. EPA/625/R-94/003.September.
EPA. 1994b. "Superfund Innovative Technology Evaluation Program Technology Profiles." SeventhEdition. ORD. EPA/540/R-94/526. November.
EPA. 1995. "Presumptive Remedies for Soils, Sediments, and Sludges at Wood Treater Sites."OSWER Directive 9200.5-162. December.
EPA. 1996. EPA Presumptive Response Strategy and Ex Situ Treatment Technologies for ContaminatedGround Water and CERCLA Sites. October.
EPA. 1997. "Seminar Series on Wood Preserving Site Remediation." ORD. EPA/625/K-97/002. June.
EPA. 1998. "Presumptive Response Strategy and Ex Situ Treatment Technologies for ContaminatedGround Water at CERCLA Sites." OSWER Directive 9283.1-12. October.
EPA. 2000a. Fact Sheet "Marion Pressure Treating Company," EPA Region 6. November.
EPA. 2000b. Letter "Request for Applicable or Relevant and Appropriate Requirements." FromWren Stenger, EPA Region 6, to Keith Casanova, LDEQ. June 16.
EPA. 2001. Letter from David Riley to Bart Canellas Regarding PRGs. June 18.
Wagner, K., K. Boyer, R. Claff, M. Evans, S. Henry, V. Hodge, S. Mahmud, D. Samo, E. Scopino, andP. Spooner. 1986. Remedial Action Technology for Waste Disposal Sites. NoylesDataCorporation, Park Ridge, New Jersey.
Roy F. Weston. 1995. "Preliminary Assessment Report, Marion Pressure Treating Company,Marion, Louisiana, EPA CERCLA I.D. No. LAD008473142." April 28.
S:\RAC\ODA03 l\TECH_MEMO\tech_4.wpd 65

APPENDIX A
CALCULATIONS SHOWING SITE-SPECIFIC SOILcwi VALUESMARION PRESSURE TREATING COMPANY
(Six Pages)

TABLE A-l
BIG CREEK SEDIMENT SOURCE AREAMARION PRESSURE TREATING COMPANY
Marion Pressure Treating CompanyCalculation ofSoilsscw valuesAssumes soil type in drainage pathways is Guyton (Gy).
Equation: Csoil (mg/kg) - GW 1 (Pb x Kd + Theta.w + Thcta.a x H')Pb
Soilciv 8.6 23 29 120 76 540 9.2Parameter___________________Benzo(a)anthracene Benzo(a)pyrene Benzo(b)fluoranthene Benzo(k)fluornnthene Chrysene Pibenzo(a,h)anthracene lndeno(l,2,3-cd)pyrene
M01-GWI (mg/L)
Pb (g/cm-')Theta-w (Lwater/Lsoil)Kd (cin'/g)Koc (cm'/g)foe%OMThcla-a (Lair/Lsoil) n-Thela.wn (Lpores/Lsoil) l-(Pb/Ps)Ps (g/cm')H (atm-m'/mol)H=Hx41@25CCalcultttd, Method 1 Soilr,^
1.05540.21
0,0135m
0.39170.6017
1.65
0.0002
4.84E+033.38E+03
3.3SE-061.37E-04
19.34
0.0001
1.31E+049.69E+03
1.13E-064.63E-05
52.35
0.000;
I.66E+041.33E+06
1. HE-044.55E-03
66.45
0.00091
1.66E+041.23E+OS
8.29E-0'3.40E-05302.34
0.0091
5.38E+033.98E+OS
9.-16E-053.88E.03978.34
0.0/
2.42E+04;. "9£+0o
I.-1'E-OS6.03 E-074835.10
0.000-1
4.69E+043.-1~E+06
1.SHE-066.56E-05374.92
Notes:Site-specific values were calculated using the upper end of the range of site-specific physical and geological values reported in Attachment A for this residual source area, Theheterogeneity of the soils yields a range of values, any one of which may be representative of the area.See page 2 of table for additional notes.
mptc_sed.xls

TABLE A-l
BIG CREEK SEDIMENT SOURCE AREAMARION PRESSURE TREATING COMPANY
Marion Pressure Treating CompanyCalculation of Soilfficn valuesAssumes soil type in drainage pathways is Guylon (Gy).
Equation: Csoil (nig/kg) - GW1 (Pb x Kd + Theta.w + Thela.a x H ' )Pb
410 120 24 1200 230 170 420 1100Acenapthene Anthracene Biphenyl Carbazole" Dibenzofuran Fluoranthene Fluorene Naphthalene 2-Methylnaphthalene' Phenanlhrene* Pyrene
0.3- 1.8 0.3 0.03 O.OH 1.3 0.14 0.91 l.S
Kd (cm7g)Koc (cni'/g)
6.62E+01•I.ME+03
3,165+021.3-IE-t-O-l
6.93E+015.13E+03
3.31E+012.-ISE+03
1.05E+02'.SOF.W
6.63E+024.91E+0-1
1.04E+02 1.61E+01' . ' I E + 0 3 1.19EW3
5.90E+014.3'E*03
1.90E+02 9.18E+02I . ^ I E i - 0 - 1 6.SOE+0-1
H (ann-in /mol)H'=Hx41@25C
1.55E-046.36E-03
6.SOE-052.67E.03
1.2SE-0:5.13E-01
3.3SE-031.39E.01
1.30E-OS5.33E-04
1.61E-OS6.60E-04
6.3SE-DS2.61E-03
4.8SE-041.98E-02
I . S S E - 0 ]759E-01
5.-IOE-032.21E-01
I. ICE-OS4.51E-04
Calculated, Method 1 Soilov 491.21 1H84.44 20.00 50.6« 19899.94 500.78 3.26 1785.02 4195.67 3306.92
Notes:a As no GW1 values were identified in RECAP, GW1 values were calculated using R£CAP methodology, Ground water protection values and chemical specific parameters are from
Texas National Resource Conservation Commission (TNRCC) Risk Reduction Rule (TNRCC 1999).Percent organic matter (OM) is from USDA. 1992. Soil Survey of Union Parish, Louisiana. Soil type identified as Sawyer (Sk) from soii map number 18 in Soil Survey.Koc from RECAP Appendix K, Table K18 (values cited from Soil Screening Guidance 1996)H from RECAP Appendix K, Table K19 (values cited from Soil Screening Guidance 1996)Values in italics arc default values/tabulated values from RECAPValues underlined are site-specific values from the Soil Survey or Hydraulic conductivity reports (Stork Southwestern Labs; see Attachment A)Bold value is the recommended final soil-to-groundwater protective value based on site-specific soil type and climate information.
mptc_sed.xls A-1-2

TABLE A-2
RESIDUAL GRID SOURCE AREAMARION PRESSURE TREATING COMPANY
Marion Pressure Treating CompanyCalculation of Soilsscw valuesAssumes soil type is Sawyer (Sk). Note: predominant soil type in the drainage pathways may be Guyton.
Equation: Csoil (mg/kg) - GW| (Pb x Kd + Theta.w + Theta.a x H ' )Pb
SoilcwParameter
MOI-CWI (mg/1.)
Pb (g/cm')Theta-w (Lwater/Lsoil)Kd (cm'/g)Koc(cm ' / a )foe%OMTheta-a (Lair/Lsoil) n-Theta.wn (Lpores/Lsoil) l-(Pb/Ps)Ps (g/cm')H (ulm-m /mol)H'-Hx41 (5)25CCalculated, Method 1 Soilcw
Benzo(a)anthracene
1.15700.21
0.0066U5
0.35340.5634
2.65
8.6
0.0002
2.37E+033.58E+OS
3.35E-061.37E-04
9.47
23Benzo(a)pyrene
0.0002
6.40E+039.69E+03
1.13E-064.63E-05
25.62
29 120Benzo(hlfluorantlicne Benzo(k)fluoranthene
0.0002 0.00091
8.13E+03 8.13E+031.23E+06 1.23E+06
I . I I E - 0 - 1 8.29E-0'455E-03 3.40E-05
32.52 147.96
76Chrvscne
0.0091
2.63E+033.9KE+OS
9.-16E-033.88E-03478.78
540nibenzo(a.h)anthracene
0.0/
1.18E+04/ ~9E*06
1.4~E-086.03E-072366.13
9.2lndeno(l,2,3-cd)pyrene
0.000^
2.29E+043.-l~F.*tt6
1.60E-066.56E-05
183.47
Notes:Site-specific values were calculated using the upper end of the range of site-specific physical and geological values reported in Attachment A for this residual source area. Theheterogeneity of the soils yields a range of values, any one of which may be representative of the area,See page 2 of table for additional notes.
mptc_grid_soil.xls A-2-1

TABLE A-2
RESIDUAL GRID SOURCE AREAMARION PRESSURE TREATING COMPANY
M«non Pressure Treating CompanyCalculation of Soilsscw valuesAssumes soil type is Sawyer (Sk). Note: predominant soil type in the drainage pathways may be Guyton.
Equation: Csoil (mg/kg) = GWI (Pb x Kd + Thcta.w tTheta.a x H ' )Pb
Soilcw 220 120 190 4.6 24 1200 230 1.5 170 420Acenapthene Anthracene Biphenyl" Carbazole* Diben2ofuran Fluoranthene Fluorene Naphthalene 2-Methylna|ihHialene* Phenanthrene*
Kd (cm'/g)K o c ( c m ' / g )
0.3'
3.24E+014.90E+03
I . S
1.55E+022.3-IE+O-I
0.3
3.39E+015.13E+03
0.03
1.62E+012.-/SE-H)}
0.014
5.16E+01'.flOK+03
1.5
3.25E+02-i.91E-K)-t
0.24
5.10E+01" 'IE+03
0.01
7.86E+001.19E+03
1.5
2.89E+01-t.3~K-H)3
I . I
9.32E+011.41I':-H!4
H (alm-m /mo!)H'=Hx41«g25C
1.33E-046.36E-03
6.50E-052.67E.03
1.13E-025.13E-01
3.38E-031.39E-01
1.30E-055.33E-04
1.61E-056.60E-04
6.36E-032.61E-03
4.R3E-041.98E-02
I.S5E.027.59E-01
S. -IDE-032.21E-01
Calculated, Method 1 Soilcw 241.01 5574.15 205.46 9.85 24.83 9740.80 245.47 1.61 878.86 2055.65
Notes:a As no GWI values were identified in RECAP, GWI values were calculated using RECAP methodology. Ground water protection values and chemical specific parameters are from
Texas Nalional Resource Conservation Commission (TNRCC) Risk Reduction Rule (TNRCC 1999).Percent organic maner(OM) is from USDA. 1992. Soil Survey of Union Parish, Louisiana. Soil type identified as Sawyer (Sk) from soil map number 18 in Soil Survey.Koc from RECAP Appendix K, Table K 18 (values cited from Soil Screening Guidance 1996)H from RECAP Appendix K, Table K19 (values cited from Soil Screening Guidance 1996)Values in italics are default values/tabulated values from RECAPValues underlined are site-specific values from the Soil Survey or Hydraulic conductivity reports (Stork Southwestern Labs; see Attachment A)Bold value is the recommended final soil-lo-groundwatcr protective value based on site-specific soil type and cliinatc information.
mptc_grid_soil.xls A-2-2

TABLE A-3
CONSOLIDATION AREA SOURCE AREAMARION PRESSURE TREATING COMPANY
Marion Pressure Treating CompanyCalculation of Soilgscw valuesAssumes soil type is Sawyer (Sk). Note; predominant soil type in the drainage pathways may be Guyton.
Equation: Csoil
SoilcwParameterM01-GW1 (mg/L)
Pb(g/cm")Tlieta-w (Lwater/Lsoil)Kd (cm'/g)Koc (cm'/g)foe%OMThela-a (Lair/Lsoil) n-Thcta.wn (Lporcs/Lsoil) l-(Pb/Ps)Ps(g/cni')H (atm-m /inol)H'-Hx41 @ 25CCalculated, Method 1 Soilcw
1 (ing/kg) = 1
1,16220.21
0.0066US
0.35140.5614
2.65
3W1 (Pb x Kd + Theta.wPb
8.6Benzo(a)anth racene
0.1)002
2.37E+033.3SE-1-05
3.35E-061.37E-04
9.47
+ Tlieta,a x H')
23Benzo(a)pyrene
0.0002
6.40E+039.69E+05
1.13E-064.63E-05
25.62
29Ben2o(b)fluoranthene
0.0002
8.13E+031.231^06
1. HE-044.55E-03
32.52
120Benzo(k)fluoranthene
0.00091
8.13E+031.23E+06
8.29E-0'3.40E-05
147.96
76Chrysene
0.0091
2.63E+033.98E+03
9.-16E-0!3.88E-03478.78
540Dibenzo(a,h)anthracene
0.01
1.18E+04l.~9E+06
l.-rE-os6.03E-072366.13
9.2Indeno(l,2,3-cd)pyrene
00004
2.29E+043 ,("/:'+0<
1.60E-066.56E-05
183.47
Notes:Site-specific values were calculated using the upper end of the range of site-specific physical and geological values reported in Attachment A for this residual source area, Theheterogeneity of the soils yields a range of values, any one of which may be representative of the area.See page 2 of table for additional notes.
mptc_CA_soil.xls A-3-1 6/21/2001

TABLE A-3
CONSOLIDATION AREA SOURCE AREAMARION PRESSURE TREATING COMPANY
Marion Pressure Treating CompanyCalculation ofSoilsscw valuesAssumes soil type Is Sawyer (Sk). Note: predominani soil type in the drainage pathways may be Guylon.
Equation: Csoil (mg/kg) "GWI (Pb x Kd + Theta.w + Theta.a x H' )Pb
Soilcw 120 190 4.6 24 1200 230 170 1.5 420 1100Acenapthene Anthracene Biphenyl* Carbazole* Dihenzofuran Fluoranthene Fluorene 2-Methylnaphthalene* Naphthalene Phenanthrene'1___Pyrene
0.3- I.H 0.3 0.03 0.024 1 . 5 0.!-! l.S 0.01 O.I ft
Kd(cm /g)Koc(cm'/g)
3.24E+014.901W13
1.55E+02 3.39E+012.3-IE+O-I S . 1 3 E + D 3
1.62E+01 5.16E+01 3.25E+02 5.10E+01 2.89E+01 7.86E+00 9.32E+01 4.49E+022.4SE+03 :80E+93 4.91E+04 •.•IE+03 4.3'E+O] 1.19E-K13 1.41E+04 6.WE-HI-1
1.55E-046.36E-03
6.50E-052.67E-03
1.25E-025.13E-01
3.38F.-031.39E-01
1.30E-055.33E-04
1.61E-OS6.60E-04
6.36E-OS2.61E-03
I.S3E.027.59E-01
4.83E-041.98E-02
S.40E-032.21E-01
I . I O K - O S4.51E.04
Calculated, Method 1 Soilr.w 241.00 5574.12 205.45 9.85 24.83 9740.77 245.46 878,77 1.61 2055.62 1618.58
Notes:a As no GW1 values were identified in RECAP, GWI values were calculated using RECAP methodology. Ground water protection values and chemical specific parameters are from
Texas National Resource Conservation Commission (TNRCC) Risk Reduction Rule (TNRCC 1999).Percent organic matter (OM) is from USDA. 1992. Soil Survey of Union Parish, Louisiana. Soil type identified as Sawyer (Sk) from soil map number 18 in Soil Survey.Koc from RECAP Appendix K, Table K 18 (values cited from Soil Screening Guidance 1996)H from RECAP Appendix K, Table Kl 9 (values cited from Soil Screening Guidance 1996)Values in italics are default values/tabulated values from RECAPValues underlined are site-specific values from the Soil Survey or Hydraulic conductivity reports (Stork Southwestern Labs; see Attachment A)Bold value is Ilic recommended final soil-to-groundwater protective value based on site-specific soil type and climate information.
mptc_CA_soil.xls A-3-2

ATTACHMENT A
STORK SOUTHWESTERN LABORATORY REPORTSSOIL CHARACTERISTICS
MARION PRESSURE TREATING COMPANY

MftY-17-2001 16:44 FROM:STORK SML 7136966307 TO:816 751 5571
BOUTHWESTERIM LABORATORIES222 Cavalcado Str—l. 77009-3213P.O. Box 8766, Houston. Texas 77249-8768Tel (713) 692-9151 Fax (713) 696-6307
HYDRAULIC CONDUCTIVITY (ASTM D 5084)Using Falling-Head Apparatus (Method C)
Project Name:Sample Location:Description ot" Soil;Type of Specimen:Buck Pressure .Saturation Coudiriomi: B CoefficientConsoJitllirion and Permeation Conditions: Effective Stress, psi:Pipet Length. Lp(em) 11.237 in 28.542cm
SPECIMEN DIMENSIONS AND PROPERTIESItem
Sample DiameterSample AreaSample LengthTare NumberTare Weight (gm)Wet Soil + TareDry Soil + TareWater Weight (grDry Soil WeightMoisture ConferWet Soil WeightWet BulkDentfitDry Bulk Density (pet)Saturation (%)Specific Gravity
HYDRAULIC CONDUCTIVITY TESTING MEASUREMENTConfining PressuReset?1 =Yes
1
AVERAGE VALUES
MeasDate08/0808/0808/0808/08
(gm)(.gm)
m)(gm)nt(%)(e1")
y (pcO
re (psi)Time
Time09:20:0009:36-0010:10:00).1;36:00
MTPC Contaminant Delineation - Tctra Tech EMSD04-6-24RDark gray sandy sllcy clayUndisturbed
InitialInput Dufci
1.88 in2.78 in2.20 in
5531.4065.7256.38
169.80
2.70 TESTED
62ha,,,,,.(cm)
120011.5510.558.40
Cor. Factor2.54
2.54
Influent Pressure (psi)"a-t
(cm)12.0012.4513.5015.65
Pipct Areu, n (25.000 cm'/Lp) = 0.876 cm2
Specific Gravity uf Witter,
Output Data4.78 cm
17.91 cm2
5.59 cm
9.3424.9837.4
105.977.185.2
Temperature("C)22.522-522-522.5
Input Datii1.882.782.20254
129.97296.30253,90
168.92
57Gradient
Min.10191817
18
> or 0.955.0
GW = 1.003
Final
in
in
|| ASSUMEDU X
Efflaeut Press, (psi)
Max.34
Proj. No.:Lab No.: 50449
Cm. Factor2.54
2-54
k(cai/s)
1.4E-061-5E-061.3E-06
1.4E-06
Output Data4.78 cm
17.91 cm2
5-59 cm
42.40123,93
34.2
105.478.595-0
55.5^0
(cm/s)
1.3E-061.4E-061.2E-06
1.3E-06Calculated by: M. Medi. E.l-T. Date:08-10-2000
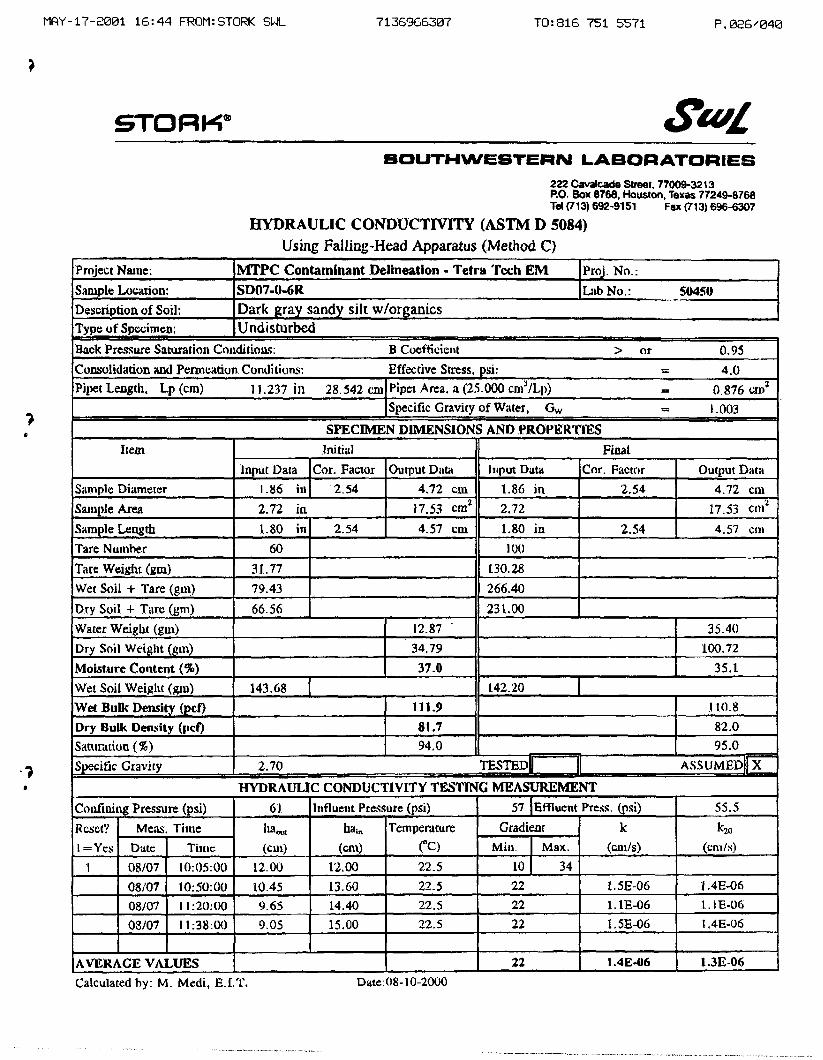
MAY-17-2001 16:44 FROM:STORK SNL 7136966307 TO:816 751 5571 P.026/040
SOUTHWESTERN LABORATORIES222 Cavalcade Street, 77009-3213P.O. Box 6768, Houston, Texas 77249-8768Tel (713) 692-9151 Fax (713) 696-6307
HYDRAULIC CONDUCTIVITY (ASTM D 5084)Using Falling-Head Apparatus (Method C)
Project Name:Sample Location:Description of Soil:TypeofSpwimeBack Pressure Saturation Conditions: B Coefficient > or 0.95Consolidation and Pennuittion Condition;:.: Effective Stress, psi: = 4.0Pipet Length. Lp (cm) 11.237 in 28.542cm
Specific Gravity of Water, Gw = 1.003SPECIMEN DIMENSIONS AND PROPERTIES
Item
Sample DiameterSample AreaSample LengthTare NumberTare Weight (gm)Wet Soil + TareDry Soil + TareWater Weight (gm)Dry Soil WeightMoisture Content (%)Wet Soil WeightWet Bulk Density (pcf)Dry Bulk Density (pcf)Satunluon (%)Specific Gravity
HYDRAULIC CONDUCTIVITY TESTING MEASUREMENTConfining Pressure (psi)Reset? Meas. Time\ =Ycs Date
:1 08/0708/0708/0708/07
AVERAGE VA1
0;
(g"i)(B"')
(e'")
(gin)
Time10:05:0010:50:0011:20:0011:38:00
LUES
MTPC Contaminant Delineation - Tetra Tcch EMSD07-0-6RDark gray sandy silt w/organicsUndisturbed
InitialInput Data
1-86 in2.72 in1.80 in
6031.7779.4366.56
143.68
2.70 TESTEDfl
61"a<«(cm)
12-0010.459.659.05
Cor. Factor2.54
2.54
Influent Pressure (psi)h'lin
(cm)12.0013.6014.4015.00
Pipet Area. a (25.000 cn^/Lp) = 0.876 vss1
Output Data4.72 cai
17,53 cm2
4.57 cm
12.87 "34.7937.0
111.981.794.0
Temperature(°C)22-522.522.522.5
FinalInput Duta
1.86 in2,721.80 in100
130.28266.40231.00
142-20
57 Effluent Prc.ss. (psi)Gradient
Mill. Max.10 34222222
22
Proj. No.:LilbNo.: 50450
Cor. Factor2.54
2.54
ASSUMBD||X
k(cm/s)
1.5E-061.1E-061.5E-06
1.4E-06
Output Data4.72 cm
17.53 cm2
4.57 cm
35.40100.72
35,1
110.882.095.0
55.5^w
(crri/s)
1.4E-06LIE-06I.4E-06
1.3E-06Calculated by: M. Medi, E.I.T. Date:08-10-2000

MflY-17-2001 16:45 FROM;STORK SNL 7136966307 TO:816 751 5571 P.027/040
»®
SOUTHWESTERN LABORATORIES222 Cavalcade Street. 77006-3213P.O. Box 0796, Houston, Texas 77249-8766Td (713) 692-9151 Fax (713) 696-8307
HYDRAULIC CONDUCTIVITY (ASTM D 5084)Using Falling-Head Apparatus (Method C)
Project Name:Sample Location:Description of Soil:Type of SpecimeBack Pressure Saturation Conditions: B Coefficient > or 0.95Consolidation and Permeation Conditions: Effective Stres.s, psi: •- 4.0Pipel Length, Lp (cm) 11.237 in 28,542cm
Specific Gravity of Waier, Gw = 1.003SPECIMEN DIMENSIONS AND PROPERTIES
Item
Sample DiameterSample AreaSample LengthTare NumberTare Weight (gm)Wet Soil + TareDry Soil + TareWater Weight (gm)Dry Soil WeightMoisture Content (%)Wet Soil WeightWet Bulk UenMty (pcf)Dry Bulk Density (per)Saturation (%)Specific Gravity
HYDRAULIC CONDUCTIVITY TESTING MEASUREMENTConfining PrtsiSUReset? Mean. Time1 =Yes Date
1 08/0908/0908/0908/09
AVERAGE VALUES
JO:
(g"l)
(gin)
(gn>)
0"n)
re (psi)
Time09:16:0009:21.0009:30:0009:36:00
MTPC Contaminant Delineation - Tetra Tech EMSD07-6-24RDark gray silty sand w/organicsUndisturbed
InilialInput Data
1.86 in2.72 in1.82 in
350,10
131.70112.68
147.05
2.70 TESTEDl
61!'»„„(cm)
12.009.957.806.05
Cor. Factor2.54
2.54
Influent Pressure (psi)ha.n
(cm)12.0014.1016-2518.00
Pipet Area. a (25.000 cni'/Lp) = 0.876 cm'1
Output Ditto4.72 cm
17,53 cm2
4.62 cm
19.0262.5S30.4
113.386.987.4
Temperature(°C)22.522.522.522.5
PinalInput Data
1.86 in2.721.82 in200
155-20303.05268.71
148.05
57 Effluent Press, (psi)Gradient
Mia. Max.10 34222120
21
Proj. No.:Lab No.: 50451
Cor. Factor2,54
2.54
ASSUMED(| X
k(cm/s)
1.8E-051.1E-051.4E-05
1.4E-05
Output Data4.72 cm
17,53 cm1
4.62 cm
34.34113.51
30.3
114.087.695.0
55.5kw
(cm/s)
1.7E-051.0E.051.3E-05
1.3E-05Calculated by; M. Mcdi. E.l.T. Date :08-10-2000

MRY-17-2001 16:45 FROM:STORK SNL 7136966307 TO:816 751 5571
SOUTHWEBTERIM LABORATORIES222 Cavalcade Street, 77009-3213P.O. Box VTM. Houston, Texas 77249-8768Tel (713) 692-9151 Fax (713) 696-6307
HYDRAULIC CONDUCTIVITY (ASTM D 5084)Using Falling-Head Apparatus (Method C)
Project Name:Sample LocationDe-scripuoii of S<Type of SpecimeBack Pressure SsCoiisolidaiioa and Pemuiation Conditions: Effective Stresa, psr.Pipet Length, Lp (cm) 11.237 in 28.542cm
SPECIMEN DIMENSIONS AND PROPERTIESItem
Sample DiameterSample AreaSample LengthTare NumberTare Weight (gin)Wee Soil + TareDry Soil + TareWater Weight (gin)Dry Soil WeightMoisture ContciWet Soil WeightWet Balk DeiisiDry Bulk DensitSaturation (%)Specific Gravity
HYDRAULIC CONDUCTIVITY TESTING MEASUREMENTConfining Pressure (psi)Reset?l=-Yes
1
AVERAGE VALUES
Meas. TimeDale08/0908/0908/0908/09
oil:a;rturiitioii Condition.-;: B Coefficient
(gro)(gni)
te'")nt(%)<g"»)
iy (pcf)y(pc0
Time11:05:0011:07:0011:09:0011:12:00
MTPC Contaminant Dclincution - Tetrc-i Tech EMSD16-0-6RBrown sandy clay w/siltUndisturbed
InitialInput Data
1.87 in2.73 in2.28 in
7431.1486.4374.56
146.90
2.70 TESTEDl
61ha,,u<(urn)
12.0011,0010.008.60
Cor. Factor2.54
2.54
Influent Pressure (psi)"am
(cm)12.0013.0014.0015.40
Pipet Area. a (25.000 cm5/Specific Gnivity or'Water.
Ouipzit Data4.74 cm
17.62 cm2
5.79 cm
11.8743.4227.3
89.870.653,2
Temperature(°C)22.522.522.522.5
Input Data1.872.752.28
4134.60293.40250.35
158.80
57Gradient
Min.10181717
17
> or 0.954.0
Lp) == 0,876 cm2
Gw = 1.003
Final
in
in
|| ASSUMED|| X
Effluent Press, (psi)
Max.34
Proj. No.;Lab No.: 50452
Cor. Factor2.54
2.54
k(cin/.s)
2-6E-052.7E.052.6E-05
2.6E-05
Outline Data4.75 cm
17.72 cm2
5.79 cm
43-05115-75
37.2
96.670.495.0
55,5^
(cm/s)
2.5E-052.5E-052.4E-05
2.5E-05Calculated by: M. Medi. E.r.T. Date.08-10-2000

MftY-17-2001 16:45 FROM:STORK SUL 7136966307 TO:816 751 5571 P.029/040
SOUTHWESTERN LABORATORIES222 Cavalcade Street, 77009-3213P.O. Box 8768. Houston, Texas 77249-8768Tel (713) 892-9151 Fax (713) 696-6307
HYDRAULIC CONDUCTIVITY (ASTM D 5084)Using Falling-Head Apparatus (Method C)
Project Name:Sample Location:Description of ScType of SpecimeBack Pressure Saturation Conditions: B CoefficientConsolidation and Permeation Conditions: Effective Stress, psi;Pipet Length. Lp(cin) 11.237 in 28.542cm
SPECIMEN DIMENSIONS AND PROPERTIESItem
Sample DiameierSample AreaSample LengthTare NumberTare Weight (gm)Wet Soil + TareDry Soil + TareWater Weight (gm)Dry Soil Wciglit (gm)Moisture Content (%)Wet Soil WeightWet Bulk Density (pel)Dry Bulk Densiity (pcf)Saturation (%)Specific Gravity
HYDRAULIC CONDUCTIVITY TESTING MEASUREMENTConfining PressuReset?1=Ye.s
1
AVERAGE VALUES
Mea.s. TimeDate08/0808/0808/0808/08
oil:SL
(fe't")
(gm)
(8"0
re (psi)
Time09:20:0009:27:0009:33:0009:38:00
MTPC Contiunlnant Delineation - Tetra Tech EMSD19-0-6HBrownish gray sandy siltUndisturbed
lnii,i<iiInput Data
1.84 in2.66 in2.21 in423
32.20150.10130.00
189.38 |
2.70 TESTED
61ha,,,n(cm)
14.008.706-054.05
Cor. Factor2.54
2.54
Influent Pressure (psi)1'a,,,
(cm)7.00
12.3515.0017.00
Pipet Area. a (25.000 csa^fLp) = 0.876 cm'1
Specific Gravity of Water.
Output Dutit4.67 cm
17.16 cm2
5-61 cm
20.1097.8020.6
122.8101.S84.8
Temperature("C)22.522.522.522.5
Input Data1.842.662.21
4135.96292.50264.60
190.82
57Gradient
Min-10181716
17
> or 0.954.0
GW = 1.003
Final
in
in
| || ASSUMED|[X
Effluent Press, (psi)
Max,.34
Proj. No.:Lab No.: 50453
Cor- Factor2.54
2.54
k(vin/s)
3.9B-052.5E-052.3E-05
2.9E-05
Output Data4.67 cm
17.16 cm2
5.61 cm
27.90128-64
21.7
123.7101.795.0
55.5k2»
(cm/s)
3.6E-052.3E-052-2E-05
2.7E-OSCalculated hy: M. Medi, E.I.T. Date: 08-10-2000

MOY-17-2001 16:45 FROM;STORK SML 7136966307 TO:816 751 5571 P.030̂ 040
SOUTHWESTERN LABORATORIES222 Cavalcade Street, 77009.3213P.O. Box 8768, Houston. Texas 77249-8768Tel (713) 692-9151 Fax (713) 696-6307
HYDRAULIC CONDUCTIVITY (ASTM D 5084)Using Falling-Head Apparatus (Method C)
Project Name:Sample Location:Description of Soil:Type of Specimen:Back Pressure Saturation Conditions: B CoefficientConsolidation, and Permeation Conditions: Effective Stress, psi:Pipel Length, Lp(cm) 11.237 in 28.542 cm Pipet Area. a (25.000 cm^Lp) = 0.876cm'2
SPECIMEN DIMENSIONS AND PROPERTIESItem
Sample DiameierSample AreaSample LengthTare NumberTare Weight (gm)Wet Soil + Tare (gin)Dry Soil + Tare (gm)Water Weight (gm)Dry Soil Weight (gm)Moisture Content (%)Wet Soil Weight (gin)Wet Bulk Density (pcf)Dry Bulk Density (pcf)Saturation (%)Specific Gravity
HYDRAULIC CONDUCTIVITY TESTING MEASUREMENTConfining Pressure (psi)Reset? Meas. Time1 =Ycs; Date
1 08/1408/1408/1408/14
AVERAGE VALUES
Time08:15:0009:15:0009:51:0010:36:00
MTPC Contaminant Delineation - Tctra Tcch EMCAOI-108-132Brown, reddish brown & gray sandy clayUndisturbed
luilialInput Data
1-54 in1.86 in2.12 in
7332.92
129.65115.50
130.40
2.70 TESTEDH || ASSUMED||X
70lia^m(cm)
13.4010.008.807.35
Cor. Factor2.54
2.54
Influenc Pressure (psi)hain
(cm)11.9514.8016.1017.60
Specific Gravity of Water,
Output Data3.91 cm
12.02 cm1
5.38 cm
14.1582.5817-1
125.8107.481.3
Temperature(°c)22.522.522.522.5
Input Data1.551.892.13500
151.82288-90265.80
136.90
62Gradient
Min.10191817
18
> or 0,958.0
GW = 1.003
Final
in
in
Effluent Prc$$. (psi)
Max.34
Proj. No.:Lab No.: 50454
Cor. Factor2.54
2.54
k(cm/s)
3.8E-062.6E-062.6E-06
3.0E-06
Output Data3.94 cm
12.17 cm2
5.41 cm
23.10113.98
20-3
129.8107.997.4
60.5k^i
(cm/s)
3.5E-062.5E-062.4E-06
2.8E-06Calculated by: M. Medi, E.I.T. Daie:08-21-2000

MflY-17-2001 16:46 FROM:STORK SUL 7136966307 TO:816 751 5571
STORKSOUTHWESTERN LABORATORIES
222 Cavalcade Street, 77009-3213P.O. Box 8768, Houston, Texas 77249-8768Tal (713) 692-9151 Fax (713) 696-6307
HYDRAULIC CONDUCTIVITY (ASTM D 5084)Using Falling-Head Apparatus (Method C)
Project Name: MTPC Contaminant Delineation - Tetra Tech EMSample Location:Description of Soil:Type of Specimen:Back Pressure Saturation Conditions: B CoefficientConsolidation and Permeation Conditions: Effective Stress, psi:Pipct Length. Lp(cm) 11.237.Ln 28.542cm
SPECIMEN DIMENSIONS AND PROPERTIESIreni
Sample DiameterSample AreaSample LengthTare NumberTare Weight (gm)WetSoJ] + Tare (gin)Dry Soil + Tare (gm)Water Weight (gni)Dry Soil Weiglit (gni)Moisture Content (%)Wet Soil Weight (gm)Wet Bulk Density (pel)Dry Bulk Density (per)Saturation (%)Specific Gravity
HYDRAULIC CONDUCTIVITY TESTING MEASUREMENTConfining Pressure (psi)Reset?l=Yes
1
AVERAGE VALUES
Meas- TimeDale08/1408/1408/1408/14
Time08:05:0010:00:0011:42:0013:23:00
CA01-132-156 Lab No.: 50455Lt gray & It reddish brown sandy clayUndisturbed
InitialInput D;iui
1.59 in1.99 in2.16 in
250.40
255.70225.20
140.31
2.70 TESTED|
70ha.»»(cm)
12.0010. •158.557.10
Cor. Factor2.54
2.54
Influent Pressure (psi)"am
(cm)12.0013-9015.5016.95
Piper Area, a (25.000 cin.'/Lp) == 0.876 cm2
Specific Gravity of Water,
Output Data4.04 cm
12.81 cm2
5.49 cm
30.501.74.80
17.4
124.6106.180.2
TemperaturefC)22.522.522.522.5
Input Data Cor. Factor1.591.992.16280
113.18246.48223.56
145.08
62Gradi<
Mm.10181.817
18
> or 0.958.0
Gw = 1.003
Final
in
in
1
Effluent Press, (psi)eni
Max.34
Pro). No.:
2.54
2.54
ASSUMED|| X
k(cm/s)
1.1E-061.1E-061.1E-06
l.IE-06
Output Data4.04 cm
12.81 Cin.2
5.49 cm
22.92110.38
20.8
128.9106.796.9
60.5^20
(cm/s)
1.1E-061.1E-06l.0£-06
l.OE-06Calculated by: M. Medi> E.T.T. Da(e;08-17-2000

mY-17-S001 16:46 FROM:STORK SNL 7136966307 TO:816 751 5571 P.032^040
SOUTHWESTERM LABORATORIES222 Cavalcade Street, 77009-3213P.O. Box 6768, Houston. Texas 77249-8768Tel (713) 692-9151 Pax (713) 696-6307
HYDRAULIC CONDUCTIVITY (ASTM D 5084)Using Falling-Head Apparatus (Method C)
Project Name: MTPC Contaminant Delineation - Tetra Tcch EM Proj. No.:Sample Location:Description of Soil:Type of Specimen:Back Pressure Saturation. Conditions: B CoefficientConsolidation and Permeation Conditions: Effective Stress, psi:Pipct Length. Lp(cm) 11.237 in 28.542cm
SPECIMEN DIMENSIONS AND PROPERTIESItem
Sample DiameterSample AreaSample LengthTare NumberTare Weight (gm)Wet Soil + Tare (gm)Dry Soil + Tare (gin)Water Weight (gin)Dry Soil Weight (gin)Moisture Content (%)Wet Soil Weight (gm)Wel Balk Density (pcf)Dry Bulk Density (pel)Saturation (%)Specific Gravity
HYDRAULIC CONDUCTIVITY TESTING MEASUREMENTConfining Pressure (psi)Reset?l=Yes
1
AVERAGE VALUES
Meas- TimeDate08/1508/.1608/1708/18
Time11:32:0008:10:0008:12:0010:15:00
CA01-36-60Lt yellowish brown fat clay w/sandUndisturbed
InitialInput Data
1-51 in1-79 in1.62 in.413
32.10206.10164.80
89.10
2.70 TESTED]
65hiloiii(cm)
12.0010.559.257.95
Cor. Factor2.54
2.54
Influent Pressure (psi)I'Hin
(cm)12.0013.5014.8016.10
Pipet Area, a (25.000 cm'/Lp) == 0.876Specific Gravity of Water,
Output Data3.84 cm
11.55 cm2
4.11 cm
41.30132.70
31.1
117.089.294.6
Temperature(°c)22.522.522-522.5
Input Data1.511.791.62706
30.42120.5298.27
90.10
60Gradient
Min.10252423
24
> or 0.955.0
Gw = 1.003
Pinal
in
in
| || ASSUMED
Effluent Press, (psi)
Max.34
Lab No-: 50456
Cor. Factor2.54
2.54
k(cn-i/s)
6.8E-085.3E-085.1E-08
5.7E-08
Output Data3.84
11.554.11
22.2567.8532.8
118.389.199.4
58.5kin
(cm/s)
6.4E-085.0B-084.7E-08
S.4E-08
cm2
cmCm2
cm
X
Calculated by: M. Medi, E.I.T.

mY-17-2001 16:46 FROM:STORK SUL 7136966307 TO:816 751 5571
STORWSOUTHWESTERM LABORATORIES
222 Cavalcade Street, 77009-3213P.O. Box 8768. Houston. Texas 77249-8768Tel (713) 692-9151 Fax (713) 696-6307
HYDRAULIC CONDUCTIVITY (ASTM D 5084)Using Falling-Head Apparatus (Method C)
Project Name:Sample LocationDescription of ScType of Specmiea:Back Pressure Saturation Conditions: B Coefficient > or 0.95Consolidation aad Permeation. Conditions: Effective Stress, p$i: ^ 5-0Pipet Length, Lp (cm) 11.237 in 28.542cm
Specific Gravity of Water, Gw == 1-003SPECIMEN DIMENSIONS AND PROPERTIES
Item,
Sample DiameterSample AreaSample LengthTare NumberTare Weight (gm)Wet Soil + TareDry Soil + TareWater Weight (gm)Dry Soil WeightMoisture Content (%)Wet Soil WeightWet Bulk DeiisilDry Bulk DciisitSaturadoa (%)Specific Gravity
HYDRAULIC CONDUCTIVITY TESTING MEASUREMENTConfining Pressure (psi)Reset? Meas. Time1 =Yes Date
I 08/2108/21.08/2208/22
AVERAGE VALUES
)il:
(gin)fern)
(gm)
(gm)ly(prf)7 (pet)
Time08:13:0016:47:0008:43:0016:39:00
MTPC Contaminant Delineation • Tetra Tech EMCA01-60-84 TopReddish Brown &. Brown sandy clayUndisturbed
InitialInput Data
1.49 in1.74 in3.75 in
4136.00223.60211.34
223.78
2.70 TESTEDH || ASSUMED |X
67haiiui(cm)
12.0011.6010-8510.55
Cor. Factor2.54
2.54
Influent Pressure (psi)^n
(cm)12.0012.4013.1013.45
Pipet Area, a (25.000 cm'/Lp) -= 0.876 cm2
Output Dad3.78 cm
11.25 Cm2
9.53 cm
12.2675.34
16.3
130.4112.187.4
Temperature("C)22.522.522.522.5
Finalinput Data
1.49 in1.743.75 in
20105.11333.21299.20
228.10
62 Effluent Press- (psi)Gradient
Min. Max.10 34111111
:n
Proj. No.:Lab No.: 50457A
Cor. Factor2.54
2.54
k(cni/.<)
l.OE-071.0E.079.4E.OS
l.ffE-07
Output Data3.78 cm
11.25 cm2
9-53 cm
34.01194.09
17.5
132.9113.196.6
60.5km
(cm/s)
9.8E-089.7E-088.8E-08
9,4E-08Calculated by: M. Medi, E.I.T. Date:08-23-2000

WY-17-3001 16;47 FROM:STORK SWL 7136966307 TO:816 751 5571 "P.034^040
BOUTHWESTERN LABORATORIES222 Cavalcade Street. 77009-3213P.O. Box 8768. Houston, Texas 77249-8788Tel (713)692-9151 Fax (713) 696-6307
HYDRAULIC CONDUCTIVITY (ASTM D 5084)Using Falling-Head Apparatus (Method C)
Project Name: MTPC Contaminant Delineation - Tetra Tech EMSample Location:Description of Soil;Type of Spechnen;Back Pressure Saturation Conditions: B CoefficientConsolidation and Permeation Conditions: Effective Stress, psi:Pipet Length, Lp (cm) 11.237 in 28.542cm
SPECIMEN DIMENSIONS AND PROPERTIESItem
Sample DiameterSample AreaSample LengthTare NumberTare Weight (gm)Wet Soil + Tare (gin)Dry Soil + Tare (gm)Water Weight (gm)Dry Soil Weight (gin)Moisture Content (%)Wet Soil Weight (gin)Wet Bulk Density (pet)Dry Bulk Density (pcf)Saturation (%)Specific Gravity
HYDRAULIC CONDUCTIVITY TESTING MEASUREMENTConfining Pressure (psi)Reset'? Mcas. Timel=Yes Daro
1 08/2208/2208/2208/22
AVERAGE VALUES
Time09:07:0009:17:0009:28:0009:36:00
CA01-60-84 BottomDark gray silty saiid w/aggregates & organicsUndisturbed
InitialInput Data
1.51 in1.79 ill
2.29 in274
120.17272.90258.20
127.90
2.65 TESTEDU
671"W(cm)
12.007.502.900.25
Cor. Factor2.54
2.54
Influent Pressure (psi)ha.n
(cm)12.0016.4521.1023.80
Pipet Area, a (25.000 cm'/Lp) = 0.876 Cin2
Specific Gravity of Water,
Output Data3.84 cm
11-55 cm2
5-82 cm
14.70138-03
10.6
118.8107.452.3
TemperatureC'C)22.522.522-522.5
Input Data1.511.792.29
199156.62293.71272-52
136.93
62Gradient
Min.10161514
15
> or 0.955.0
Gw = 1.003
Final
in
in
Effluent Press, (psi)
Max.34
Proj. No.:Lab No.: 50457B
Cor. Factor2.54
2.54
ASSUMEtD|| X
k(cm/s)
3.7E-053.9E-053.4E-05
3.7E-05
Output Data3.84 cm
11.55 cm2
5.82 cm
21.19115.90
18.3
127.2107-595.0
60.5ll20
(cm/s)
3.5E-053.7E-053-2E-05
3.5E-OSCalculated by: M. Medi, E.I.T. Date:08-23-2000

MflY-17-2001 16:47 FROM:STORK SUL 7136966307 TO:816 751 5571
STORKSOUTHWESTERN LABORATORIES
222 Cavalcade Street, 77009-3213P.O. Box 8768, Houston. Texas 77249-8768Tel (713) 692-9151 Fax (713) 686-8307
HYDRAULIC CONDUCTIVITY (ASTM D 5084)Using Falling-Head Apparatus (Method C)
Project Name:S;unp1c Location:Description of SfType of SpecimeBack Pressure Saturation. Conditions: B CoefficientConsolidation. amPipet Length, Lp (cm.) 11.237 in 28.542cm
SPECIMEN DIMENSIONS AND PROPERTIESItem
Sample DiameterSample AreaSample Length.Tare NumberTare Weight (gm)Wet Soil + Tare (gm)Dry Soil + TareWater Weight (gm)Dry Soil WeightMoisture ConlerWet Soil WeightWet Bulk DensitDry Bulk DensitSaturation (%)Specific Gravity
HYDRAULIC CONDUCTIVITY TESTING MEASUREMENTConfining Pressure (psi)Reset?l=Ycs
1
AVERAGE VALUES
Meas. TimeDate08/1408/1508/1508/16
I'll:n:
d Permeation Conditions: Effective Stress, psi:
(gm)
(gm)»t (%)(e"i)y (pet)y(pcf)
Tune08:32:0010:40:0017:32:0017:01:00
MTPC Contaminant Delineation - Tctra Tcch EMCAOI-84-108Lt gray & It reddish brown sandy clayUndisturbed
InitialInput Data
1.52 in1-81 in1.97 in
2146.76
106-6097.90
120.20
2.70 TfiSTED]
67.5"aoi,(cni)
12.009.007.954.50
Cor. Pacior2.54
2-54
Influent Pressure (psi)!",„
(cm)12.0014.9516.0019.50
Pipet Area, a (25.000 cni.'/Lp) = 0.876Specific Gravity of Water,
Output Data3.86 cm
11.71 cm2
5.00 cm
8.7051.1417.0
128.1109.585.2
Temperature("C.)22.522.522.522.5
Input Data1.521.811.97
A235.51
158.51137.25
124.10
61.5Gradient
Mm.10201918
19
> or 0.956.0
GW ^ 1.003
Final
in
in
|| ASSUMED
Effluent Press, (psi)
Max..34
Proj- No.:Lab No.: 50458
Cor. Factor2.54
2-54
k(cro/s)
1-3E-071.9E-071-9E-07
1.7E-07
Output Data3.86
11.715-00
21.26101.74
20.9
132.3109.4104.5
60^20
(cnx/s)
1.2E-071.7E-07L8E-07
1.6E-07
On2
Clll
cm2
cm
|X
Calculated hy: M. Medi, E-l.T. Datc:08-17-2000

MAY-17-2001 16:47 FROM:STORK SNL 7136966307 TO:816 751 5571
SOUTHWESTERN LABORATORIES222 Cavalcade Street. 77009-3213P.O. Box 8768. Houston, Texas 77249-8768Tel (713) 692-9151 Pax (713) 696-6307
HYDRAULIC CONDUCTIVITY (ASTM D 5084)Using Falling-Head Apparatus (Method C)
Project Name:Sample Location:Description of Soil:Type of Specimen:Back Pressure Saturation Conditions: B Coefficient > or 0.95Consolidation and Permeation Conditions: Effective Stress, psi: = 4.0Pipci Length, Lp (cm) 11.237 in 28.542cm
Specific Gravity of Water, Gy = 1.003SPECIMEN DIMENSIONS AND PROPERTIES
Item
Sample DiameterSample AreaSample LengthTare NumberTare Weight (gin)Wet Soil + TareDry Soil + TareWater Weight (gin)Dry Soil WeightMoisture CenterWet Soil WeightWet Bulk Density (pcf)Dry Bulk Density (pcf)Saturation (%)Specific Gravity
HYDRAULIC CONDUCTIVITY TESTING MEASUREMENTConfining Pressure (psi)Reset? Meas. Time1 ̂ Yes Dace
1 08/2108/2108/2108/21
AVERAGE VALUES
(gm)(gin)
(gm)nt (%)(gni)
Time08:11:0008:20:0008:31:0008:41:00
MTPC Contiiminunt Delineation - Tetra Tech EMK05-0-6Tan & gray sandy clayUndisturbed
InitialInput Data
1.50 in1.77 in1.80 in
5251.70
309.80284.20
100.57
2.70 TESTEDH [| ASSUMED|lX
66haw(cm)
12.009.156.203.50
Cor Factor2.54
2,54
Influent Pressure (psi)ua,n
(cm)12.0014,9017.8520,55
Pipet Area, a (25.000 cii^/Lp) = 0.876 c"»2
Ourpni Dara3.81 cm
11.40 cm2
4.57 cm
25.60232.50
11.0
120.4108.553.8
Temperature(°C)22.522.522.522.5
FiniilInput Data
1.50 ia1.771.80 ill
88131.58242.05222.40
110.47
62 Effluent Press, (psi)Griuliem
Min. Max.10 34222019
20
Proj- No.:Lab No.: 50459
Cor. Factor2.54
2.54
k(cm/s)
2.1E-051.9E-052.0E-05
2.0E-05
Output Data3.81 cm
11.40 cm.2
4.57 cm
19-6590,8221.6
132.3108.8100.0
60.5k-M
(cm/s,)
2.0E-051.8E-051.9E-05
1.9E-05Calculated by: M. Medi, E.I.T.

MflY-17-2001 16:48 FROM:STORK SNL 7136966307 TO:816 751 5571 P. 037-'040
BOUTHWEBTERM LABORATORIES222 Cavalcade Street. 77009-3213P.O. Box B768. Houston. Taxas 77249-8768T<»1(713)692-915'1 Fax (713)696-6307
HYDRAULIC CONDUCTIVITY (ASTM D 5084)Using Falling-Head Apparatus (Method C)
Project Name:Sample Location:Description of Soil;Type of SpecirofcBack Pressure Saturation Conditions: B Coefficient > or 0.95Consolidation and Permeation Conditions: Effective Stress, psi: == 5.0Pipci Length, Lp (cm) 11.237 ill 28.542cm
Specific Gravity of Water, Gw " 1 . 0 0 3SPECIMEN DIMENSIONS AND PROPERTIES
ItCllt
Sample DiamecerSample AreaSample LengthTare NumberTare Weight (gm)Wet Soil + TareDry Soil •\- TareWater Weight (gm)Dry Soil WeightMoisture Content (%)Wet Soil WeightWet Bulk Density (pet)Dry Bulk Density (pc!)Saturation (%)Specific Gravity
HYDRAULIC CONDUCTIVITY TESTING MEASUREMENTConfining PressuReset? Meas. Time1 =Yes Date
1 08/2108/2108/2108/21
AVERAGE VALUES
n;
(gm)(P")
(gm)
(gm)
re (psi)
Time08:29:0009:15:0010:46:0012:26:00
MTPC Contiiminant Delineation - Tetra Tech EMK05-6.24Tan & gray sandy clayUndisturbed
InitialInput Data
1.50 in1.77 in2.28 in432
31.6467.4063.02
134.51
2.70 TESTEDH || ASSUMED||X
67"aow(cm)
12.0011.109.558.05
Cor. Factor2.54
2.54
Influent Pressure (psi)hain
(cm)12.0012.9014.5016.00
Pipet Area, a (25.000 cn^/Lp) = 0.876 cin2
Output Data3.81 cm
11.40 cm2
5.79 cm
4.3831.3814.0
127.211J.673.9
Temperature("C)22.522.522.522.5
FinalInput Data
1.50 in1.772.28 in706
30.42169.92147,52
140.52
62 Effluent Press, (psi)Gradient
Mill. Max.10 34181717
17
Proj. No.:LsibNo.: 50460
Cor. Factor2.54
2.54
k(cin/s)
1.6E-061.4E-061.3E-06
1.4E-06
Output Daia3.81 cm
11.40 cm2
5.79 cm
22.40117.10
19.1
132.9111.5101.1
60.5kw
(cm/s)
1.5E-061.4E-061.213-06
1.4E-06Calculatcil by: M. McJi, E.I.T. Da.tc.08-22-2000

MftY-17-2001 16:48 FROM:STORK SUL 7136966307 TO:816 751 5571 P. 038-'040
SOUTHWESTERN LABORATORIES222 Cavalcad* Street. 77009-3213RO. Box 8768, Houston. Texas 77249-8768Tel (713) 892.9151 Fax (713) 696-6307
HYDRAULIC CONDUCTIVITY (ASTM D 5084)Using Falling-Head Apparatus (Method C)
Project Name:Sample Location;Description of Soil:Type rtf Specimen:Back Pressure Saturation Condition;';: B CoefficientConsolidatiou anPipet Leiigrii, Lp (cm) 11.237 ID 28.542cm
SPECIMEN DIMENSIONS AND PROPERTIESItem
Sample DiameterSample AreaSample LengiliTare NumberTare Weight (gmWei Soil + TareDry Soil + TareWaier Weight (gm)Dry Soil WeiglitMoisture Content (%)Wet Soil WeightWft Bulk DensiDry Bulk DensitSaturation. (%)Specific Gravity
HYDRAULIC CONDUCTIVITY TESTING MEASUREMENTConfining Pretisnre (psi)Reset?1-Yes
1
AVERAGE VALUES
Meas. TimeDate08/1708/1708/1708/17
d Permeation Conditions: Effective Stress, psi:
)(gm)(8"')
(gm)
(gm)ry (pet)y (pcf)
Time10:39:0012:47:0014:51:0017:40:00
MTPC Contaminant Delineation - Tetra Tech EMJll.0-6Lt gray & l.t reddish brown sandy clayUndisturbed
InitialInput Data
1-50 in1.77 in1.65 in
6331.90
123.33113.50
90.04
2.70 TESTED
66h'i«iui(Ml)
12.0010.9010.008.80
Cor. Factor2.54
2.54
Influent Pressure (psi)'"in
(cm)12.0013.1514,0515.25
Pipel Area, a (25.000 (.Tn^/Lp) = 0.876 cm^Specific Gravity of Water,
Output Data3.81 cm
11.40 cm2
4.19 cm
9.8381.6012.0
117.6105.053.8
Temperature("C)22.522-522.522-5
Input Data1.501,771.65
352.27
148.62131.28
98-01
62Gradient
Min.10252423
24
> or 0.954.0
Gw = 1.003
Final
in
in
| || ASSUMEDll X
Effluent Press, (psi)
Max.34
Proj. No.:Lab No.: 50461
Cur. Factor2.54
2-54
k(cm/s)
5.2E-074.4E-074.4E-07
4.6E-07
Output Data3-81 cm
11.40 cm2
4.19 cm
17.3479-0121.9
128.1105.098.0
60.5^20
(cm/s,)
4.8E-U74.1E-074.1B-07
4.3E-07Calculated by: M. Medi, E.I.T.

ATTACHMENT B
LDEQ RECAP GUIDANCE FOR DETERMININGSOIL CONCENTRATIONS PROTECTIVE OF GROUND WATER

MANAGEMENT OPTION 2SOIL CONCENTRATION PROTECTIVE OF GROUNDWATER
(SOIL,GWI» SOILiGW2i SOILiGW3DW» SOILiGW3NDw)
The Soilow represents a soil concentration that does not result in an unacceptable constituentconcentration in groundwater and is based on the use of the groundwater to be protected: Soilcwiis based on the protection of groundwater meeting the definition of Groundwater Classification 1(compliance with GWi); Soilcwi is based on the protection of groundwater meeting the definitionof Groundwater Classification 2 (compliance with GW?); Soilcwow is based on the protection ofgroundwater meeting the definition of Groundwater Classification 3 (compliance with GWaow);and Soilow3NDw is based on the protection of groundwater meeting the definition of GroundwaterClassification 3 (compliance with GW}NDW) (refer to Section 2.10 for Groundwater Classificationdefinitions and Section 5.2.2 for GWi, GW;, GW3ow, and GWJNDW definitions). A DAFdeveloped using the Summers model (to account for mixing in the groundwater zone) and theDomenico model (to account for dilution and attenuation associated with longitudinal migrationto the property boundary) may be used in the development of the Soilow2- A DAF developedusing the Summers model (to account for mixing the groundwater zone) and the Domenicomodel (to account for dilution and attenuation associated with longitudinal migration to thenearest downgradient surface water body) may be used in the development of the Soilow3Dw andthe Soilow3NDw-
The soil to groundwater pathway shall be evaluated using one of the following three methods'.
Soilcw Method 1 - Organic Constituents:
(1) Identify the appropriate groundwater RECAP Standard (GWi, GWz, GW3ow, or GW3NDw) inTable 3 (or calculate using the methods presented in this Appendix) based on theclassification of the groundwater to be protected (refer to Section 2.10). For GWz and GW3,the site-specific DAF shall not be applied to the GWz risk-based value or the GW3ow orGW3NDw limiting water quality criterion to define the target soil leachate concentration forthe soil/water partition algorithm in Step 2. If the GWi, GWz, GW3ow, or GV^NDW is greaterthan the Watersol, then the Watersol shall be used as the target soil leachate concentration inStep 2.
(2) The soil/water partition algorithm shall be used to relate the concentration of constituentadsorbed on soil organic carbon to the soil leachate concentration in the impacted zone. TheGWi, GV/2, GW3DW, or GW3NDw identified above shall be used as the target soil leachateconcentration.
C,o,, (mg/kg) = GWWDW,orWDW(w^ ̂ ^XH-)
Pb
where:
Parameter Definition (units) Input ValueCsoil Concentration adsorbed to soil organic carbon
(mg/kg dry weight)GWi,2,3Dw, or 3NDW Target soil leachate concentration (mg/L) identified in Step 1p^ Dry soil bulk density (g/cm3) site-specific (1.7) a
9 ,̂ Water filled soil porosity (Lwater/Lsoii) site-specific (0.21)3
K<i Soil-water partition coefficient, chemical-specific(K^K^xfoeHcm'/g)
LDEQ RECAP 2000 J-43

KOC
psH'
HRT
Soil-organic carbon partition coefficient chemical-specific(cm'/g)Fractional organic carbon in soil (g/g); site-specific (0.006) ^foe = percent organic matter/174(ASTM 2974)air filled soil porosity (Lau/Lsoa) n-6wtotal soil porosity (Lpore/Lsoil) 1 - pb/pssoil particle density (g/cm3) site-specific (2.65) b
Henry's Law Constant (unitless) H' = H/RT chemical-specific(H'=Hx41) where:Henry's Law Constant (atm-n^/mol) chemical-specificUniversal Gas Constant 0.0000821 atm-m3/mole-OKAbsolute temperature of soil (K°) 273 + °C (25°C)
'LDEQ''Soil Screening Guidance, User's Guide. EPA 1996.'The sample(s) for foe determination shall be collected from an un-impacted area that isrepresentative of the soil conditions in the impacted area.
If the most heavily impacted soils occur below the water table, then the term (83 H') can beomitted as all pores are water saturated. In the absence of site-specific data for a particularparameter, the default value presented above or used for the development of MO-2 RECAPStandards (Appendixl) shall be used. The soil/water partition algorithm was obtained from SoilScreening Guidance: User's Guide, EPA 1996.
(3) The soil constituent concentration calculated in Step 2 shall be multiplied by a site-specific DFsummers (for Soilcwi, Soilow2, Soilow3Dw, and Soilow3NDw) and aDAFDomenico (for SoilowZi Soilow3DW, and SoilowsNDw) to yield the maximumtheoretical constituent concentration in soil leachate that will not cause thegroundwater RECAP Standard to be exceeded:
For Soiled:
SoiIoWl = Csoil X DFsuminen,
For Soilcm.'
SoiloW2 = Csoi] X DFsununcis X DAFDonicnico
For Soilfswww and Soil(;w3HDw:
SoiloW3DW Or SoiloW3NDW = CsoB X DFsunimers X DAFDoinenico
The site-specific DFsunimcrs shall be developed using the Summers Model or a default DF of20 may be used (Soil Screening Guidance, EPA 1996). The DAFDomencio shall be developedusing the Domenico analytical solute transport model (Domenico, P.A.. and F.W. Schwartz,1990. Physical and Chemical Hydrogeology, John Wiley and Sons, New York, N.Y.) (forthe saturated zone). If there is potential for constituent migration to be influenced bypumping activities within the zone, then a site-specific DFsummcre and DAFDomenico shall not beused in the development of the Soilow. The Summers and Domenico models are presentedbelow.
LDEQ RECAP 2000 S-44

Summers Model':
The mixing of unimpacted groundwater with impacted infiltration and the resultantconcentrations in groundwater are estimated using the following equation:
^Summers =(Qp+Qa) Cj
Qp C,i
where:
ParameterCsi
QpQaCi
Definition (units)constituent concentration in the groundwater (mg/1 or g/m3)volumetric flow rate of infiltration (soil pore water) fromthe AOI into the aquifer (n^/day)volumetric flow rate of groundwater (mVday)soil leachate concentration (mg/1)
Input Value
site-specific (seebelow)see below
The volumetric flow rate of infiltration from the AOI into the aquifer:
Qp = I x Sw x L
where:
Parameter Definition (units) Input Value(Default Value)
QpiSw
L
volumetric flow rate of infiltration (soil pore water) into the site-specificaquifer (n^/day)infiltration rate (m/yr) site-specific (0.1) b
width of impacted area perpendicular to flow direction of site-specificaquifer (m)length of impacted area parallel to flow direction of aquifer site-specific(m)
The volumetric flow rate of the groundwater is estimated as:
Q. = Dv x Sd x Sw
where:
Parameter Definition (units) Input Value(Default Value)
site-specific(9.144 m/yr)refer below
volumetric flow rate of groundwater (m'/day)darcy velocity in the aquifer (m/yr)
QaD y = K * i
SdSw
thickness of the mixing zone (m)width of impacted area perpendicular to flow direction of site-specificaquifer (m)
LDEQ RECAP 2000 J-45

The aqueous-phase concentration (Ci) is estimated from the total soil concentration (Crw) asfollows:
where:
Parameter Definition (units) Input Value (DefaultValue)
Ci dissolved constituent concentration in the liquid phase(mg/1)
CTW total soil concentration on a wet weight basis (mg/kg)p,, density of water (g/cm3)pb dry bulk density of soil (g/cm3)n total porosity of soil (cn^/cm3)Ow water filled soil porosity (Lw^a/Lsou)Koc soil organic carbon partition coefficient (cn^/g)foe fractional organic carbon in soil (g/g);
foe = percent organic matter /174 (ASTM 2974)K<i soil water partition coefficient
K<i=KocXfoc[(g/g)/(g)/cm3)]H' Henry's Law Constant (unitless)
site-specific1.0site-specific (1.7) a
site-specific (1 - pb/ps)site-specific (0.21)*chemical specificsite-specific (0.006) b
chemical-specific
chemical-specific
'LDEQ''Soil Screening Guidance, User's Guide, EPA 1996.
Domenico Model":
Before site-specific DAFDorncmco values are developed using the Domenico model equationpresented below, the boundary conditions used to derive this equation shall be reviewed todetermine if all of the assumptions are appropriate for the case being modeled (see reference).The Department will only allow the use of a DAFDomcmco that is based on the modeling of aninfinite permeable zone to a distance of 2000 feet if constituent retardation and first-orderdegradation rate values are set to Appendix I default values (an equivalent situation was providedto typical UST sites). Otherwise, site-specific conditions (geological conditions) are to be takeninto account in the model equation. If there is the potential for constituent migration to beinfluenced by pumping activities within the zone, a site-specific DAF shall not be calculatedusing the Domenico model. The Submitter may develop a site-specific DAF using an appropriatemodel under MO-3. An example DAFDomenico calculation is provided at the end of the Appendixof a case where the vertical boundary of the permeable zone is finite and the horizontal boundaryof the permeable zone is considered infinite.
Ce,DAFDomenico = G - 1 / "F
^"fi I1-J1+ 1 H^Hfcl
where:
LDEQ RECAP 2000 J-46

Parameter Definition Input Value (DefaultValue)
C,(x)i
C,,
Ow
Dvn^RiivxSd
KOx
Oy
Oz
erf
concentration of constituent i in groundwater atdistance x downstream of source (mg/L) or(mg/m3)concentration of constituent i in source zone(mg/L) or (mg/m3)source width perpendicular to groundwater flow(ft)groundwater Darcy velocity (K x i) (ft/yr)soil porosity (dimensionless)first-order degradation rate for constituent iconstituent retardation factor (dimensionless)hydraulic gradient (ft/ft)groundwater seepage velocitydistance downgradient from source (ft)source thickness (e.g., the thickness of theimpacted groundwater within the permeable zone)(ft)hydraulic conductivity (ft/yr)longitudinal groundwater dispersivity (ft)transverse groundwater dispersivity (ft)vertical groundwater dispersivity (ft)error function; erfx = —IS <'~'1 dt
•in
site-specific
site-specific (30) b
site-specific (0.36) b
site-specificc
site-specific c
site-specific(K x i)/nsite-specificsite-specific
site-specific(x*0.1)(Ox/3)(a,/20)
d
"Domenico, P.A.. and F.W. Schwartz, 1990. Physical and Chemical Hydrogeology, John Wileyand Sons, New York, N.Y."LDEQ'Degradation and/or retardation shall only be included in the model when site-specificquantitative data document occurrence. Derivation of constants for these process shall beincluded with the model input data. Degradation and retardation data are by definition monitorednatural attenuation processes. Therefore, literature values for retardation and degradation are notacceptable under the RECAP.''The solution to the error function is presented in Table J-l.
LDEQ RECAP 2000 J-47

Estimation of Sd:
The Sd is defined as the thickness of the contaminated groundwater within the permeable zone.Refer to Figure J-l for an illustration ofSd.
For the purpose of developing a DAF for Soilow, LDEQ requires that the Sd be estimated usingMethod 1 (below) and appropriate default parameters. If the estimated Sd value exceeds theaquifer thickness, Sa should be set to the thickness of the aquifer.
S^ Method I: Sum ofadvective and dispersive depths
Sd = hadv + hdisp
hadv = B[l-exp((-IxL)/(BxDy))]
where:
Parameter Definition (units)
advective component of the plume depht (ft)hadvI
DvBL
infiltration rate (ft/yr)darcy horizontal velocity (ft/yr)thickness of the shallow water bearing zone (ft)length of the source parallel to the groundwater flow at thewater table (ft)
Input Value(Default Value)site-specificsite-specific (0.33)site-specific (30) "site-specific"site-specific
-LDEQ
hdisp = (2x(x,xL) l/2
where:
Parameter Definition (units)
dispersive component of the plume depth (ft)hdispOzL
vertical dispersivity (ft)length of the source parallel to the groundwater flow at thewater table (ft)
Input Value
site-specificsite-specific (L/200)
iSrf Method 2: Thickness of the aquifer
The thickness of the impacted permeable zone shall be used as the Sd if the thickness of thegroundwater plume is not known.
LDEQ RECAP 2000 J-48

Soilcw Method 1 - Inorganic Constituents:
For inorganic constituents, the Soilow shall be developed using an approach based on theToxicity Characteristic Leaching Procedure (TCLP) regulatory levels (Maximum Concentrationsof Contaminants for the Toxicity Characteristic). The Toxicity Characteristic LeachingProcedure (TCLP) is an extraction process that assesses the leaching potential of constituentspresent in soil. TCLP regulatory levels represent maximum constituent concentrations inleachate that comply with the health-based criteria specified by the Safe Drinking Water Act foran assumed drinking water well downgradient of the source. The TCLP model assumes adilution factor of 100 to account for dilution of the leachate in groundwater before reaching adrinking water well. Therefore, in general, the TCLP regulatory levels are 100 times thedrinking water standard.
To determine the Soilow from the TCLP regulatory level the TCLP regulatory level shall bemultiplied by a factor of 20 to back-calculate to the corresponding "acceptable" concentration insoil. (A multiplier of 20 was used because the TCLP procedure requires the soil sample to bediluted 20:1 prior to acid extraction and leachate analysis.)
For inorganic constituents for which a TCLP regulatory level is not available, the Soilow shall beestimated by multiplying the GWi by a dilution factor of 100 and then by a factor of 20. Thisback-calculation approach duplicates the assumptions and methods used in the development ofTCLP regulatory levels and serves to identify an "acceptable" concentration in soil for thoseinorganic constituents for which a TCLP regulatory value was not available. (Hazardous WasteManagement System; Identification and Listing of Hazardous Waste; Toxicity CharacteristicsRevisions; Final Rule. EPA, 40 CFR Part 261 et. al.).
Soilcw - Method 2 - Organic and Inorganic Constituents:
Method 2 may be used to develop a site-specific Soilow when: (1) groundwater and soil data areavailable; (2) groundwater concentrations are less than soil concentrations; and (3) groundwaterdata indicate the GWi, GW;, or GWa has been exceeded (to determine the appropriategroundwater RECAP Standard refer to the groundwater classifications presented in Section2.10).
(1) The site-specific water/soil partition coefficient shall be determined using site-specificsoil and groundwater data as follows:
Gm,2or3\_ . x.. „ „ . ( GW\,lor3 b xSoilow (mg/kg) = ————— p'/conc )
I, ^conc )where:
Parameter Definition (units) Input Value
Soilow soil concentration protective of groundwater site-specific(mg/kg)
GWi, 2, or 3" groundwater RECAP Standard (mg/1) refer to Table 3GWconcb site-specific groundwater concentration at the POC site-specific
(mg/1)Soilconc site-specific soil concentration at the POC (mg/kg) site-specific
"The groundwater RECAP Standard used in the calculation of Soilcw shall be selected basedon the current or potential use of the impacted groundwater (See Section 2.10 forgroundwater classifications). For GW2 and GWa, the site-specific DAF shall not be applied to
LDEQ RECAP 2000 J-49

the GWz risk-based value or the GWa human health limiting water quality criterion to definethe acceptable concentration in groundwater for the soil/water partition algorithm in Step 1.'"The site-specific soil and groundwater concentrations (GW» and Soils,) should be selectedas to represent site-specific partitioning of the COCs between soil and groundwater (e.g., thesoil and groundwater sampled should be: (1) from the same location; (2) in communicationwith each other; (3) and at equilibrium and /or declining conditions).
(2) The site-specific soil/water partition coefficient shall be multiplied by a site-specificDAF.
(3) The site-specific Soilow obtained in Step 2 shall be compared to Soilni or Soil; and Soilsai.The lowest of the three values shall be applied as the MO-2 soil RECAP Standard.
Soilcw - Method 3 - Organic and Inorganic Constituents:
A leach test may be used instead of the soil/water partition algorithm to relate concentrations ofconstituents adsorbed to soil organic carbon to soil leachate concentrations in the impacted zone.The EPA Synthetic Precipitation Leaching Procedure (SPLP. EPA SW-846 Method 1312, U.S.EPA, 1994d) is the recommended leach test for the soil to groundwater pathway. The SPLP wasdeveloped to model an acid rain leaching environment and is generally appropriate for animpacted soil scenario (Soil Screening Guidance, EPA April 1996). The SPLP may not beappropriate for all situations thus alternative leach tests may be approved on a site-specific basis.An appropriate dilution and attenuation factor is to be applied to the results to determine if theCOC concentration in the soil is protective of groundwater.
The soil sample(s) to be submitted for SPLP should be collected from the most heavily impactedarea(s) of the AOL This sampling strategy allows for a worst case analysis of leach potential. Ifthe results of the SPLP test (and appropriate application of dilution factors) indicate that soils donot pose an unacceptable leach potential, then all other locations at the AOI would also providesimilar results. If SPLP testing (and appropriate application of dilution factors) indicates thatsoils from the most heavily impacted area(s) of the AOI pose an unacceptable leach potential,then additional soil samples surrounding the location are recommended to delineate thehorizontal extent of impacts.
For the protection of groundwater meeting the definition of Groundwater Classification 1:
Compare the SPLP results to the GW, * DF^^:
If the SPLP results are less than or equal to the GW) * DFsununcrs, then the COC sourceconcentration in the soil is protective of groundwater. Therefore, this pathway iseliminated from further consideration.
If the SPLP results are greater than the GWi * DFsunmen, then the COC sourceconcentration in the soil is not protective of groundwater and further evaluation orcorrective action is required.
LDEQ RECAP 2000 J-50

For the protection of groundwater meeting the definition of Groundwater Classification 2 or3:
Compare the SPLP results to appropriate GWRS * DFsummers * DFoomevco'-
If the SPLP results are less than or equal to the GWz, GWaow, or GWaNpw * DPsunmere *DFDomaiico, then the COC source concentration in the soil is protective of groundwater.Therefore, this pathway is eliminated from further consideration.
If the SPLP results are greater than the GW;, GW3ow, or GWaisrow * DPsanmcrs *DFDomenico, then the COC source concentration in the soil is not protective of groundwaterand further evaluation or corrective action is required.
LDEQ RECAP 2000 J-51

ATTACHMENT C
LDEQ RECAP STANDARDS FOR GROUND WATER
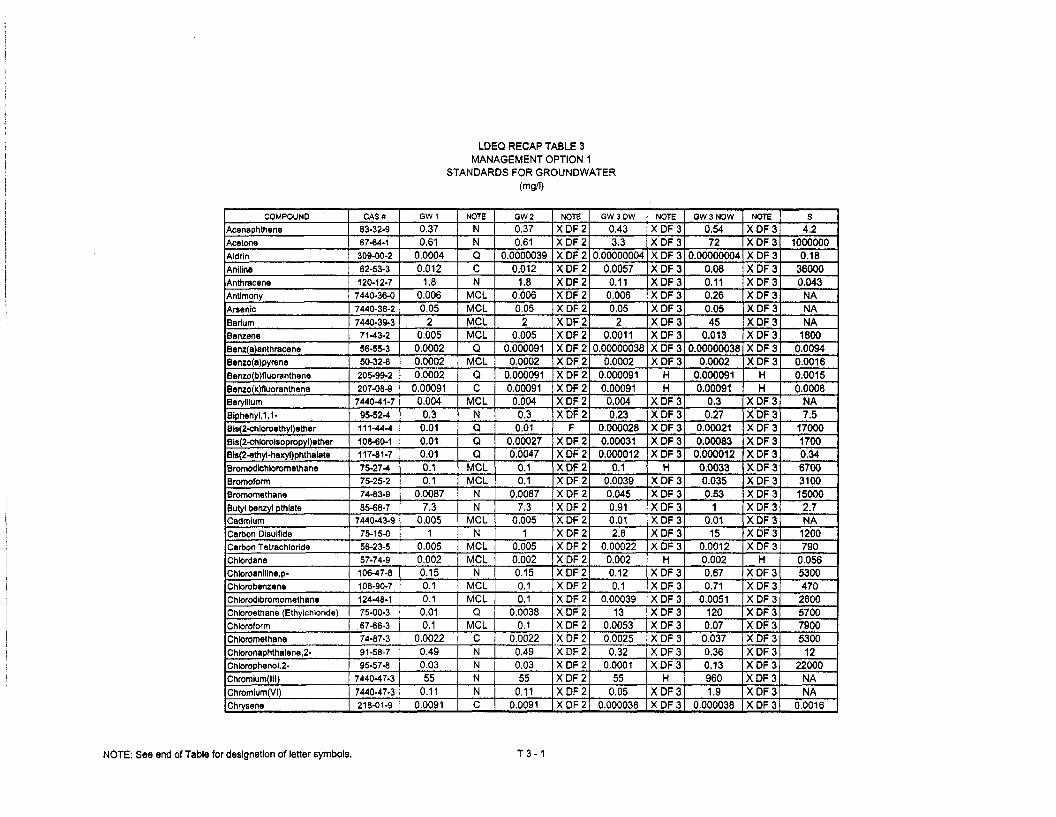
LDEQ RECAP TABLE 3MANAGEMENT OPTION 1
STANDARDS FOR GROUNDWATER(mg/l)
COMPOUNDAcenaphtheneAcetoneAldrinAnilineAnthraceneAntimonyArsenicBariumBenzeneBenz(a)anthraceneBenzo(a)pyreneBenzo(b)fluorantheneBenzo(R)fluorantheneBerylliumBlpnenyl,1,1-Bls(2-chloroethyl)etherBis(2-chloroisopropyl)etherBis(2-flthyl-haxyl)phthalateBromodicrilorometrianeBromoformBromomethaneButyl benzyl pthlateCadmiumCarbon DisulfideCarbon TetrachlorideChlordaneChloroanlline.p-ChlorobenzeneChlorodibromomethaneChloroethane (Ethylchtoride)ChloroformChloromethaneChloronaphthalene,2-Chlorophenol.2-Chromium(lll)Chromium(VI)Chrysene
CAS»83-32-967-64-1309-00-262-53-3120-12-7
7440-36-07440-38-27440-39-3
71-43-256-55-350-32-8205-99-2207-08-9
7440-41-795-52-4111-44-4108-60-1117-81-775-27-475-25-274-83-985-68-7
7440-43-975-15-056-23-557-74-9106-47-8108-90-7124-48-175-00-367-66-374-87-391-58-795-57-8
7440-47-37440-47.3218-01-9
GW10.370,61
0.00040.012
1.80.0060.05
20,0050.00020.00020.0002
0.000910.0040.30.010.010.010.10.1
0.00877.3
0.0051
0.0050.0020.150.10.1
0.010.1
0.00220.490.0355
0.110.0091
NOTENNQCN
MCLMCLMCLMCL
QMCL
QC
MCLNQQQ
MCLMCL
NN
MCLN
MCLMCL
NMCLMCL
QMCL
CNNNNC
QW20.370.61
0.00000390.012
1.80.0060.05
20.005
0.0000910.0002
0.0000910.000910.0040.30.01
0.000270.0047
0.10.1
0.00877.3
0.0051
0.0050.0020.150.10.1
0.00380.1
0.00220.490.0355
0.110.0091
NOTEXDF2XDF2XDF2XDF2XDF2XDF2XDF2XDF2XDF2XDF2XDF2XDF2XDP2XDF2XDF2
FXDF2XDF2XDF2XDF2XDF2XDF2XDP2XDF2XDF2XDF2XDF2XDF2XDF2XDF2XDF2XDF2XDF2XDF2XDF2XDF2XDF2
GW30W0.433.3
0.000000040.0057
0.110.0060.05
20.0011
0.000000380.0002
0.0000910.000910.0040.23
0.0000280.000310.000012
0.10.00390.0450.910.012.8
0.000220.0020.120.1
0.0003913
0.00530.00250.32
0.000155
0.050.000038
NOTEXDF3XDF3XDF3XDF3XDF3XDF3XDF3XDF3XDF3XDF3XDF3
HH
XDF3XDF3XDP3XDF3XDF3
HXDF3XDF3XDF3XDF3XDF3XDF3
HXDF3XDF3XDF3XDF3XDP3XDP3XDF3XDF3
HXDF3XDF3
GW 3 NDW
0.5472
0.000000040.080.110.260.0545
0.0130.00000038
0.00020.0000910.00091
0.30.27
0.000210.000830.0000120.00330.0350.53
10.01
150.00120.0020.670.71
0.00511200.07
0.0370.360.139601.9
0.000038
NOTEXDF3XDF3XDF3XDF3XDF3XDF3XDF3XDF3XDF3XDF3XDP3
HH
XDF3XDP3XDF3XDF3XDP3XDF3XDF3XDF3XDF3XDF3XDF3XDF3
HXDP3XDF3XDF3XDF3XDF3XDF3XDF3XDF3XDF3XDF3XDF3
S4,2
10000000.18
360000.043
NANANA
18000.00940.00160.00150.0008
NA7.5
1700017000.346700310015000
2.7NA
1200790
0.0565300470
2600570079005300
1222000
NANA
0.0016
NOTE: See end of Table for designation of letter symbols. T 3 - 1

LDEQ RECAP TABLE 3MANAGEMENT OPTION 1
STANDARDS FOR GROUNDWATER(mg/l)
COMPOUNDCobaltCopperCyanide (free)DDDDDEDDTDibenz(a,h)anthraceneDibenzofuranDibromo-3-chloropropane,1,2-Dichlorobenzena.1,2-Dichlorobenzene,1,3-Dichlorobenzene,1,4-Dichlorobenzidine,3,3-Dlchloroethane.1,1-Dichloroethane,1,2-Dichloroethene (mixture), 1 ,1 -Dichloroethene.cis, 1,2-Djchloroethene,trans,1.2-Dichlorophenol,2,4-Dichtoropropane, 1,2.Dichloropropene,1,3-DieldrinDIethylphlhalateDimethylphenol,2,4-Dimethyl phthalataDi-n-octylphthalateOlnitrobenzene,1,3-Dlnltrophenol,2,4.Dinitrotoluene,2,6-Dinitrotoluene,2,4-DinosebEndosulfanEndrinEthyl benzeneFluorantheneFluoreneHeptachlor
CAS#7440-46-47440-50-8
57-12-572-54-872.55-950-29-353-70-3132-64-996-12-895-50-1541-73-1106-46-791-94-175-34-3107.06-275.35-4156-59-2156-60.5120.83.278-87-5542-75.660.57-18446.2105-67-9131.11-3117-84-099-65-051-28-5
606-20-2121-14-288.85.7115-29-772-20.8100-41-4206-44-086-73-776-44-8
GW12.21.30.2
0.000280.00020.0002
0.010.0240.0002
0.60.0110.0750.020.81
0.0050.0070.070.1
0.110.0050.005
0.0000229
0,733700.730.01
0.0730.0370.0730.0070.22
0.0020,71.5
0.240.0004
NOTEN
MCLMCL
CCCQNQ
MCLN
MCLQN
MCLMCLMCLMCL
NMCL
QQNNNNQNNN
MCLN
MCLMCL
NN
MCL
GW22.21.30.2
0.000280.00020.0002
0.010.024
0,0000470.6
0.0110.075
0.000150.810.0050.0070.070.1
0.110.005
0.000080.0000041
290.733700.73
0.00370.0730.0370.0730,0070.220.0020.71.5
0,240.0004
NOTEXDF2XDF2XDF2XDF2XDF2XDF2
FXDF2XDF2XDP2XDF2XDF2XDF2XDF2XDF2XDF2XDF2XDF2XDF2XDF2XDF2XDF2XDF2XDF2XDF2XDF2X D P 2XDF2XDF2XDF2XDF2XDF2XDF2XDF2XDF2XDF2X D F 2
GW3DW21
0.660.000280.00020.0002
0.010.014
0.0000180.6
0,0180.075
0.0000133
0.000360.00005
0.070.1
0.00030.0050.0099
0.0000000513
0.282200,32
0.00310.0610.0290.0560.0070.22
0.000262.4
0.0310.0740.0004
NOTEXDF3XDF3XDF3
HHHG
XDF3XDF3XDF3XDF3XDF3XDF3XDF3XDF3XDF3XDF3XDF3XDF3XDF3XDF3XDP3XDF3XDF3XDF3XDF3XDF3XDF3XDF3X D F 3XDF3
HXDF3XDF3X D P 3XDF3
H
GW 3 NOW391.313
0.000280.00020.0002
0.010.015
0.0000673.4
0.0450.075
0.00001519
0.00680.00058
1.72.50.230.0050.16
0.0000000523
0.455700.6
0.0280.5
0.170.29
0.0250.000640.00026
8.10.0320.0780.0004
NOTE
XDP3XDF3XDF3
HHHG
XDF3XDF3XDF3XDF3XDF3XDF3XDF3XDF3XDF3XDF3XDF3XDF3XDF3XDF3XDF3XDF3XDF3XDF3XDF3XDF3XDP3XDF3XDF3XDF3XDF3XDF3XDF3XDP3XDF3
H
SNANANA0.090.120.025
0.00253.1
1200160130743.1
510085002300350063004500280028000.2
1100790043000.02530
280018027052
0.510.251700.21
20.18
NOTE: See end of Table for designation of letter symbols. T 3 . 2

LDEQ RECAP TABLE 3MANAGEMENT OPTION 1
STANDARDS FOR GROUNDWATER(mg/l)
COMPOUNDHeptachlor epoxideHexachloro benzeneHexachlorobutadieneHexachlorocyclohexane,alphaHexachlorocyclohexane.betaHexachlorocyclohexane,gammiHexachlorocyctopentadieneHexachloroethanelndeno(1,2,3-cd)pyreneIsobutyl alcoholIsophoroneLead (inorganic)Mercury (inorganic)MethoxychlorMethylena chlorideMethyl ethyl KetoneMethyl isobutyl ketoneMTBE (methyl tert-butyl ether)NaphthaleneNickelNitrateNitriteNitroanillne,2-Nltroaniline,3-Nltroaniline,4-NitrobenzeneNitrophenol,4-NItrosodi-n-propylamine.n-N-nitrosodlphenylaminePsntachtorophenolPhenolPolychlorinated biphenylsPyreneSeleniumSilverStyreneTetrachlorobenzene, 1,2,4,5-
CAS»
1024-57-3118-74-187-68-3
319-84-6319-85-758-89-977-47-467-72-1193-39-578-83-1378-59-1
7439-92-17439-97-6
72-43-575-09-278-93.3108.10-11634-04-491-20-3
7440-02.014797-55-814797-65-0
88-74-499-09-2100-01-698-95-3100-02-7621-64-786-30-687-86-5108-95-21336-36-3129-00-0
7782-49-27440-22-4100-42-595-94-3
GW1
0.00020.001
0.000850.000030.000060.00020.05
0.000790,0004
1 10.07
0.0150.0020.04
0.0051.9
0.145.2
0.010.73
101
0.050.0180,110.010.290.01
0.0140.0013.7
0.00050.180.050.180.1
0.011
NOTEMCLMCL
CQQ
MCLMCL
CQNC
MCLMCLMCL
QNNNQN
MCLMCL
QNNQNQC
MCLN
MCLN
MCLN
MCLN
GW20.00020.001
0.000850.0000110.0000370.00020.05
0.000790.000091
1 10.07
0.0150.0020.04
0.00421,9
0.145.2
0.00820.73101
0,000350.0180.11
0.00340.290.01
0.0140.001
3.70.0005
0.180.050.180.1
0.011
NOTE
XDF2XDF2XDF2XDF2XDF2XDF2XDF2XDF2XDF2XDF2XDF2XDF2XDF2XDF2XDF2XDF2XDF2XDF2XDF2XDF2XDF2XDF2XDF2XDP2XDF2XDF2XDF2
FXDF2XDF2XDF2XDF2XDF2XDF2XDF2X D F 2XDF2
GW3DW
0.00020.001
0,000090,00000180.0000049
0.000110.050.001
0.0000919.8
0.0330.050,0020.04
0.0044202.629
0.170.67
101
0.00170.0940.0940.0150.230.01
0.00220.001
190.0005
0,610.050.130.1
0.00054
NOTE
XDF3H
XDF3XDF3XDF3XDF3XDF3XDP3
HXDF3XDF3XDF3XDF3XDF3XDF3XDF3XDF3XDF3XDF3XDF3XDF3XDF3XDF3XDP3XDF3XDF3XDF3
GXDF3XDF3XDF3
HXDF3XDF3XDF3XDF3XDF3
OW 3 NOW
0.00020.001
0.000110.00000260.0000065
0.00020.05
0.00170.000091
1600.320.050.0020.040.087390305500.22
13100064
0.00960.930.930.096
1.30.0000440.00320.001170
0.00051.4
0.050.547.1
0.00057
NOTE
XDF3H
XDF3XDF3XDF3XDF3XDF3XDF3
HXDF3XDF3XDF3XDF3XDF3XDF3XDF3XDF3XDF3XDF3XDF3XDF3XDF3XDF3XDF3XDF3XDF3XDF3XDF3XDF3XDF3XDF3
HXDF3XDF3XDF3XDF3XDF3
S0.26.23.22
0.246.81.85
0.0000228500012000
NANA
0.04513000
2200001900051000
31NANANA
1300890730
2100120009900
352000
830000.0310.14NANA3100.6
NOTE: See end of Table for designation of letter symbols. T 3 - 3

LDEQ RECAP TABLE 3MANAGEMENT OPTION 1
STANDARDS FOR GROUNDWATER(mg/l)
COMPOUNDTetrachloroethane, 1 ,1 ,1 ,2-Tetrachloroethane, 1,1,2,2-TetrachloroethyleneTetrachlorophenol,2,3,4,6-ThalliumTolueneToxapheneTricntorobenzene, 1,2,4-Trichloroethane,1,1,1-Tnchloroethane, 1,1,2-TrichloroetheneTrichlorofluorometnaneTrlchlorophenol,2,4,5-Trichlorophenol,2,4,6-VanadiumVinyl chlorideXylene(mixe<l)ZincAllphatica C6-C8Allphatics >C8-C10Aliphatlcs>C10-C12Aliphatlcs >C12-C16Allphatics >C16-C28Aromatics>C8-C10Aromatlcs>C10-C12Aronnatics >C12-C16Aromatics >C16-C21AromatiC8>C21-C28TPH-GROTPH-DROTPH-ORO
CAS#630.20-679-34-5127-18-458-90-2
7440-28-0108-88-3
8001-35-2120-82-171-55-679-00-579-01-675-69-495-95-488-06-2
7440-62-275-01-4
1330-20-77440-66-6
NANANANANANANANANANANANANA
GW10,0050.00050.005
1.10.002
10.0030.070.2
0.0050.005
1.33.7
0.010.260.002
1011321.31.41.473
0,340.340.341.11 .1
0.340.341.1
NOTEQQ
MCLN
MCLMCLMCLMCLMCLMCLMCL
NNQN
MCLMCL
NNNNNNNNNNNN,lN,lN,l
GW20.000430.000055
0.0051.1
0.0021
0.0030.070,2
0.0050.005
1.33.7
0.0060.26
0.0021011321.31,41.473
0.340.340.341 . 11.1
0.340.34
1 . 1
NOTE
XDF2XDF2XDF2XDF2XDF2XDF2X D F 2XDF2XDP2XDF2XDP2XDF2XDF2XDF2XDF2XDF2XDF2XDF2XDP2XDF2XDF2XDF2XDF2XDF2XDF2XDF2XDF2XDP2XDF2XDF2XOF2
GW3DW0.000840.000160.00065
0.150.002
6.10.0030.070.2
0.000560.0028
6.90.54
0.000650.23
0.0019105
1703.43.43.4671.31.31.3
. 1.01.01.31.01.0
NOTEXDF3XDF3XDF3XDF3XDF3XDF3
HXDF3XDF3XDF3XDP3XDF3XDF3XDF3XDF3XDF3XDF3XDF3XDF3XDF3XDF3XDF3XDF3XDF3XDF3XDF3XDF3XDF3XDF3XDF3XDF3
GW 3 NDW0.00220.00180.0025
0.180.002
460.0030.195.2
0.0070.021
200.64
0.000824.5
0.036438
3900797979
16003131312424312424
NOTE
XDF3XDF3XDF3XDP3XDF3XDF3
HXDF3XDF3XDF3XDF3XDF3XDF3XDF3XDF3XDF3XDF3XDP3XDF3XDF3XDF3XDF3XDF3XDP3XDF3XDF3XDF3XDF3XDF3XDF3XDF3
S110030002001000NA5300.7430013004400110011001200800NA
2800160NA
*****
*****
....«
*****
*****
*****
*****
*****
*****
*****
*•**•
*****
*****
NOTE: See end of Table for designation of letter symbols. T 3 - 4

LDEQ RECAP TABLE 3MANAGEMENT OPTION 1
STANDARDS FOR GROUNDWATER(mg/l)
COMPOUND
C - Based on carcinogenic hearth effectsF - GW 2 multiplied by maximum DF Is less than GW 1 thus default to GW 1G - GW 3 multiplied by maximum DF is less than GW 2 thus default to GW 2 and do not multiply by DF 2H - GW 3 multiplied by maximum DF is less than GW 2 thus default to GW 2 and multiply by DF 2I - TPH Standards are only applicable when used In conjunction with Standards for indicator compoundsMCL - Based on EPA's Maximum Contaminant Level (MCL) for drinking waterN - Based on non-carcinogenic health effectsNA - Not applicableQ • Based on analytical quantitation limitX DF 2 - Multiply GW 2 by the appropriate site specific dilution factor from the chartX DF 3 - Multiply GW 3 DW or GW 3 NDW by the appropriate site specific dilution factor from the chart
CAS» GW1 NOTE GW2 NOTE GW3DW NOTE GW 3 NDW NOTE S
NOTE: See end of Table for designation of letter symbols. T 3 - 5