Embed Size (px)
Citation preview
Responding to megatrends PRI and Willis Towers Watson Investment Institutions Trend Index 2017

Willis Towers Watson is a leading global advisory, broking and solutions company that helps clients around the world turn risk into a path for growth. With roots dating to 1828, Willis Towers Watson has 39,000 employees in more than 120 countries. We design and deliver solutions that manage risk, optimize benefits, cultivate talent, and expand the power of capital to protect and strengthen institutions and individuals. Our unique perspective allows us to see the critical intersections between talent, assets and ideas — the dynamic formula that drives business performance. Together, we unlock potential.
Learn more at willistowerswatson.com
________________________________________________________________
This publication was produced by Willis Towers Watson in collaboration with the PRI.
The PRI is the world’s leading proponent of responsible investment. It works to understand the investment implications of environmental, social and governance (ESG) factors and to support its international network of investor signatories in incorporating these factors into their investment and ownership decisions. The PRI acts in the long-term interests of its signatories, of the financial markets and economies in which they operate, and ultimately of the environment and society as a whole. The PRI currently has over 1800 signatories, who collectively manage US$70 trillion in assets.
For more information, please visit www.unpri.org
________________________________________________________________
Published: December 2017
2 willistowerswatson.com
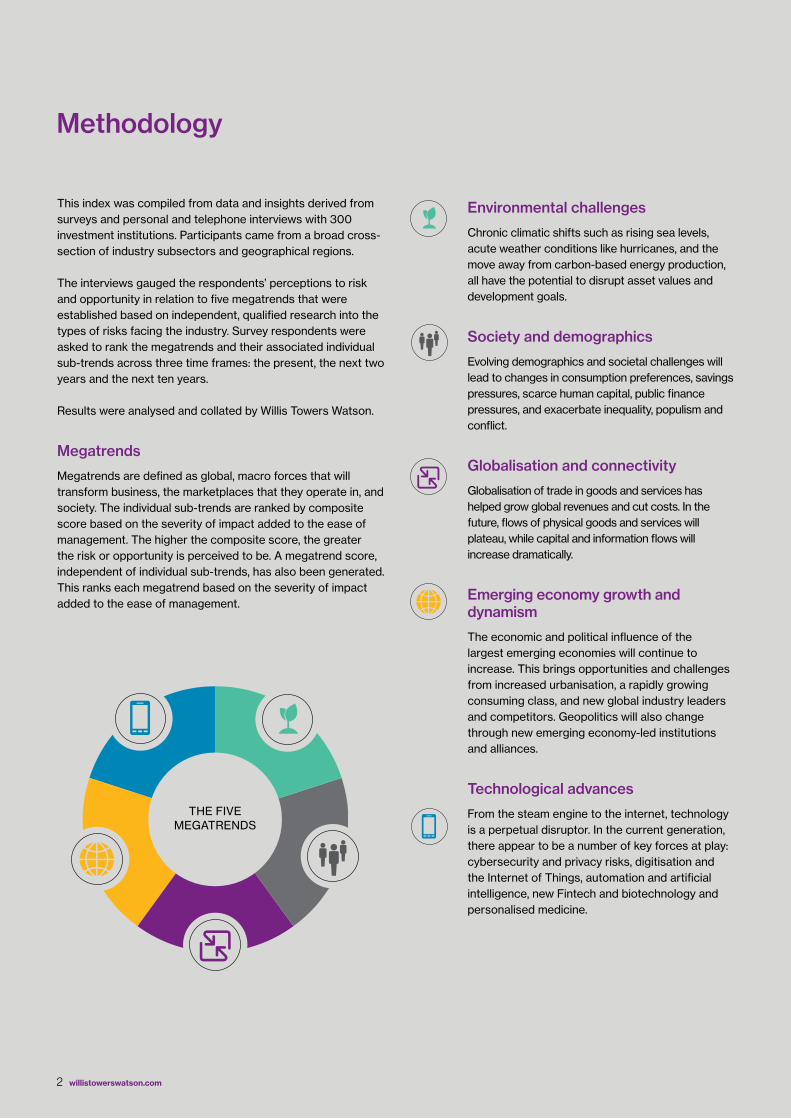
This index was compiled from data and insights derived from surveys and personal and telephone interviews with 300 investment institutions. Participants came from a broad cross-section of industry subsectors and geographical regions.
The interviews gauged the respondents’ perceptions to risk and opportunity in relation to five megatrends that were established based on independent, qualified research into the types of risks facing the industry. Survey respondents were asked to rank the megatrends and their associated individual sub-trends across three time frames: the present, the next two years and the next ten years.
Results were analysed and collated by Willis Towers Watson.
Megatrends
Megatrends are defined as global, macro forces that will transform business, the marketplaces that they operate in, and society. The individual sub-trends are ranked by composite score based on the severity of impact added to the ease of management. The higher the composite score, the greater the risk or opportunity is perceived to be. A megatrend score, independent of individual sub-trends, has also been generated. This ranks each megatrend based on the severity of impact added to the ease of management.
Methodology
Environmental challenges
Chronic climatic shifts such as rising sea levels, acute weather conditions like hurricanes, and the move away from carbon-based energy production, all have the potential to disrupt asset values and development goals.
Society and demographics
Evolving demographics and societal challenges will lead to changes in consumption preferences, savings pressures, scarce human capital, public finance pressures, and exacerbate inequality, populism and conflict.
Globalisation and connectivity
Globalisation of trade in goods and services has helped grow global revenues and cut costs. In the future, flows of physical goods and services will plateau, while capital and information flows will increase dramatically.
Emerging economy growth and dynamism
The economic and political influence of the largest emerging economies will continue to increase. This brings opportunities and challenges from increased urbanisation, a rapidly growing consuming class, and new global industry leaders and competitors. Geopolitics will also change through new emerging economy-led institutions and alliances.
Technological advances
From the steam engine to the internet, technology is a perpetual disruptor. In the current generation, there appear to be a number of key forces at play: cybersecurity and privacy risks, digitisation and the Internet of Things, automation and artificial intelligence, new Fintech and biotechnology and personalised medicine.
THE FIVE MEGATRENDS
3 Executive summary
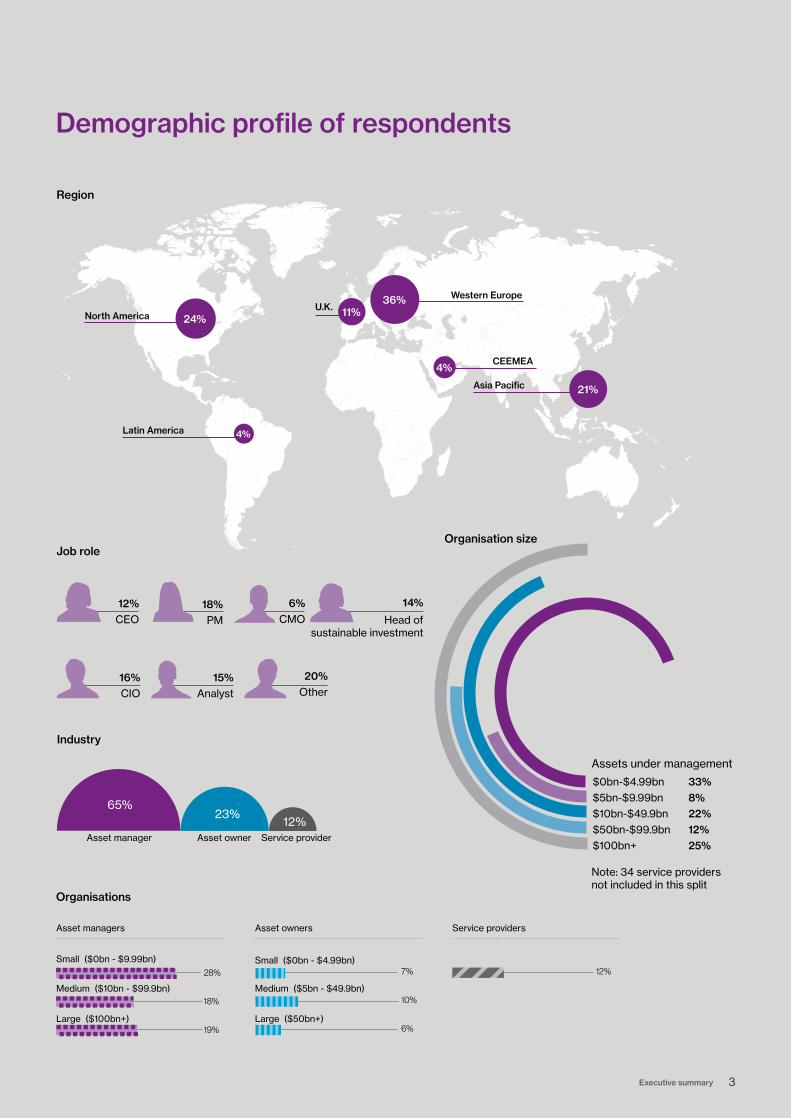
20% Other
Job role
Industry
Organisations
Region
Organisation size
Demographic profile of respondents
12% CEO
16% CIO
6% CMO
18% PM
14%
Head of sustainable investment
15% Analyst
Western Europe
North America
Asia Pacific
Latin America
Asset manager Asset owner Service provider
CEEMEA
U.K.36%
21%
24%11%
4%
4%
Note: 34 service providers not included in this split
10%
6%
7% 12%
18%
19%
28%
Small ($0bn - $9.99bn)
Asset managers Asset owners Service providers
Medium ($10bn - $99.9bn)
Large ($100bn+)
Small ($0bn - $4.99bn)
Medium ($5bn - $49.9bn)
Large ($50bn+)
65%23%
12%
$0bn-$4.99bn 33% $5bn-$9.99bn 8% $10bn-$49.9bn 22% $50bn-$99.9bn 12% $100bn+ 25%
Assets under management
4 willistowerswatson.com
Mary O’Connor Head of Client, Industry and Business Development and Global Head of Financial Institutions
Willis Towers Watson
“Megatrends are omnipresent but growing in importance. Increasingly, it is apparent that these should form part of all institutions, investment processes.”
David Hoile Global Head of Asset Research, Investment
Willis Towers Watson
Nathan Fabian Director of Policy and Research
PRI
5 Foreword
Foreword
Earlier this year, the PRI launched its Blueprint for Responsible Investment. This sets out our vision for the next 10 years and lays out three areas of impact on which the PRI will focus:
� Supporting responsible investors in their pursuit of long-term value and enhancing environmental, social and governance factor integration in the investment chain.
� Addressing unsustainable aspects of the markets in which investors operate.
� Enabling signatories to improve the real world – now and in the future – by encouraging investments and a financial system aligned with prosperous and inclusive societies for current and future generations.
These broad aims set out where we want to head and will guide what the PRI will do. However, we all know that the world in which we operate is not static and could fundamentally change in many ways.
This is why we have decided to look at megatrends – long-term, transformative changes that will affect and influence the economy, society and environment at large. These include environmental challenges; changes in society and demographics; globalisation and connectivity; emerging economy growth and dynamism; and technological change.
They have the potential to significantly impact and alter the financial system and investment industry in which the PRI and signatories operate. Many of these existing megatrends have a place in our current work and are assessed to some degree. Yet there is a need to investigate megatrends in a more comprehensive and systematic way.
We are therefore delighted to have partnered with Willis Towers Watson to examine megatrends and explore how they will impact:
� The financial system.
� Capital allocation.
� Environmental and social conditions, including the ability to deliver the UN’s Sustainable Development Goals.
By understanding the impacts of these megatrends we hope to shape and inform our work on investment practices, sustainable financial markets and the contribution of the financial system to prosperous and inclusive societies. We encourage our signatories to take the opportunity to do the same and commend this work to you.
Megatrends are at the heart of our work with clients. Whether it is the next big technological leap, or acute climate-related disruption, these trends have the potential to impact investors’ portfolios and businesses, substantially. Understanding megatrends is therefore part of our DNA, and doing so helps ensure that our clients minimise the risks, and maximise the opportunities, they bring.
We are delighted to have partnered with the PRI to build a megatrends index. The index is based on a comprehensive survey of asset owners, investment managers and service providers. Megatrends are omnipresent but growing in importance. Increasingly, it is apparent that these should form part of all institutions investment processes. Whether it is a board setting its long-term strategy, or portfolio managers dynamically seeking out the best investment opportunities, disruption to the financial system and/or impacting the world’s ability to meet the Sustainable Development Goals, megatrends matter. This is a notion shared by 80% of our survey participants.
We hope that this report serves to lift the financial industry’s awareness of megatrends, and crucially, benefit end savers and society as a whole.
Contents
6 - 9 Executive summaryOur framework deepens our collective understanding of the long-term generators of and detractors from sustainable development and financial investment
10 - 11 The primary trendsThe industry’s top trends as seen through the eyes of asset owners, asset managers, and service providers
12 - 21
Technological advancesFrom digitalisation to automation, investment institutions know successfully managing transformative and disruptive technology is essential
22 - 23
Institutional Investors Trend IndexRanking the industry’s top individual trends
24 - 35
Environmental challengesHow investors assess and mitigate the impact of environmental risks on portfolios remains a key area of uncertainty
36 - 39
Globalisation and connectivityGlobalisation drives comparative advantage and competitiveness, economies of scale, deeper capital markets and the transfer of innovation
Section one
Section two Section three
40
Rating the megatrends by sectorThe megatrend hierarchy as seen by leaders of the investment industry
41 - 44
Society and demographicsRetirement savings for lower income households are low and pension retirement needs will likely not be met
45
Rating the megatrends by regionThe global view on how the megatrends rank
50 - 53
Emerging economy growth and dynamismInvestment in capital equipment and infrastructure improves productivity and income development, with potential to achieve income goals for hundreds of millions of people
54 - 64
A systems view of megatrendsWe think in detail about the business and societal implications of megatrends, with an eye to extracting the most material implications for investment institutions
Section five Section six
Section four
6 willistowerswatson.com
Executive summary
What is a megatrend? Most institutions share a common belief that megatrend dynamics will result in multidimensional transformations across society, technology, economics, environment and politics (STEEP). We would also strongly encourage this thinking about megatrends to be framed within the context of an integrated system of real-world powerful forces altering the structure of economies, industries and global capital markets.
Importantly, these megatrends can all be defined by intuitive and practical key economic indicators. As such the impacts of these megatrends are identifiable in terms of how they change businesses, the financial system, and society and the environment.
Many long-term investors understand the problem they face in moving towards more sustainable portfolios. They know that basing their investment decisions on historical information alone is sub-optimal, because the relationships and correlations of the past may be wildly different in the future. Moreover, financial asset prices are arguably driven by shorter-term factors and may not reflect the influence of long-term change.
Megatrends matter. More than 80% of respondents agreed that incorporating notions of megatrends into their investment processes was consistent with their beliefs. Moreover, they expect megatrends to exert an accelerating influence on financial and social outcomes over the coming decade.
A good number of investment institutions have developed a set of sustainability beliefs and some have excluded or selected securities based on their ESG characteristics. But integrating sustainability metrics into portfolio management, right down the investment value chain is something we believe has eluded most institutions to date. The difficulty of exploiting the likely premium from long-term investment was cited as a critical barrier to megatrend integration. This gets right to the heart of the problem. That is, how can investment institutions create a truly sustainable portfolio and how can they be sure they have succeeded?
It ought to be possible to do this. While institutional investors have differing taxonomies and cultural challenges, their key decision-making issues tend to be similar, whatever their size and wherever they are based.
This report sets out to lift the financial industry’s awareness of megatrends and highlight our key findings. A second phase report will set out detailed trend-by-trend analysis and results.
The report is structured in six sections.
Section one: Technological advances
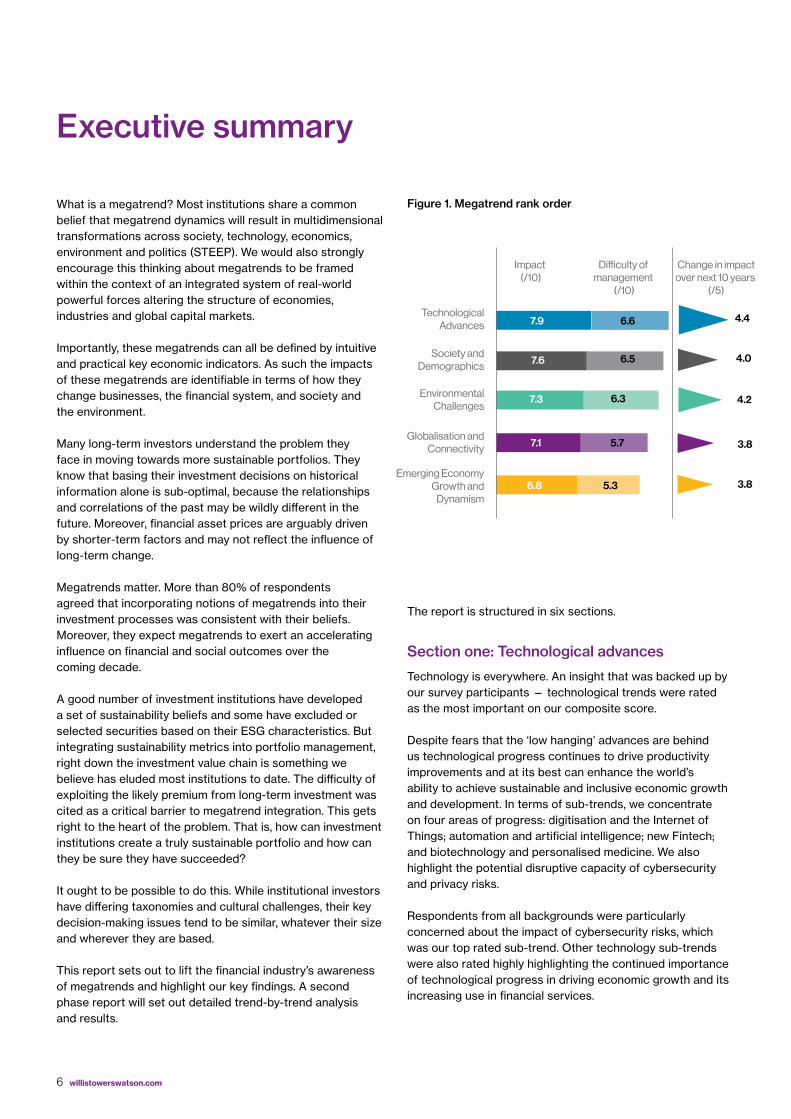
Technology is everywhere. An insight that was backed up by our survey participants — technological trends were rated as the most important on our composite score.
Despite fears that the ‘low hanging’ advances are behind us technological progress continues to drive productivity improvements and at its best can enhance the world’s ability to achieve sustainable and inclusive economic growth and development. In terms of sub-trends, we concentrate on four areas of progress: digitisation and the Internet of Things; automation and artificial intelligence; new Fintech; and biotechnology and personalised medicine. We also highlight the potential disruptive capacity of cybersecurity and privacy risks.
Respondents from all backgrounds were particularly concerned about the impact of cybersecurity risks, which was our top rated sub-trend. Other technology sub-trends were also rated highly highlighting the continued importance of technological progress in driving economic growth and its increasing use in financial services.
TechnologicalAdvances
Society andDemographics
EnvironmentalChallenges
Globalisation andConnectivity
Emerging EconomyGrowth and
Dynamism
Impact (/10)
Difficulty of management
(/10)
Change in impactover next 10 years
(/5)
6.8 5.3 3.8
7.1 5.7 3.8
7.3 6.3 4.2
7.6 6.5 4.0
7.9 6.6 4.4
Figure 1. Megatrend rank order
7 Executive summary
10
9
8
7
6
5
4
3
2
1
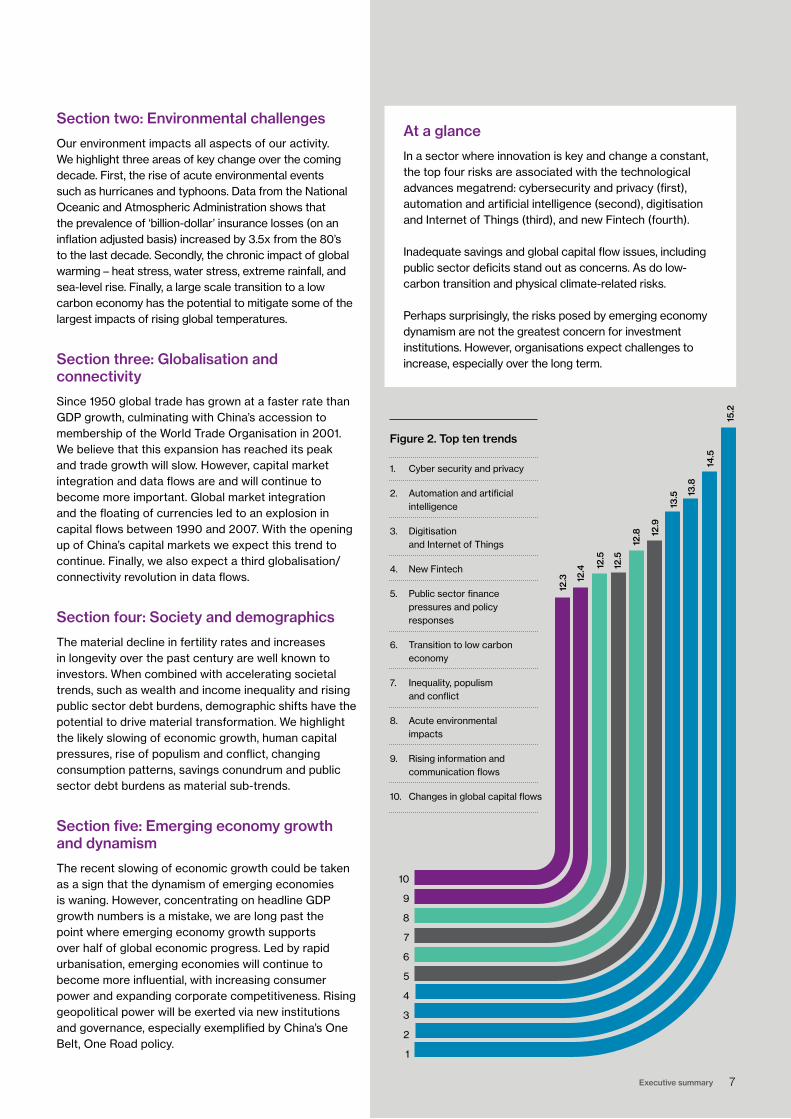
15.2
14.5
13.8
13.5
12.9
12.8
12.5
12.5
12.4
12.3
Figure 2. Top ten trends
1. Cyber security and privacy
2. Automation and artificial intelligence
3. Digitisation and Internet of Things
4. New Fintech
5. Public sector finance pressures and policy responses
6. Transition to low carbon economy
7. Inequality, populism and conflict
8. Acute environmental impacts
9. Rising information and communication flows
10. Changes in global capital flows
Section two: Environmental challenges
Our environment impacts all aspects of our activity. We highlight three areas of key change over the coming decade. First, the rise of acute environmental events such as hurricanes and typhoons. Data from the National Oceanic and Atmospheric Administration shows that the prevalence of ‘billion-dollar’ insurance losses (on an inflation adjusted basis) increased by 3.5x from the 80’s to the last decade. Secondly, the chronic impact of global warming – heat stress, water stress, extreme rainfall, and sea-level rise. Finally, a large scale transition to a low carbon economy has the potential to mitigate some of the largest impacts of rising global temperatures.
Section three: Globalisation and connectivity
Since 1950 global trade has grown at a faster rate than GDP growth, culminating with China’s accession to membership of the World Trade Organisation in 2001. We believe that this expansion has reached its peak and trade growth will slow. However, capital market integration and data flows are and will continue to become more important. Global market integration and the floating of currencies led to an explosion in capital flows between 1990 and 2007. With the opening up of China’s capital markets we expect this trend to continue. Finally, we also expect a third globalisation/connectivity revolution in data flows.
Section four: Society and demographics
The material decline in fertility rates and increases in longevity over the past century are well known to investors. When combined with accelerating societal trends, such as wealth and income inequality and rising public sector debt burdens, demographic shifts have the potential to drive material transformation. We highlight the likely slowing of economic growth, human capital pressures, rise of populism and conflict, changing consumption patterns, savings conundrum and public sector debt burdens as material sub-trends.
Section five: Emerging economy growth and dynamism
The recent slowing of economic growth could be taken as a sign that the dynamism of emerging economies is waning. However, concentrating on headline GDP growth numbers is a mistake, we are long past the point where emerging economy growth supports over half of global economic progress. Led by rapid urbanisation, emerging economies will continue to become more influential, with increasing consumer power and expanding corporate competitiveness. Rising geopolitical power will be exerted via new institutions and governance, especially exemplified by China’s One Belt, One Road policy.
At a glance
In a sector where innovation is key and change a constant, the top four risks are associated with the technological advances megatrend: cybersecurity and privacy (first), automation and artificial intelligence (second), digitisation and Internet of Things (third), and new Fintech (fourth).
Inadequate savings and global capital flow issues, including public sector deficits stand out as concerns. As do low-carbon transition and physical climate-related risks.
Perhaps surprisingly, the risks posed by emerging economy dynamism are not the greatest concern for investment institutions. However, organisations expect challenges to increase, especially over the long term.
8 willistowerswatson.com
Section six: Analysing megatrends as a system
Viewing the economy, the firms of which it is comprised and its financial systems as ecosystems has gained popularity in recent years. Over time economies and financial markets have become more interconnected such that this change in perspective, from considering how a single individual firm might compete to thinking about the system as a whole, is a natural progression. We believe this approach allows better assessment and management of risks faced by individual organisations as well as systemic risks. As the Generation Foundation highlight, “a systems view of megatrends reveals the interrelation of several sustainability issues, which broadens the set and complexity of second order risks and opportunities for investors.” In particular those risks that might be described as the tragedy of the commons — where the self-interested actions of individuals leads to the demise of the group – come into focus and we can begin to consider how pressures both within the investment system and applied from outside will shape how it changes over time.
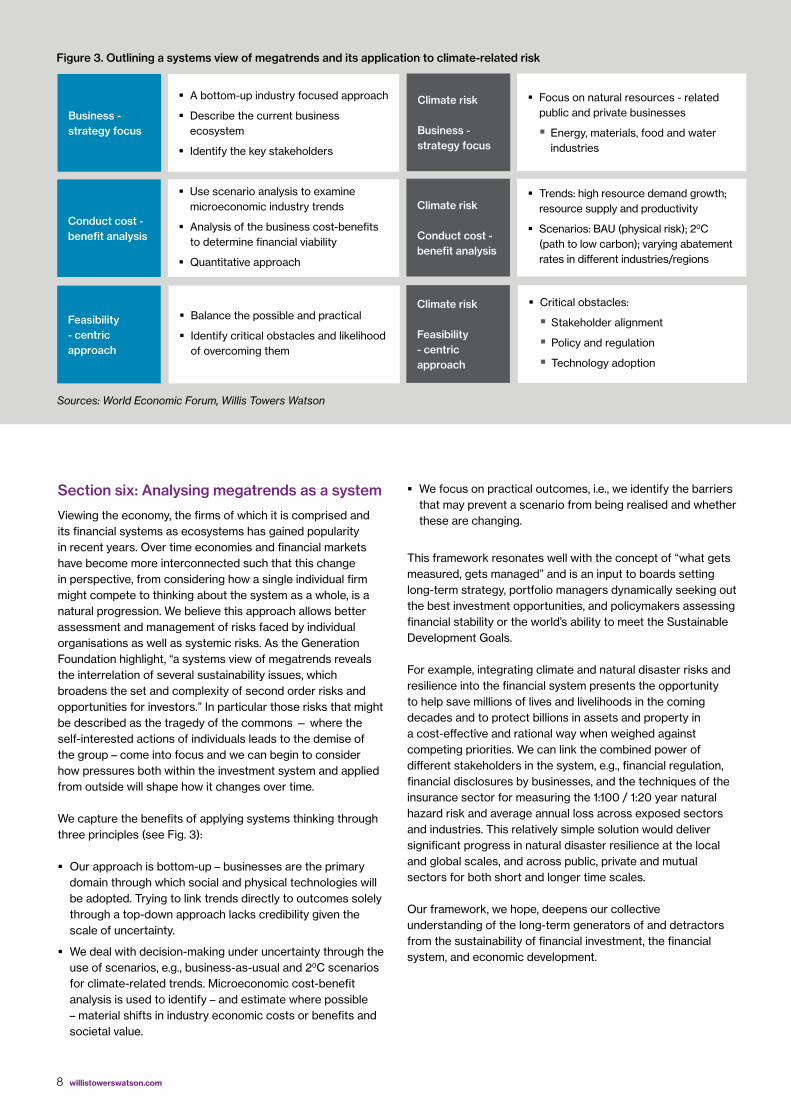
We capture the benefits of applying systems thinking through three principles (see Fig. 3):
� Our approach is bottom-up – businesses are the primary domain through which social and physical technologies will be adopted. Trying to link trends directly to outcomes solely through a top-down approach lacks credibility given the scale of uncertainty.
� We deal with decision-making under uncertainty through the use of scenarios, e.g., business-as-usual and 20C scenarios for climate-related trends. Microeconomic cost-benefit analysis is used to identify – and estimate where possible – material shifts in industry economic costs or benefits and societal value.
� We focus on practical outcomes, i.e., we identify the barriers that may prevent a scenario from being realised and whether these are changing.
This framework resonates well with the concept of “what gets measured, gets managed” and is an input to boards setting long-term strategy, portfolio managers dynamically seeking out the best investment opportunities, and policymakers assessing financial stability or the world’s ability to meet the Sustainable Development Goals.
For example, integrating climate and natural disaster risks and resilience into the financial system presents the opportunity to help save millions of lives and livelihoods in the coming decades and to protect billions in assets and property in a cost-effective and rational way when weighed against competing priorities. We can link the combined power of different stakeholders in the system, e.g., financial regulation, financial disclosures by businesses, and the techniques of the insurance sector for measuring the 1:100 / 1:20 year natural hazard risk and average annual loss across exposed sectors and industries. This relatively simple solution would deliver significant progress in natural disaster resilience at the local and global scales, and across public, private and mutual sectors for both short and longer time scales.
Our framework, we hope, deepens our collective understanding of the long-term generators of and detractors from the sustainability of financial investment, the financial system, and economic development.
Business - strategy focus
Climate risk
Business - strategy focus
� A bottom-up industry focused approach
� Describe the current business ecosystem
� Identify the key stakeholders
� Focus on natural resources - related public and private businesses
� Energy, materials, food and water industries
� Use scenario analysis to examine microeconomic industry trends
� Analysis of the business cost-benefits to determine financial viability
� Quantitative approach
� Trends: high resource demand growth; resource supply and productivity
� Scenarios: BAU (physical risk); 20C (path to low carbon); varying abatement rates in different industries/regions
� Balance the possible and practical
� Identify critical obstacles and likelihood of overcoming them
� Critical obstacles:
� Stakeholder alignment
� Policy and regulation
� Technology adoption
Conduct cost - benefit analysis
Climate risk
Conduct cost - benefit analysis
Feasibility - centric approach
Climate risk
Feasibility - centric approach
Figure 3. Outlining a systems view of megatrends and its application to climate-related risk
Sources: World Economic Forum, Willis Towers Watson
9 Executive summary
companies
megatrends
riskcapital
portfolio
different impa
ct mea
nin
dust
ryriskneed
asse
tts
risk
sse
einghu
man
alre
ady
issu
efactcertain
approach
realkey
direct
owne
rs
good
prob
ably
big
clim
ate
issu
es
asse
tnow
changetrends
people
Brazil
opportunitiesinequality
posi
tive
money happening fu
ture
wor
ld
impo
rtan
tinvestment
ESGwhole
part
inve
stm
ents
managers
tim
eye
ars
perspective marketsclients
vari
ous
certainty
long
start
believe activ
e
rese
arch
environmental
inve
stse
ctor
emer
ging
SD
Gs
little
carbon social talk
make grow
th man
agem
ent
tech
nolo
gym
arke
tsin
vest
orsw
ork
new
finan
cial fu
nd
society
finan
ce
question
sustainable
view
trend
regulation
access
making
team system
busi
ness
acro
ss
glob
alch
alle
nges
leve
lpr
oces
sin
vest
ing
inte
rest
ing
education
econ
omy
man
y
trying
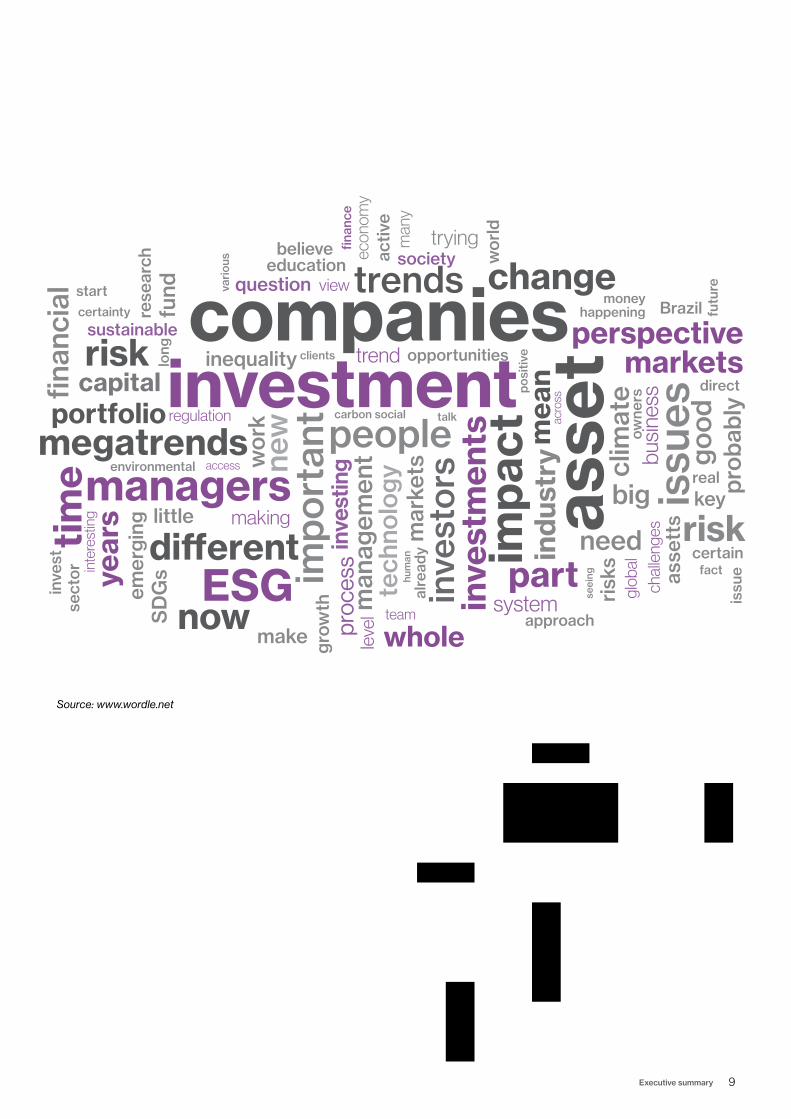
Source: www.wordle.net
10 willistowerswatson.com
Technological Advances
Environmental Challenges
Globalisation and Connectivity
North AmericaLatin America
Small asset owners
U.K.
Large asset owners
Western Europe
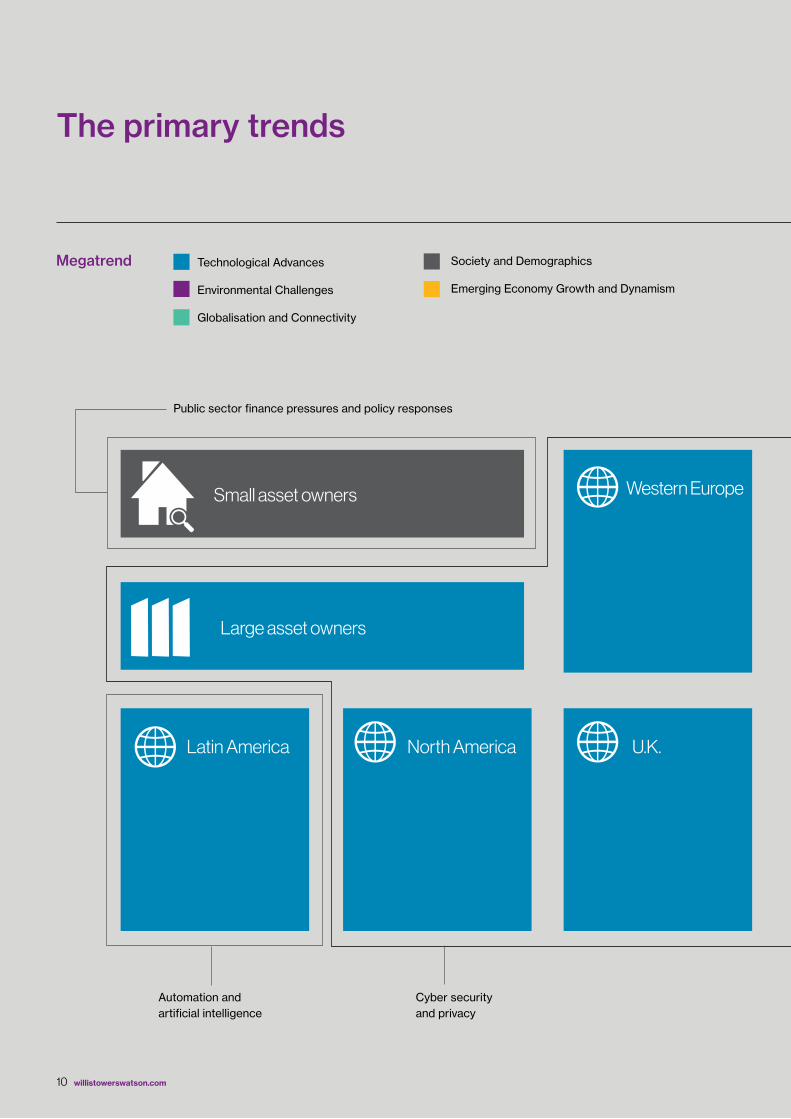
The primary trends
Megatrend Society and Demographics
Emerging Economy Growth and Dynamism
Public sector finance pressures and policy responses
Automation and artificial intelligence
Cyber security and privacy
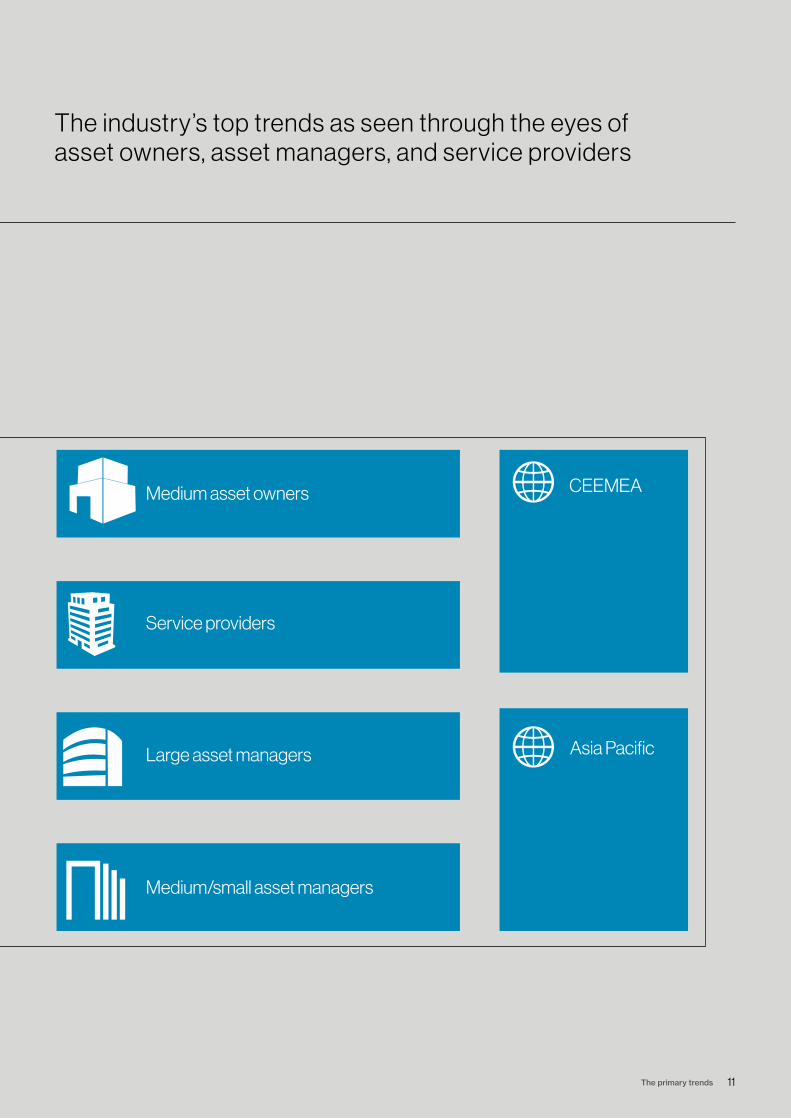
11 The primary trends
CEEMEA
Asia Pacific
Service providers
Large asset managers
Medium/small asset managers
Medium asset owners
The industry’s top trends as seen through the eyes of asset owners, asset managers, and service providers

12 willistowerswatson.com
Technological Advances
Section one
Data matters. Microsoft’s former head of research and strategy, Craig Mundie, said data is “becoming the new raw material of business … almost on a par with capital and labour.”
13 Section one - Technological advances
9
10
11
12
13
14
15
16
Cybersecurity and privacy
Digitisation and Internet of Things
Automation and artificial intelligence
New Fintech Biotechnology and personalised medicine
Com
posi
te t
rend
sco
re*
APAC Average
Americas EMEA
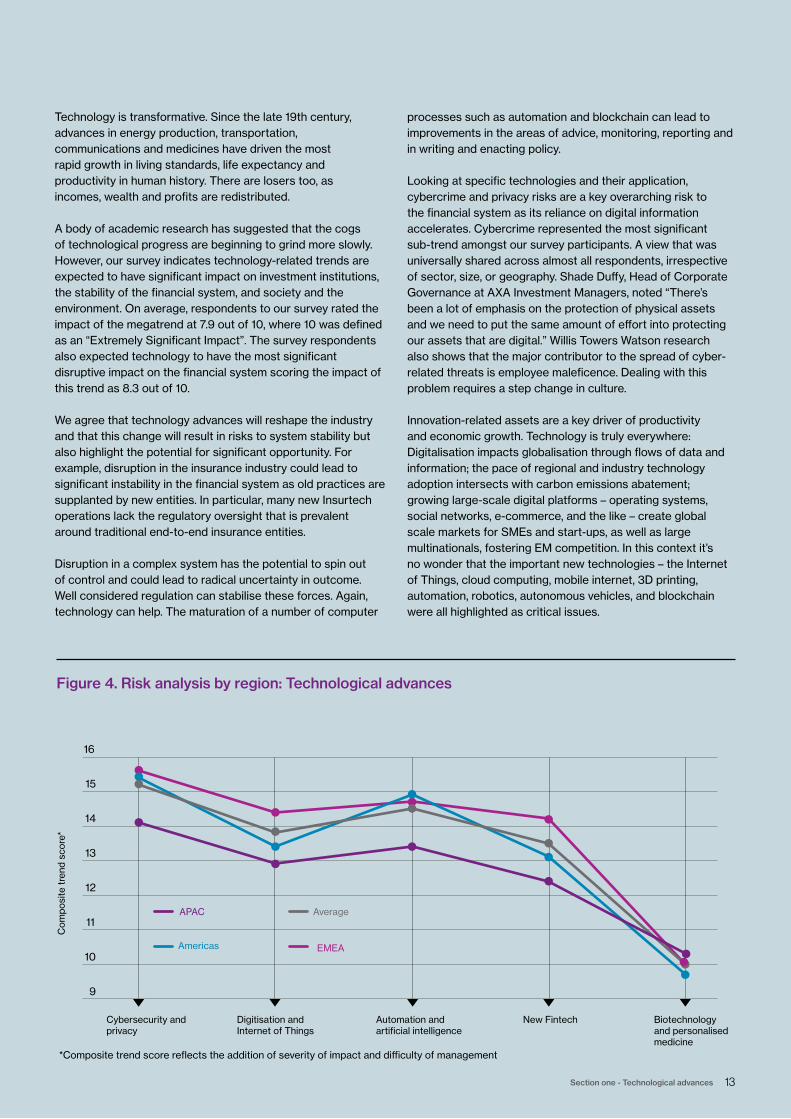
Figure 4. Risk analysis by region: Technological advances
*Composite trend score reflects the addition of severity of impact and difficulty of management
Technology is transformative. Since the late 19th century, advances in energy production, transportation, communications and medicines have driven the most rapid growth in living standards, life expectancy and productivity in human history. There are losers too, as incomes, wealth and profits are redistributed.
A body of academic research has suggested that the cogs of technological progress are beginning to grind more slowly. However, our survey indicates technology-related trends are expected to have significant impact on investment institutions, the stability of the financial system, and society and the environment. On average, respondents to our survey rated the impact of the megatrend at 7.9 out of 10, where 10 was defined as an “Extremely Significant Impact”. The survey respondents also expected technology to have the most significant disruptive impact on the financial system scoring the impact of this trend as 8.3 out of 10.
We agree that technology advances will reshape the industry and that this change will result in risks to system stability but also highlight the potential for significant opportunity. For example, disruption in the insurance industry could lead to significant instability in the financial system as old practices are supplanted by new entities. In particular, many new Insurtech operations lack the regulatory oversight that is prevalent around traditional end-to-end insurance entities.
Disruption in a complex system has the potential to spin out of control and could lead to radical uncertainty in outcome. Well considered regulation can stabilise these forces. Again, technology can help. The maturation of a number of computer
processes such as automation and blockchain can lead to improvements in the areas of advice, monitoring, reporting and in writing and enacting policy.
Looking at specific technologies and their application, cybercrime and privacy risks are a key overarching risk to the financial system as its reliance on digital information accelerates. Cybercrime represented the most significant sub-trend amongst our survey participants. A view that was universally shared across almost all respondents, irrespective of sector, size, or geography. Shade Duffy, Head of Corporate Governance at AXA Investment Managers, noted “There’s been a lot of emphasis on the protection of physical assets and we need to put the same amount of effort into protecting our assets that are digital.” Willis Towers Watson research also shows that the major contributor to the spread of cyber-related threats is employee maleficence. Dealing with this problem requires a step change in culture.
Innovation-related assets are a key driver of productivity and economic growth. Technology is truly everywhere: Digitalisation impacts globalisation through flows of data and information; the pace of regional and industry technology adoption intersects with carbon emissions abatement; growing large-scale digital platforms – operating systems, social networks, e-commerce, and the like – create global scale markets for SMEs and start-ups, as well as large multinationals, fostering EM competition. In this context it’s no wonder that the important new technologies – the Internet of Things, cloud computing, mobile internet, 3D printing, automation, robotics, autonomous vehicles, and blockchain were all highlighted as critical issues.
14 willistowerswatson.com
Analysis
We view technology both in terms of potential business transformation and capacity to disrupt. Technology and new partnerships will enable organisations to bypass traditional value chains, thereby redistributing profit pools and impacting societal value. We cover these issues extensively under globalisation, environmental challenges and emerging economies.
Here, and in the remainder of section one, we focus on the impacts of physical technologies on the financial system and their potential to transform the investment value chain via:
� Customer engagement: clearer, more frequent reporting and communication;
� Distribution: customer data mining; new technology-driven sales channels;
� Global infrastructure: managers applying standardised processes across all regions;
� Compliance and tax reporting: automated to handle regional specifics;
� Information-sharing and integration: across the investment process and use of data to refine portfolio analytics and investment models.
Fintechs have materially changed the basis of competition in financial services, but have not yet materially changed the competitive landscape. Uberisation of financial services
started some time ago, with technology moving beyond disruption to create sustainable pockets of innovative financial services, e.g., P2P lending and crowdfunding sites. Challenger banks have established themselves as viable alternatives – unburdened by legacy IT systems, they use technology to provide a distinctive and innovative approach to customers. Other challenger banks adopt a different approach by focussing on underserved sectors, such as the ‘buy-to-let’ market or SMEs. We will soon see the emergence of internet-based challengers.
Blockchain facilitates secure decentralised transactions, reduces fraud, increases transparency and efficiency in multi-party transactions. Blockchain real world applications also span a cross section of markets and industries, including travel, energy, real estate, as well as finance.
The pace and scope of automation in the financial system is a function of economic, social and technological factors. The arrival of new technologies, such as artificial intelligence, will also mean major shifts in organisations workforces as the definition of ‘talent’ evolves.
As financial institutions seek to increase the amount and variety of data they collect, ownership and control of data will become a key issue for all stakeholders. Attributing the costs and effectiveness of cyber-security and privacy measures within organisations and its impact on the pricing of capital will be an important change over the next five years.
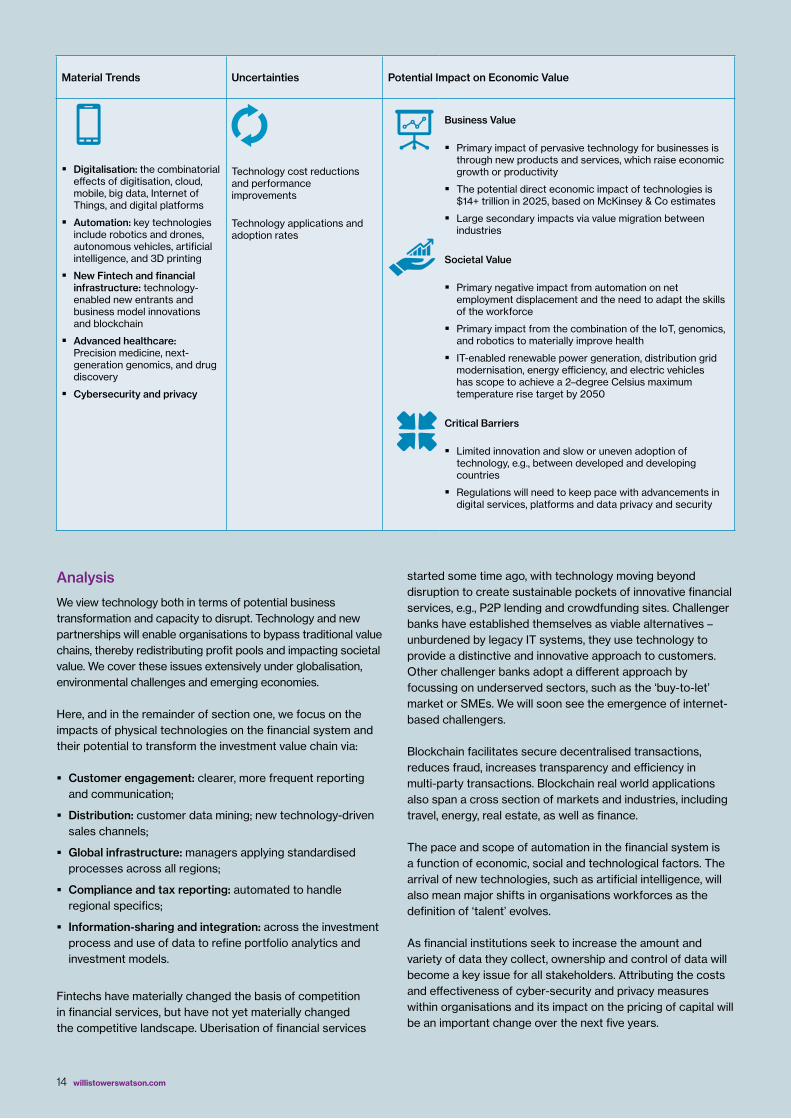
Material Trends Uncertainties Potential Impact on Economic Value
� Digitalisation: the combinatorial effects of digitisation, cloud, mobile, big data, Internet of Things, and digital platforms
� Automation: key technologies include robotics and drones, autonomous vehicles, artificial intelligence, and 3D printing
� New Fintech and financial infrastructure: technology-enabled new entrants and business model innovations and blockchain
� Advanced healthcare: Precision medicine, next-generation genomics, and drug discovery
� Cybersecurity and privacy
Technology cost reductions and performance improvements
Technology applications and adoption rates
Business Value
� Primary impact of pervasive technology for businesses is through new products and services, which raise economic growth or productivity
� The potential direct economic impact of technologies is $14+ trillion in 2025, based on McKinsey & Co estimates
� Large secondary impacts via value migration between industries
Societal Value
� Primary negative impact from automation on net employment displacement and the need to adapt the skills of the workforce
� Primary impact from the combination of the IoT, genomics, and robotics to materially improve health
� IT-enabled renewable power generation, distribution grid modernisation, energy efficiency, and electric vehicles has scope to achieve a 2–degree Celsius maximum temperature rise target by 2050
Critical Barriers
� Limited innovation and slow or uneven adoption of technology, e.g., between developed and developing countries
� Regulations will need to keep pace with advancements in digital services, platforms and data privacy and security
15 Section one - Technological advances
177 Composite trend scoreRanking
Small asset owner
Small asset owner
Small asset owner
Small asset owner
Service providers
Small asset manager
Large asset owner
Large asset owner
Large asset owner
Large asset owner
1.
Cyber security and privacy
2.
Digitisation and Internet of Things
3.
Automation and artificial intelligence
4.
New Fintech
5.
Biotechnology and personalised medicine
Sector with the lowest score Sector with the highest score
Average composite trend score
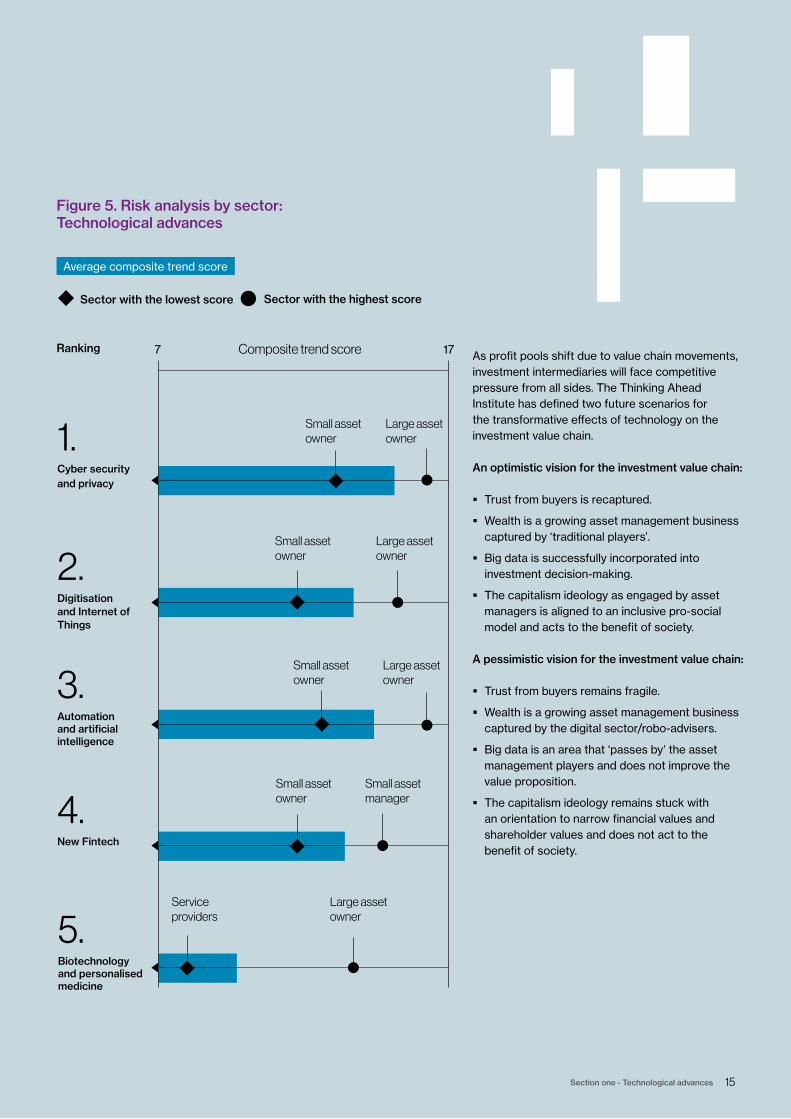
Figure 5. Risk analysis by sector: Technological advances
As profit pools shift due to value chain movements, investment intermediaries will face competitive pressure from all sides. The Thinking Ahead Institute has defined two future scenarios for the transformative effects of technology on the investment value chain.
An optimistic vision for the investment value chain:
� Trust from buyers is recaptured.
� Wealth is a growing asset management business captured by ‘traditional players’.
� Big data is successfully incorporated into investment decision-making.
� The capitalism ideology as engaged by asset managers is aligned to an inclusive pro-social model and acts to the benefit of society.
A pessimistic vision for the investment value chain:
� Trust from buyers remains fragile.
� Wealth is a growing asset management business captured by the digital sector/robo-advisers.
� Big data is an area that ‘passes by’ the asset management players and does not improve the value proposition.
� The capitalism ideology remains stuck with an orientation to narrow financial values and shareholder values and does not act to the benefit of society.
16 willistowerswatson.com
Technology DisruptionAn interview with Arthur Grigoryants
Interviewer: Please describe the top trends that are impacting your business/the asset management industry.AG: In terms of business, I think technology is crucial for us. That is, automation, artificial intelligence and also cybersecurity. Everyone knows that the industry is under pressure in terms of profit margins. Anyone who has a long-term view recognizes the impact that artificial intelligence and automation in general can have on addressing some of these pressures.
Interviewer: Are asset management businesses ready to deal with this type of technological change?AG: A willingness to deal with technological changes and actually being able to deal with them are different issues. Very often this is a result of businesses not being well positioned to deal with automation. Most asset management firms are structured along traditional departmental lines as opposed to having data and technology at their core. So it’s not just technological change that’s important but also, very often, organisational design that requires quite a material restructuring. I don’t see this as an incremental change, you have to look at the whole picture.
Interviewer: What about cybersecurity?AG: Cybersecurity is rather a different question. I think it’s almost the opposite side of the coin versus technological advances. You want to have access to more information. You want to be faster. You want to have live access. However, at the same time, the investment industry is built on trust, on privacy, on all these important concepts. Therefore, from our point of view, we have to manage the use of and access to data with the uncertainties and risks that greater digital freedom affords. No one is ultimately secure.
The Head of Investment Strategy at RWC Partners argues that dealing with technological change is crucial for the long-term sustainability of asset management businesses.
Interviewer: Why do you believe the asset management industry is ripe for technology disruption?AG: I think the asset management industry has been sleeping for too long and this is the result of somewhat excessive profitability. In my view, the industry was initially disrupted by the advent of passive investing. The profitability of core equity and bond products fell as a direct result. This coincided with the industry moving to greater use of hedge funds and alternatives to protect margins. However, since 2008/9 the ability of these structures to, on average, deliver returns has proved questionable, whilst the continued broader cost pressure from passives has led to conditions ripe for disruption.
Interviewer: Can you describe the type of actions a business needs to take to deal with technology-related threats or opportunities?AG: In general asset management businesses are structured in the wrong way from a technology perspective. If you were to create a Google of asset management, you wouldn’t build a company with a sales function, client management and reporting as separate business entities. So you need to look at the whole structure of your business to maximise your use of technology.
Interviewer: Are there particular business models that are better placed to deal with these changes?AG: I can see the competitive advantages of smaller companies in today’s world. One of the key points here is strategic flexibility. In an industry that seems to be changing, morphing, and drifting at a very high rate, flexibility should be valued. If you are a much bigger company, you have to play a different game; you are an oil tanker in an ocean.
17 Section one - Technological advances
Interviewer: Where is the innovation driven from and are there any barriers to this happening? AG: I think it’s a very good question. If you look at regulation, the cost of compliance increases the minimum bar for a new start-up. We have to be concerned about how difficult it is for new players to start off because normally innovation happens not just with the big players spending more on research and development but is also generated within new start-ups. The most effective way for an industry to innovate is to feel the pressure from young companies. If these new companies find it increasingly difficult to set-up that means the pace of innovation could slow down.
Interviewer: One final question, could a constraint on innovation lead to an impairment in the industry’s ability to deal with a wider set of megatrends?AG: Once again, a very good point because what we’ve seen so far is that innovations in areas such as ESG were started by a very small group of very dedicated people who had the freedom to set up new funds. They were unnoticeable for five or 10 years until they started getting into the mainstream. That’s how innovation works. You need some people with great ideas but you need to give them a relatively low barrier to jump over in order to build a competitive business. Otherwise you may not get the impetus for innovation that you need. I mean, would you expect General Motors to come up with Tesla? The answer is no. They are quite comfortable producing General Motors cars, not Teslas. Tesla has to disrupt General Motors’ business model for them to pay attention. If you don’t have the conditions to allow this the innovation may not happen.
“”
The most effective way for an industry to innovate is to feel the pressure from young companies. If these new companies find it increasingly difficult to set-up that means the pace of innovation could slow down.
18 willistowerswatson.com
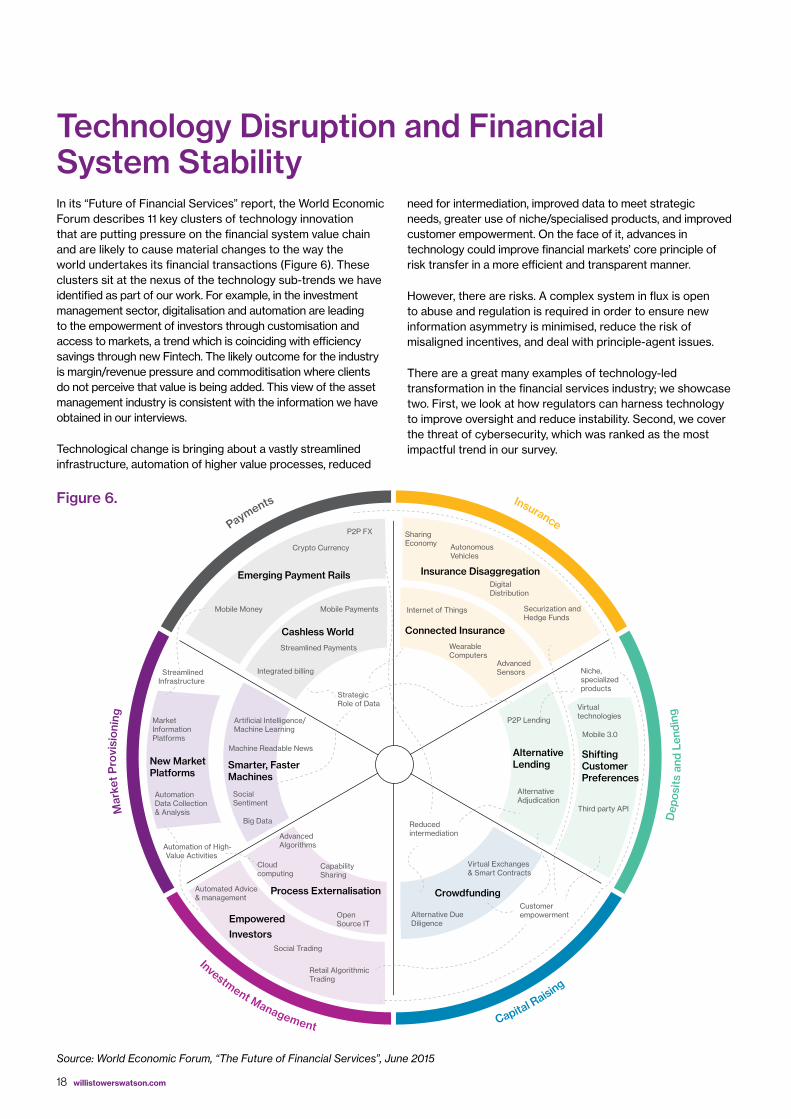
Technology Disruption and Financial System StabilityIn its “Future of Financial Services” report, the World Economic Forum describes 11 key clusters of technology innovation that are putting pressure on the financial system value chain and are likely to cause material changes to the way the world undertakes its financial transactions (Figure 6). These clusters sit at the nexus of the technology sub-trends we have identified as part of our work. For example, in the investment management sector, digitalisation and automation are leading to the empowerment of investors through customisation and access to markets, a trend which is coinciding with efficiency savings through new Fintech. The likely outcome for the industry is margin/revenue pressure and commoditisation where clients do not perceive that value is being added. This view of the asset management industry is consistent with the information we have obtained in our interviews.
Technological change is bringing about a vastly streamlined infrastructure, automation of higher value processes, reduced
Payments
Dep
osits
and
Len
ding
Capital Raising
Investment Management
Mar
ket
Pro
visi
onin
g
Insurance
Emerging Payment Rails
Cashless World
Insurance Disaggregation
Sharing Economy Autonomous
Vehicles
Digital Distribution
Securization and Hedge Funds
Internet of Things
Advanced Sensors Niche,
specialized products
Virtual technologies
Mobile 3.0
Third party API
Customer empowerment
Reduced intermediationAdvanced
Algorithms
Cloud computing
Capability Sharing
Open Source IT
Automated Advice & management
Automation of High-Value Activities
Automation Data Collection & Analysis
Market Information Platforms
Streamlined Infrastructure
Crypto Currency
Strategic Role of Data
P2P FX
Mobile Money
Integrated billing
Mobile Payments
Streamlined Payments
Artificial Intelligence/Machine Learning
Machine Readable News
Social Sentiment
Big Data
Social Trading
Retail Algorithmic Trading
Virtual Exchanges & Smart Contracts
Alternative Due Diligence
P2P Lending
Alternative Adjudication
Wearable Computers
Connected Insurance
Alternative Lending
Shifting Customer Preferences
Crowdfunding
Empowered
Investors
Process Externalisation
New Market Platforms
Smarter, Faster Machines
need for intermediation, improved data to meet strategic needs, greater use of niche/specialised products, and improved customer empowerment. On the face of it, advances in technology could improve financial markets’ core principle of risk transfer in a more efficient and transparent manner.
However, there are risks. A complex system in flux is open to abuse and regulation is required in order to ensure new information asymmetry is minimised, reduce the risk of misaligned incentives, and deal with principle-agent issues.
There are a great many examples of technology-led transformation in the financial services industry; we showcase two. First, we look at how regulators can harness technology to improve oversight and reduce instability. Second, we cover the threat of cybersecurity, which was ranked as the most impactful trend in our survey.
Figure 6.
Source: World Economic Forum, “The Future of Financial Services”, June 2015
19 Section one - Technological advances
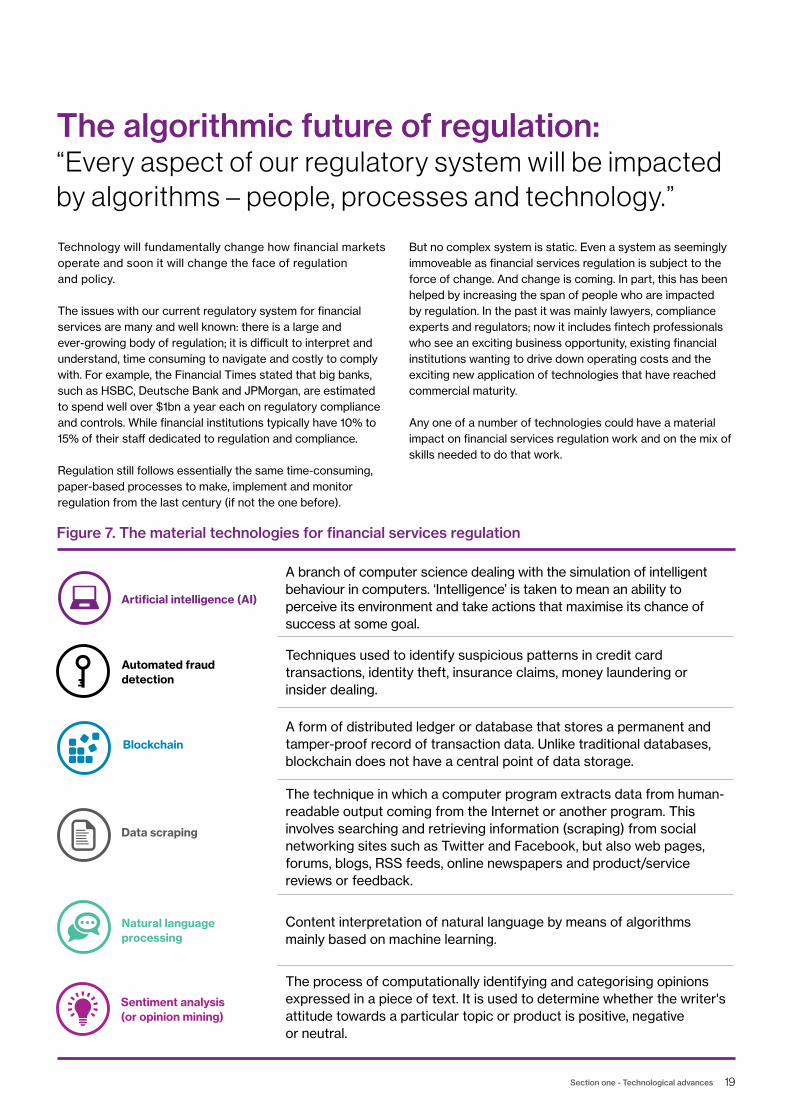
The algorithmic future of regulation:“Every aspect of our regulatory system will be impacted by algorithms – people, processes and technology.”
A branch of computer science dealing with the simulation of intelligent behaviour in computers. ‘Intelligence’ is taken to mean an ability to perceive its environment and take actions that maximise its chance of success at some goal.
Techniques used to identify suspicious patterns in credit card transactions, identity theft, insurance claims, money laundering or insider dealing.
A form of distributed ledger or database that stores a permanent and tamper-proof record of transaction data. Unlike traditional databases, blockchain does not have a central point of data storage.
The technique in which a computer program extracts data from human-readable output coming from the Internet or another program. This involves searching and retrieving information (scraping) from social networking sites such as Twitter and Facebook, but also web pages, forums, blogs, RSS feeds, online newspapers and product/service reviews or feedback.
Content interpretation of natural language by means of algorithms mainly based on machine learning.
The process of computationally identifying and categorising opinions expressed in a piece of text. It is used to determine whether the writer's attitude towards a particular topic or product is positive, negative or neutral.
Artificial intelligence (AI)
Automated fraud detection
Blockchain
Data scraping
Natural language processing
Sentiment analysis (or opinion mining)
Technology will fundamentally change how financial markets operate and soon it will change the face of regulation and policy.
The issues with our current regulatory system for financial services are many and well known: there is a large and ever-growing body of regulation; it is difficult to interpret and understand, time consuming to navigate and costly to comply with. For example, the Financial Times stated that big banks, such as HSBC, Deutsche Bank and JPMorgan, are estimated to spend well over $1bn a year each on regulatory compliance and controls. While financial institutions typically have 10% to 15% of their staff dedicated to regulation and compliance.
Regulation still follows essentially the same time-consuming, paper-based processes to make, implement and monitor regulation from the last century (if not the one before).
But no complex system is static. Even a system as seemingly immoveable as financial services regulation is subject to the force of change. And change is coming. In part, this has been helped by increasing the span of people who are impacted by regulation. In the past it was mainly lawyers, compliance experts and regulators; now it includes fintech professionals who see an exciting business opportunity, existing financial institutions wanting to drive down operating costs and the exciting new application of technologies that have reached commercial maturity.
Any one of a number of technologies could have a material impact on financial services regulation work and on the mix of skills needed to do that work.
Figure 7. The material technologies for financial services regulation

20 willistowerswatson.com
We highlight four key areas in regulation that are likely to be disrupted by innovative technology.
1. Automated advice: Artificial intelligence techniques can be used to train computers to provide advice to end users, speeding-up decisions and/or partly replacing the need for expensive legal and compliance services. AI can also be used in registration processes and authorisation by regulators. For example, Reuters reported that Credit Suisse has deployed 20 robots, some of which are helping employees answer basic compliance questions. The bank estimates that the technology may help to reduce the number of calls coming into the bank’s compliance call centre by as much as 50%.
2. Regulatory monitoring: Regulators will be able to ease the challenge of monitoring the actions of vast arrays of firms by using natural language processing to monitor online data and social media. Firms such as Corlytics are already using these technologies to interrogate enforcement and other regulatory data, generating predictive power by picking out emerging risks and trends months before they crystallise in the market.
3. Regulatory reporting: Providing data to regulators is a costly and complex activity. Research from the American Action Forum suggests U.S. firms have spent US$24bn in complying with the reporting requirements of the Dodd-Frank Reform and Consumer Protection Act. Online communication through portals and distributed ledger technology could unlock reporting from a ‘push’ to an instantaneous ‘pull’ process, in much the same way that an analyst downloads data today.
4. Regulatory policy: Smart contract technology can aid the implementation of new policy, while advanced computational modelling can reduce the risk of unintended consequences before new regulations are deployed.
Overall, this package of measures has the potential to provide regulators with the tools to understand, monitor and administer financial service activities from a more advantageous position than today. At its best an algorithmic-based regulatory system would be productive and efficient, reducing the burden of compliance and removing the incentive to game policies.
This commentary has been adapted from an original report by Philip Treleaven, Professor and Director of the U.K. Financial Computing Centre at University College London, in The Future of Financial Services, Willis Towers Watson.
21 Section one - Technological advances
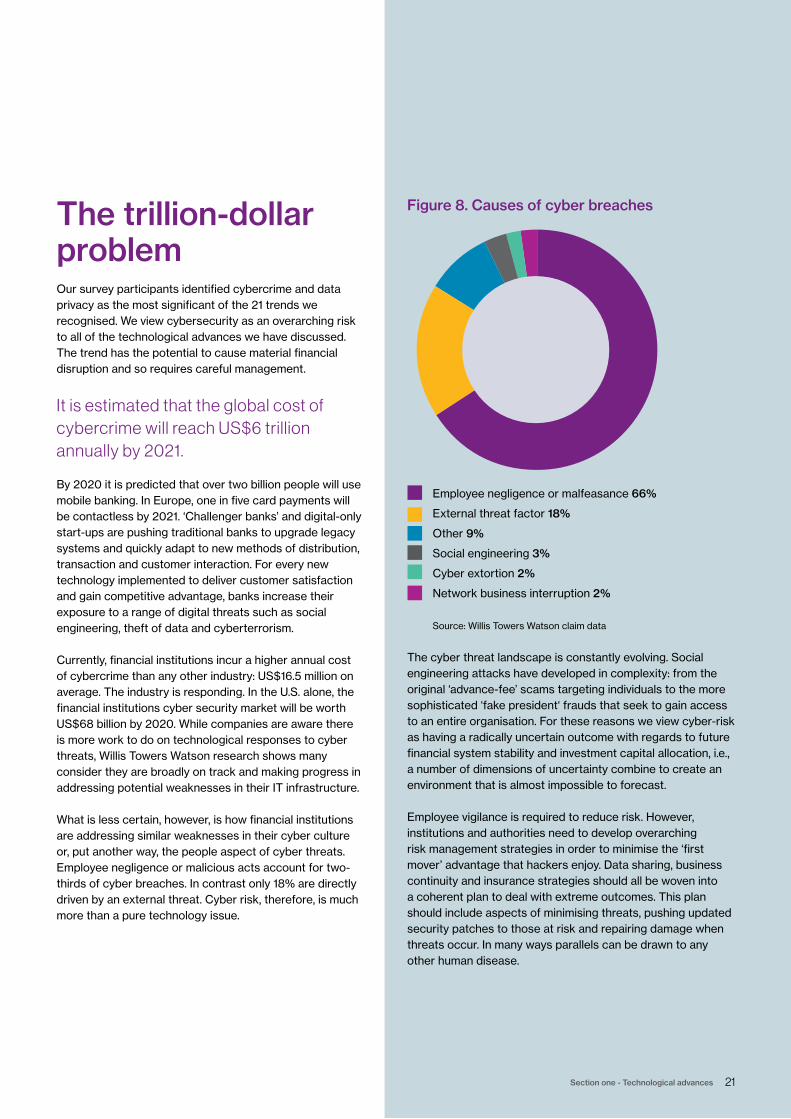
The trillion-dollar problem Our survey participants identified cybercrime and data privacy as the most significant of the 21 trends we recognised. We view cybersecurity as an overarching risk to all of the technological advances we have discussed. The trend has the potential to cause material financial disruption and so requires careful management.
It is estimated that the global cost of cybercrime will reach US$6 trillion annually by 2021.
By 2020 it is predicted that over two billion people will use mobile banking. In Europe, one in five card payments will be contactless by 2021. ‘Challenger banks’ and digital-only start-ups are pushing traditional banks to upgrade legacy systems and quickly adapt to new methods of distribution, transaction and customer interaction. For every new technology implemented to deliver customer satisfaction and gain competitive advantage, banks increase their exposure to a range of digital threats such as social engineering, theft of data and cyberterrorism.
Currently, financial institutions incur a higher annual cost of cybercrime than any other industry: US$16.5 million on average. The industry is responding. In the U.S. alone, the financial institutions cyber security market will be worth US$68 billion by 2020. While companies are aware there is more work to do on technological responses to cyber threats, Willis Towers Watson research shows many consider they are broadly on track and making progress in addressing potential weaknesses in their IT infrastructure.
What is less certain, however, is how financial institutions are addressing similar weaknesses in their cyber culture or, put another way, the people aspect of cyber threats. Employee negligence or malicious acts account for two-thirds of cyber breaches. In contrast only 18% are directly driven by an external threat. Cyber risk, therefore, is much more than a pure technology issue.
The cyber threat landscape is constantly evolving. Social engineering attacks have developed in complexity: from the original ‘advance-fee’ scams targeting individuals to the more sophisticated ‘fake president‘ frauds that seek to gain access to an entire organisation. For these reasons we view cyber-risk as having a radically uncertain outcome with regards to future financial system stability and investment capital allocation, i.e., a number of dimensions of uncertainty combine to create an environment that is almost impossible to forecast.
Employee vigilance is required to reduce risk. However, institutions and authorities need to develop overarching risk management strategies in order to minimise the ‘first mover’ advantage that hackers enjoy. Data sharing, business continuity and insurance strategies should all be woven into a coherent plan to deal with extreme outcomes. This plan should include aspects of minimising threats, pushing updated security patches to those at risk and repairing damage when threats occur. In many ways parallels can be drawn to any other human disease.
Figure 8. Causes of cyber breaches
Employee negligence or malfeasance 66%
External threat factor 18%
Other 9%
Social engineering 3%
Cyber extortion 2%
Network business interruption 2% Source: Willis Towers Watson claim data
22 willistowerswatson.com
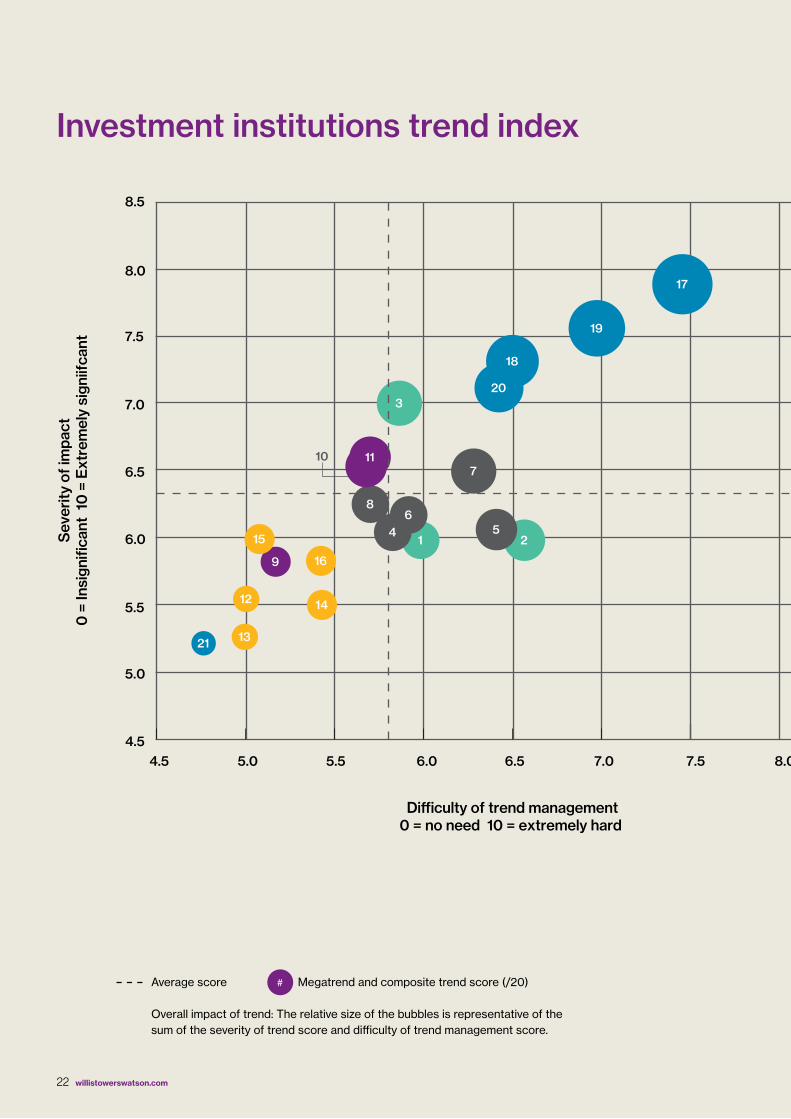
Investment institutions trend index
6.0
8.5
8.0
7.5
7.0
6.5
5.5
5.0
4.54.5 5.0 5.5 6.0 6.5 7.0 8.5 9.08.07.5
Di�culty of trend management0 = no need 10 = extremely hard
Sev
erity
of i
mpa
ct0
= In
sign
ifica
nt 1
0 =
Ext
rem
ely
sign
iifca
nt
1 2
3
4 56
10.5 11 11.5 12 12.5 13 13.5 14 14.5 15 15.5
7
8
10
9
1011
12
13
14
15
16
17
18
19
20
21
Average score Megatrend and composite trend score (/20)
Overall impact of trend: The relative size of the bubbles is representative of the sum of the severity of trend score and difficulty of trend management score.
#
23 Investment institutions trend index
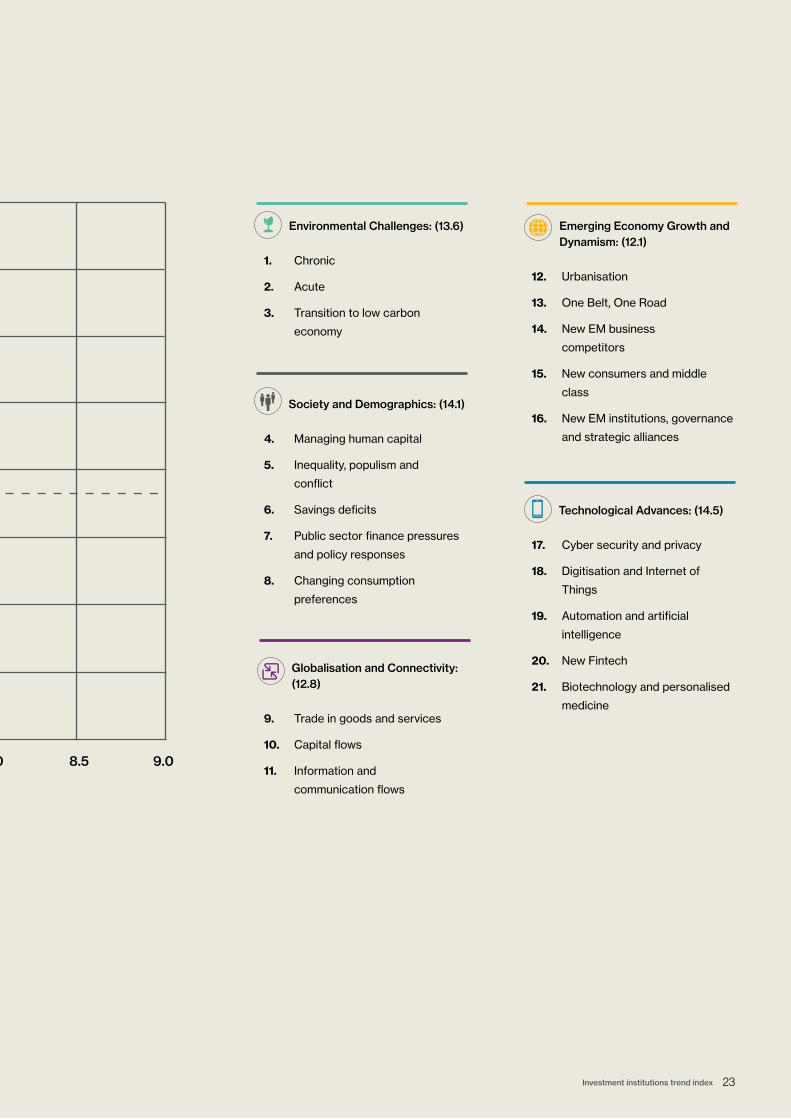
Environmental Challenges: (13.6)
1. Chronic
2. Acute
3. Transition to low carbon
economy
6.0
8.5
8.0
7.5
7.0
6.5
5.5
5.0
4.54.5 5.0 5.5 6.0 6.5 7.0 8.5 9.08.07.5
Di�culty of trend management0 = no need 10 = extremely hard
Sev
erity
of i
mpa
ct0
= In
sign
ifica
nt 1
0 =
Ext
rem
ely
sign
iifca
nt
1 2
3
4 56
10.5 11 11.5 12 12.5 13 13.5 14 14.5 15 15.5
7
8
10
9
1011
12
13
14
15
16
17
18
19
20
21
Society and Demographics: (14.1)
4. Managing human capital
5. Inequality, populism and
conflict
6. Savings deficits
7. Public sector finance pressures
and policy responses
8. Changing consumption
preferences
Globalisation and Connectivity: (12.8)
9. Trade in goods and services
10. Capital flows
11. Information and
communication flows
Emerging Economy Growth and Dynamism: (12.1)
12. Urbanisation
13. One Belt, One Road
14. New EM business
competitors
15. New consumers and middle
class
16. New EM institutions, governance
and strategic alliances
Technological Advances: (14.5)
17. Cyber security and privacy
18. Digitisation and Internet of
Things
19. Automation and artificial
intelligence
20. New Fintech
21. Biotechnology and personalised
medicine
24 willistowerswatson.com
Environmental Challenges
Section two
“ … climate change is a tragedy of the horizon which imposes a cost on future generations that the current one has no direct incentive to fix.” Mark Carney, Governor of the Bank of England
25 Section two - Environmental Challenges
Environmental challenges have always been important. For example, natural calamities like flooding and crop failures contributed to the downfall of the Chinese Ming dynasty. Environmental and climate change concerns cover a number of issues: acute environmental events such as hurricanes and typhoons – data from the National Oceanic and Atmospheric Administration shows that the prevalence of ‘billion-dollar’ insurance losses increased by 3.5x from the 80’s to the last decade; the chronic impact of global warming – heat stress, water stress, extreme rainfall, sea-level rise, crop yields, and displacement of communities; and a potential large scale transition to a low carbon economy and the broader issues of waste efficiency and improved circular economies.
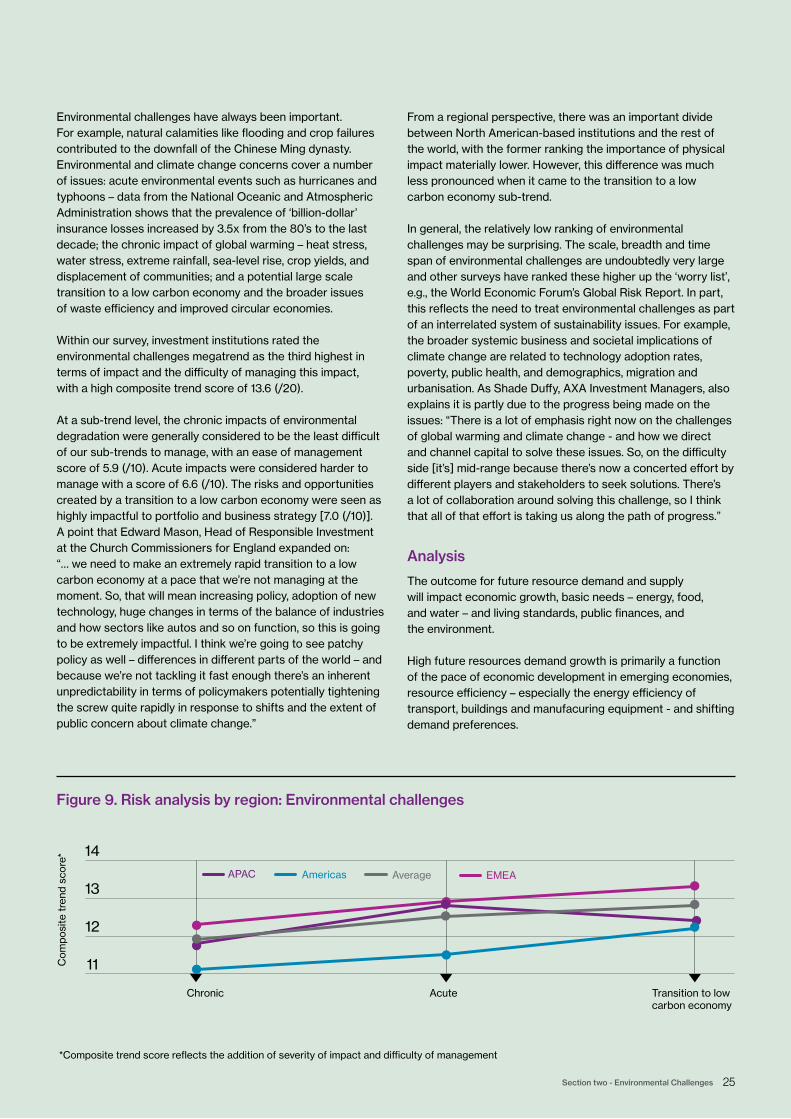
Within our survey, investment institutions rated the environmental challenges megatrend as the third highest in terms of impact and the difficulty of managing this impact, with a high composite trend score of 13.6 (/20).
At a sub-trend level, the chronic impacts of environmental degradation were generally considered to be the least difficult of our sub-trends to manage, with an ease of management score of 5.9 (/10). Acute impacts were considered harder to manage with a score of 6.6 (/10). The risks and opportunities created by a transition to a low carbon economy were seen as highly impactful to portfolio and business strategy [7.0 (/10)]. A point that Edward Mason, Head of Responsible Investment at the Church Commissioners for England expanded on: “… we need to make an extremely rapid transition to a low carbon economy at a pace that we’re not managing at the moment. So, that will mean increasing policy, adoption of new technology, huge changes in terms of the balance of industries and how sectors like autos and so on function, so this is going to be extremely impactful. I think we’re going to see patchy policy as well – differences in different parts of the world – and because we’re not tackling it fast enough there’s an inherent unpredictability in terms of policymakers potentially tightening the screw quite rapidly in response to shifts and the extent of public concern about climate change.”
From a regional perspective, there was an important divide between North American-based institutions and the rest of the world, with the former ranking the importance of physical impact materially lower. However, this difference was much less pronounced when it came to the transition to a low carbon economy sub-trend.
In general, the relatively low ranking of environmental challenges may be surprising. The scale, breadth and time span of environmental challenges are undoubtedly very large and other surveys have ranked these higher up the ‘worry list’, e.g., the World Economic Forum’s Global Risk Report. In part, this reflects the need to treat environmental challenges as part of an interrelated system of sustainability issues. For example, the broader systemic business and societal implications of climate change are related to technology adoption rates, poverty, public health, and demographics, migration and urbanisation. As Shade Duffy, AXA Investment Managers, also explains it is partly due to the progress being made on the issues: “There is a lot of emphasis right now on the challenges of global warming and climate change - and how we direct and channel capital to solve these issues. So, on the difficulty side [it’s] mid-range because there’s now a concerted effort by different players and stakeholders to seek solutions. There’s a lot of collaboration around solving this challenge, so I think that all of that effort is taking us along the path of progress.”
Analysis
The outcome for future resource demand and supply will impact economic growth, basic needs – energy, food, and water – and living standards, public finances, and the environment.
High future resources demand growth is primarily a function of the pace of economic development in emerging economies, resource efficiency – especially the energy efficiency of transport, buildings and manufacuring equipment - and shifting demand preferences.
11
12
13
14
Chronic Acute Transition to low carbon economy
Com
posi
te t
rend
sco
re*
APAC AverageAmericas EMEA
Figure 9. Risk analysis by region: Environmental challenges
*Composite trend score reflects the addition of severity of impact and difficulty of management
26 willistowerswatson.com
New supply will be largely detemined by new sources of supply and extraction, resource productivity improvements, and low-carbon energy supply and carbon capture and storage.
Increased natural resources supply and productivity improvements can most likely meet long-term demand. The relative balance between the two can be effectively captured through scenarios: a business-as-usual under known policy scenario is consisent with a large-scale future energy, water, land, and metals supply response; a 2 degrees Celsius scenario is consistent with maximum productivity gains and a large-scale shift to low carbon energy supply.
Physical risks
Under a business-as-usual scenario rising emissions and the impact of rising temperature will affect the frequency and severity of weather events, sea levels, water scarcity, desertification, deforestation, and more generally the loss of biodiversity and habitats.
From an investment capital allocation perspective the implications over 10 years are moderate but scale rapidly over time.
Rising temperatures impact country growth primarily via lower productivity. Over 10 years this could lower global GDP growth by c. 0.1% pa from lower emerging economy growth. The impact on global revenue and profit pools is small c. 0.1%, although the impact is larger if investor expectations for long-
term earnings growth rates are reduced. Industry impacts are more important with Materials, Energy and Consumer Staples particularly at risk to water scarcity, principally due to their high water usage and the location of their activities. At the sub-industry level, Agriculture, Textiles, Copper, Aluminium, Oil E&P, and Water Utilities have high exposure.
We also assess losses due to capital destruction, production and supply chain interruptions, increased operating and maintenance costs, and increased financing and insurance costs from acute weather events. 2015 world output is estimated to be c. 0.2% lower than it would otherwise have been, due to warming that has already taken place. By 2030, the total expected loss is expected to increase to around 0.45%. While that is not highly material, significant risk is created in the investment value chain through current climate-related physical risk being generally unmeasured and unmanaged – reinsurance risk tools provide a solution.
The most material implications of a business-as-usual scenario are the multiple negative impacts on the UN’s Sustainable Development Goals, from Climate Action, to Zero Hunger and Life on Land, through to Clean Water and Sanitation. For example, the expansion of water and land supply is very large. There is a magnified long-term temperature impact on low-income countries, e.g., sub-saharan Africa. Lower crop yields are likely as agricultural output declines in hotter years. And a higher impact on emerging economies from acute events due to their higher proportion of uninsured losses.
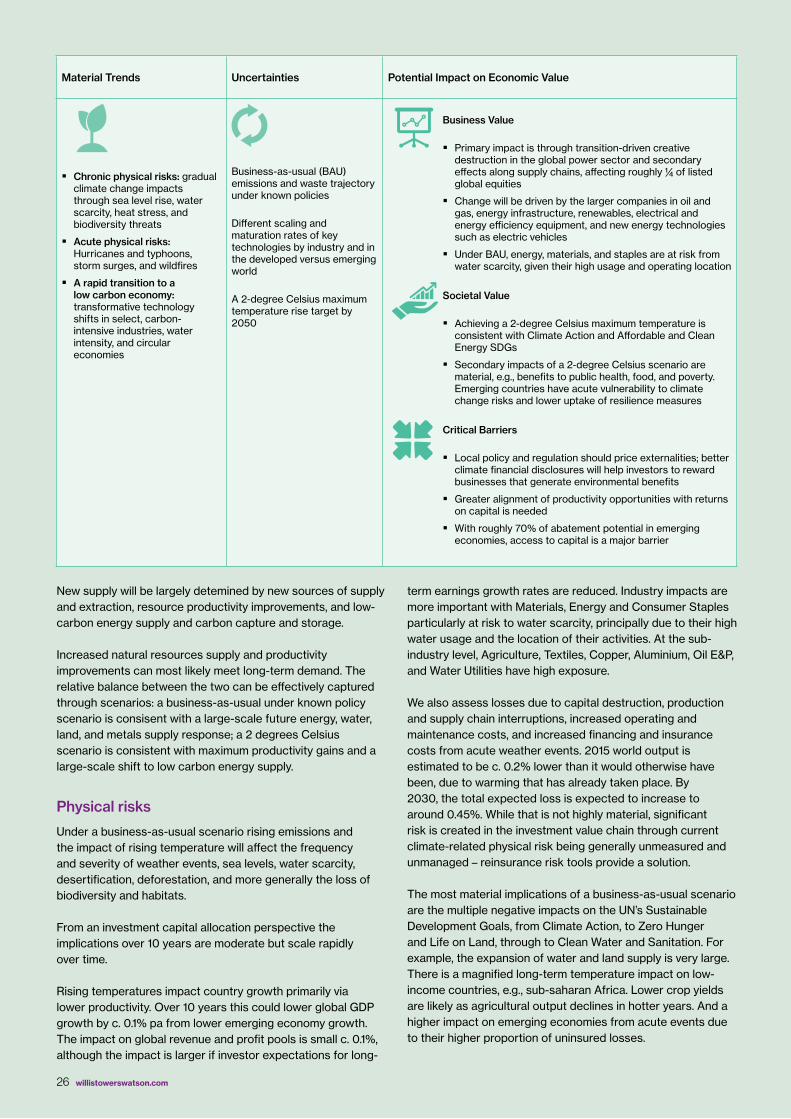
Material Trends Uncertainties Potential Impact on Economic Value
� Chronic physical risks: gradual climate change impacts through sea level rise, water scarcity, heat stress, and biodiversity threats
� Acute physical risks: Hurricanes and typhoons, storm surges, and wildfires
� A rapid transition to a low carbon economy: transformative technology shifts in select, carbon-intensive industries, water intensity, and circular economies
Business-as-usual (BAU) emissions and waste trajectory under known policies
Different scaling and maturation rates of key technologies by industry and in the developed versus emerging world
A 2-degree Celsius maximum temperature rise target by 2050
Business Value
� Primary impact is through transition-driven creative destruction in the global power sector and secondary effects along supply chains, affecting roughly ¼ of listed global equities
� Change will be driven by the larger companies in oil and gas, energy infrastructure, renewables, electrical and energy efficiency equipment, and new energy technologies such as electric vehicles
� Under BAU, energy, materials, and staples are at risk from water scarcity, given their high usage and operating location
Societal Value
� Achieving a 2-degree Celsius maximum temperature is consistent with Climate Action and Affordable and Clean Energy SDGs
� Secondary impacts of a 2-degree Celsius scenario are material, e.g., benefits to public health, food, and poverty. Emerging countries have acute vulnerability to climate change risks and lower uptake of resilience measures
Critical Barriers
� Local policy and regulation should price externalities; better climate financial disclosures will help investors to reward businesses that generate environmental benefits
� Greater alignment of productivity opportunities with returns on capital is needed
� With roughly 70% of abatement potential in emerging economies, access to capital is a major barrier
27 Section two - Environmental Challenges
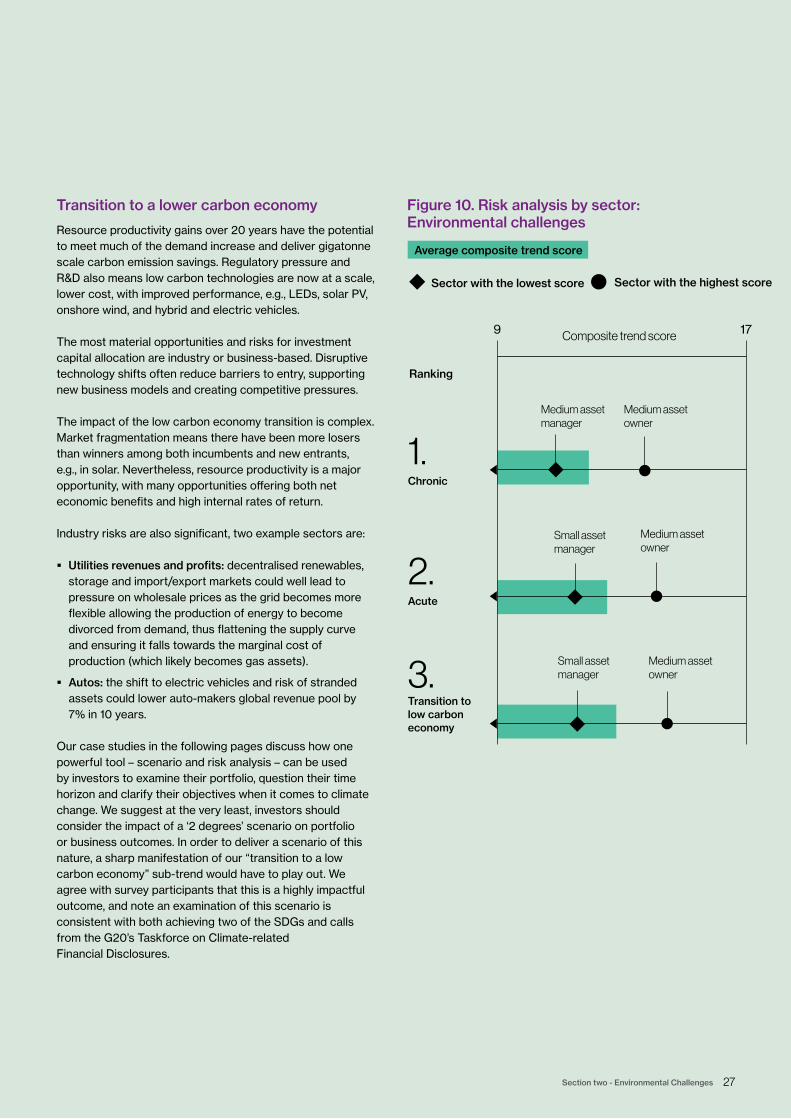
179 Composite trend score
Medium asset manager
Small asset manager
Small asset manager
Medium asset owner
Medium asset owner
Medium asset owner
1.
Chronic
2.
Acute
3.
Transition to low carbon economy
Sector with the lowest score Sector with the highest score
Average composite trend score
Ranking
Figure 10. Risk analysis by sector: Environmental challenges
Transition to a lower carbon economy
Resource productivity gains over 20 years have the potential to meet much of the demand increase and deliver gigatonne scale carbon emission savings. Regulatory pressure and R&D also means low carbon technologies are now at a scale, lower cost, with improved performance, e.g., LEDs, solar PV, onshore wind, and hybrid and electric vehicles.
The most material opportunities and risks for investment capital allocation are industry or business-based. Disruptive technology shifts often reduce barriers to entry, supporting new business models and creating competitive pressures.
The impact of the low carbon economy transition is complex. Market fragmentation means there have been more losers than winners among both incumbents and new entrants, e.g., in solar. Nevertheless, resource productivity is a major opportunity, with many opportunities offering both net economic benefits and high internal rates of return.
Industry risks are also significant, two example sectors are:
� Utilities revenues and profits: decentralised renewables, storage and import/export markets could well lead to pressure on wholesale prices as the grid becomes more flexible allowing the production of energy to become divorced from demand, thus flattening the supply curve and ensuring it falls towards the marginal cost of production (which likely becomes gas assets).
� Autos: the shift to electric vehicles and risk of stranded assets could lower auto-makers global revenue pool by 7% in 10 years.
Our case studies in the following pages discuss how one powerful tool – scenario and risk analysis – can be used by investors to examine their portfolio, question their time horizon and clarify their objectives when it comes to climate change. We suggest at the very least, investors should consider the impact of a ‘2 degrees’ scenario on portfolio or business outcomes. In order to deliver a scenario of this nature, a sharp manifestation of our “transition to a low carbon economy” sub-trend would have to play out. We agree with survey participants that this is a highly impactful outcome, and note an examination of this scenario is consistent with both achieving two of the SDGs and calls from the G20’s Taskforce on Climate-related Financial Disclosures.
28 willistowerswatson.com
Using scenario analysis to build better, climate-aware portfolios and move towards the SDGs
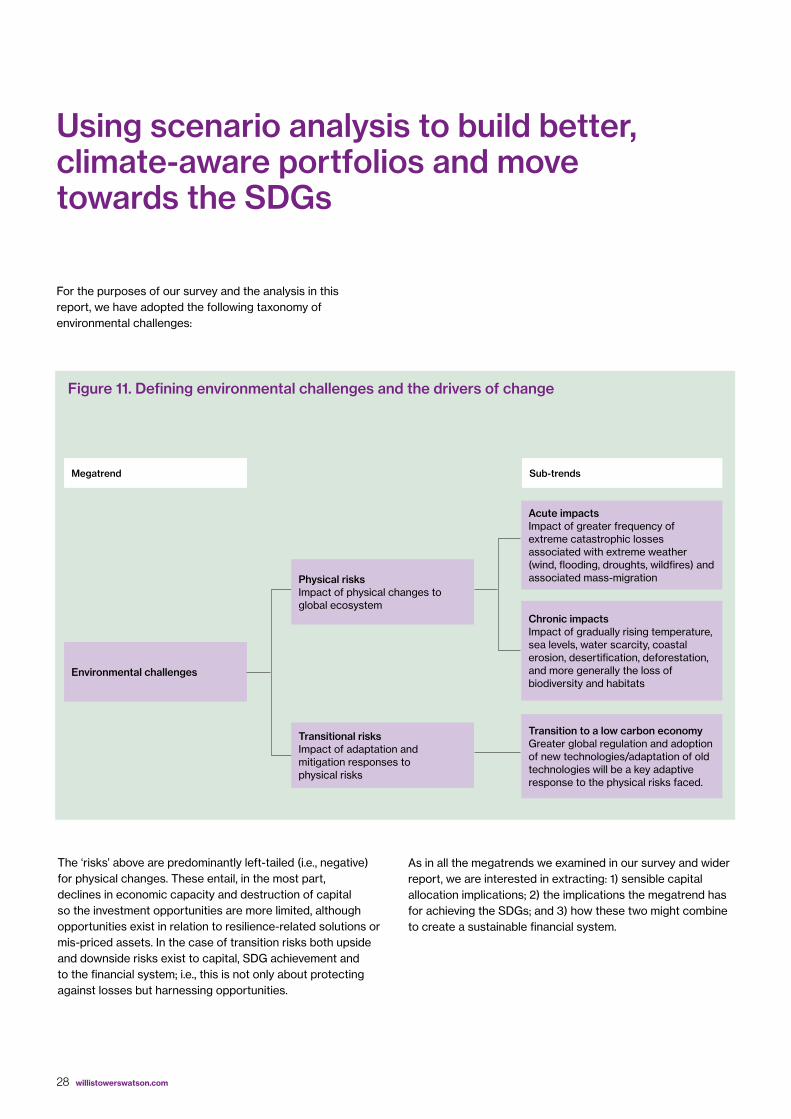
Environmental challenges
Megatrend Sub-trends
Acute impacts Impact of greater frequency of extreme catastrophic losses associated with extreme weather (wind, flooding, droughts, wildfires) and associated mass-migration
Chronic impacts Impact of gradually rising temperature, sea levels, water scarcity, coastal erosion, desertification, deforestation, and more generally the loss of biodiversity and habitats
Transition to a low carbon economy Greater global regulation and adoption of new technologies/adaptation of old technologies will be a key adaptive response to the physical risks faced.
The ‘risks’ above are predominantly left-tailed (i.e., negative) for physical changes. These entail, in the most part, declines in economic capacity and destruction of capital so the investment opportunities are more limited, although opportunities exist in relation to resilience-related solutions or mis-priced assets. In the case of transition risks both upside and downside risks exist to capital, SDG achievement and to the financial system; i.e., this is not only about protecting against losses but harnessing opportunities.
Physical risks Impact of physical changes to global ecosystem
Transitional risks Impact of adaptation and mitigation responses to physical risks
As in all the megatrends we examined in our survey and wider report, we are interested in extracting: 1) sensible capital allocation implications; 2) the implications the megatrend has for achieving the SDGs; and 3) how these two might combine to create a sustainable financial system.
For the purposes of our survey and the analysis in this report, we have adopted the following taxonomy of environmental challenges:
Figure 11. Defining environmental challenges and the drivers of change
29 Section two - Environmental Challenges
Assessing the impact on capital allocation
How investors sensibly assess and mitigate the impact of environmental risks on portfolios remains a key area of uncertainty. Participants to our survey were often at the leading edge of integrating environmental factors into security-selection decisions. However, investors struggle to reflect the impact of climate change (and other megatrends) into the institutional asset allocation decision. There is a growing recognition that this needs to occur if the investment industry is to contribute materially to shifting the climate dynamic and to managing its own climate-related risks.
We heartily support the G20’s Taskforce for Climate-related Financial Disclosure (TCFD), which makes an important call for greater disclosure of climate-related exposures, both from companies and from investors themselves. We note the high level of awareness and engagement with the TCFD’s recommendations amongst some of our survey respondents. Specifically, the TCFD holds out scenario analysis as the methodology through which corporates and investors can gain understanding of their climate-related exposures. Again, this is a recommendation we firmly support, noting that the historically-calibrated asset-liability modelling techniques which underpin the asset allocation of many large investment institutions around the world will be unable to cope with significant environmental change because change of the scale that looks likely isn’t within the calibration data.
A deterministic scenario analysis, which stresses the institutional balance sheet to specific climate-related outcomes is likely the best tool we have. However, scenario analysis requires a significant amount of judgement both to build and to use. Happily, scenario analysis has been widely used in climate science for decades to probabilistically describe the evolving pathway of the global climate, so we are not starting from scratch. Climate scientists have also done a great deal of work linking the impact of climate to the economy in an attempt to quantify the impact of climate change.
The precise scenarios adopted, the modelling approaches used and the variables focussed upon within those scenarios will be heavily influenced by institutional context. Ultimately, the scenarios must focus on the most material outcomes – from either a financial or, if relevant, non-financial perspective – to the institution in question. However, as a general framework for building a scenario set, we would suggest the following areas are addressed:
� Which scenarios/what to capture? Our survey highlights the transition to the low carbon economy as being the most impactful and we would suggest, at the very least, investors should examine a scenario under which this transition is significant – perhaps enough to limit warming by 2050 to 2 degrees Celsius over pre-industrial levels with a 66% chance. Investors may also wish to develop a baseline scenario, either reflecting current climate policies in force (likely to result in a pre-industrial temperature increase of c3.5 degrees Celsius), or the additional pledges embedded in the Paris Accord (c2.8-3 degrees Celsius).
� Time horizon & the impact of sentiment: Many of the more severe impacts of environmental change look likely to manifest beyond a 20-year horizon. However, asset prices will begin to discount those changes before (possibly long before) they are due to occur. Therefore, a 10 or 20-year scenario will have to consider much longer-term outcomes in order to capture this effect. To focus only on the changes expected within that 10 or 20-year horizon will miss the vast majority of asset return impacts under certain assumptions. Similarly, the scenario will have to consider the extent to which sentiment (or valuation) changes are permanent features.
30 willistowerswatson.com
Achieving the SDGs: the environmental imperative
Investors implicitly or explicitly driven by extra-financial considerations will also be concerned about the ability of this industry to help deliver a sustainable long-term climate outcome. As we discuss elsewhere in this report, these longer-term societal objectives are best enshrined in the SDGs. Those for which climate change are particularly relevant are:
� Goal 7: Ensure access to affordable, reliable, sustainable and modern energy for all. By 2030, this calls for not only universal access to affordable energy but also significant increases in the use of renewable energy, energy efficiency and clean energy research.
� Goal 13: Take urgent action to combat climate change and its impacts. This is generally considered as consistent with limiting global warming to below 2 degrees Celsius, per the Paris Accord. There are other more specific targets, notably mobilising $100billion annually by 2020 from all sources, “to address the needs of developing countries in the context of meaningful mitigation actions and transparency on implementation and fully operationalize the Green Climate Fund through its capitalization as soon as possible.”
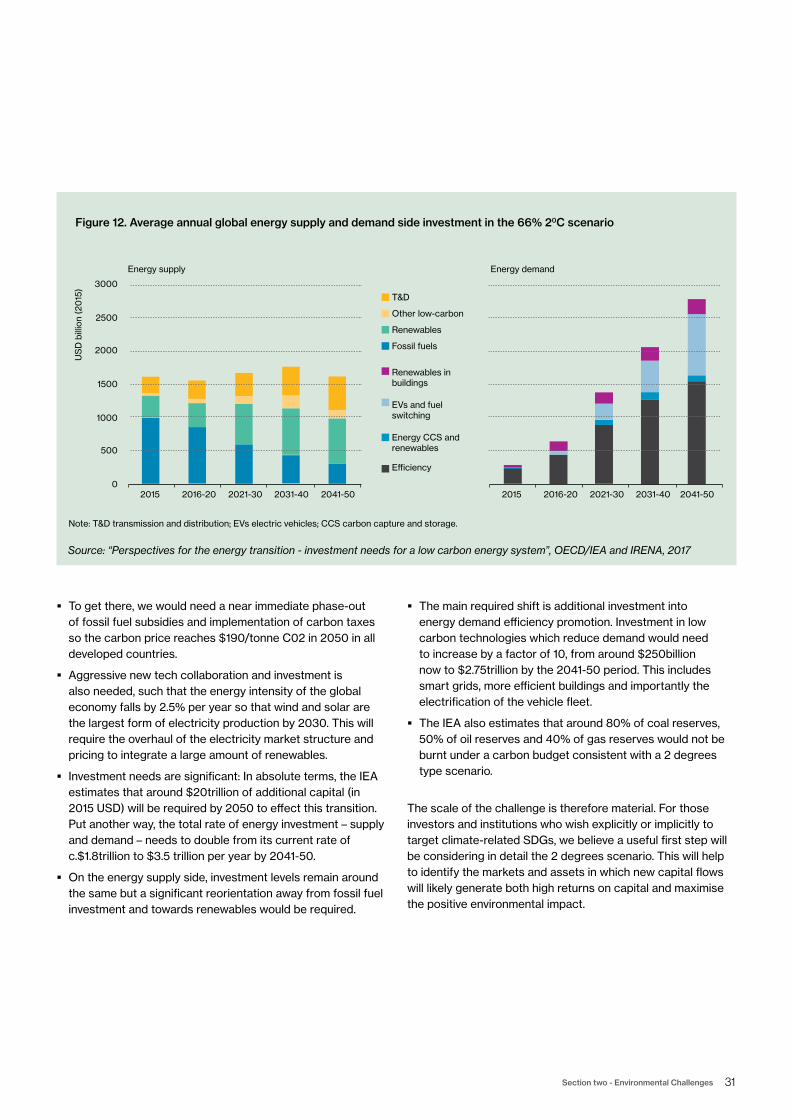
Targeting achievement of these SDGs, particularly goal 13, suggests an even sharper focus on the 2 degrees scenario than discussed above since this scenario is highly likely to deliver these SDGs. A great deal of work has been done examining the implications of a 2 degrees scenario, most recently by the International Energy Agency (IEA) and International Renewable Energy Agency, at the behest of the G20. This examines, in some detail, the shifts of economic capacity that will be required to deliver a 2 degrees scenario and by implication the SDGs. The required shifts are significant:
� Emissions will have to peak by 2020 and fall 70% by 2050, or equivalently the share of fossil fuels in energy demand would have to halve from 2014 levels by 2050; leaving nuclear, renewables and fossil fuels with carbon-capture representing 70% of energy demand by 2050.
31 Section two - Environmental Challenges
� To get there, we would need a near immediate phase-out of fossil fuel subsidies and implementation of carbon taxes so the carbon price reaches $190/tonne C02 in 2050 in all developed countries.
� Aggressive new tech collaboration and investment is also needed, such that the energy intensity of the global economy falls by 2.5% per year so that wind and solar are the largest form of electricity production by 2030. This will require the overhaul of the electricity market structure and pricing to integrate a large amount of renewables.
� Investment needs are significant: In absolute terms, the IEA estimates that around $20trillion of additional capital (in 2015 USD) will be required by 2050 to effect this transition. Put another way, the total rate of energy investment – supply and demand – needs to double from its current rate of c.$1.8trillion to $3.5 trillion per year by 2041-50.
� On the energy supply side, investment levels remain around the same but a significant reorientation away from fossil fuel investment and towards renewables would be required.
� The main required shift is additional investment into energy demand efficiency promotion. Investment in low carbon technologies which reduce demand would need to increase by a factor of 10, from around $250billion now to $2.75trillion by the 2041-50 period. This includes smart grids, more efficient buildings and importantly the electrification of the vehicle fleet.
� The IEA also estimates that around 80% of coal reserves, 50% of oil reserves and 40% of gas reserves would not be burnt under a carbon budget consistent with a 2 degrees type scenario.
The scale of the challenge is therefore material. For those investors and institutions who wish explicitly or implicitly to target climate-related SDGs, we believe a useful first step will be considering in detail the 2 degrees scenario. This will help to identify the markets and assets in which new capital flows will likely generate both high returns on capital and maximise the positive environmental impact.
20150
500
1000
1500
2000
2500
3000
Energy supply Energy demand
Note: T&D transmission and distribution; EVs electric vehicles; CCS carbon capture and storage.
US
D b
illio
n (2
015
)
2016-20 2021-30 2031-40 2041-50 2015
T&D
Other low-carbon
Renewables
Fossil fuels
Renewables in buildings
EVs and fuel switching
Energy CCS and renewables
E�ciency
2016-20 2021-30 2031-40 2041-50
Figure 12. Average annual global energy supply and demand side investment in the 66% 20C scenario
Source: “Perspectives for the energy transition - investment needs for a low carbon energy system”, OECD/IEA and IRENA, 2017
32 willistowerswatson.com
Managing environmental related riskConversation with: Lauren Compere (Managing Director) and Steven Heim (Managing Director), Boston Common Asset Management
The management of environment-related risk and opportunity at an industry and asset-level came up in our conversation with Boston Common Asset Management. They have been working on a multi-year project to evaluate climate-related risk in the banking sector. It showcases the scope for stewardship and highlights the inter-relationships of the E, S, and G in ESG.
Interviewer: Please tell us a little about your investment process.LC: We invest in quality companies, whose stock we expect to outperform on a risk-adjusted basis. We believe that incorporating ESG-related concepts fundamentally improves operating performance and also lowers the cost of capital.
SH: We look to optimise both ESG and traditional financial aspects. Our approach often includes engagement with our target companies on how they improve the former.
Interviewer: Please could you provide some detail on the work you have undertaken in the banking sector specifically?LC: Three years ago, pre-COP21, we put out a call to action to the banking sector to assess and disclose climate risk from their financing activities. Partly, with a view to mitigation especially given the financial risk to banks, customers and shareholders linked to a new potential class of stranded assets – fossil fuels – particularly coal. Partly, so they could position themselves to take advantage of the opportunities that the transition to a low carbon economy could provide in terms of financing new areas. We have run a multi-year
campaign to outline how banks are managing their governance around climate risk. In early 2017 we released our second report summarising our findings and are due to issue our third in early 2018 with a more explicit focus on alignment with the TCFD (Taskforce on Climate-related Financial Disclosures).
Interviewer: What areas has your work focussed on?LC: One is establishing a climate risk plan at the group level. This focuses on governance in areas like board-level oversight, links to compensation, performance goals, etc. Another is enhanced risk management in high-carbon sectors. Finally, opportunity capture around climate action such as green bonds or energy efficiency financing. We are asking banks to assess their exposure first and provide visibility to investors by articulating their findings so that they can make an informed choice.
Interviewer: Do you have an example of where this work has led to engagement with the sector on a particular project?
SH: Over 140 investors joined our engagment with 17 banks over their financing for the Dakota Access Pipeline. Direct loans to the project represent a tiny part of their balance sheets. However, we felt that the reputational and stranded asset risks of the project outweighed the financial benefit. We called on the banks to address or support the Standing Rock Sioux Tribe’s request to re-route the pipeline so that a satisfactory resolution could be sought. Later, several banks withdrew their funding for the project.
33 Section two - Environmental Challenges
Integrating natural disaster risks & resilience into the financial systemIntegrating climate and disaster risk into the financial system presents the opportunity to help save millions of lives and livelihoods in the coming decades and to protect billions in assets and property in a cost-effective and rational way when weighed against competing priorities.
This relatively simple solution links the combined power of financial regulation and accounting principles with the acute political priority and growing economic impact of natural disaster risk. It delivers significant progress in natural disaster resilience at the local and global scales, and across public, private and mutual sectors for both short and longer time scales.
The remarkable story of the global re/insurance sector’s near existential crisis in the late 1980s and early 1990s, and its ensuing journey towards far greater structural resilience to natural disaster risk by 2012-2014, provides a number of invaluable lessons on the essential techniques and approaches necessary for such a financial reform to occur.
Learning from crisis
Following a period of unprecedented losses in the 1980s, largely driven by natural catastrophe events, the global re/insurance market entered a crisis, culminating in the losses from Hurricane Andrew in 1992. This resulted in a number of insolvencies in Europe, North America and elsewhere, and structural confidence in the global risk-sharing mechanism of insurance was in disarray. Private capital withdrew, mutual
capital could not be expanded and, in most cases, public sector solutions could not be practically applied. With such lack of capital, natural disaster re/insurance became unavailable, severely restricted and/or excessively expensive. It was clear that the sector’s modus operandi of the last 300 years was no longer adequate in coping with the level of risks underwriters were facing.
Three key forces
During the decade from 1993 to 2003, the entire sector underwent a transformation driven by a deeper understanding of the roles of three key forces, which transformed the treatment of natural disaster risk within global re/insurance. These three key forces were smart capital; a scientific, data and analytical revolution; and public policy and financial regulation.
Smart capital began entering the sector from new private sector investors, mutuals, and even progressive state sector insurance systems, that demanded improvements in the way that underwriters evaluated and priced natural disaster risk in their portfolios.
34 willistowerswatson.com
A scientific, data and analytical revolution thrived with the influence of mid-1990s software and technology trends on underwriting data management and analysis, coupled with an influx of catastrophe risk modelling firms. As a result, the level of analytics of natural disaster risks went from relatively simple aggregate assessments undertaken by a single underwriter, to industrial scale operations: large cross-disciplinary analytical teams were now managing terabytes of data on major IT platforms to assess floods, earthquakes, windstorms and other perils to portfolios of homes and assets throughout the world.
The influence of public policy and financial regulation came to the fore when governments, through their insurance regulators, developed an emerging convention that insurance contracts should deliver their commitments at a 1:200 year level of confidence. This required, in effect, that an insurance company should have access to sufficient capital (either directly or through reinsurance) to remain solvent and pay all insurance claims when it experiences the worst combination of extreme events across the world over a twelve-month period once every 200 years at current (not historic) levels of risk.
Such multi-century scale risk management was new and unknown to insurance, as well as the wider financial world. Over time, however, knowledge was acquired, techniques became more refined, and the general market practice transformed. This policy approach, driven by insurance regulators seeking policyholder protection, was reinforced by re/insurer credit rating agencies who serve the demands of investors and creditors as well as providing metrics of financial strength employed by re/insurance counter parties and corporate insurance buyers.
Together, the three converging forces of smart capital; a scientific, data and analytical revolution; and public policy and financial regulation, created a revolution in the re/insurance market by the mid-2000s: sufficient amounts of capital began to be allocated to match levels of risk; failures became less frequent; and the volatility in the level of underwriting capacity and pricing in response to periods of high catastrophe losses steadily dampened.
In short, the market was beginning to master how to manage risk more effectively. Indeed, the year 2005 witnessed Hurricanes Katrina, Rita and Wilma hitting Florida and the Gulf Coast, causing major insured losses in excess of US$50 billion. However, despite the modelling challenges for Hurricane Katrina, the global re/insurance market was capitalised to pay claims and there were few insolvencies. By 2011, the worst global natural catastrophe loss year on record with over US$120 billion in claims, the sector succeeded in managing well within normal market operations, a trend that continued with the response to New York’s Super Storm Sandy in 2012. A trend that has also continued in 2017, with hurricanes in the U.S. (Harvey, Irma and Maria),
two earthquakes in Mexico, California wildfires and floods in various parts of Asia and Europe causing early estimates of total insured losses in the range of $120bn to $180bn.
Encouraging resilience
Over the last quarter of a century, the insurance sector, with its science and public policy partners, has firmly established a tried and tested operational system for rationally allocating capital in relation to disaster risks, even at extreme probabilities.
Furthermore, it has developed conditions and standards of behaviour for its customers to reduce risk to the system and to encourage, and sometimes enforce, resilience as a requirement of access to the contingent capital that an insurance policy represents.
While the insurance sector still has a long way to go and represents a relatively small proportion of the financial system, its remarkable journey through the nexus of capital, science, and public policy, provides the essential ingredients and method to embed natural disaster risks and resilience across financial regulation, accounting, and the condition for the access to capital it governs.
Accounting for disaster risk
The financial sector beyond non-life insurance generally does not take adequate account of natural disaster risk: it is not factored into investors’ valuations, creditors do not adequately assess natural hazards against their loans books, and extreme event risk is largely ignored by real estate markets (even in highly exposed locations).
Increasing levels of natural disaster losses in most parts of the world, combined with the growing frequency, intensity and duration of hydro-meteorological extremes, renders the continued invisibility of this risk within financial practice unsustainable. Investors, creditors and prudential regulators therefore urgently need to be informed of material risks to institutions, securities and commitments.
In due course, appropriate natural disaster risk factors will inevitably need to be incorporated into banking and securities protocols to reflect the basic tenets of regulation, accounting and audit which are underpinned by the principle that liabilities and material risk should be identified, and where appropriate, evaluated and reflected in reporting protocols and financial returns. This envisioned yet attainable financial reform would need to be founded on the principles of simplicity and consistency, which are important elements in financial regulation, accounting and reporting. Upon these principles, and borrowing from the insurance experience, a number of metrics would be developed and applied to securities and debt instruments.
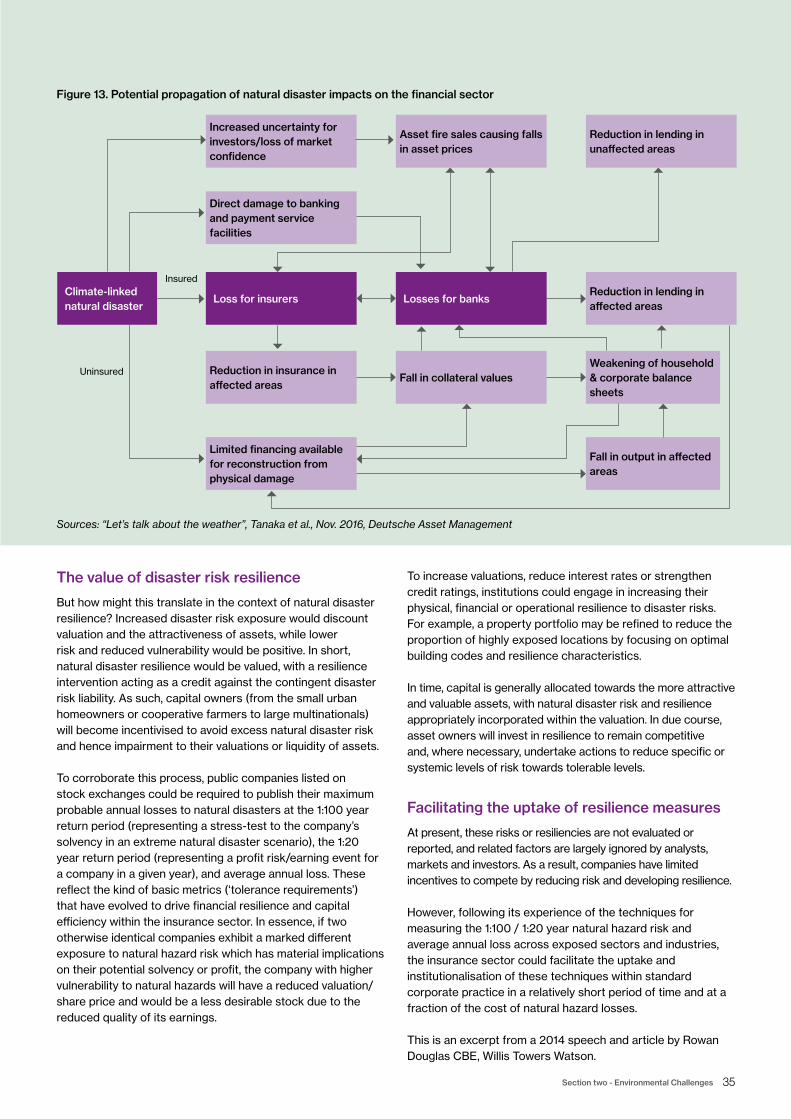
35 Section two - Environmental Challenges
The value of disaster risk resilience
But how might this translate in the context of natural disaster resilience? Increased disaster risk exposure would discount valuation and the attractiveness of assets, while lower risk and reduced vulnerability would be positive. In short, natural disaster resilience would be valued, with a resilience intervention acting as a credit against the contingent disaster risk liability. As such, capital owners (from the small urban homeowners or cooperative farmers to large multinationals) will become incentivised to avoid excess natural disaster risk and hence impairment to their valuations or liquidity of assets.
To corroborate this process, public companies listed on stock exchanges could be required to publish their maximum probable annual losses to natural disasters at the 1:100 year return period (representing a stress-test to the company’s solvency in an extreme natural disaster scenario), the 1:20 year return period (representing a profit risk/earning event for a company in a given year), and average annual loss. These reflect the kind of basic metrics (‘tolerance requirements’) that have evolved to drive financial resilience and capital efficiency within the insurance sector. In essence, if two otherwise identical companies exhibit a marked different exposure to natural hazard risk which has material implications on their potential solvency or profit, the company with higher vulnerability to natural hazards will have a reduced valuation/share price and would be a less desirable stock due to the reduced quality of its earnings.
To increase valuations, reduce interest rates or strengthen credit ratings, institutions could engage in increasing their physical, financial or operational resilience to disaster risks. For example, a property portfolio may be refined to reduce the proportion of highly exposed locations by focusing on optimal building codes and resilience characteristics.
In time, capital is generally allocated towards the more attractive and valuable assets, with natural disaster risk and resilience appropriately incorporated within the valuation. In due course, asset owners will invest in resilience to remain competitive and, where necessary, undertake actions to reduce specific or systemic levels of risk towards tolerable levels.
Facilitating the uptake of resilience measures
At present, these risks or resiliencies are not evaluated or reported, and related factors are largely ignored by analysts, markets and investors. As a result, companies have limited incentives to compete by reducing risk and developing resilience.
However, following its experience of the techniques for measuring the 1:100 / 1:20 year natural hazard risk and average annual loss across exposed sectors and industries, the insurance sector could facilitate the uptake and institutionalisation of these techniques within standard corporate practice in a relatively short period of time and at a fraction of the cost of natural hazard losses.
This is an excerpt from a 2014 speech and article by Rowan Douglas CBE, Willis Towers Watson.
Figure 13. Potential propagation of natural disaster impacts on the financial sector
Climate-linked natural disaster
Increased uncertainty for investors/loss of market confidence
Asset fire sales causing falls in asset prices
Losses for banks
Fall in collateral values
Reduction in lending in unaffected areas
Reduction in lending in affected areas
Weakening of household & corporate balance sheets
Fall in output in affected areas
Direct damage to banking and payment service facilities
Loss for insurers
Reduction in insurance in affected areas
Limited financing available for reconstruction from physical damage
Insured
Uninsured
Sources: “Let’s talk about the weather”, Tanaka et al., Nov. 2016, Deutsche Asset Management
36 willistowerswatson.com
Globalisation and Connectivity
Section three
“I think there’s a lot of merit in an international economy and global markets, but they’re not sufficient because markets don’t look after social needs.” George Soros, Chairman, Soros Fund Management
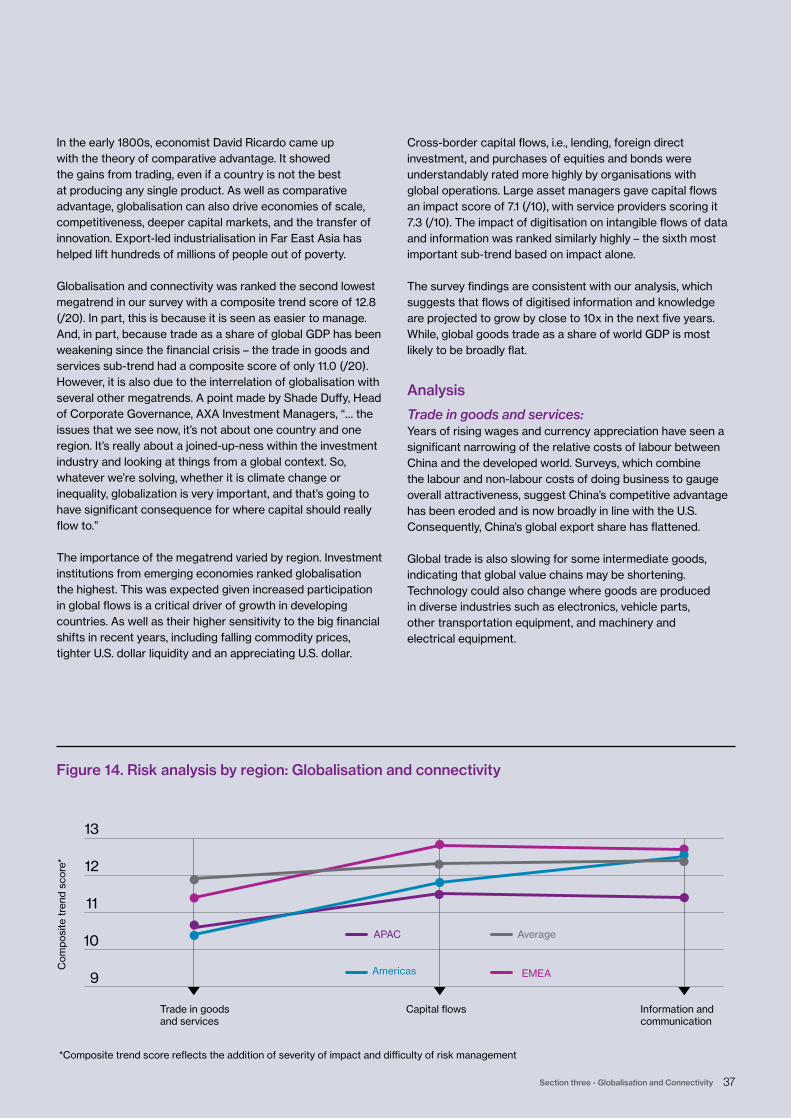
37 Section three - Globalisation and Connectivity
9
10
11
12
13
Trade in goods and services
Capital flows Information and communication
APAC Average
Americas EMEA
Com
posi
te t
rend
sco
re*
Figure 14. Risk analysis by region: Globalisation and connectivity
*Composite trend score reflects the addition of severity of impact and difficulty of risk management
In the early 1800s, economist David Ricardo came up with the theory of comparative advantage. It showed the gains from trading, even if a country is not the best at producing any single product. As well as comparative advantage, globalisation can also drive economies of scale, competitiveness, deeper capital markets, and the transfer of innovation. Export-led industrialisation in Far East Asia has helped lift hundreds of millions of people out of poverty.
Globalisation and connectivity was ranked the second lowest megatrend in our survey with a composite trend score of 12.8 (/20). In part, this is because it is seen as easier to manage. And, in part, because trade as a share of global GDP has been weakening since the financial crisis – the trade in goods and services sub-trend had a composite score of only 11.0 (/20). However, it is also due to the interrelation of globalisation with several other megatrends. A point made by Shade Duffy, Head of Corporate Governance, AXA Investment Managers, “… the issues that we see now, it’s not about one country and one region. It’s really about a joined-up-ness within the investment industry and looking at things from a global context. So, whatever we’re solving, whether it is climate change or inequality, globalization is very important, and that’s going to have significant consequence for where capital should really flow to.”
The importance of the megatrend varied by region. Investment institutions from emerging economies ranked globalisation the highest. This was expected given increased participation in global flows is a critical driver of growth in developing countries. As well as their higher sensitivity to the big financial shifts in recent years, including falling commodity prices, tighter U.S. dollar liquidity and an appreciating U.S. dollar.
Cross-border capital flows, i.e., lending, foreign direct investment, and purchases of equities and bonds were understandably rated more highly by organisations with global operations. Large asset managers gave capital flows an impact score of 7.1 (/10), with service providers scoring it 7.3 (/10). The impact of digitisation on intangible flows of data and information was ranked similarly highly – the sixth most important sub-trend based on impact alone.
The survey findings are consistent with our analysis, which suggests that flows of digitised information and knowledge are projected to grow by close to 10x in the next five years. While, global goods trade as a share of world GDP is most likely to be broadly flat.
Analysis
Trade in goods and services: Years of rising wages and currency appreciation have seen a significant narrowing of the relative costs of labour between China and the developed world. Surveys, which combine the labour and non-labour costs of doing business to gauge overall attractiveness, suggest China’s competitive advantage has been eroded and is now broadly in line with the U.S. Consequently, China’s global export share has flattened.
Global trade is also slowing for some intermediate goods, indicating that global value chains may be shortening. Technology could also change where goods are produced in diverse industries such as electronics, vehicle parts, other transportation equipment, and machinery and electrical equipment.
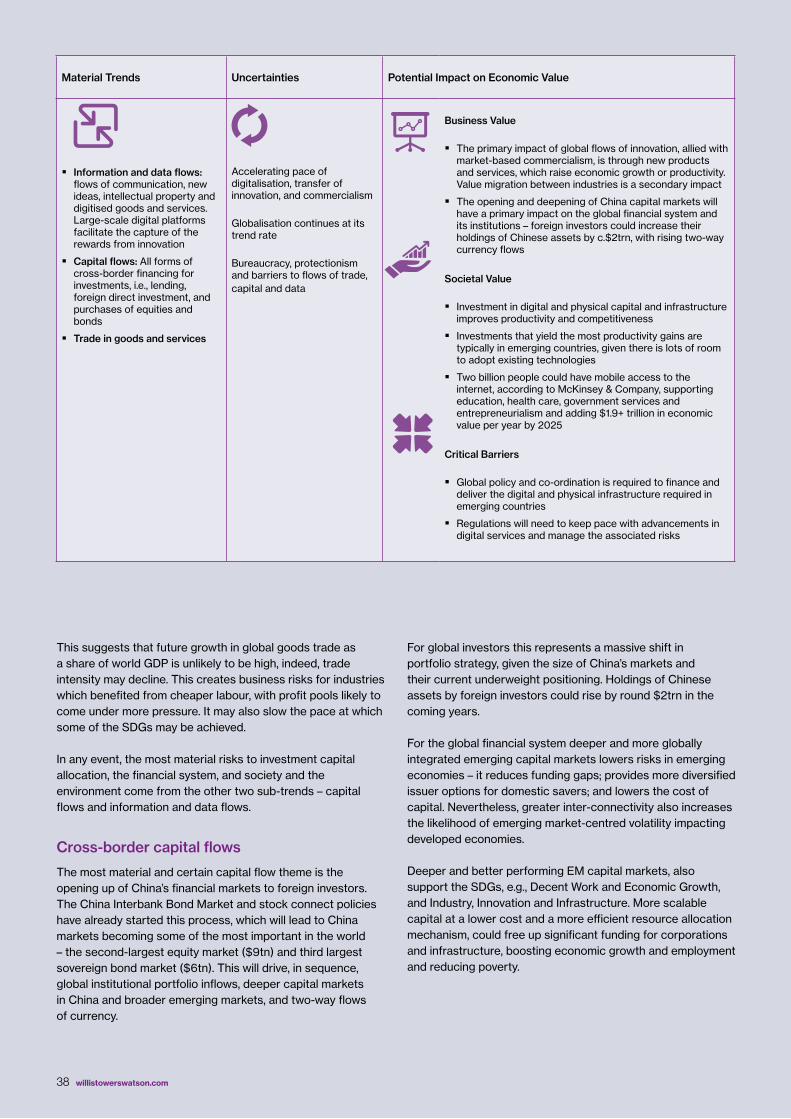
38 willistowerswatson.com
This suggests that future growth in global goods trade as a share of world GDP is unlikely to be high, indeed, trade intensity may decline. This creates business risks for industries which benefited from cheaper labour, with profit pools likely to come under more pressure. It may also slow the pace at which some of the SDGs may be achieved.
In any event, the most material risks to investment capital allocation, the financial system, and society and the environment come from the other two sub-trends – capital flows and information and data flows.
Cross-border capital flows
The most material and certain capital flow theme is the opening up of China’s financial markets to foreign investors. The China Interbank Bond Market and stock connect policies have already started this process, which will lead to China markets becoming some of the most important in the world – the second-largest equity market ($9tn) and third largest sovereign bond market ($6tn). This will drive, in sequence, global institutional portfolio inflows, deeper capital markets in China and broader emerging markets, and two-way flows of currency.
For global investors this represents a massive shift in portfolio strategy, given the size of China’s markets and their current underweight positioning. Holdings of Chinese assets by foreign investors could rise by round $2trn in the coming years.
For the global financial system deeper and more globally integrated emerging capital markets lowers risks in emerging economies – it reduces funding gaps; provides more diversified issuer options for domestic savers; and lowers the cost of capital. Nevertheless, greater inter-connectivity also increases the likelihood of emerging market-centred volatility impacting developed economies.
Deeper and better performing EM capital markets, also support the SDGs, e.g., Decent Work and Economic Growth, and Industry, Innovation and Infrastructure. More scalable capital at a lower cost and a more efficient resource allocation mechanism, could free up significant funding for corporations and infrastructure, boosting economic growth and employment and reducing poverty.
Material Trends Uncertainties Potential Impact on Economic Value
� Information and data flows: flows of communication, new ideas, intellectual property and digitised goods and services. Large-scale digital platforms facilitate the capture of the rewards from innovation
� Capital flows: All forms of cross-border financing for investments, i.e., lending, foreign direct investment, and purchases of equities and bonds
� Trade in goods and services
Accelerating pace of digitalisation, transfer of innovation, and commercialism
Globalisation continues at its trend rate
Bureaucracy, protectionism and barriers to flows of trade, capital and data
Business Value
� The primary impact of global flows of innovation, allied with market-based commercialism, is through new products and services, which raise economic growth or productivity. Value migration between industries is a secondary impact
� The opening and deepening of China capital markets will have a primary impact on the global financial system and its institutions – foreign investors could increase their holdings of Chinese assets by c.$2trn, with rising two-way currency flows
Societal Value
� Investment in digital and physical capital and infrastructure improves productivity and competitiveness
� Investments that yield the most productivity gains are typically in emerging countries, given there is lots of room to adopt existing technologies
� Two billion people could have mobile access to the internet, according to McKinsey & Company, supporting education, health care, government services and entrepreneurialism and adding $1.9+ trillion in economic value per year by 2025
Critical Barriers
� Global policy and co-ordination is required to finance and deliver the digital and physical infrastructure required in emerging countries
� Regulations will need to keep pace with advancements in digital services and manage the associated risks
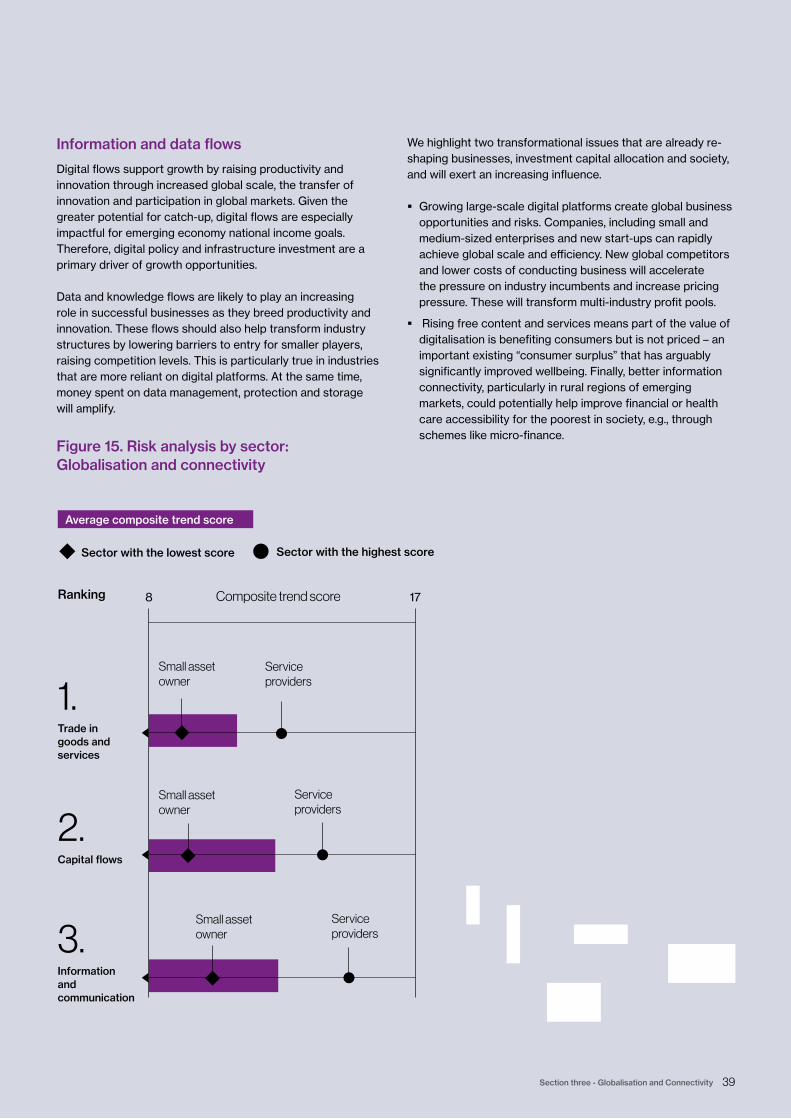
39 Section three - Globalisation and Connectivity
178 Composite trend score
Small asset owner
Small asset owner
Small asset owner
Service providers
Service providers
Service providers
Ranking
1.
Trade in goods and services
2.
Capital flows
3.
Information and communication
Sector with the lowest score Sector with the highest score
Average composite trend score
Figure 15. Risk analysis by sector: Globalisation and connectivity
Information and data flows
Digital flows support growth by raising productivity and innovation through increased global scale, the transfer of innovation and participation in global markets. Given the greater potential for catch-up, digital flows are especially impactful for emerging economy national income goals. Therefore, digital policy and infrastructure investment are a primary driver of growth opportunities.
Data and knowledge flows are likely to play an increasing role in successful businesses as they breed productivity and innovation. These flows should also help transform industry structures by lowering barriers to entry for smaller players, raising competition levels. This is particularly true in industries that are more reliant on digital platforms. At the same time, money spent on data management, protection and storage will amplify.
We highlight two transformational issues that are already re-shaping businesses, investment capital allocation and society, and will exert an increasing influence.
� Growing large-scale digital platforms create global business opportunities and risks. Companies, including small and medium-sized enterprises and new start-ups can rapidly achieve global scale and efficiency. New global competitors and lower costs of conducting business will accelerate the pressure on industry incumbents and increase pricing pressure. These will transform multi-industry profit pools.
� Rising free content and services means part of the value of digitalisation is benefiting consumers but is not priced – an important existing “consumer surplus” that has arguably significantly improved wellbeing. Finally, better information connectivity, particularly in rural regions of emerging markets, could potentially help improve financial or health care accessibility for the poorest in society, e.g., through schemes like micro-finance.
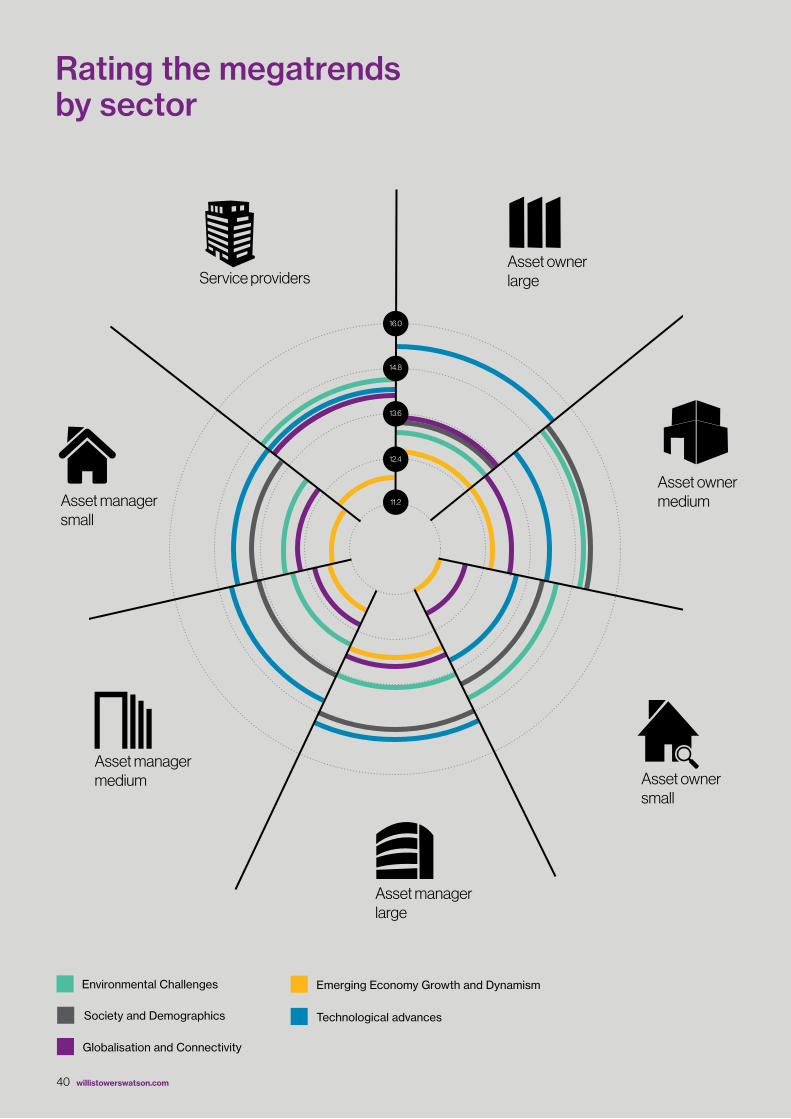
40 willistowerswatson.com
11.2
12.4
13.6
14.8
16.0
Rating the megatrends by sector
Technological advances
Globalisation and Connectivity
Emerging Economy Growth and DynamismEnvironmental Challenges
Society and Demographics
Asset owner large
Asset owner medium
Asset manager large
Asset manager medium
Asset manager small
Service providers
Asset owner small
41 Section four - Society and Demographics
Society and Demographics
Section four
“No society can surely be flourishing and happy, of which the far greater part of the members are poor and miserable.”Adam Smith
42 willistowerswatson.com
The unequal nature of income and wealth and changes in the demographic profile of society are at the heart of the Society and Demographics megatrend. A perspective echoed by Amanda Young, Standard Life Investments, “The world has become a very unequal place. Rising inequalities have led to political events such as Brexit and Trump. Over the past few years, we have identified social inequality as a key risk for the portfolios that we are investing in. There is pressure on the underlying entities to address rising inequalities as part of their business strategies. This can be in areas such as access to information, access to healthcare, remuneration issues and pay and employment issues.”
Slowing population growth will lower the rate of GDP growth, via labour pressures. Government revenues will fall with the number of workers, unless there is an offsetting increase in productivity or taxes, potentially reducing their ability to maintain social welfare. Ageing and low long-term returns mean savings are likely to be below expectations and what is required to fill public and private pensions and social services funding gaps in the developed world. This will likely increase the ratio of public sector spending to GDP by c.5% by 2030. Disparity in income/wealth is contributing to rising political populism and less trust in government in the developed world. Lower income households in the U.S. have rising death rates and worsening mental and physical health. In emerging economies growth is necessary to improve living standards. Population growth in emerging economies is also a material driver of resources demand – energy, materials, food, and water – affecting environmental sustainability.
Successful institutions and governments will need to adapt. Amanda Young highlights the interconnectedness of regulation, societal attitudes, and transformational change through the business domain, “We are already witnessing this with climate change, where an increasing number of shareholder resolutions are appearing at company AGMs, with shareholders putting pressure on companies to assess the risks climate change poses to their business. In addition, we are seeing governments increasing regulation in this area. Society and governments are expecting more from companies in how they approach social issues. This includes issues such as access to health, access to education, access to finance and unsustainable production and consumption.”
In our survey, the society and demographics megatrend scored second highest in terms of its composite score, only behind technological advances. The sub-trends clustered around the average impact score. However, this scoring masked significant dispersion amongst sub-trends and participants. Two sub-trends scored especially highly. The first was public sector finance pressures and policy responses, which scored highly both in terms of impact and difficulty of management. The second was inequality, populism and
conflict, primarily due to the difficulty in managing the trend, despite an average expected impact.
Asia Pacific-based institutions generally ranked the sub-trends below other regions. On the other hand, emerging-economy based investors – primarily from Latin American and South Africa – rated the trends higher. This regional dispersion could reflect the economic experiences of different countries, with major Latin American and African economies experiencing debt crises and broader political instability over the past few years.
Across sectors, both the top ranked sub-trends were scored more highly by asset owners than asset management firms, particularly small and medium-sized. In the case of public sector finance and policy pressures, in particular, this likely reflects the fact that a number of the asset owner survey respondents are more directly impacted. For example, a reasonable sample of asset owner respondents were pension funds with state links.
Analysis
From a financial system perspectiveSavings shortfalls and current and future public sector indebtedness have the most material impact on the financial system.
First, on average, G20 economies will have to finance increased retirement and healthcare costs of around 110% of GDP by 2050, or around 3% of GDP per annum. Population ageing will in turn contribute to lower asset returns, which exacerbate the problem, meaning that authorities are left with unpalatable decisions to deal with rising liabilities.
There will likely be a material shift in net savings and investment balances despite the current savings shortfall; a consequence of slower worker and peak saver growth. This is likely to drive up borrowing costs, as investment demand remains relatively constant or increases given the UN Sustainable Development Goals, e.g., Industry, Innovation and Infrastructure development.
Public finance pressures are likely to require tax increases. This burden may fall disproportionately on the financial sector, via additional taxation on large pools of capital.
The alternative scenario, to prevent a rise in interest rates, is a developed world central bank policy of money printing, asset purchases and financing of government deficits.
Japanese DB pension funds are a useful case study for how one might deal with funding shortfalls. Funding gaps were met by higher household savings, more government contributions, and benefits cuts of c. 20%.
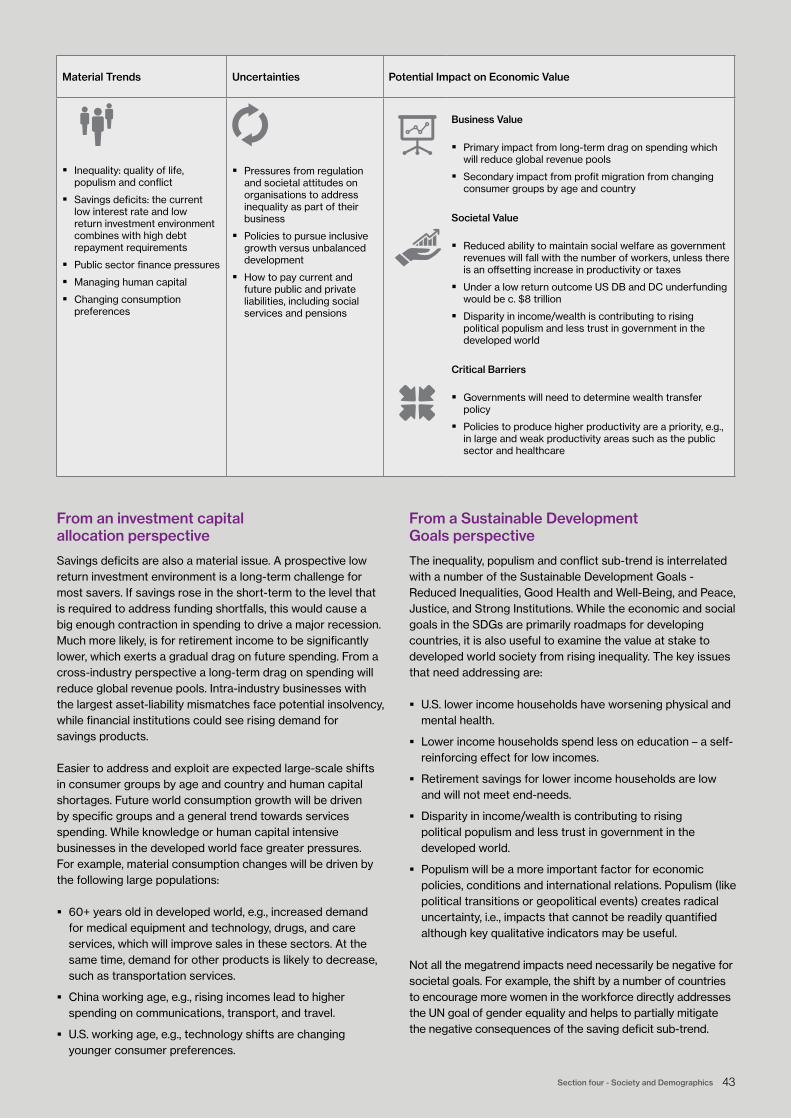
43 Section four - Society and Demographics
From an investment capital allocation perspective
Savings deficits are also a material issue. A prospective low return investment environment is a long-term challenge for most savers. If savings rose in the short-term to the level that is required to address funding shortfalls, this would cause a big enough contraction in spending to drive a major recession. Much more likely, is for retirement income to be significantly lower, which exerts a gradual drag on future spending. From a cross-industry perspective a long-term drag on spending will reduce global revenue pools. Intra-industry businesses with the largest asset-liability mismatches face potential insolvency, while financial institutions could see rising demand for savings products.
Easier to address and exploit are expected large-scale shifts in consumer groups by age and country and human capital shortages. Future world consumption growth will be driven by specific groups and a general trend towards services spending. While knowledge or human capital intensive businesses in the developed world face greater pressures. For example, material consumption changes will be driven by the following large populations:
� 60+ years old in developed world, e.g., increased demand for medical equipment and technology, drugs, and care services, which will improve sales in these sectors. At the same time, demand for other products is likely to decrease, such as transportation services.
� China working age, e.g., rising incomes lead to higher spending on communications, transport, and travel.
� U.S. working age, e.g., technology shifts are changing younger consumer preferences.
From a Sustainable Development Goals perspective
The inequality, populism and conflict sub-trend is interrelated with a number of the Sustainable Development Goals - Reduced Inequalities, Good Health and Well-Being, and Peace, Justice, and Strong Institutions. While the economic and social goals in the SDGs are primarily roadmaps for developing countries, it is also useful to examine the value at stake to developed world society from rising inequality. The key issues that need addressing are:
� U.S. lower income households have worsening physical and mental health.
� Lower income households spend less on education – a self-reinforcing effect for low incomes.
� Retirement savings for lower income households are low and will not meet end-needs.
� Disparity in income/wealth is contributing to rising political populism and less trust in government in the developed world.
� Populism will be a more important factor for economic policies, conditions and international relations. Populism (like political transitions or geopolitical events) creates radical uncertainty, i.e., impacts that cannot be readily quantified although key qualitative indicators may be useful.
Not all the megatrend impacts need necessarily be negative for societal goals. For example, the shift by a number of countries to encourage more women in the workforce directly addresses the UN goal of gender equality and helps to partially mitigate the negative consequences of the saving deficit sub-trend.
Material Trends Uncertainties Potential Impact on Economic Value
� Inequality: quality of life, populism and conflict
� Savings deficits: the current low interest rate and low return investment environment combines with high debt repayment requirements
� Public sector finance pressures
� Managing human capital
� Changing consumption preferences
� Pressures from regulation and societal attitudes on organisations to address inequality as part of their business
� Policies to pursue inclusive growth versus unbalanced development
� How to pay current and future public and private liabilities, including social services and pensions
Business Value
� Primary impact from long-term drag on spending which will reduce global revenue pools
� Secondary impact from profit migration from changing consumer groups by age and country
Societal Value
� Reduced ability to maintain social welfare as government revenues will fall with the number of workers, unless there is an offsetting increase in productivity or taxes
� Under a low return outcome US DB and DC underfunding would be c. $8 trillion
� Disparity in income/wealth is contributing to rising political populism and less trust in government in the developed world
Critical Barriers
� Governments will need to determine wealth transfer policy
� Policies to produce higher productivity are a priority, e.g., in large and weak productivity areas such as the public sector and healthcare
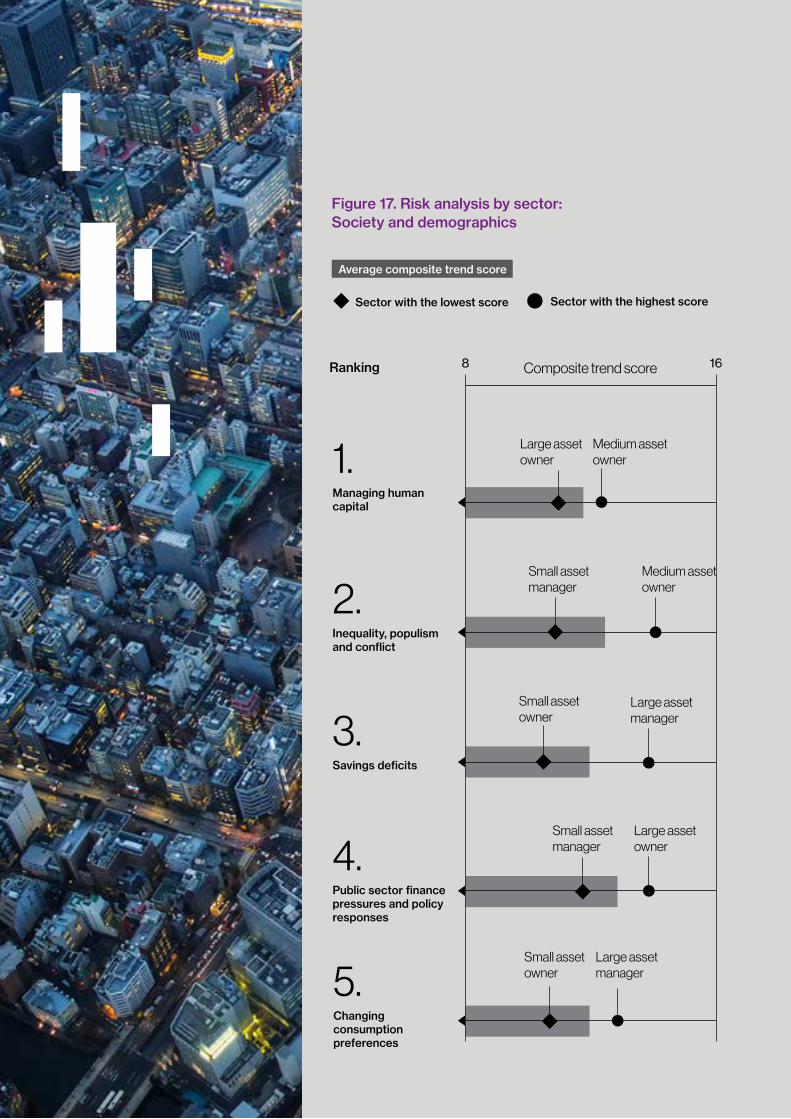
44 willistowerswatson.com
168 Composite trend score
Large asset owner
Small asset manager
Small asset owner
Small asset owner
Small asset manager
Large asset owner
Large asset manager
Medium asset owner
Medium asset owner
Large asset manager
1.
Managing human capital
2.
Inequality, populism and conflict
3.
Savings deficits
4.
Public sector finance pressures and policy responses
5.
Changing consumption preferences
Sector with the lowest score Sector with the highest score
Average composite trend score
Ranking
Figure 17. Risk analysis by sector: Society and demographics
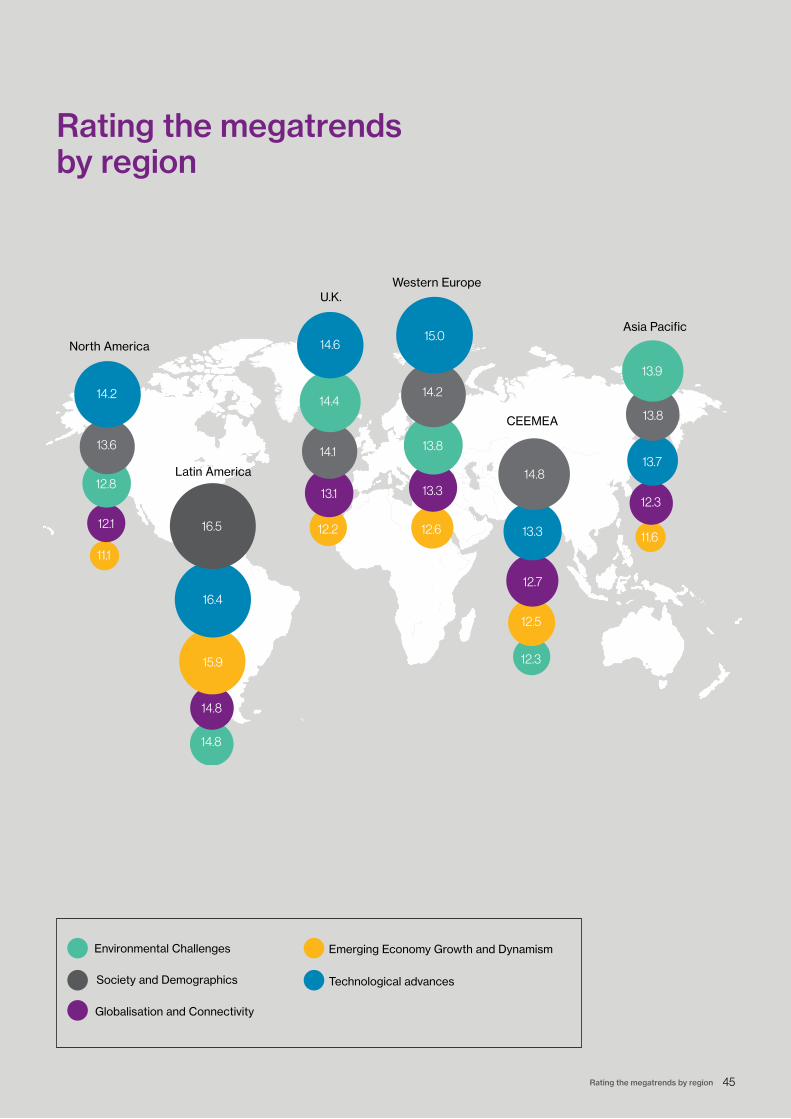
45 Rating the megatrends by region
North America
12.8
13.6
12.1
11.1
14.2
Latin America
14.8
16.5
14.8
15.9
16.4
U.K.
14.4
14.1
13.1
12.2
14.6
Western Europe
13.8
14.2
13.3
12.6
15.0
CEEMEA
12.3
14.8
12.7
12.5
13.3
Asia Pacific
13.9
13.8
12.3
11.6
13.7
Rating the megatrends by region
Technological advances
Globalisation and Connectivity
Emerging Economy Growth and DynamismEnvironmental Challenges
Society and Demographics
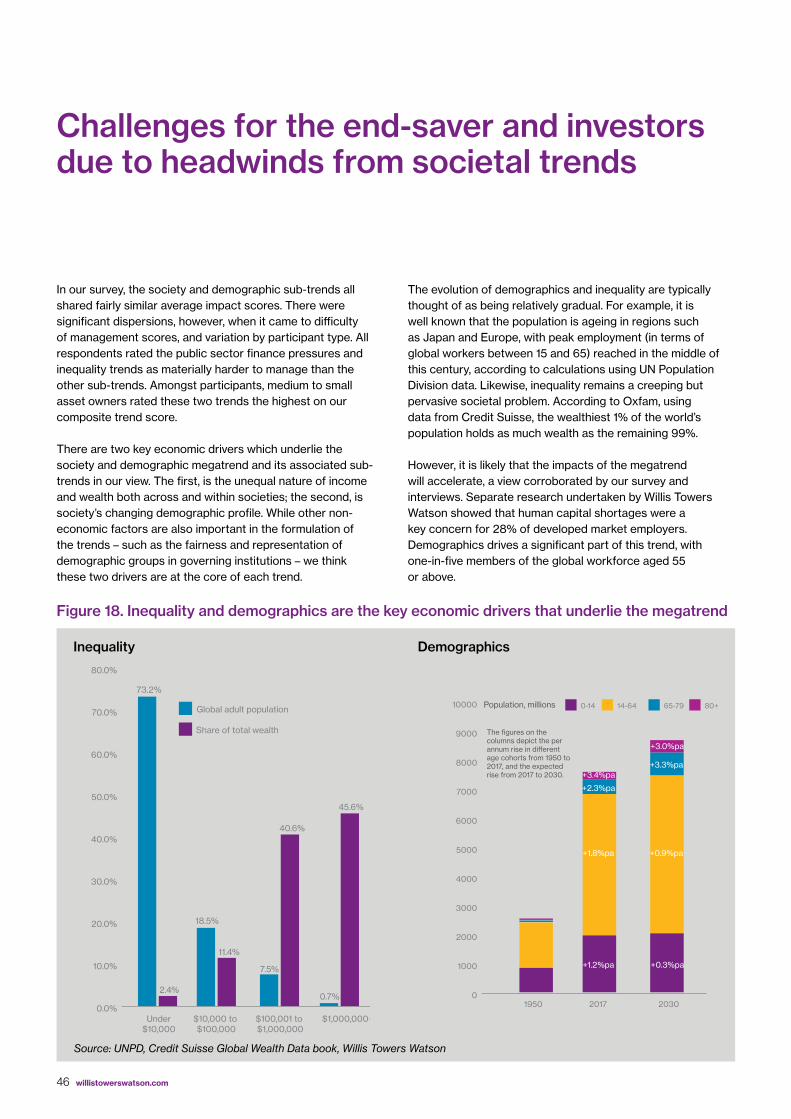
46 willistowerswatson.com
Challenges for the end-saver and investors due to headwinds from societal trends
In our survey, the society and demographic sub-trends all shared fairly similar average impact scores. There were significant dispersions, however, when it came to difficulty of management scores, and variation by participant type. All respondents rated the public sector finance pressures and inequality trends as materially harder to manage than the other sub-trends. Amongst participants, medium to small asset owners rated these two trends the highest on our composite trend score.
There are two key economic drivers which underlie the society and demographic megatrend and its associated sub-trends in our view. The first, is the unequal nature of income and wealth both across and within societies; the second, is society’s changing demographic profile. While other non-economic factors are also important in the formulation of the trends – such as the fairness and representation of demographic groups in governing institutions – we think these two drivers are at the core of each trend.
The evolution of demographics and inequality are typically thought of as being relatively gradual. For example, it is well known that the population is ageing in regions such as Japan and Europe, with peak employment (in terms of global workers between 15 and 65) reached in the middle of this century, according to calculations using UN Population Division data. Likewise, inequality remains a creeping but pervasive societal problem. According to Oxfam, using data from Credit Suisse, the wealthiest 1% of the world’s population holds as much wealth as the remaining 99%.
However, it is likely that the impacts of the megatrend will accelerate, a view corroborated by our survey and interviews. Separate research undertaken by Willis Towers Watson showed that human capital shortages were a key concern for 28% of developed market employers. Demographics drives a significant part of this trend, with one-in-five members of the global workforce aged 55 or above.
0.0%
10.0%
20.0%
30.0%
40.0%
50.0%
60.0%
70.0%
80.0%
73.2%
Global adult population
2.4%
18.5%
11.4%
7.5%
40.6%
0.7%
45.6%
Share of total wealth
Under$10,000
$10,000 to $100,000
$100,001 to $1,000,000
$1,000,000+
Inequality
0
1000
2000
3000
4000
5000
6000
7000
8000
9000
10000
1950 2017 2030
0-14 14-64 65-79 80+
The figures on the columns depict the per annum rise in di�erent age cohorts from 1950 to 2017, and the expected rise from 2017 to 2030.
Population, millions
+0.3%pa+1.2%pa
+0.9%pa+1.8%pa
+3.3%pa
+2.3%pa
+3.4%pa
+3.0%pa
Demographics
Figure 18. Inequality and demographics are the key economic drivers that underlie the megatrend
Source: UNPD, Credit Suisse Global Wealth Data book, Willis Towers Watson

47 Section four - Society and Demographics
Likewise, the rise of populism in developed world politics, partly fuelled by an unequal income and wealth distribution, has already had a material and relatively swift impact on the global financial system. Examples of this are the impacts on currencies and stock prices from the decision by the U.K. public to leave the EU and the election of Donald Trump.
The global savings challenge
The remainder of this article puts a spotlight on global savings challenges. Ageing and unequal societies can place significant pressure on public and private sector saving schemes through unfunded liabilities. Below, we set out the key issues and suggest some policy actions to minimise the negative implications.
At a global level, quantifying the extent of the savings challenge is difficult. Different assumptions regarding longevity, discount rates and investment returns means that national numbers are generally not comparable. The IMF has estimated the likely required increase in global public sector pension and healthcare expenditures to meet societal needs over the coming decades. On average, G20 economies will have to finance increased retirement and healthcare costs of around 110% of GDP by 2050. This equates to 3% of GDP per annum over the period.
The public sector is not alone in facing a significant increase in expenditures. In the U.K., estimates provided by the U.K. Pension Protection Fund puts the shortfall of assets against liabilities of the corporate final salary sector at around £340 billion, or a little over 18% of U.K. GDP.
48 willistowerswatson.com
This solvency issue in private sector final salary schemes has led to greater usage of defined contribution (DC) schemes in many geographies, where retiree benefits are not defined in advance. However, changing plan design shifts the burden of the savings challenge from the shoulders of the sponsoring entity onto the shoulders of the underlying members, instead of solving it.
Retirement and healthcare benefits are funded in two ways: 1) for ‘funded’ DC plans, an asset pool is built up over time, or 2) for ‘unfunded’ plans current income from taxes/contributions/assets is used to pay current liabilities. The amount required to be put aside to fund future liabilities depends on actuarial assumptions for the funds liabilities (e.g., longevity) and the rate of return that accrues on the assets in the case of a funded plan.
The impact of societal ageing on longevity is self-evident, increasing the burden of healthcare insurance and pension schemes. Similarly, greater disparity in wealth and income has been shown to increase healthcare costs. What is harder to gauge is the impact that ageing has on prospective returns, which operates through two channels:
� GDP growth: as the population ages, the rate of growth of the labour force declines which slows economic growth. According to data from McKinsey & Company, over the past 50 years, working age population growth was around 1.8%.
Over the next 50, it will average 0.4%. Additionally, as people get older, they spend progressively less on consumption, regardless of their income. A household headed by someone aged 80+ spends, on average, 43% less than a household headed by a 50 year old, lowering growth.
� Equilibrium real interest rates: in the long run, equilibrium interest rates reflect the balance between the demand for funds (investment) and the supply of funds (desired saving). As populations have aged, the supply of funds has increased as savings have increased. These forces have driven real interest rates lower. We estimate that ageing accounts for approximately 100 to 200bps of the approximately 450bps decline in real interest rates since 1980.
Therefore, ageing acts to reduce expected long-term returns by reducing future real economic growth and current interest rates. In concert with longevity and inequality, low returns increase the amount that must be put aside now in order to fund future expenditure. Importantly, the factors do not act independently but reinforce each other.
Ultimately, if left unaddressed, private savings issues will transform into fiscal issues. If pensions do turn out to be too low, in the sense that standards of living in retirement are socially unacceptable, the pressure will grow on the public sector to step in.
Millennial money
By 2020 millennials could have a net worth of US$24 trillion yet only one third invest in the stock market. Many grew up during the financial crisis of 2007-2008 and saw their parents suffer as a result; this has engendered distrust in investments and a risk-averse attitude. In China where millennials are relatively more prosperous (70% are homeowners), their preferred investments are property and cash over stocks or funds.
Relatability is another issue; the average age of a financial adviser is 50 years old and there are more financial advisers over 70 than there are under 30. This wariness of investing is compounded by high student debt, house price rises and the fact that young adults today earn 20% less than their counterparts did in 1989.
While millennial saving for short-term goals may be damaging to their long-term financial health, it is also bad news for asset managers. The average investor is currently in their late 50s but 81% of asset managers say they want to become more attractive to the younger generation.
Asset managers who fail to adapt business and operating models to attract this next generation of wealth may risk losing a substantial pool of future investments. Asset management is not immune to the fintech boom and millennials are particularly open when it comes to technology; 85% of U.K. millennials are comfortable with using robots for financial advice. Arguably this will only grow when Generation Z (born 1995-2012) reach investment age; they are the only generation to have never known a world without internet.
According to fintech thought leader Paolo Sironi, gamification – the process of adding games or game-like elements to something so as to encourage participation – can “achieve sustained innovation in financial services because it can provide a way for individuals to rewire their brains … and achieve better investment behaviour against the imprints generated by financial events and the experience of their formative years”. This is particularly relevant for millennials, 82% of whom say their investment decisions are motivated by the financial crisis. For asset managers, gamification can also create ‘stickiness’ among clients and enhance profitability.

49 Section four - Society and Demographics
Unaddressed, the savings challenge presents a potential major disruption to the global economy and financial system. However, certain actions can be taken to reduce the solvency issues described above.
� Save more now: estimates suggest that U.S. public pension schemes need an additional $270bn of contributions over the next 30 years to meet their liabilities, equivalent to an additional 12% of state and local government revenues. Likewise, data from the European Insurance and Occupational Pensions Authority (EIOPA) suggests that over 20% of European life insurers run the risk of not meeting capital requirements if bond yields stay low. This is not a panacea. Higher saving means lower spending and weaker economic growth.
� Revisit plan design and benefit entitlements: part of the solution is likely to be reductions in ultimate benefits. In private sector schemes, this may require revisions to the design of the benefits and/or the encouragement of transfers out. For the public sector, further incremental changes to retirement ages and indexation may be required. Neither will be popular with beneficiaries but are likely required to deliver sustainable outcomes and counter the prospect of significant intergenerational inequity.
� Take more investment risk: Increased investment risk and return may contribute to closing funding gaps. However, it also leads to greater risk of insolvency, which could be systemic if taken by many plans.
Reforms in the Japanese Public Pension system have combined many of these aspects. Contributions into schemes have been raised materially over the course of the last decade. Benefits have been cut through changes in indexation rates and increasing the pensionable age. Through these mechanisms, Japanese authorities hope to control required pension expenditure at close to 10% GDP, roughly current levels. The rest of the developed world will need to go through similar processes in the coming years to meet their savings needs.
There is a need to focus decision makers’ attention on the big picture. Engaging with the possibility of lower returns and redefining the mission of savings vehicles requires a significant time commitment. For final salary schemes, revising the plan design, encouraging transfers out and other forms of risk transfer will take up a large amount of the time of a board of directors, for example. For defined contribution schemes, the important job of increasing the contribution rates of members requires energy and resources. Given the scale of these tasks, the savings challenge demands a fundamental rethink of investment governance.
50 willistowerswatson.com
Emerging economy growth and dynamism
Section five
“China advocates inclusive growth. Our main task now is to address unbalanced, inadequate development in order to meet its people’s need for a better life as well as for greater democracy, the rule of law, justice, security and a better environment.” Liu Xiaoming, Chinese Ambassador to the U.K.
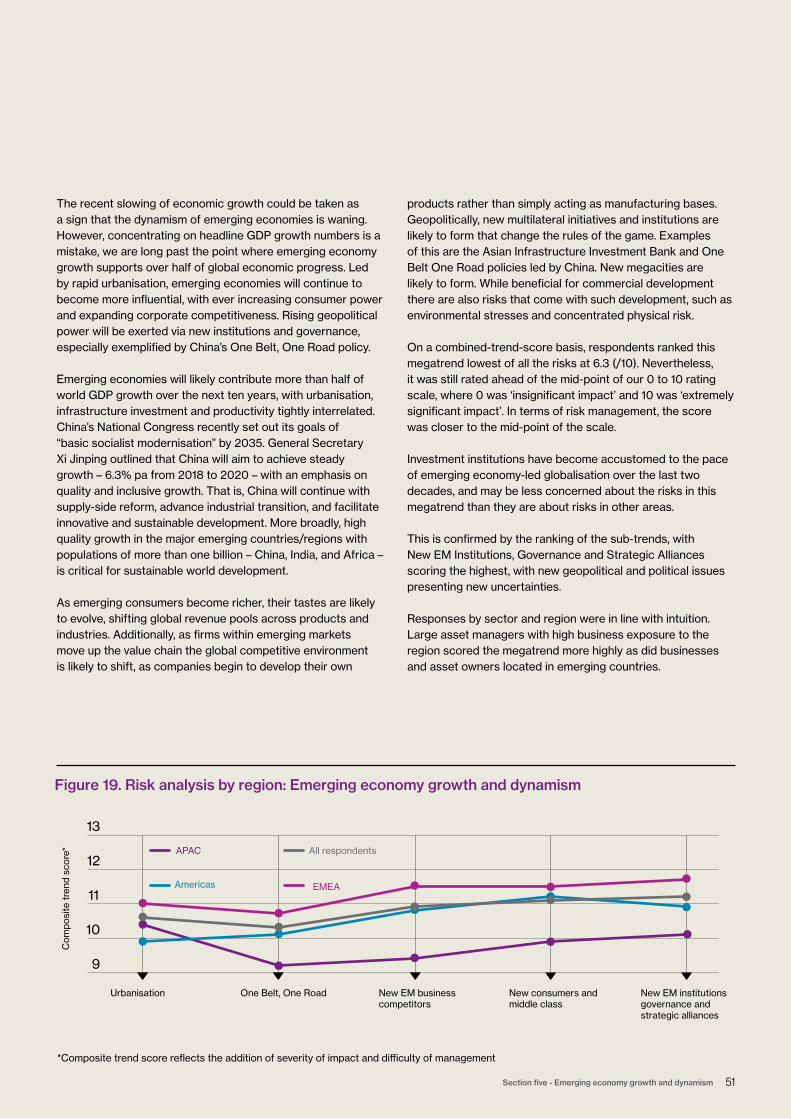
51 Section five - Emerging economy growth and dynamism
9
10
11
12
13
Urbanisation One Belt, One Road New EM business competitors
New consumers and middle class
New EM institutions governance and strategic alliances
APAC All respondents
Americas EMEA
Com
posi
te t
rend
sco
re*
Figure 19. Risk analysis by region: Emerging economy growth and dynamism
*Composite trend score reflects the addition of severity of impact and difficulty of management
The recent slowing of economic growth could be taken as a sign that the dynamism of emerging economies is waning. However, concentrating on headline GDP growth numbers is a mistake, we are long past the point where emerging economy growth supports over half of global economic progress. Led by rapid urbanisation, emerging economies will continue to become more influential, with ever increasing consumer power and expanding corporate competitiveness. Rising geopolitical power will be exerted via new institutions and governance, especially exemplified by China’s One Belt, One Road policy.
Emerging economies will likely contribute more than half of world GDP growth over the next ten years, with urbanisation, infrastructure investment and productivity tightly interrelated. China’s National Congress recently set out its goals of “basic socialist modernisation” by 2035. General Secretary Xi Jinping outlined that China will aim to achieve steady growth – 6.3% pa from 2018 to 2020 – with an emphasis on quality and inclusive growth. That is, China will continue with supply-side reform, advance industrial transition, and facilitate innovative and sustainable development. More broadly, high quality growth in the major emerging countries/regions with populations of more than one billion – China, India, and Africa – is critical for sustainable world development.
As emerging consumers become richer, their tastes are likely to evolve, shifting global revenue pools across products and industries. Additionally, as firms within emerging markets move up the value chain the global competitive environment is likely to shift, as companies begin to develop their own
products rather than simply acting as manufacturing bases. Geopolitically, new multilateral initiatives and institutions are likely to form that change the rules of the game. Examples of this are the Asian Infrastructure Investment Bank and One Belt One Road policies led by China. New megacities are likely to form. While beneficial for commercial development there are also risks that come with such development, such as environmental stresses and concentrated physical risk.
On a combined-trend-score basis, respondents ranked this megatrend lowest of all the risks at 6.3 (/10). Nevertheless, it was still rated ahead of the mid-point of our 0 to 10 rating scale, where 0 was ‘insignificant impact’ and 10 was ‘extremely significant impact’. In terms of risk management, the score was closer to the mid-point of the scale.
Investment institutions have become accustomed to the pace of emerging economy-led globalisation over the last two decades, and may be less concerned about the risks in this megatrend than they are about risks in other areas.
This is confirmed by the ranking of the sub-trends, with New EM Institutions, Governance and Strategic Alliances scoring the highest, with new geopolitical and political issues presenting new uncertainties.
Responses by sector and region were in line with intuition. Large asset managers with high business exposure to the region scored the megatrend more highly as did businesses and asset owners located in emerging countries.
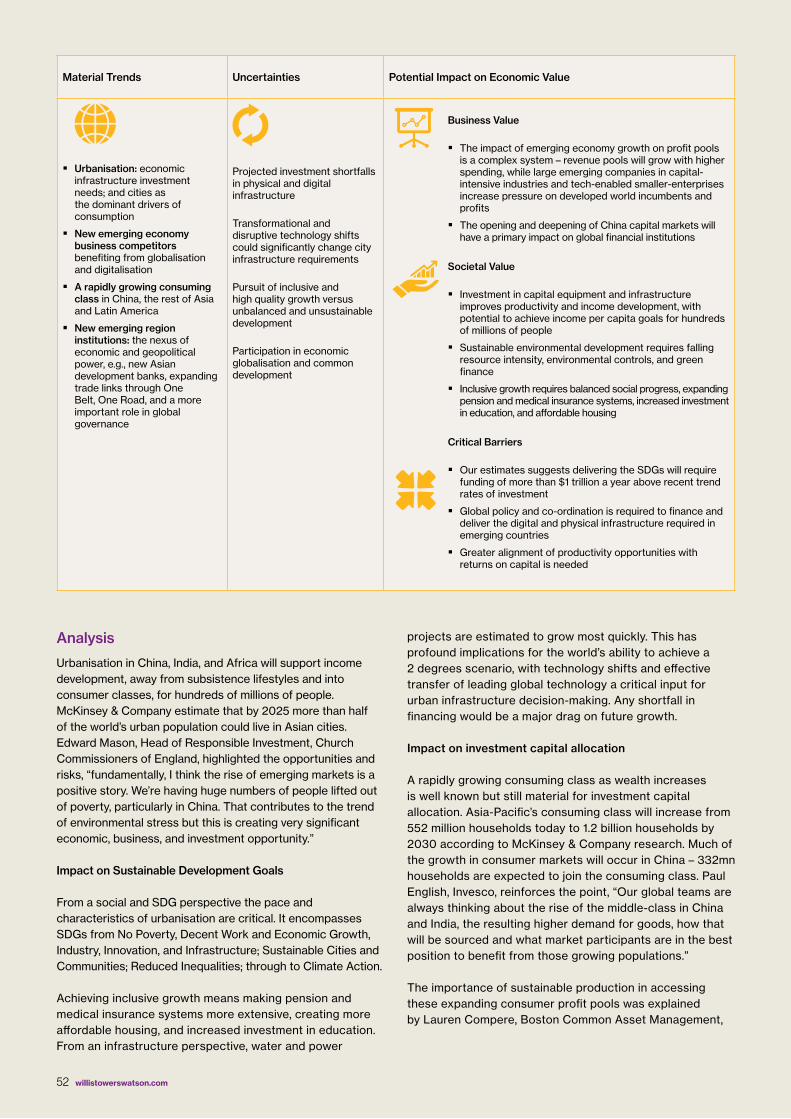
52 willistowerswatson.com
Analysis
Urbanisation in China, India, and Africa will support income development, away from subsistence lifestyles and into consumer classes, for hundreds of millions of people. McKinsey & Company estimate that by 2025 more than half of the world’s urban population could live in Asian cities. Edward Mason, Head of Responsible Investment, Church Commissioners of England, highlighted the opportunities and risks, “fundamentally, I think the rise of emerging markets is a positive story. We’re having huge numbers of people lifted out of poverty, particularly in China. That contributes to the trend of environmental stress but this is creating very significant economic, business, and investment opportunity.”
Impact on Sustainable Development Goals From a social and SDG perspective the pace and characteristics of urbanisation are critical. It encompasses SDGs from No Poverty, Decent Work and Economic Growth, Industry, Innovation, and Infrastructure; Sustainable Cities and Communities; Reduced Inequalities; through to Climate Action.
Achieving inclusive growth means making pension and medical insurance systems more extensive, creating more affordable housing, and increased investment in education. From an infrastructure perspective, water and power
projects are estimated to grow most quickly. This has profound implications for the world’s ability to achieve a 2 degrees scenario, with technology shifts and effective transfer of leading global technology a critical input for urban infrastructure decision-making. Any shortfall in financing would be a major drag on future growth.
Impact on investment capital allocation
A rapidly growing consuming class as wealth increases is well known but still material for investment capital allocation. Asia-Pacific’s consuming class will increase from 552 million households today to 1.2 billion households by 2030 according to McKinsey & Company research. Much of the growth in consumer markets will occur in China – 332mn households are expected to join the consuming class. Paul English, Invesco, reinforces the point, “Our global teams are always thinking about the rise of the middle-class in China and India, the resulting higher demand for goods, how that will be sourced and what market participants are in the best position to benefit from those growing populations.”
The importance of sustainable production in accessing these expanding consumer profit pools was explained by Lauren Compere, Boston Common Asset Management,
Material Trends Uncertainties Potential Impact on Economic Value
� Urbanisation: economic infrastructure investment needs; and cities as the dominant drivers of consumption
� New emerging economy business competitors benefiting from globalisation and digitalisation
� A rapidly growing consuming class in China, the rest of Asia and Latin America
� New emerging region institutions: the nexus of economic and geopolitical power, e.g., new Asian development banks, expanding trade links through One Belt, One Road, and a more important role in global governance
Projected investment shortfalls in physical and digital infrastructure
Transformational and disruptive technology shifts could significantly change city infrastructure requirements
Pursuit of inclusive and high quality growth versus unbalanced and unsustainable development
Participation in economic globalisation and common development
Business Value
� The impact of emerging economy growth on profit pools is a complex system – revenue pools will grow with higher spending, while large emerging companies in capital-intensive industries and tech-enabled smaller-enterprises increase pressure on developed world incumbents and profits
� The opening and deepening of China capital markets will have a primary impact on global financial institutions
Societal Value
� Investment in capital equipment and infrastructure improves productivity and income development, with potential to achieve income per capita goals for hundreds of millions of people
� Sustainable environmental development requires falling resource intensity, environmental controls, and green finance
� Inclusive growth requires balanced social progress, expanding pension and medical insurance systems, increased investment in education, and affordable housing
Critical Barriers
� Our estimates suggests delivering the SDGs will require funding of more than $1 trillion a year above recent trend rates of investment
� Global policy and co-ordination is required to finance and deliver the digital and physical infrastructure required in emerging countries
� Greater alignment of productivity opportunities with returns on capital is needed
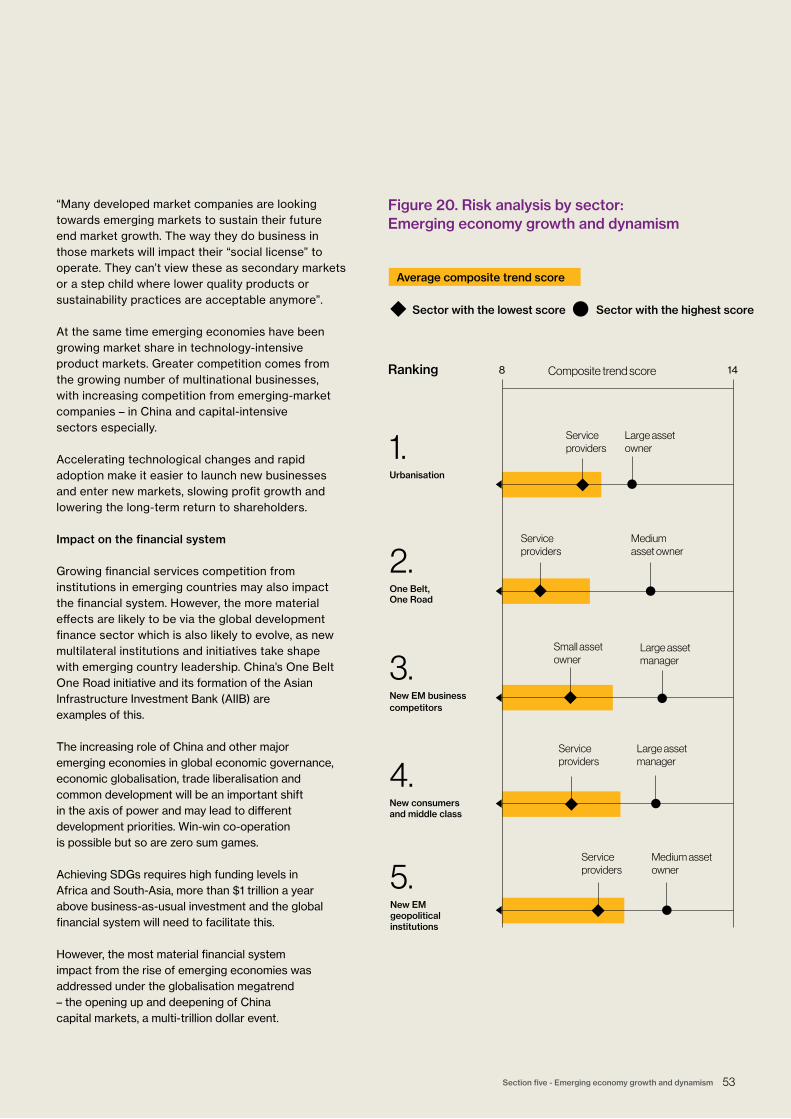
53 Section five - Emerging economy growth and dynamism
148 Composite trend score
Service providers
Service providers
Small asset owner
Service providers
Service providers
Large asset manager
Medium asset owner
Large asset owner
Medium asset owner
Large asset manager
1.
Urbanisation
2.
One Belt, One Road
3.
New EM business competitors
4.
New consumers and middle class
5.
New EM geopolitical institutions
Sector with the lowest score Sector with the highest score
Average composite trend score
Figure 20. Risk analysis by sector: Emerging economy growth and dynamism
Ranking
“Many developed market companies are looking towards emerging markets to sustain their future end market growth. The way they do business in those markets will impact their “social license” to operate. They can’t view these as secondary markets or a step child where lower quality products or sustainability practices are acceptable anymore”.
At the same time emerging economies have been growing market share in technology-intensive product markets. Greater competition comes from the growing number of multinational businesses, with increasing competition from emerging-market companies – in China and capital-intensive sectors especially.
Accelerating technological changes and rapid adoption make it easier to launch new businesses and enter new markets, slowing profit growth and lowering the long-term return to shareholders.
Impact on the financial system
Growing financial services competition from institutions in emerging countries may also impact the financial system. However, the more material effects are likely to be via the global development finance sector which is also likely to evolve, as new multilateral institutions and initiatives take shape with emerging country leadership. China’s One Belt One Road initiative and its formation of the Asian Infrastructure Investment Bank (AIIB) are examples of this.
The increasing role of China and other major emerging economies in global economic governance, economic globalisation, trade liberalisation and common development will be an important shift in the axis of power and may lead to different development priorities. Win-win co-operation is possible but so are zero sum games.
Achieving SDGs requires high funding levels in Africa and South-Asia, more than $1 trillion a year above business-as-usual investment and the global financial system will need to facilitate this.
However, the most material financial system impact from the rise of emerging economies was addressed under the globalisation megatrend – the opening up and deepening of China capital markets, a multi-trillion dollar event.
54 willistowerswatson.com
A systems view of megatrends
Section six
Studying the investment ecosystem, not just the markets, is critical to anticipate some transformational changes, especially given the accelerating pace of change.
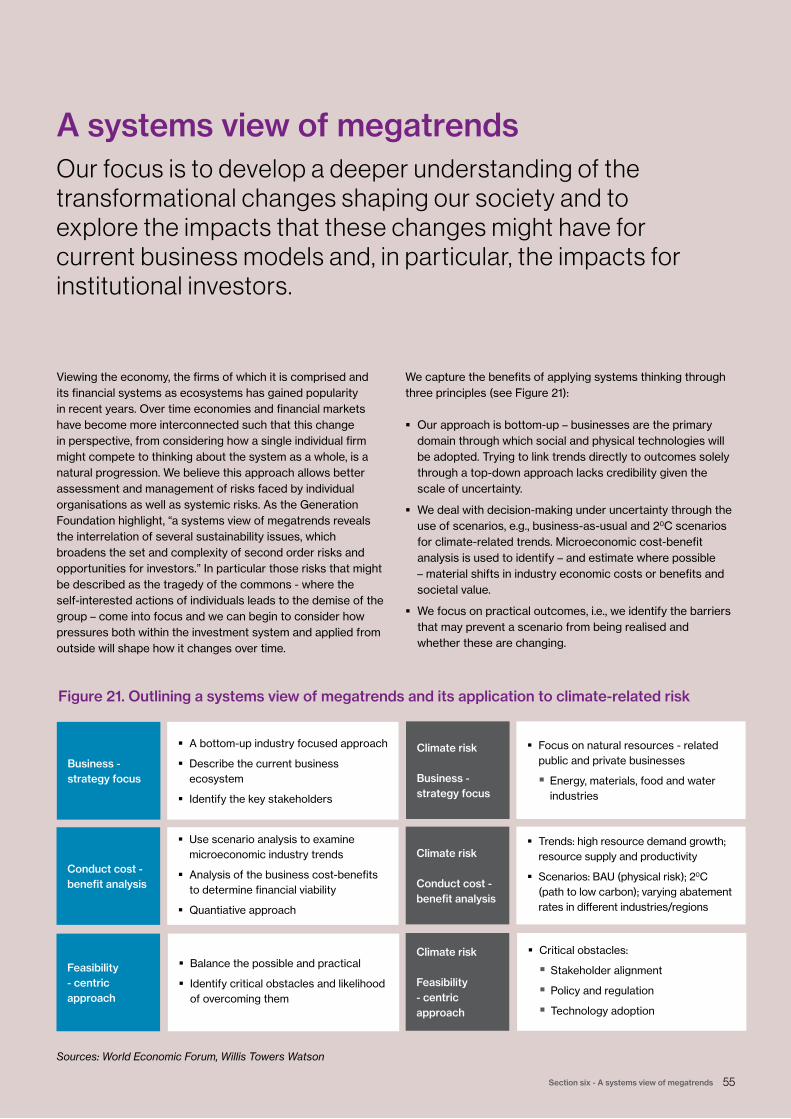
55 Section six - A systems view of megatrends
Viewing the economy, the firms of which it is comprised and its financial systems as ecosystems has gained popularity in recent years. Over time economies and financial markets have become more interconnected such that this change in perspective, from considering how a single individual firm might compete to thinking about the system as a whole, is a natural progression. We believe this approach allows better assessment and management of risks faced by individual organisations as well as systemic risks. As the Generation Foundation highlight, “a systems view of megatrends reveals the interrelation of several sustainability issues, which broadens the set and complexity of second order risks and opportunities for investors.” In particular those risks that might be described as the tragedy of the commons - where the self-interested actions of individuals leads to the demise of the group – come into focus and we can begin to consider how pressures both within the investment system and applied from outside will shape how it changes over time.
A systems view of megatrendsOur focus is to develop a deeper understanding of the transformational changes shaping our society and to explore the impacts that these changes might have for current business models and, in particular, the impacts for institutional investors.
We capture the benefits of applying systems thinking through three principles (see Figure 21):
� Our approach is bottom-up – businesses are the primary domain through which social and physical technologies will be adopted. Trying to link trends directly to outcomes solely through a top-down approach lacks credibility given the scale of uncertainty.
� We deal with decision-making under uncertainty through the use of scenarios, e.g., business-as-usual and 20C scenarios for climate-related trends. Microeconomic cost-benefit analysis is used to identify – and estimate where possible – material shifts in industry economic costs or benefits and societal value.
� We focus on practical outcomes, i.e., we identify the barriers that may prevent a scenario from being realised and whether these are changing.
Business - strategy focus
Climate risk
Business - strategy focus
� A bottom-up industry focused approach
� Describe the current business ecosystem
� Identify the key stakeholders
� Focus on natural resources - related public and private businesses
� Energy, materials, food and water industries
� Use scenario analysis to examine microeconomic industry trends
� Analysis of the business cost-benefits to determine financial viability
� Quantiative approach
� Trends: high resource demand growth; resource supply and productivity
� Scenarios: BAU (physical risk); 20C (path to low carbon); varying abatement rates in different industries/regions
� Balance the possible and practical
� Identify critical obstacles and likelihood of overcoming them
� Critical obstacles:
� Stakeholder alignment
� Policy and regulation
� Technology adoption
Conduct cost - benefit analysis
Climate risk
Conduct cost - benefit analysis
Feasibility - centric approach
Climate risk
Feasibility - centric approach
Figure 21. Outlining a systems view of megatrends and its application to climate-related risk
Sources: World Economic Forum, Willis Towers Watson
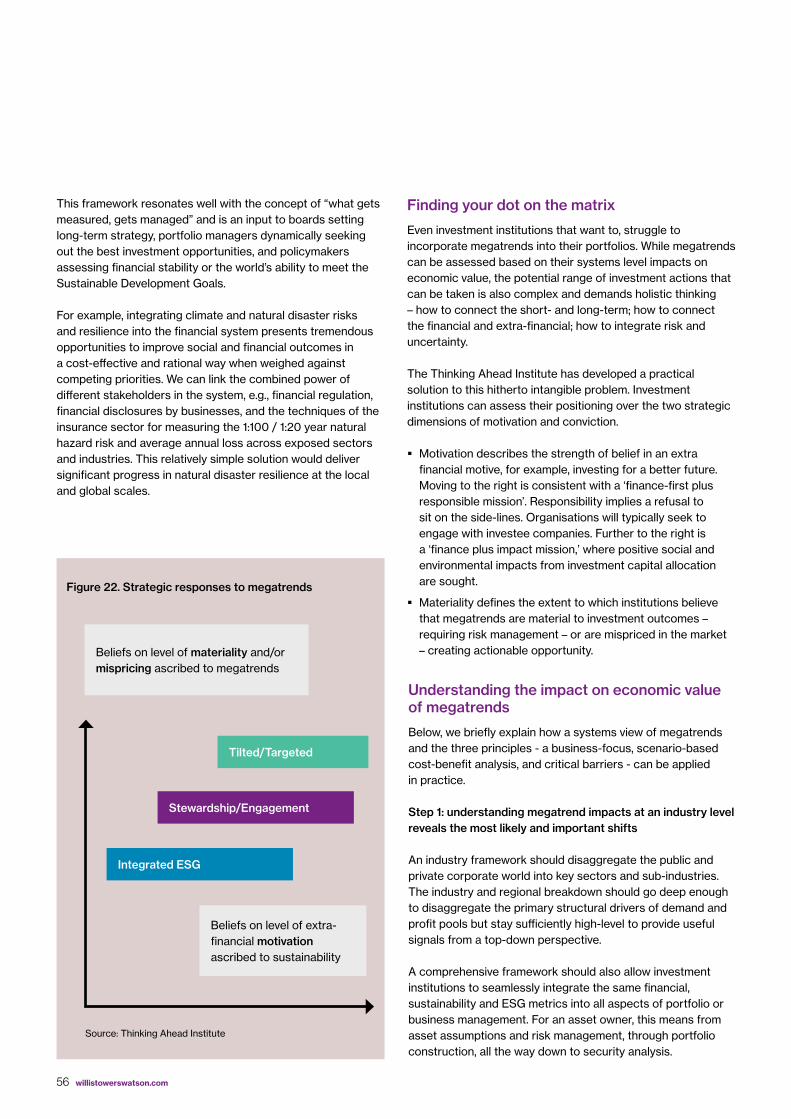
56 willistowerswatson.com
This framework resonates well with the concept of “what gets measured, gets managed” and is an input to boards setting long-term strategy, portfolio managers dynamically seeking out the best investment opportunities, and policymakers assessing financial stability or the world’s ability to meet the Sustainable Development Goals.
For example, integrating climate and natural disaster risks and resilience into the financial system presents tremendous opportunities to improve social and financial outcomes in a cost-effective and rational way when weighed against competing priorities. We can link the combined power of different stakeholders in the system, e.g., financial regulation, financial disclosures by businesses, and the techniques of the insurance sector for measuring the 1:100 / 1:20 year natural hazard risk and average annual loss across exposed sectors and industries. This relatively simple solution would deliver significant progress in natural disaster resilience at the local and global scales.
Understanding the impact on economic value of megatrends
Below, we briefly explain how a systems view of megatrends and the three principles - a business-focus, scenario-based cost-benefit analysis, and critical barriers - can be applied in practice.
Step 1: understanding megatrend impacts at an industry level reveals the most likely and important shifts
An industry framework should disaggregate the public and private corporate world into key sectors and sub-industries. The industry and regional breakdown should go deep enough to disaggregate the primary structural drivers of demand and profit pools but stay sufficiently high-level to provide useful signals from a top-down perspective.
A comprehensive framework should also allow investment institutions to seamlessly integrate the same financial, sustainability and ESG metrics into all aspects of portfolio or business management. For an asset owner, this means from asset assumptions and risk management, through portfolio construction, all the way down to security analysis.
Figure 22. Strategic responses to megatrends
Beliefs on level of materiality and/or mispricing ascribed to megatrends
Beliefs on level of extra-financial motivation ascribed to sustainability
Tilted/Targeted
Stewardship/Engagement
Integrated ESG
Source: Thinking Ahead Institute
Finding your dot on the matrix
Even investment institutions that want to, struggle to incorporate megatrends into their portfolios. While megatrends can be assessed based on their systems level impacts on economic value, the potential range of investment actions that can be taken is also complex and demands holistic thinking – how to connect the short- and long-term; how to connect the financial and extra-financial; how to integrate risk and uncertainty.
The Thinking Ahead Institute has developed a practical solution to this hitherto intangible problem. Investment institutions can assess their positioning over the two strategic dimensions of motivation and conviction.
� Motivation describes the strength of belief in an extra financial motive, for example, investing for a better future. Moving to the right is consistent with a ‘finance-first plus responsible mission’. Responsibility implies a refusal to sit on the side-lines. Organisations will typically seek to engage with investee companies. Further to the right is a ‘finance plus impact mission,’ where positive social and environmental impacts from investment capital allocation are sought.
� Materiality defines the extent to which institutions believe that megatrends are material to investment outcomes – requiring risk management – or are mispriced in the market – creating actionable opportunity.
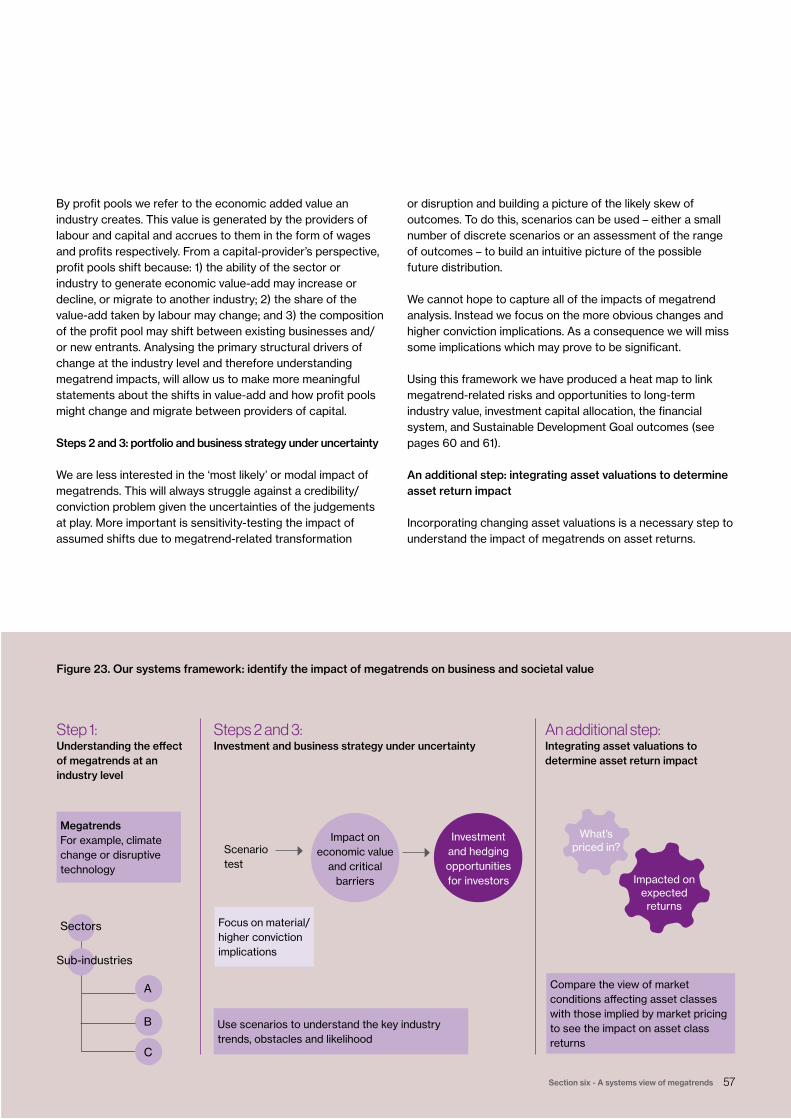
57 Section six - A systems view of megatrends
By profit pools we refer to the economic added value an industry creates. This value is generated by the providers of labour and capital and accrues to them in the form of wages and profits respectively. From a capital-provider’s perspective, profit pools shift because: 1) the ability of the sector or industry to generate economic value-add may increase or decline, or migrate to another industry; 2) the share of the value-add taken by labour may change; and 3) the composition of the profit pool may shift between existing businesses and/or new entrants. Analysing the primary structural drivers of change at the industry level and therefore understanding megatrend impacts, will allow us to make more meaningful statements about the shifts in value-add and how profit pools might change and migrate between providers of capital.
Steps 2 and 3: portfolio and business strategy under uncertainty
We are less interested in the ‘most likely’ or modal impact of megatrends. This will always struggle against a credibility/conviction problem given the uncertainties of the judgements at play. More important is sensitivity-testing the impact of assumed shifts due to megatrend-related transformation
Figure 23. Our systems framework: identify the impact of megatrends on business and societal value
Step 1: Understanding the effect of megatrends at an industry level
Megatrends For example, climate change or disruptive technology
Focus on material/higher conviction implications
Sectors
Sub-industries
Impact on economic value
and critical barriers
Scenario test
Investment and hedging opportunities for investors
What’s priced in?
Impacted on expected returns
Use scenarios to understand the key industry trends, obstacles and likelihood
Compare the view of market conditions affecting asset classes with those implied by market pricing to see the impact on asset class returns
Steps 2 and 3: Investment and business strategy under uncertainty
An additional step: Integrating asset valuations to determine asset return impact
A
B
C
or disruption and building a picture of the likely skew of outcomes. To do this, scenarios can be used – either a small number of discrete scenarios or an assessment of the range of outcomes – to build an intuitive picture of the possible future distribution.
We cannot hope to capture all of the impacts of megatrend analysis. Instead we focus on the more obvious changes and higher conviction implications. As a consequence we will miss some implications which may prove to be significant.
Using this framework we have produced a heat map to link megatrend-related risks and opportunities to long-term industry value, investment capital allocation, the financial system, and Sustainable Development Goal outcomes (see pages 60 and 61).
An additional step: integrating asset valuations to determine asset return impact
Incorporating changing asset valuations is a necessary step to understand the impact of megatrends on asset returns.
58 willistowerswatson.com
Almost all financial assets provide access to a stream of cashflows, which can be discounted back at some rate to give a present value or price. By setting the present value equal to the current asset price and reversing the equation, it is possible to derive the stream of cashflow and fundamental conditions currently discounted in the market price. By comparing these conditions with our own views, we can make meaningful and quantifiable statements about how our view of the world materially differs from that implied by market pricing.
Ultimately, what we are seeking to do is broadly identify the size of the impact of sustainability risks on asset returns. Once we find a significant mispricing and have clear reasons as to why it exists, investors can determine the best implementation options to take advantage of an opportunity or hedge a risk. We seek to be approximately right rather than precisely wrong. This recognises that our goal is to gain an understanding of the material opportunities and risks for portfolios from sustainability analysis, given starting market prices.

59 Section six - A systems view of megatrends
Conclusions
It is tempting to make sweeping conclusions when it comes to determining the impact of megatrends – such as climate change, wealth and income inequality, technological advances, dysfunctional governance – on the sustainability of financial investment, the financial system, and economic development. But such conclusions lack credibility and objectivity and, therefore, struggle to support meaningful action.
There is no choice, in our opinion, but to think in detail about the socio-political, environmental, economical and industry implications of a particular trend, with an eye to extracting the most likely and important implications.
The framework set out here, in effect a modular toolkit, should be sufficiently flexible to be lifted into any portfolio or business. It enables granular analysis of the economic and industrial impact of megatrends, which is critical to understanding and measuring them.
This report sets out to lift the financial industry’s awareness of megatrends and highlight our key findings. A second phase report will set out detailed trend-by-trend analysis and results.
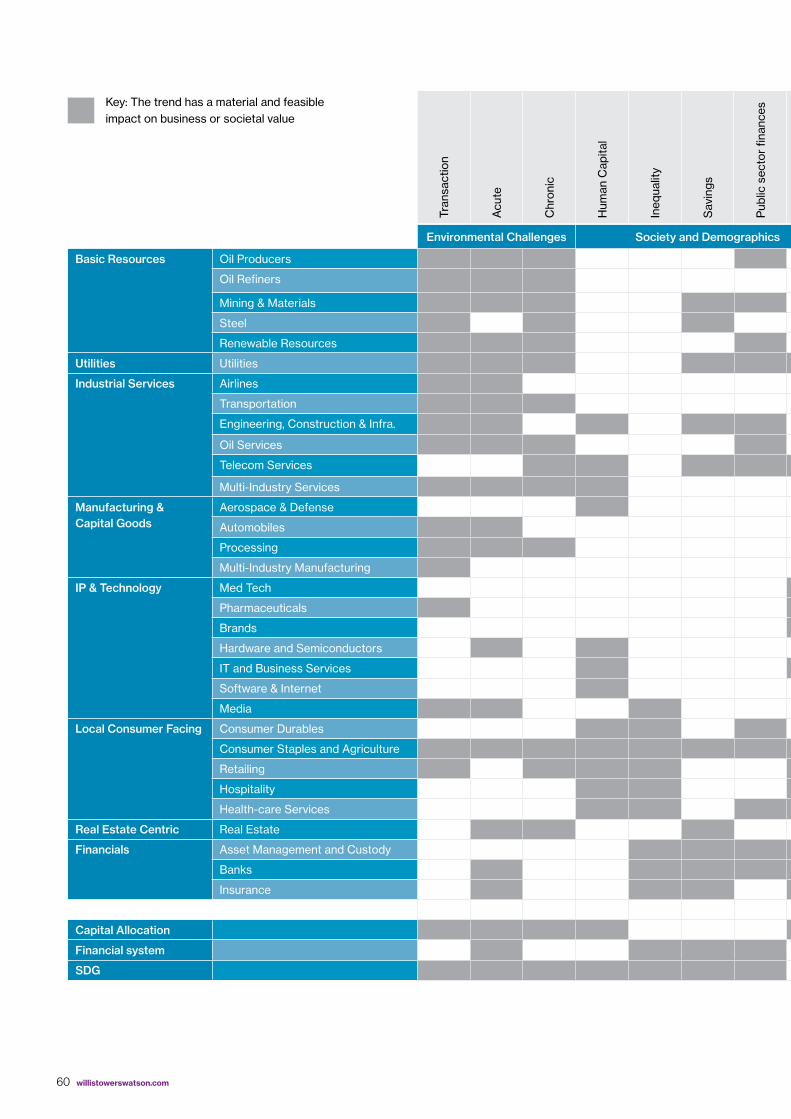
60 willistowerswatson.com
Tran
sact
ion
Acu
te
Chr
onic
Hum
an C
apita
l
Ineq
ualit
y
Sav
ings
Pub
lic s
ecto
r fin
ance
s
Con
sum
ptio
n
Trad
e
Cap
ital fl
ows
Info
rmat
ion
flow
s
Urb
anis
atio
n
One
Bel
t O
ne R
oad
EM
com
petit
ors
EM
con
sum
ers
EM
inst
itutio
ns
Cyb
erse
curit
y
Dig
itisa
tion
Aut
omat
ion
Fin
tech
Bio
tech
Environmental Challenges Society and Demographics Globalisation Emerging Economy Growth & Dynamism Technological Advances
Basic Resources Oil Producers
Oil Refiners
Mining & Materials
Steel
Renewable Resources
Utilities Utilities
Industrial Services Airlines
Transportation
Engineering, Construction & Infra.
Oil Services
Telecom Services
Multi-Industry Services
Manufacturing & Capital Goods
Aerospace & Defense
Automobiles
Processing
Multi-Industry Manufacturing
IP & Technology Med Tech
Pharmaceuticals
Brands
Hardware and Semiconductors
IT and Business Services
Software & Internet
Media
Local Consumer Facing Consumer Durables
Consumer Staples and Agriculture
Retailing
Hospitality
Health-care Services
Real Estate Centric Real Estate
Financials Asset Management and Custody
Banks
Insurance
Capital Allocation
Financial system
SDG
Key: The trend has a material and feasible impact on business or societal value
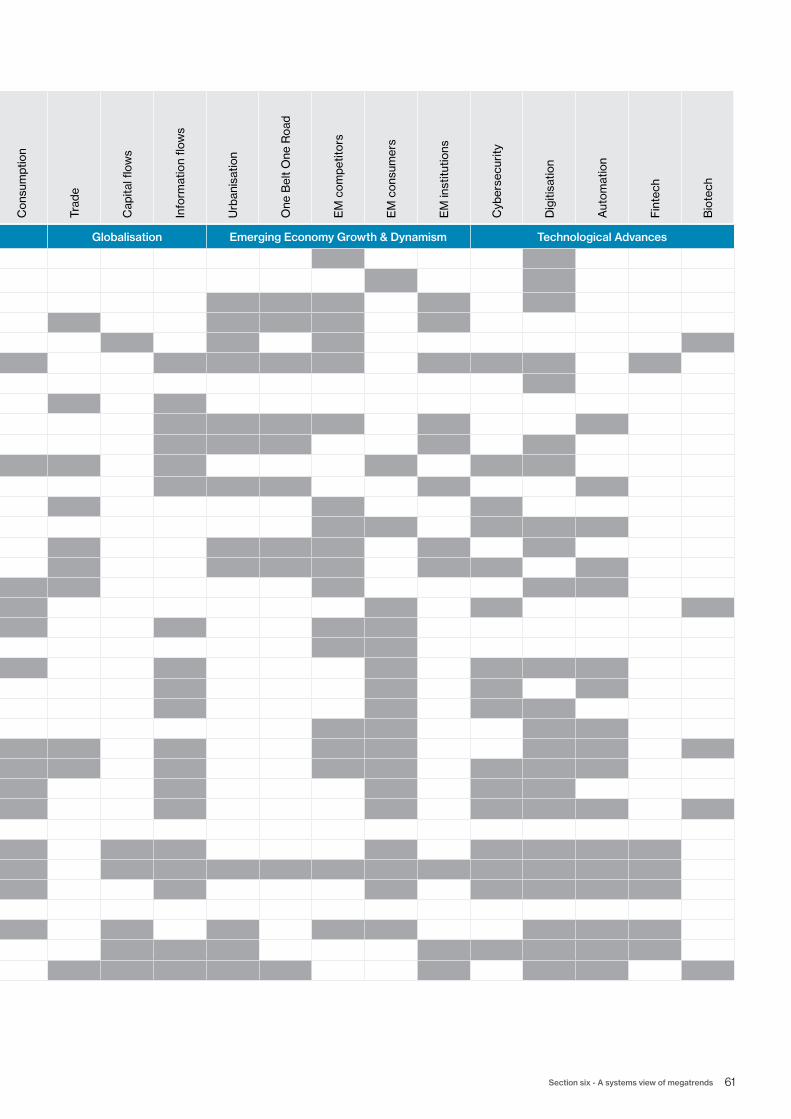
61 Section six - A systems view of megatrends
Tran
sact
ion
Acu
te
Chr
onic
Hum
an C
apita
l
Ineq
ualit
y
Sav
ings
Pub
lic s
ecto
r fin
ance
s
Con
sum
ptio
n
Trad
e
Cap
ital fl
ows
Info
rmat
ion
flow
s
Urb
anis
atio
n
One
Bel
t O
ne R
oad
EM
com
petit
ors
EM
con
sum
ers
EM
inst
itutio
ns
Cyb
erse
curit
y
Dig
itisa
tion
Aut
omat
ion
Fin
tech
Bio
tech
Environmental Challenges Society and Demographics Globalisation Emerging Economy Growth & Dynamism Technological Advances
Basic Resources Oil Producers
Oil Refiners
Mining & Materials
Steel
Renewable Resources
Utilities Utilities
Industrial Services Airlines
Transportation
Engineering, Construction & Infra.
Oil Services
Telecom Services
Multi-Industry Services
Manufacturing & Capital Goods
Aerospace & Defense
Automobiles
Processing
Multi-Industry Manufacturing
IP & Technology Med Tech
Pharmaceuticals
Brands
Hardware and Semiconductors
IT and Business Services
Software & Internet
Media
Local Consumer Facing Consumer Durables
Consumer Staples and Agriculture
Retailing
Hospitality
Health-care Services
Real Estate Centric Real Estate
Financials Asset Management and Custody
Banks
Insurance
Capital Allocation
Financial system
SDG

62 willistowerswatson.com
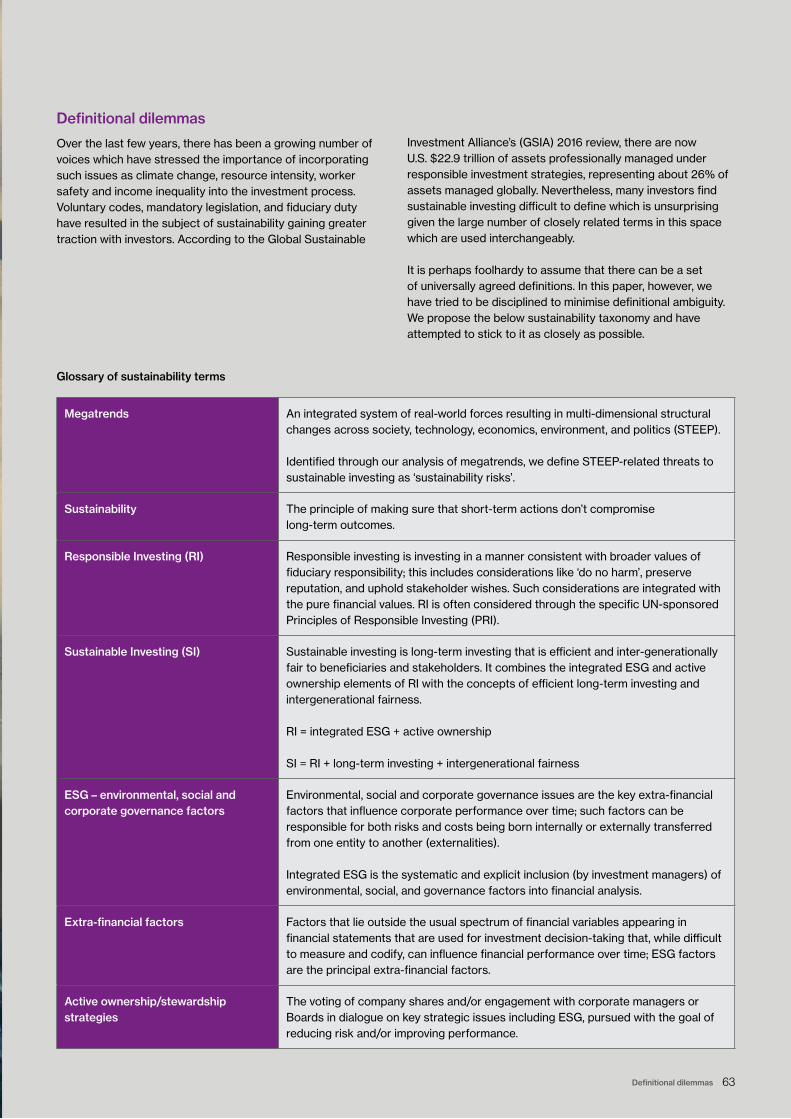
63 Definitional dilemmas
Definitional dilemmas
Over the last few years, there has been a growing number of voices which have stressed the importance of incorporating such issues as climate change, resource intensity, worker safety and income inequality into the investment process. Voluntary codes, mandatory legislation, and fiduciary duty have resulted in the subject of sustainability gaining greater traction with investors. According to the Global Sustainable
Investment Alliance’s (GSIA) 2016 review, there are now U.S. $22.9 trillion of assets professionally managed under responsible investment strategies, representing about 26% of assets managed globally. Nevertheless, many investors find sustainable investing difficult to define which is unsurprising given the large number of closely related terms in this space which are used interchangeably.
It is perhaps foolhardy to assume that there can be a set of universally agreed definitions. In this paper, however, we have tried to be disciplined to minimise definitional ambiguity. We propose the below sustainability taxonomy and have attempted to stick to it as closely as possible.
Glossary of sustainability terms
Megatrends An integrated system of real-world forces resulting in multi-dimensional structural changes across society, technology, economics, environment, and politics (STEEP).
Identified through our analysis of megatrends, we define STEEP-related threats to sustainable investing as ‘sustainability risks’.
Sustainability The principle of making sure that short-term actions don’t compromise long-term outcomes.
Responsible Investing (RI) Responsible investing is investing in a manner consistent with broader values of fiduciary responsibility; this includes considerations like ‘do no harm’, preserve reputation, and uphold stakeholder wishes. Such considerations are integrated with the pure financial values. RI is often considered through the specific UN-sponsored Principles of Responsible Investing (PRI).
Sustainable Investing (SI) Sustainable investing is long-term investing that is efficient and inter-generationally fair to beneficiaries and stakeholders. It combines the integrated ESG and active ownership elements of RI with the concepts of efficient long-term investing and intergenerational fairness.
RI = integrated ESG + active ownership
SI = RI + long-term investing + intergenerational fairness
ESG – environmental, social and corporate governance factors
Environmental, social and corporate governance issues are the key extra-financial factors that influence corporate performance over time; such factors can be responsible for both risks and costs being born internally or externally transferred from one entity to another (externalities).
Integrated ESG is the systematic and explicit inclusion (by investment managers) of environmental, social, and governance factors into financial analysis.
Extra-financial factors Factors that lie outside the usual spectrum of financial variables appearing in financial statements that are used for investment decision-taking that, while difficult to measure and codify, can influence financial performance over time; ESG factors are the principal extra-financial factors.
Active ownership/stewardship strategies
The voting of company shares and/or engagement with corporate managers or Boards in dialogue on key strategic issues including ESG, pursued with the goal of reducing risk and/or improving performance.

64 willistowerswatson.com

65
For further information regarding this publication please contact:
Global Head of Asset Research David Hoile +44 20 7170 2144 [email protected]
Financial Institutions Industry Jagdev Kenth +44 20 3124 8560 [email protected]
Global Head of Sustainability Lucy Thomas +61 2 9253 3167 [email protected]

66 willistowerswatson.com
Willis Limited, Registered number: 181116 England and Wales.Registered address: 51 Lime Street, London, EC3M 7DQ. A Lloyd’s Broker. Authorised and regulated by the Financial Conduct Authority for its general insurance mediation activities only. WTW20850/12/17
willistowerswatson.com/social-media
About Willis Towers WatsonWillis Towers Watson (NASDAQ: WLTW) is a leading global advisory, broking and solutions company that helps clients around the world turn risk into a path for growth. With roots dating to 1828, Willis Towers Watson has 40,000 employees serving more than 140 countries. We design and deliver solutions that manage risk, optimize benefits, cultivate talent, and expand the power of capital to protect and strengthen institutions and individuals. Our unique perspective allows us to see the critical intersections between talent, assets and ideas — the dynamic formula that drives business performance. Together, we unlock potential. Learn more at willistowerswatson.com.