Embed Size (px)
Citation preview

Respiratory metabolism during low oxygen stress 1
2 Corresponding author Carla Antoacutenio 3 Address Carla Antoacutenio Plant Metabolomics Laboratory Instituto de Tecnologia Quiacutemica e Bioloacutegica 4 Antoacutenio Xavier-Universidade Nova de Lisboa (ITQB-UNL) Avenida da Repuacuteblica 2780-157 Oeiras 5 Portugal 6 Telephone +351 21 446 9634 7 E-mail antonioitqbunlpt 8 9 10 11 12 13 14 15 Funding 16 17 This work was supported by the Max Planck Society and the Federal Ministry of Education and Research 18 (BMBF HydromicPro) A M L and H D were supported by the Ministegravere de la Recherche et 19 Technologies (MRT) and QUALISEM program funded by Reacutegion des Pas de la Loire C A acknowledges 20 support from the FCT Investigator programme (IF003762012CP0165CT0003) by Fundaccedilatildeo para a 21 Ciecircncia e a Tecnologia and the ITQB research unit GREEN-it ldquoBioresources for sustainabilityrdquo 22 (UIDMulti045512013) 23 24 25 26 27 28 29 30 31 32 33 34 35 36 37 38
Plant Physiology Preview Published on November 9 2015 as DOI101104pp1500266
Copyright 2015 by the American Society of Plant Biologists
wwwplantphysiolorgon November 8 2018 - Published by Downloaded from Copyright copy 2015 American Society of Plant Biologists All rights reserved
2
Regulation of primary metabolism in response to low oxygen availability as revealed by carbon 39 and nitrogen isotope redistribution 40 41 Carla Antoacutenio12sectDagger Carola Paumlpke1sect Marcio Rocha13 Houssein Diab4 Anis M Limami45 Toshihiro 42 Obata6 Alisdair R Fernie6 and Joost T van Dongen17 43 44 1 Energy Metabolism Group Max Planck Institute of Molecular Plant Physiology Am Muumlhlenberg 1 D-45
14476 Potsdam-Golm Germany 46 2 Plant Metabolomics Laboratory Instituto de Tecnologia Quiacutemica e Bioloacutegica Antoacutenio Xavier- 47
Universidade Nova de Lisboa (ITQB-UNL) Avenida da Repuacuteblica 2780-157 Oeiras Portugal 48 3 Departamento de Produccedilatildeo Animal e Vegetal Faculdade de Ciecircncias Agraacuterias Universidade Federal do 49
Amazonas Manaus AM 69082-653 Brazil 50 4 University of Angers UMR 1345 IRHS SFR 4207 QUASAV 2 Bd Lavoisier F-49045 Angers - France 51 5 INRA UMR 1345 IRHS SFR 4207 QUASAV 2 Bd Lavoisier F-49045 Angers - France 52 6 Central Metabolism Group Max Planck Institute of Molecular Plant Physiology Am Muumlhlenberg 1 D-53
14476 Potsdam-Golm Germany 54 7 Institute for Biology I RWTH Aachen University Worringerweg 1 D-52056 Aachen Germany 55 sect These authors equally contributed to this work 56 Dagger Corresponding author 57 58 59 60 During low oxygen stress activation of alanine and GABA-metabolism and bifurcation of the TCA cycle 61 explains the down-regulation of respiratory oxygen consumption 62 63 64 65 66 67 68 69 70 71 72 73 74 75
wwwplantphysiolorgon November 8 2018 - Published by Downloaded from Copyright copy 2015 American Society of Plant Biologists All rights reserved
ABSTRACT 76 77 Based on enzyme activity assays and metabolic responses to waterlogging of the legume Lotus japonicus 78 it was previously suggested that during hypoxia the TCA cycle switches to a non-cyclic operation mode 79 Hypotheses were postulated to explain the alternative metabolic pathways involved but as yet direct 80 analysis of the relative redistribution of label through the corresponding pathways were not evaluated 81 Here we describe the use of stable isotope labelling experiments for studying metabolism under hypoxia 82 using wild-type roots of the crop legume soybean (Glycine max) 13C-pyruvate labelling was performed to 83 compare metabolism through the TCA cycle fermentation alanine metabolism and the γ-amino butyric 84 acid (GABA) shunt whilst 13C-glutamate and 15N-ammonium labelling were performed to address the 85 metabolism via glutamate to succinate Following these labellings the time course for the redistribution of 86 the 13C15N label throughout the metabolic network was evaluated with gas chromatography time-of-flight 87 mass spectrometry (GC-TOF-MS) Our combined labelling data suggest the inhibition of the TCA-cycle 88 enzyme succinate dehydrogenase (SDH) also known as Complex-II of the mitochondrial electron 89 transport chain providing support for the bifurcation of the cycle and the downregulation of the rate of 90 respiration measured during hypoxic stress Moreover up-regulation of the GABA shunt and alanine 91 metabolism explained the accumulation of succinate and alanine during hypoxia 92
93
wwwplantphysiolorgon November 8 2018 - Published by Downloaded from Copyright copy 2015 American Society of Plant Biologists All rights reserved
4
INTRODUCTION 94 95 Plants are sessile unable to relocate when exposed to diverse environmental and seasonal stimuli hence 96 must be able to respond rapidly to survive stress conditions Flooding or waterlogging of the soil is a 97 common environmental condition which can greatly affect crop production and quality by blocking the 98 entry of oxygen into the soil so that roots and other below-ground organs cannot maintain respiration 99 During recent decades the number of extreme floodings has strongly increased which is especially tragic 100 since most arable land world wide is located in regions that are threatened by regular flooding events 101 (Voesenek and Bailey-Serres 2015) 102 103 In plant heterotrophic tissues respiratory metabolism is comprised of various pathways including 104 glycolysis the mitochondrial tricarboxylic acid (TCA) cycle and the mitochondrial electron transport chain 105 Under normal conditions the conversion of glucose to pyruvate in the cytosol involves an initial input of 106 ATP and produces the reduced cofactor NADH The reactions of the TCA cycle occur within the 107 mitochondrial matrix and lead to the complete oxidation of pyruvate moving electrons from organic acids 108 to the oxidized redox cofactors NAD+ and FAD forming the reducing equivalents NADH and FADH2 and 109 concomitantly releasing carbon dioxide (Tovar-Meacutendez et al 2003 Millar et al 2011) Finally the 110 reduced cofactors generated during glycolysis and the TCA cycle are subsequently oxidized by the 111 mitochondrial electron transport chain to fuel ATP synthesis by a process known as oxidative 112 phosphorylation (Fernie et al 2004 Plaxton and Podesta 2006) The TCA-cycle turnover rate depends 113 greatly on the rate of NADH reoxidation by the mitochondrial electron transport chain and on the cellular 114 rate of ATP utilisation (Plaxton and Podesta 2006) Besides supporting ATP synthesis the reactions of 115 the TCA cycle also contribute to the production of key metabolic intermediates for use in many other 116 fundamental biosynthetic processes elsewhere in the cell (Fernie et al 2004 Sweetlove et al 2010 van 117 Dongen 2011 Arauacutejo et al 2012) Nevertheless the control and regulation of the carbon flux through the 118 TCA cycle is still poorly understood in plants and non-cyclic modes have been described to operate under 119 certain circumstances (Rocha et al 2010 Sweetlove et al 2010 Arauacutejo et al 2012) 120 121 Upon hypoxia respiratory energy (ATP) production via oxidative phosphorylation by the mitochondiral 122 electron transport chain goes down To compensate for this the glycolytic flux increases and glucose is 123 consumed faster in an attempt to produce ATP via the glycolytic pathway a process known as the Pasteur 124 effect To survive short-term hypoxia during flooding or waterlogging plants must generate sufficient ATP 125 and regenerate NADP+ and NAD+ which is required for glycolysis (Narsai et al 2011 van Dongen et al 126 2011) In addition to the accumulation of ethanol and lactate in oxygen-deprived plant tissues metabolites 127 such as alanine succinate and γ-amino butyric acid (GABA) have also been shown to accumulate (Sousa 128 and Sodek 2003 van Dongen et al 2009 Kreuzwieser et al 2009 Rocha et al 2010 Zabalza et al 129 2011) although hardly anything is known about the fate of these products of hypoxic metabolism 130
wwwplantphysiolorgon November 8 2018 - Published by Downloaded from Copyright copy 2015 American Society of Plant Biologists All rights reserved
5
However the relative abundance of these products of hypoxic metabolism vary between plant species 131 genotypes and tissues and can change throughout the course of oxygen limitation stress as well (Narsai 132 et al 2011) 133 134 A model describing metabolic changes during hypoxia has previously been described for waterlogged 135 roots of the highly flood-tolerant model crop legume Lotus japonicus (Rocha et al 2010) upon 136 waterlogging the rate of pyruvate production is enhanced due to an activation of glycolysis (Pasteur 137 effect) and concomitant production of ATP via substrate-level phosphorylation At the same time the 138 fermentation pathway is activated with the accumulation of lactate via lactate dehydrogenase and ethanol 139 via two subsequent reactions catalysed by pyruvate decarboxylase and alcohol dedydrogenase (Tadege 140 et al 1999) The amount of pyruvate produced can be reduced via alanine amino transferease (AlaAT) 141 which catalyzes the reversible reaction interconverting pyruvate and glutamate to alanine and 2-142 oxoglutarate (2OG) Concomitantly 2OG was suggested to re-enter the TCA cycle to be used to produce 143 another ATP and also succinate which accumulates in the cell (Rocha et al 2010) This alanine pathway 144 provides a means for the role of alanine accumulation during hypoxia via reorganisation of the TCA cycle 145 Furthermore given that use of this strategy prevents pyruvate accumulation continued operation of 146 glycolysis during waterlogging can occur 147 148 It should be noted however that measurements of metabolite levels alone do not provide information 149 about the actual activity of the metabolic pathways involved Furthermore the previous studies did not 150 reveal which enzymes of the TCA cycle change their activity that leads to reorganisation of the TCA cycle 151 To overcome this analysis of metabolism using isotope-labelled substrates has proven to be essential for 152 understanding the control and regulation of metabolic networks and it has been often observed that 153 significant changes in C-flow are sometimes associated with only small adjustments in metabolite 154 abundance (Schwender et al 2004 Ratcliffe and Shachar-Hill 2006) Metabolomics studies that require 155 extensive metabolite labelling utilize uniformly labelled stable isotope tracers Alternatively detailed 156 analysis of central carbon metabolism can make use of positional labelling as well Following extraction of 157 labelled metabolites the 13C label redistribution is measured usually with nuclear magnetic resonance 158 (NMR) or gas chromatography coupled to mass spectrometry (GC-MS) methods (Jorge et al 2015) 159 Schwender and Ohlrogge (2002) used both labelling approaches to investigate embryo development in 160 Brassica napus seeds While uniformly labelled 13C6-glucose and 13C12-sucrose were applied to determine 161 the metabolic flux through the major pathways of carbon metabolism positionally labelled 12-13C-glucose 162 was used to specifically outline the glycolyticoxidative pentose phosphate pathway network during 163 embryo development (Schwender and Ohlrogge 2002) GC-MS analysis was used in this study to 164 evaluate the 13C-enrichment and isotopomer composition In earlier studies of hypoxic metabolism 165 positionally labelled 1-13C-glucose was used to specifically investigate energy metabolism and pH 166 regulation in hypoxic maize root tips (Roberts et al 1992 Edwards et al 1998) 167
wwwplantphysiolorgon November 8 2018 - Published by Downloaded from Copyright copy 2015 American Society of Plant Biologists All rights reserved
6
In our study we performed stable isotope labelling experiments using wild-type soybean roots (Glycine 168 max) in order to better understand the dynamics of metabolism in operation in plant cells under hypoxic 169 conditions For this we used fully labelled 13C and 15N tracers rather than positional labelling as this 170 allowed us to cover a broad view of the central carbon and nitrogen metabolic network The labelling 171 pattern of metabolites was subsequently measured with GC-TOF-MS Our studies confirm the activity of 172 alanine metabolism while revealing the parallel activity of the GABA shunt Results provided evidence 173 that the bifurcation of the TCA cycle results from the inhibition of the TCA-cycle enzyme succinate 174 dehydrogenase (SDH) also known as Complex-II of the mitochondrial electron transport chain (mETC) 175
176 177
wwwplantphysiolorgon November 8 2018 - Published by Downloaded from Copyright copy 2015 American Society of Plant Biologists All rights reserved
7
RESULTS 178
179
Metabolite profiling and isotope redistribution analysis 180
To obtain an overview of the metabolic responses of soybean roots under our experimental conditions we 181 first carried out a broad metabolite profiling study with GC-TOF-MS (Lisec et al 2006) (Figure 1) Using 182 this approach over 30 metabolites from the central primary metabolism were characterized including 183 sugars amino acids and intermediates of the TCA cycle Figure 1 shows the changes of selected primary 184 metabolites in soybean root extracts expressed as the ratio between values obtained with hypoxia and 185 normoxia conditions Significant accumulation (Student t-test plt005) of fructose glucose lactate valine 186 leucine serine phenylalanine alanine and proline was observed in soybean roots after 6 h of hypoxic 187 treatment (Figure 1 and Table I) Aspartate asparagine and the organic acid fumarate were shown to 188 significantly decrease after 6 h of hypoxic treatment (Student t-test plt005) (Figure 1 and Table I) These 189 data showed that after 6 h an increase in many amino acids was observed in hypoxic soybean roots whilst 190 intermediates of the TCA cycle remained mostly unchanged except for succinate which accumulated 191
192 Isotope tracer experiments were next performed by assessing how 13C-isotopes were redistributed among 193 metabolites following incubating of excised soybean roots in 13C-pyruvate or 13C-glutamate under hypoxic 194 conditions The same experiment was performed using the corresponding 12C substrates as controls to 195 assess the effect of substrate provision alone and the labelling pattern of metabolites was subsequently 196 measured with GC-TOF-MS Metabolite profiling analysis revealed that the metabolic changes induced by 197 low-oxygen were independent from the supply of labelledunlabelled substrate Similar levels of the 198 characteristic hypoxic responsive metabolites alanine GABA lactate succinate and aspartate were 199 observed in all treatments (Table I Supplemental Table SI) 200 201 The 13C-pyruvate labelling experiment revealed a rapid 13C label-incorporation into lactate and alanine 202 after 3 h of hypoxic treatment Label incoporation doubled after 6 h (Figure 2 Table II Table III 203 Supplemental Table SII) To a lesser extent 13C label was also redistributed from pyruvate to citrate and 204 2OG a process that was apparently independent of the oxygen concentration since similar levels were 205 observed under both normoxic and hypoxic conditions In addition considerable 13C-label was 206 incorporated into glutamate (via 2OG) 207 208
wwwplantphysiolorgon November 8 2018 - Published by Downloaded from Copyright copy 2015 American Society of Plant Biologists All rights reserved
8
The 13C-glutamate labelling experiment on the other hand revealed a 13C-label incorporation mainly in 209 GABA succinate and asparagine (via aspartate) immediately after 3 h of hypoxic treatment (Figure 3 210 Table IV Table V Supplemental Table SIII) The accumulation of 13C-label in succinate provides 211 additional evidence that the GABA shunt is active during hypoxia Furthermore while almost undetectable 212 13C-label was observed in fumarate under hypoxia 13C-label was observed in malate presumably by 213
wwwplantphysiolorgon November 8 2018 - Published by Downloaded from Copyright copy 2015 American Society of Plant Biologists All rights reserved
9
incorporation via oxaloacetate (OAA) which is in agreement with an anti-clockwise operation of the TCA 214 cycle during hypoxia (Figure 2 and 3) 215 216
wwwplantphysiolorgon November 8 2018 - Published by Downloaded from Copyright copy 2015 American Society of Plant Biologists All rights reserved
10
Our metabolite redistribution analysis was further investigated by performing a 15N-ammonium (15NH4+) 217
labelling experiment for 36 h to study the redistribution of nitrogen through the pathways of both glutamate 218 and alanine synthesis The 15NH4
+ labelling experiment revealed a inhibition of the reversible reaction of 219 aspartate amino transferase (AspAT) activity upon hypoxia in the direction of aspartate and asparagine 220 synthesis as only negligible amounts of 15NH4
+ were incorporated into aspartate and asparagine (Figure 221 4 Table VI Table VII Supplemental Table SIV) On the other hand during the 24 h 15NH4
+ labelling 222 period considerable incorporation of 15N-label into alanine and GABA in hypoxic soybean roots was 223 observed 224 225 Respiration Rate Measurements 226
wwwplantphysiolorgon November 8 2018 - Published by Downloaded from Copyright copy 2015 American Society of Plant Biologists All rights reserved
11
The rate of respiratory oxygen consumption was measured on soybean roots pieces in normoxic and 227 hypoxic conditions (Figure 5) Our data show a strong reduction of approximately 40 under hypoxic 228 conditions compared to normoxic conditions 229 230 231
wwwplantphysiolorgon November 8 2018 - Published by Downloaded from Copyright copy 2015 American Society of Plant Biologists All rights reserved
12
DISCUSSION 232 233 Low-oxygen stress induces a higly conserved metabolic response in plants 234 Metabolite profiling confirmed that in soybean roots a short-term hypoxic treatment (up to 6 hours) already 235 induces fermentation with an increase in lactate and alanine and several responses in most central 236 metabolites such as carbohydrates glycolytic intermediates and amino acids (Figure 1) (Sousa and 237 Sodek 2003 Bailey-Serres and Voesenek 2008 Narsai et al 2011 Bailey-Serres et al 2012) Serine 238 derived from the glycolytic intermediate 3-phosphoglycerate (3-PGA) increased and so did phenylalanine 239 (derived from phosphoenolpyruvate) and valine leucine and alanine (derived from pyruvate) The amino 240 acids glutamate and proline that are derived from the TCA-cycle intermediate 2OG increase during 241 hypoxia On the other hand the amino acids aspartate and asparagine derived from the TCA-cycle 242 intermediate OAA decrease during hypoxia We compared our metabolite profiling data to other 243 previously reported studies of different hypoxic treatments applied to root material in several plant 244 systems namely Pisum sativum (Zabalza et al 2011) Lotus japonicus (Rocha et al 2010) Arabidopsis 245 thaliana (van Dongen et al 2009) and the hybrid Populus x canescens (Kreuzwieser et al 2009) We 246 observed that most of the known metabolic changes upon hypoxia are conserved across the different 247 species analysed such as activation of fermentation with an increase in lactate alanine and the 248 accumulation of GABA and succinate (Supplemental Figure SI) We therefore suggest that conclusions 249 from soybean experiments are likely to be valid for many other plant species as well 250 251 Feeding isotope-labelled substrate does not affect the metabolic response to hypoxia 252 Even though metabolite changes in response to low oxygen concentrations suggest a regulation of 253 primary metabolism through alternative pathways such as a non-cyclic operation of the TCA cycle (Rocha 254 et al 2010) the existing data in the literature are mainly non-quantitative metabolite levels which do not 255
wwwplantphysiolorgon November 8 2018 - Published by Downloaded from Copyright copy 2015 American Society of Plant Biologists All rights reserved
13
provide final proof on the direction of the C-flow through the metabolic pathways To overcome this 256 metabolic flux analysis that make use of robust protocols for quantifying steady-state metabolic fluxes 257 have been developed and applied to reveal novel aspects of the fluxes through the TCA cycle and 258 associated pathways (Ratcliffe and Shachar-Hill 2006 Schwender et al 2004 2006 Williams et al 259 2008) Following a similar approach we performed feeding experiments utilizing uniformly stable isotope 260 labelled precursors to evaluate relative isotope redistribution within the different primary metabolic 261 pathways in hypoxic soybean roots 262 263 To check if providing additional 13C-labelled substrates to the plant tissue affected the metabolic response 264 to hypoxia we first tested for changes in the metabolite levels (both 12C and 13C-isotopes combined) in 265 soybean roots under our hypoxic conditions (Table I Supplemental Table SI) This experiment revealed 266 that the metabolite responses to hypoxia were independent from the supply of isotope-labelled substrate 267 as the changes of metabolite levels were similar in all of the experimental treatments (Table I 268 Supplemental Table SI) 269 270 Because in our experiments we used uniformly precursor substrates all pathways in which the precursor 271 is involved in will be marked Nevertheless although uniformly stable isotope experiments will provide a 272 more broad overview of changes in various metabolic pathways it will simultaneously make it more 273 difficult to specifically calculate the dynamics of the redistribution of label due to mixing of pathways 274 Alternatively the more expensive positional isotope tracers can be used The latter will give more detailed 275 information about the redistribution of label through specific pathways only However one problem with 276 positional labelled molecules is that the label can get too rapidly lost due to decarboxylation reactions to 277 provide effective information in some instances (Kruger and von Schaewen 2003) 278 Both Alanine metabolism and the GABA shunt are activated during hypoxia 279 We first addressed the isotope redistribution from 13C-labelled pyruvate through the TCA cycle 280 fermentation and alanine synthesis (Figure 2) As expected by the induction of fermentation the 281 redistribution of label from pyruvate to lactate increased strongly during hypoxia Similarly the 282 incorporation of 13C in alanine increased during hypoxic conditions In contrast the redistribution of label 283 into the TCA-cycle intermediates citrate and 2OG was not affected by the oxygen concentration whereas 284 a progressive increase of label in succinate was observed during the course of the hypoxic treatment The 285 identical profiles of label incorporation in citrate and 2OG indicate that the metabolic pathway via 286 aconitase and isocitrate dehydrogenase remains active during low-oxygen stress This observation 287 opposes to our previous suggestion that these reactions were likely inhibited during hypoxia (Rocha et al 288 2010) The feeding experiments using 13C-glutamate as precursor confirmed the suggested activation of 289 AlaAT during hypoxia and the concomitant link between 2OG and succinate metabolism by the TCA cycle 290 (Figure 3) Apparently hypoxia does not induce a complete shift between the two pathways that lead to 291
wwwplantphysiolorgon November 8 2018 - Published by Downloaded from Copyright copy 2015 American Society of Plant Biologists All rights reserved
14
2OG production but rather activates the Alanine pathway in addition to the existing TCA-cycle reactions 292 during hypoxia 293 294 In addition to the activation of the Alanine pathway both the 13C-pyruvate and 13C-glutamate feeding 295 experiments revealed considerable GABA shunt activity during hypoxia explaining also the increase in 296 redistribution of 13C to succinate during hypoxia (Figure 2 and 3) Interpretation of the fractional 297 enrichment of the metabolites from the GABA shunt revealed the following sequence after 13C-pyruvate 298 feeding for 6 h (Table III) glutamate (15) ndash GABA (11) ndash succinate (7) while after 13C-glutamate 299 feeding for 6 h the 13C enrichment was as follows (Table V) glutamate (59) ndash GABA (25) ndash succinate 300 (16) The steadily decreasing fractional enrichment of the subsequent metabolites from the GABA shunt 301 pathway are characteristic for a linear pathway and support the conclusion that the GABA shunt is active 302 upon hypoxia although a precise quantitative comparison of the activities of the Ala pathway and the 303 GABA shunt are not possible from our data Like previously shown for Medicago truncatula roots (Limami 304 et al 2008) the reaction from 2OG to glutamate is likely catalysed by glutamate synthase (GOGAT) 305 which uses glutamine along with 13C-2OG to generate a mixture of 13C- and 12C-glutamate while using 306 NADH as reducing power thus regenerating NAD+ (Figure 2 and 3) 307 308 Interpretation of the fractional enrichment sequence of the metabolites in the pathway from 2-OG to 309 succinate is more complex after 13C-glutamate feeding for 6 h (Table V) glutamate (59) ndash 2OG (21) ndash310 succinate (16) indicating that a linear pathway from 2OG produced by AlaAT to succinate is possible 311 On the other hand after 6 h of 13C-pyruvate feeding the following fractional enrichment series was 312 observed (Table III) pyruvate (89) ndash citrate (307) ndash 2OG (299) ndash succinate (717) This latter 313 series indicates that the pathway via pyruvate to 2-OG and succinate is not likely explained via a simple 314 linear reaction pathway Although it is therefore not possible to calculate exactly the relative extend of both 315 Ala and GABA pathways this provides additional evidence that the GABA shunt is involved in the 316 production of succinate during hypoxia Quantitative comparision between the activity of both pathways 317 will require the use of positional labelling in future experiments since positional labelling of precursors 318 allow much better to distinguish between specific metabolic pathways than uniformly labelled substrates 319 do (Roberts et al 1992 Edwards et al 1998) 320 321 Previously a link between GABA and the TCA cycle was discussed to be unlikely during hypoxic stress 322 because the reaction from GABA to succinate requires NAD+ which becomes limiting during hypoxic 323 conditions (Rocha et al 2010) Moreover the drop in cytosolic pH that occurs during hypoxia (Felle 324 2005) was expected to inhibit the activity of the enzyme succinate semialdehyde dehydrogenase (SSADH 325 pH optimum 9) which catalyses the reaction converting GABA to succinate (Satya Narayan and Nair 326 1989 Shelp et al 1995) However our results clearly indicate that the predicted inhibition of the GABA 327 shunt activity does not affect the isotope between GABA to succinate In contrast the data support the 328
wwwplantphysiolorgon November 8 2018 - Published by Downloaded from Copyright copy 2015 American Society of Plant Biologists All rights reserved
15
hypothesis that the consumption of protons by glutamate decarboxylase (GAD) for the production of 329 GABA can help to stabilize the cytosolic pH during exposure to different stress conditions including 330 hypoxia (Turano and Fang 1998 Shelp et al 2012) 331 332 Hypoxia leads to the inhibition of Succinate Dehydrogenase and concomitantly of respiration 333 While label in succinate accumulated during hypoxia very little 13C-label was detected in fumarate in 334 both the 13C-pyruvate and 13C-glutamate feeding experiments (Figure 2 and 3 Supplemental Figure SII) 335 In contrast 13C-incorporation in malate occured in both experiments also during hypoxia Of course 336 interpretation of isotope accumulation in the organic acids of the TCA cycle can be complicated by the 337 occurence of sometimes large pools of unlabelled metabolites in different cellular compartments or the 338 simultaneous occurence of metabolites in various metabolic pathways like malate and OAA that can also 339 be produced from pyruvate and PEP via pyruvate-orthophosphate dikinase (PPDK) and PEP carboxylase 340 (Setieacuten et al 2014) or malate production via the glyoxylate cycle Indeed expression of PPDK genes was 341 shown to be slightly upregulated in low-oxygen experiments with rice or arabidopsis (Mustroph et al 342 2010 Narsai et al 2011) indicating that the reaction from pyruvate to PEP is an option However it 343 should be noted that no conclusion can be drawn about the activity of these pathways based on these 344 gene expression data and further future experiments are required to describe the pathways that lead to 345 label accumulation in malate under hypoxia 346 347 Especially when label accumulation occurs very slowly (as for fumarate) the labelling efficiency should be 348 assessed critically For example variations in the exchange of labelled compounds between different 349 cellular compartments can conceal the redistribution of 13C through a metabolic pathway especially when 350 the concentration of labelled metabolites is low such as in the case of mitochondrial fumarate Having 351 said so the observation that 13C-label in fumarate decreased to almost undetectable values during 352 hypoxia (Table III Table V Supplemental Figure SII) can also be explained by the reduction of the 353 fumarate synthesis upon hypoxia as compared to the normoxic treatment probably as a consequence of 354 the inhibition during low-oxygen stress of the enzyme succinate dehydrogenase (SDH) also known as 355 Complex-II of the mitochondiral electron transport chain (mETC) 356 357 Inhibition of SDH will disrupt the TCA cycle which leads to a non-cyclic reaction pathway which has 358 actually been described earlier to occur in plants and green algae in response to various conditions 359 including low-oxygen availability (Vanlerberghe et al 1989 Vanlerberghe et al 1990 Vanlerberghe and 360 Turpin 1990 Vanlerberghe et al 1991 Hanning and Heldt 1993 Schwender et al 2006 Steuer et al 361 2007 Boyle and Morgan 2009 Tcherkez et al 2009 Sweetlove et al 2010 Grafahrend-Belau et al 362 2013 Ma et al 2014) Interestingly similar observations were made on the relative levels of the 363 metabolites associated with the TCA cycle in antisense SDH tomato plants which were deficient in the 364 expression of the iron-sulfur subunit of SDH (Arauacutejo et al 2011) In these transgenic lines the activity of 365
wwwplantphysiolorgon November 8 2018 - Published by Downloaded from Copyright copy 2015 American Society of Plant Biologists All rights reserved
16
the TCA cycle was clearly reduced with high accumulation of succinate in comparison to wild-type plants 366 while fumarate was not detected 367 368 The inhibition of SDH will not only affect the net output of redox equivalents by the TCA-cycle reactions 369 (NADH FADH) as substrates for the mETC but also the direct input of electrons into the mETC via SDH 370 itself As a causal response this is anticipated to result in a decrease of the activity of the mETC leading 371 to a reduction of the rate of respiratory oxygen consumption as was shown previously in plants deficient in 372 SDH expression (Arauacutejo et al 2011) Indeed inhibition of respiratory activity was measured during 373 hypoxic conditions as compared to normoxic conditions (in a buffer solution that is in equilibrium with air) 374 (Figure 5) It should be noted that the oxygen concentration in the hypoxic solution is about two orders of 375 magnitude higher than the Km for oxygen of cytochrome-c oxidase (01 ndash 015 microM) These results thus 376 provide a mechanistical explanation for the pro-active down-regulation of respiratory oxygen consumption 377 during hypoxia that was discussed previously (Geigenberger et al 2000 Geigenberger 2003 Zabalza et 378 al 2009 Gupta et al 2009 Armstrong and Becket 2011 Nikoloski and van Dongen 2011) 379 380 Alanine metabolism and the GABA shunt are activated at the expense of the production of other 381 amino acids 382 The 15NH4
+ labelling experiment was performed to study isotope redistribution through the pathways of 383 both glutamate and alanine synthesis Ammonium is assimilated into glutamine and sequentially 384 converted into glutamate Synthesis or regeneration of glutamate is an important issue in hypoxic tissues 385 to maintain AlaAT and GAD pathways These two pathways contribute to mitigate damaging effects of 386 hypoxia AlaAT contributes to save carbon derived from glycolysis by using pyruvate competitively with 387 fermentation because ethanol is released to the rhizosphere and the carbon is lost for the plant (Bailey-388 Serres and Voesenek 2008) 389 15NH4
+ labelling revealed that the reversible reaction of AspAT activity is strongly inhibited upon hypoxia in 390 the direction of aspartate synthesis confirmed by the very low 15N-label redistributed to aspartate and 391 asparagine in favour of an increased metabolic activity of AlaAT and GAD both of which use glutamate 392 as amino donor This observation is supported by the high 15N-enrichment patterns observed in alanine 393 and GABA synthesis during hypoxia (Figure 4) The slow 15N-enrichment in asparagine is furthermore in 394 agreement with its function as N storage and transport resulting in a lower N assimilation under low 395 oxygen availability A slow 15N-enrichment was also observed in serine and glycine during hypoxia 396 suggesting that the glutamateglyoxylate aminotransferase (GGAT) activity might be higher under 397 normoxia (Ricoult et al 2006 Limami et al 2008) however further directed studies will be required to 398 verify this hypothesis 399 400 Is the redox status of the cell involved in regulation of TCA cycle activity 401
wwwplantphysiolorgon November 8 2018 - Published by Downloaded from Copyright copy 2015 American Society of Plant Biologists All rights reserved
17
Evidence from our results here as well as from data from other publications (Vanlerberghe et al 1989) 402 point out that the activity of the TCA cycle is modulated when the oxygen availability to a cell decreases 403 The subsequent question that arises is how this regulation is mediated It was previously discussed that 404 hypoxia-mediated changes in the redox status of the cell could be involved in regulating low-oxygen stress 405 responses (Considine and Foyer 2014) Although it is not possible to fully answer the question on how the 406 TCA cycle is controlled upon hypoxia with our current experimental data our results provide interesting 407 indications that give rise to the hypothesis that redox-mediated control of the TCA cycle might be involved 408 409 Recently mitochondrial thioredoxins were identified as master regulators of the C-flow through the TCA 410 cycle in plants (Daloso et al 2015) Based on 13C-metabolic flux analysis in Arabidopsis thioredoxin 411 mutants and in vitro activity studies on enzymes of the TCA cycle it was shown that the activity of SDH 412 and fumarase is deactivated by reduced thioredoxin while ATP-citrate lyase (ACL) is activated Via the 413 enzyme ACL citrate is converted to acetyl-CoA and OAA in the cytosol (Klinman and Rose 1971) Here 414 OAA reacts to aspartate This pathway was previously shown to exist in soybean (Allen and Young 2013) 415 and is upregulated upon hypoxia in mammalian cells (Metallo et al 2011) However while ACL might be 416 involved in the synthesis of malate and aspartate under hypoxia it cannot explain the labelling of these 417 metabolites because the two carbons that are derived from labelled pyruvate in citrate are released as the 418 two carbon moiety by the action of ACL (Klinman and Rose 1971) Taken altogether it is reasonable to 419 suggest an hypothesis that the TCA cycle activity is modulated upon hypoxia via a redox-mediated 420 mechanism in which thioredoxin is involved 421 422 423 424 425 426 CONCLUSION 427 428 Upon hypoxia a series of drastic metabolic adaptations are initiated in plants Of these the best known is 429 the activation of fermentation and upregulation of glycolytic activity to increase the yield of ATP from the 430 glycolytic pathway Our evaluation of isotope redistribution following 13C- and 15N-feeding demonstrates 431 the existence of an alternative carbon flux that explains the accumulation of alanine GABA and succinate 432 upon hypoxia via pathways mediated by an alanine and GABA shunt These alternative pathways go 433 hand-in-hand with the bifurcation of the TCA cycle into separate oxidative and reductive pathways 434 Concomitantly the net production of redox equivalents in the mitochondria decreases which could explain 435 the reduction of respiratory oxygen consumption during hypoxic conditions Future analysis of the 436 regulation of this part of respiratory metabolism might include positional labelling experiments to provide 437
wwwplantphysiolorgon November 8 2018 - Published by Downloaded from Copyright copy 2015 American Society of Plant Biologists All rights reserved
18
more detailed information about the relative activity of the different alternative pathways that are identified 438 here 439 440 441 MATERIALS AND METHODS 442 443 Plant Material and growth conditions 444 Wild-type soybean plants (Glycine max L Merril cv IAC-17) were grown from seeds in the greenhouse 445 under natural light and temperature After two weeks of germination in the greenhouse soybean roots 446 were inoculated with Bradyrhizobium elkanii strain DSM 11554 before being transferred into pots 447 containing hydroponic culture substrate granules (Lecaton Original Fibo Exclay Deutschland) 448 Bradyrhizobium elkanii were grown in liquid culture using a medium solution composed of 05 gL KH2PO4 449 08 gL MgSO47H2O 01 gL NaCl 001 gL FeCl36H2O 08 gL yeast extract 10 gL mannitol and 5 mL 450 bromotimol blue 05 (wv) in ethanol (pH 68) prior to inoculation Plants were watered daily and supplied 451 twice a week with 200 mL N-containing nutrient solution (50 mM KNO3 05 mM KCl 025 mM KH2PO4 452 025 mM K2HPO4 10 mM MgSO4 005 mM FeEDTA and trace elements 91 μM MnCl2 0046 mM 453 H3BO3 0765 μM ZnCl2 056 μM NaMoO4 and 032 μM CuCl2 as previously described (Hoagland and 454 Arnon 1950) After 4 weeks mature nodules were observed 455 456 457 Introduction of label and sampling 458 The introduction of 13C-label was performed by adding [U-13C3-Pyruvate 99 atom 13C] or [U-13C5-459 Glutamate 98 atom 13C] (Euriso-Top GmbH) at a final concentration of 20 mM to 25 mL buffer solution 460 (10 mM MES+KOH pH 65) Unlabelled control samples were prepared by adding 12C-pyruvate or 12C-461 glutamate at a final concentration of 20 mM Nodules were removed and root pieces of a pool of six 462 independent plants were incubated for 45 min in buffer solution without label in order to adapt the root 463 pieces to the experimental normoxic (approximately 250 microM oxygen) and hypoxic (approximately 50 microM 464 oxygen) conditions Normoxic and hypoxic conditions were obtained by supplying air or an 465 oxygennitrogen mixture to the flasks respectively Samples were then harvested at different time points 466 (0 3 and 6 h) after the addition of 13C-label or 12C-unlabelled substrate A control experiment without 467 addition of substrate was also performed Root pieces were washed three times with buffer (10 mM 468 MES+KOH pH 65) and snap frozen in liquid nitrogen Samples were stored at -80 degC prior to extraction 469 and GC-TOF-MS analysis 470 471 The introduction of 15N-label was performed by adding [15N-ammonium ge98 atom 15N] (Euriso-Top 472 GmbH) at a final concentration of 20 mM to 25 mL buffer solution (10 mM MES+KOH pH 65) Nodules 473 were removed and root pieces of a pool of five independent plants were incubated for 45 min in buffer 474
wwwplantphysiolorgon November 8 2018 - Published by Downloaded from Copyright copy 2015 American Society of Plant Biologists All rights reserved
19
solution without label in order to adapt the root pieces to the experimental normoxic (approximately 250 475 microM oxygen) and hypoxic (approximately 50 microM oxygen) conditions Normoxic and hypoxic conditions were 476 obtained by supplying air or an oxygennitrogen mixture to the flasks respectively Samples were then 477 harvested at different time points (0 3 24 and 36 h) after the addition of 15N-ammonium (NH4
+) Root 478 pieces were washed three times with buffer (10 mM MES+KOH pH 65) and snap frozen in liquid 479 nitrogen Samples were stored at -80 degC prior to extraction and GC-TOF-MS analysis 480 481 Extraction of metabolites and GC-TOF-MS metabolite profiling analysis of 13C15N labelling 482 Primary metabolites were extracted using a methanolchloroform extraction procedure as previously 483 described in the literature (Lisec et al 2006) Briefly a total of 20 mg (FW) of homogenized soybean root 484 material was extracted in 280 μL of 100 (vv) methanol with 12 μL of ribitol (02 mg mLndash1 ribitol in water) 485 as an internal standard Extracts were incubated for 15 min at 70 degC on a shaker (950 rpm) and then 486 centrifuged at room temperature 12000 g for 10 min The supernatant was transferred to a new tube and 487 mixed with 150 μL chloroform and 300 μL water and vortex mixed Extracts were centrifuged at room 488 temperature 12000 g for 15 min A total of 150 μL aliquots of the polar (upper) phase were evaporated to 489 dryness using a centrifugal concentrator and metabolites were subsequently derivatized and analyzed 490 using an established GC-TOF-MS protocol (Lisec et al 2006) GC-TOF-MS chromatograms were 491 evaluated using TagFinder (Luedemann et al 2008) Analytes were manually identified using the 492 TargetFinder plug-in of the TagFinder software and a reference library of ambient and 13C or 15N-labelled 493 mass spectra and retention indices (RI) from the Golm Metabolome Database (GMD http gmdmpimp-494 golmmpgde) (Kopka et al 2005 Schauer et al 2005) A peak intensity matrix containing all available 495 mass isotopomers of characteristic mass fragments that represented the primary metabolites under 496 investigation was generated by TagFinder This matrix was processed using the CORRECTOR software 497 tool a TagFinder based high throughput tool for the mass isotope correction of GC-TOF-MS flux profiling 498 experiments (httpwww-enmpimp-golmmpgde03-researchresearchGroups01dept1Root_Metabolism 499 smpCORRECTORindexhtml) Fractional 15N-enrichments of mass fragments were calculated using this 500 processing tool as previously described (Huege et al 2011) Fractional 13C-enrichments were evaluated 501 by determination of the intensities of the 12C spectral fragments and the isotopic spectral fragments of 502 unlabelled controls were compared with the fragmentation patterns of metabolites detected in the 503 chromatograms of the 13C-fed soybean roots as described by Roessner-Tunali et al (2004) The total 13C 504 and 15N label present in a metabolite pool (expressed as nmol 13C- or 15N-labelled metabolite per g FW) 505 was calculated by multiplying the absolute concentration of that metabolite determined after GC-TOF-MS 506 analysis by its mean 13C-fractional enrichment (Roessner-Tunali et al 2004) 507 508 Respiratory oxygen consumption measurements 509 Respiratory oxygen consumption was measured on excised root pieces (2-6 mm long total mass 510 approximately 25 mg) Prior to the measurements excised roots were pre-incubated in HEPES buffer 511
wwwplantphysiolorgon November 8 2018 - Published by Downloaded from Copyright copy 2015 American Society of Plant Biologists All rights reserved
20
(100 mM pH 74) for 50 min to reduce wound-stress responses Respiraton was determined after transfer 512 of the roots to 1 mL of well-stirred fresh HEPES buffer (100 mM pH 74) in a closed vial at 25 degC 513 connected to a OXY-4 multi-channel optical oxygen sensor (PreSens Regensburg Germany) 514 515 Supplemental Figure Legend 516 517 Figure SI- Comparison of the metabolite response after isotope feeding with control (without feeding) and 518 literature data Heatmap showing metabolite responses of different species to different hypoxia 519 treatments False colour imaging was performed on Log10-transformed GC-TOF-MS metabolite data 520 (relative values) The relative metabolite levels are normalized to internal standard (ribitol) and fresh 521 weight of the samples Grey colour depicts values not detected in the reported experiment 522 523 Figure SII- GC-EI-TOF-MS signal obtained for fumarate under normoxia (red) and hypoxia (blue) 524 conditions in the 13Cpyruvate experiment at (A) 3 h and (B) 6 h and in the 13Cglutamate experiment at (C) 525 3 h and (D) 6 h The mass-to-charge ratio (mz) 245 corresponds to the fragment ion [M-15]+ after loss of 526 a methyl group from the trimethylsilylated -Si-(CH3)3 moiety and it contains four carbons The bar graph 527 represents the calculated 13C-enrichment () between conditions (normoxia vs hypoxia) at 3 h and 6 h 528 respectively 529 530 Supplemental Table Legends 531 532 Table SI- (A) Relative values of 33 primary metabolites in soybean root pieces during a 6 h time course of 533 hypoxia treatment determined with GC-TOF-MS (13Cpyruvate substrate) (B) Two-way ANOVA for 33 534 primary metabolites obtained with GC-TOF-MS relative values (13Cpyruvate substrate) NS P-value 535 statistically non-significant (red colour) () P-value statistically significant at 10 () P-value statistically 536 significant at 5 and () P-value statistically significant at 1 (C) Relative values of 33 primary 537 metabolites in soybean root pieces during a 6 h time course of hypoxia treatment determined with GC-538 TOF-MS (13Cglutamate substrate) (D) Two-way ANOVA for 33 primary metabolites obtained with GC-539 TOF-MS relative values (13Cglutamate substrate) NS P-value statistically non-significant (red colour) () 540 P-value statistically significant at 10 () P-value statistically significant at 5 and () P-value 541 statistically significant at 1 542 543 Table SII- Absolute concentrations of selected primary metabolites measured in the roots of soybean 544 used to determine the Total 13C-label accumulated following incubation in 13C-pyruvate Values are mean 545 plusmn SE of 5 independent measurements Values set in bold type were determined by the Student t-test 546 (plt005) to be significantly different from the control 547 548
wwwplantphysiolorgon November 8 2018 - Published by Downloaded from Copyright copy 2015 American Society of Plant Biologists All rights reserved
21
Table SIII- Absolute concentrations of selected primary metabolites measured in the roots of soybean 549 used to determine the Total 13C-label accumulated following incubation in 13C-glutamate Values are mean 550 plusmn SE of 5 independent measurements Values set in bold type were determined by the Student t-test 551 (plt005) to be significantly different from the control 552 553 Table SIV- Absolute concentrations of selected primary metabolites measured in the roots of soybean 554 used to determine the Total 15N-label accumulated following incubation in 15N-labelled substrate Values 555 are mean plusmn SE of 5 independent measurements Values set in bold type were determined by the Student 556 t-test (plt005) to be significantly different from the control 557 558 ACKNOWLEDGEMENTS 559 560 This work was supported by the Max Planck Society and the Federal Ministry of Education and Research 561 (BMBF HydromicPro) A M L and H D were supported by the Ministegravere de la Recherche et 562 Technologies (MRT) and QUALISEM program funded by Reacutegion des Pas de la Loire C A acknowledges 563 support from the FCT Investigator programme (IF003762012CP0165CT0003) by Fundaccedilatildeo para a 564 Ciecircncia e a Tecnologia and the ITQB research unit GREEN-it ldquoBioresources for sustainabilityrdquo 565 (UIDMulti045512013) 566 567 Figure Legends 568 569 Figure 1- Relative abundance of metabolites in soybean root pieces during a 6 h time course of hypoxia 570 treatment determined with GC-TOF-MS The relative metabolite levels are normalized to internal standard 571 (ribitol) and fresh weight of the samples and are depicted on a primary metabolite map The grey bars 572 represent the ratio of metabolite levels between hypoxianormoxia conditions at each time-interval The 573 values are mean plusmn SE of 6 biological replicates A star () indicates the value showed significant difference 574 from the control (normoxia) in Student t-test (plt005) Abbreviations PEP Phosphoenolpyruvate PEPC 575 Phosphoenolpyruvate carboxylase GABA-T GABA transaminase AlaT alanine aminotransferase 576 GOGAT glutamate synthase AspAT aspartate aminotransferase SSADH succinic semialdehyde 577 dehydrogenase ACL ATP citrate lyase ICL isocitrate lyase OGDH 2-oxoglutarate dehydrogenase 578 SDH succinate dehydrogenase MS malate synthase ME malic enzyme 579 580 Figure 2- Total 13C accumulation in primary metabolites in soybean roots following 13C-pyruvate feeding 581 for a period of 6 h Black and grey bars represent normoxia and hypoxia conditions respectively All data 582 are given in nmol(g-1FW) and a star () indicates the value showed significant difference from the control 583 (normoxia) in Student t-test (plt005) Red and blue colour represent the transfer of C through the 584 pathways of AlaAT and GABA shunt respectively The black dashed line in this scheme indicates that 585
wwwplantphysiolorgon November 8 2018 - Published by Downloaded from Copyright copy 2015 American Society of Plant Biologists All rights reserved
22
pyruvate and 2-oxoglutarate can participate in different reactions however data are the same The three 586 carbons donated by pyruvate to alanine are highlighted in red The two carbons donated by Acetyl-CoA to 587 citrate are highlighted in blue at which point they become randomized and no longer can be traced 588 Abbreviations PEP Phosphoenolpyruvate PEPC Phosphoenolpyruvate carboxylase GABA-T GABA 589 transaminase AlaT alanine aminotransferase GOGAT glutamate synthase GAD glutamate 590 decarboxylase AspAT aspartate aminotransferase SSADH succinic semialdehyde dehydrogenase 591 ACL ATP citrate lyase ICL isocitrate lyase OGDH 2-oxoglutarate dehydrogenase SDH succinate 592 dehydrogenase MS malate synthase ME malic enzyme LDH lactate dehydrogenase 593 594 Figure 3- Total 13C accumulation in primary metabolites in soybean roots following 13C-glutamate feeding 595 for a period of 6 h Black and grey bars represent normoxia and hypoxia conditions respectively All data 596 are given in nmol(g-1FW) and a star () indicates the value showed significant difference from the control 597 (normoxia) in Student t-test (plt005) Red and blue colour represent the transfer of C through the 598 pathways of AlaAT and GABA shunt respectively The black dashed line in this scheme indicates that 2-599 oxoglutarate can participate in different reactions however data are the same The five carbons donated 600 by glutamate to 2-oxoglutarate are highlighted in red Abbreviations PEP Phosphoenolpyruvate PEPC 601 Phosphoenolpyruvate carboxylase GABA-T GABA transaminase AlaT alanine aminotransferase 602 GOGAT glutamate synthase GAD glutamate decarboxylase AspAT aspartate aminotransferase 603 SSADH succinic semialdehyde dehydrogenase ACL ATP citrate lyase ICL isocitrate lyase OGDH 2-604 oxoglutarate dehydrogenase SDH succinate dehydrogenase MS malate synthase ME malic enzyme 605 LDH lactate dehydrogenase 606 607 Figure 4- Total 15N accumulation in primary metabolites in soybean roots following 15N-ammonium 608 feeding for a period of 36 h Black and grey bars represent normoxia and hypoxia conditions respectively 609 All data are given in nmol(g-1FW) and a star () indicates the value showed significant difference from the 610 control (normoxia) in Student t-test (plt005) Red colour represent the transfer of N through the pathways 611 of GOGAT and GABA shunt Abbreviations PEP Phosphoenolpyruvate PEPC Phosphoenolpyruvate 612 carboxylase GABA-T GABA transaminase AlaT alanine aminotransferase GOGAT glutamate 613 synthase GS glutamine synthetase GAD glutamate decarboxylase AspAT aspartate 614 aminotransferase SSADH succinic semialdehyde dehydrogenase ACL ATP citrate lyase ICL isocitrate 615 lyase OGDH 2-oxoglutarate dehydrogenase SDH succinate dehydrogenase MS malate synthase ME 616 malic enzyme LDH lactate dehydrogenase 617 618 Figure 5- Respiratory oxygen consumption rates of soybean roots during normoxia and hypoxia 619 conditions Values are mean plusmn SE of at least 45 independent measurements (of freshly excised roots 50 620 min in buffer) 621 622
wwwplantphysiolorgon November 8 2018 - Published by Downloaded from Copyright copy 2015 American Society of Plant Biologists All rights reserved
23
Table Legends 623 624 Table I- GC-TOF-MS primary metabolite profiling of soybean root tissue following incubation in different 625 substrates Relative values are the ratio between hypoxianormoxia conditions and are represented as 626 mean plusmn SE of 6 independent measurements Values set in bold type indicate the value showed significant 627 difference from the control (normoxia) in Student t-test (plt005) False colour imaging was performed on 628 Log10-transformed GC-TOF-MS metabolite data 629
(No substrate)
Hyp
oxia
0 h
Hyp
oxia
3 h
Hyp
oxia
6 h
Suga
rs
Glucose 082 plusmn 002 112 plusmn 002 125 plusmn 027 Fructose 076 plusmn 004 120 plusmn 004 161 plusmn 005 Trehalose 087 plusmn 006 101 plusmn 001 087 plusmn 006
myo-Inositol 101 plusmn 001 102 plusmn 001 109 plusmn 002
Glycerol 102 plusmn 005 104 plusmn 001 094 plusmn 013
Fru-6P 088 plusmn 003 086 plusmn 001 087 plusmn 003
Glc-6P 091 plusmn 005 086 plusmn 002 077 plusmn 009
Am
ino
acid
s amp
der
ivat
ives
Alanine 115 plusmn 006 181 plusmn 006 182 plusmn 007 Valine 100 plusmn 008 111 plusmn 002 114 plusmn 008 Glycine 113 plusmn 006 115 plusmn 027 101 plusmn 009
Aspartate 080 plusmn 002 062 plusmn 002 064 plusmn 001 Glutamate 102 plusmn 004 121 plusmn 003 113 plusmn 004
Serine 112 plusmn 008 114 plusmn 008 144 plusmn 008 Threonine 095 plusmn 003 102 plusmn 001 101 plusmn 001
Phenylalanine 079 plusmn 005 115 plusmn 023 234 plusmn 003 Asparagine 103 plusmn 008 081 plusmn 004 077 plusmn 003 β-Alanine 101 plusmn 003 087 plusmn 005 085 plusmn 003
Methionine 095 plusmn 003 101 plusmn 001 102 plusmn 001
Pyroglutamate 090 plusmn 005 112 plusmn 003 139 plusmn 005
Leucine 083 plusmn 008 108 plusmn 012 199 plusmn 008 Isoleucine 088 plusmn 004 111 plusmn 003 101 plusmn 003
GABA 097 plusmn 008 174 plusmn 005 117 plusmn 007
Proline 113 plusmn 013 224 plusmn 031 332 plusmn 014
Urea 101 plusmn 003 104 plusmn 001 115 plusmn 008
Org
anic
aci
ds
Lactate 111 plusmn 002 284 plusmn 020 657 plusmn 002 Pyruvate 091 plusmn 006 113 plusmn 013 110 plusmn 005
Citrate 091 plusmn 002 085 plusmn 004 101 plusmn 003
2-Oxoglutarate 103 plusmn 007 085 plusmn 004 099 plusmn 004
Succinate 103 plusmn 004 160 plusmn 005 126 plusmn 004 Malate 086 plusmn 002 070 plusmn 019 111 plusmn 002
Fumarate 102 plusmn 003 103 plusmn 007 089 plusmn 002
Glycerate 079 plusmn 019 090 plusmn 005 110 plusmn 005
Threonate 103 plusmn 002 083 plusmn 003 082 plusmn 002
wwwplantphysiolorgon November 8 2018 - Published by Downloaded from Copyright copy 2015 American Society of Plant Biologists All rights reserved
24
-1 Log1
0 1 630 631
(12Cpyruvate) (13Cpyruvate)
Hyp
oxia
0 h
Hyp
oxia
3 h
Hyp
oxia
6 h
Hyp
oxia
0 h
Hyp
oxia
3 h
Hyp
oxia
6 h
101 plusmn 003 087 plusmn 007 123 plusmn 003 087 plusmn 007 119 plusmn 005 123 plusmn 003 101 plusmn 004 088 plusmn 006 173 plusmn 003 087 plusmn 006 126 plusmn 006 173 plusmn 004 086 plusmn 006 087 plusmn 001 110 plusmn 006 086 plusmn 007 089 plusmn 005 084 plusmn 007
101 plusmn 004 104 plusmn 004 112 plusmn 003 093 plusmn 005 101 plusmn 004 113 plusmn 005
101 plusmn 002 088 plusmn 001 112 plusmn 004 095 plusmn 007 084 plusmn 002 086 plusmn 003
100 plusmn 005 088 plusmn 002 087 plusmn 005 089 plusmn 003 087 plusmn 003 087 plusmn 005
086 plusmn 004 087 plusmn 003 088 plusmn 002 084 plusmn 004 087 plusmn 006 095 plusmn 005
101 plusmn 011 179 plusmn 001 291 plusmn 012 102 plusmn 001 182 plusmn 006 302 plusmn 012 101 plusmn 006 102 plusmn 008 113 plusmn 006 102 plusmn 009 108 plusmn 003 169 plusmn 007 112 plusmn 011 110 plusmn 023 088 plusmn 011 155 plusmn 025 104 plusmn 036 082 plusmn 012
089 plusmn 003 082 plusmn 002 059 plusmn 002 090 plusmn 003 062 plusmn 001 061 plusmn 003 117 plusmn 007 155 plusmn 006 149 plusmn 005 118 plusmn 007 136 plusmn 008 127 plusmn 007 113 plusmn 005 118 plusmn 005 146 plusmn 009 113 plusmn 006 115 plusmn 006 150 plusmn 005 101 plusmn 003 117 plusmn 005 102 plusmn 003 101 plusmn 006 111 plusmn 004 100 plusmn 004
089 plusmn 009 162 plusmn 003 165 plusmn 005 088 plusmn 003 168 plusmn 007 185 plusmn 009 091 plusmn 002 085 plusmn 008 085 plusmn 003 091 plusmn 007 085 plusmn 006 085 plusmn 003
093 plusmn 003 084 plusmn 004 082 plusmn 003 093 plusmn 005 087 plusmn 008 087 plusmn 002
101 plusmn 007 102 plusmn 005 101 plusmn 004 099 plusmn 006 099 plusmn 003 099 plusmn 008
111 plusmn 005 150 plusmn 004 130 plusmn 001 111 plusmn 005 157 plusmn 008 141 plusmn 005 101 plusmn 009 090 plusmn 004 146 plusmn 016 093 plusmn 004 091 plusmn 003 211 plusmn 009 092 plusmn 002 109 plusmn 004 102 plusmn 004 088 plusmn 005 110 plusmn 003 099 plusmn 003
102 plusmn 004 214 plusmn 005 131 plusmn 005 104 plusmn 005 219 plusmn 011 136 plusmn 004 116 plusmn 012 212 plusmn 009 326 plusmn 014 120 plusmn 010 210 plusmn 031 362 plusmn 015
092 plusmn 001 104 plusmn 006 113 plusmn 007 098 plusmn 007 105 plusmn 002 116 plusmn 007
111 plusmn 032 283 plusmn 005 657 plusmn 021 095 plusmn 005 561 plusmn 020 771 plusmn 035 113 plusmn 001 112 plusmn 004 109 plusmn 002 114 plusmn 006 114 plusmn 003 112 plusmn 002 101 plusmn 001 112 plusmn 010 102 plusmn 002 113 plusmn 012 091 plusmn 004 095 plusmn 002
102 plusmn 005 092 plusmn 002 112 plusmn 005 099 plusmn 003 091 plusmn 003 113 plusmn 005
102 plusmn 005 121 plusmn 003 169 plusmn 002 093 plusmn 003 124 plusmn 003 175 plusmn 005 087 plusmn 004 026 plusmn 002 111 plusmn 004 089 plusmn 003 024 plusmn 001 111 plusmn 005
093 plusmn 002 102 plusmn 003 074 plusmn 003 094 plusmn 003 096 plusmn 003 076 plusmn 003 102 plusmn 003 087 plusmn 011 109 plusmn 003 060 plusmn 019 086 plusmn 017 110 plusmn 003
101 plusmn 003 090 plusmn 005 063 plusmn 002 103 plusmn 006 062 plusmn 002 063 plusmn 004 632 633
(12Cglutamate) (13Cglutamate)
wwwplantphysiolorgon November 8 2018 - Published by Downloaded from Copyright copy 2015 American Society of Plant Biologists All rights reserved
25
Hyp
oxia
0 h
Hyp
oxia
3 h
Hyp
oxia
6 h
Hyp
oxia
0 h
Hyp
oxia
3 h
Hyp
oxia
6 h
086 plusmn 002 110 plusmn 004 123 plusmn 001 092 plusmn 004 125 plusmn 003 111 plusmn 002
087 plusmn 002 123 plusmn 002 171 plusmn 004 089 plusmn 003 126 plusmn 006 173 plusmn 004 088 plusmn 002 113 plusmn 004 143 plusmn 003 095 plusmn 002 165 plusmn 009 124 plusmn 005 101 plusmn 003 114 plusmn 003 071 plusmn 002 088 plusmn 003 145 plusmn 007 069 plusmn 003 104 plusmn 005 113 plusmn 002 111 plusmn 005 104 plusmn 006 110 plusmn 015 114 plusmn 006
087 plusmn 003 088 plusmn 001 089 plusmn 004 088 plusmn 004 087 plusmn 003 085 plusmn 005
066 plusmn 004 084 plusmn 003 086 plusmn 002 082 plusmn 006 066 plusmn 004 069 plusmn 003
119 plusmn 005 182 plusmn 003 312 plusmn 011 119 plusmn 008 188 plusmn 007 295 plusmn 012 101 plusmn 008 118 plusmn 002 166 plusmn 008 102 plusmn 009 116 plusmn 003 167 plusmn 007 172 plusmn 006 174 plusmn 034 112 plusmn 010 091 plusmn 006 173 plusmn 057 113 plusmn 010
088 plusmn 002 087 plusmn 002 059 plusmn 002 090 plusmn 003 060 plusmn 001 061 plusmn 003 110 plusmn 002 101 plusmn 006 163 plusmn 005 107 plusmn 003 101 plusmn 006 167 plusmn 006 162 plusmn 008 138 plusmn 005 265 plusmn 008 175 plusmn 009 139 plusmn 027 259 plusmn 010 101 plusmn 003 112 plusmn 004 152 plusmn 005 097 plusmn 004 112 plusmn 011 149 plusmn 004 077 plusmn 002 275 plusmn 006 232 plusmn 008 077 plusmn 004 275 plusmn 027 228 plusmn 006 100 plusmn 008 079 plusmn 004 081 plusmn 001 101 plusmn 009 079 plusmn 005 079 plusmn 003 102 plusmn 003 085 plusmn 008 085 plusmn 003 101 plusmn 004 085 plusmn 008 085 plusmn 003
087 plusmn 001 176 plusmn 003 138 plusmn 004 093 plusmn 003 177 plusmn 009 146 plusmn 005 121 plusmn 004 142 plusmn 007 098 plusmn 001 108 plusmn 006 143 plusmn 003 099 plusmn 001
090 plusmn 008 109 plusmn 001 284 plusmn 010 133 plusmn 009 110 plusmn 014 301 plusmn 011 091 plusmn 004 115 plusmn 002 218 plusmn 005 106 plusmn 005 118 plusmn 003 227 plusmn 008 102 plusmn 005 169 plusmn 015 156 plusmn 004 097 plusmn 006 167 plusmn 008 164 plusmn 005 116 plusmn 013 217 plusmn 021 333 plusmn 013 116 plusmn 015 223 plusmn 037 342 plusmn 014
096 plusmn 005 099 plusmn 002 112 plusmn 005 079 plusmn 006 105 plusmn 002 118 plusmn 007
097 plusmn 002 292 plusmn 018 699 plusmn 020 097 plusmn 002 473 plusmn 021 678 plusmn 023 114 plusmn 003 112 plusmn 002 111 plusmn 002 114 plusmn 005 159 plusmn 002 109 plusmn 002
090 plusmn 002 084 plusmn 003 082 plusmn 002 091 plusmn 003 089 plusmn 003 082 plusmn 003
103 plusmn 004 101 plusmn 004 101 plusmn 003 103 plusmn 005 099 plusmn 005 101 plusmn 005
102 plusmn 003 148 plusmn 004 127 plusmn 003 091 plusmn 003 164 plusmn 005 134 plusmn 003 091 plusmn 002 075 plusmn 001 111 plusmn 002 087 plusmn 003 028 plusmn 001 110 plusmn 005
090 plusmn 003 073 plusmn 002 126 plusmn 007 090 plusmn 003 045 plusmn 002 126 plusmn 004 025 plusmn 011 086 plusmn 012 085 plusmn 008 076 plusmn 015 143 plusmn 005 090 plusmn 004
092 plusmn 003 102 plusmn 001 080 plusmn 001 102 plusmn 005 102 plusmn 003 084 plusmn 001 634 635 636 637 Table II- Total 13C accumulation in primary metabolites in soybean roots following incubation in 13C-638 pyruvate for 3 and 6 h Values are mean plusmn SE of 6 independent measurements FW fresh weight Values 639 set in bold type indicate the value showed significant difference from the control (normoxia) in Student t-640 test (plt005) 641
wwwplantphysiolorgon November 8 2018 - Published by Downloaded from Copyright copy 2015 American Society of Plant Biologists All rights reserved
26
642
Total 13C label (nmol g-1FW) 3 h 6 h
Normoxia Hypoxia Normoxia Hypoxia Fumarate 0016 plusmn 0000 1352E-05 plusmn 0000 0034 plusmn 0000 8003E-05 plusmn 0000 Citrate 0182 plusmn 0006 0176 plusmn 0011 0634 plusmn 0022 0623 plusmn 0019 2-Oxoglutarate 0240 plusmn 0028 0207 plusmn 0025 0543 plusmn 0041 0606 plusmn 0032 GABA 0532 plusmn 0016 0889 plusmn 0024 3514 plusmn 0214 6141 plusmn 0313 Succinate 0595 plusmn 0013 0816 plusmn 0020 0786 plusmn 0021 1556 plusmn 0096 Alanine 0619 plusmn 0052 1054 plusmn 0048 0799 plusmn 0049 2217 plusmn 0098 Lactate 0645 plusmn 0048 2180 plusmn 0113 1025 plusmn 0123 7036 plusmn 0224 Aspartate 0866 plusmn 0057 0506 plusmn 0033 1393 plusmn 0053 1087 plusmn 0073 Glutamate 1122 plusmn 0086 1482 plusmn 0075 1656 plusmn 0069 2598 plusmn 0146 Malate 2464 plusmn 0134 0611 plusmn 0015 3810 plusmn 0173 4184 plusmn 0168 Pyruvate 17346 plusmn 0788 19188 plusmn 0526 19851 plusmn 0631 22369 plusmn 1020 643 Table III- Fractional enrichment 13C of metabolites labelled in soybean root tissue following incubation 644 in 13C-pyruvate for 3 and 6 h Values are mean plusmn SE () of 6 independent measurements Values set in 645 bold type indicate the value showed significant difference from the control (normoxia) in Student t-test 646 (plt005) 647 648
13C enrichment () 3 h 6 h
Normoxia Hypoxia Normoxia Hypoxia Fumarate 0842 plusmn 0004 0001 plusmn 0000 1173 plusmn 0004 0004 plusmn 0000 Citrate 0959 plusmn 0027 1013 plusmn 0021 2990 plusmn 0111 3074 plusmn 0019 2-Oxoglutarate 1259 plusmn 0060 1195 plusmn 0073 2557 plusmn 0346 2992 plusmn 0241 Malate 1296 plusmn 0075 1155 plusmn 0052 4088 plusmn 0068 4025 plusmn 0095 GABA 3258 plusmn 0133 2495 plusmn 0214 8761 plusmn 0118 11322 plusmn 0159 Succinate 4458 plusmn 0187 4986 plusmn 0114 6274 plusmn 0210 7173 plusmn 0226 Aspartate 5875 plusmn 0136 5463 plusmn 0121 8205 plusmn 0235 10184 plusmn 0083 Glutamate 8756 plusmn 0050 8654 plusmn 0054 11754 plusmn 0061 14748 plusmn 0090 Lactate 10976 plusmn 0125 11592 plusmn 0103 17275 plusmn 0053 18492 plusmn 0109 Alanine 14576 plusmn 0074 14316 plusmn 0084 19429 plusmn 0049 20327 plusmn 0037 Pyruvate 89586 plusmn 0167 87576 plusmn 0145 88386 plusmn 0195 89420 plusmn 0030 649 Table IV- Total 13C accumulation in primary metabolites in soybean roots following incubation in 13C-650 glutamate for 3 and 6 h Values are mean plusmn SE of 6 independent measurements FW fresh weight 651 Values set in bold type indicate the value showed significant difference from the control (normoxia) in 652 Student t-test (plt005) 653 Total 13C label (nmol g-1FW) 3 h 6 h
Normoxia Hypoxia Normoxia Hypoxia Fumarate 0011 plusmn 0000 9864E-06 plusmn 0000 0016 plusmn 0000 2316E-04 plusmn 0000 Proline 0026 plusmn 0016 0115 plusmn 0024 0099 plusmn 0014 0813 plusmn 0113 Alanine 0029 plusmn 0006 0072 plusmn 0011 0089 plusmn 0022 0588 plusmn 0019 2-Oxoglutarate 0097 plusmn 0017 0533 plusmn 0033 0115 plusmn 0023 0752 plusmn 0073 Succinate 0150 plusmn 0034 1655 plusmn 0115 0381 plusmn 0053 3497 plusmn 0068 Aspartate 0535 plusmn 0086 0365 plusmn 0075 1626 plusmn 0169 2848 plusmn 0146
wwwplantphysiolorgon November 8 2018 - Published by Downloaded from Copyright copy 2015 American Society of Plant Biologists All rights reserved
27
GABA 0789 plusmn 0048 5547 plusmn 0113 4695 plusmn 0123 13480 plusmn 0224 Glutamate 1196 plusmn 0388 8764 plusmn 0426 8191 plusmn 0331 10394 plusmn 0570 Malate 2433 plusmn 0078 1167 plusmn 0065 8974 plusmn 0241 14489 plusmn 0432 Asparagine 3726 plusmn 0153 17862 plusmn 0065 21974 plusmn 1036 34674 plusmn 1011 654 655 Table V- Fractional enrichment 13C of metabolites labelled in soybean root tissue following incubation in 656 13C-glutamate for 3 and 6 h Values are mean plusmn SE () of 6 independent measurements Values set in 657 bold type indicate the value showed significant difference from the control (normoxia) in Student t-test 658 (plt005) 659 660
13C enrichment () 3 h 6 h
Normoxia Hypoxia Normoxia Hypoxia Fumarate 0598 plusmn 0004 0001 plusmn 0000 0727 plusmn 0005 0009 plusmn 0000 Alanine 0680 plusmn 0020 0975 plusmn 0017 2169 plusmn 0099 5412 plusmn 0025 Proline 1046 plusmn 0211 2487 plusmn 0199 4010 plusmn 0231 11576 plusmn 0179 Succinate 1124 plusmn 0038 10055 plusmn 0068 2997 plusmn 0059 16135 plusmn 0074 Malate 1283 plusmn 0054 2215 plusmn 0036 9630 plusmn 0290 13955 plusmn 0325 Asparagine 2020 plusmn 0215 2872 plusmn 0099 3488 plusmn 0198 4681 plusmn 0326 2-Oxoglutarate 2896 plusmn 0119 16870 plusmn 0311 3209 plusmn 0328 20542 plusmn 0075 Aspartate 3599 plusmn 0033 3947 plusmn 0041 9588 plusmn 0076 26703 plusmn 0088 GABA 4793 plusmn 0140 15574 plusmn 0098 11655 plusmn 0050 24857 plusmn 0124 Glutamate 9345 plusmn 0054 51211 plusmn 0074 58177 plusmn 0036 59028 plusmn 0048 661 662 663 664 665 666 667 668
wwwplantphysiolorgon November 8 2018 - Published by Downloaded from Copyright copy 2015 American Society of Plant Biologists All rights reserved
Table VI- Total 15N accumulation in primary metabolites in soybean roots following incubation in 15N-ammonium for 3 12 24 and 36 h Values are 669 mean plusmn SE of 5 independent measurements FW fresh weight Values set in bold type indicate the value showed significant difference from the control 670 (normoxia) in Student t-test (plt005) 671
Total 15N label (nmol g-1FW) 3 h 12 h 24 h 36 h
Normoxia Hypoxia Normoxia Hypoxia Normoxia Hypoxia Normoxia Hypoxia Serine 0150 plusmn 0001 0118 plusmn 0001 0475 plusmn 0001 0242 plusmn 0001 0792 plusmn 0001 0282 plusmn 0001 1326 plusmn 0001 0559 plusmn 0001 Glycine 0244 plusmn 0001 0189 plusmn 0002 0907 plusmn 0001 0443 plusmn 0001 1247 plusmn 0001 0533 plusmn 0002 2491 plusmn 0001 0879 plusmn 0001 Alanine 0412 plusmn 0000 0650 plusmn 0001 0920 plusmn 0000 2738 plusmn 0001 1563 plusmn 0000 6576 plusmn 0001 3010 plusmn 0000 8330 plusmn 0001 Aspartate 0760 plusmn 0001 0258 plusmn 0001 2054 plusmn 0001 0396 plusmn 0001 3557 plusmn 0001 0509 plusmn 0001 5365 plusmn 0001 0574 plusmn 0001 GABA 1552 plusmn 0002 2011 plusmn 0002 2436 plusmn 0003 3501 plusmn 0001 2880 plusmn 0002 4904 plusmn 0002 3248 plusmn 0003 7368 plusmn 0001 Glutamine 1602 plusmn 0001 0181 plusmn 0000 1973 plusmn 0001 0209 plusmn 0001 3388 plusmn 0001 0309 plusmn 0000 6163 plusmn 0001 0368 plusmn 0001 Glutamate 3762 plusmn 0000 3277 plusmn 0000 4588 plusmn 0001 3982 plusmn 0001 5854 plusmn 0000 4025 plusmn 0000 6629 plusmn 0001 3367 plusmn 0001 Asparagine 7049 plusmn 0002 7360 plusmn 0003 58114 plusmn 0002 5282 plusmn 0001 26618 plusmn 0002 3782 plusmn 0003 33835 plusmn 0002 6009 plusmn 0001
672 Table VII- Fractional enrichment 15N of metabolites labelled in soybean root tissue following incubation in 15N-ammonium for 3 12 24 and 36 h 673 Values are mean plusmn SE () of 5 independent measurements Values set in bold type indicate the value showed significant difference from the control 674 (normoxia) in Student t-test (plt005) 675 676 677
15N enrichment () 3 h 12 h 24 h 36 h
Normoxia Hypoxia Normoxia Hypoxia Normoxia Hypoxia Normoxia Hypoxia Serine 3317 plusmn 0159 2653 plusmn 0054 10137 plusmn 0083 5337 plusmn 0070 15143 plusmn 0109 6248 plusmn 0064 22239 plusmn 0093 12575 plusmn 0070 Glycine 4620 plusmn 0080 3357 plusmn 0136 19528 plusmn 0071 8151 plusmn 0082 22239 plusmn 0090 10350 plusmn 0196 43460 plusmn 0081 17678 plusmn 0082 Asparagine 4992 plusmn 0159 5237 plusmn 0224 25658 plusmn 0178 8965 plusmn 0105 39167 plusmn 0159 14239 plusmn 0284 44798 plusmn 0198 20173 plusmn 0105 Alanine 7366 plusmn 0057 7431 plusmn 0067 17675 plusmn 0029 36894 plusmn 0058 29037 plusmn 0037 78806 plusmn 0087 54075 plusmn 0039 86075 plusmn 0058 Aspartate 15143 plusmn 0095 5070 plusmn 0060 37024 plusmn 0078 7751 plusmn 0051 65471 plusmn 0095 9861 plusmn 0060 87500 plusmn 0058 10980 plusmn 0051 GABA 23128 plusmn 0441 28379 plusmn 0275 45956 plusmn 0331 58608 plusmn 0108 54768 plusmn 0241 71036 plusmn 0175 60236 plusmn 0231 81949 plusmn 0108 Glutamine 64167 plusmn 0050 12070 plusmn 0058 67725 plusmn 0080 16538 plusmn 0107 70732 plusmn 0070 17725 plusmn 0060 79955 plusmn 0030 22495 plusmn 0082 Glutamate 69943 plusmn 0029 60858 plusmn 0049 77435 plusmn 0141 74686 plusmn 0147 81015 plusmn 0019 64342 plusmn 0038 87615 plusmn 0101 46660 plusmn 0147 678
w
ww
plantphysiolorgon N
ovember 8 2018 - P
ublished by D
ownloaded from
C
opyright copy 2015 A
merican S
ociety of Plant B
iologists All rights reserved
29
679
w
ww
plantphysiolorgon N
ovember 8 2018 - P
ublished by D
ownloaded from
C
opyright copy 2015 A
merican S
ociety of Plant B
iologists All rights reserved
Parsed CitationsAllen DKYoung JD (2013) Carbon and nitrogen provisions alter the metabolic flux in developing soybean embryos Plant Physiol161 1458-1475
Pubmed Author and TitleCrossRef Author and TitleGoogle Scholar Author Only Title Only Author and Title
Arauacutejo WL Nunes-Nesi A Osorio S Usadel B Fuentes D Nagy R Balbo I Lehmann M Studart-Witkowski C Tohge T Martinoia EJordana X DaMatta FM Fernie AR (2011) Antisense inhibition of the iron-sulphur subunit of succinate dehydrogenase enhancesphotosynthesis and growth in tomato via an organic acid-mediated effect on stomatal aperture Plant Cell 23 600-627
Pubmed Author and TitleCrossRef Author and TitleGoogle Scholar Author Only Title Only Author and Title
Arauacutejo WL Nunes-Nesi A Nikoloski Z Sweetlove LJ Fernie AR (2012) Metabolic control and regulation of the tricarboxylic acidcycle in photosynthetic and heterotrophic plant tissues Plant Cell Environ 35 1-21
Pubmed Author and TitleCrossRef Author and TitleGoogle Scholar Author Only Title Only Author and Title
Armstrong W Beckett PM (2011) Experimental and modelling data contradict the idea of respiratory down-regulation in planttissues at an internal [O2] substantially above the critical oxygen pressure for cytochrome oxidase New Phytol 190 431-441
Pubmed Author and TitleCrossRef Author and TitleGoogle Scholar Author Only Title Only Author and Title
Bailey-Serres J Voesenek LA (2008) Flooding stress acclimations and genetic diversity Ann Rev Plant Biol 59 313-339Pubmed Author and TitleCrossRef Author and TitleGoogle Scholar Author Only Title Only Author and Title
Bailey-Serres J Fukao T Gibbs DJ Holdsworth MJ Lee SC Licausi F Perata P Voesenek LA van Dongen JT (2012) Makingsense of low oxygen sensing Trends Plant Sci 17 129-138
Pubmed Author and TitleCrossRef Author and TitleGoogle Scholar Author Only Title Only Author and Title
Boyle NR Morgan JA (2009) Flux balance analysis of primary metabolism in Chlamydomonas reinhardtii BMC Syst Biol 3 4Pubmed Author and TitleCrossRef Author and TitleGoogle Scholar Author Only Title Only Author and Title
Considine MJ Foyer CH (2014) Redox regulation of plant development Antioxid Redox Signal 21 1305-1326Pubmed Author and TitleCrossRef Author and TitleGoogle Scholar Author Only Title Only Author and Title
Daloso DM Muumlller K Obata T Florian A Tohge T Bottcher A Riondet C Laetitia Bariat Carrari F Nunes-Nesi A Buchanan BBReichheld J-P Arauacutejo WL Fernie AR (2015) Thioredoxin a master regulator of the tricarboxylic acid cycle in plant mitochondriaPNAS 112 E1392-1400
Pubmed Author and TitleCrossRef Author and TitleGoogle Scholar Author Only Title Only Author and Title
Edwards S Nguyen B-T Do B Roberts JKM (1998) Contribution of malic enzyme pyruvate kinase phosphoenolpyruvatecarboxylase and the Krebs cycle to respiration and biosynthesis and to intracellular pH regulation during hypoxia in maize roottips observed by nuclear magnetic resonance imaging and gas chromatography-mass spectrometry Plant Physiol 116 1073-1081
Pubmed Author and TitleCrossRef Author and TitleGoogle Scholar Author Only Title Only Author and Title
Felle HH (2005) pH Regulation in Anoxic Plants Ann Bot 96 519-532Pubmed Author and TitleCrossRef Author and TitleGoogle Scholar Author Only Title Only Author and Title
Fernie AR Carrari F Sweetlove LJ (2004) Respiratory metabolism glycolysis the TCA cycle and mitochondrial electron transportCurr Opin Plant Biol 7 254-261
Pubmed Author and TitleCrossRef Author and TitleGoogle Scholar Author Only Title Only Author and Title
Geigenberger P Fernie AR Gibon Y Christ M Stitt M (2000) Metabolic activity decreases as an adaptive response to low internaloxygen in growing potato tubers Biol Chem 381 723-740
Pubmed Author and TitleCrossRef Author and TitleGoogle Scholar Author Only Title Only Author and Title
Geigenberger P (2003) Response of plant metabolism to too little oxygen Curr Opin Plant Biol 6 247-56 wwwplantphysiolorgon November 8 2018 - Published by Downloaded from Copyright copy 2015 American Society of Plant Biologists All rights reserved
Pubmed Author and TitleCrossRef Author and TitleGoogle Scholar Author Only Title Only Author and Title
Grafahrend-Belau E Junker A Eschenroumlder A Muumlller J Schreiber F Junker BH (2013) Multiscale metabolic modeling dynamicflux balance analysis on a whole-plant scale Plant Physiol 163 637-647
Pubmed Author and TitleCrossRef Author and TitleGoogle Scholar Author Only Title Only Author and Title
Gupta KJ Zabalza A van Dongen JT (2009) Regulation of respiration when the oxygen availability changes Physiol Plantarum 137383-391
Pubmed Author and TitleCrossRef Author and TitleGoogle Scholar Author Only Title Only Author and Title
Hanning I Heldt HW (1993) On the function of mitochondrial metabolism during photosynthesis in spinach (Spinacia oleracea L)leaves Partitioning between respiration and export of redox equivalents and precursors for nitrate assimilation products PlantPhysiol 103 1147-1154
Pubmed Author and TitleCrossRef Author and TitleGoogle Scholar Author Only Title Only Author and Title
Hoagland D Arnon D (1950) The water culture method of growing plants without soil California Agricultural Experiment StationBulletin 347
Pubmed Author and TitleCrossRef Author and TitleGoogle Scholar Author Only Title Only Author and Title
Huege J Goetze J Schwarz D Bauwe H Hagemann M Kopka J (2011) Modulation of the major paths of carbon inphotorespiratory mutants of Synechocystis PLoS ONE 6 e16278 doi101371journalpone0016278
Pubmed Author and TitleCrossRef Author and TitleGoogle Scholar Author Only Title Only Author and Title
Jorge TF Rodrigues JA Caldana C Schmidt R van Dongen J Thomas-Oates J Antonio C (2015) Mass spectrometry-based plantmetabolomics metabolite responses to abiotic stress Mass Spectrom Rev DOI 101002mas21449
Pubmed Author and TitleCrossRef Author and TitleGoogle Scholar Author Only Title Only Author and Title
Klinman JP Rose IA (1971) Stereochemistry of the interconversions of citrate and acetate catalyzed by citrate synthase adenosinetriphosphate citrate lyase and citrate lyase Biochem 10 2267-2272
Pubmed Author and TitleCrossRef Author and TitleGoogle Scholar Author Only Title Only Author and Title
Kopka J Schauer N Krueger S Birkemeyer C Usadel B Bergmuller E Dormann P Weckwerth W Gibon Y Stitt M Willmitzer LFernie AR Steinhauser D (2005) GmdcsbDb The Golm Metabolome Database Bioinformatics 21 1635-1638
Pubmed Author and TitleCrossRef Author and TitleGoogle Scholar Author Only Title Only Author and Title
Kreuzwieser J Hauberg J Howell KA Carroll A Rennenberg H Millar AH Whelan J (2009) Differentail response of gray poplarleaves and roots underpins stress adaptation during hypoxia Plant Physiol 149 461-473
Pubmed Author and TitleCrossRef Author and TitleGoogle Scholar Author Only Title Only Author and Title
Kruger NJ von Schaewen A (2003) The oxidative pentose phosphate pathway structure and organization Curr Opin Plant Biol6 236-246
Pubmed Author and TitleCrossRef Author and TitleGoogle Scholar Author Only Title Only Author and Title
Limami AM Gleacutevarec G Ricoult C Cliquet J-B Planchet E (2008) Concerted modulation of alanine and glutamate metabolism inyoung Medicago truncatula seedlings under hypoxic stress J Exp Bot 59 2325-2335
Pubmed Author and TitleCrossRef Author and TitleGoogle Scholar Author Only Title Only Author and Title
Lisec J Schauer N Kopka J Willmitzer L Fernie AR (2006) Gas chromatography mass spectrometry-based metabolite profiling inplants Nature Protocols 1 387-396
Pubmed Author and TitleCrossRef Author and TitleGoogle Scholar Author Only Title Only Author and Title
Luedemann A Strassburg K Erban A Kopka J (2008) TagFinder for the quantitative analysis of gas chromatography-massspectrometry (GC-MS)-based metabolite profiling experiments Bioinformatics 24 732-737
Pubmed Author and Title wwwplantphysiolorgon November 8 2018 - Published by Downloaded from
Copyright copy 2015 American Society of Plant Biologists All rights reserved
CrossRef Author and TitleGoogle Scholar Author Only Title Only Author and Title
Ma F Jazmin LJ Young JD Allen DK (2014) Isotopically nonstationary 13C flux analysis of changes in Arabidopsis thaliana leafmetabolism due to high light acclimation PNAS 11116967-16972
Pubmed Author and TitleCrossRef Author and TitleGoogle Scholar Author Only Title Only Author and Title
Metallo CM Gameiro PA Bell EL Mattaini KR Yang J Hiller K Jewell CM Johnson ZR Irvine DJ Guarente L Kelleher JKHeiden MGV Iliopoulos O Stephanopoulos G (2011) Reductive glutamine metabolism by IDH1 mediates lipogenesis underhypoxia Nature 468 380-386
Pubmed Author and TitleCrossRef Author and TitleGoogle Scholar Author Only Title Only Author and Title
Millar AH Whelan J Soole KL Day DA (2011) Organisation and regulation of mitochondrial respiration in plants Ann Rev PlantBiol 62 79-104
Pubmed Author and TitleCrossRef Author and TitleGoogle Scholar Author Only Title Only Author and Title
Mustroph A Lee SC Oosumi T Zanetti ME Yang H Ma K Yaghoubi-Masihi A Fukao T Bailey-Serres J (2010) Cross-kingdomcomparison of transcriptomic adjustments to low-oxygen stress highlights conserved and plant-specific responses Plant Physiol152 1484-1500
Pubmed Author and TitleCrossRef Author and TitleGoogle Scholar Author Only Title Only Author and Title
Narsai R Rocha M Geigenberger P Whelan J van Dongen JT (2011) Comparative analysis between plant species oftranscriptional and metabolic responses to hypoxia New Phytol 190 472-487
Pubmed Author and TitleCrossRef Author and TitleGoogle Scholar Author Only Title Only Author and Title
Nikoloski Z van Dongen JT (2011) Modeling alternatives for interpreting the change in oxygen-consumption rates during hypoxicconditions New Phytol 190 273-276
Pubmed Author and TitleCrossRef Author and TitleGoogle Scholar Author Only Title Only Author and Title
Plaxton WC Podesta FE (2006) The functional organization and control of plant respiration Crit Rev Plant Sci 25 159-198Pubmed Author and TitleCrossRef Author and TitleGoogle Scholar Author Only Title Only Author and Title
Ratcliffe RG Shachar-Hill Y (2006) Measuring multiple fluxes through plant metabolic networks Plant J 45 490-511Pubmed Author and TitleCrossRef Author and TitleGoogle Scholar Author Only Title Only Author and Title
Ricoult C Echeverria LO Cliquet J-B Limami AM (2006) Characterization of alanine aminotransferase (AlaAT) multigene family andhypoxic responsive in young seedlings of the model legume Medicago truncatula J Exp Bot 57 3079-3089
Pubmed Author and TitleCrossRef Author and TitleGoogle Scholar Author Only Title Only Author and Title
Roberts JKM Hooks MA Miaullis AP Edwards S Webster C (1992) Contribution of malate and amino acid metabolism tocytoplasmic pH regulation in hypoxic maize root tips studied using nuclear magnetic resonance spectroscopy Plant Physiol 98480-487
Pubmed Author and TitleCrossRef Author and TitleGoogle Scholar Author Only Title Only Author and Title
Rocha M Licausi F Arauacutejo WL Nunes-Nesi A Sodek L Fernie AR van Dongen JT (2010) Glycolysis and the tricarboxylic acid cycleare linked by alanine aminotransferase during hypoxia induced by waterlogging of Lotus japonicus Plant Physiol 152 1501-1513
Pubmed Author and TitleCrossRef Author and TitleGoogle Scholar Author Only Title Only Author and Title
Roessner-Tunali U Liu J Leisse A Balbo I Perez-Melis A Willmitzer L Fernie AR (2004) Kinetics of labelling of organic and aminoacids in potato tubers by gas chromatography-mass spectrometry following
incubation in (13)C labelled isotopes Plant J 39 668-679
Satya Narayan V Nair PM (1989) Potato tuber succinate semialdehyde dehydrogenase purification and characterization ArchBiochem Biophys 275 469-477
Pubmed Author and TitleCrossRef Author and TitleGoogle Scholar Author Only Title Only Author and Title
wwwplantphysiolorgon November 8 2018 - Published by Downloaded from Copyright copy 2015 American Society of Plant Biologists All rights reserved
Schauer N Steinhauser D Strelkov S Schomburg D Allison G Moritz T Lundgren K Roessner-Tunali U Forbes MG WillmitzerL Fernie AR Kopka J (2005) GCMS libraries for the rapid identification of metabolites in complex biological samples FEBS Letters579 1332-1337
Pubmed Author and TitleCrossRef Author and TitleGoogle Scholar Author Only Title Only Author and Title
Schwender J Ohlrogge JB (2002) Probing in vivo metabolism by stable isotope labeling of storage lipids and proteins indeveloping Brassica napus embryos Plant Physiol 130 347-361
Pubmed Author and TitleCrossRef Author and TitleGoogle Scholar Author Only Title Only Author and Title
Schwender J Shachar-Hill Y Ohlrogge JB (2004) Understanding ux in plant metabolic networks Curr Opin Plant Biol 7 309-317Pubmed Author and TitleCrossRef Author and TitleGoogle Scholar Author Only Title Only Author and Title
Schwender J Shachar-Hill Y Ohlrogge JB (2006) Mitochondrial metabolism in developing embryos of Brassica napus J BiolChem 281 34040-34047
Pubmed Author and TitleCrossRef Author and TitleGoogle Scholar Author Only Title Only Author and Title
Setieacuten I Vega-Mas I Celestino N Calleja-Cervantes ME Gonzaacutelez-Murua C Estavillo JM Gonzaacutelez-Moro MB (2014) Rootphosphoenolpyruvate carboxylase and NAD-malic enzymes activity increase the ammonium-assimilating capacity in tomato J PlantPhysiol 171 49-63
Pubmed Author and TitleCrossRef Author and TitleGoogle Scholar Author Only Title Only Author and Title
Shelp BJ Walton CS Snedden WA Tuin LG Oresnik IJ Layzell DB (1995) Gaba shunt in developing soybean seeds is associatedwith hypoxia Physiol Plant 94 219-228
Pubmed Author and TitleCrossRef Author and TitleGoogle Scholar Author Only Title Only Author and Title
Shelp BJ Mullen RT Waller JC (2012) Compartmentation of GABA metabolism raises intriguing questions Trends Plant Sci 17 57-59
Pubmed Author and TitleCrossRef Author and TitleGoogle Scholar Author Only Title Only Author and Title
Sousa CAF Sodek L (2003) Alanine metabolism and alanine aminotransferase activity in soybean (Glycine max) during hypoxia ofthe root system and subsequent return to normoxia Environ Exp Bot 50 1-8
Pubmed Author and TitleCrossRef Author and TitleGoogle Scholar Author Only Title Only Author and Title
Steuer R Nunes-Nesi A Fernie AR Gross T Blasius B Selbig J (2007) From structure to dynamics of metabolic pathwaysapplication to the plant mitochondrial TCA cycle Bioinformatics 23 1378-1385
Pubmed Author and TitleCrossRef Author and TitleGoogle Scholar Author Only Title Only Author and Title
Sweetlove LJ Beard KFM Nunes-Nesi A Fernie AR Ratcliffe RG (2010) Not just a circle flux modes in the plant TCA cycleTrends Plant Sci 15 462-470
Pubmed Author and TitleCrossRef Author and TitleGoogle Scholar Author Only Title Only Author and Title
Tadege M Dupuis II Kuhlemeier C (1999) Ethanolic fermentation new functions for an old pathway Trends Plant Sci 4 320-325Pubmed Author and TitleCrossRef Author and TitleGoogle Scholar Author Only Title Only Author and Title
Tcherkez G Maheacute A Gauthier P Mauve C Gout E Bligny R Cornic G Hodges M (2009) In folio respiratory fluxomics revealed by13C isotopic labelling and HD isotope effects highlight the noncyclic nature of the Tricarboxylic Acid Cycle in illuminated leavesPlant Physiol 151 620-630
Pubmed Author and TitleCrossRef Author and TitleGoogle Scholar Author Only Title Only Author and Title
Tovar-Meacutendez A Miernyk JA Randall DD (2003) Regulation of pyruvate dehydrogenase complex activity in plant cells Eur JBiochem 270 1043-1049
Pubmed Author and TitleCrossRef Author and TitleGoogle Scholar Author Only Title Only Author and Title
Turano FJ Fang TK (1998) Characterization of two glutamate decarboxylase cDNA clones from Arabidopsis Plant Physiol 117 wwwplantphysiolorgon November 8 2018 - Published by Downloaded from
Copyright copy 2015 American Society of Plant Biologists All rights reserved
1411-1421Pubmed Author and TitleCrossRef Author and TitleGoogle Scholar Author Only Title Only Author and Title
van Dongen JT Froumlhlich A Ramiacuterez-Aguilar SJ Schauer N Fernie AR Erban A Kopka J Clark J Langer A Geigenberger P (2009)Transcript and metabolite profiling of the adaptive response to mild decreases in oxygen concentration in the roots of Arabidopsisplants Ann Bot 103 269-80
Pubmed Author and TitleCrossRef Author and TitleGoogle Scholar Author Only Title Only Author and Title
van Dongen JT Gupta KJ Ramiacuterez-Aguilar SJ Arauacutejo WL Nunes-Nesi A Fernie AR (2011) Regulation of respiration in plants arole for alternative metabolic pathways J Plant Physiol 168 1434-1443
Pubmed Author and TitleCrossRef Author and TitleGoogle Scholar Author Only Title Only Author and Title
Vanlerberghe GC Horsey AK Weger HG Turpin DH (1989) Anaerobic carbon metabolism by the tricarboxylic acid cycle Evidencefor partial and reductive pathways during dark ammonium assimilation Plant Physiol 91 1551-1557
Pubmed Author and TitleCrossRef Author and TitleGoogle Scholar Author Only Title Only Author and Title
Vanlerberghe GC Feil R Turpin DH (1990) Anaerobic metabolism in the N-limited green alga Selenastrum minutum I Regulationof carbon metabolism and succinate as a fermentation product Plant Physiol 94 1116-1123
Pubmed Author and TitleCrossRef Author and TitleGoogle Scholar Author Only Title Only Author and Title
Vanlerberghe GC Turpin DH (1990) Anaerobic metabolism in the N-limited green alga Selenastrum minutum II Assimilation ofammonium by anaerobic cells Plant Physiol 94 1124-1130
Pubmed Author and TitleCrossRef Author and TitleGoogle Scholar Author Only Title Only Author and Title
Vanlerberghe GC Joy KW Turpin DH (1991) Anaerobic metabolism in the N-Limited green alga Selenastrum minutum III Alanine isthe product of anaerobic ammonium assimilation Plant Physiol 1991 95 655-658
Pubmed Author and TitleCrossRef Author and TitleGoogle Scholar Author Only Title Only Author and Title
Voesenek LACJ Bailey-Serres J (2015) Flood adaptive traits and processes an overview New Phytol 206 57-73Pubmed Author and TitleCrossRef Author and TitleGoogle Scholar Author Only Title Only Author and Title
Williams TCR Miguet L Masakapalli SK Kruger NJ Sweetlove LJ Ratcliffe G (2008) Metabolic network fluxes in heterotrophicArabidopsis cells stability of the flux distribution under different oxygenation conditions Plant Physiol 148 704-718
Pubmed Author and TitleCrossRef Author and TitleGoogle Scholar Author Only Title Only Author and Title
Zabalza A van Dongen JT Froehlich A Oliver SN Faix B Gupta KJ Schmaumllzlin E Igal M Orcaray L Royuela M Geigenberger P(2009) Regulation of respiration and fermentation to control the plant internal oxygen concentration Plant Physiol 149 1087-1098
Pubmed Author and TitleCrossRef Author and TitleGoogle Scholar Author Only Title Only Author and Title
Zabalza A Orcaray L Igal M Schauer N Fernie AR Geigenberger P van Dongen JT Royuela M (2011) Unravelling the role offermentation in the mode of action of acetolactate synthase inhibitors by metabolic profiling J Plant Physiol 168 1568-1575
Pubmed Author and TitleCrossRef Author and TitleGoogle Scholar Author Only Title Only Author and Title
wwwplantphysiolorgon November 8 2018 - Published by Downloaded from Copyright copy 2015 American Society of Plant Biologists All rights reserved
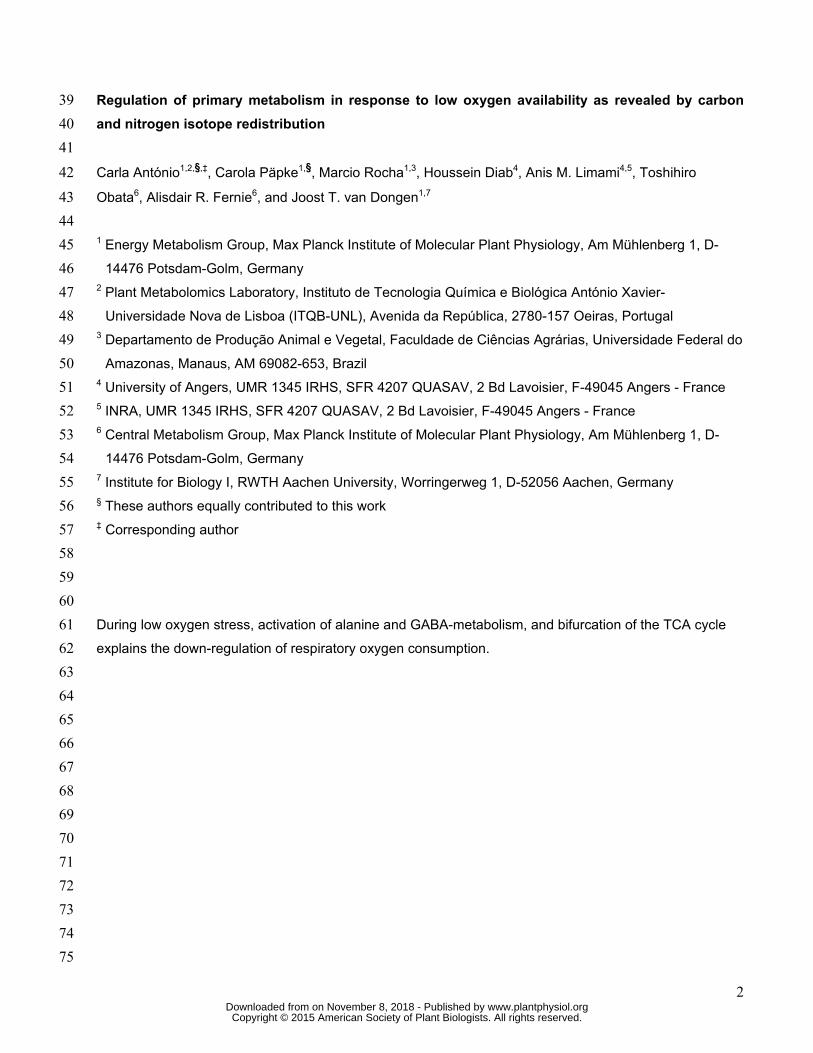
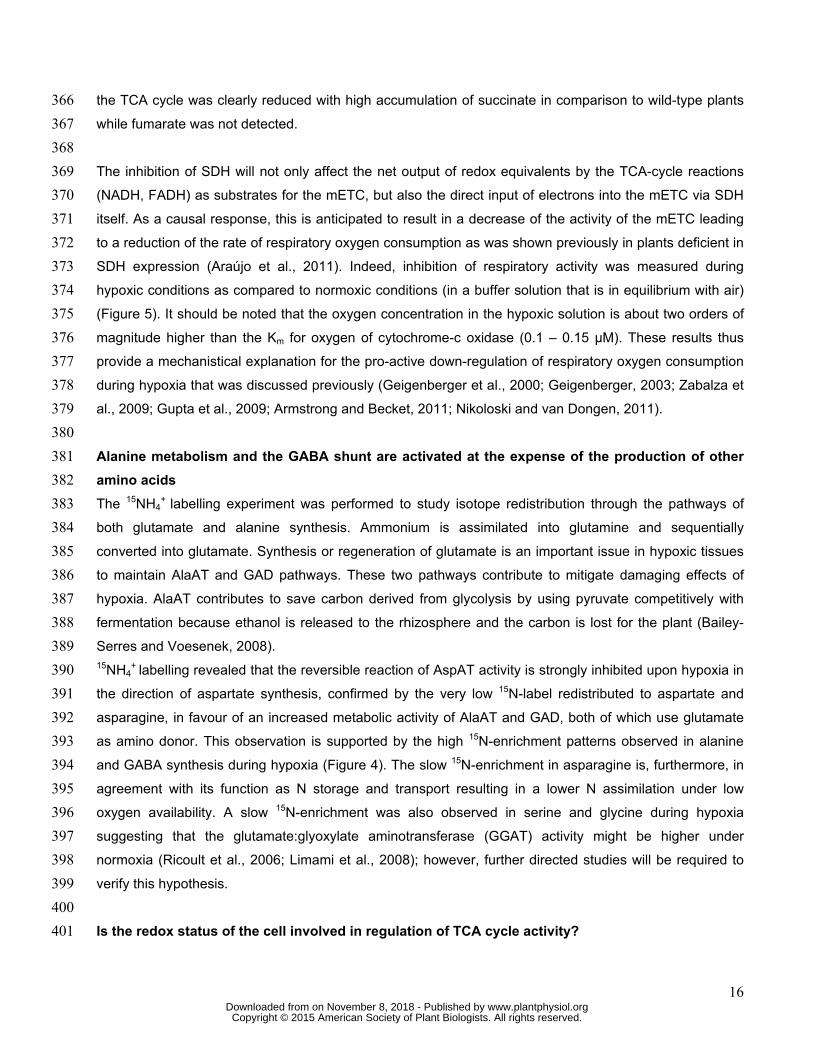
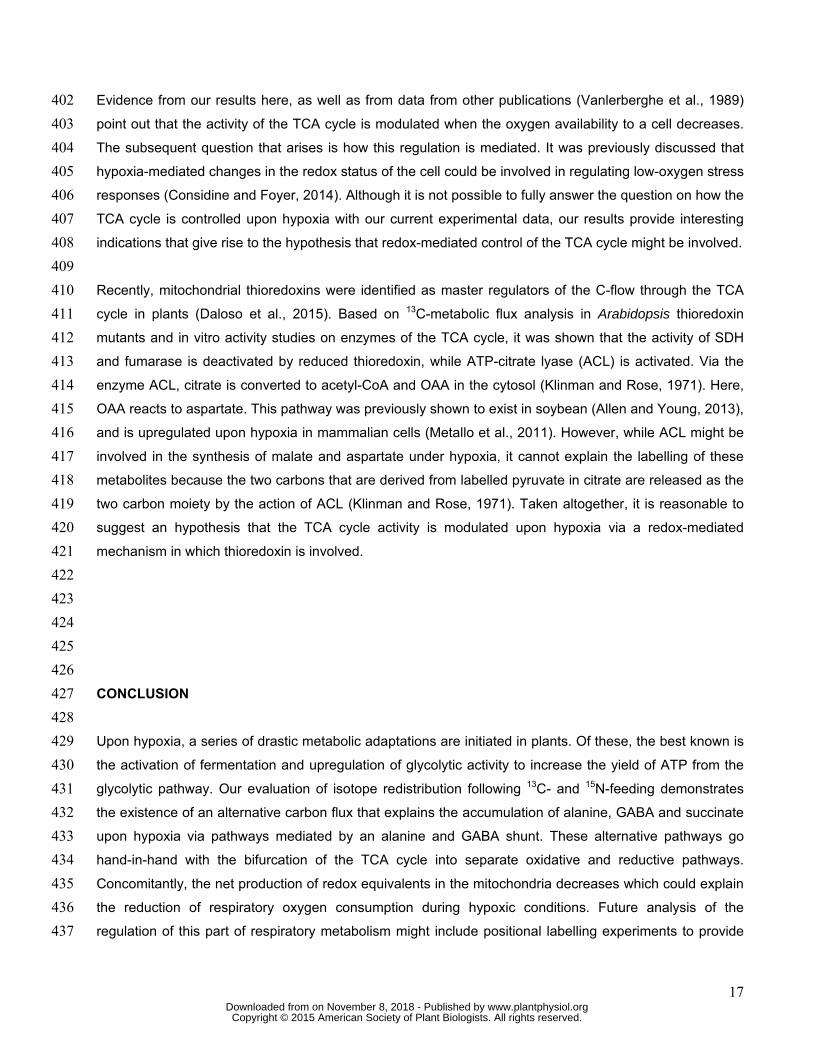
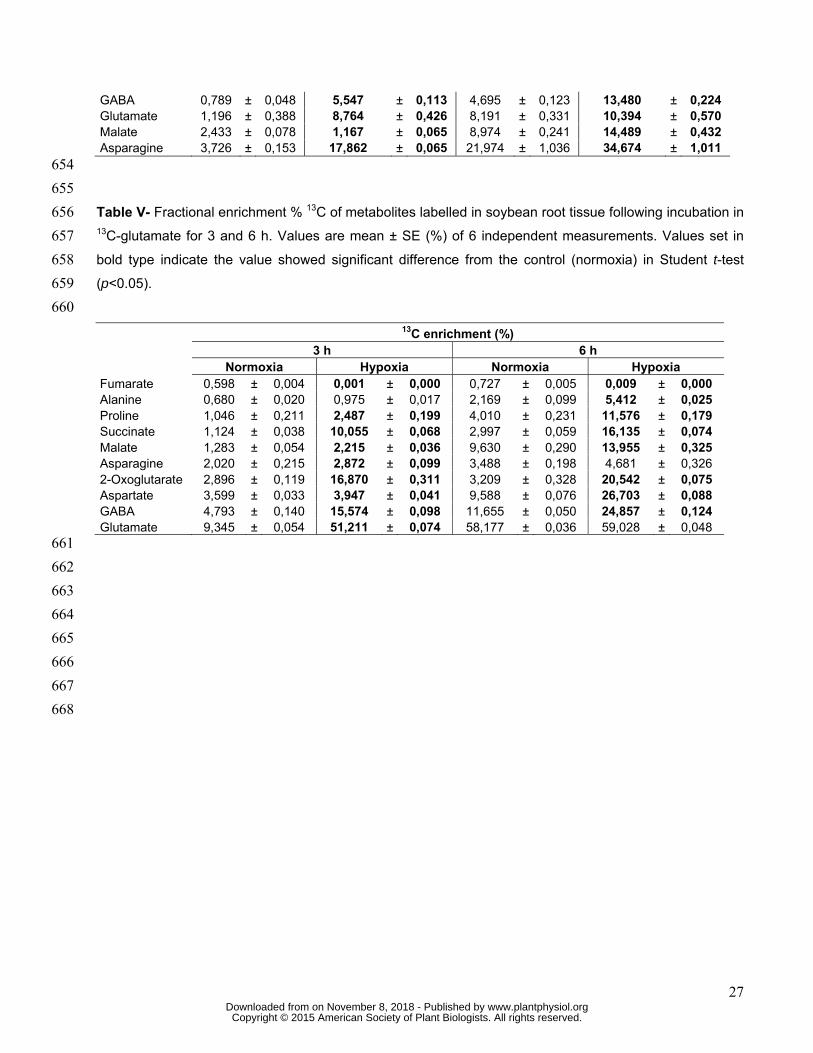

Pubmed Author and TitleCrossRef Author and TitleGoogle Scholar Author Only Title Only Author and Title
Grafahrend-Belau E Junker A Eschenroumlder A Muumlller J Schreiber F Junker BH (2013) Multiscale metabolic modeling dynamicflux balance analysis on a whole-plant scale Plant Physiol 163 637-647
Pubmed Author and TitleCrossRef Author and TitleGoogle Scholar Author Only Title Only Author and Title
Gupta KJ Zabalza A van Dongen JT (2009) Regulation of respiration when the oxygen availability changes Physiol Plantarum 137383-391
Pubmed Author and TitleCrossRef Author and TitleGoogle Scholar Author Only Title Only Author and Title
Hanning I Heldt HW (1993) On the function of mitochondrial metabolism during photosynthesis in spinach (Spinacia oleracea L)leaves Partitioning between respiration and export of redox equivalents and precursors for nitrate assimilation products PlantPhysiol 103 1147-1154
Pubmed Author and TitleCrossRef Author and TitleGoogle Scholar Author Only Title Only Author and Title
Hoagland D Arnon D (1950) The water culture method of growing plants without soil California Agricultural Experiment StationBulletin 347
Pubmed Author and TitleCrossRef Author and TitleGoogle Scholar Author Only Title Only Author and Title
Huege J Goetze J Schwarz D Bauwe H Hagemann M Kopka J (2011) Modulation of the major paths of carbon inphotorespiratory mutants of Synechocystis PLoS ONE 6 e16278 doi101371journalpone0016278
Pubmed Author and TitleCrossRef Author and TitleGoogle Scholar Author Only Title Only Author and Title
Jorge TF Rodrigues JA Caldana C Schmidt R van Dongen J Thomas-Oates J Antonio C (2015) Mass spectrometry-based plantmetabolomics metabolite responses to abiotic stress Mass Spectrom Rev DOI 101002mas21449
Pubmed Author and TitleCrossRef Author and TitleGoogle Scholar Author Only Title Only Author and Title
Klinman JP Rose IA (1971) Stereochemistry of the interconversions of citrate and acetate catalyzed by citrate synthase adenosinetriphosphate citrate lyase and citrate lyase Biochem 10 2267-2272
Pubmed Author and TitleCrossRef Author and TitleGoogle Scholar Author Only Title Only Author and Title
Kopka J Schauer N Krueger S Birkemeyer C Usadel B Bergmuller E Dormann P Weckwerth W Gibon Y Stitt M Willmitzer LFernie AR Steinhauser D (2005) GmdcsbDb The Golm Metabolome Database Bioinformatics 21 1635-1638
Pubmed Author and TitleCrossRef Author and TitleGoogle Scholar Author Only Title Only Author and Title
Kreuzwieser J Hauberg J Howell KA Carroll A Rennenberg H Millar AH Whelan J (2009) Differentail response of gray poplarleaves and roots underpins stress adaptation during hypoxia Plant Physiol 149 461-473
Pubmed Author and TitleCrossRef Author and TitleGoogle Scholar Author Only Title Only Author and Title
Kruger NJ von Schaewen A (2003) The oxidative pentose phosphate pathway structure and organization Curr Opin Plant Biol6 236-246
Pubmed Author and TitleCrossRef Author and TitleGoogle Scholar Author Only Title Only Author and Title
Limami AM Gleacutevarec G Ricoult C Cliquet J-B Planchet E (2008) Concerted modulation of alanine and glutamate metabolism inyoung Medicago truncatula seedlings under hypoxic stress J Exp Bot 59 2325-2335
Pubmed Author and TitleCrossRef Author and TitleGoogle Scholar Author Only Title Only Author and Title
Lisec J Schauer N Kopka J Willmitzer L Fernie AR (2006) Gas chromatography mass spectrometry-based metabolite profiling inplants Nature Protocols 1 387-396
Pubmed Author and TitleCrossRef Author and TitleGoogle Scholar Author Only Title Only Author and Title
Luedemann A Strassburg K Erban A Kopka J (2008) TagFinder for the quantitative analysis of gas chromatography-massspectrometry (GC-MS)-based metabolite profiling experiments Bioinformatics 24 732-737
Pubmed Author and Title wwwplantphysiolorgon November 8 2018 - Published by Downloaded from
Copyright copy 2015 American Society of Plant Biologists All rights reserved
CrossRef Author and TitleGoogle Scholar Author Only Title Only Author and Title
Ma F Jazmin LJ Young JD Allen DK (2014) Isotopically nonstationary 13C flux analysis of changes in Arabidopsis thaliana leafmetabolism due to high light acclimation PNAS 11116967-16972
Pubmed Author and TitleCrossRef Author and TitleGoogle Scholar Author Only Title Only Author and Title
Metallo CM Gameiro PA Bell EL Mattaini KR Yang J Hiller K Jewell CM Johnson ZR Irvine DJ Guarente L Kelleher JKHeiden MGV Iliopoulos O Stephanopoulos G (2011) Reductive glutamine metabolism by IDH1 mediates lipogenesis underhypoxia Nature 468 380-386
Pubmed Author and TitleCrossRef Author and TitleGoogle Scholar Author Only Title Only Author and Title
Millar AH Whelan J Soole KL Day DA (2011) Organisation and regulation of mitochondrial respiration in plants Ann Rev PlantBiol 62 79-104
Pubmed Author and TitleCrossRef Author and TitleGoogle Scholar Author Only Title Only Author and Title
Mustroph A Lee SC Oosumi T Zanetti ME Yang H Ma K Yaghoubi-Masihi A Fukao T Bailey-Serres J (2010) Cross-kingdomcomparison of transcriptomic adjustments to low-oxygen stress highlights conserved and plant-specific responses Plant Physiol152 1484-1500
Pubmed Author and TitleCrossRef Author and TitleGoogle Scholar Author Only Title Only Author and Title
Narsai R Rocha M Geigenberger P Whelan J van Dongen JT (2011) Comparative analysis between plant species oftranscriptional and metabolic responses to hypoxia New Phytol 190 472-487
Pubmed Author and TitleCrossRef Author and TitleGoogle Scholar Author Only Title Only Author and Title
Nikoloski Z van Dongen JT (2011) Modeling alternatives for interpreting the change in oxygen-consumption rates during hypoxicconditions New Phytol 190 273-276
Pubmed Author and TitleCrossRef Author and TitleGoogle Scholar Author Only Title Only Author and Title
Plaxton WC Podesta FE (2006) The functional organization and control of plant respiration Crit Rev Plant Sci 25 159-198Pubmed Author and TitleCrossRef Author and TitleGoogle Scholar Author Only Title Only Author and Title
Ratcliffe RG Shachar-Hill Y (2006) Measuring multiple fluxes through plant metabolic networks Plant J 45 490-511Pubmed Author and TitleCrossRef Author and TitleGoogle Scholar Author Only Title Only Author and Title
Ricoult C Echeverria LO Cliquet J-B Limami AM (2006) Characterization of alanine aminotransferase (AlaAT) multigene family andhypoxic responsive in young seedlings of the model legume Medicago truncatula J Exp Bot 57 3079-3089
Pubmed Author and TitleCrossRef Author and TitleGoogle Scholar Author Only Title Only Author and Title
Roberts JKM Hooks MA Miaullis AP Edwards S Webster C (1992) Contribution of malate and amino acid metabolism tocytoplasmic pH regulation in hypoxic maize root tips studied using nuclear magnetic resonance spectroscopy Plant Physiol 98480-487
Pubmed Author and TitleCrossRef Author and TitleGoogle Scholar Author Only Title Only Author and Title
Rocha M Licausi F Arauacutejo WL Nunes-Nesi A Sodek L Fernie AR van Dongen JT (2010) Glycolysis and the tricarboxylic acid cycleare linked by alanine aminotransferase during hypoxia induced by waterlogging of Lotus japonicus Plant Physiol 152 1501-1513
Pubmed Author and TitleCrossRef Author and TitleGoogle Scholar Author Only Title Only Author and Title
Roessner-Tunali U Liu J Leisse A Balbo I Perez-Melis A Willmitzer L Fernie AR (2004) Kinetics of labelling of organic and aminoacids in potato tubers by gas chromatography-mass spectrometry following
incubation in (13)C labelled isotopes Plant J 39 668-679
Satya Narayan V Nair PM (1989) Potato tuber succinate semialdehyde dehydrogenase purification and characterization ArchBiochem Biophys 275 469-477
Pubmed Author and TitleCrossRef Author and TitleGoogle Scholar Author Only Title Only Author and Title
wwwplantphysiolorgon November 8 2018 - Published by Downloaded from Copyright copy 2015 American Society of Plant Biologists All rights reserved
Schauer N Steinhauser D Strelkov S Schomburg D Allison G Moritz T Lundgren K Roessner-Tunali U Forbes MG WillmitzerL Fernie AR Kopka J (2005) GCMS libraries for the rapid identification of metabolites in complex biological samples FEBS Letters579 1332-1337
Pubmed Author and TitleCrossRef Author and TitleGoogle Scholar Author Only Title Only Author and Title
Schwender J Ohlrogge JB (2002) Probing in vivo metabolism by stable isotope labeling of storage lipids and proteins indeveloping Brassica napus embryos Plant Physiol 130 347-361
Pubmed Author and TitleCrossRef Author and TitleGoogle Scholar Author Only Title Only Author and Title
Schwender J Shachar-Hill Y Ohlrogge JB (2004) Understanding ux in plant metabolic networks Curr Opin Plant Biol 7 309-317Pubmed Author and TitleCrossRef Author and TitleGoogle Scholar Author Only Title Only Author and Title
Schwender J Shachar-Hill Y Ohlrogge JB (2006) Mitochondrial metabolism in developing embryos of Brassica napus J BiolChem 281 34040-34047
Pubmed Author and TitleCrossRef Author and TitleGoogle Scholar Author Only Title Only Author and Title
Setieacuten I Vega-Mas I Celestino N Calleja-Cervantes ME Gonzaacutelez-Murua C Estavillo JM Gonzaacutelez-Moro MB (2014) Rootphosphoenolpyruvate carboxylase and NAD-malic enzymes activity increase the ammonium-assimilating capacity in tomato J PlantPhysiol 171 49-63
Pubmed Author and TitleCrossRef Author and TitleGoogle Scholar Author Only Title Only Author and Title
Shelp BJ Walton CS Snedden WA Tuin LG Oresnik IJ Layzell DB (1995) Gaba shunt in developing soybean seeds is associatedwith hypoxia Physiol Plant 94 219-228
Pubmed Author and TitleCrossRef Author and TitleGoogle Scholar Author Only Title Only Author and Title
Shelp BJ Mullen RT Waller JC (2012) Compartmentation of GABA metabolism raises intriguing questions Trends Plant Sci 17 57-59
Pubmed Author and TitleCrossRef Author and TitleGoogle Scholar Author Only Title Only Author and Title
Sousa CAF Sodek L (2003) Alanine metabolism and alanine aminotransferase activity in soybean (Glycine max) during hypoxia ofthe root system and subsequent return to normoxia Environ Exp Bot 50 1-8
Pubmed Author and TitleCrossRef Author and TitleGoogle Scholar Author Only Title Only Author and Title
Steuer R Nunes-Nesi A Fernie AR Gross T Blasius B Selbig J (2007) From structure to dynamics of metabolic pathwaysapplication to the plant mitochondrial TCA cycle Bioinformatics 23 1378-1385
Pubmed Author and TitleCrossRef Author and TitleGoogle Scholar Author Only Title Only Author and Title
Sweetlove LJ Beard KFM Nunes-Nesi A Fernie AR Ratcliffe RG (2010) Not just a circle flux modes in the plant TCA cycleTrends Plant Sci 15 462-470
Pubmed Author and TitleCrossRef Author and TitleGoogle Scholar Author Only Title Only Author and Title
Tadege M Dupuis II Kuhlemeier C (1999) Ethanolic fermentation new functions for an old pathway Trends Plant Sci 4 320-325Pubmed Author and TitleCrossRef Author and TitleGoogle Scholar Author Only Title Only Author and Title
Tcherkez G Maheacute A Gauthier P Mauve C Gout E Bligny R Cornic G Hodges M (2009) In folio respiratory fluxomics revealed by13C isotopic labelling and HD isotope effects highlight the noncyclic nature of the Tricarboxylic Acid Cycle in illuminated leavesPlant Physiol 151 620-630
Pubmed Author and TitleCrossRef Author and TitleGoogle Scholar Author Only Title Only Author and Title
Tovar-Meacutendez A Miernyk JA Randall DD (2003) Regulation of pyruvate dehydrogenase complex activity in plant cells Eur JBiochem 270 1043-1049
Pubmed Author and TitleCrossRef Author and TitleGoogle Scholar Author Only Title Only Author and Title
Turano FJ Fang TK (1998) Characterization of two glutamate decarboxylase cDNA clones from Arabidopsis Plant Physiol 117 wwwplantphysiolorgon November 8 2018 - Published by Downloaded from
Copyright copy 2015 American Society of Plant Biologists All rights reserved
1411-1421Pubmed Author and TitleCrossRef Author and TitleGoogle Scholar Author Only Title Only Author and Title
van Dongen JT Froumlhlich A Ramiacuterez-Aguilar SJ Schauer N Fernie AR Erban A Kopka J Clark J Langer A Geigenberger P (2009)Transcript and metabolite profiling of the adaptive response to mild decreases in oxygen concentration in the roots of Arabidopsisplants Ann Bot 103 269-80
Pubmed Author and TitleCrossRef Author and TitleGoogle Scholar Author Only Title Only Author and Title
van Dongen JT Gupta KJ Ramiacuterez-Aguilar SJ Arauacutejo WL Nunes-Nesi A Fernie AR (2011) Regulation of respiration in plants arole for alternative metabolic pathways J Plant Physiol 168 1434-1443
Pubmed Author and TitleCrossRef Author and TitleGoogle Scholar Author Only Title Only Author and Title
Vanlerberghe GC Horsey AK Weger HG Turpin DH (1989) Anaerobic carbon metabolism by the tricarboxylic acid cycle Evidencefor partial and reductive pathways during dark ammonium assimilation Plant Physiol 91 1551-1557
Pubmed Author and TitleCrossRef Author and TitleGoogle Scholar Author Only Title Only Author and Title
Vanlerberghe GC Feil R Turpin DH (1990) Anaerobic metabolism in the N-limited green alga Selenastrum minutum I Regulationof carbon metabolism and succinate as a fermentation product Plant Physiol 94 1116-1123
Pubmed Author and TitleCrossRef Author and TitleGoogle Scholar Author Only Title Only Author and Title
Vanlerberghe GC Turpin DH (1990) Anaerobic metabolism in the N-limited green alga Selenastrum minutum II Assimilation ofammonium by anaerobic cells Plant Physiol 94 1124-1130
Pubmed Author and TitleCrossRef Author and TitleGoogle Scholar Author Only Title Only Author and Title
Vanlerberghe GC Joy KW Turpin DH (1991) Anaerobic metabolism in the N-Limited green alga Selenastrum minutum III Alanine isthe product of anaerobic ammonium assimilation Plant Physiol 1991 95 655-658
Pubmed Author and TitleCrossRef Author and TitleGoogle Scholar Author Only Title Only Author and Title
Voesenek LACJ Bailey-Serres J (2015) Flood adaptive traits and processes an overview New Phytol 206 57-73Pubmed Author and TitleCrossRef Author and TitleGoogle Scholar Author Only Title Only Author and Title
Williams TCR Miguet L Masakapalli SK Kruger NJ Sweetlove LJ Ratcliffe G (2008) Metabolic network fluxes in heterotrophicArabidopsis cells stability of the flux distribution under different oxygenation conditions Plant Physiol 148 704-718
Pubmed Author and TitleCrossRef Author and TitleGoogle Scholar Author Only Title Only Author and Title
Zabalza A van Dongen JT Froehlich A Oliver SN Faix B Gupta KJ Schmaumllzlin E Igal M Orcaray L Royuela M Geigenberger P(2009) Regulation of respiration and fermentation to control the plant internal oxygen concentration Plant Physiol 149 1087-1098
Pubmed Author and TitleCrossRef Author and TitleGoogle Scholar Author Only Title Only Author and Title
Zabalza A Orcaray L Igal M Schauer N Fernie AR Geigenberger P van Dongen JT Royuela M (2011) Unravelling the role offermentation in the mode of action of acetolactate synthase inhibitors by metabolic profiling J Plant Physiol 168 1568-1575
Pubmed Author and TitleCrossRef Author and TitleGoogle Scholar Author Only Title Only Author and Title
wwwplantphysiolorgon November 8 2018 - Published by Downloaded from Copyright copy 2015 American Society of Plant Biologists All rights reserved