Embed Size (px)
Citation preview
WWW.INDUSTRY.GOV.AU/REQ
Resources and Energy QuarterlyJune 2021

2
Further informationFor more information on data or government initiatives please access the report from the Department’s website at: www.industry.gov.au/oce
EditorDavid Thurtell
Chapter AuthorsResource and energy overview: David Thurtell
Macroeconomic overview and copper: Kate Martin
Steel and iron ore: Andrew Nash
Metallurgical coal, thermal coal and uranium: Mark Gibbons
Gas: Nathan Pitts
Oil and Nickel: Breanna Gasson
Gold, aluminium, alumina and bauxite: Thuong Nguyen
Zinc and lithium: Caroline Lewis
AcknowledgementsThe authors would like to acknowledge the contributions of:
Kayelle Drinkwater, James Hutson, Jeewantha Karunarathna, Lauren Pratley, Russell Wilson and Joseph Winterbottom
Cover image source: Shutterstock
ISSN 1839-5007
Vol. 11, no. 2
© Commonwealth of Australia 2021
Ownership of intellectual property rightsUnless otherwise noted, copyright (and any other intellectual property rights, if any) in this publication is owned by the Commonwealth of Australia.
Creative Commons licence
All material in this publication is licensed under a Creative Commons Attribution 4.0 International Licence, with the exception of:• the Commonwealth Coat of Arms;• content supplied by third parties;• logos; and • any material protected by trademark or otherwise noted in this publication.
Creative Commons Attribution 4.0 International Licence is a standard form licence agreement that allows you to copy, distribute, transmit and adapt this publication provided you attribute the work. A summary of the licence terms is available from https://creativecommons.org/licenses/by/4.0/.
Wherever a third party holds copyright in material contained in this publication, the copyright remains with that party. Their permission may be required to use the material. Please contact them directly.
AttributionContent contained herein should be attributed as follows:
Department of Industry, Science, Energy and Resources, Commonwealth of Australia Resources and Energy Quarterly June 2021. The Commonwealth of Australia does not necessarily endorse the content of this publication.
Requests and inquiries concerning reproduction and rights should be addressed to [email protected]
Disclaimer The views expressed in this report are those of the author(s) and do not necessarily reflect those of the Australian Government or the Department of Industry, Science, Energy and Resources.
This publication is not legal or professional advice. The Commonwealth of Australia does not guarantee the accuracy or reliability of the information and data in the publication. Third parties rely upon this publication entirely at their own risk.
Attribution 4.0 International LicenceCC BY 4.0
3
Contents
Foreword 4
About the edition 5
Overview 6
Macroeconomic Outlook 15
Steel 23
Iron Ore 30
Metallurgical Coal 40
Thermal Coal 50
Gas 62
Oil 74
Uranium 84
Gold 90
Aluminium 101
Copper 112
Nickel 120
Zinc 128
Lithium 138
Trade summary charts and tables 150
Appendix A: Definitions and classifications 158
Appendix B: Glossary 160
Gold Box 10.1: The Pilbara — Australia’s new gold rush region 98
Resources insights
Zinc Box 14.2: Zinc batteries for utility scale storage 131
Lithium Box 15.1: Electric vehicle trends 140
Zinc Box 14.1: Zinc batteries for power storage 131

4
Resources and Energy Quarterly June 2021
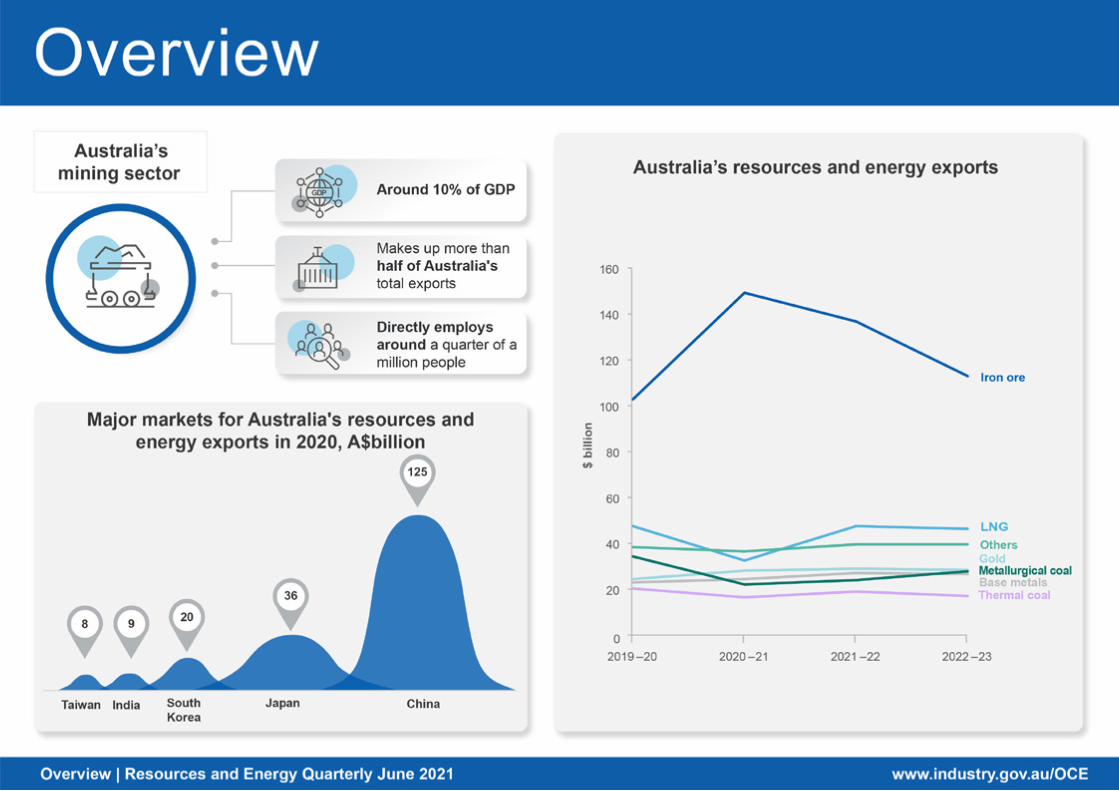
Foreword Australia’s resource and energy exports are estimated at a record $310 billion in 2020–21, with almost half of those earnings coming from iron ore alone. This is a very strong result in the context of the global COVID-19 pandemic. In 2021–22, a further rise in exports to $334 billion is forecast, before moderating world economic growth and falling prices reduce export earnings to $304 billion in 2022–23.
The rollout of COVID-19 vaccines in advanced nations is now steadily allowing a rebound in the services side of the world economy, where many sectors (such as land and air-based domestic tourism and hospitality) were more heavily impacted than goods markets. Petroleum and jet fuel demand — and hence the demand for oil — is picking up accordingly. The pent up demand for goods, and strong dwelling and infrastructure spending in many countries, will also see strong demand for steel and non-ferrous metals for some quarters yet.
Australian iron ore earnings appear to have surged by almost 50% to an all-time high in 2020–21: after topping the $100 billion mark (for the first time ever for a commodity) in 2019–20, iron ore export earnings are forecast to rise to $149 billion in 2020–21. Base metal prices have all surged back above levels reached just before the COVID-19 pandemic; strong demand and worries over higher taxes on South American mining companies have raised fears of a fall in mining investment in the continent, boosting the copper price to over US$10,000 a tonne.
With rising agricultural commodity prices and some mineral prices — such as iron ore and copper — reaching record levels, concerns have grown over global inflation. Bond yields have risen, as the market looks to the withdrawal of stimulatory monetary policies by the major central banks. However, major central banks have suggested that the price rises are likely to be transitory, pointing to both spare capacity in many sectors and the low level of inflation in recent decades — brought on largely by globalisation, deregulation, automation and technological advances, and the sharp reduction in search costs for consumers (thanks to the internet).
After a fall of 3.3% in 2020, the IMF forecasts world GDP growth of 6.0% in 2021 and 4.4% in 2022. The recovery is expected to be dominated by the advanced nations, where the COVID-19 vaccine rollout has been fastest and access higher.
Very strong growth in the Chinese economy in financial year 2020–21 seems set to moderate, with the IMF forecasting Chinese GDP growth of 8.4% in 2021 and around 5-1/2% in 2022 and 2023. This outlook has been helped by stimulatory Chinese government policy actions and high foreign demand for goods — needed to help solve the problems created by, and to cope with, the COVID-19 pandemic.
The rise in the Australian dollar during 2020 has partly diminished the impact of higher US dollar commodity prices on our export earnings, but has also acted to contain any inflationary pressures. A noticeable feature of the June quarter 2021 has been the steadiness in Australian dollar in the face of surging commodity prices, particularly iron ore.
Coal markets continue to adjust to China’s informal import restrictions on Australian coal. Thermal coal prices have surged in China, as a critical shortage emerges ahead of the Northern Hemisphere summer — when cooling demand raises the need for increased power output. Australia’s high calorie thermal coal has fared better than lower calorie grades which have seen greater discounting. Yet prices have increased across all grades in the face of supply shortages. Surging demand from steel producers has seen Australian metallurgical coal prices regain all of the losses incurred as a result of China’s informal import restrictions.
There are downside risks to these extremely strong export earnings forecasts. These include a potential for a spike in global inflation and a sharper than expected tightening of monetary policy by major central banks, and a risk of delays in the rollout of COVID-19 vaccines to the world’s working population. Another downside risk is the extent of further disruption to Australian resource and energy commodity trade with China, which took 45% of such Australian exports in 2020.

5
Resources and Energy Quarterly June 2021
About this edition The Resources and Energy Quarterly (REQ) contains the Office of the Chief Economist’s forecasts for the value, volume and price of Australia’s major resources and energy commodity exports.
A ‘medium term’ (five year) outlook is published in the March quarter edition of the Resources and Energy Quarterly. Each June, September and December edition of the Resources and Energy Quarterly features a ‘short term’ (two year) outlook for Australia’s major resource and energy commodity exports.
Underpinning the forecasts/projections contained in the Resources and Energy Quarterly is the Office of the Chief Economist’s outlook for global resource and energy commodity prices, demand and supply. The forecasts/projections for Australia’s resource and energy commodity exporters are reconciled with this global context.
The global environment in which Australia’s producers compete can change rapidly. Each edition of the Resources and Energy Quarterly attempts to factor in these changes, and makes appropriate alterations to the forecasts/projections by estimating the impact on Australian producers and the value of their exports.
In this report, commodities are grouped into two broad categories, referred to as ‘resources’ and ‘energy’. ‘Energy’ commodities comprise metallurgical and thermal coal, oil, gas and uranium. ‘Resource’ commodities in this report are all other mineral commodities.
Unless otherwise stated, all Australian and US dollar figures in this report are in nominal terms. Inflation and exchange rate assumptions are provided in tables 2.1 and 2.2 in the macroeconomic outlook chapter.
Information in this edition of the Resources and Energy Quarterly is current as of 21 June 2021.
Resources and Energy Quarterly publication schedule
Publication Expected release date Outlook period final year
September 2021 30 September 2021 Australian data: 2022–23 World data: 2023
December 2021 20 December 2021 Australian data: 2022–23 World data: 2023
March 2022 4 April 2022 Australian data: 2026–27 World data: 2027
June 2022 4 July 2022 Australian data: 2023–24 World data: 2024
Source: Department of Industry, Science, Energy and Resources (2021)
7
Resources and Energy Quarterly June 2021
1.1 Summary The outlook for Australia’s mineral exports continues to improve, as the
world economy rebounds from the impact of the COVID-19 pandemic. As the world economy recovers, record iron ore prices have driven a surge in export earnings. Our metallurgical coal mining firms are also benefiting from the surge in world steel production.
2020–21 export earnings are estimated at $310 billion, up almost 7% on the record set in 2019–20. Earnings are expected to rise further to $334 billion in 2021–22, before declining to $304 billion in 2022–23.
Australian thermal coal miners are pivoting to ex-China markets, helped by critical shortages after a very cold Northern Hemisphere winter.
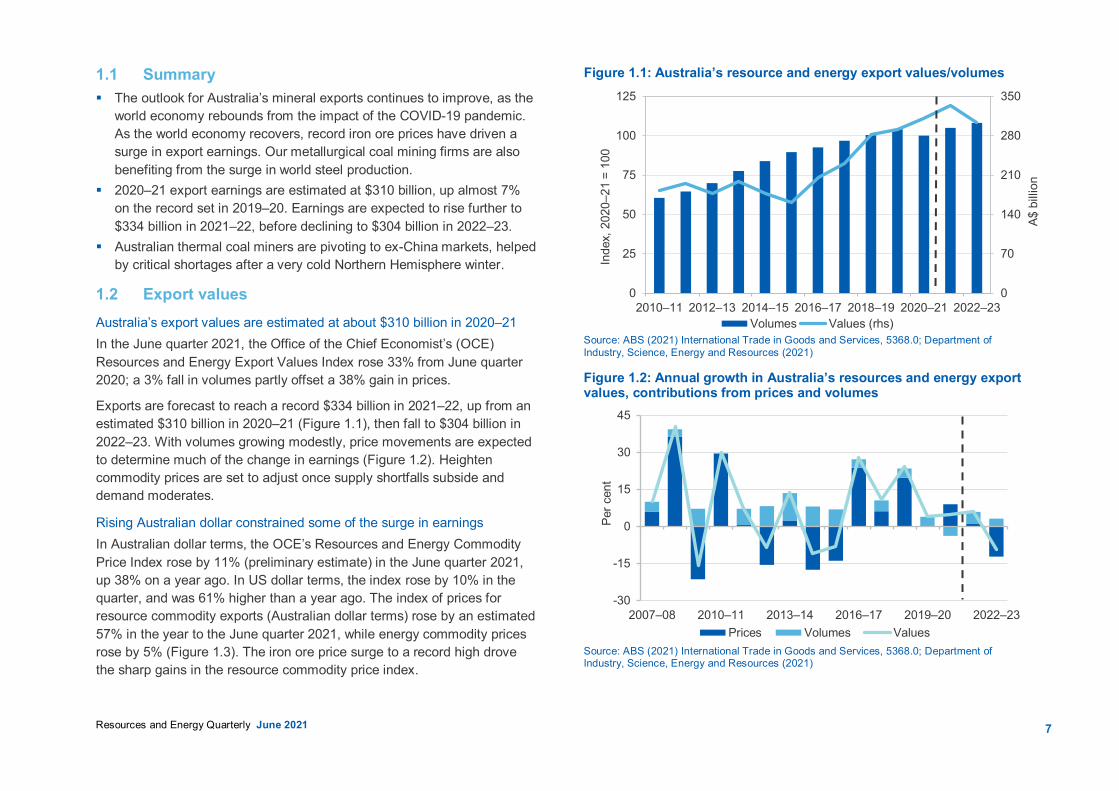
1.2 Export values Australia’s export values are estimated at about $310 billion in 2020–21 In the June quarter 2021, the Office of the Chief Economist’s (OCE) Resources and Energy Export Values Index rose 33% from June quarter 2020; a 3% fall in volumes partly offset a 38% gain in prices.
Exports are forecast to reach a record $334 billion in 2021–22, up from an estimated $310 billion in 2020–21 (Figure 1.1), then fall to $304 billion in 2022–23. With volumes growing modestly, price movements are expected to determine much of the change in earnings (Figure 1.2). Heighten commodity prices are set to adjust once supply shortfalls subside and demand moderates.
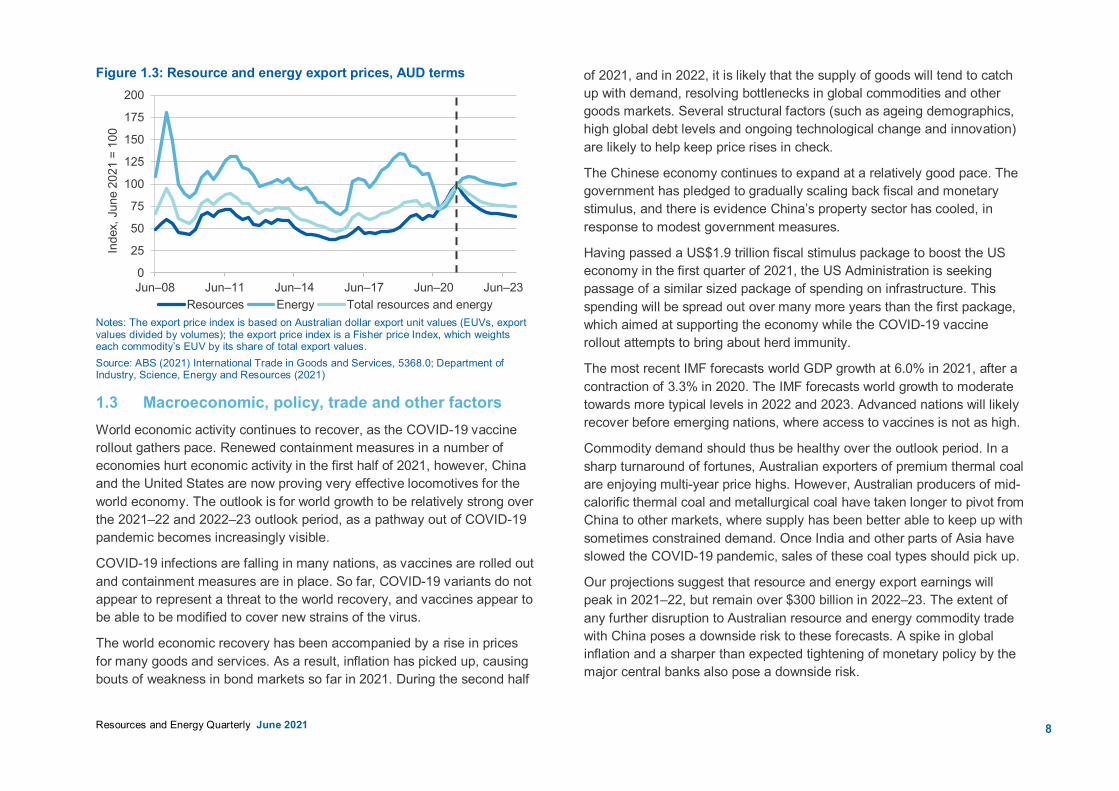
Rising Australian dollar constrained some of the surge in earnings In Australian dollar terms, the OCE’s Resources and Energy Commodity Price Index rose by 11% (preliminary estimate) in the June quarter 2021, up 38% on a year ago. In US dollar terms, the index rose by 10% in the quarter, and was 61% higher than a year ago. The index of prices for resource commodity exports (Australian dollar terms) rose by an estimated 57% in the year to the June quarter 2021, while energy commodity prices rose by 5% (Figure 1.3). The iron ore price surge to a record high drove the sharp gains in the resource commodity price index.
Figure 1.1: Australia’s resource and energy export values/volumes
Source: ABS (2021) International Trade in Goods and Services, 5368.0; Department of Industry, Science, Energy and Resources (2021)
Figure 1.2: Annual growth in Australia’s resources and energy export values, contributions from prices and volumes
Source: ABS (2021) International Trade in Goods and Services, 5368.0; Department of Industry, Science, Energy and Resources (2021)
0
70
140
210
280
350
0
25
50
75
100
125
2010–11 2012–13 2014–15 2016–17 2018–19 2020–21 2022–23
A$ b
illio
n
Inde
x, 2
020–
21 =
100
Volumes Values (rhs)
-30
-15
0
15
30
45
2007–08 2010–11 2013–14 2016–17 2019–20 2022–23Pe
r cen
t
Prices Volumes Values
8
Resources and Energy Quarterly June 2021
Figure 1.3: Resource and energy export prices, AUD terms
Notes: The export price index is based on Australian dollar export unit values (EUVs, export values divided by volumes); the export price index is a Fisher price Index, which weights each commodity’s EUV by its share of total export values. Source: ABS (2021) International Trade in Goods and Services, 5368.0; Department of Industry, Science, Energy and Resources (2021)
1.3 Macroeconomic, policy, trade and other factors World economic activity continues to recover, as the COVID-19 vaccine rollout gathers pace. Renewed containment measures in a number of economies hurt economic activity in the first half of 2021, however, China and the United States are now proving very effective locomotives for the world economy. The outlook is for world growth to be relatively strong over the 2021–22 and 2022–23 outlook period, as a pathway out of COVID-19 pandemic becomes increasingly visible.
COVID-19 infections are falling in many nations, as vaccines are rolled out and containment measures are in place. So far, COVID-19 variants do not appear to represent a threat to the world recovery, and vaccines appear to be able to be modified to cover new strains of the virus.
The world economic recovery has been accompanied by a rise in prices for many goods and services. As a result, inflation has picked up, causing bouts of weakness in bond markets so far in 2021. During the second half
of 2021, and in 2022, it is likely that the supply of goods will tend to catch up with demand, resolving bottlenecks in global commodities and other goods markets. Several structural factors (such as ageing demographics, high global debt levels and ongoing technological change and innovation) are likely to help keep price rises in check.
The Chinese economy continues to expand at a relatively good pace. The government has pledged to gradually scaling back fiscal and monetary stimulus, and there is evidence China’s property sector has cooled, in response to modest government measures.
Having passed a US$1.9 trillion fiscal stimulus package to boost the US economy in the first quarter of 2021, the US Administration is seeking passage of a similar sized package of spending on infrastructure. This spending will be spread out over many more years than the first package, which aimed at supporting the economy while the COVID-19 vaccine rollout attempts to bring about herd immunity.
The most recent IMF forecasts world GDP growth at 6.0% in 2021, after a contraction of 3.3% in 2020. The IMF forecasts world growth to moderate towards more typical levels in 2022 and 2023. Advanced nations will likely recover before emerging nations, where access to vaccines is not as high.
Commodity demand should thus be healthy over the outlook period. In a sharp turnaround of fortunes, Australian exporters of premium thermal coal are enjoying multi-year price highs. However, Australian producers of mid-calorific thermal coal and metallurgical coal have taken longer to pivot from China to other markets, where supply has been better able to keep up with sometimes constrained demand. Once India and other parts of Asia have slowed the COVID-19 pandemic, sales of these coal types should pick up.
Our projections suggest that resource and energy export earnings will peak in 2021–22, but remain over $300 billion in 2022–23. The extent of any further disruption to Australian resource and energy commodity trade with China poses a downside risk to these forecasts. A spike in global inflation and a sharper than expected tightening of monetary policy by the major central banks also pose a downside risk.
0
25
50
75
100
125
150
175
200
Jun–08 Jun–11 Jun–14 Jun–17 Jun–20 Jun–23
Inde
x, J
une
2021
= 1
00
Resources Energy Total resources and energy
9
Resources and Energy Quarterly June 2021
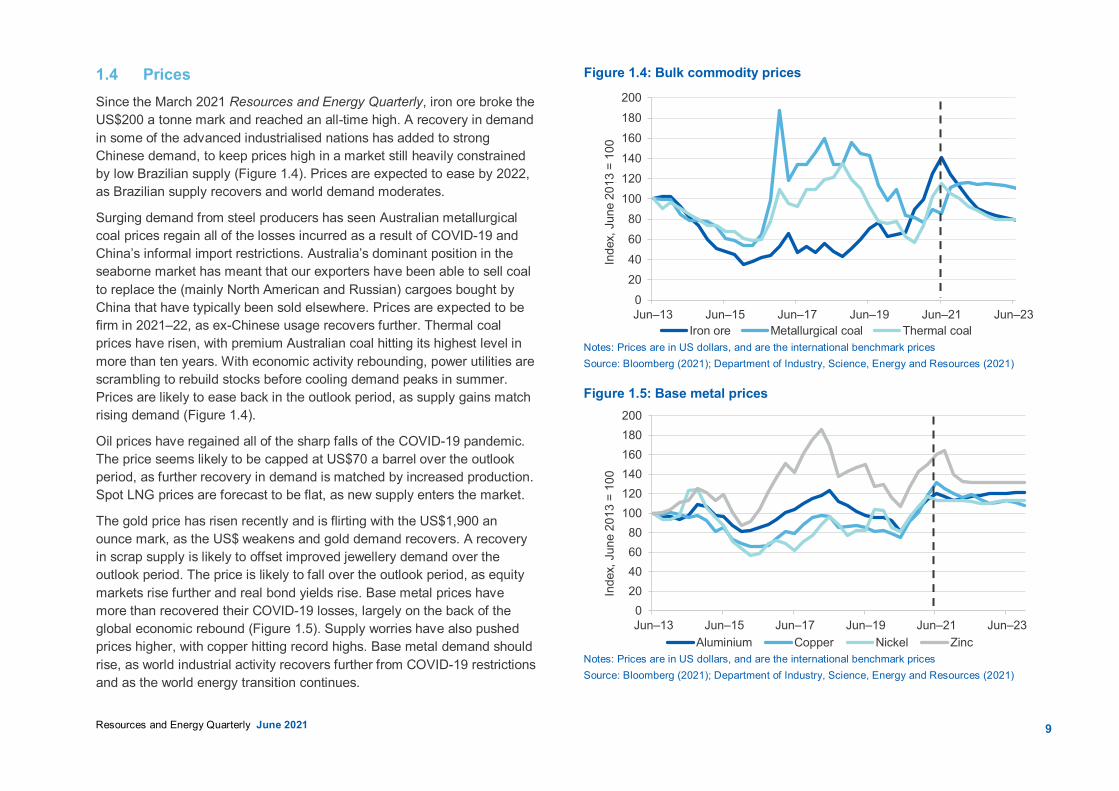
1.4 Prices Since the March 2021 Resources and Energy Quarterly, iron ore broke the US$200 a tonne mark and reached an all-time high. A recovery in demand in some of the advanced industrialised nations has added to strong Chinese demand, to keep prices high in a market still heavily constrained by low Brazilian supply (Figure 1.4). Prices are expected to ease by 2022, as Brazilian supply recovers and world demand moderates.
Surging demand from steel producers has seen Australian metallurgical coal prices regain all of the losses incurred as a result of COVID-19 and China’s informal import restrictions. Australia’s dominant position in the seaborne market has meant that our exporters have been able to sell coal to replace the (mainly North American and Russian) cargoes bought by China that have typically been sold elsewhere. Prices are expected to be firm in 2021–22, as ex-Chinese usage recovers further. Thermal coal prices have risen, with premium Australian coal hitting its highest level in more than ten years. With economic activity rebounding, power utilities are scrambling to rebuild stocks before cooling demand peaks in summer. Prices are likely to ease back in the outlook period, as supply gains match rising demand (Figure 1.4).
Oil prices have regained all of the sharp falls of the COVID-19 pandemic. The price seems likely to be capped at US$70 a barrel over the outlook period, as further recovery in demand is matched by increased production. Spot LNG prices are forecast to be flat, as new supply enters the market.
The gold price has risen recently and is flirting with the US$1,900 an ounce mark, as the US$ weakens and gold demand recovers. A recovery in scrap supply is likely to offset improved jewellery demand over the outlook period. The price is likely to fall over the outlook period, as equity markets rise further and real bond yields rise. Base metal prices have more than recovered their COVID-19 losses, largely on the back of the global economic rebound (Figure 1.5). Supply worries have also pushed prices higher, with copper hitting record highs. Base metal demand should rise, as world industrial activity recovers further from COVID-19 restrictions and as the world energy transition continues.
Figure 1.4: Bulk commodity prices
Notes: Prices are in US dollars, and are the international benchmark prices Source: Bloomberg (2021); Department of Industry, Science, Energy and Resources (2021)
Figure 1.5: Base metal prices
Notes: Prices are in US dollars, and are the international benchmark prices Source: Bloomberg (2021); Department of Industry, Science, Energy and Resources (2021)
020406080
100120140160180200
Jun–13 Jun–15 Jun–17 Jun–19 Jun–21 Jun–23
Inde
x, J
une
2013
= 1
00
Iron ore Metallurgical coal Thermal coal
020406080
100120140160180200
Jun–13 Jun–15 Jun–17 Jun–19 Jun–21 Jun–23In
dex,
Jun
e 20
13 =
100
Aluminium Copper Nickel Zinc
10
Resources and Energy Quarterly June 2021
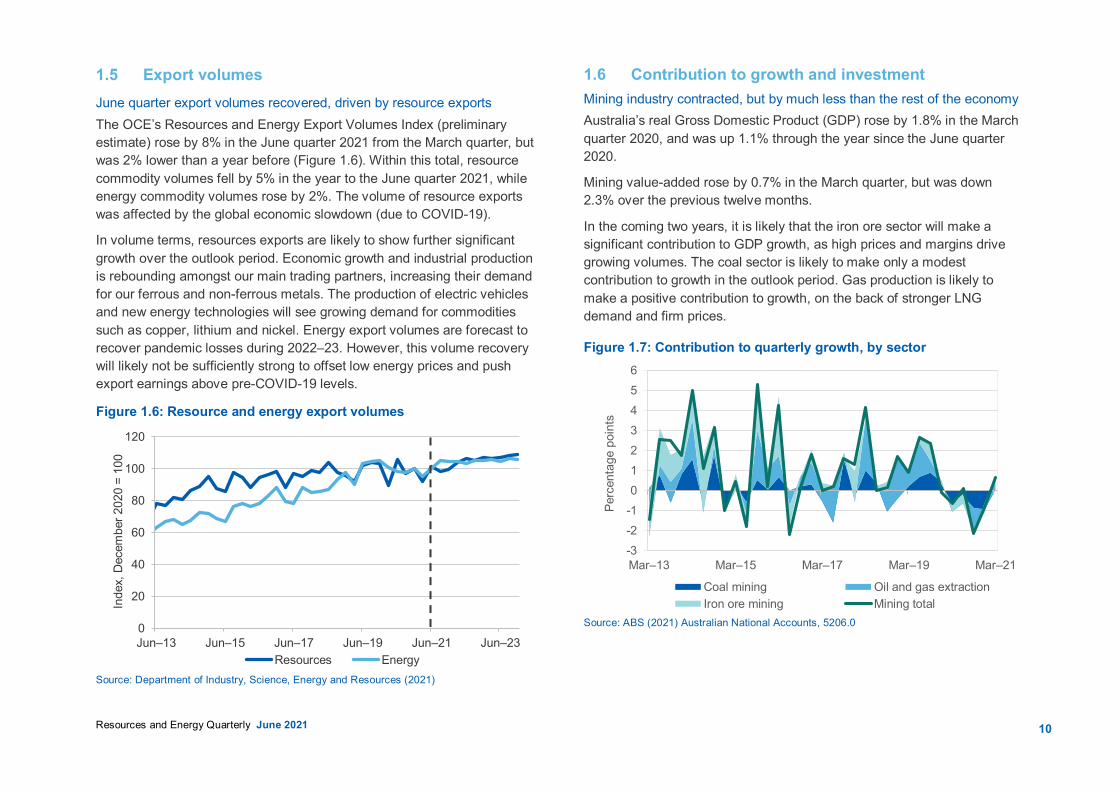
1.5 Export volumes June quarter export volumes recovered, driven by resource exports The OCE’s Resources and Energy Export Volumes Index (preliminary estimate) rose by 8% in the June quarter 2021 from the March quarter, but was 2% lower than a year before (Figure 1.6). Within this total, resource commodity volumes fell by 5% in the year to the June quarter 2021, while energy commodity volumes rose by 2%. The volume of resource exports was affected by the global economic slowdown (due to COVID-19).
In volume terms, resources exports are likely to show further significant growth over the outlook period. Economic growth and industrial production is rebounding amongst our main trading partners, increasing their demand for our ferrous and non-ferrous metals. The production of electric vehicles and new energy technologies will see growing demand for commodities such as copper, lithium and nickel. Energy export volumes are forecast to recover pandemic losses during 2022–23. However, this volume recovery will likely not be sufficiently strong to offset low energy prices and push export earnings above pre-COVID-19 levels.
Figure 1.6: Resource and energy export volumes
Source: Department of Industry, Science, Energy and Resources (2021)
1.6 Contribution to growth and investment Mining industry contracted, but by much less than the rest of the economy Australia’s real Gross Domestic Product (GDP) rose by 1.8% in the March quarter 2020, and was up 1.1% through the year since the June quarter 2020.
Mining value-added rose by 0.7% in the March quarter, but was down 2.3% over the previous twelve months.
In the coming two years, it is likely that the iron ore sector will make a significant contribution to GDP growth, as high prices and margins drive growing volumes. The coal sector is likely to make only a modest contribution to growth in the outlook period. Gas production is likely to make a positive contribution to growth, on the back of stronger LNG demand and firm prices.
Figure 1.7: Contribution to quarterly growth, by sector
Source: ABS (2021) Australian National Accounts, 5206.0 0
20
40
60
80
100
120
Jun–13 Jun–15 Jun–17 Jun–19 Jun–21 Jun–23
Inde
x, D
ecem
ber 2
020
= 10
0
Resources Energy
-3-2-10123456
Mar–13 Mar–15 Mar–17 Mar–19 Mar–21
Perc
enta
ge p
oint
s
Coal mining Oil and gas extractionIron ore mining Mining total

11
Mining investment is picking up The ABS Private New Capital Expenditure and Expected Expenditure survey for the March quarter 2021 shows that Australia’s mining industry invested $8.1 billion in the quarter. This is down by 14% in the quarter, but up 1.3% from the March quarter 2020. In recent quarters, strong iron ore prices has supported growth in investment by the metal ore mining sector, though there are signs that this growth is tailing off in the March quarter (Figure 1.8).
Figure 1.8: Mining industry capital expenditure by commodity
Notes: Other mining includes non-metallic mineral mining and quarrying and exploration and other mining support services; chart data is in nominal, original terms Source: ABS (2021) Private New Capital Expenditure and Expected Expenditure, 5625.0
Expenditure rose both for buildings and structures and for machinery and equipment in the March quarter 2021 (Figure 1.9). Spending on plant and equipment remains well above its average level of recent years, though the reverse trend has been evident in buildings and structures. Forward expectations suggest that investment in 2020–21 will be slightly higher than in 2019–20 (Figure 1.10). Strong prices for gold, iron ore and other minerals are leading to new investment plans, including the re-opening of mines. However, investment in new greenfield projects remains well below the levels of the previous decade, when seven LNG plants were built.
Resources and Energy Quarterly June 2021
Figure 1.9: Mining industry capital expenditure by type, quarterly
Notes: Chart data is in nominal terms, seasonally adjusted. Source: ABS (2021) Private New Capital Expenditure and Expected Expenditure, 5625.0
Figure 1.10: Mining industry capital expenditure, fiscal year
Notes: Chart data is in nominal terms Source: ABS (2021) Private New Capital Expenditure and Expected Expenditure, 5625.0
0
3
6
9
12
15
18
2011 2013 2015 2017 2019 2021
A$ b
illio
n
Oil and gas extraction Metal ore miningCoal mining Other mining
0
1
2
3
4
5
0
5
10
15
20
25
2003 2006 2009 2012 2015 2018 2021Buildings and structures Equipment, plant and machinery (rhs)
A$ b
illio
n
A$ b
illio
n0
20
40
60
80
100
2010–11 2012–13 2014–15 2016–17 2018–19 2020–21$
billi
onActual Expected
12
Resources and Energy Quarterly June 2021
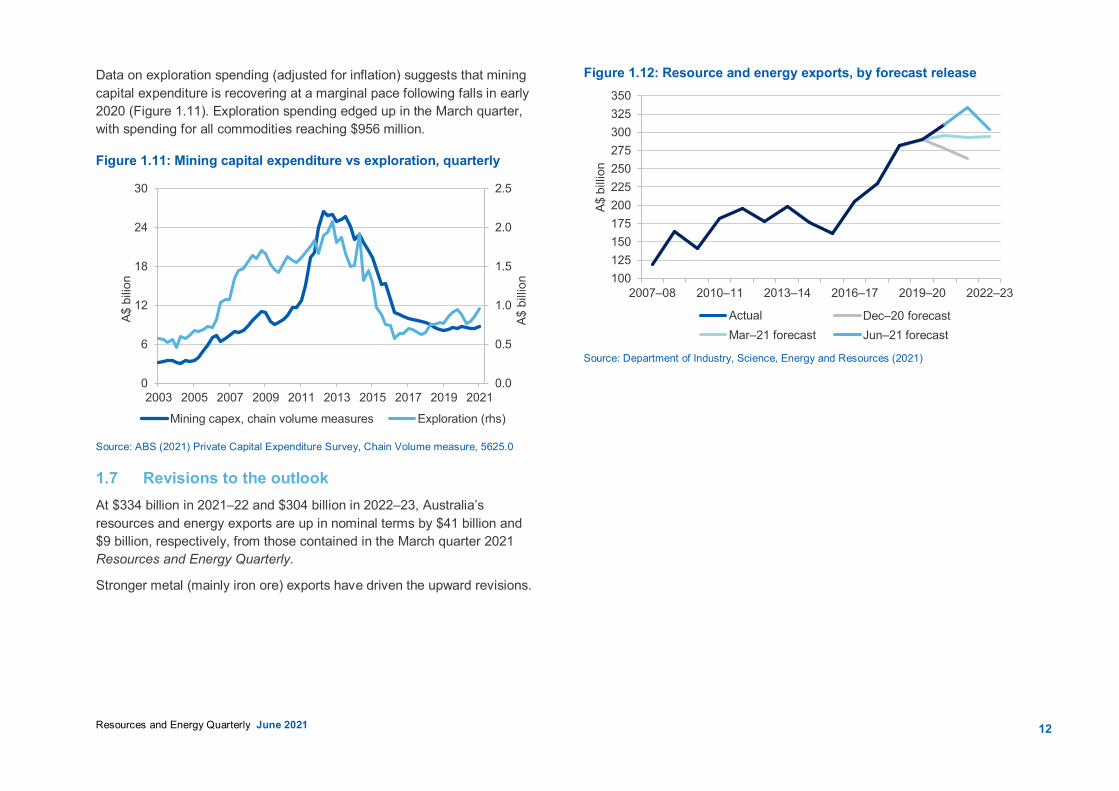
Data on exploration spending (adjusted for inflation) suggests that mining capital expenditure is recovering at a marginal pace following falls in early 2020 (Figure 1.11). Exploration spending edged up in the March quarter, with spending for all commodities reaching $956 million.
Figure 1.11: Mining capital expenditure vs exploration, quarterly
Source: ABS (2021) Private Capital Expenditure Survey, Chain Volume measure, 5625.0
1.7 Revisions to the outlook At $334 billion in 2021–22 and $304 billion in 2022–23, Australia’s resources and energy exports are up in nominal terms by $41 billion and $9 billion, respectively, from those contained in the March quarter 2021 Resources and Energy Quarterly.
Stronger metal (mainly iron ore) exports have driven the upward revisions.
Figure 1.12: Resource and energy exports, by forecast release
Source: Department of Industry, Science, Energy and Resources (2021)
0.0
0.5
1.0
1.5
2.0
2.5
0
6
12
18
24
30
2003 2005 2007 2009 2011 2013 2015 2017 2019 2021
A$ b
illio
n
A$ b
ilion
Mining capex, chain volume measures Exploration (rhs)
100125150175200225250275300325350
2007–08 2010–11 2013–14 2016–17 2019–20 2022–23
A$ b
illio
n
Actual Dec–20 forecastMar–21 forecast Jun–21 forecast

13
Resources and Energy Quarterly June 2021
Data on exploration spending (adjusted for inflation) suggests that mining capital expenditure is recovering at a marginal pace following falls in early 2020 (Figure 1.11). Exploration spending edged up in the March quarter, with spending for all commodities reaching $956 million.
Figure 1.11: Mining capital expenditure vs exploration, quarterly
Source: ABS (2021) Private Capital Expenditure Survey, Chain Volume measure, 5625.0
1.7 Revisions to the outlook At $334 billion in 2021–22 and $304 billion in 2022–23, Australia’s resources and energy exports are up in nominal terms by $41 billion and $9 billion, respectively, from those contained in the March quarter 2021 Resources and Energy Quarterly.
Stronger metal (mainly iron ore) exports have driven the upward revisions.
Figure 1.12: Resource and energy exports, by forecast release
Source: Department of Industry, Science, Energy and Resources (2021)
0.0
0.5
1.0
1.5
2.0
2.5
0
6
12
18
24
30
2003 2005 2007 2009 2011 2013 2015 2017 2019 2021
A$ b
illio
n
A$ b
ilion
Mining capex, chain volume measures Exploration (rhs)
100125150175200225250275300325350
2007–08 2010–11 2013–14 2016–17 2019–20 2022–23
A$ b
illio
n
Actual Dec–20 forecastMar–21 forecast Jun–21 forecast

14
Resources and Energy Quarterly June 2021
Table 1.1: Outlook for Australia’s resources and energy exports in nominal and real terms
Annual percent change Exports (A$m) 2019–20 2020–21s 2021–22f 2022–23f 2019–20 2020–21s 2021–22f 2022–23f
Resources and energy 290,778 310,222 333,803 303,526 3.3 6.7 7.6 –9.1
– realb 293,973 310,222 328,266 293,396 1.9 5.5 5.8 –10.6 Energy 115,532 83,831 115,080 108,644 –12.9 –27.4 37.3 –5.6 – realb 116,802 83,831 113,171 105,018 –14.1 –28.2 35.0 –7.2 Resources 175,245 226,391 218,723 194,882 17.7 29.2 –3.4 –10.9 – realb 177,171 226,391 215,095 188,378 16.2 27.8 –5.0 –12.4
Notes: b In 2020–21 Australian dollars; f forecast; r Compound annual growth rate; z projection. Source: ABS (2021) International Trade in Goods and Services, 5368.0; Department of Industry, Science, Energy and Resources (2021)
Table 1.2: Australia's resource and energy exports, selected commodities
Prices Export volumes Export values, A$b Unit 2020–21s 2021–22f 2022–23f Unit 2020–21s 2021–22f 2022–23f 2020–21s 2021–22f 2022–23f Iron ore US$/t 137 129 100 Mt 871 904 954 149 137 113 LNG A$/GJ 7.8 11.2 10.4 Mt 79 83 83 32 49 46 Metallurgical coal US$/t 119 163 162 Mt 171 183 186 22 30 32 Gold US$/oz 1,841 1,736 1,667 Mt 323 409 417 28 29 28 Thermal coal US$/t 74 82 69 Mt 194 208 212 17 21 17 Copper US$/t 7,882 8,579 7,994 Kt 896 885 909 12 13 13 Crude oil US$/bbl 54 69 64 Kb/d 18,263 18,299 18,336 7.7 10.9 10.1 Alumina US$/t 284 282 310 Kt 286 314 310 7.0 7.1 7.2 Nickel US$/t 16,257 17,048 17,260 Kt 197 248 251 3.6 4.4 4.6 Aluminium US$/t 1,982 2,121 2,202 Kt 1,366 1,387 1,388 3.7 3.7 3.9 Zinc US$/t 2,666 2,611 2,421 Kt 1,427 1,579 1,651 3.3 3.6 3.5 Lithium US$/t 482 773 752 Kt 1,440 1,951 2,209 0.9 2.0 2.5 Uranium US$/lb 30 31 34 t 6,157 5,800 5,800 0.6 0.4 0.5
Notes: a Export data covers both crude oil and condensate; f forecast. Price information: Iron ore fob (free-on-board) at 62 per cent iron content estimated netback from Western Australia to Qingdao China; Metallurgical coal premium hard coking coal fob East Coast Australia; Thermal coal fob Newcastle 6000 kc (calorific content); LNG fob Australia's export unit values; Gold LBMA PM; Alumina fob Australia; Copper LME cash; Crude oil Brent; Aluminum LME cash; Zinc LME cash; Nickel LME cash; Lithium spodumene ore. Source: ABS (2021) International Trade in Goods and Services, Australia, Cat. No. 5368.0; LME; London Bullion Market Association; The Ux Consulting Company; US Department of Energy; Metal Bulletin; Japan Ministry of Economy, Trade and Industry; Department of Industry, Science, Energy and Resources (2021)
16
Resources and Energy Quarterly June 2021
2.1 Summary Advanced economies and most of Australia’s major trading partners are
continuing to recover strongly from the economic impacts of the COVID-19 pandemic. Recent waves of infection in India and Europe seem to be subsiding.
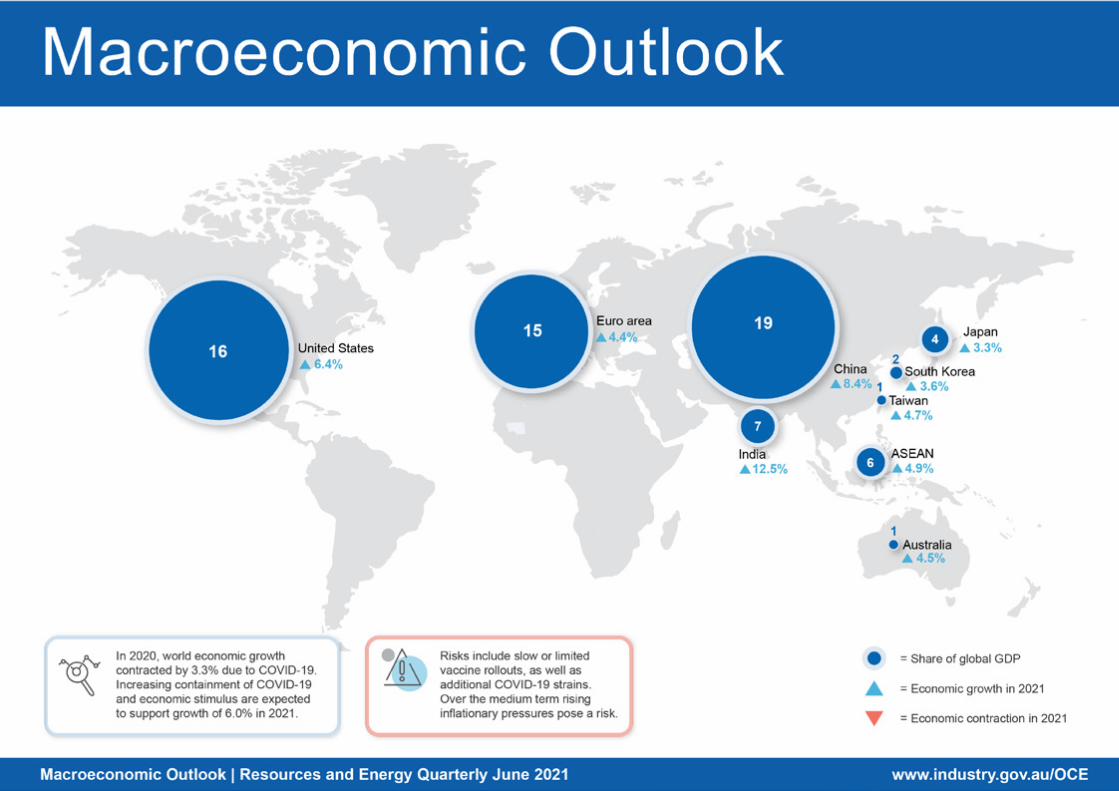
World GDP growth forecasts have been revised up: after an estimated 3.3% contraction in 2020, the world economy is forecast to grow by 6.0% in 2021 and by 4.4% in 2022.
Advanced economies are recovering with developing nations expected to follow. However risks are present, including vaccine bottlenecks, additional COVID-19 strains and rising inflation over the medium term.
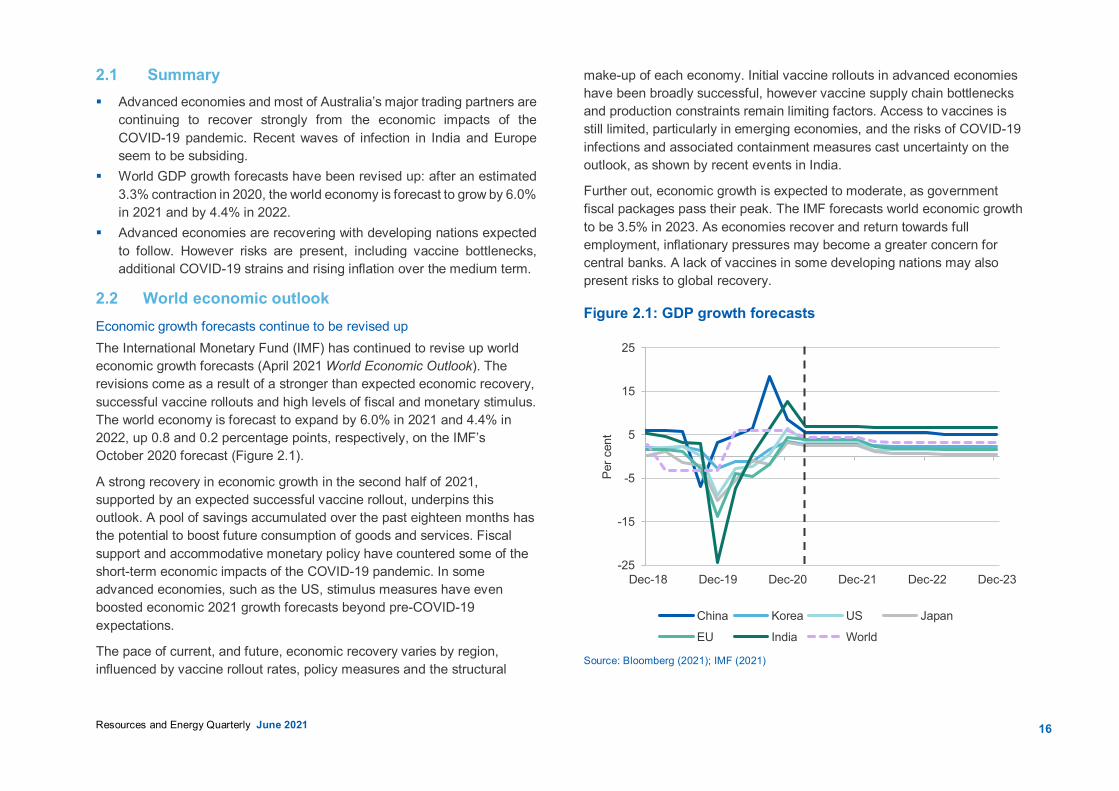
2.2 World economic outlook Economic growth forecasts continue to be revised up The International Monetary Fund (IMF) has continued to revise up world economic growth forecasts (April 2021 World Economic Outlook). The revisions come as a result of a stronger than expected economic recovery, successful vaccine rollouts and high levels of fiscal and monetary stimulus. The world economy is forecast to expand by 6.0% in 2021 and 4.4% in 2022, up 0.8 and 0.2 percentage points, respectively, on the IMF’s October 2020 forecast (Figure 2.1).
A strong recovery in economic growth in the second half of 2021, supported by an expected successful vaccine rollout, underpins this outlook. A pool of savings accumulated over the past eighteen months has the potential to boost future consumption of goods and services. Fiscal support and accommodative monetary policy have countered some of the short-term economic impacts of the COVID-19 pandemic. In some advanced economies, such as the US, stimulus measures have even boosted economic 2021 growth forecasts beyond pre-COVID-19 expectations.
The pace of current, and future, economic recovery varies by region, influenced by vaccine rollout rates, policy measures and the structural
make-up of each economy. Initial vaccine rollouts in advanced economies have been broadly successful, however vaccine supply chain bottlenecks and production constraints remain limiting factors. Access to vaccines is still limited, particularly in emerging economies, and the risks of COVID-19 infections and associated containment measures cast uncertainty on the outlook, as shown by recent events in India.
Further out, economic growth is expected to moderate, as government fiscal packages pass their peak. The IMF forecasts world economic growth to be 3.5% in 2023. As economies recover and return towards full employment, inflationary pressures may become a greater concern for central banks. A lack of vaccines in some developing nations may also present risks to global recovery.
Figure 2.1: GDP growth forecasts
Source: Bloomberg (2021); IMF (2021)
-25
-15
-5
5
15
25
Dec-18 Dec-19 Dec-20 Dec-21 Dec-22 Dec-23
Per c
ent
China Korea US Japan
EU India World
17
Resources and Energy Quarterly June 2021
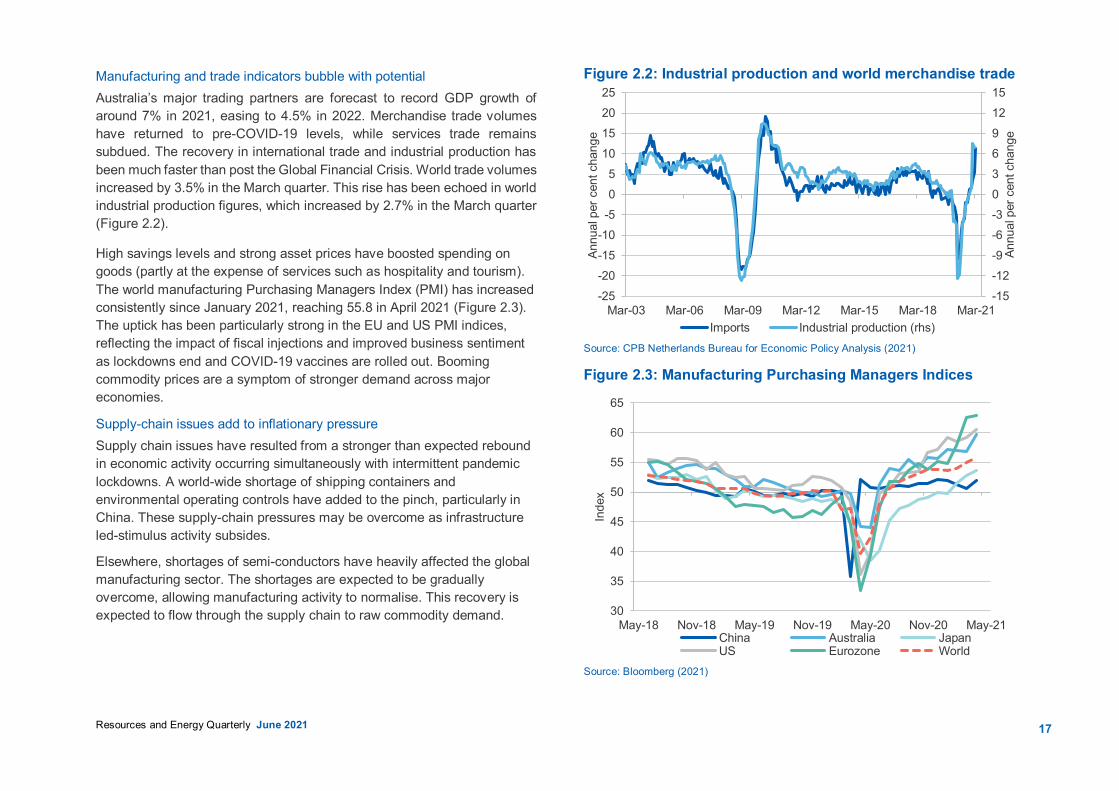
Manufacturing and trade indicators bubble with potential Australia’s major trading partners are forecast to record GDP growth of around 7% in 2021, easing to 4.5% in 2022. Merchandise trade volumes have returned to pre-COVID-19 levels, while services trade remains subdued. The recovery in international trade and industrial production has been much faster than post the Global Financial Crisis. World trade volumes increased by 3.5% in the March quarter. This rise has been echoed in world industrial production figures, which increased by 2.7% in the March quarter (Figure 2.2).
High savings levels and strong asset prices have boosted spending on goods (partly at the expense of services such as hospitality and tourism). The world manufacturing Purchasing Managers Index (PMI) has increased consistently since January 2021, reaching 55.8 in April 2021 (Figure 2.3). The uptick has been particularly strong in the EU and US PMI indices, reflecting the impact of fiscal injections and improved business sentiment as lockdowns end and COVID-19 vaccines are rolled out. Booming commodity prices are a symptom of stronger demand across major economies.
Supply-chain issues add to inflationary pressure Supply chain issues have resulted from a stronger than expected rebound in economic activity occurring simultaneously with intermittent pandemic lockdowns. A world-wide shortage of shipping containers and environmental operating controls have added to the pinch, particularly in China. These supply-chain pressures may be overcome as infrastructure led-stimulus activity subsides.
Elsewhere, shortages of semi-conductors have heavily affected the global manufacturing sector. The shortages are expected to be gradually overcome, allowing manufacturing activity to normalise. This recovery is expected to flow through the supply chain to raw commodity demand.
Figure 2.2: Industrial production and world merchandise trade
Source: CPB Netherlands Bureau for Economic Policy Analysis (2021)
Figure 2.3: Manufacturing Purchasing Managers Indices
Source: Bloomberg (2021)
-15-12-9-6-303691215
-25-20-15-10-505
10152025
Mar-03 Mar-06 Mar-09 Mar-12 Mar-15 Mar-18 Mar-21
Annu
al p
er c
ent c
hang
e
Annu
al p
er c
ent c
hang
e
Imports Industrial production (rhs)
30
35
40
45
50
55
60
65
May-18 Nov-18 May-19 Nov-19 May-20 Nov-20 May-21
Inde
x
China Australia JapanUS Eurozone World
18
Resources and Energy Quarterly June 2021
2.3 Major trading partner economic outlook China’s economic recovery to moderate China was the only country to see economic growth in 2020; GDP increased 2.3%, despite COVID-19 impacts. The IMF forecasts China’s economy to grow by 8.4% in 2021, before moderating to 5.6% in 2022. The Chinese government’s 2021 domestic growth target is 6% or more. China’s economic activity was strong in the March and June quarters, in stark difference to the COVID-19 impacted periods last year. March quarter growth was 18% year-on-year, broadly consistent with the December quarter, despite some isolated COVID-19 outbreaks.
China’s industrial and manufacturing activity has been supported by infrastructure spending and a recovering appetite for China’s exports. This has seen China’s exports grow consistently since June 2020, contributing to a record high trade surplus of US$78 billion at the end of 2020. In the four months to April, exports were 24.5% higher year-on-year, and at their highest level since 2017.
Industrial production growth hit 14% in March year-on-year, down 1.4% over the month. This reflects healthy growth from the low points of 2020, when production was affected by the COVID-19 pandemic. In April, China’s manufacturing PMI decreased marginally to 51.1, but remains in the expansionary territory position held since March 2020. The Caixin-Markit PMI, which has a broader survey base, rose from an 11-month low of 50.6 in March to 51.9 in April.
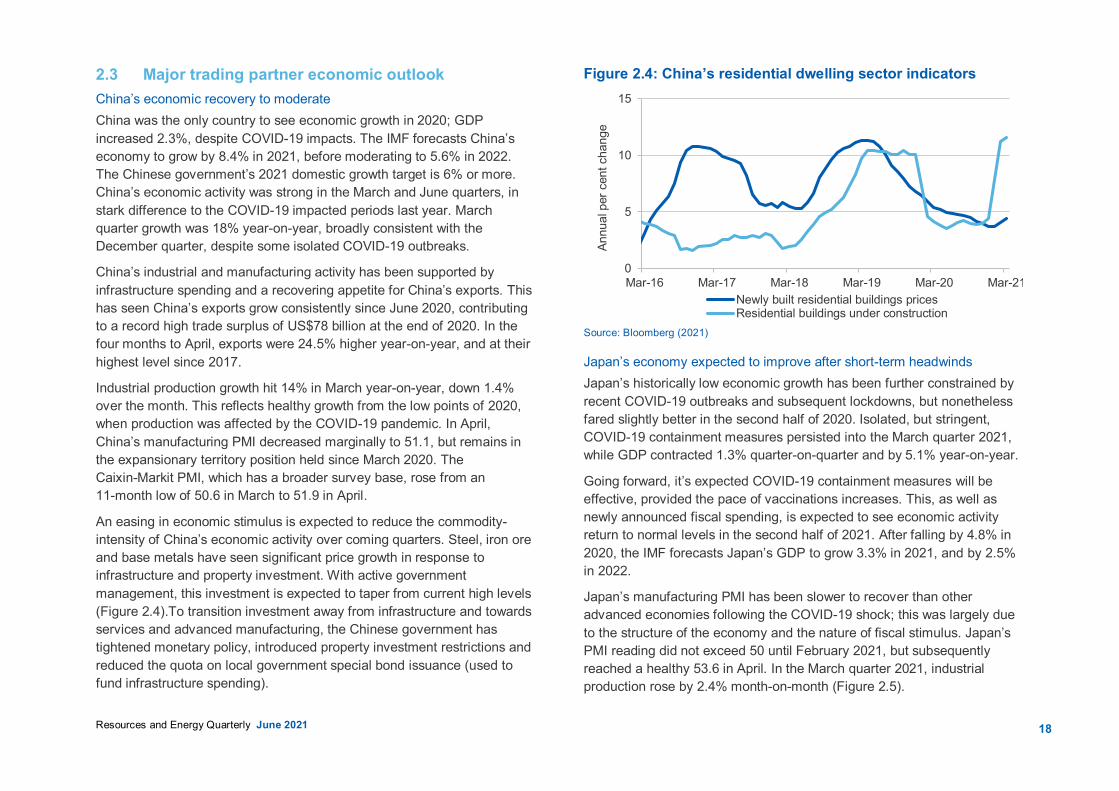
An easing in economic stimulus is expected to reduce the commodity-intensity of China’s economic activity over coming quarters. Steel, iron ore and base metals have seen significant price growth in response to infrastructure and property investment. With active government management, this investment is expected to taper from current high levels (Figure 2.4).To transition investment away from infrastructure and towards services and advanced manufacturing, the Chinese government has tightened monetary policy, introduced property investment restrictions and reduced the quota on local government special bond issuance (used to fund infrastructure spending).
Figure 2.4: China’s residential dwelling sector indicators
Source: Bloomberg (2021)
Japan’s economy expected to improve after short-term headwinds Japan’s historically low economic growth has been further constrained by recent COVID-19 outbreaks and subsequent lockdowns, but nonetheless fared slightly better in the second half of 2020. Isolated, but stringent, COVID-19 containment measures persisted into the March quarter 2021, while GDP contracted 1.3% quarter-on-quarter and by 5.1% year-on-year.
Going forward, it’s expected COVID-19 containment measures will be effective, provided the pace of vaccinations increases. This, as well as newly announced fiscal spending, is expected to see economic activity return to normal levels in the second half of 2021. After falling by 4.8% in 2020, the IMF forecasts Japan’s GDP to grow 3.3% in 2021, and by 2.5% in 2022.
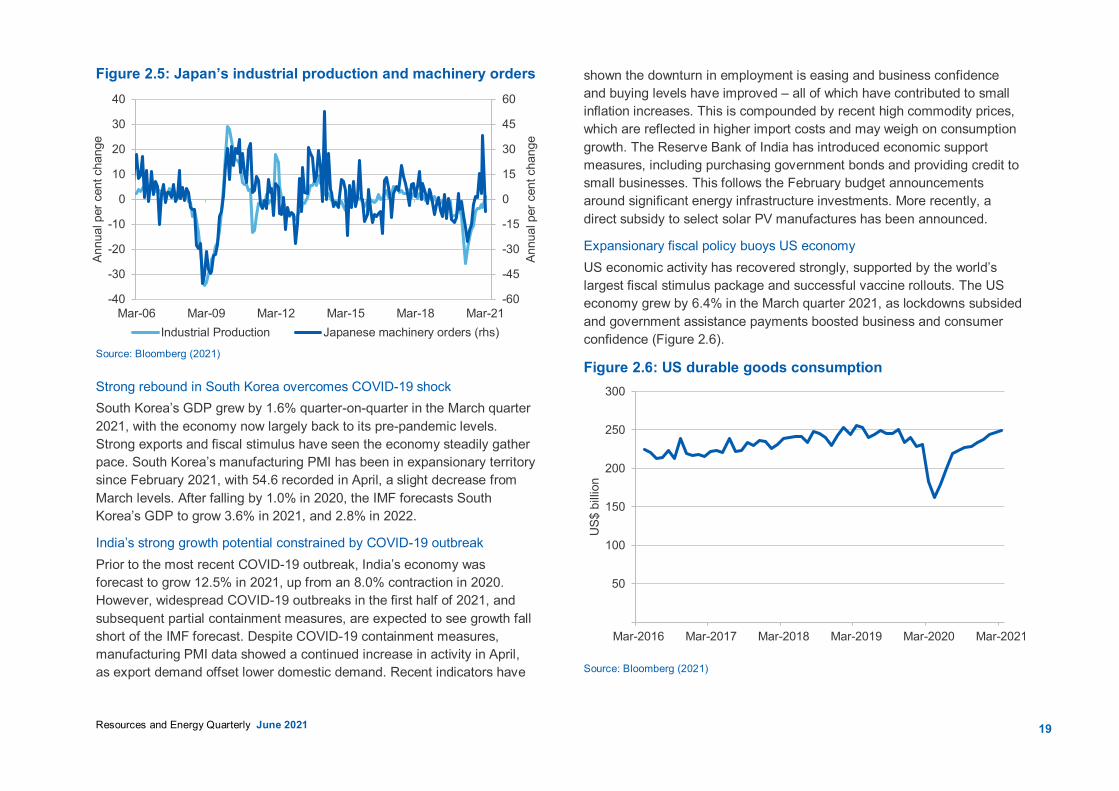
Japan’s manufacturing PMI has been slower to recover than other advanced economies following the COVID-19 shock; this was largely due to the structure of the economy and the nature of fiscal stimulus. Japan’s PMI reading did not exceed 50 until February 2021, but subsequently reached a healthy 53.6 in April. In the March quarter 2021, industrial production rose by 2.4% month-on-month (Figure 2.5).
0
5
10
15
Mar-16 Mar-17 Mar-18 Mar-19 Mar-20 Mar-21
Annu
al p
er c
ent c
hang
e
Newly built residential buildings pricesResidential buildings under construction
19
Resources and Energy Quarterly June 2021
Figure 2.5: Japan’s industrial production and machinery orders
Source: Bloomberg (2021)
Strong rebound in South Korea overcomes COVID-19 shock South Korea’s GDP grew by 1.6% quarter-on-quarter in the March quarter 2021, with the economy now largely back to its pre-pandemic levels. Strong exports and fiscal stimulus have seen the economy steadily gather pace. South Korea’s manufacturing PMI has been in expansionary territory since February 2021, with 54.6 recorded in April, a slight decrease from March levels. After falling by 1.0% in 2020, the IMF forecasts South Korea’s GDP to grow 3.6% in 2021, and 2.8% in 2022.
India’s strong growth potential constrained by COVID-19 outbreak Prior to the most recent COVID-19 outbreak, India’s economy was forecast to grow 12.5% in 2021, up from an 8.0% contraction in 2020. However, widespread COVID-19 outbreaks in the first half of 2021, and subsequent partial containment measures, are expected to see growth fall short of the IMF forecast. Despite COVID-19 containment measures, manufacturing PMI data showed a continued increase in activity in April, as export demand offset lower domestic demand. Recent indicators have
shown the downturn in employment is easing and business confidence and buying levels have improved – all of which have contributed to small inflation increases. This is compounded by recent high commodity prices, which are reflected in higher import costs and may weigh on consumption growth. The Reserve Bank of India has introduced economic support measures, including purchasing government bonds and providing credit to small businesses. This follows the February budget announcements around significant energy infrastructure investments. More recently, a direct subsidy to select solar PV manufactures has been announced.
Expansionary fiscal policy buoys US economy US economic activity has recovered strongly, supported by the world’s largest fiscal stimulus package and successful vaccine rollouts. The US economy grew by 6.4% in the March quarter 2021, as lockdowns subsided and government assistance payments boosted business and consumer confidence (Figure 2.6).
Figure 2.6: US durable goods consumption
Source: Bloomberg (2021)
-60
-45
-30
-15
0
15
30
45
60
-40
-30
-20
-10
0
10
20
30
40
Mar-06 Mar-09 Mar-12 Mar-15 Mar-18 Mar-21
Annu
al p
er c
ent c
hang
e
Annu
al p
er c
ent c
hang
e
Industrial Production Japanese machinery orders (rhs)
50
100
150
200
250
300
Mar-2016 Mar-2017 Mar-2018 Mar-2019 Mar-2020 Mar-2021
US$
bill
ion

20
Resources and Energy Quarterly June 2021
The April US PMI index reached a multi-year high of 60.5. Business investment and household consumption have been energised by fiscal stimulus packages totalling the equivalent of 25% of US GDP.
After contracting 3.5% in 2020, the US economy is forecast to grow by 6.4% in 2021 and by 3.5% in 2022. Fiscal measures have supported household expenditure, which is expected to see consumption remain strong well into 2021. However, spending on services will drive much of the extra consumption. An additional US$2 trillion fiscal stimulus package is under consideration, which could impact infrastructure and social spending over the outlook period.
EU’s bumpy economic recovery expected to smooth In 2020, around €750 billion of fiscal stimulus was provided to European Union countries, including grants, loans and green investment. To support economic recovery further, the European Central Bank increased the pace of asset purchases in the March and June 2021 quarters.
Figure 2.7: Eurozone GDP and Composite PMI
Source: Bloomberg (2021)
Economic recovery in the EU has been constrained by COVID-19 outbreaks and subsequent lockdowns. March quarter 2021 GDP fell 0.6% amid reintroduced lockdowns and reduced spending. After social distancing restrictions were tightened in numerous countries towards the end of 2020 and in early 2021, containment measures were gradually relaxed over April and May 2021. Vaccine rollout rates reached 2.6 million doses daily in May — double the average rate in the March quarter. With this and the upcoming summer, it is expected economies will steadily reopen. Partial indicators suggest economic growth may be returning, this time in a more sustained way.
The Eurozone PMI surged to above 62 in March and April (Figure 2.7). As vaccine coverage increases and economies open up, economic growth is forecast at 4.4% in 2021 and 3.8% in 2022, after a 6.6% fall in 2020.
-12
-8
-4
0
4
8
14
26
38
50
62
74
Jun-05 Jun-09 Jun-13 Jun-17 Jun-21
Qua
rterly
per
cent
age
chan
ge
Inde
x
Eurozone Composite PMI Eurozone GDP (rhs)

21
Resources and Energy Quarterly June 2021
Table 2.1: Key IMF GDP assumptions
2020 2021a 2022a 2023a
Economic growthb
Advanced economies -4.7 5.1 3.6 1.8
– Australia -2.4 4.5 2.8 2.3
– Eurozone -6.1 4.4 3.8 2.3
– France -8.2 5.8 4.2 1.7
– Germany -4.9 3.6 3.4 1.6
– Japan -4.8 3.3 2.5 1.1
– New Zealand -3.0 4.0 3.2 2.6
– South Korea -1.0 3.6 2.8 2.6
– United Kingdom -9.9 5.3 5.1 2.0
– United States -3.5 6.4 3.5 1.4
Emerging economies -2.2 6.7 5.0 4.7
– ASEAN-5d -3.4 4.9 6.1 5.7
– Chinae 2.3 8.4 5.6 5.4
– India -8.0 12.5 6.9 6.8
– Latin America -7.0 4.6 3.1 2.7
– Middle East -2.9 3.7 3.8 2.8
Worldc -3.3 6.0 4.4 3.5 Notes: a Assumption; b Year-on-year change; c Calculated by the IMF using purchasing power parity (PPP) weights for nominal country gross domestic product; d Indonesia, Malaysia, the Philippines, Thailand and Vietnam. e Excludes Hong Kong. Sources: Bloomberg (2021); Department of Industry, Science, Energy and Resources (2021); IMF (2021)
22
Resources and Energy Quarterly June 2021
Table 2.2: Exchange rate and inflation assumptions
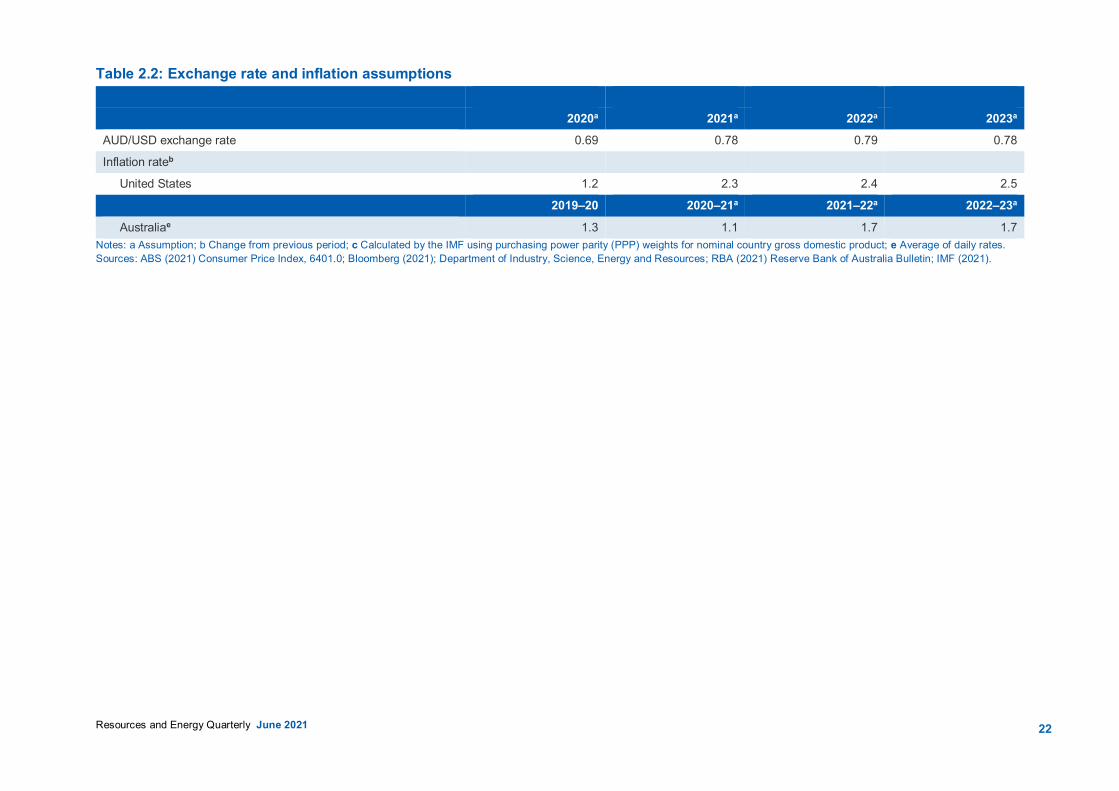
2020a 2021a 2022a 2023a AUD/USD exchange rate 0.69 0.78 0.79 0.78
Inflation rateb
United States 1.2 2.3 2.4 2.5 2019–20 2020–21a 2021–22a 2022–23a
Australiae 1.3 1.1 1.7 1.7 Notes: a Assumption; b Change from previous period; c Calculated by the IMF using purchasing power parity (PPP) weights for nominal country gross domestic product; e Average of daily rates. Sources: ABS (2021) Consumer Price Index, 6401.0; Bloomberg (2021); Department of Industry, Science, Energy and Resources; RBA (2021) Reserve Bank of Australia Bulletin; IMF (2021).

25Resources and Energy Quarterly June 2021
3.1 Summary World steel demand is forecast to rise by 5.8% in 2021, reflecting the
ongoing recovery in global activity from the COVID-19 pandemic. However, further outbreaks of the pandemic and delays in the vaccination rollout present key risks to global reflation and higher steel demand.
The recovery in steel markets is being led by the release of pent up demand and accommodative government policies across major economies, with infrastructure-led fiscal stimulus providing an additional tailwind. Growth in world steel demand is expected to ease to 2.7% in 2022, as the market returns to more typical growth levels.
Strong demand in the midst of recovering supply chains has led to record steel prices across the US, EU and Asia in the first half of 2021. Prices are expected to ease from the second half of 2021, as this demand impulse recedes and supply continues to come back online.
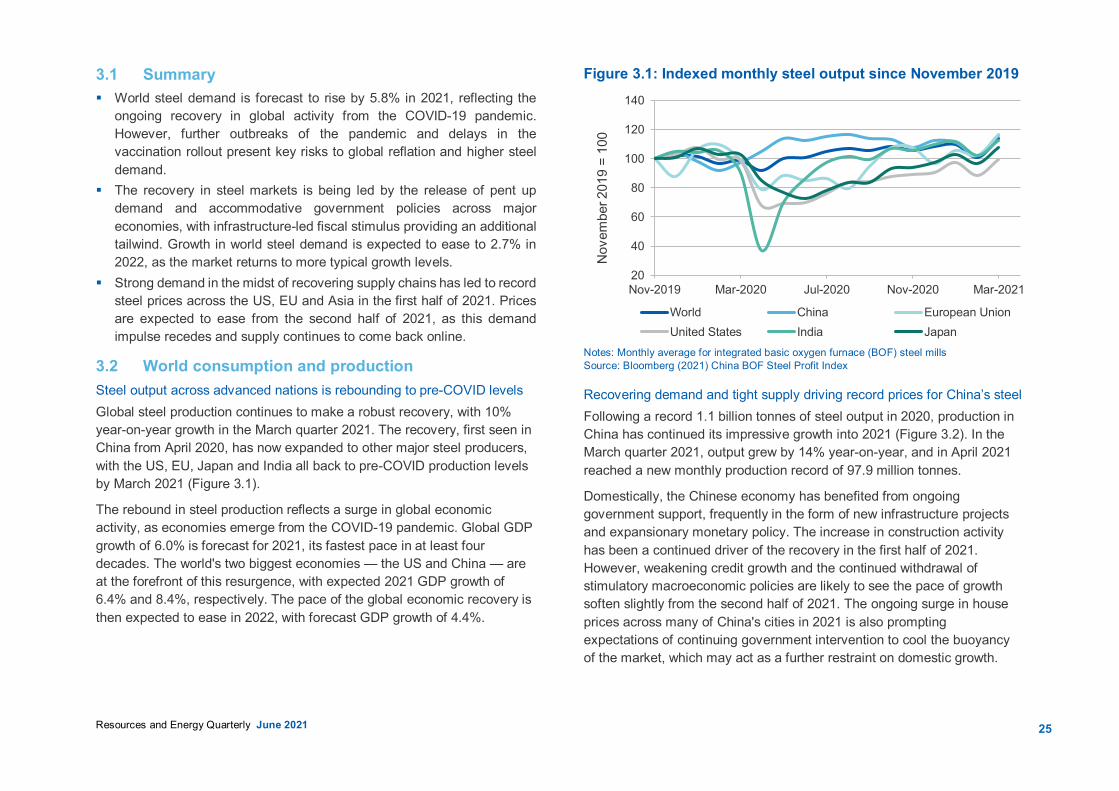
3.2 World consumption and production Steel output across advanced nations is rebounding to pre-COVID levels Global steel production continues to make a robust recovery, with 10% year-on-year growth in the March quarter 2021. The recovery, first seen in China from April 2020, has now expanded to other major steel producers, with the US, EU, Japan and India all back to pre-COVID production levels by March 2021 (Figure 3.1).
The rebound in steel production reflects a surge in global economic activity, as economies emerge from the COVID-19 pandemic. Global GDP growth of 6.0% is forecast for 2021, its fastest pace in at least four decades. The world's two biggest economies — the US and China — are at the forefront of this resurgence, with expected 2021 GDP growth of 6.4% and 8.4%, respectively. The pace of the global economic recovery is then expected to ease in 2022, with forecast GDP growth of 4.4%.
Figure 3.1: Indexed monthly steel output since November 2019
Notes: Monthly average for integrated basic oxygen furnace (BOF) steel mills Source: Bloomberg (2021) China BOF Steel Profit Index
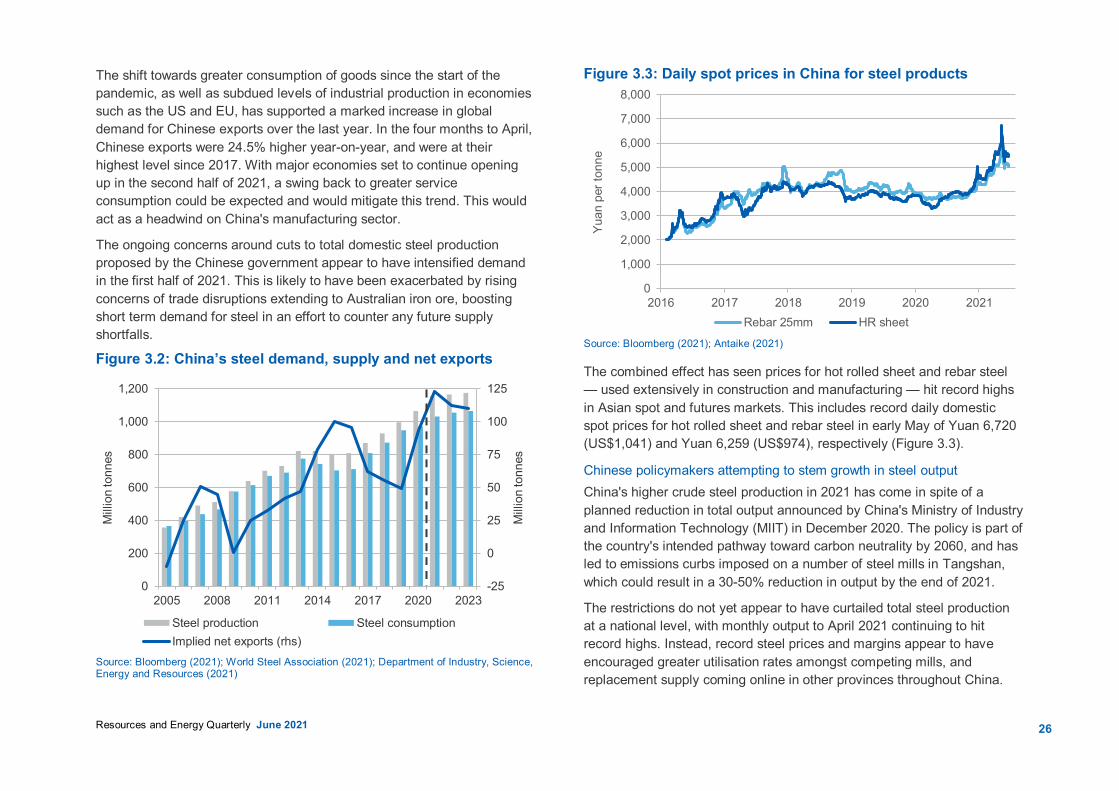
Recovering demand and tight supply driving record prices for China’s steel Following a record 1.1 billion tonnes of steel output in 2020, production in China has continued its impressive growth into 2021 (Figure 3.2). In the March quarter 2021, output grew by 14% year-on-year, and in April 2021 reached a new monthly production record of 97.9 million tonnes.
Domestically, the Chinese economy has benefited from ongoing government support, frequently in the form of new infrastructure projects and expansionary monetary policy. The increase in construction activity has been a continued driver of the recovery in the first half of 2021. However, weakening credit growth and the continued withdrawal of stimulatory macroeconomic policies are likely to see the pace of growth soften slightly from the second half of 2021. The ongoing surge in house prices across many of China's cities in 2021 is also prompting expectations of continuing government intervention to cool the buoyancy of the market, which may act as a further restraint on domestic growth.
20
40
60
80
100
120
140
Nov-2019 Mar-2020 Jul-2020 Nov-2020 Mar-2021
Nov
embe
r 201
9 =
100
World China European UnionUnited States India Japan
26Resources and Energy Quarterly June 2021
The shift towards greater consumption of goods since the start of the pandemic, as well as subdued levels of industrial production in economies such as the US and EU, has supported a marked increase in global demand for Chinese exports over the last year. In the four months to April, Chinese exports were 24.5% higher year-on-year, and were at their highest level since 2017. With major economies set to continue opening up in the second half of 2021, a swing back to greater service consumption could be expected and would mitigate this trend. This would act as a headwind on China's manufacturing sector.
The ongoing concerns around cuts to total domestic steel production proposed by the Chinese government appear to have intensified demand in the first half of 2021. This is likely to have been exacerbated by rising concerns of trade disruptions extending to Australian iron ore, boosting short term demand for steel in an effort to counter any future supply shortfalls.
Figure 3.2: China’s steel demand, supply and net exports
Source: Bloomberg (2021); World Steel Association (2021); Department of Industry, Science, Energy and Resources (2021)
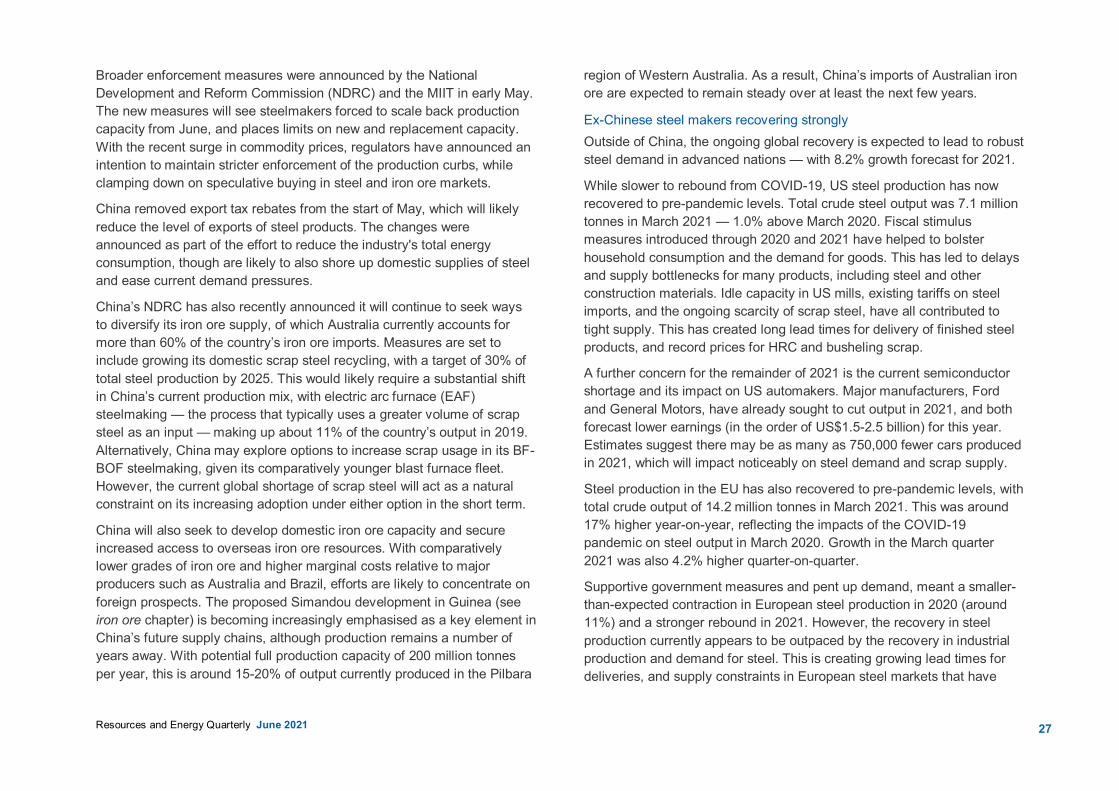
Figure 3.3: Daily spot prices in China for steel products
Source: Bloomberg (2021); Antaike (2021)
The combined effect has seen prices for hot rolled sheet and rebar steel — used extensively in construction and manufacturing — hit record highs in Asian spot and futures markets. This includes record daily domestic spot prices for hot rolled sheet and rebar steel in early May of Yuan 6,720 (US$1,041) and Yuan 6,259 (US$974), respectively (Figure 3.3).
Chinese policymakers attempting to stem growth in steel output China's higher crude steel production in 2021 has come in spite of a planned reduction in total output announced by China's Ministry of Industry and Information Technology (MIIT) in December 2020. The policy is part of the country's intended pathway toward carbon neutrality by 2060, and has led to emissions curbs imposed on a number of steel mills in Tangshan, which could result in a 30-50% reduction in output by the end of 2021.
The restrictions do not yet appear to have curtailed total steel production at a national level, with monthly output to April 2021 continuing to hit record highs. Instead, record steel prices and margins appear to have encouraged greater utilisation rates amongst competing mills, and replacement supply coming online in other provinces throughout China.
0
1,000
2,000
3,000
4,000
5,000
6,000
7,000
8,000
2016 2017 2018 2019 2020 2021
Yuan
per
tonn
e
Rebar 25mm HR sheet
-25
0
25
50
75
100
125
0
200
400
600
800
1,000
1,200
2005 2008 2011 2014 2017 2020 2023
Mill
ion
tonn
es
Mill
ion
tonn
es
Steel production Steel consumptionImplied net exports (rhs)
27Resources and Energy Quarterly June 2021
Broader enforcement measures were announced by the National Development and Reform Commission (NDRC) and the MIIT in early May. The new measures will see steelmakers forced to scale back production capacity from June, and places limits on new and replacement capacity. With the recent surge in commodity prices, regulators have announced an intention to maintain stricter enforcement of the production curbs, while clamping down on speculative buying in steel and iron ore markets.
China removed export tax rebates from the start of May, which will likely reduce the level of exports of steel products. The changes were announced as part of the effort to reduce the industry's total energy consumption, though are likely to also shore up domestic supplies of steel and ease current demand pressures.
China’s NDRC has also recently announced it will continue to seek ways to diversify its iron ore supply, of which Australia currently accounts for more than 60% of the country’s iron ore imports. Measures are set to include growing its domestic scrap steel recycling, with a target of 30% of total steel production by 2025. This would likely require a substantial shift in China’s current production mix, with electric arc furnace (EAF) steelmaking — the process that typically uses a greater volume of scrap steel as an input — making up about 11% of the country’s output in 2019. Alternatively, China may explore options to increase scrap usage in its BF-BOF steelmaking, given its comparatively younger blast furnace fleet. However, the current global shortage of scrap steel will act as a natural constraint on its increasing adoption under either option in the short term.
China will also seek to develop domestic iron ore capacity and secure increased access to overseas iron ore resources. With comparatively lower grades of iron ore and higher marginal costs relative to major producers such as Australia and Brazil, efforts are likely to concentrate on foreign prospects. The proposed Simandou development in Guinea (see iron ore chapter) is becoming increasingly emphasised as a key element in China’s future supply chains, although production remains a number of years away. With potential full production capacity of 200 million tonnes per year, this is around 15-20% of output currently produced in the Pilbara
region of Western Australia. As a result, China’s imports of Australian iron ore are expected to remain steady over at least the next few years.
Ex-Chinese steel makers recovering strongly Outside of China, the ongoing global recovery is expected to lead to robust steel demand in advanced nations — with 8.2% growth forecast for 2021.
While slower to rebound from COVID-19, US steel production has now recovered to pre-pandemic levels. Total crude steel output was 7.1 million tonnes in March 2021 — 1.0% above March 2020. Fiscal stimulus measures introduced through 2020 and 2021 have helped to bolster household consumption and the demand for goods. This has led to delays and supply bottlenecks for many products, including steel and other construction materials. Idle capacity in US mills, existing tariffs on steel imports, and the ongoing scarcity of scrap steel, have all contributed to tight supply. This has created long lead times for delivery of finished steel products, and record prices for HRC and busheling scrap.
A further concern for the remainder of 2021 is the current semiconductor shortage and its impact on US automakers. Major manufacturers, Ford and General Motors, have already sought to cut output in 2021, and both forecast lower earnings (in the order of US$1.5-2.5 billion) for this year. Estimates suggest there may be as many as 750,000 fewer cars produced in 2021, which will impact noticeably on steel demand and scrap supply.
Steel production in the EU has also recovered to pre-pandemic levels, with total crude output of 14.2 million tonnes in March 2021. This was around 17% higher year-on-year, reflecting the impacts of the COVID-19 pandemic on steel output in March 2020. Growth in the March quarter 2021 was also 4.2% higher quarter-on-quarter.
Supportive government measures and pent up demand, meant a smaller-than-expected contraction in European steel production in 2020 (around 11%) and a stronger rebound in 2021. However, the recovery in steel production currently appears to be outpaced by the recovery in industrial production and demand for steel. This is creating growing lead times for deliveries, and supply constraints in European steel markets that have

28Resources and Energy Quarterly June 2021
pushed HRC and rebar prices to record highs. Many major steelmakers reported their strongest quarter in a decade in the year to March 2021.
The recovery in the EU economy in 2021 continues to be led by its construction and manufacturing sectors, particularly in Italy, France and Spain. Though as with the US, the current shortage of semi-conductors remains a key risk in the recovery of the region’s automotive manufacturing sector.
Global demand for steel to continue to grow to 2023 A number of countries have now committed to ambitious emissions reductions targets over the next few decades. In April, the US announced a new target of a 50-52% reduction in greenhouse gas emissions (below 2005 levels) by 2030. This follows similar targets by other major steel producers such as the EU (55% reduction on 1990 levels by 2030), China (carbon neutral by 2060), and Japan (46% reduction on 2013 levels by 2030).
The steel industry will be directly affected by this transition, given its high energy and emissions intensities. However, the push for a recovery in economic activity coming out of the pandemic is likely to ensure continued growth in demand for steel in the short-term. As a critical input for the clean energy transition, steel demand will also likely benefit from the substantial infrastructure programs either planned or underway amongst major economies. This would include upgraded electricity transmission and distribution infrastructure, wind turbines, hydropower and nuclear power plants.
The US Administration's proposed US$2.2 trillion American Jobs Plan has a strong focus on investment in new infrastructure, clean technologies and renewable energy. If passed, proposed spending of US$1.7 trillion has been earmarked for infrastructure, including the repair of roads and bridges, new public transportation, a rebuild of utilities infrastructure and development of its domestic electric vehicle market. Similar infrastructure-intensive ‘green’ fiscal stimulus is also being planned or introduced in the European Union and Japan.
As a consequence, steady growth of 2.8% annually is projected for world steel production over the outlook period, reaching 2.1 billion tonnes by 2023 (Figure 3.4).
Longer term, the industry is expected to require significant advancement in technological performance and material efficiency, in order to meet emissions targets. This includes an increasing share of secondary steel production, process automation and the use of artificial intelligence. The increasing switch in fuels to natural gas, deployment of new technologies such as carbon capture, utilisation and storage (CCUS), and hydrogen-based production will also be critical.
With the increasing take up on these initiatives, there is the potential for overall global demand for steel to flatten or even fall from present levels in coming decades. Though with priority being afforded to the economic recovery and fiscal stimulus, no fall in total output is expected over the outlook period.
Figure 3.4: Global steel production by country
Source: World Steel Association (2021); Department of Industry, Science, Energy and Resources (2021)
0
500
1,000
1,500
2,000
2,500
2005 2007 2009 2011 2013 2015 2017 2019 2021 2023M
illio
n to
nnes
China European Union India Japan United States ROW
29
Resources and Energy Quarterly June 2021
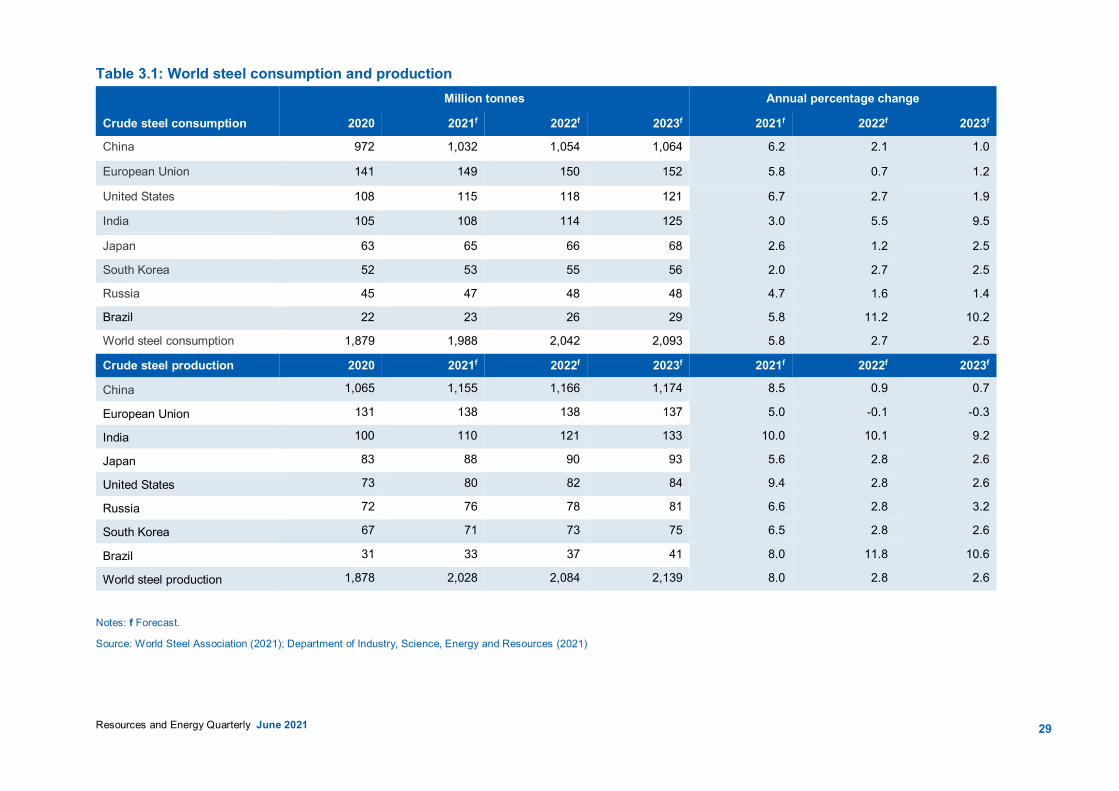
Table 3.1: World steel consumption and production Million tonnes Annual percentage change
Crude steel consumption 2020 2021f 2022f 2023f 2021f 2022f 2023f
China 972 1,032 1,054 1,064 6.2 2.1 1.0
European Union 141 149 150 152 5.8 0.7 1.2
United States 108 115 118 121 6.7 2.7 1.9
India 105 108 114 125 3.0 5.5 9.5
Japan 63 65 66 68 2.6 1.2 2.5
South Korea 52 53 55 56 2.0 2.7 2.5
Russia 45 47 48 48 4.7 1.6 1.4
Brazil 22 23 26 29 5.8 11.2 10.2
World steel consumption 1,879 1,988 2,042 2,093 5.8 2.7 2.5
Crude steel production 2020 2021f 2022f 2023f 2021f 2022f 2023f
China 1,065 1,155 1,166 1,174 8.5 0.9 0.7
European Union 131 138 138 137 5.0 -0.1 -0.3
India 100 110 121 133 10.0 10.1 9.2
Japan 83 88 90 93 5.6 2.8 2.6
United States 73 80 82 84 9.4 2.8 2.6
Russia 72 76 78 81 6.6 2.8 3.2
South Korea 67 71 73 75 6.5 2.8 2.6
Brazil 31 33 37 41 8.0 11.8 10.6
World steel production 1,878 2,028 2,084 2,139 8.0 2.8 2.6
Notes: f Forecast.
Source: World Steel Association (2021); Department of Industry, Science, Energy and Resources (2021)
32
Resources and Energy Quarterly June 2021
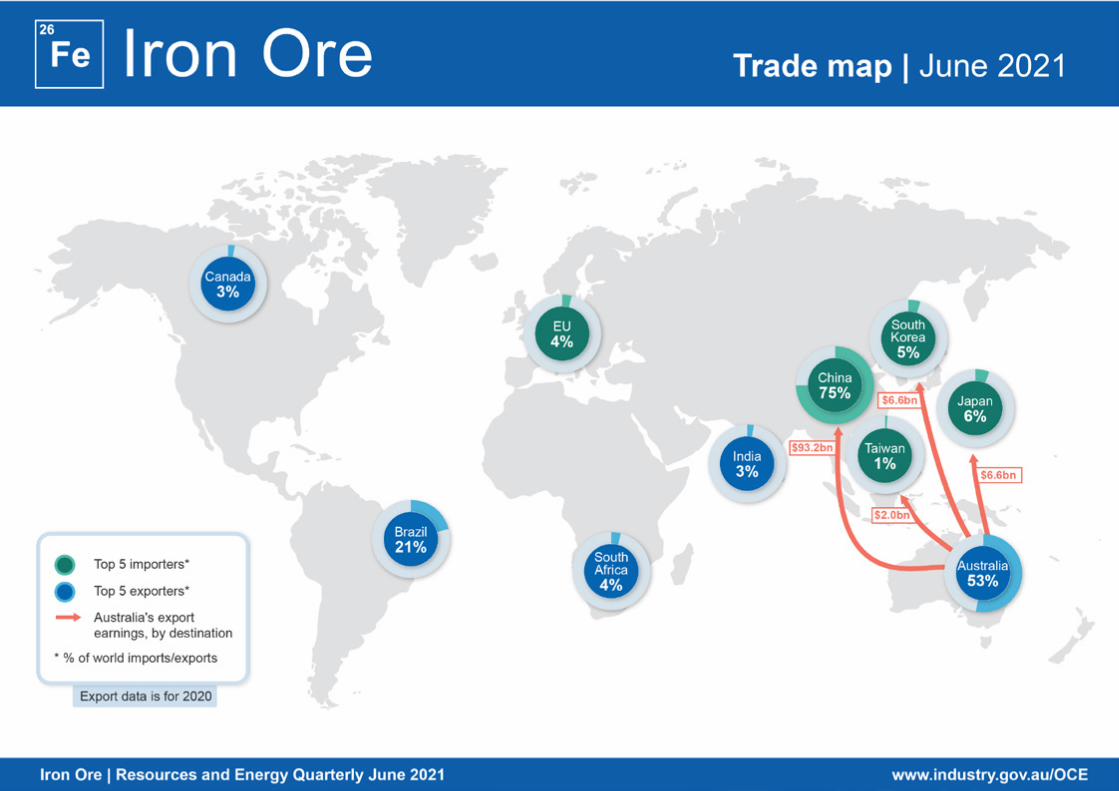
4.1 Summary Iron ore prices surged to record highs in 2021, surpassing
US$200 a tonne in early May. The continuing rebound in economic activity in China and other advanced economies has led to an elevated demand for steel and consumption goods, in the midst of ongoing tightness in global iron ore supply.
Australian export volumes are expected to grow steadily, from 871 million tonnes in 2020–21 to 954 million tonnes by 2022–23. This reflects the commencement of several new mines in Western Australia.
Australia's iron ore export values are estimated to have risen from $103 billion in 2019–20 to $149 billion in 2020–21, on the back of record prices and growing volumes. An easing in prices from the latter half of 2021 is forecast to lower export earnings to $113 billion by 2022–23.
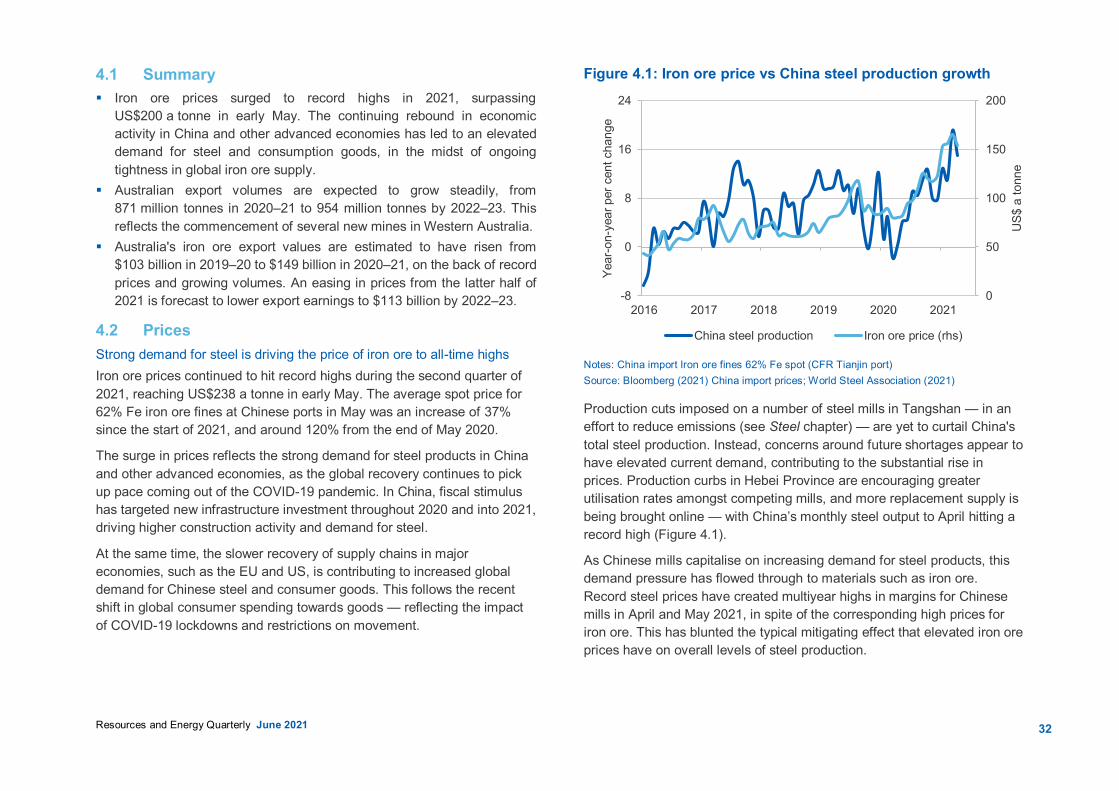
4.2 Prices Strong demand for steel is driving the price of iron ore to all-time highs Iron ore prices continued to hit record highs during the second quarter of 2021, reaching US$238 a tonne in early May. The average spot price for 62% Fe iron ore fines at Chinese ports in May was an increase of 37% since the start of 2021, and around 120% from the end of May 2020.
The surge in prices reflects the strong demand for steel products in China and other advanced economies, as the global recovery continues to pick up pace coming out of the COVID-19 pandemic. In China, fiscal stimulus has targeted new infrastructure investment throughout 2020 and into 2021, driving higher construction activity and demand for steel.
At the same time, the slower recovery of supply chains in major economies, such as the EU and US, is contributing to increased global demand for Chinese steel and consumer goods. This follows the recent shift in global consumer spending towards goods — reflecting the impact of COVID-19 lockdowns and restrictions on movement.
Figure 4.1: Iron ore price vs China steel production growth
Notes: China import Iron ore fines 62% Fe spot (CFR Tianjin port) Source: Bloomberg (2021) China import prices; World Steel Association (2021)
Production cuts imposed on a number of steel mills in Tangshan — in an effort to reduce emissions (see Steel chapter) — are yet to curtail China's total steel production. Instead, concerns around future shortages appear to have elevated current demand, contributing to the substantial rise in prices. Production curbs in Hebei Province are encouraging greater utilisation rates amongst competing mills, and more replacement supply is being brought online — with China’s monthly steel output to April hitting a record high (Figure 4.1).
As Chinese mills capitalise on increasing demand for steel products, this demand pressure has flowed through to materials such as iron ore. Record steel prices have created multiyear highs in margins for Chinese mills in April and May 2021, in spite of the corresponding high prices for iron ore. This has blunted the typical mitigating effect that elevated iron ore prices have on overall levels of steel production.
0
50
100
150
200
-8
0
8
16
24
2016 2017 2018 2019 2020 2021
US$
a to
nne
Year
-on-
year
per
cen
t cha
nge
China steel production Iron ore price (rhs)
33
Resources and Energy Quarterly June 2021
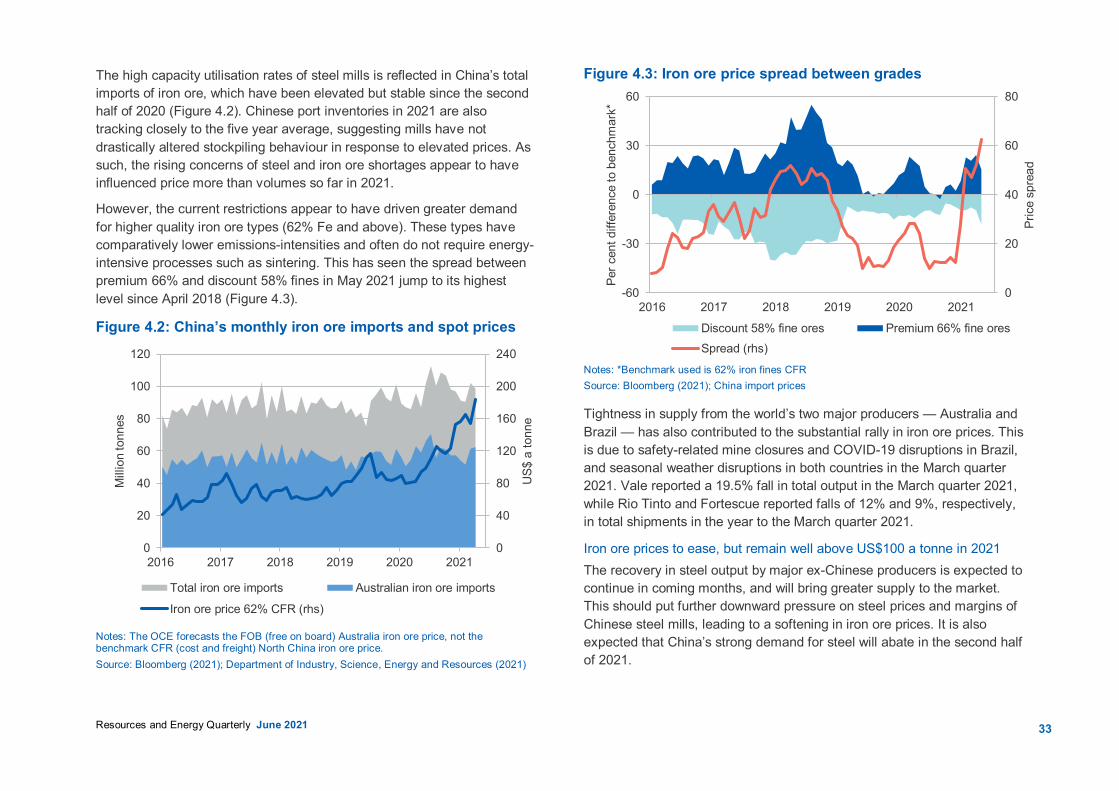
The high capacity utilisation rates of steel mills is reflected in China’s total imports of iron ore, which have been elevated but stable since the second half of 2020 (Figure 4.2). Chinese port inventories in 2021 are also tracking closely to the five year average, suggesting mills have not drastically altered stockpiling behaviour in response to elevated prices. As such, the rising concerns of steel and iron ore shortages appear to have influenced price more than volumes so far in 2021.
However, the current restrictions appear to have driven greater demand for higher quality iron ore types (62% Fe and above). These types have comparatively lower emissions-intensities and often do not require energy-intensive processes such as sintering. This has seen the spread between premium 66% and discount 58% fines in May 2021 jump to its highest level since April 2018 (Figure 4.3).
Figure 4.2: China’s monthly iron ore imports and spot prices
Notes: The OCE forecasts the FOB (free on board) Australia iron ore price, not the benchmark CFR (cost and freight) North China iron ore price. Source: Bloomberg (2021); Department of Industry, Science, Energy and Resources (2021)
Figure 4.3: Iron ore price spread between grades
Notes: *Benchmark used is 62% iron fines CFR Source: Bloomberg (2021); China import prices
Tightness in supply from the world’s two major producers — Australia and Brazil — has also contributed to the substantial rally in iron ore prices. This is due to safety-related mine closures and COVID-19 disruptions in Brazil, and seasonal weather disruptions in both countries in the March quarter 2021. Vale reported a 19.5% fall in total output in the March quarter 2021, while Rio Tinto and Fortescue reported falls of 12% and 9%, respectively, in total shipments in the year to the March quarter 2021.
Iron ore prices to ease, but remain well above US$100 a tonne in 2021 The recovery in steel output by major ex-Chinese producers is expected to continue in coming months, and will bring greater supply to the market. This should put further downward pressure on steel prices and margins of Chinese steel mills, leading to a softening in iron ore prices. It is also expected that China’s strong demand for steel will abate in the second half of 2021.
0
40
80
120
160
200
240
0
20
40
60
80
100
120
2016 2017 2018 2019 2020 2021
US$
a to
nne
Mill
ion
tonn
es
Total iron ore imports Australian iron ore imports
Iron ore price 62% CFR (rhs)
0
20
40
60
80
-60
-30
0
30
60
2016 2017 2018 2019 2020 2021
Pric
e sp
read
Per c
ent d
iffer
ence
to b
ench
mar
k*
Discount 58% fine ores Premium 66% fine oresSpread (rhs)

34
Resources and Energy Quarterly June 2021
Domestic efforts to curb China’s total steel output are likely to start taking hold in coming months, and should have a dampening effect on the price of iron ore. New measures announced by the National Development and Reform Commission (NDRC) and Ministry of Industry and Information Technology in early May 2021 will see steelmakers forced to further scale back production capacity from June, and will place limits on new and replacement capacity. With the recent surge in commodity prices, regulators have flagged potential strengthening of the enforcement of production curbs, as well as clamping down on speculative behaviour in steel and iron ore markets.
China has removed export tax rebates from the start of May 2021, which is expected to reduce the level of exports of steel products. The changes were announced as part of the effort to reduce the industry's total energy consumption, though are likely to also bolster domestic supplies of steel and ease current demand pressures.
The current ramp up in China's steel output — typically seen from April each year during the construction sector's busy season — should ease by mid-year. China also appears to be stepping up efforts to address surging property prices, which may help to soften the boom in construction activity. The introduction of lending restrictions from late 2020, and market-cooling policies introduced for Tier 1 cities in early 2021 has seen loan and credit growth slow in April. Current expectations are for restrictions to soon be extended to Tier 2 and Tier 3 cities, following ongoing price rises in these cities through April.
Any disruptions to iron ore imports from Australia could add to current upward price pressures, as could emissions-related production cuts which outpace the expected easing in steel demand.
The sources of tight global supply in iron ore are expected to ease throughout 2021. Total volumes shipped from Australia and Brazil should increase, following weather-affected falls in production and shipments — which typically have the most significant effects in the first quarter of each year. Production guidance in 2021 for major producers such as Rio Tinto, BHP and Fortescue is unchanged.
Vale’s Brazilian operations are steadily returning to output levels last seen prior to the January 2019 Brumadinho tailings dam collapse. The company has announced that it expects to reach an iron ore capacity of 400 million tonnes per year by the end of 2022. More rapid progress on this front could lower prices more swiftly.
Heavy rains, which sometimes disrupt operations in Brazil, and cyclonic activity which periodically affects Australian shipments, present risks to growing global supply. Australian producers have also flagged skilled labour shortages as an ongoing concern, with both factors having potential to prolong the current upswing in prices through the second half of 2021.
Prices are forecast to average around US$150 a tonne in 2021, before falling to below US$100 a tonne by the end of 2022, as Brazilian supply recovers and Chinese steel production softens (Figure 4.4).
Figure 4.4: Iron ore price outlook, quarterly
Notes: China import iron ore fines 62% Fe spot (FOB) Source: Bloomberg (2021); Department of Industry, Science, Energy and Resources (2021)
0
50
100
150
200
2016 2017 2018 2019 2020 2021 2022 2023
$US
a to
nne
Iron ore quarterly price (fines)

35
Resources and Energy Quarterly June 2021
4.3 World trade Australia’s dominance of iron ore markets will face challenges Global trade remains dominated by Australia, which exported more than half of all seaborne iron ore in 2020. However, growing output from Brazil and Africa may provide some pushback to Australia’s dominance over the coming years (Figure 4.5).
In May 2021, the Chinese government announced it will seek to diversify its iron ore supply, of which Australia currently accounts for more than 60% of the country’s iron ore imports. China is expected to undertake greater exploration and development of domestic resources, and seek to secure alternative sources of overseas supply. Efforts to expand its domestic supply will face headwinds, given the relatively low quality of available deposits and the associated high production and refining costs. Chinese domestic output of iron ore is also likely to trend down over time, as the existing mines deplete.
China is investigating a number of possible iron ore mines in Africa, including large deposits in Gabon and Madagascar. The most notable prospect in Africa is the proposed Simandou iron ore mine, located in Guinea.
The Simandou project remains a number of years away from generating significant output. Extensive rail and port infrastructure needs to be developed before the iron ore can be shipped, including a new deep water port and more than 650 kilometres of railway. With potential full production capacity of 200 million tonnes per year, this is around 15-20% of output currently produced in the Pilbara region of Western Australia.
Despite the fall in production in the March quarter 2021, Brazilian iron ore output is expected to recover over the next two years. Vale is projecting total production of 315-335 million tonnes in 2021, with the aim of 400 million tonnes per annum by the end of 2022. This would include planned recommissioning and expansion of its Timbopeba and Northern System operations. However, progress may be checked by the complexity of the projects, reflected in a series of already-missed deadlines in the
company’s recovery plans. Conditions in Brazil remain challenging, due to the COVID-19 pandemic and lingering impacts from the Brumadinho tailings dam collapse.
Beyond 2022, Vale’s US$1.5 billion Serra Sul 120 project is due to be commissioned in the first half of 2024. With its completion, total production capacity of Vale’s Northern System is expected to rise to 260 million tonnes per annum. However, this is expected to be at least partially offset by declining output in the producer’s Southern System.
Global iron ore markets are expected to remain tight, with slow growth in both supply and demand over the next few years. Market structure is not expected to alter significantly, with Australia’s market share expected to hold up. A recovery in Brazilian supply is likely in the short-term, but a number of high-cost mines in Brazil and China are also expected to face closure or depletion over the next 10 years.
Figure 4.5: Outlook for global iron ore exports
Source: World Steel Association (2021); Department of Industry, Science, Energy and Resources (2021)
0
500
1,000
1,500
2,000
2016 2017 2018 2019 2020 2021 2022 2023M
illio
n to
nnes
Australia Brazil ROW

36
Resources and Energy Quarterly June 2021
4.4 Australia Iron ore export earnings are set to reach a new record in 2020–21 Australia’s iron ore export value reached a record $38 billion in the March quarter 2021. This included a new monthly record of $14 billion of iron ore exported in the month of March. The strong result reflects soaring global iron ore prices, with total export values in the March quarter 2021 rising 8.8% from the December quarter 2020, and around 65% from the same period in 2020.
The unprecedented rise in prices has helped to overcome a fall of 8.0% quarter-on-quarter in total export volumes in the March quarter 2021. The drop is attributable to seasonal weather disruptions, typically experienced during the early months of each calendar year. However, the outcome for the March 2021 quarter still represents a 4.9% rise in total export volumes compared with the same quarter in 2020.
Iron ore exports to China totalled around A$28.8 billion in the March quarter 2021, constituting around three-quarters of total Australian iron ore export value for the period. Total export value to China for the March quarter 2021 rose 9.0% quarter-on-quarter, and was over 50% higher than the same period in 2020 (Figure 4.6). The outcome reflects the significant role that elevated iron ore prices are having for Australian exporters, with March quarter 2021 export volumes to China falling 8.0% from the December quarter (while rising by a modest 4.9% year-on-year).
Despite modest falls in export volumes for a number of Australia's major producers in the March quarter 2021, domestic operations continue to perform strongly. Total export volumes of iron ore are estimated at 871 million tonnes in 2020–21, up 1.4%.
Rio Tinto's 2021 guidance (for 325 to 340 million tonnes of production) remains on track despite of seasonal weather disruptions and labour shortages encountered through the March quarter 2021. This remains subject to around 90 million tonnes of replacement mine capacity expected to come online at Robe Valley and West Angelas hubs, along with the new Gudai-Darri (formerly Koodaideri) mine.
Figure 4.6: Australia’s iron ore export destinations, monthly
Source: ABS (2021); Department of Industry, Science, Energy and Resources (2021)
BHP was able to achieve 4% quarter-on-quarter growth in the March quarter 2021, in spite of weather impacts and planned maintenance. Guidance for the 2020–21 financial year remains at 245-255 million tonnes. BHP also reported first delivery from its South Flank project in May. The project is expected to ramp up to 80 million tonnes per year, though it will largely act as a replacement for its depleted Yandi mine.
Fortescue's total exports fell by 9% in quarterly terms, to 42 million tonnes in the March quarter 2021. However, quarterly results were mostly stable in year-on-year terms. This has come as Fortescue’s newly developed Eliwana project successfully ramps up in 2021, with output expected to reach almost 30 million tonnes per year.
High iron ore prices have seen efforts to bring a number of new and idled projects back online in 2021 – with up to 10 million tonnes of new capacity potentially coming online from smaller producers in 2021.
The Roper Bar mine in the Northern Territory has recently restarted production, with the project expected to ramp up to 1.5-2 million tonnes of
0
2,000
4,000
6,000
8,000
10,000
12,000
1997 2001 2005 2009 2013 2017 2021
$ m
illio
ns
Japan Korea Taiwan China Others
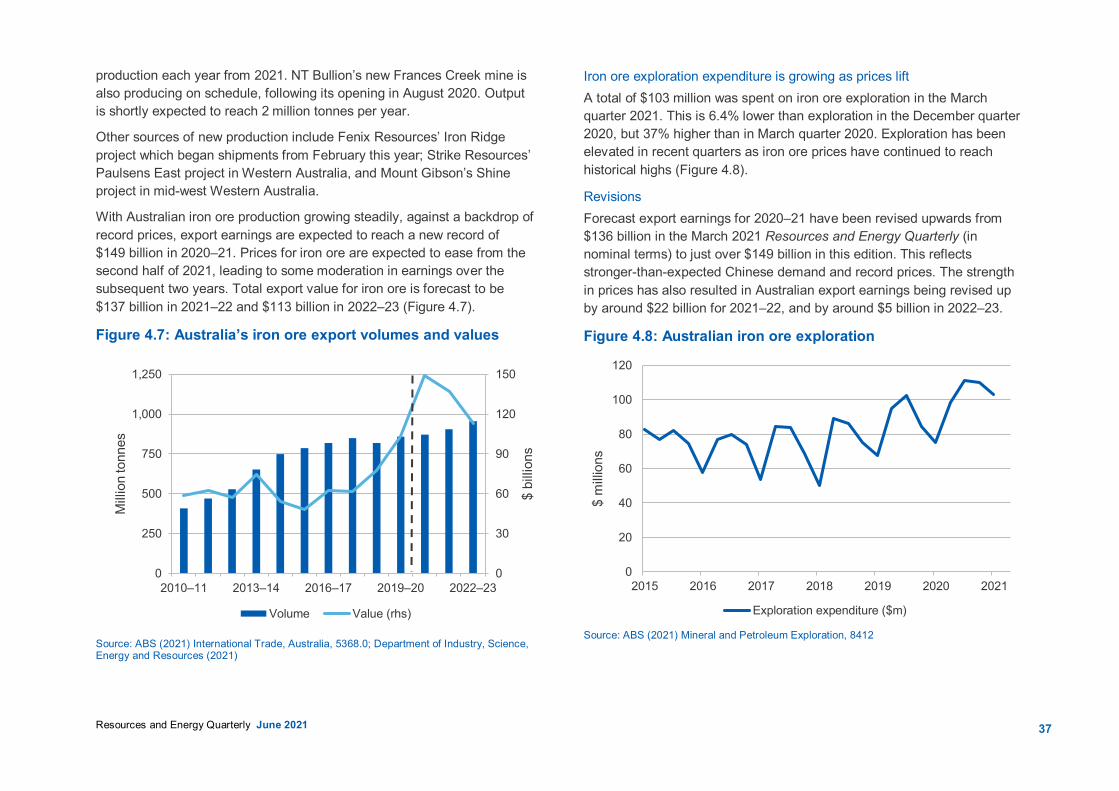
37
Resources and Energy Quarterly June 2021
production each year from 2021. NT Bullion’s new Frances Creek mine is also producing on schedule, following its opening in August 2020. Output is shortly expected to reach 2 million tonnes per year.
Other sources of new production include Fenix Resources’ Iron Ridge project which began shipments from February this year; Strike Resources’ Paulsens East project in Western Australia, and Mount Gibson’s Shine project in mid-west Western Australia.
With Australian iron ore production growing steadily, against a backdrop of record prices, export earnings are expected to reach a new record of $149 billion in 2020–21. Prices for iron ore are expected to ease from the second half of 2021, leading to some moderation in earnings over the subsequent two years. Total export value for iron ore is forecast to be $137 billion in 2021–22 and $113 billion in 2022–23 (Figure 4.7).
Figure 4.7: Australia’s iron ore export volumes and values
Source: ABS (2021) International Trade, Australia, 5368.0; Department of Industry, Science, Energy and Resources (2021)
Iron ore exploration expenditure is growing as prices lift A total of $103 million was spent on iron ore exploration in the March quarter 2021. This is 6.4% lower than exploration in the December quarter 2020, but 37% higher than in March quarter 2020. Exploration has been elevated in recent quarters as iron ore prices have continued to reach historical highs (Figure 4.8).
Revisions Forecast export earnings for 2020–21 have been revised upwards from $136 billion in the March 2021 Resources and Energy Quarterly (in nominal terms) to just over $149 billion in this edition. This reflects stronger-than-expected Chinese demand and record prices. The strength in prices has also resulted in Australian export earnings being revised up by around $22 billion for 2021–22, and by around $5 billion in 2022–23.
Figure 4.8: Australian iron ore exploration
Source: ABS (2021) Mineral and Petroleum Exploration, 8412
0
30
60
90
120
150
0
250
500
750
1,000
1,250
2010–11 2013–14 2016–17 2019–20 2022–23
$ bi
llion
s
Mill
ion
tonn
es
Volume Value (rhs)
0
20
40
60
80
100
120
2015 2016 2017 2018 2019 2020 2021$
mill
ions
Exploration expenditure ($m)
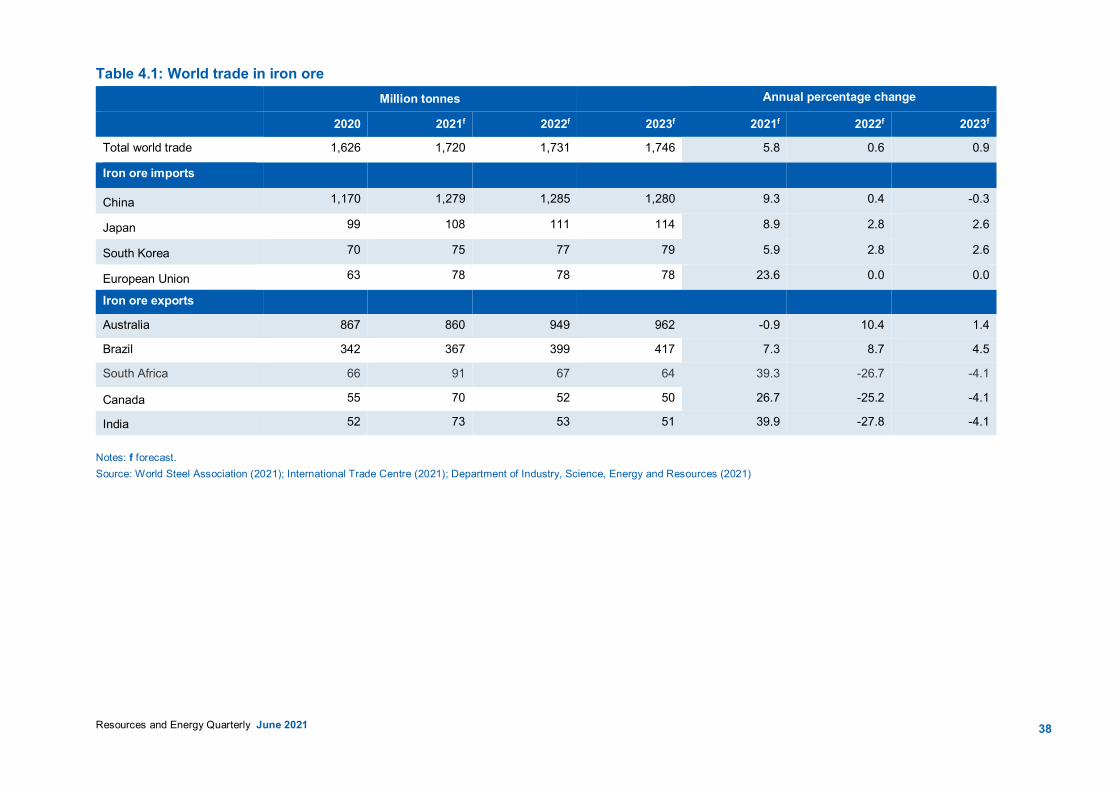
38
Resources and Energy Quarterly June 2021
Table 4.1: World trade in iron ore Million tonnes Annual percentage change
2020 2021f 2022f 2023f 2021f 2022f 2023f
Total world trade 1,626 1,720 1,731 1,746 5.8 0.6 0.9
Iron ore imports
China 1,170 1,279 1,285 1,280 9.3 0.4 -0.3
Japan 99 108 111 114 8.9 2.8 2.6
South Korea 70 75 77 79 5.9 2.8 2.6
European Union 63 78 78 78 23.6 0.0 0.0
Iron ore exports
Australia 867 860 949 962 -0.9 10.4 1.4
Brazil 342 367 399 417 7.3 8.7 4.5
South Africa 66 91 67 64 39.3 -26.7 -4.1
Canada 55 70 52 50 26.7 -25.2 -4.1
India 52 73 53 51 39.9 -27.8 -4.1 Notes: f forecast. Source: World Steel Association (2021); International Trade Centre (2021); Department of Industry, Science, Energy and Resources (2021)
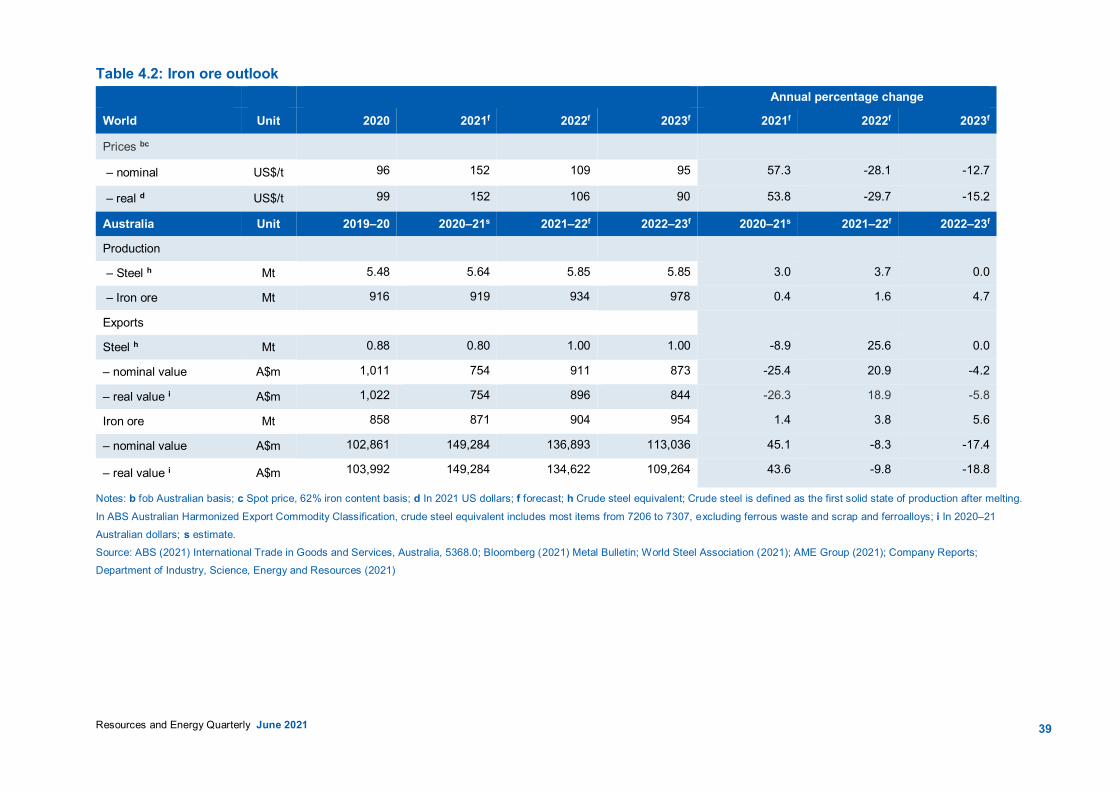
39
Resources and Energy Quarterly June 2021
Table 4.2: Iron ore outlook Annual percentage change
World Unit 2020 2021f 2022f 2023f 2021f 2022f 2023f
Prices bc
– nominal US$/t 96 152 109 95 57.3 -28.1 -12.7
– real d US$/t 99 152 106 90 53.8 -29.7 -15.2
Australia Unit 2019–20 2020–21s 2021–22f 2022–23f 2020–21s 2021–22f 2022–23f
Production
– Steel h Mt 5.48 5.64 5.85 5.85 3.0 3.7 0.0
– Iron ore Mt 916 919 934 978 0.4 1.6 4.7
Exports
Steel h Mt 0.88 0.80 1.00 1.00 -8.9 25.6 0.0
– nominal value A$m 1,011 754 911 873 -25.4 20.9 -4.2
– real value i A$m 1,022 754 896 844 -26.3 18.9 -5.8
Iron ore Mt 858 871 904 954 1.4 3.8 5.6
– nominal value A$m 102,861 149,284 136,893 113,036 45.1 -8.3 -17.4
– real value i A$m 103,992 149,284 134,622 109,264 43.6 -9.8 -18.8
Notes: b fob Australian basis; c Spot price, 62% iron content basis; d In 2021 US dollars; f forecast; h Crude steel equivalent; Crude steel is defined as the first solid state of production after melting.
In ABS Australian Harmonized Export Commodity Classification, crude steel equivalent includes most items from 7206 to 7307, excluding ferrous waste and scrap and ferroalloys; i In 2020–21 Australian dollars; s estimate. Source: ABS (2021) International Trade in Goods and Services, Australia, 5368.0; Bloomberg (2021) Metal Bulletin; World Steel Association (2021); AME Group (2021); Company Reports; Department of Industry, Science, Energy and Resources (2021)
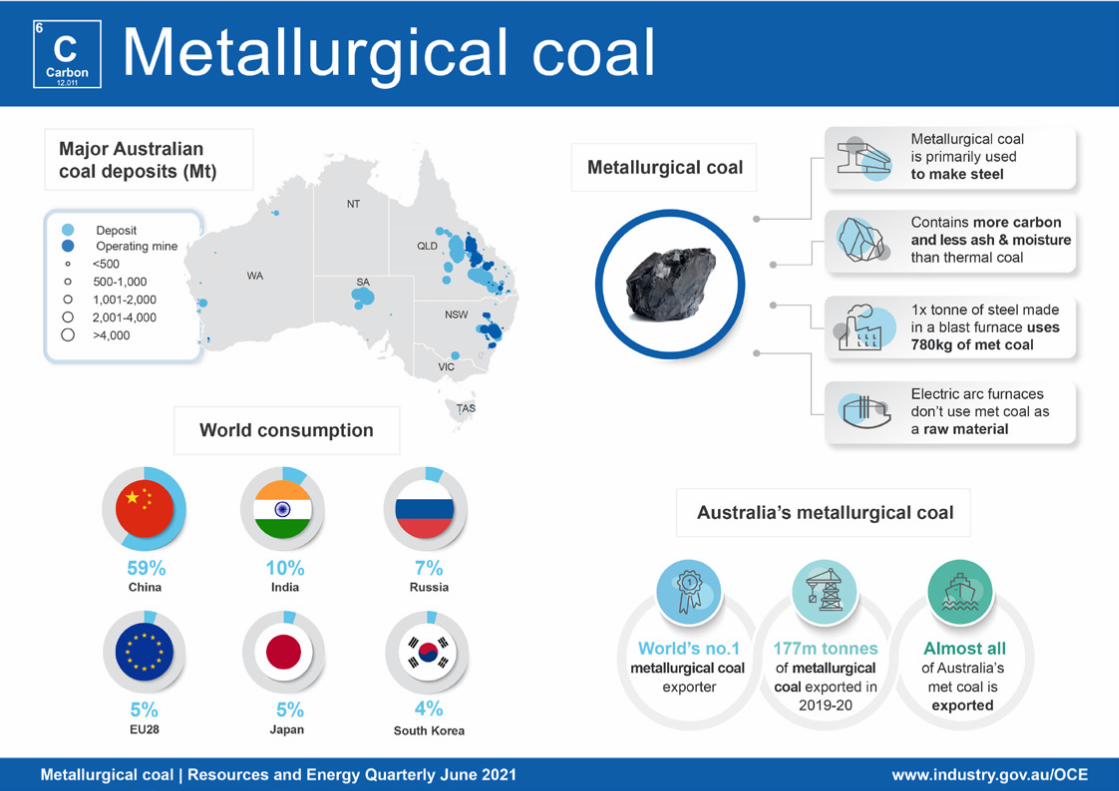
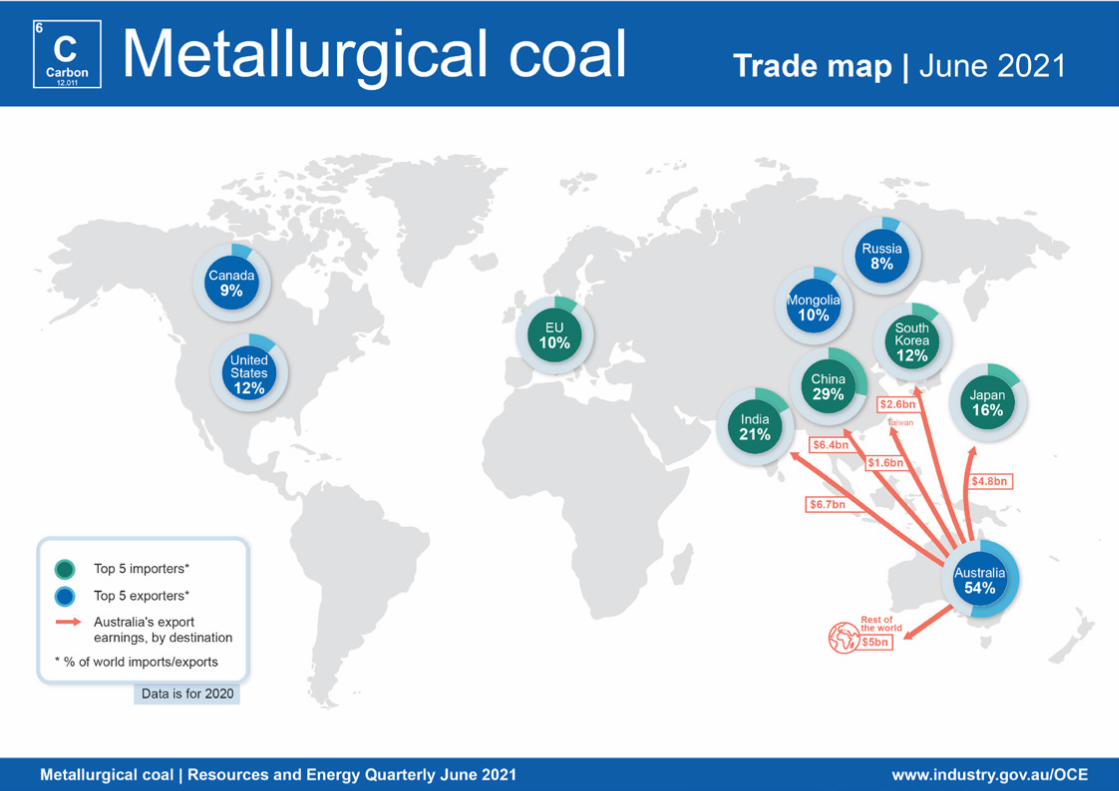
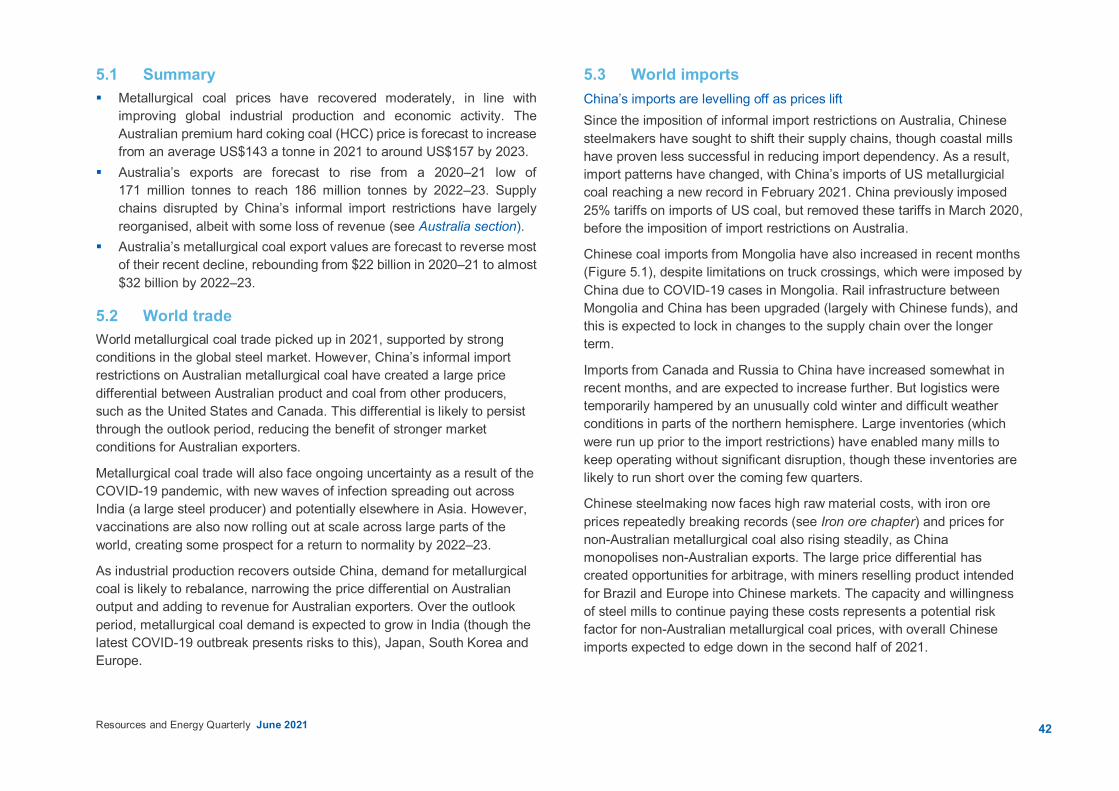
42Resources and Energy Quarterly June 2021
5.1 Summary Metallurgical coal prices have recovered moderately, in line with
improving global industrial production and economic activity. The Australian premium hard coking coal (HCC) price is forecast to increase from an average US$143 a tonne in 2021 to around US$157 by 2023.
Australia’s exports are forecast to rise from a 2020–21 low of 171 million tonnes to reach 186 million tonnes by 2022–23. Supply chains disrupted by China’s informal import restrictions have largely reorganised, albeit with some loss of revenue (see Australia section).
Australia’s metallurgical coal export values are forecast to reverse most of their recent decline, rebounding from $22 billion in 2020–21 to almost $32 billion by 2022–23.
5.2 World trade World metallurgical coal trade picked up in 2021, supported by strong conditions in the global steel market. However, China’s informal import restrictions on Australian metallurgical coal have created a large price differential between Australian product and coal from other producers, such as the United States and Canada. This differential is likely to persist through the outlook period, reducing the benefit of stronger market conditions for Australian exporters.
Metallurgical coal trade will also face ongoing uncertainty as a result of the COVID-19 pandemic, with new waves of infection spreading out across India (a large steel producer) and potentially elsewhere in Asia. However, vaccinations are also now rolling out at scale across large parts of the world, creating some prospect for a return to normality by 2022–23.
As industrial production recovers outside China, demand for metallurgical coal is likely to rebalance, narrowing the price differential on Australian output and adding to revenue for Australian exporters. Over the outlook period, metallurgical coal demand is expected to grow in India (though the latest COVID-19 outbreak presents risks to this), Japan, South Korea and Europe.
5.3 World imports China’s imports are levelling off as prices lift Since the imposition of informal import restrictions on Australia, Chinese steelmakers have sought to shift their supply chains, though coastal mills have proven less successful in reducing import dependency. As a result, import patterns have changed, with China’s imports of US metallurgicial coal reaching a new record in February 2021. China previously imposed 25% tariffs on imports of US coal, but removed these tariffs in March 2020, before the imposition of import restrictions on Australia.
Chinese coal imports from Mongolia have also increased in recent months (Figure 5.1), despite limitations on truck crossings, which were imposed by China due to COVID-19 cases in Mongolia. Rail infrastructure between Mongolia and China has been upgraded (largely with Chinese funds), and this is expected to lock in changes to the supply chain over the longer term.
Imports from Canada and Russia to China have increased somewhat in recent months, and are expected to increase further. But logistics were temporarily hampered by an unusually cold winter and difficult weather conditions in parts of the northern hemisphere. Large inventories (which were run up prior to the import restrictions) have enabled many mills to keep operating without significant disruption, though these inventories are likely to run short over the coming few quarters.
Chinese steelmaking now faces high raw material costs, with iron ore prices repeatedly breaking records (see Iron ore chapter) and prices for non-Australian metallurgical coal also rising steadily, as China monopolises non-Australian exports. The large price differential has created opportunities for arbitrage, with miners reselling product intended for Brazil and Europe into Chinese markets. The capacity and willingness of steel mills to continue paying these costs represents a potential risk factor for non-Australian metallurgical coal prices, with overall Chinese imports expected to edge down in the second half of 2021.
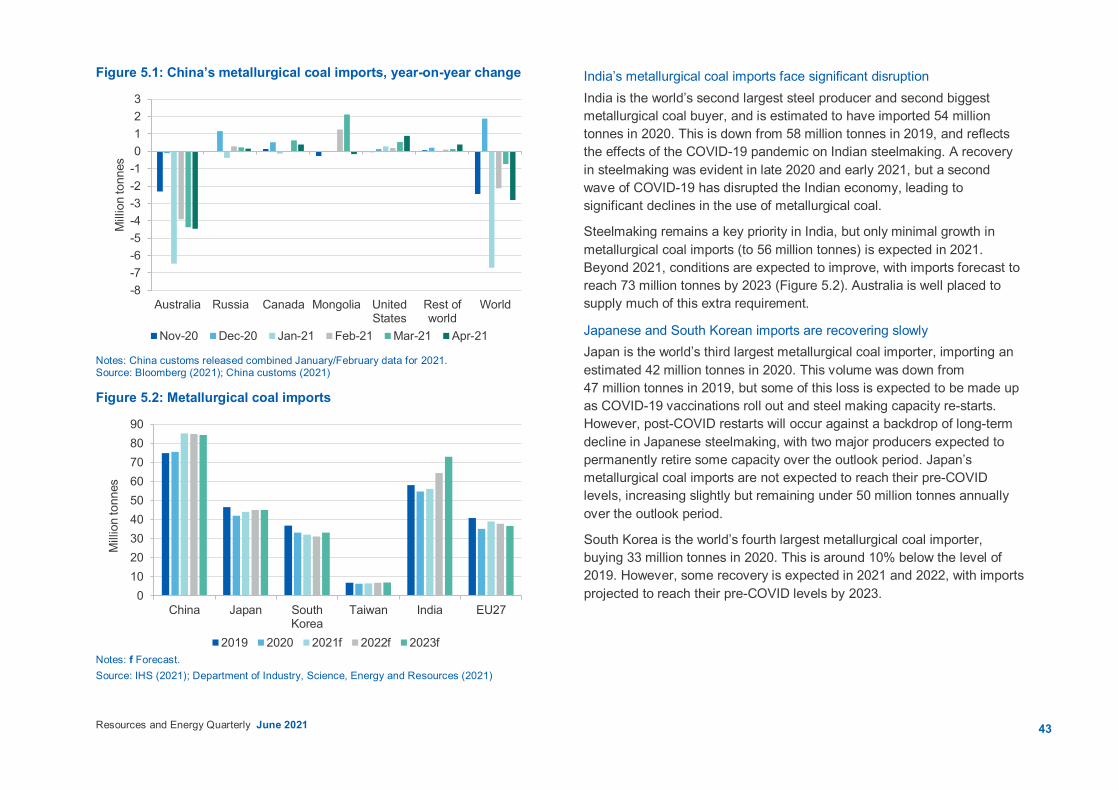
43Resources and Energy Quarterly June 2021
Figure 5.1: China’s metallurgical coal imports, year-on-year change
Notes: China customs released combined January/February data for 2021. Source: Bloomberg (2021); China customs (2021)
Figure 5.2: Metallurgical coal imports
Notes: f Forecast. Source: IHS (2021); Department of Industry, Science, Energy and Resources (2021)
India’s metallurgical coal imports face significant disruption India is the world’s second largest steel producer and second biggest metallurgical coal buyer, and is estimated to have imported 54 million tonnes in 2020. This is down from 58 million tonnes in 2019, and reflects the effects of the COVID-19 pandemic on Indian steelmaking. A recovery in steelmaking was evident in late 2020 and early 2021, but a second wave of COVID-19 has disrupted the Indian economy, leading to significant declines in the use of metallurgical coal.
Steelmaking remains a key priority in India, but only minimal growth in metallurgical coal imports (to 56 million tonnes) is expected in 2021. Beyond 2021, conditions are expected to improve, with imports forecast to reach 73 million tonnes by 2023 (Figure 5.2). Australia is well placed to supply much of this extra requirement.
Japanese and South Korean imports are recovering slowly Japan is the world’s third largest metallurgical coal importer, importing an estimated 42 million tonnes in 2020. This volume was down from 47 million tonnes in 2019, but some of this loss is expected to be made up as COVID-19 vaccinations roll out and steel making capacity re-starts. However, post-COVID restarts will occur against a backdrop of long-term decline in Japanese steelmaking, with two major producers expected to permanently retire some capacity over the outlook period. Japan’s metallurgical coal imports are not expected to reach their pre-COVID levels, increasing slightly but remaining under 50 million tonnes annually over the outlook period.
South Korea is the world’s fourth largest metallurgical coal importer, buying 33 million tonnes in 2020. This is around 10% below the level of 2019. However, some recovery is expected in 2021 and 2022, with imports projected to reach their pre-COVID levels by 2023.
-8-7-6-5-4-3-2-10123
Australia Russia Canada Mongolia UnitedStates
Rest ofworld
World
Mill
ion
tonn
es
Nov-20 Dec-20 Jan-21 Feb-21 Mar-21 Apr-21
0102030405060708090
China Japan SouthKorea
Taiwan India EU27
Mill
ion
tonn
es
2019 2020 2021f 2022f 2023f
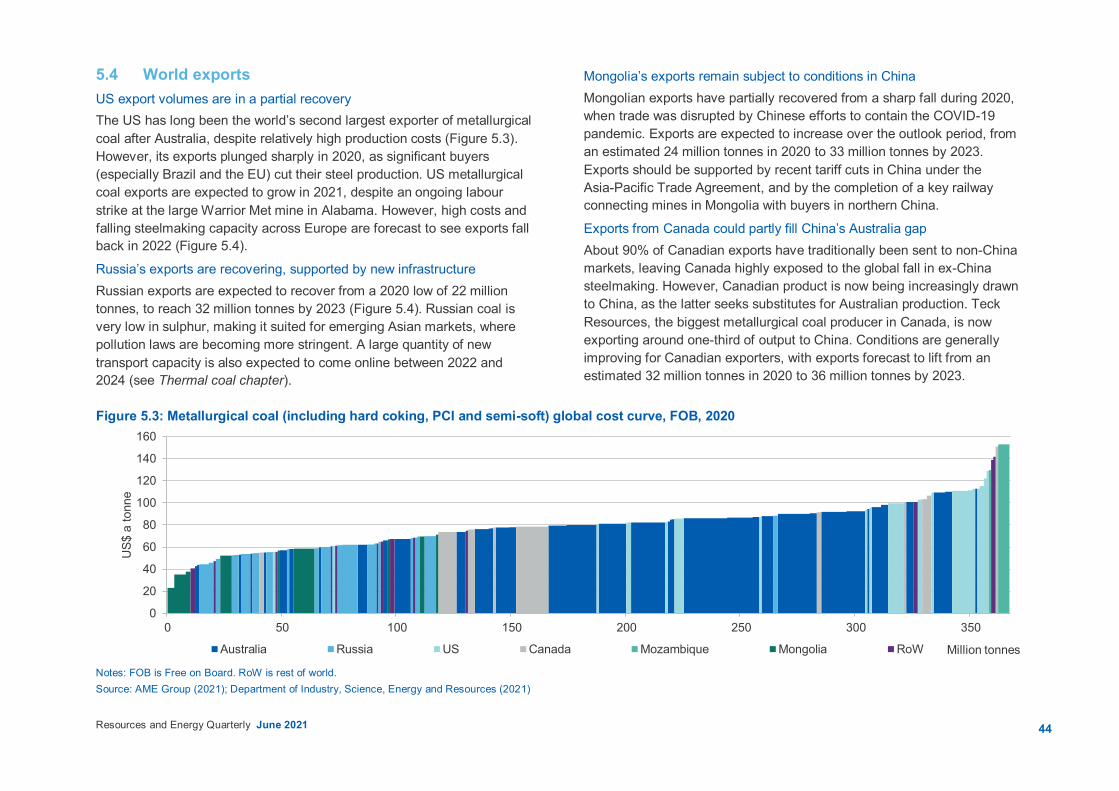
44Resources and Energy Quarterly June 2021
5.4 World exports US export volumes are in a partial recovery The US has long been the world’s second largest exporter of metallurgical coal after Australia, despite relatively high production costs (Figure 5.3). However, its exports plunged sharply in 2020, as significant buyers (especially Brazil and the EU) cut their steel production. US metallurgical coal exports are expected to grow in 2021, despite an ongoing labour strike at the large Warrior Met mine in Alabama. However, high costs and falling steelmaking capacity across Europe are forecast to see exports fall back in 2022 (Figure 5.4).
Russia’s exports are recovering, supported by new infrastructure Russian exports are expected to recover from a 2020 low of 22 million tonnes, to reach 32 million tonnes by 2023 (Figure 5.4). Russian coal is very low in sulphur, making it suited for emerging Asian markets, where pollution laws are becoming more stringent. A large quantity of new transport capacity is also expected to come online between 2022 and 2024 (see Thermal coal chapter).
Mongolia’s exports remain subject to conditions in China Mongolian exports have partially recovered from a sharp fall during 2020, when trade was disrupted by Chinese efforts to contain the COVID-19 pandemic. Exports are expected to increase over the outlook period, from an estimated 24 million tonnes in 2020 to 33 million tonnes by 2023. Exports should be supported by recent tariff cuts in China under the Asia-Pacific Trade Agreement, and by the completion of a key railway connecting mines in Mongolia with buyers in northern China.
Exports from Canada could partly fill China’s Australia gap About 90% of Canadian exports have traditionally been sent to non-China markets, leaving Canada highly exposed to the global fall in ex-China steelmaking. However, Canadian product is now being increasingly drawn to China, as the latter seeks substitutes for Australian production. Teck Resources, the biggest metallurgical coal producer in Canada, is now exporting around one-third of output to China. Conditions are generally improving for Canadian exporters, with exports forecast to lift from an estimated 32 million tonnes in 2020 to 36 million tonnes by 2023.
Figure 5.3: Metallurgical coal (including hard coking, PCI and semi-soft) global cost curve, FOB, 2020
Notes: FOB is Free on Board. RoW is rest of world. Source: AME Group (2021); Department of Industry, Science, Energy and Resources (2021)
0
20
40
60
80
100
120
140
160
0 50 100 150 200 250 300 350
US$
a to
nne
Million tonnesAustralia Russia US Canada Mozambique Mongolia RoW

45
Resources and Energy Quarterly June 2021
Figure 5.4: Metallurgical coal exports
Notes: f Forecast Source: IHS (2021); Department of Industry, Science, Energy and Resources (2021)
Mozambique’s exports will take time to recover Mozambique’s exports fell sharply in 2020, to an estimated 3 million tonnes, as low prices severely affected the country’s relatively high cost producers. Exports are forecast to recover to 7 million tonnes by the end of the outlook period, supported by improved global demand, by the ramp up of Vale’s Moatize mine, and by upgrades to the Nacala logistics corridor rail line and port.
5.5 Prices Metallurgical coal prices volatile on China uncertainty Metallurgical coal prices were volatile in April and May, with prices for Australian product discounted across seaborne markets (Figures 5.5 and 5.6). High price differentials between Australian and non-Australian metallurgical coal have led to a wave of arbitrage and exchange between various Chinese and non-Chinese steelmakers.
Figure 5.5: Metallurgical coal prices, monthly
Notes: HCC stands for hard coking coal. PCI stands for pulverized coal for injection. Source: Platts (2021)
Figure 5.6: Metallurgical coal prices - Australian Prime Hard vs US Low Vol, FOB
Source: IHS (2021). Low vol = low volatile coking coal. Orange marker indicates approximate timing of informal import restrictions from China.
0
40
80
120
160
200
Australia US Canada Mongolia Russia Mozamb.
Mill
ion
tonn
es
2019 2020 2021f 2022f 2023f
0
50
100
150
200
250
300
350
2012 2013 2014 2015 2016 2017 2018 2019 2020 2021
US$
a to
nne
Australian HCC Low Vol PCI Semi-soft
0
50
100
150
200
250
300
350
2014 2015 2016 2017 2018 2019 2020 2021U
S$ a
tonn
eAustralian prime hard coking US Low Vol
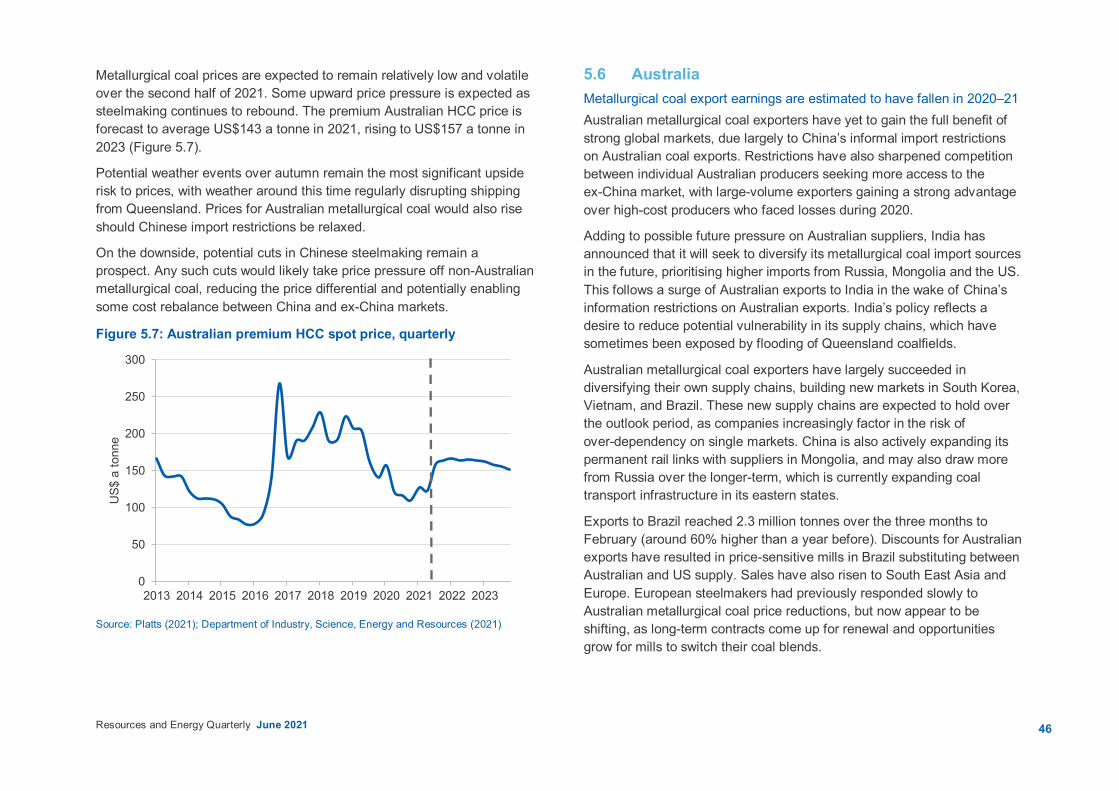
46
Resources and Energy Quarterly June 2021
Metallurgical coal prices are expected to remain relatively low and volatile over the second half of 2021. Some upward price pressure is expected as steelmaking continues to rebound. The premium Australian HCC price is forecast to average US$143 a tonne in 2021, rising to US$157 a tonne in 2023 (Figure 5.7).
Potential weather events over autumn remain the most significant upside risk to prices, with weather around this time regularly disrupting shipping from Queensland. Prices for Australian metallurgical coal would also rise should Chinese import restrictions be relaxed.
On the downside, potential cuts in Chinese steelmaking remain a prospect. Any such cuts would likely take price pressure off non-Australian metallurgical coal, reducing the price differential and potentially enabling some cost rebalance between China and ex-China markets.
Figure 5.7: Australian premium HCC spot price, quarterly
Source: Platts (2021); Department of Industry, Science, Energy and Resources (2021)
5.6 Australia Metallurgical coal export earnings are estimated to have fallen in 2020–21 Australian metallurgical coal exporters have yet to gain the full benefit of strong global markets, due largely to China’s informal import restrictions on Australian coal exports. Restrictions have also sharpened competition between individual Australian producers seeking more access to the ex-China market, with large-volume exporters gaining a strong advantage over high-cost producers who faced losses during 2020.
Adding to possible future pressure on Australian suppliers, India has announced that it will seek to diversify its metallurgical coal import sources in the future, prioritising higher imports from Russia, Mongolia and the US. This follows a surge of Australian exports to India in the wake of China’s information restrictions on Australian exports. India’s policy reflects a desire to reduce potential vulnerability in its supply chains, which have sometimes been exposed by flooding of Queensland coalfields.
Australian metallurgical coal exporters have largely succeeded in diversifying their own supply chains, building new markets in South Korea, Vietnam, and Brazil. These new supply chains are expected to hold over the outlook period, as companies increasingly factor in the risk of over-dependency on single markets. China is also actively expanding its permanent rail links with suppliers in Mongolia, and may also draw more from Russia over the longer-term, which is currently expanding coal transport infrastructure in its eastern states.
Exports to Brazil reached 2.3 million tonnes over the three months to February (around 60% higher than a year before). Discounts for Australian exports have resulted in price-sensitive mills in Brazil substituting between Australian and US supply. Sales have also risen to South East Asia and Europe. European steelmakers had previously responded slowly to Australian metallurgical coal price reductions, but now appear to be shifting, as long-term contracts come up for renewal and opportunities grow for mills to switch their coal blends.
0
50
100
150
200
250
300
2013 2014 2015 2016 2017 2018 2019 2020 2021 2022 2023
US$
a to
nne
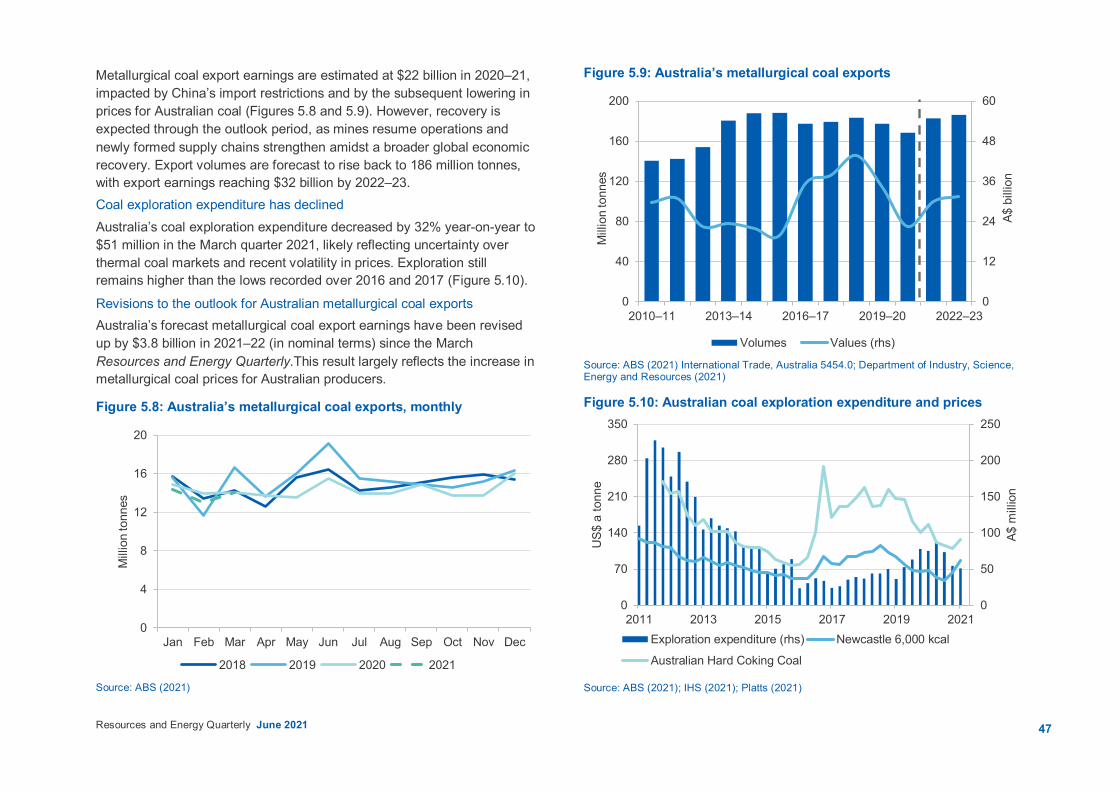
47
Resources and Energy Quarterly June 2021
Metallurgical coal export earnings are estimated at $22 billion in 2020–21, impacted by China’s import restrictions and by the subsequent lowering in prices for Australian coal (Figures 5.8 and 5.9). However, recovery is expected through the outlook period, as mines resume operations and newly formed supply chains strengthen amidst a broader global economic recovery. Export volumes are forecast to rise back to 186 million tonnes, with export earnings reaching $32 billion by 2022–23. Coal exploration expenditure has declined Australia’s coal exploration expenditure decreased by 32% year-on-year to $51 million in the March quarter 2021, likely reflecting uncertainty over thermal coal markets and recent volatility in prices. Exploration still remains higher than the lows recorded over 2016 and 2017 (Figure 5.10).
Revisions to the outlook for Australian metallurgical coal exports Australia’s forecast metallurgical coal export earnings have been revised up by $3.8 billion in 2021–22 (in nominal terms) since the March Resources and Energy Quarterly.This result largely reflects the increase in metallurgical coal prices for Australian producers.
Figure 5.8: Australia’s metallurgical coal exports, monthly
Source: ABS (2021)
Figure 5.9: Australia’s metallurgical coal exports
Source: ABS (2021) International Trade, Australia 5454.0; Department of Industry, Science, Energy and Resources (2021)
Figure 5.10: Australian coal exploration expenditure and prices
Source: ABS (2021); IHS (2021); Platts (2021)
0
4
8
12
16
20
Jan Feb Mar Apr May Jun Jul Aug Sep Oct Nov Dec
Mill
ion
tonn
es
2018 2019 2020 2021
0
12
24
36
48
60
0
40
80
120
160
200
2010–11 2013–14 2016–17 2019–20 2022–23
A$ b
illio
n
Mill
ion
tonn
es
Volumes Values (rhs)
0
50
100
150
200
250
0
70
140
210
280
350
2011 2013 2015 2017 2019 2021
A$ m
illio
n
US$
a to
nne
Exploration expenditure (rhs) Newcastle 6,000 kcal
Australian Hard Coking Coal
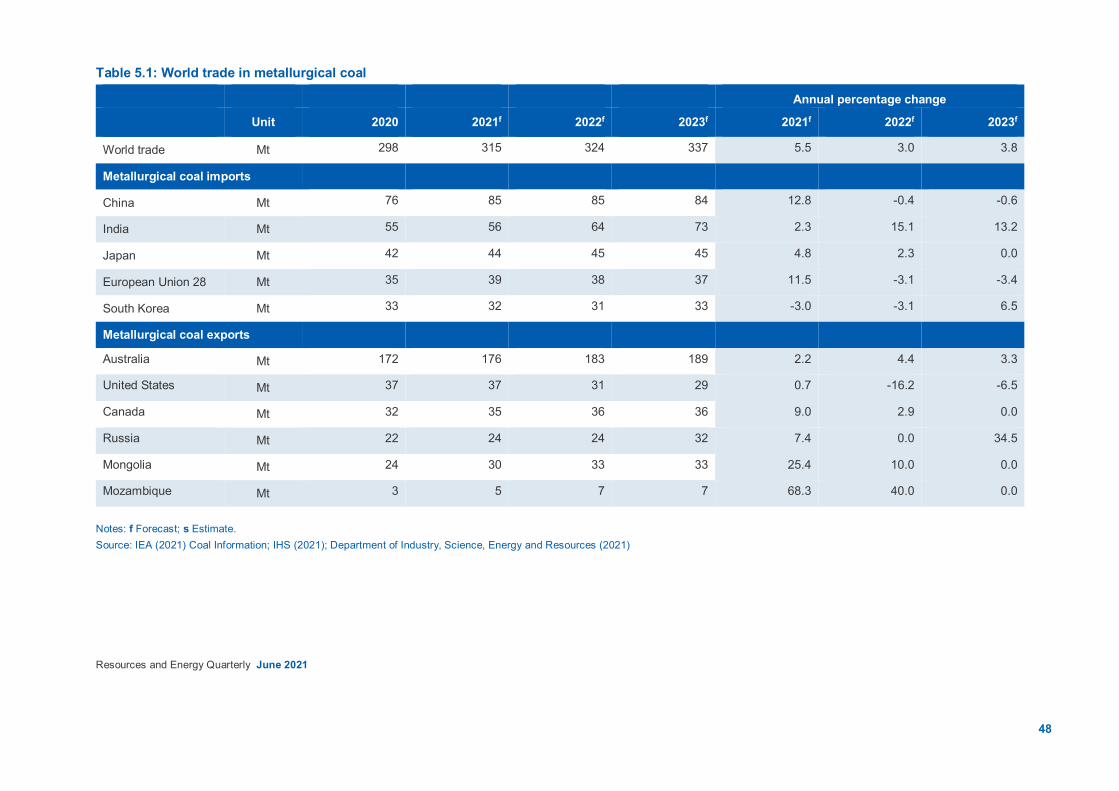
48
Resources and Energy Quarterly June 2021
Table 5.1: World trade in metallurgical coal
Annual percentage change
Unit 2020 2021f 2022f 2023f 2021f 2022f 2023f
World trade Mt 298 315 324 337 5.5 3.0 3.8
Metallurgical coal imports
China Mt 76 85 85 84 12.8 -0.4 -0.6
India Mt 55 56 64 73 2.3 15.1 13.2
Japan Mt 42 44 45 45 4.8 2.3 0.0
European Union 28 Mt 35 39 38 37 11.5 -3.1 -3.4
South Korea Mt 33 32 31 33 -3.0 -3.1 6.5
Metallurgical coal exports
Australia Mt 172 176 183 189 2.2 4.4 3.3
United States Mt 37 37 31 29 0.7 -16.2 -6.5
Canada Mt 32 35 36 36 9.0 2.9 0.0
Russia Mt 22 24 24 32 7.4 0.0 34.5
Mongolia Mt 24 30 33 33 25.4 10.0 0.0
Mozambique Mt 3 5 7 7 68.3 40.0 0.0
Notes: f Forecast; s Estimate. Source: IEA (2021) Coal Information; IHS (2021); Department of Industry, Science, Energy and Resources (2021)

49
Resources and Energy Quarterly June 2021
Table 5.2: Metallurgical coal outlook Annual percentage change
World Unit 2020 2021f 2022f 2023f 2021f 2022f 2023f
Contract pricese
– nominal US$/t 125 139 164 158 10.8 18.6 -4.1
– reald US$/t 128 139 160 150 8.3 15.8 -6.8
Spot pricesg
– nominal US$/t 125 143 164 157 14.2 14.8 -4.6
– reald US$/t 128 143 160 149 11.6 12.1 -7.3
Australia Unit 2019–20 2020–21s 2021–22f 2022–23f 2020–21s 2021–22f 2022–23f
Production Mt 183 170 188 192 -7.1 10.9 1.9
Export volume Mt 177 171 183 186 -3.7 7.0 1.9
– nominal value A$m 34,245 22,457 29,903 31,535 -34.4 28.6 1.6
– real valuei A$m 34,621 22,457 29,407 30,482 -35.1 26.4 -0.1
Notes: d In 2021 US dollars. e Contract price assessment for high-quality hard coking coal. i In 2020–21 Australian dollars. f Forecast. g Hard coking coal fob Australia east coast ports. s Estimate. Source: ABS (2021) International Trade in Goods and Services, Australia, 5368.0; Department of Industry, Innovation and Science (2021); Platts (2021)
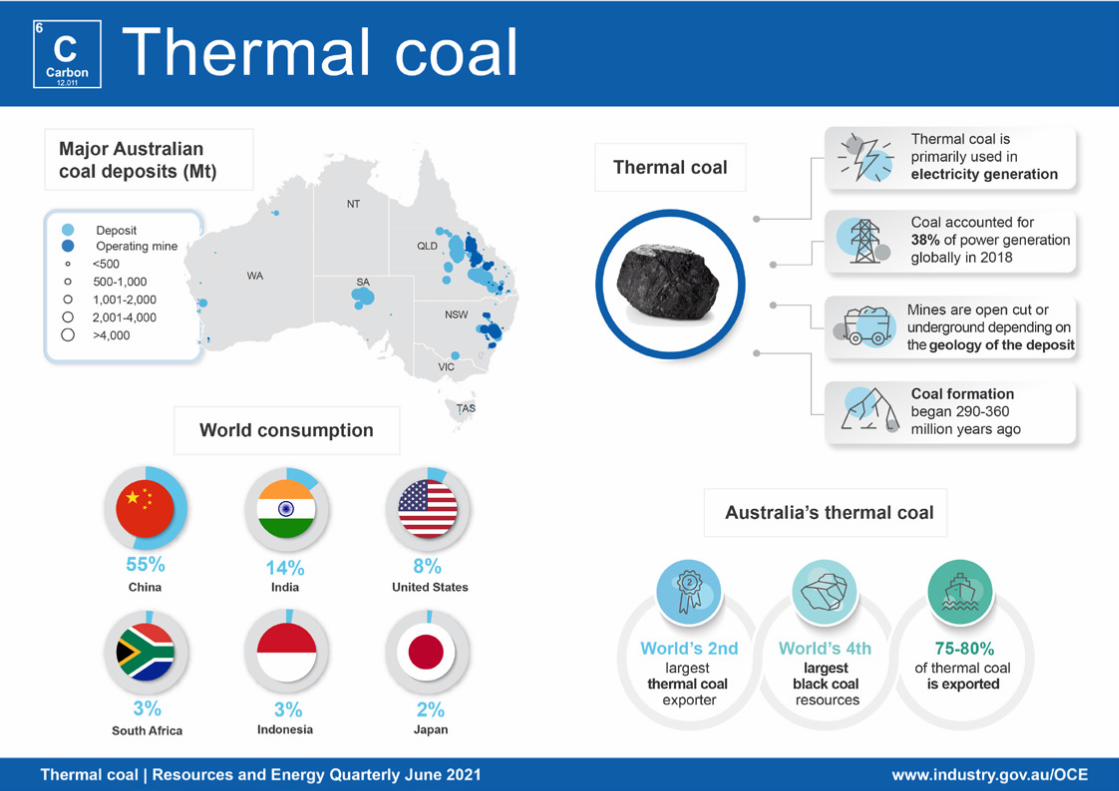
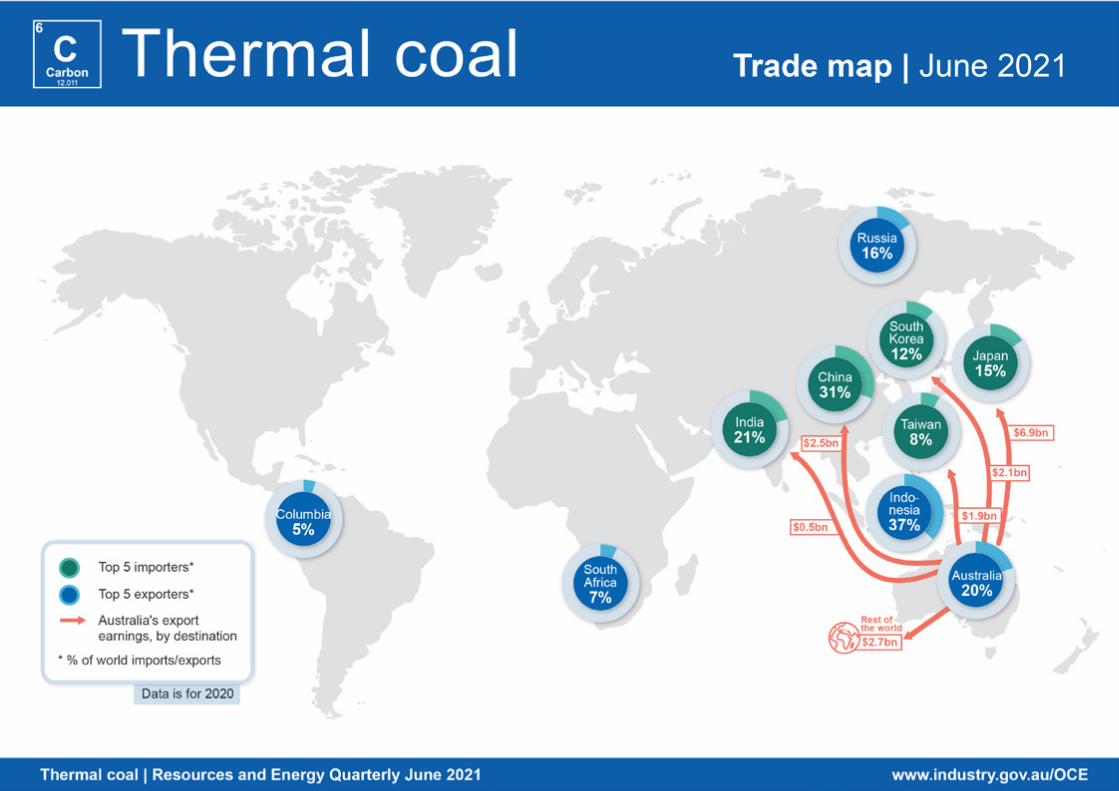

52
Resources and Energy Quarterly June 2021
6.1 Summary Thermal coal spot prices have generally recovered over the past
quarter, as Asian economies continue to emerge from the 2020 downturn. The Newcastle benchmark price is forecast to average US$90 a tonne in 2021, easing slowly to US$68 a tonne by 2023.
The COVID-19 pandemic and informal import restrictions imposed by China have led to a decline in Australian thermal coal exports, from 213 million tonnes in 2019-20 to a forecast 194 million tonnes in 2020–21. Exports are expected to recover to 212 million tonnes by 2022–23, as Asian economies return to normal conditions.
Australia’s thermal coal exports are forecast at $17 billion in 2021-22, a relatively strong result, but lower than 2019-20 earnings of $20 billion.
6.2 World trade Thermal coal markets have tightened up in recent months, with supply cuts running up against a gradual recovery in demand. Thermal coal trade fell sharply in 2019 and 2020, but is expected to partly recover as the world emerges from recession in 2021. Demand from domestic electricity use and industrial production is rising across Asia, with growth broadening out from China. This has led to a recovery in prices, with relatively tight supply conditions expected to persist through the rest of 2021.
However, conditions in coal markets remain uncertain. The new wave of COVID-19 in India creates added risks for thermal coal demand and prices. Risks have also grown in the other direction, with a possible hot summer in the northern hemisphere potentially adding to electricity demand across Asia. The current informal restrictions imposed on Australian exports to China also represent a significant variable, though no change to this policy is assumed over the outlook period.
Demand over 2021 is not expected to reach its level of 2019, but demand growth is likely to persist over subsequent years, peaking towards the end of the outlook period, then flattening from 2023. Prices are also expected
to trend down over time, affected by the long-term trend of declining demand against a backdrop of plentiful spare supply, which is expected to return to the market over the coming years.
There is significant variance among regions. The Asia Pacific region contains the most significant coal exporters and importers, and its share of seaborne trade is set to grow further as Europe withdraws from coal. The Asia Pacific region is also seeing significant investment in coal transport infrastructure. Russian exports are expected to pick up over coming years as the Russian government upgrades its capacity for the transport and shipment of coal. Russian coal exports are of comparable quality to Australian exports, and expanded exports from Russia are expected to compete directly with the higher grade Australian coal in Asian markets.
Coal plant construction is also concentrated in the Asia Pacific region, with China holding an increasingly large share of ongoing construction proposals. Coal use is expected to rise in South and South East Asia (albeit to a lower peak than previously forecast), driven by rises in electricity use in India, Bangladesh and a number of ASEAN nations. The recent rebound in gas prices is also likely to support short-term coal demand across Asia. Significant variance is also evident across coal grades, with 6,000kcal coal prices lifting rapidly relative to prices for lower grade coal. China’s informal import restrictions on Australian coal are also driving growing price differentials between Australian coal and coal of equivalent quality produced elsewhere.
Global coal demand is expected to rise slowly over the outlook period, flattening just beyond it. Coal use in most OECD countries is expected to resume structural decline in 2022, but demand will be supported in the short-term through growing coal use in parts of Asia (Figure 6.1). However, trajectories for coal use in Asia are expected to vary widely, with imports to India, Vietnam, Japan and South Korea all expected to remain below their 2019 levels. This reflects a combination of stronger domestic supply (notably in China), competition from renewables, and government policies that have curbed importations to the power sector.

53
Resources and Energy Quarterly June 2021
Figure 6.1: Thermal coal imports
Note: f Forecast;. ROW = Rest of World. Source: IHS (2021); IEA (2021) Coal Market Report; Department of Industry, Science, Energy and Resources (2021)
Figure 6.2: China’s domestic vs Australian thermal coal export price
Notes: The ‘green zone’ is a price band from 500-570RMB. Qinhuangdao (QHD) prices are a key benchmark for coal prices in northeastern China. Note that the Newcastle series excludes freight costs which typically add around US$10/t or 66 RMB.
Source: Bloomberg (2021)
6.3 World imports China’s import price premium remains high as import restrictions persist
China’s thermal coal imports fell by around one-fifth over the year to April 2021, and are expected to come under further pressure over the next few years despite some recent tightness in domestic supply. Domestic production of coal in China topped 970 million tonnes in the March quarter 2021, up by 16% through the year. In April, China’s National Development and Reform Commission ordered coal producers to increase their output in order to contain surging prices (Figure 6.2) and allow for inventory build ahead of the summer period, when electricity use is expected to increase.
As Chinese domestic coal output rises, imports will account for a gradually smaller share of Chinese coal supply. Australian coal exports to China were effectively nil over the March quarter 2021, which added considerably to China’s domestic coal prices. However, imports from other nations are partially filling the gap, with Indonesia becoming China’s largest coal supplier. Chinese import volumes from Russia also rose by 23% over the year to the March quarter. However, with the overall Chinese import market likely to decline over time, the opportunity to these exporters may eventually lose steam, with Australia’s exporters potentially gaining an advantage through having re-organised their supply chains sooner.
India’s coal imports have moderated
Higher prices have led to Indian buyers deferring some of their planned restocking, leading to a fall in imports in the first quarter of 2021. This follows a brief rise at the end of 2020, when power station imports surged to meet expected demand. However, this rise has subsequently reversed, with demand falling back and domestic supply providing a larger share of overall inputs in the March quarter.
Australian supply has increased its share of the Indian market as supply chains redirected and costs for the lower calorific grades have come down relative to other countries (Figure 6.3).
0
50
100
150
200
250
China Japan SouthKorea
Taiwan India OtherAsia
EU27 RoW
Mill
ion
tonn
es
2019 2020 2021f 2022f 2023f
0
200
400
600
800
1000
Jan-19 Jul-19 Jan-20 Jul-20 Jan-21
RM
B a
tonn
e
Qinhuangdao 5500 kcal Newcastle 5500 kcal
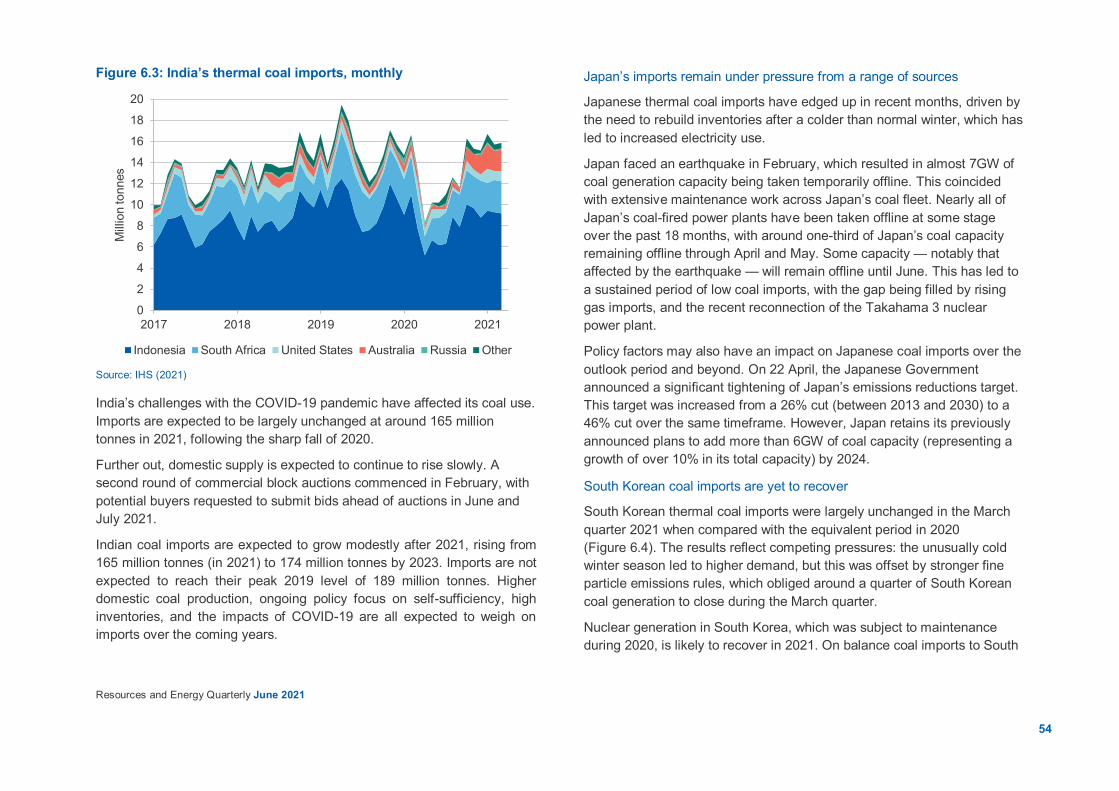
54
Resources and Energy Quarterly June 2021
Figure 6.3: India’s thermal coal imports, monthly
Source: IHS (2021)
India’s challenges with the COVID-19 pandemic have affected its coal use. Imports are expected to be largely unchanged at around 165 million tonnes in 2021, following the sharp fall of 2020.
Further out, domestic supply is expected to continue to rise slowly. A second round of commercial block auctions commenced in February, with potential buyers requested to submit bids ahead of auctions in June and July 2021.
Indian coal imports are expected to grow modestly after 2021, rising from 165 million tonnes (in 2021) to 174 million tonnes by 2023. Imports are not expected to reach their peak 2019 level of 189 million tonnes. Higher domestic coal production, ongoing policy focus on self-sufficiency, high inventories, and the impacts of COVID-19 are all expected to weigh on imports over the coming years.
Japan’s imports remain under pressure from a range of sources
Japanese thermal coal imports have edged up in recent months, driven by the need to rebuild inventories after a colder than normal winter, which has led to increased electricity use.
Japan faced an earthquake in February, which resulted in almost 7GW of coal generation capacity being taken temporarily offline. This coincided with extensive maintenance work across Japan’s coal fleet. Nearly all of Japan’s coal-fired power plants have been taken offline at some stage over the past 18 months, with around one-third of Japan’s coal capacity remaining offline through April and May. Some capacity — notably that affected by the earthquake — will remain offline until June. This has led to a sustained period of low coal imports, with the gap being filled by rising gas imports, and the recent reconnection of the Takahama 3 nuclear power plant.
Policy factors may also have an impact on Japanese coal imports over the outlook period and beyond. On 22 April, the Japanese Government announced a significant tightening of Japan’s emissions reductions target. This target was increased from a 26% cut (between 2013 and 2030) to a 46% cut over the same timeframe. However, Japan retains its previously announced plans to add more than 6GW of coal capacity (representing a growth of over 10% in its total capacity) by 2024.
South Korean coal imports are yet to recover
South Korean thermal coal imports were largely unchanged in the March quarter 2021 when compared with the equivalent period in 2020 (Figure 6.4). The results reflect competing pressures: the unusually cold winter season led to higher demand, but this was offset by stronger fine particle emissions rules, which obliged around a quarter of South Korean coal generation to close during the March quarter.
Nuclear generation in South Korea, which was subject to maintenance during 2020, is likely to recover in 2021. On balance coal imports to South
0
2
4
6
8
10
12
14
16
18
20
2017 2018 2019 2020 2021
Mill
ion
tonn
es
Indonesia South Africa United States Australia Russia Other
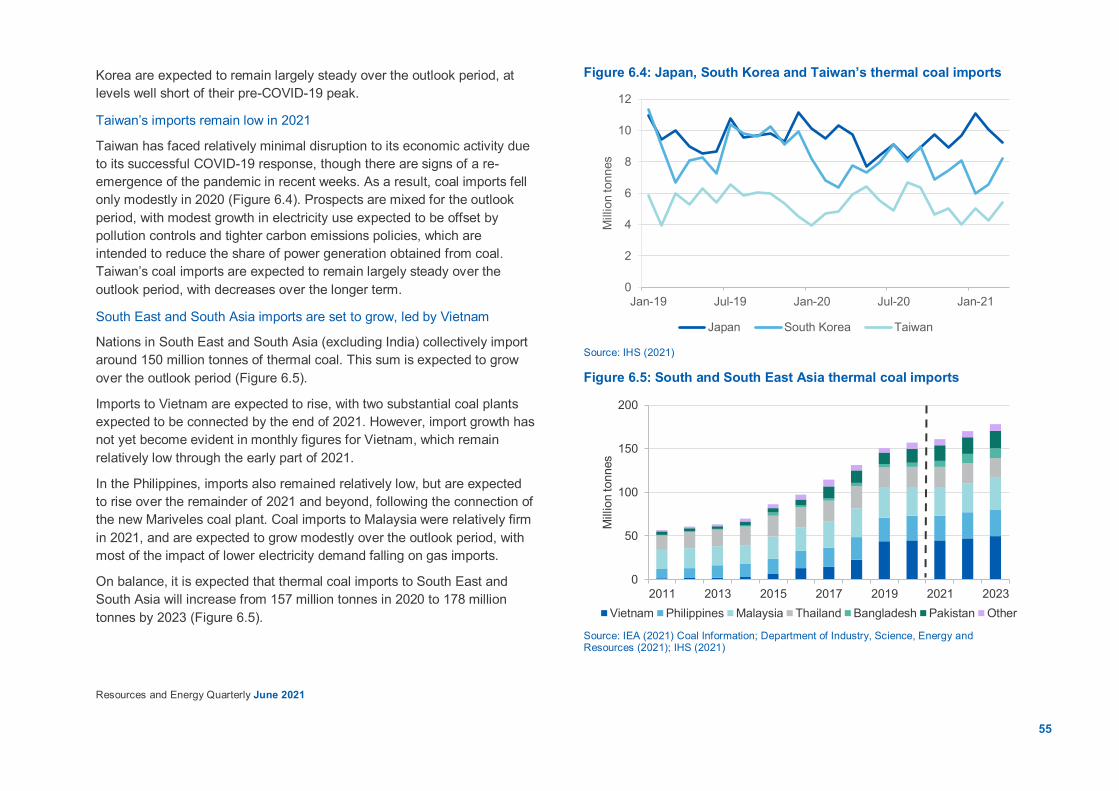
55
Resources and Energy Quarterly June 2021
Korea are expected to remain largely steady over the outlook period, at levels well short of their pre-COVID-19 peak.
Taiwan’s imports remain low in 2021
Taiwan has faced relatively minimal disruption to its economic activity due to its successful COVID-19 response, though there are signs of a re-emergence of the pandemic in recent weeks. As a result, coal imports fell only modestly in 2020 (Figure 6.4). Prospects are mixed for the outlook period, with modest growth in electricity use expected to be offset by pollution controls and tighter carbon emissions policies, which are intended to reduce the share of power generation obtained from coal. Taiwan’s coal imports are expected to remain largely steady over the outlook period, with decreases over the longer term.
South East and South Asia imports are set to grow, led by Vietnam
Nations in South East and South Asia (excluding India) collectively import around 150 million tonnes of thermal coal. This sum is expected to grow over the outlook period (Figure 6.5).
Imports to Vietnam are expected to rise, with two substantial coal plants expected to be connected by the end of 2021. However, import growth has not yet become evident in monthly figures for Vietnam, which remain relatively low through the early part of 2021.
In the Philippines, imports also remained relatively low, but are expected to rise over the remainder of 2021 and beyond, following the connection of the new Mariveles coal plant. Coal imports to Malaysia were relatively firm in 2021, and are expected to grow modestly over the outlook period, with most of the impact of lower electricity demand falling on gas imports.
On balance, it is expected that thermal coal imports to South East and South Asia will increase from 157 million tonnes in 2020 to 178 million tonnes by 2023 (Figure 6.5).
Figure 6.4: Japan, South Korea and Taiwan’s thermal coal imports
Source: IHS (2021)
Figure 6.5: South and South East Asia thermal coal imports
Source: IEA (2021) Coal Information; Department of Industry, Science, Energy and Resources (2021); IHS (2021)
0
2
4
6
8
10
12
Jan-19 Jul-19 Jan-20 Jul-20 Jan-21
Mill
ion
tonn
es
Japan South Korea Taiwan
0
50
100
150
200
2011 2013 2015 2017 2019 2021 2023M
illio
n to
nnes
Vietnam Philippines Malaysia Thailand Bangladesh Pakistan Other
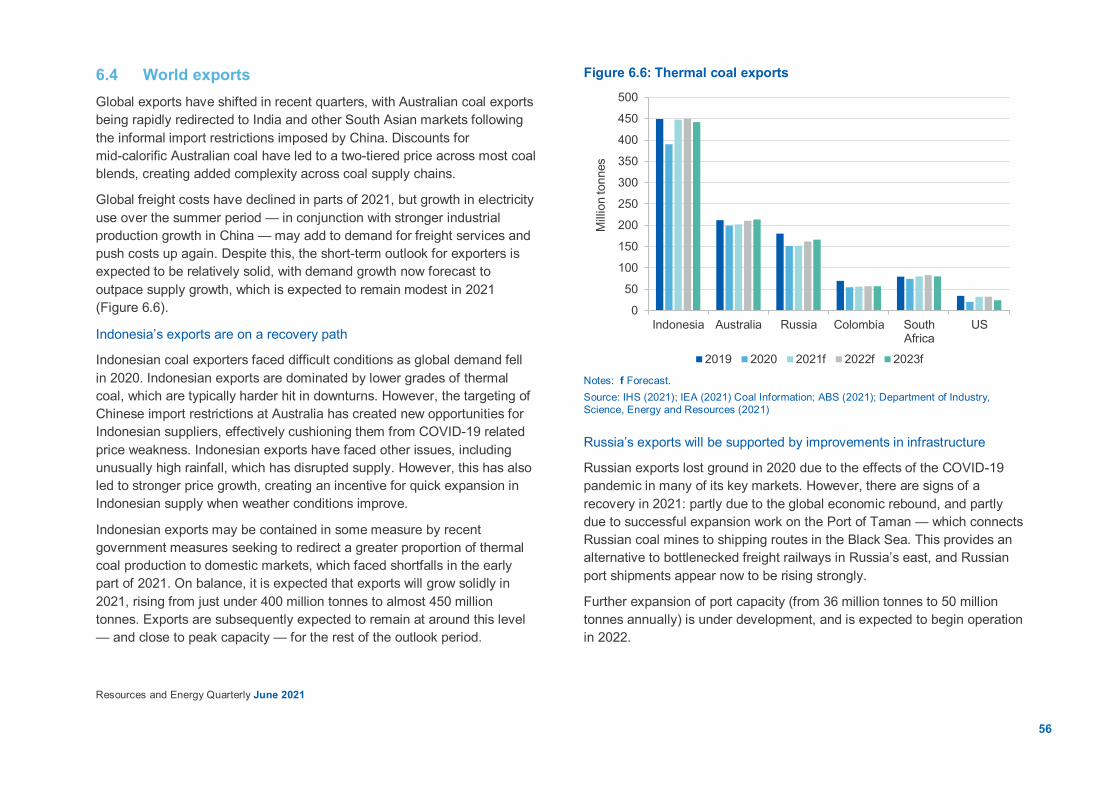
56
Resources and Energy Quarterly June 2021
6.4 World exports Global exports have shifted in recent quarters, with Australian coal exports being rapidly redirected to India and other South Asian markets following the informal import restrictions imposed by China. Discounts for mid-calorific Australian coal have led to a two-tiered price across most coal blends, creating added complexity across coal supply chains.
Global freight costs have declined in parts of 2021, but growth in electricity use over the summer period — in conjunction with stronger industrial production growth in China — may add to demand for freight services and push costs up again. Despite this, the short-term outlook for exporters is expected to be relatively solid, with demand growth now forecast to outpace supply growth, which is expected to remain modest in 2021 (Figure 6.6).
Indonesia’s exports are on a recovery path
Indonesian coal exporters faced difficult conditions as global demand fell in 2020. Indonesian exports are dominated by lower grades of thermal coal, which are typically harder hit in downturns. However, the targeting of Chinese import restrictions at Australia has created new opportunities for Indonesian suppliers, effectively cushioning them from COVID-19 related price weakness. Indonesian exports have faced other issues, including unusually high rainfall, which has disrupted supply. However, this has also led to stronger price growth, creating an incentive for quick expansion in Indonesian supply when weather conditions improve.
Indonesian exports may be contained in some measure by recent government measures seeking to redirect a greater proportion of thermal coal production to domestic markets, which faced shortfalls in the early part of 2021. On balance, it is expected that exports will grow solidly in 2021, rising from just under 400 million tonnes to almost 450 million tonnes. Exports are subsequently expected to remain at around this level — and close to peak capacity — for the rest of the outlook period.
Figure 6.6: Thermal coal exports
Notes: f Forecast. Source: IHS (2021); IEA (2021) Coal Information; ABS (2021); Department of Industry, Science, Energy and Resources (2021)
Russia’s exports will be supported by improvements in infrastructure
Russian exports lost ground in 2020 due to the effects of the COVID-19 pandemic in many of its key markets. However, there are signs of a recovery in 2021: partly due to the global economic rebound, and partly due to successful expansion work on the Port of Taman — which connects Russian coal mines to shipping routes in the Black Sea. This provides an alternative to bottlenecked freight railways in Russia’s east, and Russian port shipments appear now to be rising strongly.
Further expansion of port capacity (from 36 million tonnes to 50 million tonnes annually) is under development, and is expected to begin operation in 2022.
0
50
100
150
200
250
300
350
400
450
500
Indonesia Australia Russia Colombia SouthAfrica
US
Mill
ion
tonn
es
2019 2020 2021f 2022f 2023f
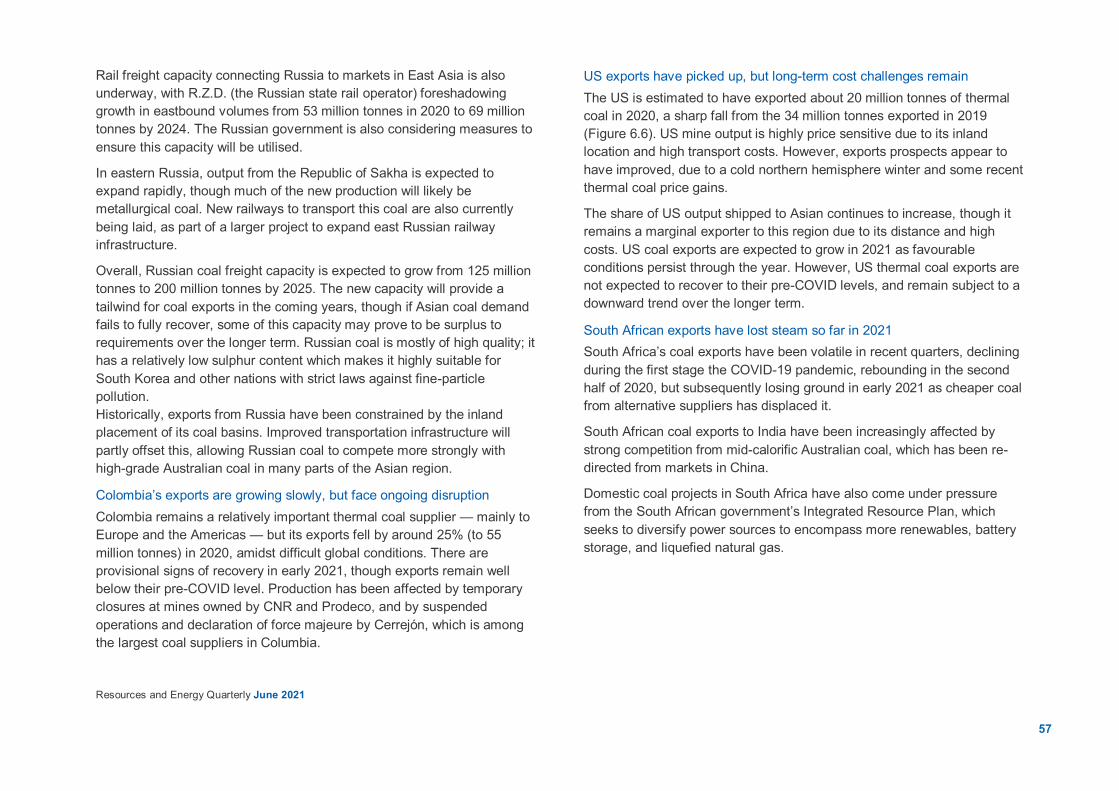
57
Resources and Energy Quarterly June 2021
Rail freight capacity connecting Russia to markets in East Asia is also underway, with R.Z.D. (the Russian state rail operator) foreshadowing growth in eastbound volumes from 53 million tonnes in 2020 to 69 million tonnes by 2024. The Russian government is also considering measures to ensure this capacity will be utilised.
In eastern Russia, output from the Republic of Sakha is expected to expand rapidly, though much of the new production will likely be metallurgical coal. New railways to transport this coal are also currently being laid, as part of a larger project to expand east Russian railway infrastructure.
Overall, Russian coal freight capacity is expected to grow from 125 million tonnes to 200 million tonnes by 2025. The new capacity will provide a tailwind for coal exports in the coming years, though if Asian coal demand fails to fully recover, some of this capacity may prove to be surplus to requirements over the longer term. Russian coal is mostly of high quality; it has a relatively low sulphur content which makes it highly suitable for South Korea and other nations with strict laws against fine-particle pollution. Historically, exports from Russia have been constrained by the inland placement of its coal basins. Improved transportation infrastructure will partly offset this, allowing Russian coal to compete more strongly with high-grade Australian coal in many parts of the Asian region.
Colombia’s exports are growing slowly, but face ongoing disruption Colombia remains a relatively important thermal coal supplier — mainly to Europe and the Americas — but its exports fell by around 25% (to 55 million tonnes) in 2020, amidst difficult global conditions. There are provisional signs of recovery in early 2021, though exports remain well below their pre-COVID level. Production has been affected by temporary closures at mines owned by CNR and Prodeco, and by suspended operations and declaration of force majeure by Cerrejón, which is among the largest coal suppliers in Columbia.
US exports have picked up, but long-term cost challenges remain The US is estimated to have exported about 20 million tonnes of thermal coal in 2020, a sharp fall from the 34 million tonnes exported in 2019 (Figure 6.6). US mine output is highly price sensitive due to its inland location and high transport costs. However, exports prospects appear to have improved, due to a cold northern hemisphere winter and some recent thermal coal price gains.
The share of US output shipped to Asian continues to increase, though it remains a marginal exporter to this region due to its distance and high costs. US coal exports are expected to grow in 2021 as favourable conditions persist through the year. However, US thermal coal exports are not expected to recover to their pre-COVID levels, and remain subject to a downward trend over the longer term.
South African exports have lost steam so far in 2021 South Africa’s coal exports have been volatile in recent quarters, declining during the first stage the COVID-19 pandemic, rebounding in the second half of 2020, but subsequently losing ground in early 2021 as cheaper coal from alternative suppliers has displaced it.
South African coal exports to India have been increasingly affected by strong competition from mid-calorific Australian coal, which has been re-directed from markets in China.
Domestic coal projects in South Africa have also come under pressure from the South African government’s Integrated Resource Plan, which seeks to diversify power sources to encompass more renewables, battery storage, and liquefied natural gas.

58
Resources and Energy Quarterly June 2021
6.5 Prices International thermal coal prices are likely to be peaking
Thermal coal prices have picked up over recent quarters (Figure 6.7), as global supply conditions tightened up: utilities restocked after the cold winter, and production cuts among price-sensitive miners further reduced supply.
Most of this price growth has occurred for the higher-grade calorific coals, with lower calorific coal becoming somewhat oversupplied in some markets following the informal import restrictions imposed on Australian coal by China.
The Japanese Fiscal Year 2021-22 6322kcal GAR thermal coal contract reference price has now been agreed, and is set to increase by 60% from the previous year’s level. The new price — US$109.97 per metric tonne FOB Newcastle — is likely to be used as a reference price for contract prices of other grades of coal, and will be good news for coal producers, many of whom have faced months of losses due to low seaborne prices.
Prices for the benchmark Australian thermal coal spot price — Newcastle 6,000 kcal/kg — have lifted from around US$80 a tonne at the end of 2020 to more than US$100 a tonne at the time of writing. However, this rally is expected to partly unwind over the remainder of 2021, as inventories normalise and temporary drivers of price gains ease. Prices are forecast to ease to around US$80 a tonne by the end of 2021, and then to US$67 a tonne by the final quarter of the outlook period.
Prices across the Asia-Pacific market are expected to remain more favourable than in the Atlantic market, which will provide some relief to Australian exporters.
Figure 6.7: Thermal coal prices — Australian vs Indonesian
Source: IHS (2021). NAR = Net as received. Red dot indicates timing of Chinese restrictions.
6.6 Australia Australian thermal coal exporters face volatile conditions in 2021
Australian coal exporters faced volatile conditions over 2020, culminating in informal import restrictions imposed by China in early November 2020. This particularly affected the 5,500kcal grades, which were the most common Chinese import from Australia.
Australian 5,500kcal coal found markets in India and the rest of South Asia, but these markets have been impacted by recent COVID-19 outbreaks. Australian Producers faced material price reductions over 2020 with a reversal in premiums enjoyed over other exporters. Prices have nonetheless increased in recent months and spiked in recent weeks as utilities scramble to build inventories ahead of the Northern Hemisphere summer, when power is needed for cooling.
-40
-20
0
20
40
60
80
100
120
2014 2015 2016 2017 2018 2019 2020 2021
Newcastle 5,500kc NAR Indonesia 4,700kc* NAR Differential
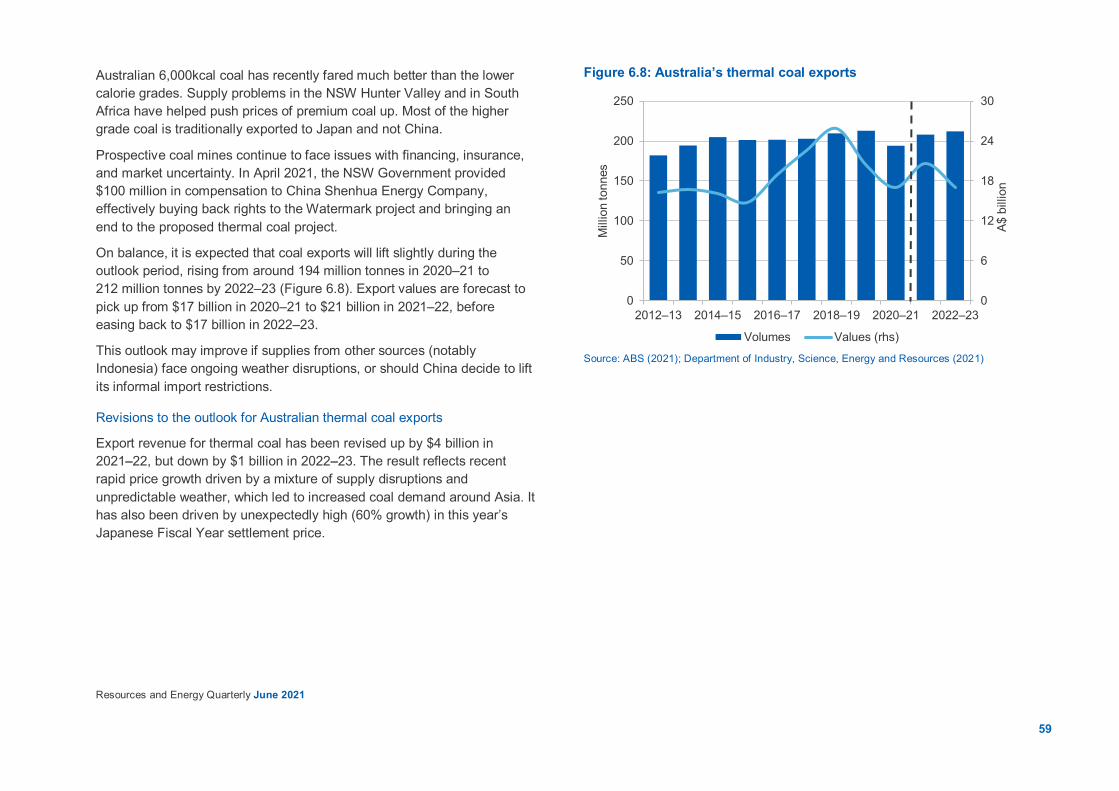
59
Resources and Energy Quarterly June 2021
Australian 6,000kcal coal has recently fared much better than the lower calorie grades. Supply problems in the NSW Hunter Valley and in South Africa have helped push prices of premium coal up. Most of the higher grade coal is traditionally exported to Japan and not China.
Prospective coal mines continue to face issues with financing, insurance, and market uncertainty. In April 2021, the NSW Government provided $100 million in compensation to China Shenhua Energy Company, effectively buying back rights to the Watermark project and bringing an end to the proposed thermal coal project.
On balance, it is expected that coal exports will lift slightly during the outlook period, rising from around 194 million tonnes in 2020–21 to 212 million tonnes by 2022–23 (Figure 6.8). Export values are forecast to pick up from $17 billion in 2020–21 to $21 billion in 2021–22, before easing back to $17 billion in 2022–23.
This outlook may improve if supplies from other sources (notably Indonesia) face ongoing weather disruptions, or should China decide to lift its informal import restrictions.
Revisions to the outlook for Australian thermal coal exports
Export revenue for thermal coal has been revised up by $4 billion in 2021–22, but down by $1 billion in 2022–23. The result reflects recent rapid price growth driven by a mixture of supply disruptions and unpredictable weather, which led to increased coal demand around Asia. It has also been driven by unexpectedly high (60% growth) in this year’s Japanese Fiscal Year settlement price.
Figure 6.8: Australia’s thermal coal exports
Source: ABS (2021); Department of Industry, Science, Energy and Resources (2021)
0
6
12
18
24
30
0
50
100
150
200
250
2012–13 2014–15 2016–17 2018–19 2020–21 2022–23
A$ b
illio
n
Mill
ion
tonn
es
Volumes Values (rhs)
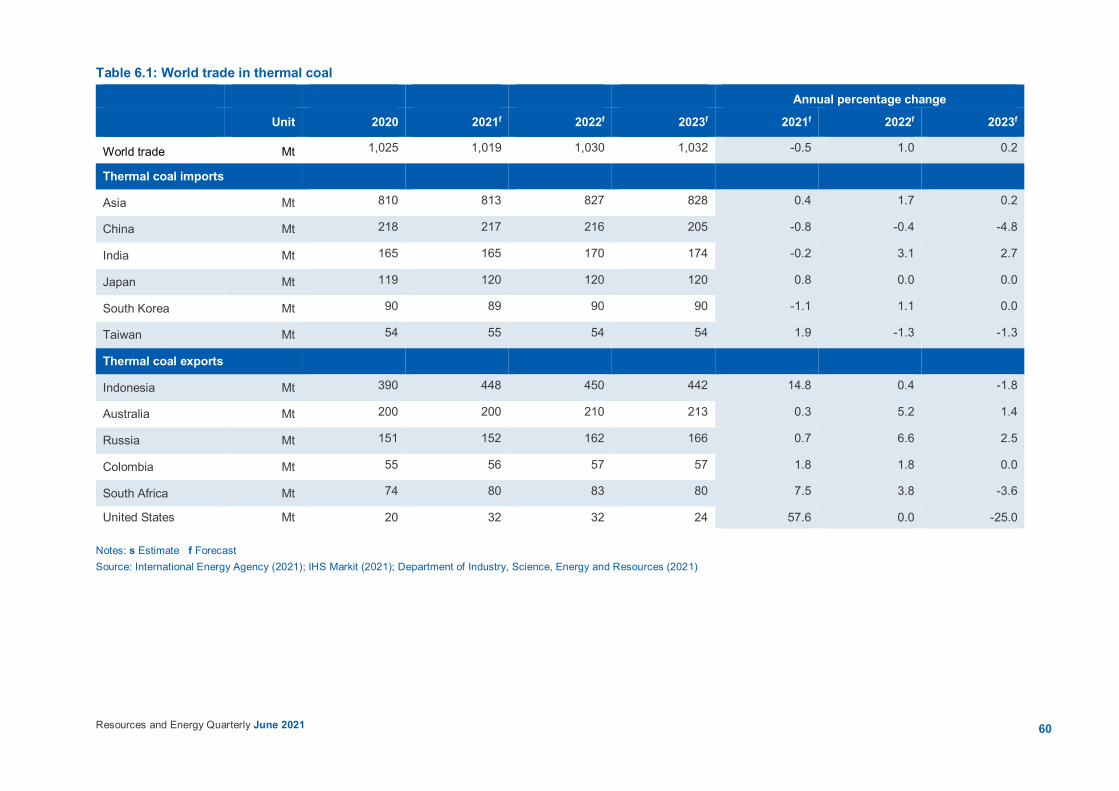
60Resources and Energy Quarterly June 2021
Table 6.1: World trade in thermal coal
Annual percentage change
Unit 2020 2021f 2022f 2023f 2021f 2022f 2023f
World trade Mt 1,025 1,019 1,030 1,032 -0.5 1.0 0.2
Thermal coal imports
Asia Mt 810 813 827 828 0.4 1.7 0.2
China Mt 218 217 216 205 -0.8 -0.4 -4.8
India Mt 165 165 170 174 -0.2 3.1 2.7
Japan Mt 119 120 120 120 0.8 0.0 0.0
South Korea Mt 90 89 90 90 -1.1 1.1 0.0
Taiwan Mt 54 55 54 54 1.9 -1.3 -1.3
Thermal coal exports
Indonesia Mt 390 448 450 442 14.8 0.4 -1.8
Australia Mt 200 200 210 213 0.3 5.2 1.4
Russia Mt 151 152 162 166 0.7 6.6 2.5
Colombia Mt 55 56 57 57 1.8 1.8 0.0
South Africa Mt 74 80 83 80 7.5 3.8 -3.6
United States Mt 20 32 32 24 57.6 0.0 -25.0
Notes: s Estimate f Forecast Source: International Energy Agency (2021); IHS Markit (2021); Department of Industry, Science, Energy and Resources (2021)
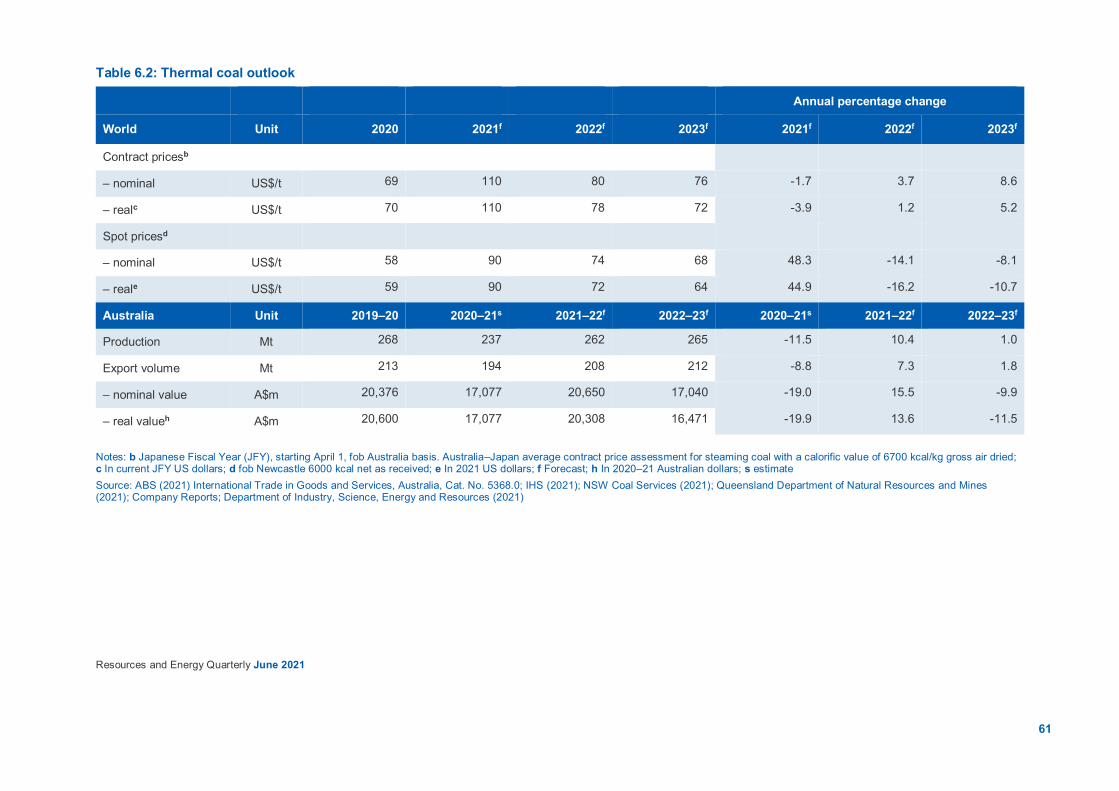
61
Resources and Energy Quarterly June 2021
Table 6.2: Thermal coal outlook
Notes: b Japanese Fiscal Year (JFY), starting April 1, fob Australia basis. Australia–Japan average contract price assessment for steaming coal with a calorific value of 6700 kcal/kg gross air dried; c In current JFY US dollars; d fob Newcastle 6000 kcal net as received; e In 2021 US dollars; f Forecast; h In 2020–21 Australian dollars; s estimate Source: ABS (2021) International Trade in Goods and Services, Australia, Cat. No. 5368.0; IHS (2021); NSW Coal Services (2021); Queensland Department of Natural Resources and Mines (2021); Company Reports; Department of Industry, Science, Energy and Resources (2021)
Annual percentage change
World Unit 2020 2021f 2022f 2023f 2021f 2022f 2023f
Contract pricesb
– nominal US$/t 69 110 80 76 -1.7 3.7 8.6
– realc US$/t 70 110 78 72 -3.9 1.2 5.2
Spot pricesd
– nominal US$/t 58 90 74 68 48.3 -14.1 -8.1
– reale US$/t 59 90 72 64 44.9 -16.2 -10.7
Australia Unit 2019–20 2020–21s 2021–22f 2022–23f 2020–21s 2021–22f 2022–23f
Production Mt 268 237 262 265 -11.5 10.4 1.0
Export volume Mt 213 194 208 212 -8.8 7.3 1.8
– nominal value A$m 20,376 17,077 20,650 17,040 -19.0 15.5 -9.9
– real valueh A$m 20,600 17,077 20,308 16,471 -19.9 13.6 -11.5
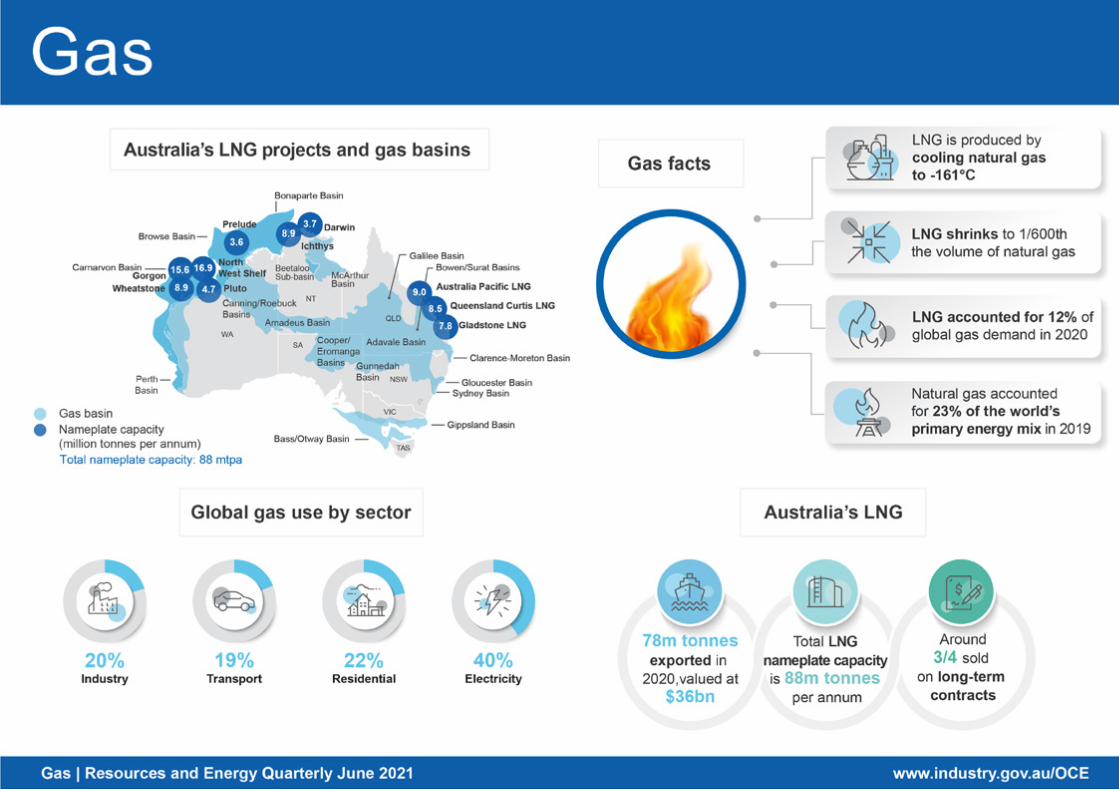

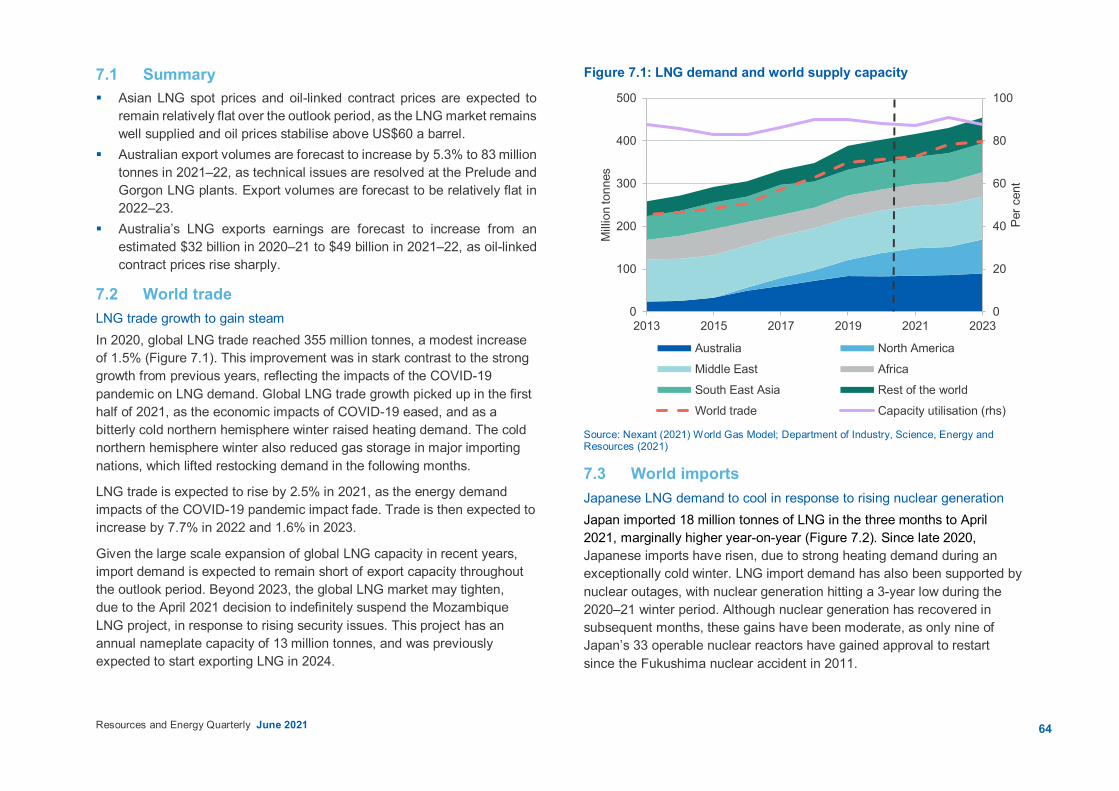
64Resources and Energy Quarterly June 2021
7.1 Summary Asian LNG spot prices and oil-linked contract prices are expected to
remain relatively flat over the outlook period, as the LNG market remains well supplied and oil prices stabilise above US$60 a barrel.
Australian export volumes are forecast to increase by 5.3% to 83 million tonnes in 2021–22, as technical issues are resolved at the Prelude and Gorgon LNG plants. Export volumes are forecast to be relatively flat in 2022–23.
Australia’s LNG exports earnings are forecast to increase from an estimated $32 billion in 2020–21 to $49 billion in 2021–22, as oil-linked contract prices rise sharply.
7.2 World trade LNG trade growth to gain steam In 2020, global LNG trade reached 355 million tonnes, a modest increase of 1.5% (Figure 7.1). This improvement was in stark contrast to the strong growth from previous years, reflecting the impacts of the COVID-19 pandemic on LNG demand. Global LNG trade growth picked up in the first half of 2021, as the economic impacts of COVID-19 eased, and as a bitterly cold northern hemisphere winter raised heating demand. The cold northern hemisphere winter also reduced gas storage in major importing nations, which lifted restocking demand in the following months.
LNG trade is expected to rise by 2.5% in 2021, as the energy demand impacts of the COVID-19 pandemic impact fade. Trade is then expected to increase by 7.7% in 2022 and 1.6% in 2023.
Given the large scale expansion of global LNG capacity in recent years, import demand is expected to remain short of export capacity throughout the outlook period. Beyond 2023, the global LNG market may tighten, due to the April 2021 decision to indefinitely suspend the Mozambique LNG project, in response to rising security issues. This project has an annual nameplate capacity of 13 million tonnes, and was previously expected to start exporting LNG in 2024.
Figure 7.1: LNG demand and world supply capacity
Source: Nexant (2021) World Gas Model; Department of Industry, Science, Energy and Resources (2021)
7.3 World imports Japanese LNG demand to cool in response to rising nuclear generation Japan imported 18 million tonnes of LNG in the three months to April 2021, marginally higher year-on-year (Figure 7.2). Since late 2020, Japanese imports have risen, due to strong heating demand during an exceptionally cold winter. LNG import demand has also been supported by nuclear outages, with nuclear generation hitting a 3-year low during the 2020–21 winter period. Although nuclear generation has recovered in subsequent months, these gains have been moderate, as only nine of Japan’s 33 operable nuclear reactors have gained approval to restart since the Fukushima nuclear accident in 2011.
0
20
40
60
80
100
0
100
200
300
400
500
2013 2015 2017 2019 2021 2023
Per c
ent
Mill
ion
tonn
es
Australia North America
Middle East Africa
South East Asia Rest of the world
World trade Capacity utilisation (rhs)

65Resources and Energy Quarterly June 2021
LNG imports in 2021 are estimated to fall marginally to 73 million tonnes, as higher nuclear generation more than offsets higher gas demand from the economic recovery. However, the pace of gains in nuclear generation remains uncertain, and subject to potential delays and slippages. Imports during the second half of 2021 are also likely to be affected by localised COVID-19 containment measures (see macroeconomic outlook chapter), which will weigh on residential demand. LNG imports are expected to fall further to 72 million tonnes in 2023, due to energy efficiency improvements and higher nuclear output. Beyond the outlook period, Japan’s LNG import demand is likely to be affected by the April 2021 announcement tightening Japan’s 2030 emissions reductions target. This may increase the incentive to reconnect currently idled nuclear power plants.
Figure 7.2: Asian LNG imports and spot price
Source: Bloomberg (2021)
China forecast to be the world’s largest LNG importer from 2022 China’s LNG imports increased by 12% in 2020, reaching 67 million tonnes — making it the world’s second largest LNG importing country. Gas consumption increased significantly in 2020, driven by the industrial and residential sectors, and ongoing coal-to-gas switching. The share of LNG
in Chinese gas demand remained historically high in 2020, reflecting low LNG prices. In 2020, Australia accounted for the largest share of China’s LNG imports, at around 43% (Figure 7.3).
Figure 7.3: China’s gas supply by source
Source: Bloomberg (2021); National Bureau of Statistics of China (2021) General Administration of Customs
In May 2021, there were media reports that at least two of China’s second-tier LNG importers were instructed by the Chinese government to avoid purchasing additional Australian LNG cargoes. Second-tier Chinese LNG importers account for around 10% of Chinese imports, with large state-owned enterprises accounting for the rest. At the time of writing, these alleged directives have not materially affected Australia’s LNG exports to China. With second-tier LNG importers less active on spot markets, the impacts from these directives are likely to be limited.
After China imported virtually no LNG from the US in 2019, imports resumed in April 2020 and reached 1.1 million tonnes in December. This increase followed tariff waivers as part of the US-China Phase One trade deal. For the rest of the outlook period, Chinese targets for purchases of US energy products are expected to remain in place.
0
5
10
15
20
25
0
5
10
15
20
25
Apr-18 Apr-19 Apr-20 Apr-21U
S$ a
mm
tu
Mill
ion
tonn
es
Japan South KoreaChina TaiwanAsian LNG spot price (rhs)
0
2
4
6
8
10
0
20
40
60
80
100
Apr-18 Jan-19 Oct-19 Jul-20 Apr-21
Mill
ion
tonn
es
Per c
ent
Australia QatarMalaysia & Indonesia OtherUnited States Total volumes (rhs)

66Resources and Energy Quarterly June 2021
Chinese LNG imports are expected to remain a key driver of global LNG demand growth, rising by an average 8.7% per annum over the next three years. As a result, China is expected to become the world’s largest LNG importer in 2022, overtaking Japan. China’s 14th Five Year Plan indicates that gas will play an important role in the country’s energy transition to meet its ‘carbon-neutral by 2060’ pledge.
Over the outlook period, China’s LNG import demand is expected to see increased competition from rising gas supply from domestic sources and pipeline imports. Despite China facing geological challenges tapping its extensive gas reserves, domestic gas output is expected to rise due to supportive government policies. The 14th Five Year Plan’s energy resource security strategy targets higher domestic gas production. Pipeline gas imports are also expected to grow, due to the Power of Siberia pipeline opening in December 2019. The pipeline has an annual nameplate capacity of 38 billion cubic metres of gas — equal to about 28 million tonnes of LNG.
South Korea’s LNG demand to increase due to coal-to-gas switching
South Korea’s LNG imports were strong in late 2020 and early 2021, supported by temporary nuclear and coal power plant outages, and strong winter demand. This follows relatively weak LNG imports in early 2020, when imports were weighed down by both the impacts of the COVID-19 pandemic on power demand, and by the restart of nuclear power plants. Over 2020, South Korea’s LNG imports fell by 1.8% to 40 million tonnes.
South Korea’s LNG imports are forecast to stage a modest recovery between 2021 and 2023, rising by about 1.4% a year (Figure 7.4). Although gas demand is expected to be negatively affected by growing nuclear capacity, it is also expected to benefit from government policies that favour gas usage over coal. South Korea’s policies to transition away from coal is expected to continue supporting LNG imports beyond the outlook period, as the government plans to convert 25% of coal-fired capacity to gas by 2031.
Figure 7.4: World LNG import changes
Notes: Emerging Asia includes India. Source: Nexant (2021) World Gas Model; Department of Industry, Science, Energy and Resources (2021)
Taiwan’s imports to rise Taiwan’s LNG demand was resilient in 2020, rising by 7.7% despite the impacts of COVID-19. Gas-fired power generation grew substantially in 2020, driven by government initiatives to phase out coal and nuclear power. These government policies are assumed to continue throughout the outlook period, with the Taiwanese government aiming to increase the share of gas-fired power generation in its electricity mix, from 35% in 2020 to 50% by 2025. However, any substantial growth in Taiwan’s imports is likely to depend on the construction of a third LNG import terminal, as the two existing terminals are operating at full capacity. Taiwanese LNG imports are forecast to reach 18 million tonnes in 2023, 14% higher than 2020 volumes.
-60
-30
0
30
60
2013 2015 2017 2019 2021 2023
Mill
ion
tonn
es
Japan South KoreaChina Emerging AsiaEurope Rest of worldWorld supply capacity

67Resources and Energy Quarterly June 2021
Indian residential gas demand to grow India’s LNG imports were volatile in 2020, negatively affected by the lockdowns earlier in the year. In the second half of 2020, imports rose markedly, due to the opportunistic buying of cheap LNG on the spot market. Over the full year, India’s LNG imports in 2020 rose by 9.9% to 26 million tonnes. This volatility is expected to persist into the second half of 2021, as India continues to grapple with COVID-19. Media reports suggest some Indian importers are asking suppliers to defer deliveries, as COVID-19 containment measures have reduced gas demand. Indian LNG imports in 2021 are forecast to rise by 7.3% to 27 million tonnes.
Imports are forecast to rise to 29 million tonnes in 2022, as residential gas demand recovers. As a price sensitive LNG importer, Indian imports are likely to be affected by the relative cost of LNG throughout the outlook period. Beyond the outlook period, the Indian government has ambitions to lift the share of gas in its energy mix from about 6% in 2020 to 15% in 2030. Its success will depend on a range of factors, including gas market reforms, infrastructure development, and higher domestic gas output.
Europe’s Nord Stream 2 pipeline to reduce LNG import demand In recent years, Europe has played an important role in balancing the global LNG market; its extensive storage capacity and liquid gas hubs have absorbed large volumes of LNG. However, in late 2020 and early 2021, the region absorbed fewer LNG cargoes, due to high Asian demand.
European LNG import demand is forecast to fall, reflecting the ramp up of two new gas pipelines. The Trans Adriatic Pipeline began commercial operations in November 2020, and has an annual nameplate capacity of 10 billion cubic metres (about 7.4 million tonnes of LNG). The other European gas pipeline, Nord Stream 2, has faced delays due to geopolitical tensions. However, US President Biden announced in May 2021 that the US government was waiving sanctions on the companies involved with Nord Stream 2. As a result, Nord Stream 2 is expected to be operational in the second half of 2021, transporting up to 55 billion cubic metres of pipeline gas each year from Russia to Germany (40 million tonnes of LNG).
As a result of assumed higher pipeline gas imports, European LNG imports are forecast to fall from 85 million tonnes in 2020 to 69 million tonnes in 2023.
Emerging Asia to significantly increase LNG imports Other South and South-East Asian economies were a major source of demand growth in late 2020 and early 2021. Ship tracking data suggests that in the three months to April 2021, Pakistan’s LNG imports rose by 7.3% year-on-year, and Bangladesh’s by 10%.
Over the outlook period, imports from emerging Asian economies are expected to increase due to declining domestic gas production, the expansion of gas-fired power generation and new LNG infrastructure developments. Individually, these countries are relatively small importers of LNG, although collectively they are expected to account for a growing share of global LNG demand going forward. The region (including India) is forecast to import 84 million tonnes of LNG by 2023, 44% higher than 2020 volumes (Figure 7.5).
Figure 7.5: LNG imports from emerging Asian countries
Source: Nexant (2021) World Gas Model; Department of Industry, Science, Energy and Resources (2021)
0
20
40
60
80
100
2016 2017 2018 2019 2020 2021 2022 2023M
illio
n to
nnes
India PakistanBangladesh ThailandMalaysia Other emerging Asia

68Resources and Energy Quarterly June 2021
7.4 World exports Lingering 2020 impacts to affect LNG export capacity In 2020, weak spot LNG and oil prices resulted in multiple FID deferrals, and only one liquefaction project was approved— Sempra Energy’s 2.5 million tonnes per annum (mtpa) Costa Azul project in Mexico. At the end of 2020, global LNG capacity was estimated at around 450 mtpa, with another 125 mtpa of capacity under construction or sanctioned for development. However, less than 10 mtpa of new capacity is expected to come online in 2021.
There is around 900 mtpa of proposed LNG capacity in the pre-FID stage, though much of this is unlikely to proceed. LNG capacity is expected to rise later in the decade, predominantly as a result of new projects in Qatar and Russia. This growing capacity in low-cost producers is likely to affect future investment decisions in other producers, which could impact the timing of the next wave of LNG capacity additions.
US exports to rise in the short-term In 2020, the US was the largest driver of the recovery in global LNG exports. US exports declined significantly between June and September 2020, as high US prices reduced the competitiveness of US LNG exports to Asia and Europe. Later in the year, supply disruptions in other major exporters lifted Asian and European prices, raising the attractiveness of US exports. As a result, US exports rose sharply, reaching a record high in December 2020. US LNG exports rose 31% to 50 million tonnes in 2020.
So far in 2021, US exports have increased further, reaching a new record in March 2021 and remaining historically high in later months. Over the full year, US LNG exports are forecast to increase by 13% year-on-year to 56 million tonnes, reflecting ongoing growth in US LNG capacity.
US LNG capacity growth is expected to stagnate in 2022, and US exports are projected to increase only marginally. In 2023, exports are expected to rise by 5.8%, reflecting higher liquefaction capacity. However, the pace of capacity growth remains uncertain. In March 2021, Annova LNG
announced they were ceasing development of their planned Texas export facility, due to changes in the global LNG market. Facing strong price competition from expanding Qatari and Russian LNG capacity, future US LNG facilities could face similar FID deferrals or cancellations.
Figure 7.6: Outlook for global LNG exports
Source: Nexant (2021) World Gas Model; Department of Industry, Science, Energy and Resources (2021)
Qatar’s exports to remain relatively steady over the short-term Qatar’s LNG exports were largely resilient in 2020. Shipping data indicates that Qatar may have been the world’s largest LNG exporter in 2020, slightly surpassing Australia. However, given the marginal difference between the two country’s exports and uncertainty surrounding the precise level of Qatar’s LNG exports, an accurate assessment of totals is difficult.
Qatar’s LNG exports are forecast to be relatively steady in 2021 and 2022, hovering around 79 million tonnes (Figure 7.6). Beyond the outlook period, Qatar’s LNG exports are expected to increase significantly, as a result of the $US29 billion North Field East project, anticipated to be completed in late 2025. This project has a nameplate capacity of 33 million tonnes, lifting Qatar’s export capacity to 110 million tonnes.
0
30
60
90
Australia Qatar UnitedStates
Russia SouthEast Asia
Africa Rest ofworld
Mill
ion
tonn
es
2020 2021 2022 2023
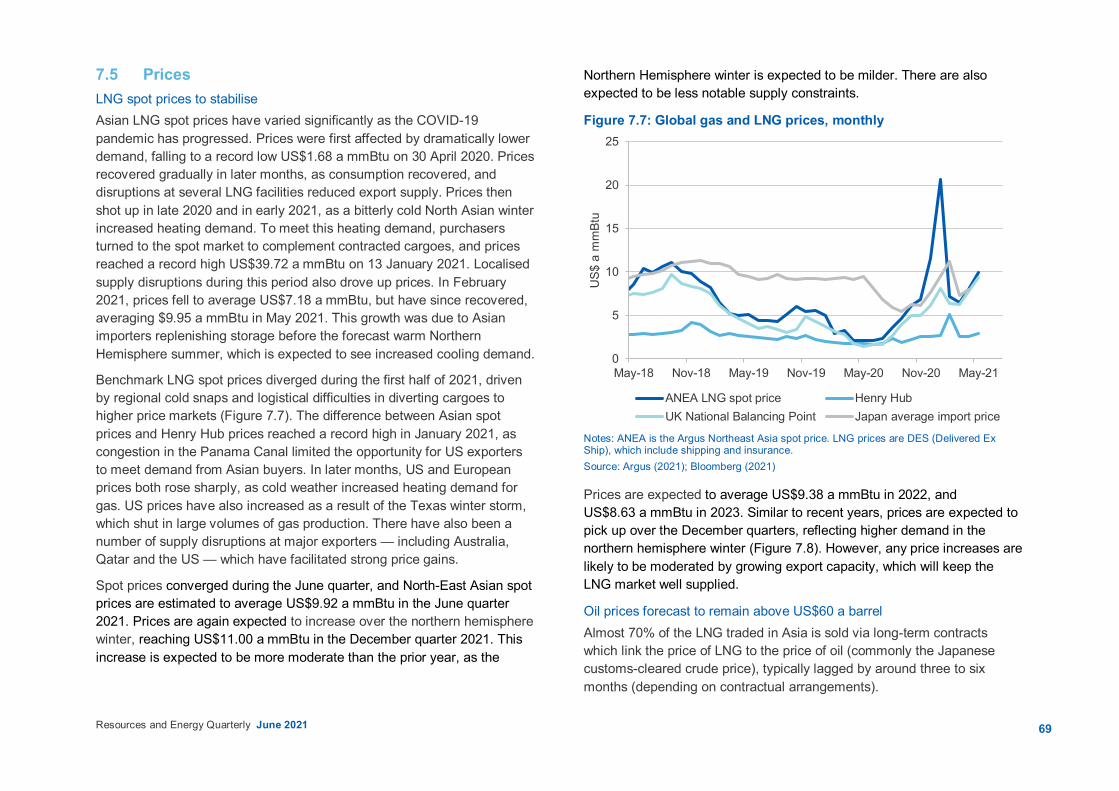
69Resources and Energy Quarterly June 2021
7.5 Prices LNG spot prices to stabilise Asian LNG spot prices have varied significantly as the COVID-19 pandemic has progressed. Prices were first affected by dramatically lower demand, falling to a record low US$1.68 a mmBtu on 30 April 2020. Prices recovered gradually in later months, as consumption recovered, and disruptions at several LNG facilities reduced export supply. Prices then shot up in late 2020 and in early 2021, as a bitterly cold North Asian winter increased heating demand. To meet this heating demand, purchasers turned to the spot market to complement contracted cargoes, and prices reached a record high US$39.72 a mmBtu on 13 January 2021. Localised supply disruptions during this period also drove up prices. In February 2021, prices fell to average US$7.18 a mmBtu, but have since recovered, averaging $9.95 a mmBtu in May 2021. This growth was due to Asian importers replenishing storage before the forecast warm Northern Hemisphere summer, which is expected to see increased cooling demand.
Benchmark LNG spot prices diverged during the first half of 2021, driven by regional cold snaps and logistical difficulties in diverting cargoes to higher price markets (Figure 7.7). The difference between Asian spot prices and Henry Hub prices reached a record high in January 2021, as congestion in the Panama Canal limited the opportunity for US exporters to meet demand from Asian buyers. In later months, US and European prices both rose sharply, as cold weather increased heating demand for gas. US prices have also increased as a result of the Texas winter storm, which shut in large volumes of gas production. There have also been a number of supply disruptions at major exporters — including Australia, Qatar and the US — which have facilitated strong price gains.
Spot prices converged during the June quarter, and North-East Asian spot prices are estimated to average US$9.92 a mmBtu in the June quarter 2021. Prices are again expected to increase over the northern hemisphere winter, reaching US$11.00 a mmBtu in the December quarter 2021. This increase is expected to be more moderate than the prior year, as the
Northern Hemisphere winter is expected to be milder. There are also expected to be less notable supply constraints.
Figure 7.7: Global gas and LNG prices, monthly
Notes: ANEA is the Argus Northeast Asia spot price. LNG prices are DES (Delivered Ex Ship), which include shipping and insurance. Source: Argus (2021); Bloomberg (2021)
Prices are expected to average US$9.38 a mmBtu in 2022, and US$8.63 a mmBtu in 2023. Similar to recent years, prices are expected to pick up over the December quarters, reflecting higher demand in the northern hemisphere winter (Figure 7.8). However, any price increases are likely to be moderated by growing export capacity, which will keep the LNG market well supplied.
Oil prices forecast to remain above US$60 a barrel Almost 70% of the LNG traded in Asia is sold via long-term contracts which link the price of LNG to the price of oil (commonly the Japanese customs-cleared crude price), typically lagged by around three to six months (depending on contractual arrangements).
0
5
10
15
20
25
May-18 Nov-18 May-19 Nov-19 May-20 Nov-20 May-21
US$
a m
mBt
u
ANEA LNG spot price Henry HubUK National Balancing Point Japan average import price
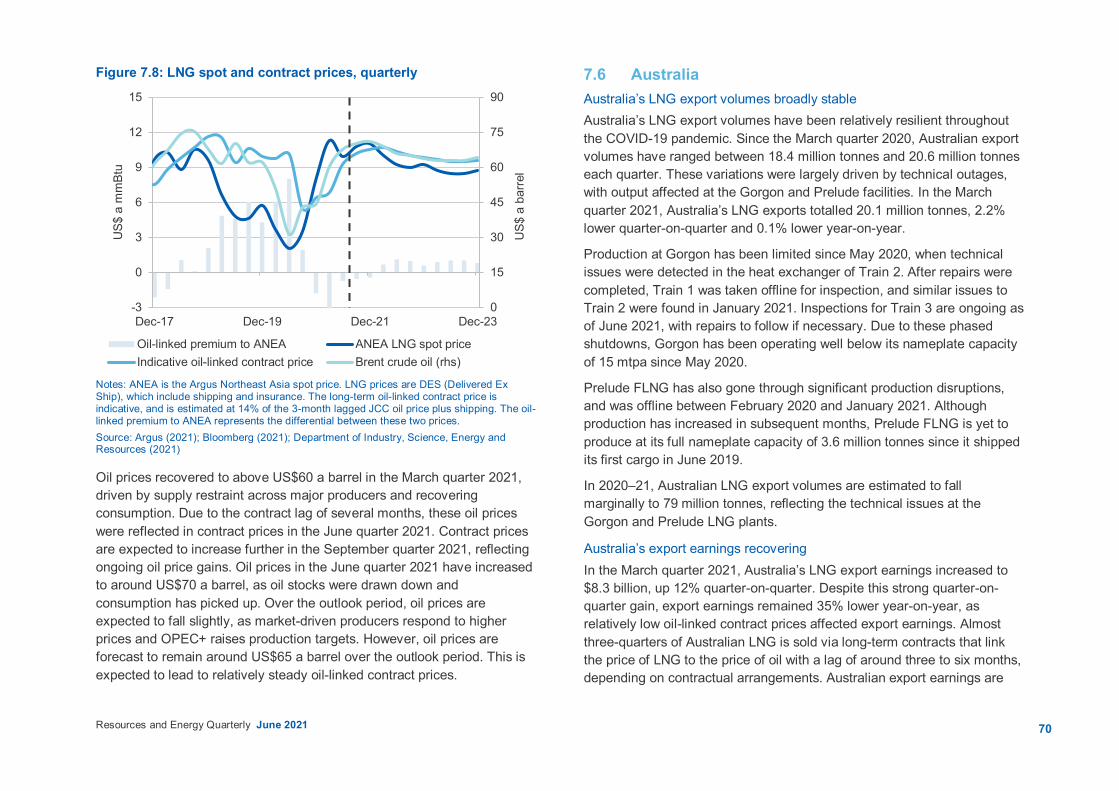
70Resources and Energy Quarterly June 2021
Figure 7.8: LNG spot and contract prices, quarterly
Notes: ANEA is the Argus Northeast Asia spot price. LNG prices are DES (Delivered Ex Ship), which include shipping and insurance. The long-term oil-linked contract price is indicative, and is estimated at 14% of the 3-month lagged JCC oil price plus shipping. The oil-linked premium to ANEA represents the differential between these two prices. Source: Argus (2021); Bloomberg (2021); Department of Industry, Science, Energy and Resources (2021)
Oil prices recovered to above US$60 a barrel in the March quarter 2021, driven by supply restraint across major producers and recovering consumption. Due to the contract lag of several months, these oil prices were reflected in contract prices in the June quarter 2021. Contract prices are expected to increase further in the September quarter 2021, reflecting ongoing oil price gains. Oil prices in the June quarter 2021 have increased to around US$70 a barrel, as oil stocks were drawn down and consumption has picked up. Over the outlook period, oil prices are expected to fall slightly, as market-driven producers respond to higher prices and OPEC+ raises production targets. However, oil prices are forecast to remain around US$65 a barrel over the outlook period. This is expected to lead to relatively steady oil-linked contract prices.
7.6 Australia Australia’s LNG export volumes broadly stable Australia’s LNG export volumes have been relatively resilient throughout the COVID-19 pandemic. Since the March quarter 2020, Australian export volumes have ranged between 18.4 million tonnes and 20.6 million tonnes each quarter. These variations were largely driven by technical outages, with output affected at the Gorgon and Prelude facilities. In the March quarter 2021, Australia’s LNG exports totalled 20.1 million tonnes, 2.2% lower quarter-on-quarter and 0.1% lower year-on-year.
Production at Gorgon has been limited since May 2020, when technical issues were detected in the heat exchanger of Train 2. After repairs were completed, Train 1 was taken offline for inspection, and similar issues to Train 2 were found in January 2021. Inspections for Train 3 are ongoing as of June 2021, with repairs to follow if necessary. Due to these phased shutdowns, Gorgon has been operating well below its nameplate capacity of 15 mtpa since May 2020.
Prelude FLNG has also gone through significant production disruptions, and was offline between February 2020 and January 2021. Although production has increased in subsequent months, Prelude FLNG is yet to produce at its full nameplate capacity of 3.6 million tonnes since it shipped its first cargo in June 2019.
In 2020–21, Australian LNG export volumes are estimated to fall marginally to 79 million tonnes, reflecting the technical issues at the Gorgon and Prelude LNG plants.
Australia’s export earnings recovering In the March quarter 2021, Australia’s LNG export earnings increased to $8.3 billion, up 12% quarter-on-quarter. Despite this strong quarter-on-quarter gain, export earnings remained 35% lower year-on-year, as relatively low oil-linked contract prices affected export earnings. Almost three-quarters of Australian LNG is sold via long-term contracts that link the price of LNG to the price of oil with a lag of around three to six months, depending on contractual arrangements. Australian export earnings are
0
15
30
45
60
75
90
-3
0
3
6
9
12
15
Dec-17 Dec-19 Dec-21 Dec-23
US$
a b
arre
l
US$
a m
mBt
u
Oil-linked premium to ANEA ANEA LNG spot priceIndicative oil-linked contract price Brent crude oil (rhs)
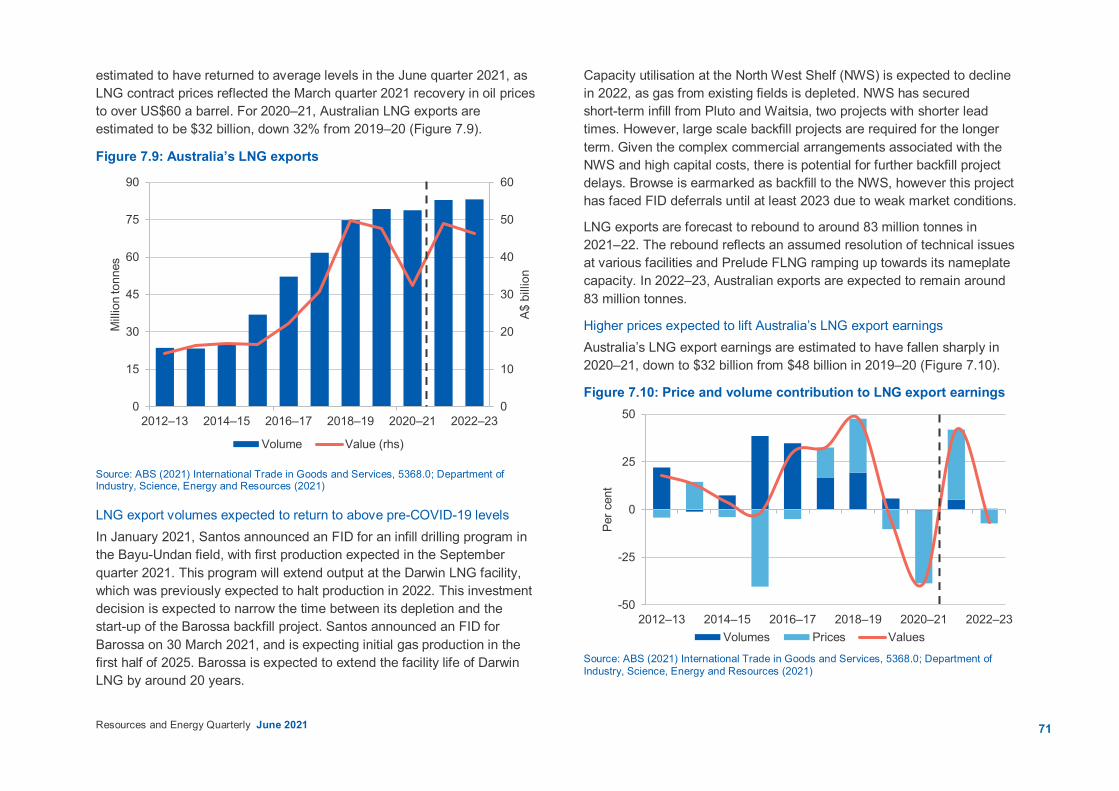
71Resources and Energy Quarterly June 2021
estimated to have returned to average levels in the June quarter 2021, as LNG contract prices reflected the March quarter 2021 recovery in oil prices to over US$60 a barrel. For 2020–21, Australian LNG exports are estimated to be $32 billion, down 32% from 2019–20 (Figure 7.9).
Figure 7.9: Australia’s LNG exports
Source: ABS (2021) International Trade in Goods and Services, 5368.0; Department of Industry, Science, Energy and Resources (2021)
LNG export volumes expected to return to above pre-COVID-19 levels In January 2021, Santos announced an FID for an infill drilling program in the Bayu-Undan field, with first production expected in the September quarter 2021. This program will extend output at the Darwin LNG facility, which was previously expected to halt production in 2022. This investment decision is expected to narrow the time between its depletion and the start-up of the Barossa backfill project. Santos announced an FID for Barossa on 30 March 2021, and is expecting initial gas production in the first half of 2025. Barossa is expected to extend the facility life of Darwin LNG by around 20 years.
Capacity utilisation at the North West Shelf (NWS) is expected to decline in 2022, as gas from existing fields is depleted. NWS has secured short-term infill from Pluto and Waitsia, two projects with shorter lead times. However, large scale backfill projects are required for the longer term. Given the complex commercial arrangements associated with the NWS and high capital costs, there is potential for further backfill project delays. Browse is earmarked as backfill to the NWS, however this project has faced FID deferrals until at least 2023 due to weak market conditions.
LNG exports are forecast to rebound to around 83 million tonnes in 2021–22. The rebound reflects an assumed resolution of technical issues at various facilities and Prelude FLNG ramping up towards its nameplate capacity. In 2022–23, Australian exports are expected to remain around 83 million tonnes.
Higher prices expected to lift Australia’s LNG export earnings Australia’s LNG export earnings are estimated to have fallen sharply in 2020–21, down to $32 billion from $48 billion in 2019–20 (Figure 7.10).
Figure 7.10: Price and volume contribution to LNG export earnings
Source: ABS (2021) International Trade in Goods and Services, 5368.0; Department of Industry, Science, Energy and Resources (2021)
0
10
20
30
40
50
60
0
15
30
45
60
75
90
2012–13 2014–15 2016–17 2018–19 2020–21 2022–23
A$ b
illio
n
Mill
ion
tonn
es
Volume Value (rhs)
-50
-25
0
25
50
2012–13 2014–15 2016–17 2018–19 2020–21 2022–23Pe
r cen
t
Volumes Prices Values
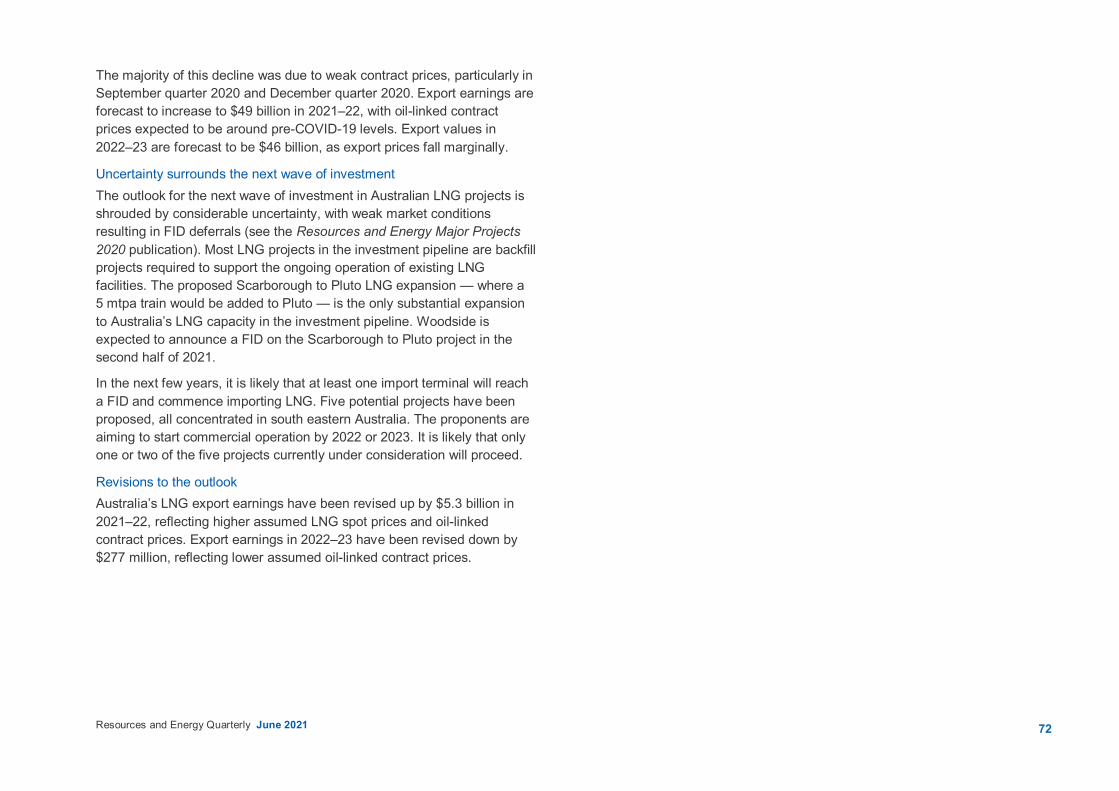
72Resources and Energy Quarterly June 2021
The majority of this decline was due to weak contract prices, particularly in September quarter 2020 and December quarter 2020. Export earnings are forecast to increase to $49 billion in 2021–22, with oil-linked contract prices expected to be around pre-COVID-19 levels. Export values in 2022–23 are forecast to be $46 billion, as export prices fall marginally.
Uncertainty surrounds the next wave of investment The outlook for the next wave of investment in Australian LNG projects is shrouded by considerable uncertainty, with weak market conditions resulting in FID deferrals (see the Resources and Energy Major Projects 2020 publication). Most LNG projects in the investment pipeline are backfill projects required to support the ongoing operation of existing LNG facilities. The proposed Scarborough to Pluto LNG expansion — where a 5 mtpa train would be added to Pluto — is the only substantial expansion to Australia’s LNG capacity in the investment pipeline. Woodside is expected to announce a FID on the Scarborough to Pluto project in the second half of 2021.
In the next few years, it is likely that at least one import terminal will reach a FID and commence importing LNG. Five potential projects have been proposed, all concentrated in south eastern Australia. The proponents are aiming to start commercial operation by 2022 or 2023. It is likely that only one or two of the five projects currently under consideration will proceed.
Revisions to the outlook Australia’s LNG export earnings have been revised up by $5.3 billion in 2021–22, reflecting higher assumed LNG spot prices and oil-linked contract prices. Export earnings in 2022–23 have been revised down by $277 million, reflecting lower assumed oil-linked contract prices.
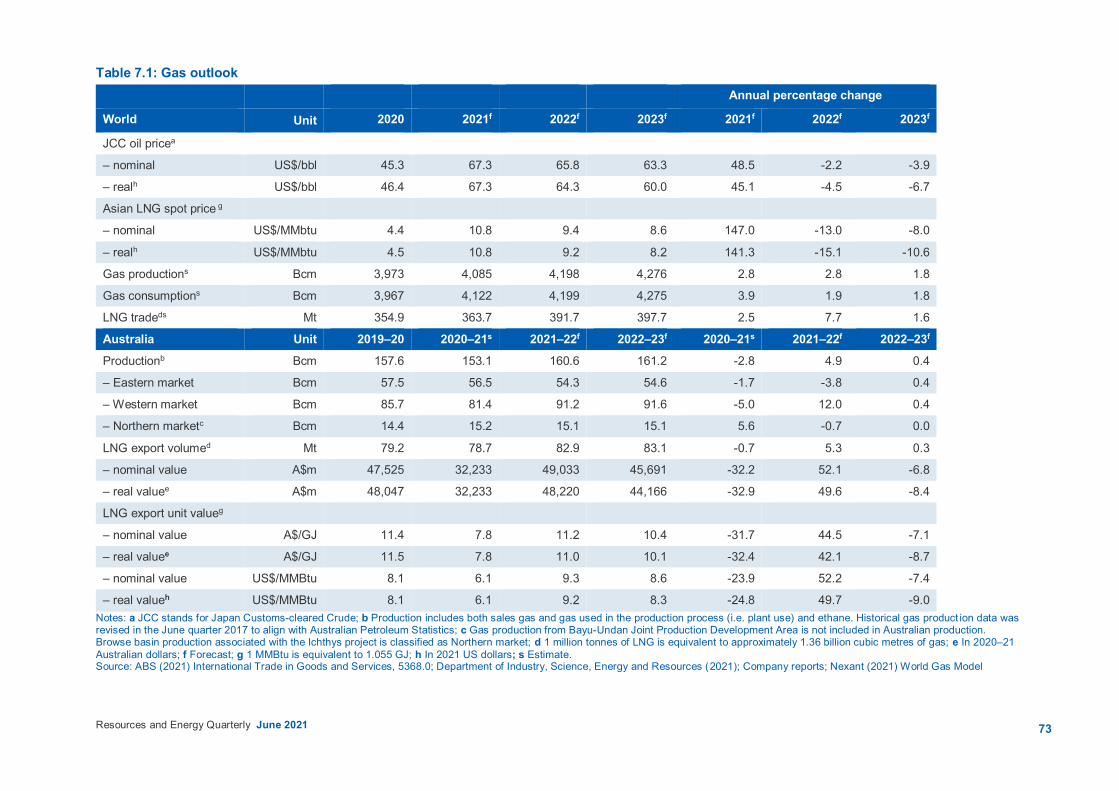
73Resources and Energy Quarterly June 2021
Table 7.1: Gas outlook Annual percentage change
World Unit 2020 2021f 2022f 2023f 2021f 2022f 2023f
JCC oil pricea
– nominal US$/bbl 45.3 67.3 65.8 63.3 48.5 -2.2 -3.9
– realh US$/bbl 46.4 67.3 64.3 60.0 45.1 -4.5 -6.7
Asian LNG spot price g
– nominal US$/MMbtu 4.4 10.8 9.4 8.6 147.0 -13.0 -8.0
– realh US$/MMbtu 4.5 10.8 9.2 8.2 141.3 -15.1 -10.6
Gas productions Bcm 3,973 4,085 4,198 4,276 2.8 2.8 1.8
Gas consumptions Bcm 3,967 4,122 4,199 4,275 3.9 1.9 1.8
LNG tradeds Mt 354.9 363.7 391.7 397.7 2.5 7.7 1.6
Australia Unit 2019–20 2020–21s 2021–22f 2022–23f 2020–21s 2021–22f 2022–23f Productionb Bcm 157.6 153.1 160.6 161.2 -2.8 4.9 0.4
– Eastern market Bcm 57.5 56.5 54.3 54.6 -1.7 -3.8 0.4
– Western market Bcm 85.7 81.4 91.2 91.6 -5.0 12.0 0.4
– Northern marketc Bcm 14.4 15.2 15.1 15.1 5.6 -0.7 0.0
LNG export volumed Mt 79.2 78.7 82.9 83.1 -0.7 5.3 0.3
– nominal value A$m 47,525 32,233 49,033 45,691 -32.2 52.1 -6.8
– real valuee A$m 48,047 32,233 48,220 44,166 -32.9 49.6 -8.4
LNG export unit valueg
– nominal value A$/GJ 11.4 7.8 11.2 10.4 -31.7 44.5 -7.1
– real valuee A$/GJ 11.5 7.8 11.0 10.1 -32.4 42.1 -8.7
– nominal value US$/MMBtu 8.1 6.1 9.3 8.6 -23.9 52.2 -7.4
– real valueh US$/MMBtu 8.1 6.1 9.2 8.3 -24.8 49.7 -9.0 Notes: a JCC stands for Japan Customs-cleared Crude; b Production includes both sales gas and gas used in the production process (i.e. plant use) and ethane. Historical gas product ion data was revised in the June quarter 2017 to align with Australian Petroleum Statistics; c Gas production from Bayu-Undan Joint Production Development Area is not included in Australian production. Browse basin production associated with the Ichthys project is classified as Northern market; d 1 million tonnes of LNG is equivalent to approximately 1.36 billion cubic metres of gas; e In 2020–21 Australian dollars; f Forecast; g 1 MMBtu is equivalent to 1.055 GJ; h In 2021 US dollars; s Estimate. Source: ABS (2021) International Trade in Goods and Services, 5368.0; Department of Industry, Science, Energy and Resources (2021); Company reports; Nexant (2021) World Gas Model


76Resources and Energy Quarterly June 2021
8.1 Summary Oil prices are expected to stabilise in the second half of 2021. Brent
crude prices are forecast to average US$67 a barrel in 2021, up from US$42 a barrel in 2020. Prices will likely steady in 2022 and 2023.
Australian crude oil and feedstock exports are estimated to have declined to 286,000 barrels a day in 2020–21. Exports are forecast to increase to around 310,000 barrels a day in 2022-23.
Australian oil export earnings are estimated to have declined marginally to $7.7 billion in 2020–21, reflecting low prices early in the financial year. Improving prices are expected to lead to export earnings rising to $10.9 billion in 2021–22 and $10.1 billion in 2022–23.
8.2 World consumption Consumption to make a strong recovery in H2 2021 So far in 2021, global oil demand has continued to recover, reflecting improved economic activity in major consumers, the rapid progress in the global vaccination rollout, and a rebound in domestic travel (Figure 8.1). However, average quarterly usage in the first half of 2021 has been lower than the December quarter 2020. This is partly seasonal, but also reflects unusually poor weather in the US in early 2021, as well as the ongoing effects of the COVID-19 pandemic in some nations.
Industrial consumption has rebounded strongly, with trade and industrial production indicators remaining strong and pointing to a sharp acceleration of global petrochemical manufacturing activity over the second half of 2021. Petrochemicals were more sheltered from the effects of the pandemic than other oil products, so growth in consumption demand in the short-run is likely to be slightly more muted. However, it is expected that ethane, LPG and naphtha together will account for a majority of the increase in oil product demand to 2023.
As the global vaccination program is rolled out, restrictions on mobility are gradually easing, and both air and ground travel is picking up. In China, a booming domestic travel industry is significantly offsetting the decline in international flights elsewhere. There has been a significant increase in
daily global air traffic, being led by the US which averaged 1.5 million passengers a day in May. This was partially offset by noticeable falls in India, Vietnam and Japan. Despite recent increases, it is now expected that aviation fuel consumption — which was hit hardest by COVID-19 — will not return to 2019 levels until 2024. It is likely that the spread of online meetings has permanently altered patterns in business travel. Ground travel has increased across most major economies. As at 17 June, road traffic in China has recovered to 88% of pre-COVID levels, while traffic in Europe is at 91% of pre-virus levels and 64% in the United States.
Figure 8.1: Oil consumption, OECD and non-OECD
Source: Department of Industry, Science, Energy and Resources (2021); International Energy Agency (2021)
OECD consumption driving overall recovery in consumption OECD oil consumption is gradually increasing, following a low outcome in the March quarter. Consumption has picked up in both Europe and the US as COVID-19 containment measures have gradually eased. The roll-out of vaccination campaigns across much of the OECD is also likely to support oil consumption. However, consumption has still not recovered to pre-COVID levels, and is forecast to average 45 million barrels a day in 2021 and grow by a further 2% in 2022 (Figure 8.2).
0
20
40
60
80
100
120
2013 2015 2017 2019 2021 2023
Mill
ion
barre
ls a
day
OECD Non-OECD
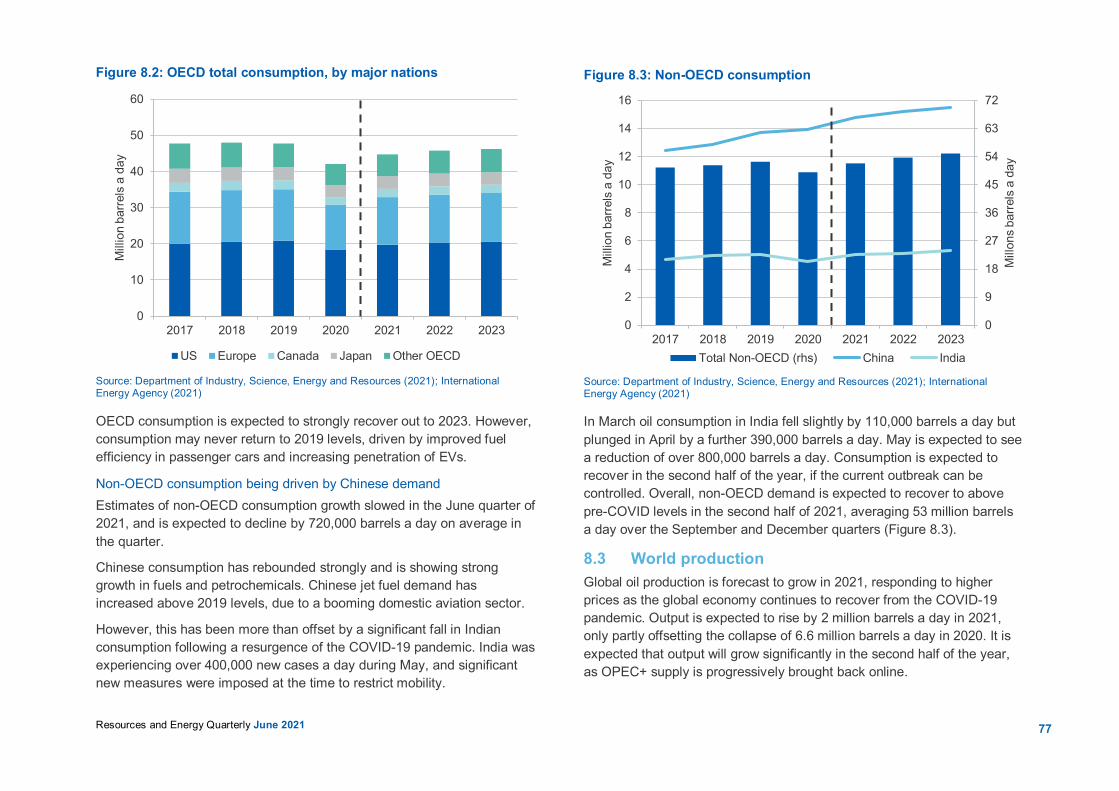
77Resources and Energy Quarterly June 2021
Figure 8.2: OECD total consumption, by major nations
Source: Department of Industry, Science, Energy and Resources (2021); International Energy Agency (2021)
OECD consumption is expected to strongly recover out to 2023. However, consumption may never return to 2019 levels, driven by improved fuel efficiency in passenger cars and increasing penetration of EVs.
Non-OECD consumption being driven by Chinese demand Estimates of non-OECD consumption growth slowed in the June quarter of 2021, and is expected to decline by 720,000 barrels a day on average in the quarter.
Chinese consumption has rebounded strongly and is showing strong growth in fuels and petrochemicals. Chinese jet fuel demand has increased above 2019 levels, due to a booming domestic aviation sector.
However, this has been more than offset by a significant fall in Indian consumption following a resurgence of the COVID-19 pandemic. India was experiencing over 400,000 new cases a day during May, and significant new measures were imposed at the time to restrict mobility.
Figure 8.3: Non-OECD consumption
Source: Department of Industry, Science, Energy and Resources (2021); International Energy Agency (2021)
In March oil consumption in India fell slightly by 110,000 barrels a day but plunged in April by a further 390,000 barrels a day. May is expected to see a reduction of over 800,000 barrels a day. Consumption is expected to recover in the second half of the year, if the current outbreak can be controlled. Overall, non-OECD demand is expected to recover to above pre-COVID levels in the second half of 2021, averaging 53 million barrels a day over the September and December quarters (Figure 8.3).
8.3 World production Global oil production is forecast to grow in 2021, responding to higher prices as the global economy continues to recover from the COVID-19 pandemic. Output is expected to rise by 2 million barrels a day in 2021, only partly offsetting the collapse of 6.6 million barrels a day in 2020. It is expected that output will grow significantly in the second half of the year, as OPEC+ supply is progressively brought back online.
0
10
20
30
40
50
60
2017 2018 2019 2020 2021 2022 2023
Mill
ion
barre
ls a
day
US Europe Canada Japan Other OECD
0
9
18
27
36
45
54
63
72
0
2
4
6
8
10
12
14
16
2017 2018 2019 2020 2021 2022 2023
Mill
ons
barre
ls a
day
Mill
ion
barre
ls a
day
Total Non-OECD (rhs) China India
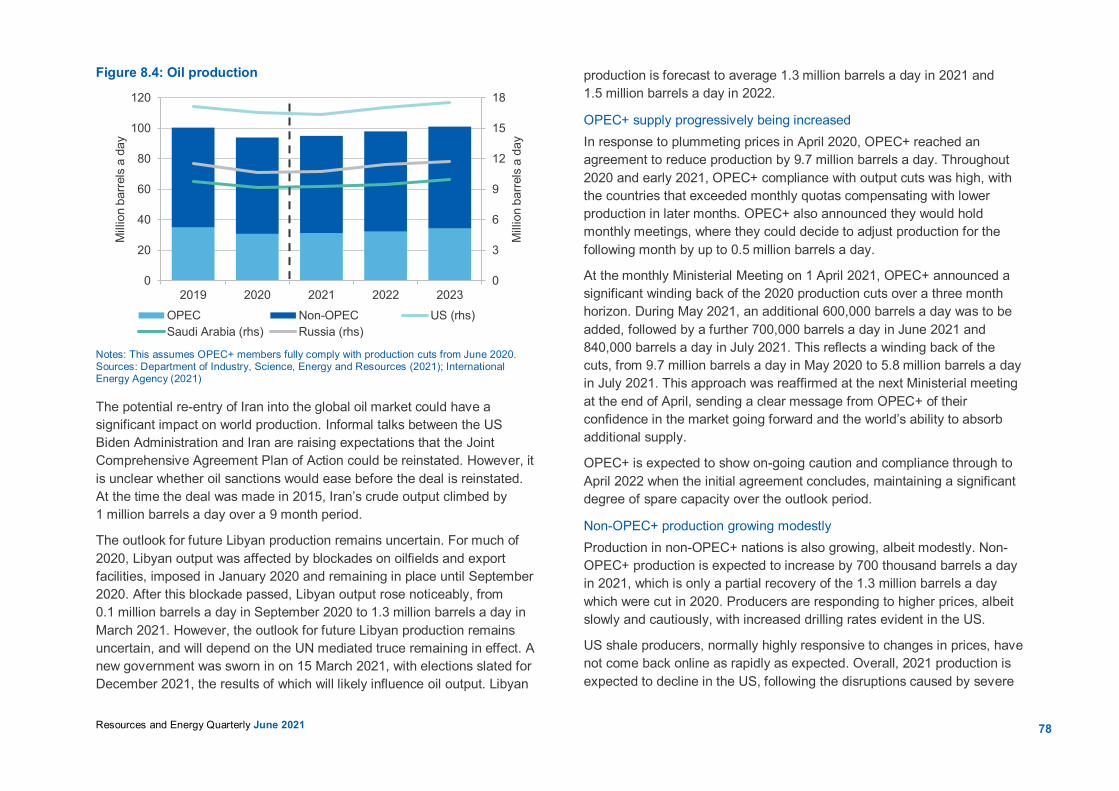
78Resources and Energy Quarterly June 2021
Figure 8.4: Oil production
Notes: This assumes OPEC+ members fully comply with production cuts from June 2020. Sources: Department of Industry, Science, Energy and Resources (2021); International Energy Agency (2021)
The potential re-entry of Iran into the global oil market could have a significant impact on world production. Informal talks between the US Biden Administration and Iran are raising expectations that the Joint Comprehensive Agreement Plan of Action could be reinstated. However, it is unclear whether oil sanctions would ease before the deal is reinstated. At the time the deal was made in 2015, Iran’s crude output climbed by 1 million barrels a day over a 9 month period.
The outlook for future Libyan production remains uncertain. For much of 2020, Libyan output was affected by blockades on oilfields and export facilities, imposed in January 2020 and remaining in place until September 2020. After this blockade passed, Libyan output rose noticeably, from 0.1 million barrels a day in September 2020 to 1.3 million barrels a day in March 2021. However, the outlook for future Libyan production remains uncertain, and will depend on the UN mediated truce remaining in effect. A new government was sworn in on 15 March 2021, with elections slated for December 2021, the results of which will likely influence oil output. Libyan
production is forecast to average 1.3 million barrels a day in 2021 and 1.5 million barrels a day in 2022.
OPEC+ supply progressively being increased In response to plummeting prices in April 2020, OPEC+ reached an agreement to reduce production by 9.7 million barrels a day. Throughout 2020 and early 2021, OPEC+ compliance with output cuts was high, with the countries that exceeded monthly quotas compensating with lower production in later months. OPEC+ also announced they would hold monthly meetings, where they could decide to adjust production for the following month by up to 0.5 million barrels a day.
At the monthly Ministerial Meeting on 1 April 2021, OPEC+ announced a significant winding back of the 2020 production cuts over a three month horizon. During May 2021, an additional 600,000 barrels a day was to be added, followed by a further 700,000 barrels a day in June 2021 and 840,000 barrels a day in July 2021. This reflects a winding back of the cuts, from 9.7 million barrels a day in May 2020 to 5.8 million barrels a day in July 2021. This approach was reaffirmed at the next Ministerial meeting at the end of April, sending a clear message from OPEC+ of their confidence in the market going forward and the world’s ability to absorb additional supply.
OPEC+ is expected to show on-going caution and compliance through to April 2022 when the initial agreement concludes, maintaining a significant degree of spare capacity over the outlook period.
Non-OPEC+ production growing modestly Production in non-OPEC+ nations is also growing, albeit modestly. Non-OPEC+ production is expected to increase by 700 thousand barrels a day in 2021, which is only a partial recovery of the 1.3 million barrels a day which were cut in 2020. Producers are responding to higher prices, albeit slowly and cautiously, with increased drilling rates evident in the US.
US shale producers, normally highly responsive to changes in prices, have not come back online as rapidly as expected. Overall, 2021 production is expected to decline in the US, following the disruptions caused by severe
0
3
6
9
12
15
18
0
20
40
60
80
100
120
2019 2020 2021 2022 2023
Mill
ion
barre
ls a
day
Mill
ion
barre
ls a
day
OPEC Non-OPEC US (rhs)Saudi Arabia (rhs) Russia (rhs)
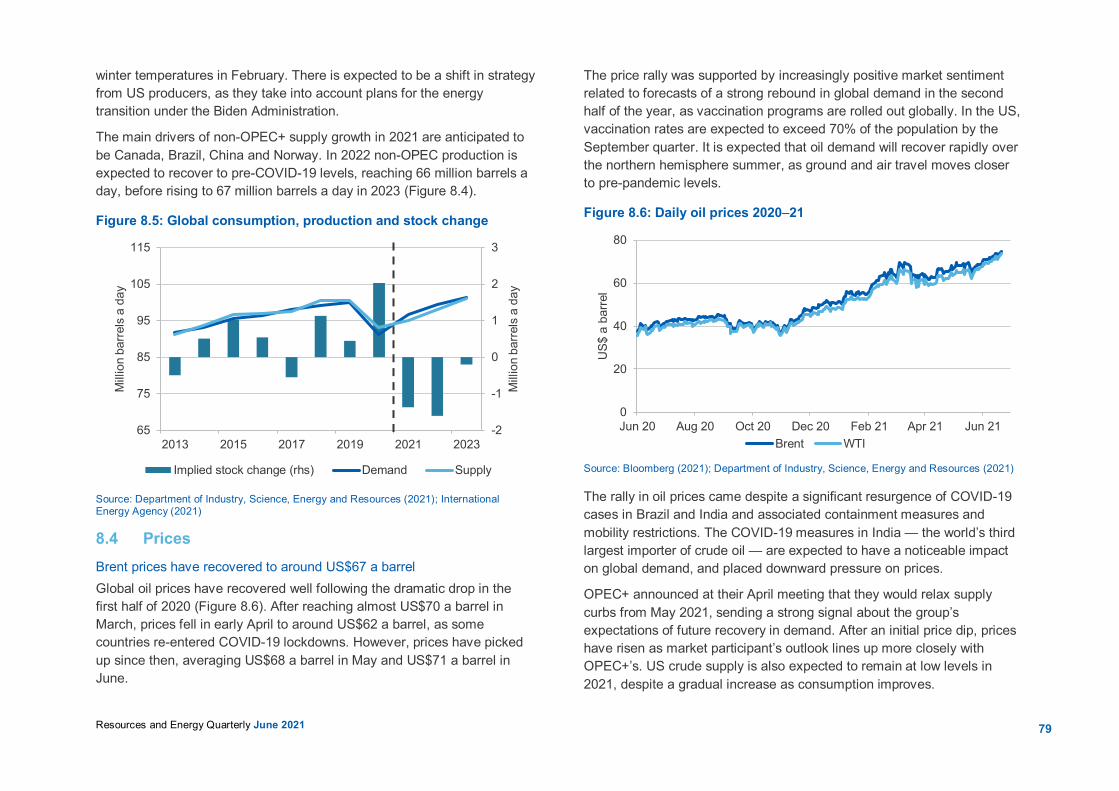
79Resources and Energy Quarterly June 2021
winter temperatures in February. There is expected to be a shift in strategy from US producers, as they take into account plans for the energy transition under the Biden Administration.
The main drivers of non-OPEC+ supply growth in 2021 are anticipated to be Canada, Brazil, China and Norway. In 2022 non-OPEC production is expected to recover to pre-COVID-19 levels, reaching 66 million barrels a day, before rising to 67 million barrels a day in 2023 (Figure 8.4).
Figure 8.5: Global consumption, production and stock change
Source: Department of Industry, Science, Energy and Resources (2021); International Energy Agency (2021)
8.4 Prices Brent prices have recovered to around US$67 a barrel Global oil prices have recovered well following the dramatic drop in the first half of 2020 (Figure 8.6). After reaching almost US$70 a barrel in March, prices fell in early April to around US$62 a barrel, as some countries re-entered COVID-19 lockdowns. However, prices have picked up since then, averaging US$68 a barrel in May and US$71 a barrel in June.
The price rally was supported by increasingly positive market sentiment related to forecasts of a strong rebound in global demand in the second half of the year, as vaccination programs are rolled out globally. In the US, vaccination rates are expected to exceed 70% of the population by the September quarter. It is expected that oil demand will recover rapidly over the northern hemisphere summer, as ground and air travel moves closer to pre-pandemic levels.
Figure 8.6: Daily oil prices 2020–21
Source: Bloomberg (2021); Department of Industry, Science, Energy and Resources (2021)
The rally in oil prices came despite a significant resurgence of COVID-19 cases in Brazil and India and associated containment measures and mobility restrictions. The COVID-19 measures in India — the world’s third largest importer of crude oil — are expected to have a noticeable impact on global demand, and placed downward pressure on prices.
OPEC+ announced at their April meeting that they would relax supply curbs from May 2021, sending a strong signal about the group’s expectations of future recovery in demand. After an initial price dip, prices have risen as market participant’s outlook lines up more closely with OPEC+’s. US crude supply is also expected to remain at low levels in 2021, despite a gradual increase as consumption improves.
-2
-1
0
1
2
3
65
75
85
95
105
115
2013 2015 2017 2019 2021 2023
Mill
ion
barre
ls a
day
Mill
ion
barre
ls a
day
Implied stock change (rhs) Demand Supply
0
20
40
60
80
Jun 20 Aug 20 Oct 20 Dec 20 Feb 21 Apr 21 Jun 21
US$
a b
arre
l
Brent WTI
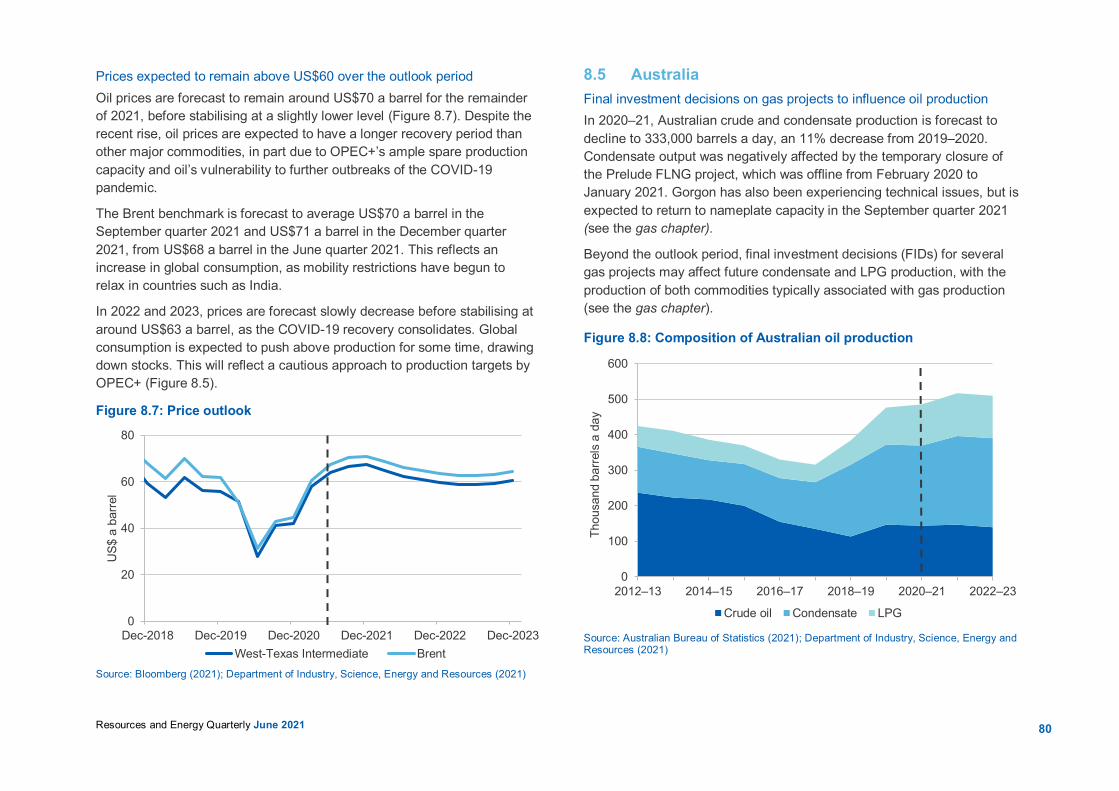
80Resources and Energy Quarterly June 2021
Prices expected to remain above US$60 over the outlook period Oil prices are forecast to remain around US$70 a barrel for the remainder of 2021, before stabilising at a slightly lower level (Figure 8.7). Despite the recent rise, oil prices are expected to have a longer recovery period than other major commodities, in part due to OPEC+’s ample spare production capacity and oil’s vulnerability to further outbreaks of the COVID-19 pandemic.
The Brent benchmark is forecast to average US$70 a barrel in the September quarter 2021 and US$71 a barrel in the December quarter 2021, from US$68 a barrel in the June quarter 2021. This reflects an increase in global consumption, as mobility restrictions have begun to relax in countries such as India.
In 2022 and 2023, prices are forecast slowly decrease before stabilising at around US$63 a barrel, as the COVID-19 recovery consolidates. Global consumption is expected to push above production for some time, drawing down stocks. This will reflect a cautious approach to production targets by OPEC+ (Figure 8.5).
Figure 8.7: Price outlook
Source: Bloomberg (2021); Department of Industry, Science, Energy and Resources (2021)
8.5 Australia Final investment decisions on gas projects to influence oil production In 2020–21, Australian crude and condensate production is forecast to decline to 333,000 barrels a day, an 11% decrease from 2019–2020. Condensate output was negatively affected by the temporary closure of the Prelude FLNG project, which was offline from February 2020 to January 2021. Gorgon has also been experiencing technical issues, but is expected to return to nameplate capacity in the September quarter 2021 (see the gas chapter).
Beyond the outlook period, final investment decisions (FIDs) for several gas projects may affect future condensate and LPG production, with the production of both commodities typically associated with gas production (see the gas chapter).
Figure 8.8: Composition of Australian oil production
Source: Australian Bureau of Statistics (2021); Department of Industry, Science, Energy and Resources (2021)
0
20
40
60
80
Dec-2018 Dec-2019 Dec-2020 Dec-2021 Dec-2022 Dec-2023
US$
a b
arre
l
West-Texas Intermediate Brent
0
100
200
300
400
500
600
2012–13 2014–15 2016–17 2018–19 2020–21 2022–23Th
ousa
nd b
arre
ls a
day
Crude oil Condensate LPG
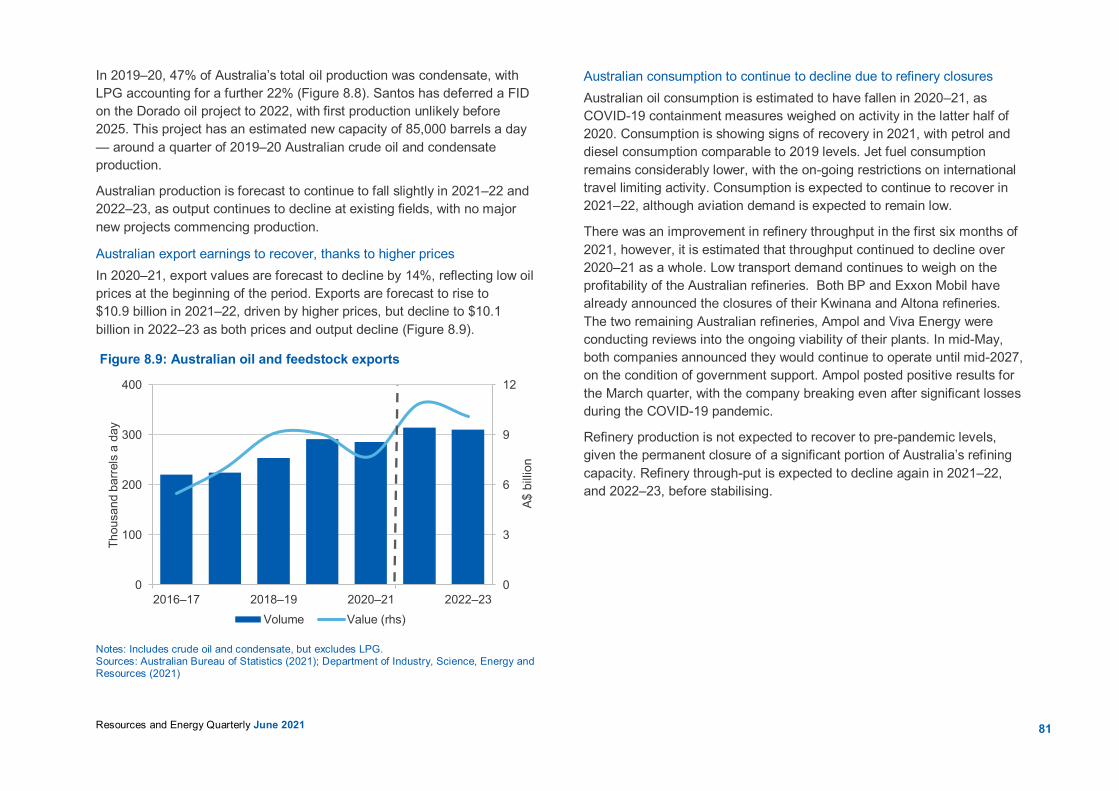
81Resources and Energy Quarterly June 2021
In 2019–20, 47% of Australia’s total oil production was condensate, with LPG accounting for a further 22% (Figure 8.8). Santos has deferred a FID on the Dorado oil project to 2022, with first production unlikely before 2025. This project has an estimated new capacity of 85,000 barrels a day — around a quarter of 2019–20 Australian crude oil and condensate production.
Australian production is forecast to continue to fall slightly in 2021–22 and 2022–23, as output continues to decline at existing fields, with no major new projects commencing production.
Australian export earnings to recover, thanks to higher prices In 2020–21, export values are forecast to decline by 14%, reflecting low oil prices at the beginning of the period. Exports are forecast to rise to $10.9 billion in 2021–22, driven by higher prices, but decline to $10.1 billion in 2022–23 as both prices and output decline (Figure 8.9).
Figure 8.9: Australian oil and feedstock exports
Notes: Includes crude oil and condensate, but excludes LPG. Sources: Australian Bureau of Statistics (2021); Department of Industry, Science, Energy and Resources (2021)
Australian consumption to continue to decline due to refinery closures Australian oil consumption is estimated to have fallen in 2020–21, as COVID-19 containment measures weighed on activity in the latter half of 2020. Consumption is showing signs of recovery in 2021, with petrol and diesel consumption comparable to 2019 levels. Jet fuel consumption remains considerably lower, with the on-going restrictions on international travel limiting activity. Consumption is expected to continue to recover in 2021–22, although aviation demand is expected to remain low.
There was an improvement in refinery throughput in the first six months of 2021, however, it is estimated that throughput continued to decline over 2020–21 as a whole. Low transport demand continues to weigh on the profitability of the Australian refineries. Both BP and Exxon Mobil have already announced the closures of their Kwinana and Altona refineries. The two remaining Australian refineries, Ampol and Viva Energy were conducting reviews into the ongoing viability of their plants. In mid-May, both companies announced they would continue to operate until mid-2027, on the condition of government support. Ampol posted positive results for the March quarter, with the company breaking even after significant losses during the COVID-19 pandemic.
Refinery production is not expected to recover to pre-pandemic levels, given the permanent closure of a significant portion of Australia’s refining capacity. Refinery through-put is expected to decline again in 2021–22, and 2022–23, before stabilising.
0
3
6
9
12
0
100
200
300
400
2016–17 2018–19 2020–21 2022–23
A$ b
illio
n
Thou
sand
bar
rels
a d
ay
Volume Value (rhs)
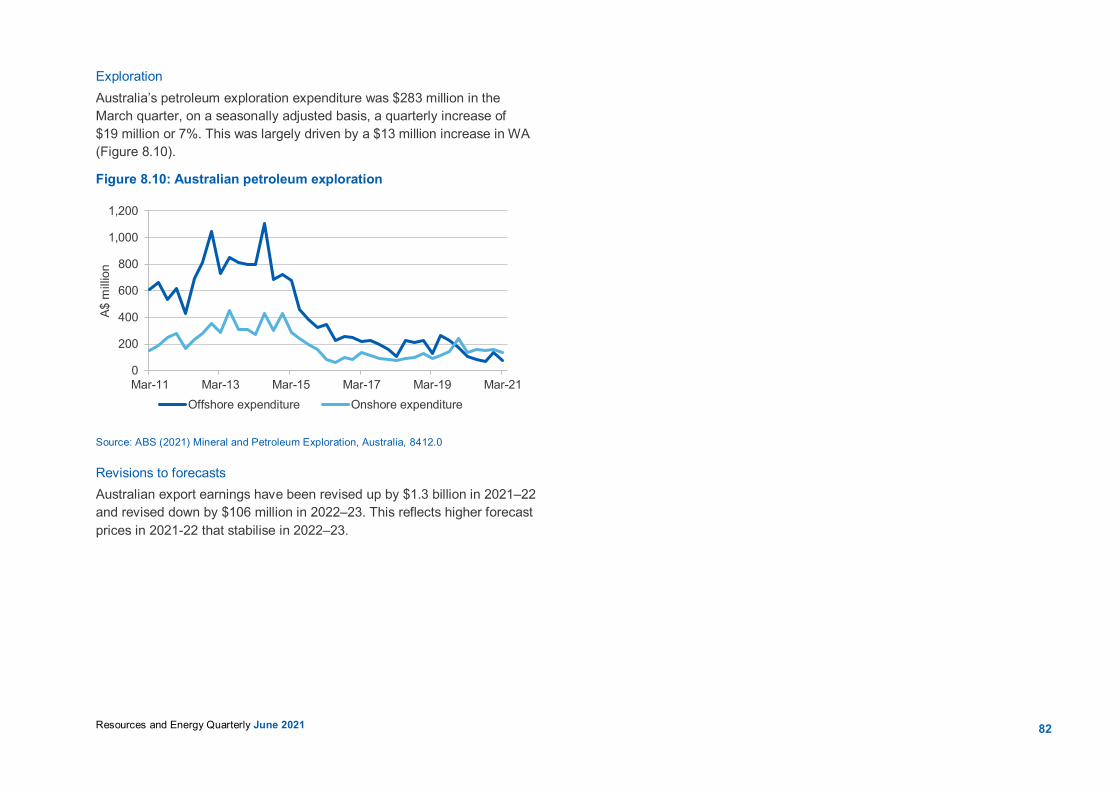
82Resources and Energy Quarterly June 2021
Exploration Australia’s petroleum exploration expenditure was $283 million in the March quarter, on a seasonally adjusted basis, a quarterly increase of $19 million or 7%. This was largely driven by a $13 million increase in WA (Figure 8.10).
Figure 8.10: Australian petroleum exploration
Xx Paste figure here xx Source: ABS (2021) Mineral and Petroleum Exploration, Australia, 8412.0
Revisions to forecasts Australian export earnings have been revised up by $1.3 billion in 2021–22 and revised down by $106 million in 2022–23. This reflects higher forecast prices in 2021-22 that stabilise in 2022–23.
0
200
400
600
800
1,000
1,200
Mar-11 Mar-13 Mar-15 Mar-17 Mar-19 Mar-21
A$ m
illio
n
Offshore expenditure Onshore expenditure
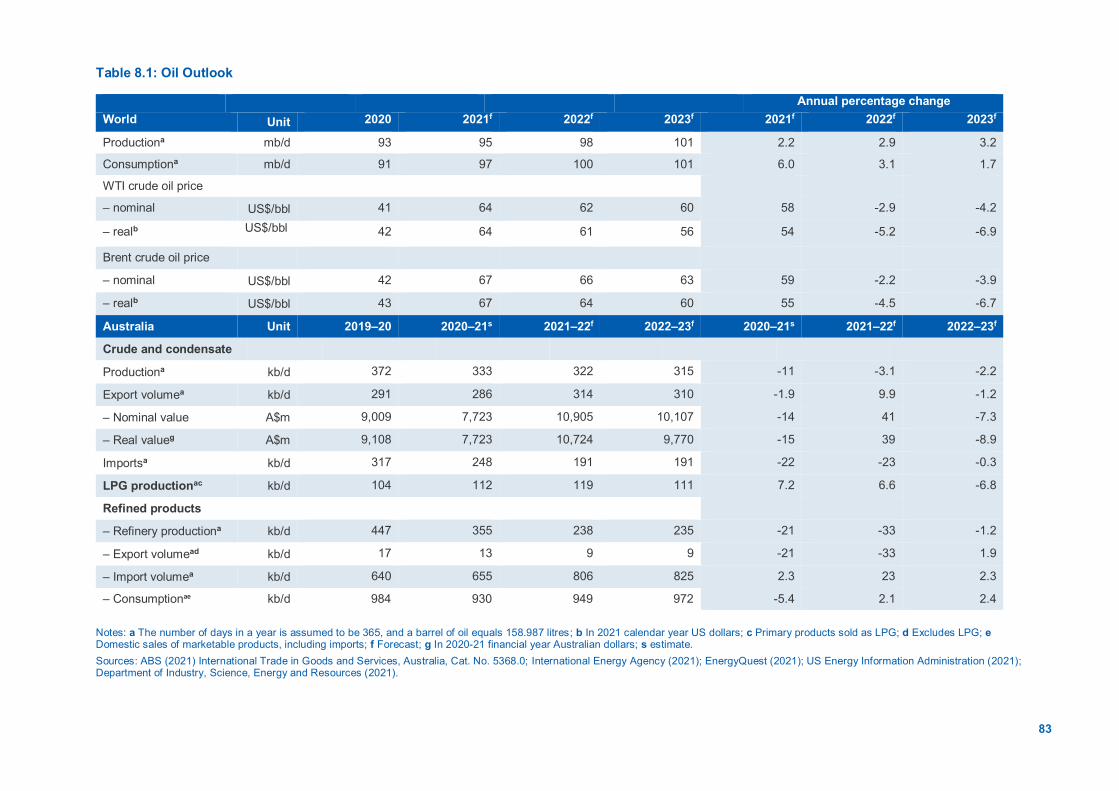
83
Table 8.1: Oil Outlook
Notes: a The number of days in a year is assumed to be 365, and a barrel of oil equals 158.987 litres; b In 2021 calendar year US dollars; c Primary products sold as LPG; d Excludes LPG; e Domestic sales of marketable products, including imports; f Forecast; g In 2020-21 financial year Australian dollars; s estimate. Sources: ABS (2021) International Trade in Goods and Services, Australia, Cat. No. 5368.0; International Energy Agency (2021); EnergyQuest (2021); US Energy Information Administration (2021); Department of Industry, Science, Energy and Resources (2021).
Annual percentage change World Unit 2020 2021f 2022f 2023f 2021f 2022f 2023f
Productiona mb/d 93 95 98 101 2.2 2.9 3.2
Consumptiona mb/d 91 97 100 101 6.0 3.1 1.7
WTI crude oil price
– nominal US$/bbl 41 64 62 60 58 -2.9 -4.2
– realb US$/bbl 42 64 61 56 54 -5.2 -6.9
Brent crude oil price
– nominal US$/bbl 42 67 66 63 59 -2.2 -3.9
– realb US$/bbl 43 67 64 60 55 -4.5 -6.7
Australia Unit 2019–20 2020–21s 2021–22f 2022–23f 2020–21s 2021–22f 2022–23f
Crude and condensate
Productiona kb/d 372 333 322 315 -11 -3.1 -2.2
Export volumea kb/d 291 286 314 310 -1.9 9.9 -1.2
– Nominal value A$m 9,009 7,723 10,905 10,107 -14 41 -7.3
– Real valueg A$m 9,108 7,723 10,724 9,770 -15 39 -8.9
Importsa kb/d 317 248 191 191 -22 -23 -0.3
LPG productionac kb/d 104 112 119 111 7.2 6.6 -6.8
Refined products
– Refinery productiona kb/d 447 355 238 235 -21 -33 -1.2
– Export volumead kb/d 17 13 9 9 -21 -33 1.9
– Import volumea kb/d 640 655 806 825 2.3 23 2.3
– Consumptionae kb/d 984 930 949 972 -5.4 2.1 2.4
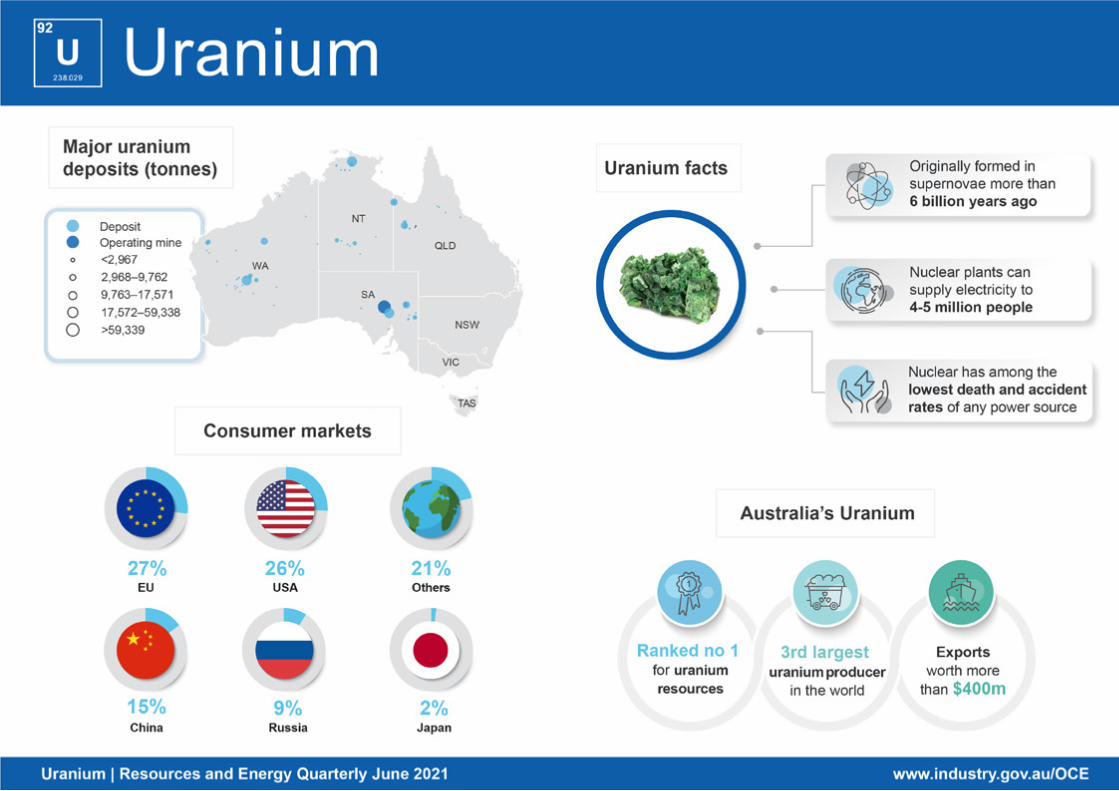
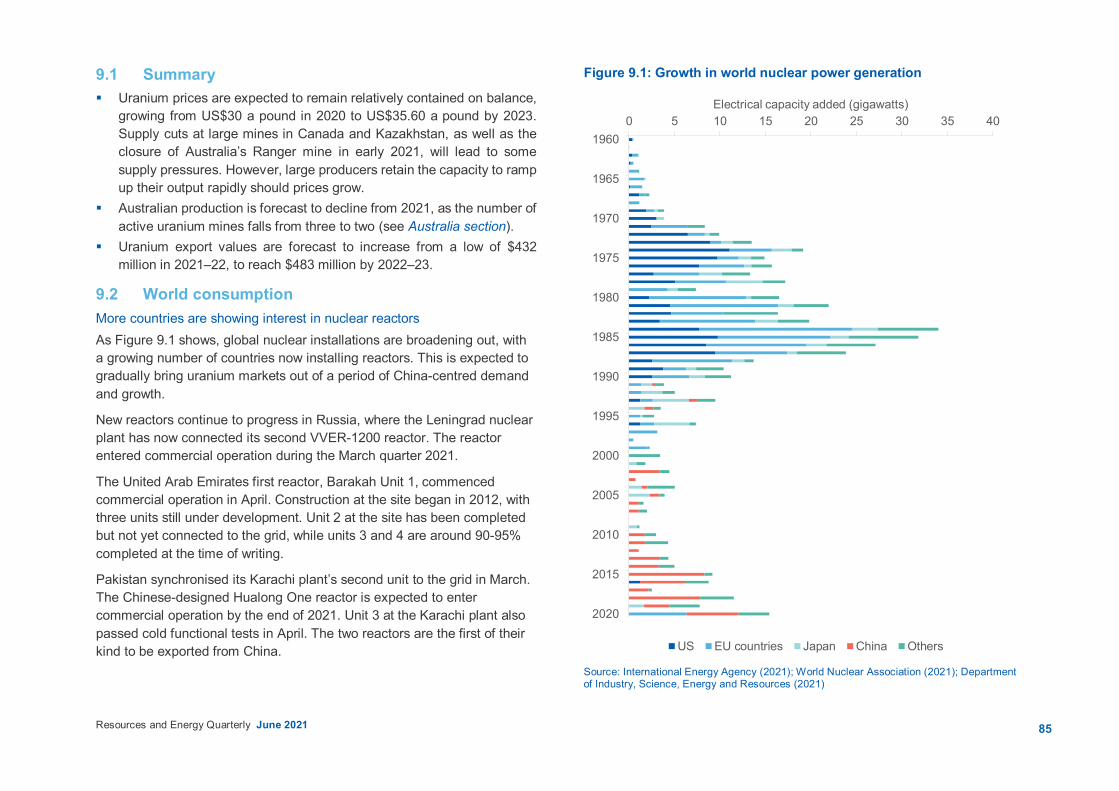
85Resources and Energy Quarterly June 2021
9.1 Summary Uranium prices are expected to remain relatively contained on balance,
growing from US$30 a pound in 2020 to US$35.60 a pound by 2023. Supply cuts at large mines in Canada and Kazakhstan, as well as the closure of Australia’s Ranger mine in early 2021, will lead to some supply pressures. However, large producers retain the capacity to ramp up their output rapidly should prices grow.
Australian production is forecast to decline from 2021, as the number of active uranium mines falls from three to two (see Australia section).
Uranium export values are forecast to increase from a low of $432 million in 2021–22, to reach $483 million by 2022–23.
9.2 World consumption More countries are showing interest in nuclear reactors As Figure 9.1 shows, global nuclear installations are broadening out, with a growing number of countries now installing reactors. This is expected to gradually bring uranium markets out of a period of China-centred demand and growth.
New reactors continue to progress in Russia, where the Leningrad nuclear plant has now connected its second VVER-1200 reactor. The reactor entered commercial operation during the March quarter 2021.
The United Arab Emirates first reactor, Barakah Unit 1, commenced commercial operation in April. Construction at the site began in 2012, with three units still under development. Unit 2 at the site has been completed but not yet connected to the grid, while units 3 and 4 are around 90-95% completed at the time of writing.
Pakistan synchronised its Karachi plant’s second unit to the grid in March. The Chinese-designed Hualong One reactor is expected to enter commercial operation by the end of 2021. Unit 3 at the Karachi plant also passed cold functional tests in April. The two reactors are the first of their kind to be exported from China.
Figure 9.1: Growth in world nuclear power generation
Source: International Energy Agency (2021); World Nuclear Association (2021); Department of Industry, Science, Energy and Resources (2021)
0 5 10 15 20 25 30 35 401960
1965
1970
1975
1980
1985
1990
1995
2000
2005
2010
2015
2020
Electrical capacity added (gigawatts)
US EU countries Japan China Others

86Resources and Energy Quarterly June 2021
Bangladesh’s Rooppur plant passed key milestones in the March quarter 2021, with hydraulic tests now completed on the pressure vessel. The plant is the country’s first nuclear facility, and is expected to deliver 2.4 GWe annually to the country’s power grid from 2023.
Estonia is considering commencing a nuclear energy program, with the government forming a nuclear energy working group to review the possibilities. The working group is expected to deliver its recommendations by mid- or late-2022.
In the UK, the Office for Nuclear Regulation has announced that reactors 3 and 4 at Hinkley Point B will be allowed to return to service for an extended period, after completing a safety check.
Fuel loading has been completed at the Olkiluoto 3 EPR site in Finland. The reactor, which has been under construction for 15 years, is expected to commence commercial operation in early 2022. However, the country’s Hanhikivi 1 nuclear power plant is now likely to enter operation a year later than initially expected, with the owners postponing their expected date of commercial operation to 2029.
In Japan, Takahama units 1 and 2 and Mihama unit 3 are set to resume operation, following a final approval from the Fukui Prefecture.
Reactor construction also continues in China, with concrete recently being poured for unit 3 of Changjiang’s nuclear plant in Hainan. Progress is also underway on unit 4 at the same site. Tianwan nuclear plant’s unit 6 entered full commercial operation in the first week of June 2021, having completed the final stages of operational testing.
On balance, uranium consumption is expected to pick up only marginally in the short term, though with some diversification of demand sources (Figures 9.2 and 9.3).
However, signs may be more positive for uranium producers over the longer term. In recent years, US research and development into nuclear energy has picked up, with the US Department of Defence scheduling full-power testing for its first mobile reactor in 2023.
Figure 9.2: World uranium consumption and inventory build (U3O8)
Source: International Energy Agency (2021); World Nuclear Association (2021); Ux Consulting (2021)
Figure 9.3: New nuclear capacity: medium-term expansion
Source: International Energy Agency (2021); World Nuclear Association (2021); Department of Industry, Science, Energy and Resources (2021)
0
20
40
60
80
100
120
2011 2013 2015 2017 2019 2021 2023
Thou
sand
tonn
es
China European Union Japan RussiaUnited States Others Inventories Total production
0
20
40
60
China OtherAsia
EasternEurope
NorthAmerica
WesternEurope
Africa &MiddleEast
SouthAmerica
Gig
awat
ts e
lect
ric
Under construction Planned

87Resources and Energy Quarterly June 2021
The US Administration has also announced that advanced nuclear reactor development (and a new clean energy standard intended to provide more incentive for the efficient use of nuclear energy) will be included in its expansive infrastructure and clean energy plan.
Small modular reactor technology also continues to draw in new investment. In the US, Energy Northwest, X-energy, and the Grant County Public Utility District have formally partnered to develop and commercialise the US’s first advanced nuclear reactor. The proposed model will be modular and transportable, building on the Xe-100 design developed by X-energy. In Canada, the Federal Government has announced that around US$45 million will be invested in developing small modular technology in New Brunswick.
9.3 World production Large suppliers are shifting back to full production Global supply remains relatively constrained (Figure 9.4), partly due to COVID-19 disruptions, and partly due to deliberate cutbacks in Canada and Kazakhstan. The closure of the Ranger mine in Australia is also likely to constrain supply over coming years (see Australia section), although high inventories will likely ensure adequate availability in most places.
Operations at Niger’s Cominak uranium mine were concluded in March 2021, with the mine largely depleted after 40 years of production. Remediation at the site is set to begin shortly.
Offsetting this, production is now re-commencing at Cameco’s large Cigar Lake uranium mine in Canada. This follows a suspension in late 2020, when the company was dealing with low prices and potential disruption from the COVID-19 pandemic. Orano Canada has also announced that operations will resume at the McClean Lake uranium mill. Taken together, the two operations are substantial, and their re-opening is likely to help ease price pressures over the remainder of 2021.
Figure 9.4: World uranium production and secondary supply (U3O8)
Source: International Energy Agency (2021); World Nuclear Association (2021); Ux Consulting (2021)
9.4 Prices Prices are expected to rise slowly over the outlook period Uranium prices remain relatively subdued in early 2021 (Figure 9.5), failing to recapture the brief surge of March and April of 2020, when prices peaked above US$30 a pound. The 2020 price peak was also driven by suspensions of output from the large Cigar Lake mine in Canada, but an imminent return to regular operations at the site will likely see some of this effect unwind.
Sellers in the uranium spot market continue to outnumber buyers, though some price pressure may feed through over time as utilities gradually return to the spot market. On balance, it is expected that prices will shift up slowly over the next two years, reaching just over US$35 a pound by 2023.
0
20
40
60
80
100
120
2011 2013 2015 2017 2019 2021 2023
Thou
sand
tonn
es
Kazakhstan Canada AustraliaAfrica Russia OthersSecondary supply Total consumption
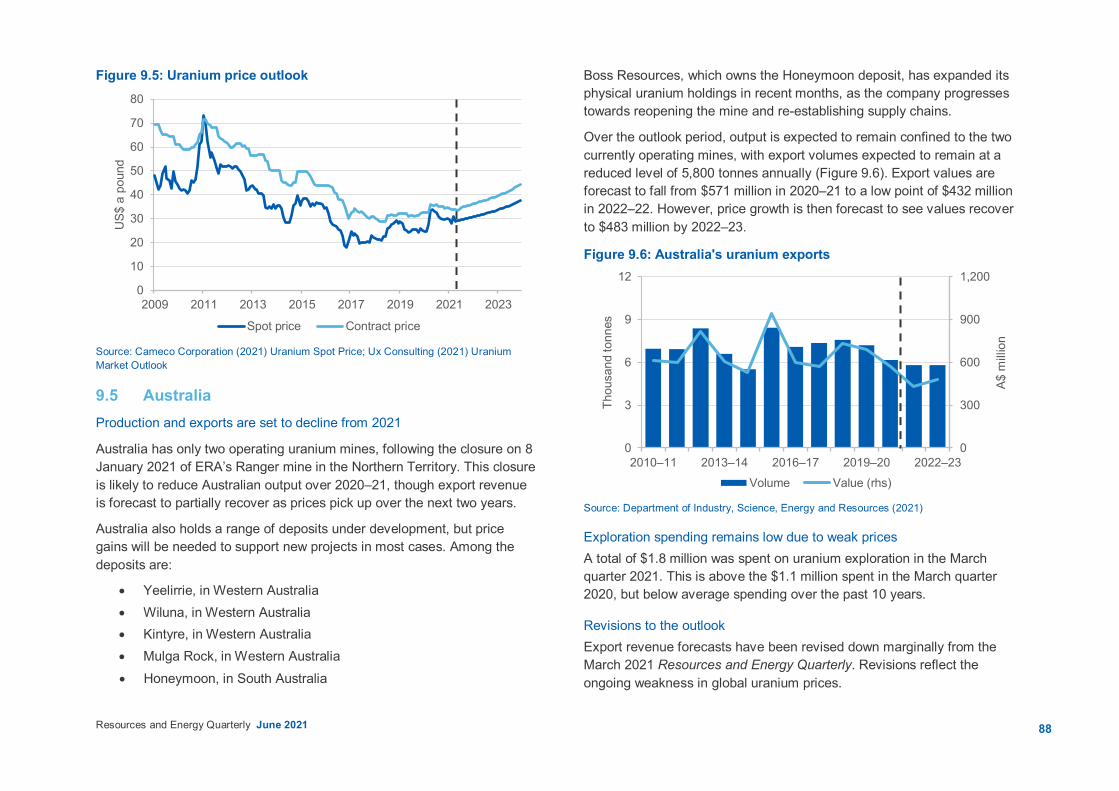
88Resources and Energy Quarterly June 2021
Figure 9.5: Uranium price outlook
Source: Cameco Corporation (2021) Uranium Spot Price; Ux Consulting (2021) Uranium Market Outlook
9.5 Australia Production and exports are set to decline from 2021
Australia has only two operating uranium mines, following the closure on 8 January 2021 of ERA’s Ranger mine in the Northern Territory. This closure is likely to reduce Australian output over 2020–21, though export revenue is forecast to partially recover as prices pick up over the next two years.
Australia also holds a range of deposits under development, but price gains will be needed to support new projects in most cases. Among the deposits are:
Yeelirrie, in Western Australia Wiluna, in Western Australia Kintyre, in Western Australia Mulga Rock, in Western Australia Honeymoon, in South Australia
Boss Resources, which owns the Honeymoon deposit, has expanded its physical uranium holdings in recent months, as the company progresses towards reopening the mine and re-establishing supply chains.
Over the outlook period, output is expected to remain confined to the two currently operating mines, with export volumes expected to remain at a reduced level of 5,800 tonnes annually (Figure 9.6). Export values are forecast to fall from $571 million in 2020–21 to a low point of $432 million in 2022–22. However, price growth is then forecast to see values recover to $483 million by 2022–23.
Figure 9.6: Australia's uranium exports
Source: Department of Industry, Science, Energy and Resources (2021)
Exploration spending remains low due to weak prices A total of $1.8 million was spent on uranium exploration in the March quarter 2021. This is above the $1.1 million spent in the March quarter 2020, but below average spending over the past 10 years.
Revisions to the outlook Export revenue forecasts have been revised down marginally from the March 2021 Resources and Energy Quarterly. Revisions reflect the ongoing weakness in global uranium prices.
0
10
20
30
40
50
60
70
80
2009 2011 2013 2015 2017 2019 2021 2023
US$
a p
ound
Spot price Contract price
0
300
600
900
1,200
0
3
6
9
12
2010–11 2013–14 2016–17 2019–20 2022–23
A$ m
illio
n
Thou
sand
tonn
es
Volume Value (rhs)
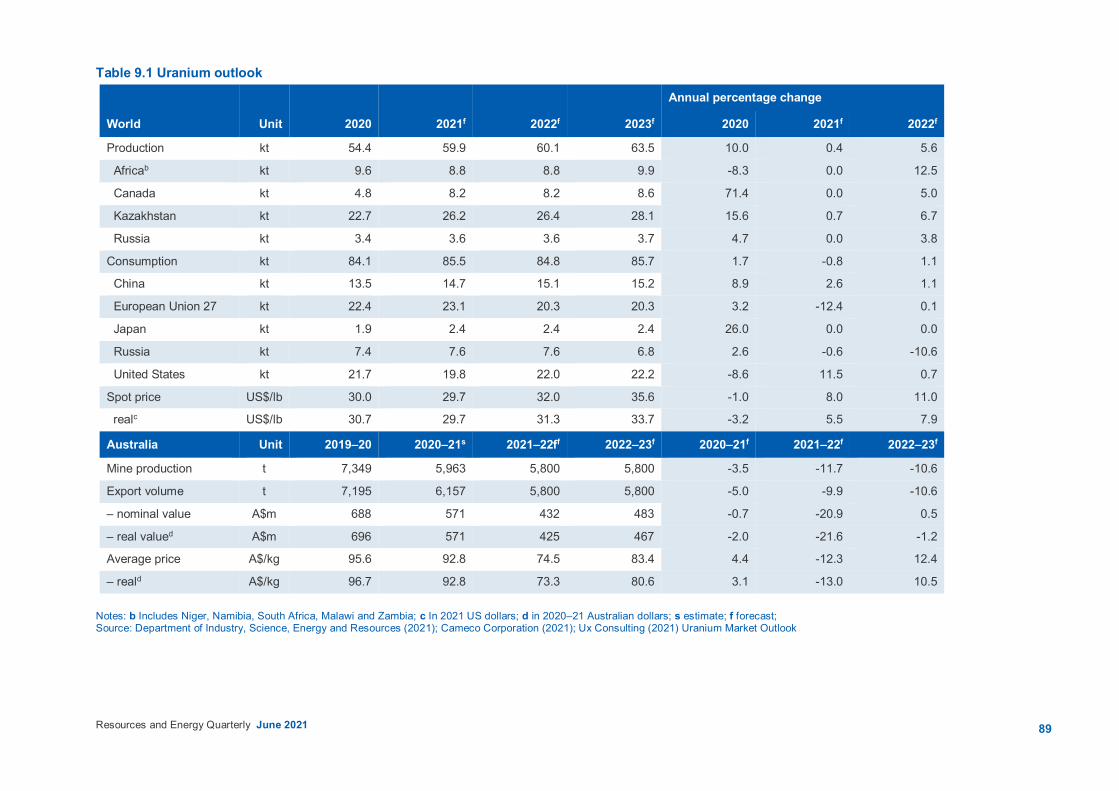
89Resources and Energy Quarterly June 2021
Table 9.1 Uranium outlook
Annual percentage change
World Unit 2020 2021f 2022f 2023f 2020 2021f 2022f
Production kt 54.4 59.9 60.1 63.5 10.0 0.4 5.6
Africab kt 9.6 8.8 8.8 9.9 -8.3 0.0 12.5
Canada kt 4.8 8.2 8.2 8.6 71.4 0.0 5.0
Kazakhstan kt 22.7 26.2 26.4 28.1 15.6 0.7 6.7
Russia kt 3.4 3.6 3.6 3.7 4.7 0.0 3.8
Consumption kt 84.1 85.5 84.8 85.7 1.7 -0.8 1.1
China kt 13.5 14.7 15.1 15.2 8.9 2.6 1.1
European Union 27 kt 22.4 23.1 20.3 20.3 3.2 -12.4 0.1
Japan kt 1.9 2.4 2.4 2.4 26.0 0.0 0.0
Russia kt 7.4 7.6 7.6 6.8 2.6 -0.6 -10.6
United States kt 21.7 19.8 22.0 22.2 -8.6 11.5 0.7
Spot price US$/lb 30.0 29.7 32.0 35.6 -1.0 8.0 11.0
realc US$/lb 30.7 29.7 31.3 33.7 -3.2 5.5 7.9
Australia Unit 2019–20 2020–21s 2021–22ff 2022–23f 2020–21f 2021–22f 2022–23f
Mine production t 7,349 5,963 5,800 5,800 -3.5 -11.7 -10.6
Export volume t 7,195 6,157 5,800 5,800 -5.0 -9.9 -10.6
– nominal value A$m 688 571 432 483 -0.7 -20.9 0.5
– real valued A$m 696 571 425 467 -2.0 -21.6 -1.2
Average price A$/kg 95.6 92.8 74.5 83.4 4.4 -12.3 12.4
– reald A$/kg 96.7 92.8 73.3 80.6 3.1 -13.0 10.5
Notes: b Includes Niger, Namibia, South Africa, Malawi and Zambia; c In 2021 US dollars; d in 2020–21 Australian dollars; s estimate; f forecast; Source: Department of Industry, Science, Energy and Resources (2021); Cameco Corporation (2021); Ux Consulting (2021) Uranium Market Outlook
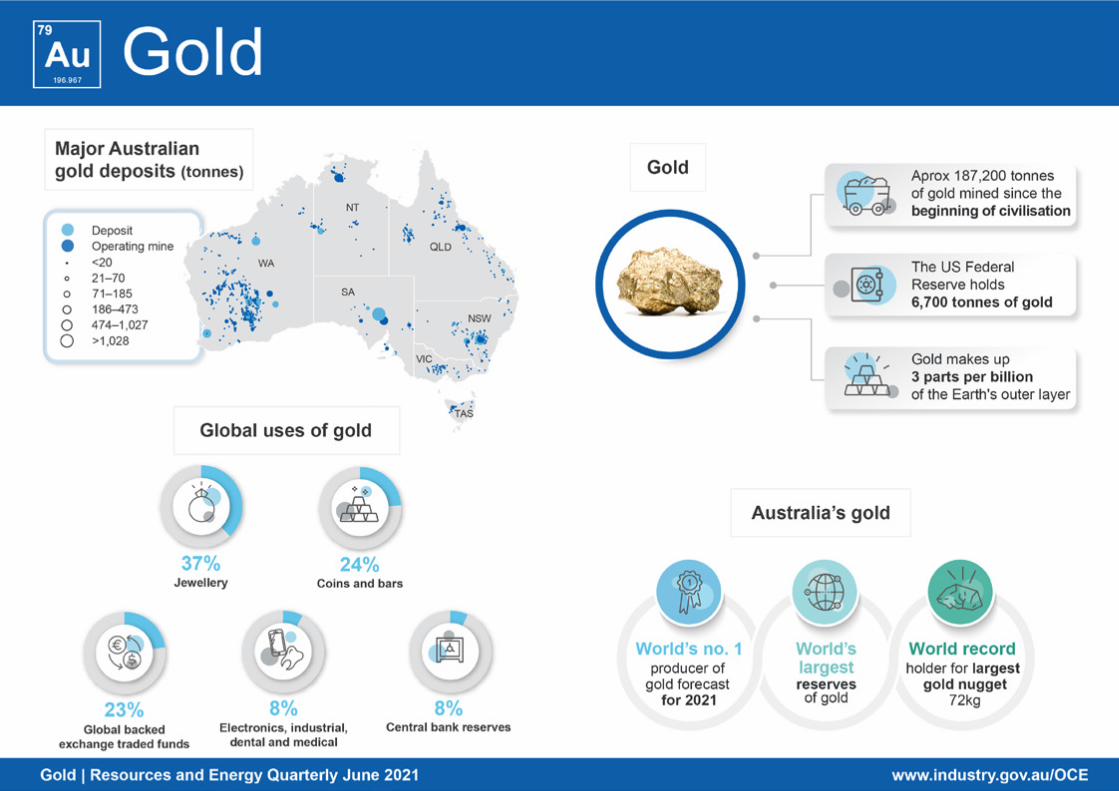
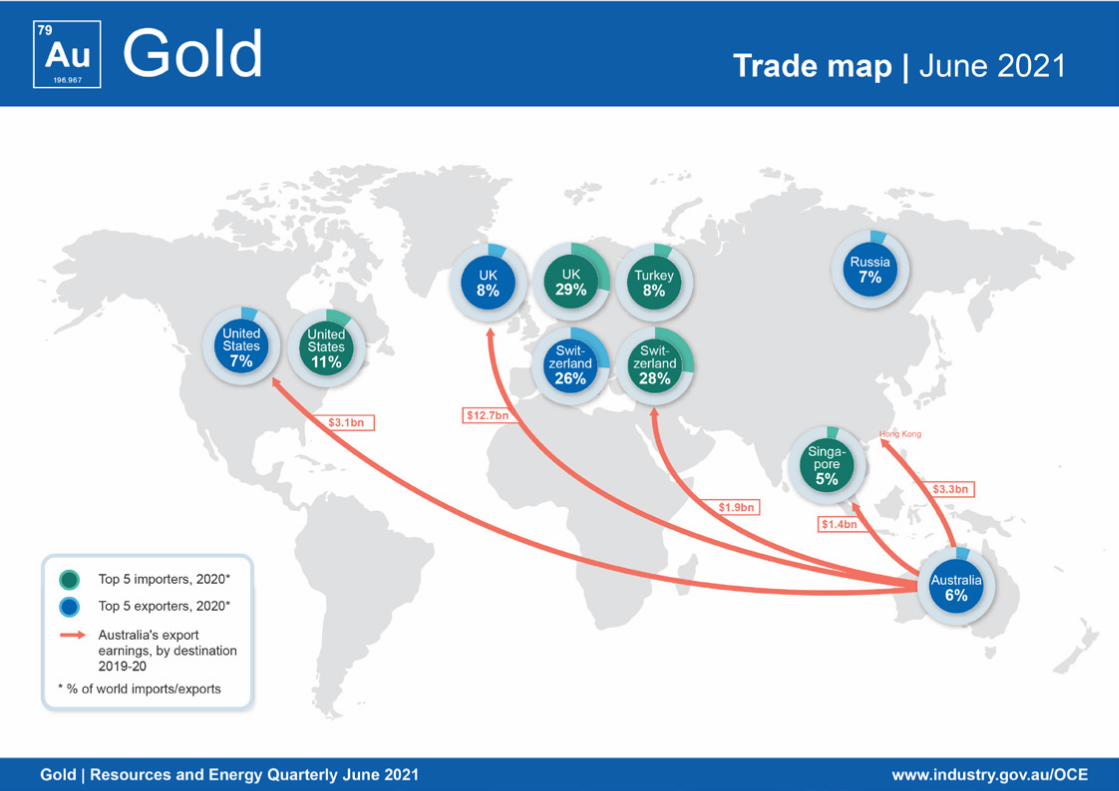

92Resources and Energy Quarterly June 2021
10.1 Summary The price averaged about US$1,800 an ounce in the first half of 2021
— up US$30 an ounce from the 2020 average. This reflects ongoing uncertainty over the COVID-19 pandemic and still-low real US 10-year Treasury bond yields. As the pandemic recedes and the world economy recovers fully, gold prices are forecast to steadily fall in the outlook period, averaging US$1,635 an ounce in 2023.
Labour and skill shortages are affecting Australia’s gold mine production, which is estimated to reach 332 tonnes in 2020–21. Production from new mines and existing mine expansions is expected to boost gold mine production to 388 tonnes in 2022–23 (see Australia section).
Gold export earnings are forecast at $29 billion in 2021–22, before a decline to $28 billion in 2022–23, as gold prices ease back.
10.2 Consumption World gold consumption decreased in the March quarter 2021 World gold demand fell by 23% year-on-year to 816 tonnes in the March quarter 2021. The decline was driven by a strong outflow from gold-backed exchange traded funds (ETFs), which lost nearly 178 tonnes (or US$9.5 billion). An improvement in the global economy and the roll-out of the COVID-19 vaccines led to an exodus of institutional investors’ funds from safe haven assets (such as gold ETFs) to riskier assets.
Over the year to the March quarter 2021, official sector gold buying (that is, from central banks and other government financial institutions) fell by 23% to 95 tonnes. Supporting the economic recovery from the COVID-19 pandemic appears to have been the main catalyst for some central banks’ diminished appetite for gold. According to the World Gold Council, Turkey was the largest gold seller in the March quarter 2021, selling about 32 tonnes of gold. Hungary was the largest gold buyer in the March quarter 2021, buying 63 tonnes of gold.
Figure 10.1: World gold consumption by sector
Source: World Gold Council (2021) Gold Demand Trends; Department of Industry, Science, Energy and Resources (2021) Offsetting the fall in gold-backed ETF holdings and weaker official sector demand has been a rise in consumer demand for gold (jewellery, gold coins and bars). Gold jewellery consumption rose by 52% year-on-year to 477 tonnes in the March quarter 2021, driven by lower gold prices and festival and wedding purchases in China and India — the world’s two largest gold jewellery consuming countries. In China, jewellery demand increased by 212% year-on-year in the March quarter 2021 to 191 tonnes. Over this same period, jewellery demand in India increased by 39% year-on-year to 103 tonnes.
Attracted by lower gold prices, bargain-hunting retail investors returned to the gold bar and coin markets, buying 339 tonnes of gold in the March quarter 2021, a 36% year-on-year rise from the March quarter 2020.
World gold consumption forecast to rise in 2021 Uncertainty persists, due to the uneven pace of the COVID-19 vaccine take-up and rising COVID-19 cases in many nations. This uncertainty is helping to maintain investor demand for gold.
0
1,000
2,000
3,000
4,000
5,000
2013 2015 2017 2019 2021 2023
Tonn
es
Total Fabricated Investment Official sector
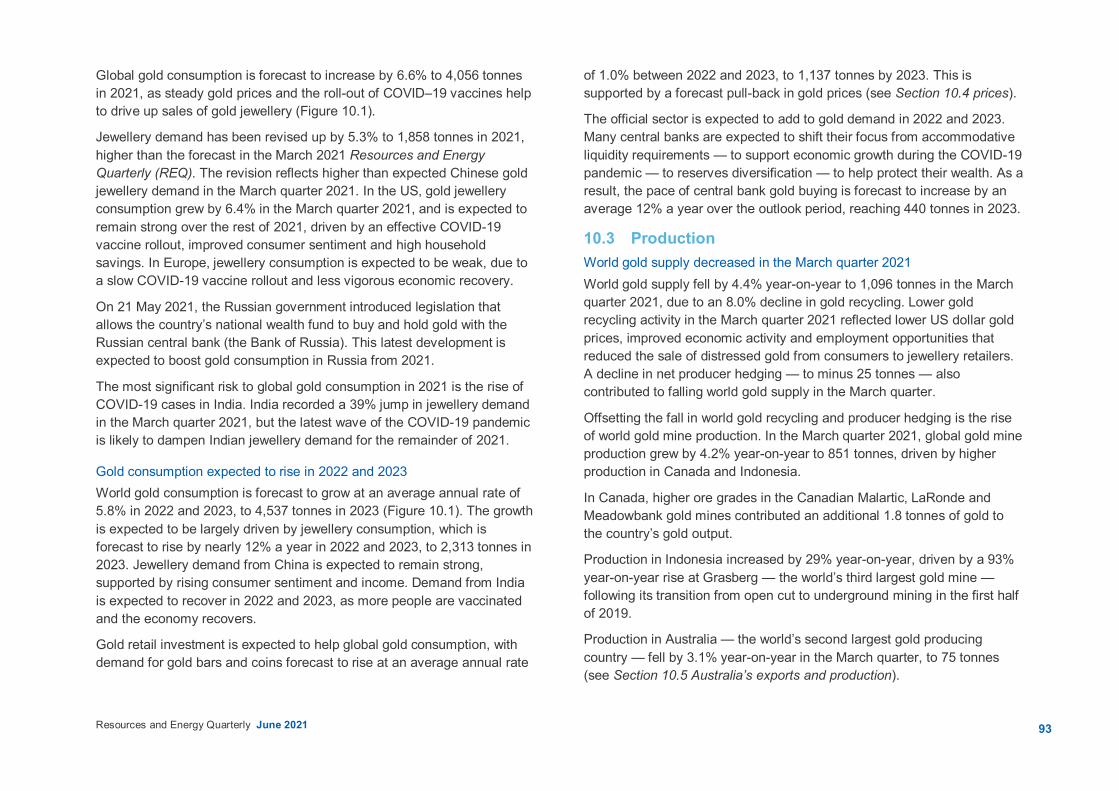
93Resources and Energy Quarterly June 2021
Global gold consumption is forecast to increase by 6.6% to 4,056 tonnes in 2021, as steady gold prices and the roll-out of COVID–19 vaccines help to drive up sales of gold jewellery (Figure 10.1).
Jewellery demand has been revised up by 5.3% to 1,858 tonnes in 2021, higher than the forecast in the March 2021 Resources and Energy Quarterly (REQ). The revision reflects higher than expected Chinese gold jewellery demand in the March quarter 2021. In the US, gold jewellery consumption grew by 6.4% in the March quarter 2021, and is expected to remain strong over the rest of 2021, driven by an effective COVID-19 vaccine rollout, improved consumer sentiment and high household savings. In Europe, jewellery consumption is expected to be weak, due to a slow COVID-19 vaccine rollout and less vigorous economic recovery.
On 21 May 2021, the Russian government introduced legislation that allows the country’s national wealth fund to buy and hold gold with the Russian central bank (the Bank of Russia). This latest development is expected to boost gold consumption in Russia from 2021.
The most significant risk to global gold consumption in 2021 is the rise of COVID-19 cases in India. India recorded a 39% jump in jewellery demand in the March quarter 2021, but the latest wave of the COVID-19 pandemic is likely to dampen Indian jewellery demand for the remainder of 2021.
Gold consumption expected to rise in 2022 and 2023 World gold consumption is forecast to grow at an average annual rate of 5.8% in 2022 and 2023, to 4,537 tonnes in 2023 (Figure 10.1). The growth is expected to be largely driven by jewellery consumption, which is forecast to rise by nearly 12% a year in 2022 and 2023, to 2,313 tonnes in 2023. Jewellery demand from China is expected to remain strong, supported by rising consumer sentiment and income. Demand from India is expected to recover in 2022 and 2023, as more people are vaccinated and the economy recovers.
Gold retail investment is expected to help global gold consumption, with demand for gold bars and coins forecast to rise at an average annual rate
of 1.0% between 2022 and 2023, to 1,137 tonnes by 2023. This is supported by a forecast pull-back in gold prices (see Section 10.4 prices).
The official sector is expected to add to gold demand in 2022 and 2023. Many central banks are expected to shift their focus from accommodative liquidity requirements — to support economic growth during the COVID-19 pandemic — to reserves diversification — to help protect their wealth. As a result, the pace of central bank gold buying is forecast to increase by an average 12% a year over the outlook period, reaching 440 tonnes in 2023.
10.3 Production World gold supply decreased in the March quarter 2021 World gold supply fell by 4.4% year-on-year to 1,096 tonnes in the March quarter 2021, due to an 8.0% decline in gold recycling. Lower gold recycling activity in the March quarter 2021 reflected lower US dollar gold prices, improved economic activity and employment opportunities that reduced the sale of distressed gold from consumers to jewellery retailers. A decline in net producer hedging — to minus 25 tonnes — also contributed to falling world gold supply in the March quarter.
Offsetting the fall in world gold recycling and producer hedging is the rise of world gold mine production. In the March quarter 2021, global gold mine production grew by 4.2% year-on-year to 851 tonnes, driven by higher production in Canada and Indonesia.
In Canada, higher ore grades in the Canadian Malartic, LaRonde and Meadowbank gold mines contributed an additional 1.8 tonnes of gold to the country’s gold output.
Production in Indonesia increased by 29% year-on-year, driven by a 93% year-on-year rise at Grasberg — the world’s third largest gold mine — following its transition from open cut to underground mining in the first half of 2019.
Production in Australia — the world’s second largest gold producing country — fell by 3.1% year-on-year in the March quarter, to 75 tonnes (see Section 10.5 Australia’s exports and production).
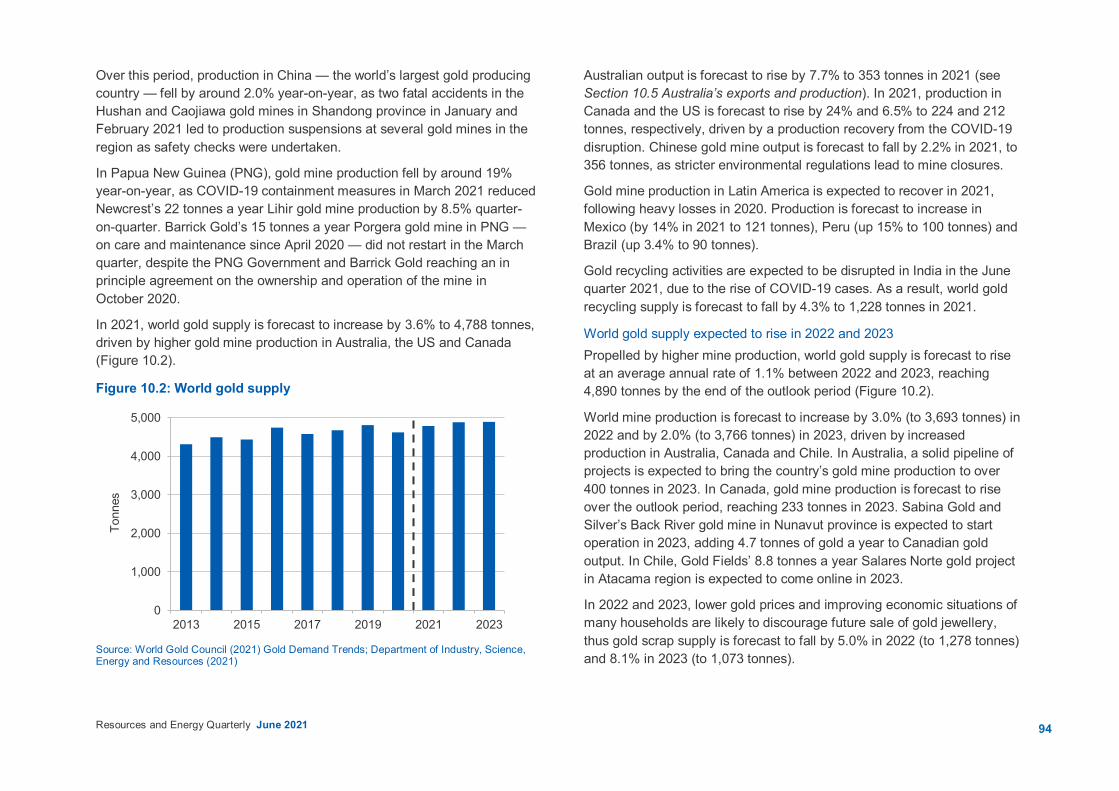
94Resources and Energy Quarterly June 2021
Over this period, production in China — the world’s largest gold producing country — fell by around 2.0% year-on-year, as two fatal accidents in the Hushan and Caojiawa gold mines in Shandong province in January and February 2021 led to production suspensions at several gold mines in the region as safety checks were undertaken.
In Papua New Guinea (PNG), gold mine production fell by around 19% year-on-year, as COVID-19 containment measures in March 2021 reduced Newcrest’s 22 tonnes a year Lihir gold mine production by 8.5% quarter-on-quarter. Barrick Gold’s 15 tonnes a year Porgera gold mine in PNG — on care and maintenance since April 2020 — did not restart in the March quarter, despite the PNG Government and Barrick Gold reaching an in principle agreement on the ownership and operation of the mine in October 2020.
In 2021, world gold supply is forecast to increase by 3.6% to 4,788 tonnes, driven by higher gold mine production in Australia, the US and Canada (Figure 10.2).
Figure 10.2: World gold supply
Source: World Gold Council (2021) Gold Demand Trends; Department of Industry, Science, Energy and Resources (2021)
Australian output is forecast to rise by 7.7% to 353 tonnes in 2021 (see Section 10.5 Australia’s exports and production). In 2021, production in Canada and the US is forecast to rise by 24% and 6.5% to 224 and 212 tonnes, respectively, driven by a production recovery from the COVID-19 disruption. Chinese gold mine output is forecast to fall by 2.2% in 2021, to 356 tonnes, as stricter environmental regulations lead to mine closures.
Gold mine production in Latin America is expected to recover in 2021, following heavy losses in 2020. Production is forecast to increase in Mexico (by 14% in 2021 to 121 tonnes), Peru (up 15% to 100 tonnes) and Brazil (up 3.4% to 90 tonnes).
Gold recycling activities are expected to be disrupted in India in the June quarter 2021, due to the rise of COVID-19 cases. As a result, world gold recycling supply is forecast to fall by 4.3% to 1,228 tonnes in 2021.
World gold supply expected to rise in 2022 and 2023 Propelled by higher mine production, world gold supply is forecast to rise at an average annual rate of 1.1% between 2022 and 2023, reaching 4,890 tonnes by the end of the outlook period (Figure 10.2).
World mine production is forecast to increase by 3.0% (to 3,693 tonnes) in 2022 and by 2.0% (to 3,766 tonnes) in 2023, driven by increased production in Australia, Canada and Chile. In Australia, a solid pipeline of projects is expected to bring the country’s gold mine production to over 400 tonnes in 2023. In Canada, gold mine production is forecast to rise over the outlook period, reaching 233 tonnes in 2023. Sabina Gold and Silver’s Back River gold mine in Nunavut province is expected to start operation in 2023, adding 4.7 tonnes of gold a year to Canadian gold output. In Chile, Gold Fields’ 8.8 tonnes a year Salares Norte gold project in Atacama region is expected to come online in 2023.
In 2022 and 2023, lower gold prices and improving economic situations of many households are likely to discourage future sale of gold jewellery, thus gold scrap supply is forecast to fall by 5.0% in 2022 (to 1,278 tonnes) and 8.1% in 2023 (to 1,073 tonnes).
0
1,000
2,000
3,000
4,000
5,000
2013 2015 2017 2019 2021 2023
Tonn
es
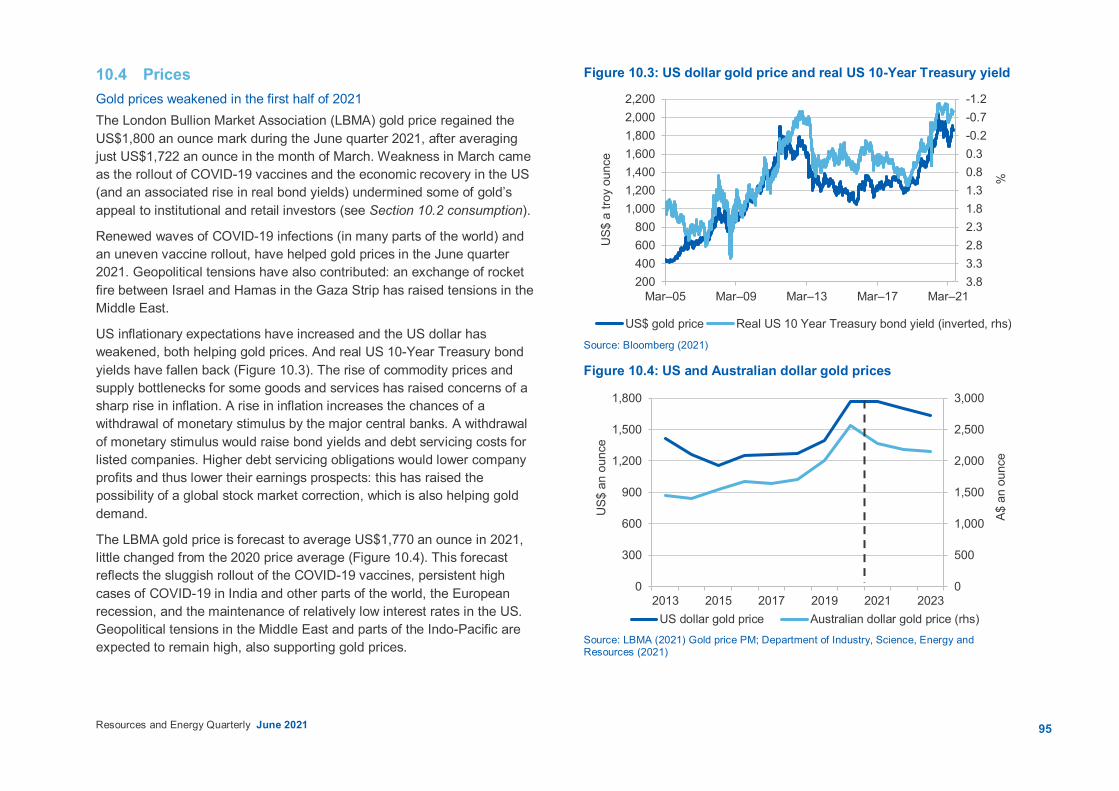
95Resources and Energy Quarterly June 2021
10.4 Prices Gold prices weakened in the first half of 2021 The London Bullion Market Association (LBMA) gold price regained the US$1,800 an ounce mark during the June quarter 2021, after averaging just US$1,722 an ounce in the month of March. Weakness in March came as the rollout of COVID-19 vaccines and the economic recovery in the US (and an associated rise in real bond yields) undermined some of gold’s appeal to institutional and retail investors (see Section 10.2 consumption).
Renewed waves of COVID-19 infections (in many parts of the world) and an uneven vaccine rollout, have helped gold prices in the June quarter 2021. Geopolitical tensions have also contributed: an exchange of rocket fire between Israel and Hamas in the Gaza Strip has raised tensions in the Middle East.
US inflationary expectations have increased and the US dollar has weakened, both helping gold prices. And real US 10-Year Treasury bond yields have fallen back (Figure 10.3). The rise of commodity prices and supply bottlenecks for some goods and services has raised concerns of a sharp rise in inflation. A rise in inflation increases the chances of a withdrawal of monetary stimulus by the major central banks. A withdrawal of monetary stimulus would raise bond yields and debt servicing costs for listed companies. Higher debt servicing obligations would lower company profits and thus lower their earnings prospects: this has raised the possibility of a global stock market correction, which is also helping gold demand.
The LBMA gold price is forecast to average US$1,770 an ounce in 2021, little changed from the 2020 price average (Figure 10.4). This forecast reflects the sluggish rollout of the COVID-19 vaccines, persistent high cases of COVID-19 in India and other parts of the world, the European recession, and the maintenance of relatively low interest rates in the US. Geopolitical tensions in the Middle East and parts of the Indo-Pacific are expected to remain high, also supporting gold prices.
Figure 10.3: US dollar gold price and real US 10-Year Treasury yield
Source: Bloomberg (2021)
Figure 10.4: US and Australian dollar gold prices
Source: LBMA (2021) Gold price PM; Department of Industry, Science, Energy and Resources (2021)
-1.2-0.7-0.20.30.81.31.82.32.83.33.8200
400600800
1,0001,2001,4001,6001,8002,0002,200
Mar–05 Mar–09 Mar–13 Mar–17 Mar–21
%
US$
a tr
oy o
unce
US$ gold price Real US 10 Year Treasury bond yield (inverted, rhs)
0
500
1,000
1,500
2,000
2,500
3,000
0
300
600
900
1,200
1,500
1,800
2013 2015 2017 2019 2021 2023
A$ a
n ou
nce
US$
an
ounc
eUS dollar gold price Australian dollar gold price (rhs)
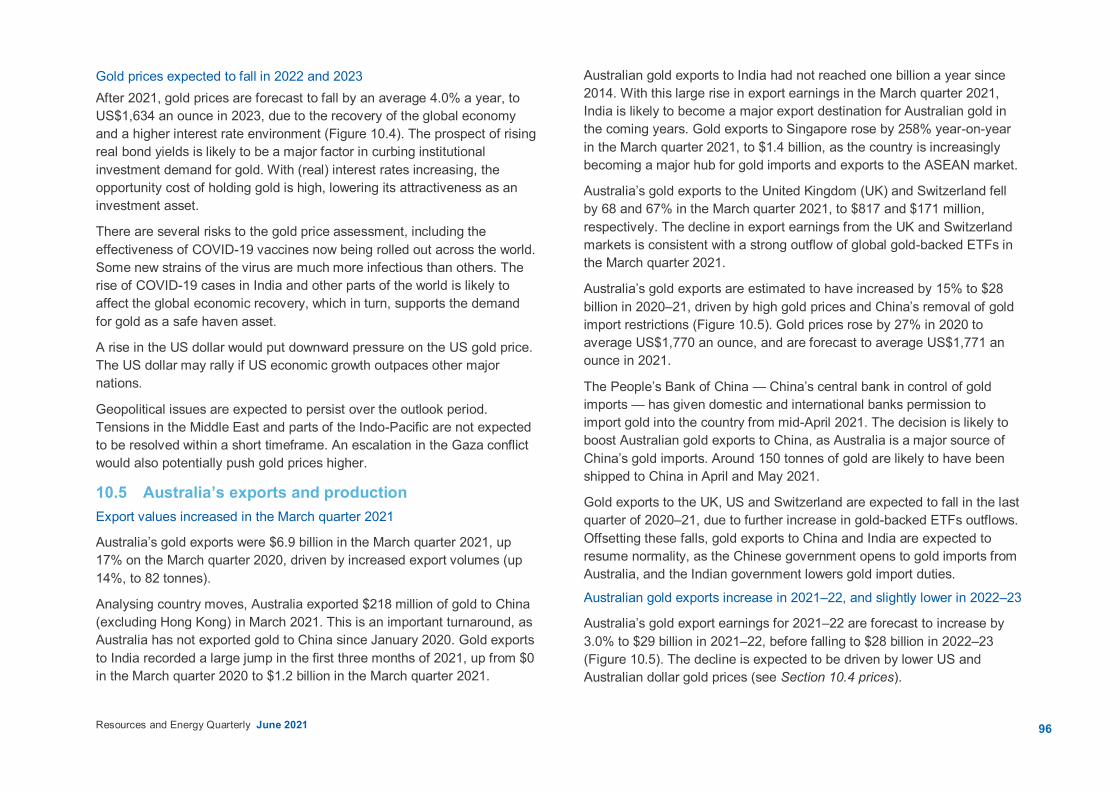
96Resources and Energy Quarterly June 2021
Gold prices expected to fall in 2022 and 2023 After 2021, gold prices are forecast to fall by an average 4.0% a year, to US$1,634 an ounce in 2023, due to the recovery of the global economy and a higher interest rate environment (Figure 10.4). The prospect of rising real bond yields is likely to be a major factor in curbing institutional investment demand for gold. With (real) interest rates increasing, the opportunity cost of holding gold is high, lowering its attractiveness as an investment asset.
There are several risks to the gold price assessment, including the effectiveness of COVID-19 vaccines now being rolled out across the world. Some new strains of the virus are much more infectious than others. The rise of COVID-19 cases in India and other parts of the world is likely to affect the global economic recovery, which in turn, supports the demand for gold as a safe haven asset.
A rise in the US dollar would put downward pressure on the US gold price. The US dollar may rally if US economic growth outpaces other major nations.
Geopolitical issues are expected to persist over the outlook period. Tensions in the Middle East and parts of the Indo-Pacific are not expected to be resolved within a short timeframe. An escalation in the Gaza conflict would also potentially push gold prices higher.
10.5 Australia’s exports and production Export values increased in the March quarter 2021
Australia’s gold exports were $6.9 billion in the March quarter 2021, up 17% on the March quarter 2020, driven by increased export volumes (up 14%, to 82 tonnes).
Analysing country moves, Australia exported $218 million of gold to China (excluding Hong Kong) in March 2021. This is an important turnaround, as Australia has not exported gold to China since January 2020. Gold exports to India recorded a large jump in the first three months of 2021, up from $0 in the March quarter 2020 to $1.2 billion in the March quarter 2021.
Australian gold exports to India had not reached one billion a year since 2014. With this large rise in export earnings in the March quarter 2021, India is likely to become a major export destination for Australian gold in the coming years. Gold exports to Singapore rose by 258% year-on-year in the March quarter 2021, to $1.4 billion, as the country is increasingly becoming a major hub for gold imports and exports to the ASEAN market.
Australia’s gold exports to the United Kingdom (UK) and Switzerland fell by 68 and 67% in the March quarter 2021, to $817 and $171 million, respectively. The decline in export earnings from the UK and Switzerland markets is consistent with a strong outflow of global gold-backed ETFs in the March quarter 2021.
Australia’s gold exports are estimated to have increased by 15% to $28 billion in 2020–21, driven by high gold prices and China’s removal of gold import restrictions (Figure 10.5). Gold prices rose by 27% in 2020 to average US$1,770 an ounce, and are forecast to average US$1,771 an ounce in 2021.
The People’s Bank of China — China’s central bank in control of gold imports — has given domestic and international banks permission to import gold into the country from mid-April 2021. The decision is likely to boost Australian gold exports to China, as Australia is a major source of China’s gold imports. Around 150 tonnes of gold are likely to have been shipped to China in April and May 2021.
Gold exports to the UK, US and Switzerland are expected to fall in the last quarter of 2020–21, due to further increase in gold-backed ETFs outflows. Offsetting these falls, gold exports to China and India are expected to resume normality, as the Chinese government opens to gold imports from Australia, and the Indian government lowers gold import duties.
Australian gold exports increase in 2021–22, and slightly lower in 2022–23
Australia’s gold export earnings for 2021–22 are forecast to increase by 3.0% to $29 billion in 2021–22, before falling to $28 billion in 2022–23 (Figure 10.5). The decline is expected to be driven by lower US and Australian dollar gold prices (see Section 10.4 prices).

97Resources and Energy Quarterly June 2021
Figure 10.5: Australia’s gold exports
Note: Export volume contains ash, waste and scrap gold, of which the gold content is unknown. Source: ABS (2021) International Trade, 5464.0; Department of Industry, Science, Energy and Resources (2021).
Australian gold mine production fell in the March quarter 2021 Australia’s gold production fell by 3.1% year-on-year in the March quarter 2021 to reach 75 tonnes, due to planned and unplanned maintenance and lower ore grades in some gold mines.
Production at Newcrest’s Cadia mine in NSW decreased by 8.0% year-on-year to 5.6 tonnes in the March quarter, due to planned maintenance and decreased mill throughput. Over this period, production at Northern Star’s Super Pit gold operations in WA fell by 5% year-on-year, to around 3.5 tonnes, due to a one-off planned 14-day mill shutdown. Production at AngloGold Ashanti’s Sunrise Dam gold mine in WA decreased by 19% year-on-year to 1.4 tonnes, due to lower mill throughput and ore grades. Mining operations at Laneway Resources’ Agate Creek gold mine in Queensland remained suspended in the March quarter, due to a localised flooding in January 2021.
Production at Newmont’s Boddington gold mine in WA rose by 7.0% year-on-year to 4.7 tonnes in the March quarter, propelled by higher ore grades. Production at Newcrest’s Telfer gold mine in WA increased by 8.6% year-on-year to 3.3 tonnes in the March quarter, driven by increased mill throughput and higher ore grades.
Red River’s 1.6 tonnes a year Hill Grove gold mine in NSW poured its first gold in March 2021. Novo Resources’ 3.1 tonnes a year Beatons Creek gold mine in WA commenced operation in February 2021. Ora Banda Mining’s 2.9 tonnes a year Davyhurst gold mine in WA poured first gold in February 2021.
Australian gold output is estimated to have grown by 1.1% to 332 tonnes in 2020–21, driven by production from new mines and improved ore grades from existing mines (Figure 10.6). Output at Newmont’s Tanami gold operation in the Northern Territory and Boddington gold mine in WA is expected to reach nearly 26 and 16 tonnes of gold, respectively, in 2021.
Higher production in the short term Australian gold mine production is forecast to rise at an average annual rate of 8.3% between 2021–22 and 2022–23. Production of 388 tonnes by 2022–23 will be propelled by both production from new mines and existing mine expansions (Figure 10.6).
Capricorn Metals has started the commissioning phase of its 3.0 tonnes a year Karlawinda gold mine project in WA in early June 2021. Red 5’s 6.2 tonnes a year King of the Hills gold project in WA is expected to start production in mid-2022. Ramelius Resources commenced ore mining at its Tampia gold mine in WA on 18 June 2021. It is expected that the mine will add 3.2 tonnes of gold to the Australian gold output from 2021–22 onwards.
Vista Gold received an approval from the Northern Territory government in mid-June 2021 to recommence operations at the mothballed Mount Todd gold mine. The site has been on care and maintenance since 2006. Heritage Minerals plans to reopen the 1.6 tonnes a year Mount Morgan gold mine in Queensland in 2023. The mine was once one of the richest
0
6
12
18
24
30
0
90
180
270
360
450
2012–13 2014–15 2016–17 2018–19 2020–21 2022–23
A$ b
illio
n
Tonn
es
Export volume Export value (rhs)
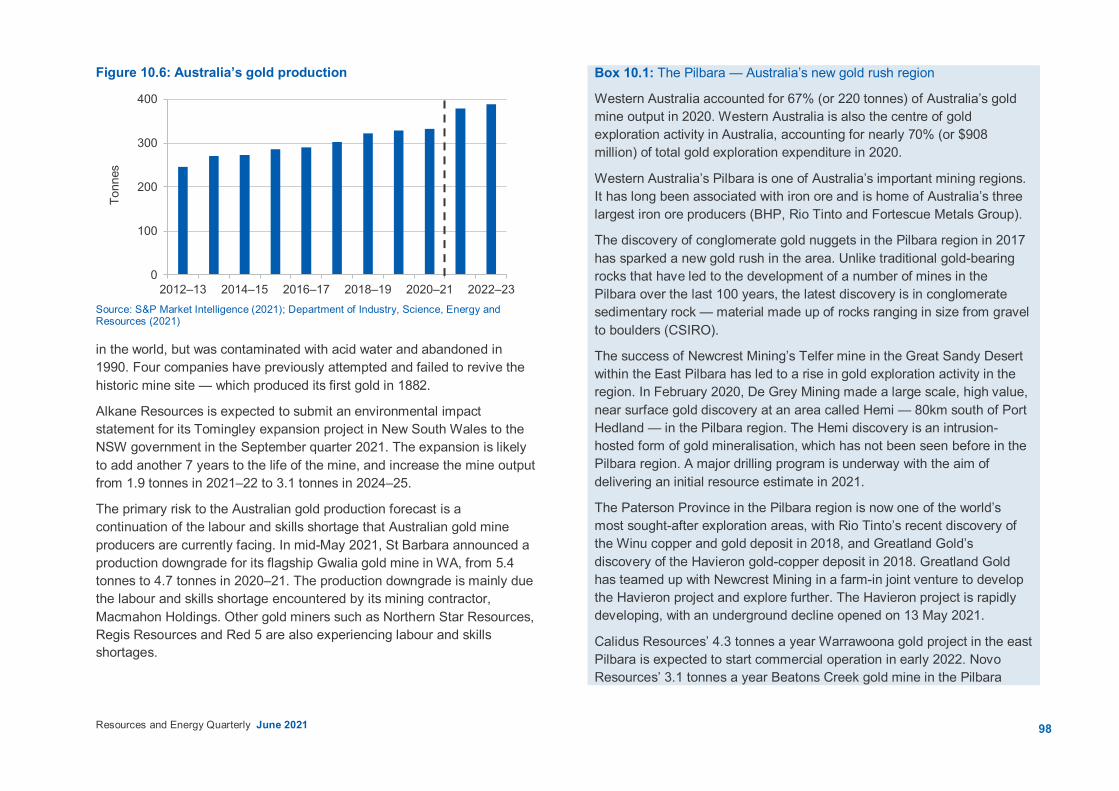
98Resources and Energy Quarterly June 2021
Figure 10.6: Australia’s gold production
Source: S&P Market Intelligence (2021); Department of Industry, Science, Energy and Resources (2021)
in the world, but was contaminated with acid water and abandoned in 1990. Four companies have previously attempted and failed to revive the historic mine site — which produced its first gold in 1882.
Alkane Resources is expected to submit an environmental impact statement for its Tomingley expansion project in New South Wales to the NSW government in the September quarter 2021. The expansion is likely to add another 7 years to the life of the mine, and increase the mine output from 1.9 tonnes in 2021–22 to 3.1 tonnes in 2024–25.
The primary risk to the Australian gold production forecast is a continuation of the labour and skills shortage that Australian gold mine producers are currently facing. In mid-May 2021, St Barbara announced a production downgrade for its flagship Gwalia gold mine in WA, from 5.4 tonnes to 4.7 tonnes in 2020–21. The production downgrade is mainly due the labour and skills shortage encountered by its mining contractor, Macmahon Holdings. Other gold miners such as Northern Star Resources, Regis Resources and Red 5 are also experiencing labour and skills shortages.
Box 10.1: The Pilbara — Australia’s new gold rush region
Western Australia accounted for 67% (or 220 tonnes) of Australia’s gold mine output in 2020. Western Australia is also the centre of gold exploration activity in Australia, accounting for nearly 70% (or $908 million) of total gold exploration expenditure in 2020.
Western Australia’s Pilbara is one of Australia’s important mining regions. It has long been associated with iron ore and is home of Australia’s three largest iron ore producers (BHP, Rio Tinto and Fortescue Metals Group).
The discovery of conglomerate gold nuggets in the Pilbara region in 2017 has sparked a new gold rush in the area. Unlike traditional gold-bearing rocks that have led to the development of a number of mines in the Pilbara over the last 100 years, the latest discovery is in conglomerate sedimentary rock — material made up of rocks ranging in size from gravel to boulders (CSIRO).
The success of Newcrest Mining’s Telfer mine in the Great Sandy Desert within the East Pilbara has led to a rise in gold exploration activity in the region. In February 2020, De Grey Mining made a large scale, high value, near surface gold discovery at an area called Hemi — 80km south of Port Hedland — in the Pilbara region. The Hemi discovery is an intrusion-hosted form of gold mineralisation, which has not been seen before in the Pilbara region. A major drilling program is underway with the aim of delivering an initial resource estimate in 2021.
The Paterson Province in the Pilbara region is now one of the world’s most sought-after exploration areas, with Rio Tinto’s recent discovery of the Winu copper and gold deposit in 2018, and Greatland Gold’s discovery of the Havieron gold-copper deposit in 2018. Greatland Gold has teamed up with Newcrest Mining in a farm-in joint venture to develop the Havieron project and explore further. The Havieron project is rapidly developing, with an underground decline opened on 13 May 2021.
Calidus Resources’ 4.3 tonnes a year Warrawoona gold project in the east Pilbara is expected to start commercial operation in early 2022. Novo Resources’ 3.1 tonnes a year Beatons Creek gold mine in the Pilbara
0
100
200
300
400
2012–13 2014–15 2016–17 2018–19 2020–21 2022–23
Tonn
es
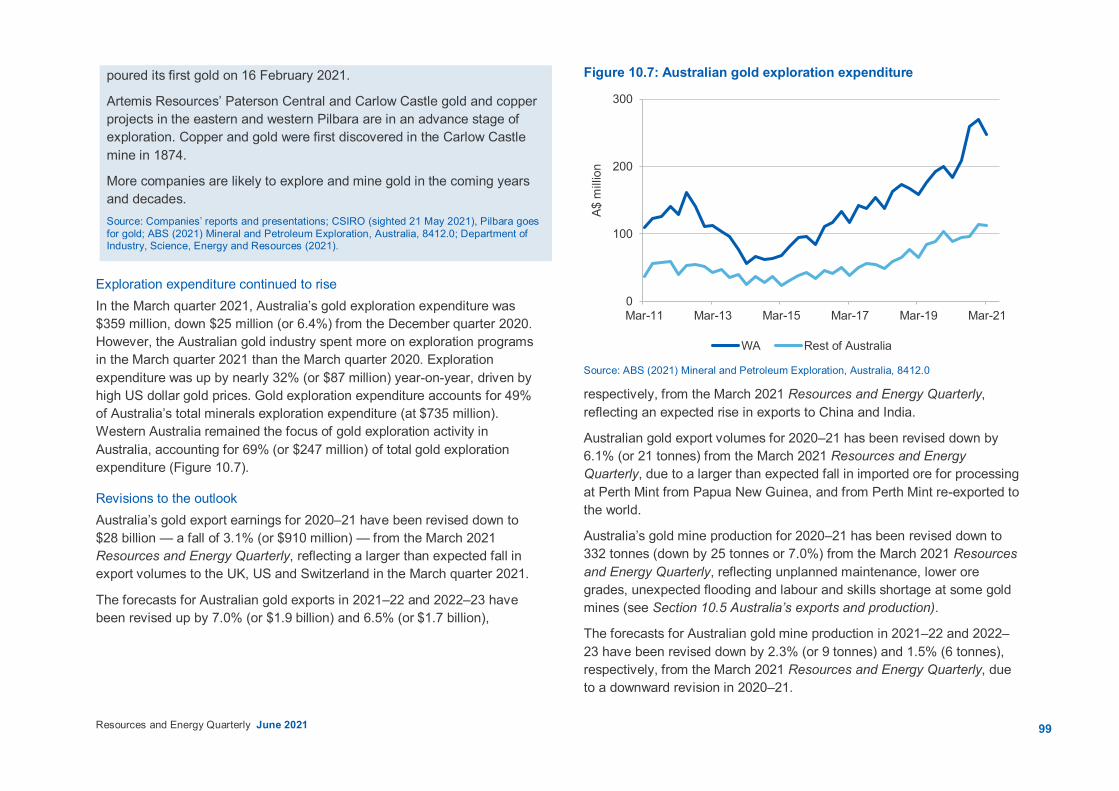
99Resources and Energy Quarterly June 2021
poured its first gold on 16 February 2021.
Artemis Resources’ Paterson Central and Carlow Castle gold and copper projects in the eastern and western Pilbara are in an advance stage of exploration. Copper and gold were first discovered in the Carlow Castle mine in 1874.
More companies are likely to explore and mine gold in the coming years and decades. Source: Companies’ reports and presentations; CSIRO (sighted 21 May 2021), Pilbara goes for gold; ABS (2021) Mineral and Petroleum Exploration, Australia, 8412.0; Department of Industry, Science, Energy and Resources (2021).
Exploration expenditure continued to rise In the March quarter 2021, Australia’s gold exploration expenditure was $359 million, down $25 million (or 6.4%) from the December quarter 2020. However, the Australian gold industry spent more on exploration programs in the March quarter 2021 than the March quarter 2020. Exploration expenditure was up by nearly 32% (or $87 million) year-on-year, driven by high US dollar gold prices. Gold exploration expenditure accounts for 49% of Australia’s total minerals exploration expenditure (at $735 million). Western Australia remained the focus of gold exploration activity in Australia, accounting for 69% (or $247 million) of total gold exploration expenditure (Figure 10.7).
Revisions to the outlook Australia’s gold export earnings for 2020–21 have been revised down to $28 billion — a fall of 3.1% (or $910 million) — from the March 2021 Resources and Energy Quarterly, reflecting a larger than expected fall in export volumes to the UK, US and Switzerland in the March quarter 2021.
The forecasts for Australian gold exports in 2021–22 and 2022–23 have been revised up by 7.0% (or $1.9 billion) and 6.5% (or $1.7 billion),
Figure 10.7: Australian gold exploration expenditure
Source: ABS (2021) Mineral and Petroleum Exploration, Australia, 8412.0
respectively, from the March 2021 Resources and Energy Quarterly, reflecting an expected rise in exports to China and India.
Australian gold export volumes for 2020–21 has been revised down by 6.1% (or 21 tonnes) from the March 2021 Resources and Energy Quarterly, due to a larger than expected fall in imported ore for processing at Perth Mint from Papua New Guinea, and from Perth Mint re-exported to the world.
Australia’s gold mine production for 2020–21 has been revised down to 332 tonnes (down by 25 tonnes or 7.0%) from the March 2021 Resources and Energy Quarterly, reflecting unplanned maintenance, lower ore grades, unexpected flooding and labour and skills shortage at some gold mines (see Section 10.5 Australia’s exports and production).
The forecasts for Australian gold mine production in 2021–22 and 2022–23 have been revised down by 2.3% (or 9 tonnes) and 1.5% (6 tonnes), respectively, from the March 2021 Resources and Energy Quarterly, due to a downward revision in 2020–21.
0
100
200
300
Mar-11 Mar-13 Mar-15 Mar-17 Mar-19 Mar-21
A$ m
illio
n
WA Rest of Australia
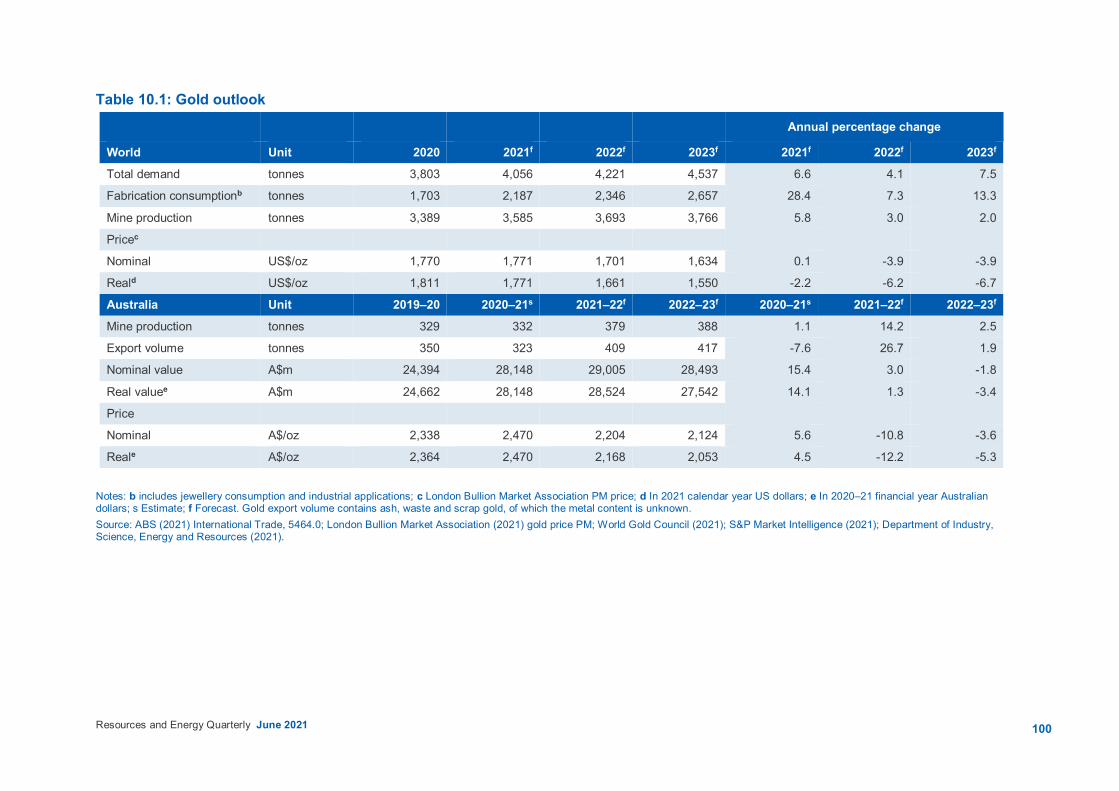
100Resources and Energy Quarterly June 2021
Table 10.1: Gold outlook
Annual percentage change
World Unit 2020 2021f 2022f 2023f 2021f 2022f 2023f Total demand tonnes 3,803 4,056 4,221 4,537 6.6 4.1 7.5
Fabrication consumptionb tonnes 1,703 2,187 2,346 2,657 28.4 7.3 13.3
Mine production tonnes 3,389 3,585 3,693 3,766 5.8 3.0 2.0
Pricec
Nominal US$/oz 1,770 1,771 1,701 1,634 0.1 -3.9 -3.9
Reald US$/oz 1,811 1,771 1,661 1,550 -2.2 -6.2 -6.7
Australia Unit 2019–20 2020–21s 2021–22f 2022–23f 2020–21s 2021–22f 2022–23f Mine production tonnes 329 332 379 388 1.1 14.2 2.5
Export volume tonnes 350 323 409 417 -7.6 26.7 1.9
Nominal value A$m 24,394 28,148 29,005 28,493 15.4 3.0 -1.8
Real valuee A$m 24,662 28,148 28,524 27,542 14.1 1.3 -3.4
Price
Nominal A$/oz 2,338 2,470 2,204 2,124 5.6 -10.8 -3.6
Reale A$/oz 2,364 2,470 2,168 2,053 4.5 -12.2 -5.3
Notes: b includes jewellery consumption and industrial applications; c London Bullion Market Association PM price; d In 2021 calendar year US dollars; e In 2020–21 financial year Australian dollars; s Estimate; f Forecast. Gold export volume contains ash, waste and scrap gold, of which the metal content is unknown. Source: ABS (2021) International Trade, 5464.0; London Bullion Market Association (2021) gold price PM; World Gold Council (2021); S&P Market Intelligence (2021); Department of Industry, Science, Energy and Resources (2021).
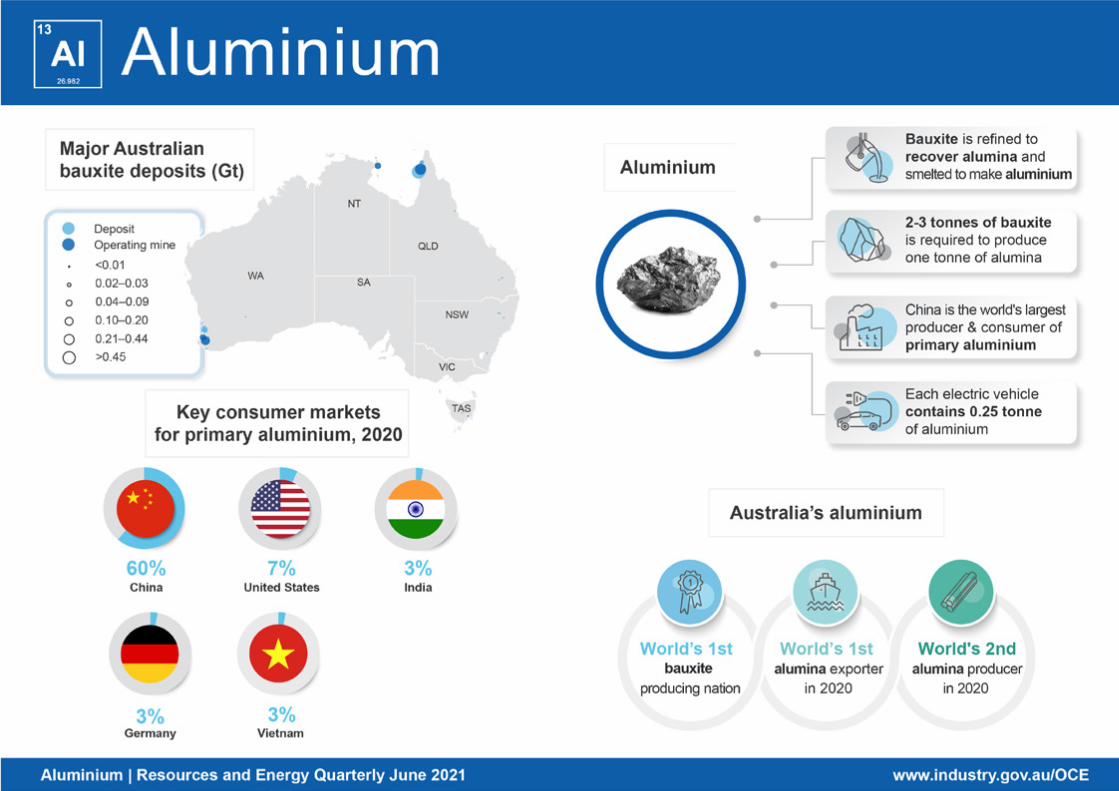
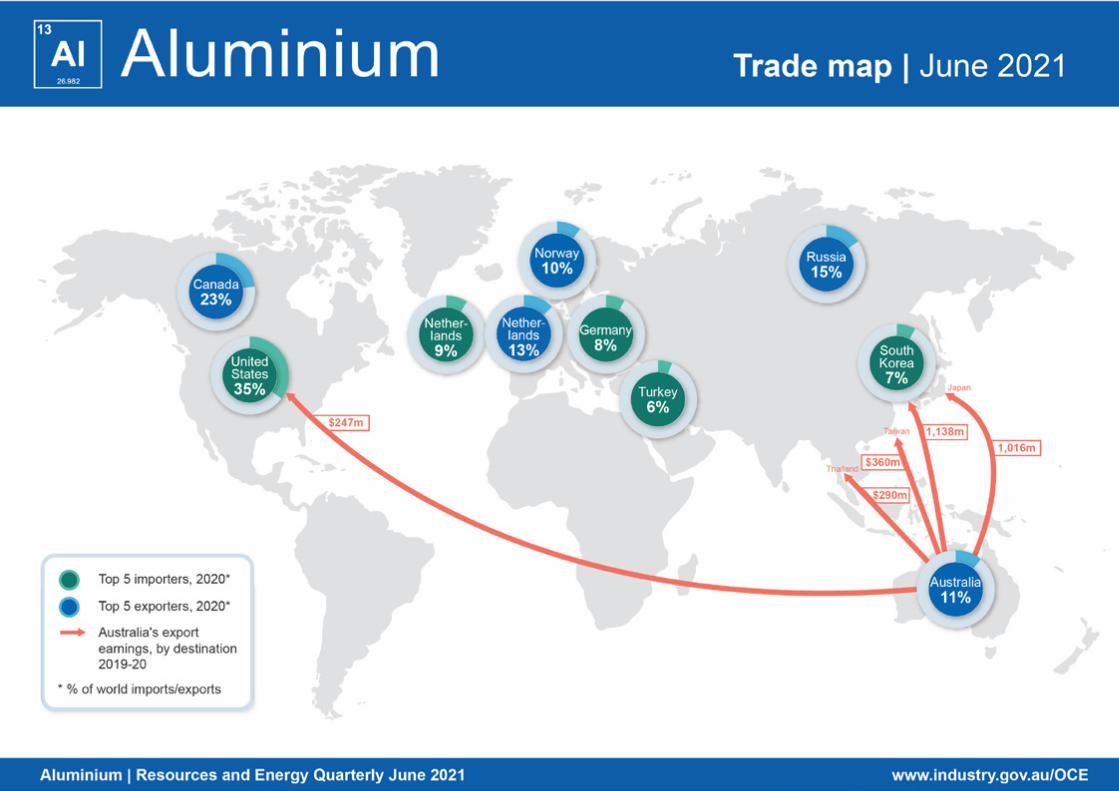
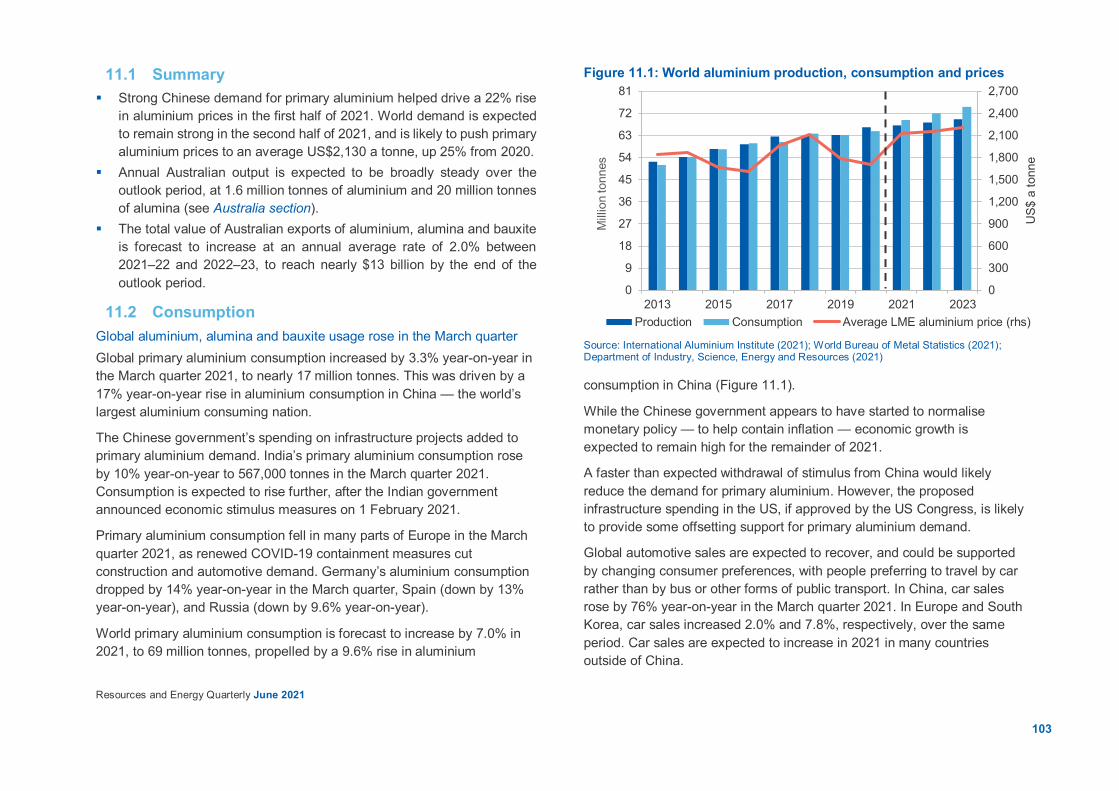
103
Resources and Energy Quarterly June 2021
11.1 Summary Strong Chinese demand for primary aluminium helped drive a 22% rise
in aluminium prices in the first half of 2021. World demand is expected to remain strong in the second half of 2021, and is likely to push primary aluminium prices to an average US$2,130 a tonne, up 25% from 2020.
Annual Australian output is expected to be broadly steady over the outlook period, at 1.6 million tonnes of aluminium and 20 million tonnes of alumina (see Australia section).
The total value of Australian exports of aluminium, alumina and bauxite is forecast to increase at an annual average rate of 2.0% between 2021–22 and 2022–23, to reach nearly $13 billion by the end of the outlook period.
11.2 Consumption Global aluminium, alumina and bauxite usage rose in the March quarter Global primary aluminium consumption increased by 3.3% year-on-year in the March quarter 2021, to nearly 17 million tonnes. This was driven by a 17% year-on-year rise in aluminium consumption in China — the world’s largest aluminium consuming nation.
The Chinese government’s spending on infrastructure projects added to primary aluminium demand. India’s primary aluminium consumption rose by 10% year-on-year to 567,000 tonnes in the March quarter 2021. Consumption is expected to rise further, after the Indian government announced economic stimulus measures on 1 February 2021.
Primary aluminium consumption fell in many parts of Europe in the March quarter 2021, as renewed COVID-19 containment measures cut construction and automotive demand. Germany’s aluminium consumption dropped by 14% year-on-year in the March quarter, Spain (down by 13% year-on-year), and Russia (down by 9.6% year-on-year).
World primary aluminium consumption is forecast to increase by 7.0% in 2021, to 69 million tonnes, propelled by a 9.6% rise in aluminium
Figure 11.1: World aluminium production, consumption and prices
Source: International Aluminium Institute (2021); World Bureau of Metal Statistics (2021); Department of Industry, Science, Energy and Resources (2021)
consumption in China (Figure 11.1).
While the Chinese government appears to have started to normalise monetary policy — to help contain inflation — economic growth is expected to remain high for the remainder of 2021.
A faster than expected withdrawal of stimulus from China would likely reduce the demand for primary aluminium. However, the proposed infrastructure spending in the US, if approved by the US Congress, is likely to provide some offsetting support for primary aluminium demand.
Global automotive sales are expected to recover, and could be supported by changing consumer preferences, with people preferring to travel by car rather than by bus or other forms of public transport. In China, car sales rose by 76% year-on-year in the March quarter 2021. In Europe and South Korea, car sales increased 2.0% and 7.8%, respectively, over the same period. Car sales are expected to increase in 2021 in many countries outside of China.
0
300
600
900
1,200
1,500
1,800
2,100
2,400
2,700
0
9
18
27
36
45
54
63
72
81
2013 2015 2017 2019 2021 2023
US$
a to
nne
Mill
ion
tonn
es
Production Consumption Average LME aluminium price (rhs)

104
Resources and Energy Quarterly June 2021
The economic recovery in Europe has been interrupted by renewed COVID-19 containment measures. Economic growth is expected to resume in the June quarter 2021 and onwards, with GDP increasing by around 4.0% in 2021 (see macroeconomic chapter). Economic recovery in the United States, United Kingdom, India and Japan in the second half of 2021 is likely to add significantly to primary aluminium demand.
World alumina usage increased by 1.7% year-on-year to nearly 32 million tonnes in the March quarter 2021, driven by higher aluminium production (which was up by 1.1% year-on-year in the March quarter 2021).
World alumina demand is estimated to increase by 1.7% to nearly 131 million tonnes in 2021 (Figure 11.2). An expected 1.1% rise in global primary aluminium production in 2021 is likely to lift global alumina demand. China is expected to contribute strongly to the growth in global alumina demand, with an estimated 2.0 million tonnes of new primary aluminium capacity being added in 2021.
World bauxite usage increased by 2.6% year-on-year to 80 million tonnes in the March quarter 2021, propelled by increased global alumina production (up 9.0% year-on-year in the March quarter 2021) (see Section 11.4 production).
World bauxite consumption is forecast to grow by 4.7% to 322 million tonnes in 2021. The gains are expected to be driven by higher alumina output from existing refinery capacities in China and Brazil.
Aluminium, alumina and bauxite demand set to increase in 2022 and 2023 World primary aluminium demand is forecast to increase at an average annual rate of 3.7% in 2022 and 2023, to 75 million tonnes by 2023 (Figure 11.1). The global economic recovery is expected to support demand for cars, houses and electrical equipment, and thus aluminium consumption. An expected increase in the use of renewable energy equipment — such as wind and solar power generators — will boost primary aluminium demand over the outlook period.
China’s primary aluminium consumption is expected to continue to grow strongly over the next two years, reaching 46 million tonnes in 2023. The Chinese government’s ambitious initiatives for promoting electric vehicle production are expected to bolster demand for aluminium. These initiatives are likely to at least partly offset the withdrawal of economic stimulus programs.
World alumina consumption is forecast to rise at an average annual rate of 1.5% in 2022 and 2023, reaching 135 million tonnes in 2023 (Figure 11.2). Alumina demand is driven by primary aluminium production, which is forecast to increase by 1.8% a year in 2022 and 2023.
World bauxite consumption is forecast to grow at an average annual rate of 3.9% in 2022 and 2023, reaching 346 million tonnes in 2023. This is expected to be driven by new alumina capacity in China and India.
Figure 11.2: World alumina production, consumption and prices
Source: International Aluminium Institute (2021); World Bureau of Metal Statistics (2021); Department of Industry, Science, Energy and Resources (2021)
0
100
200
300
400
500
0
30
60
90
120
150
2013 2015 2017 2019 2021 2023
US$
a to
nne
(FO
B Au
stra
lia)
Mill
ion
tonn
esProduction Consumption FOB Australia alumina prices (rhs)
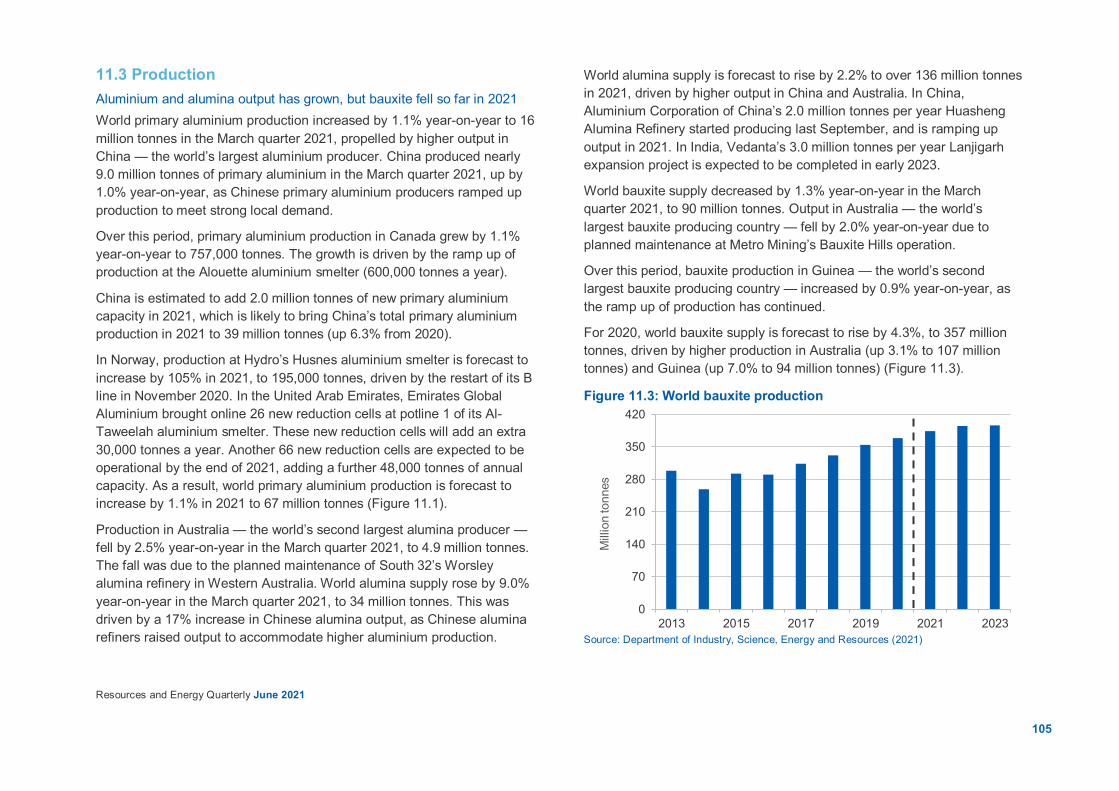
105
Resources and Energy Quarterly June 2021
11.3 Production Aluminium and alumina output has grown, but bauxite fell so far in 2021 World primary aluminium production increased by 1.1% year-on-year to 16 million tonnes in the March quarter 2021, propelled by higher output in China — the world’s largest aluminium producer. China produced nearly 9.0 million tonnes of primary aluminium in the March quarter 2021, up by 1.0% year-on-year, as Chinese primary aluminium producers ramped up production to meet strong local demand.
Over this period, primary aluminium production in Canada grew by 1.1% year-on-year to 757,000 tonnes. The growth is driven by the ramp up of production at the Alouette aluminium smelter (600,000 tonnes a year).
China is estimated to add 2.0 million tonnes of new primary aluminium capacity in 2021, which is likely to bring China’s total primary aluminium production in 2021 to 39 million tonnes (up 6.3% from 2020).
In Norway, production at Hydro’s Husnes aluminium smelter is forecast to increase by 105% in 2021, to 195,000 tonnes, driven by the restart of its B line in November 2020. In the United Arab Emirates, Emirates Global Aluminium brought online 26 new reduction cells at potline 1 of its Al-Taweelah aluminium smelter. These new reduction cells will add an extra 30,000 tonnes a year. Another 66 new reduction cells are expected to be operational by the end of 2021, adding a further 48,000 tonnes of annual capacity. As a result, world primary aluminium production is forecast to increase by 1.1% in 2021 to 67 million tonnes (Figure 11.1).
Production in Australia — the world’s second largest alumina producer — fell by 2.5% year-on-year in the March quarter 2021, to 4.9 million tonnes. The fall was due to the planned maintenance of South 32’s Worsley alumina refinery in Western Australia. World alumina supply rose by 9.0% year-on-year in the March quarter 2021, to 34 million tonnes. This was driven by a 17% increase in Chinese alumina output, as Chinese alumina refiners raised output to accommodate higher aluminium production.
World alumina supply is forecast to rise by 2.2% to over 136 million tonnes in 2021, driven by higher output in China and Australia. In China, Aluminium Corporation of China’s 2.0 million tonnes per year Huasheng Alumina Refinery started producing last September, and is ramping up output in 2021. In India, Vedanta’s 3.0 million tonnes per year Lanjigarh expansion project is expected to be completed in early 2023.
World bauxite supply decreased by 1.3% year-on-year in the March quarter 2021, to 90 million tonnes. Output in Australia — the world’s largest bauxite producing country — fell by 2.0% year-on-year due to planned maintenance at Metro Mining’s Bauxite Hills operation.
Over this period, bauxite production in Guinea — the world’s second largest bauxite producing country — increased by 0.9% year-on-year, as the ramp up of production has continued.
For 2020, world bauxite supply is forecast to rise by 4.3%, to 357 million tonnes, driven by higher production in Australia (up 3.1% to 107 million tonnes) and Guinea (up 7.0% to 94 million tonnes) (Figure 11.3).
Figure 11.3: World bauxite production
Source: Department of Industry, Science, Energy and Resources (2021)
0
70
140
210
280
350
420
2013 2015 2017 2019 2021 2023M
illio
n to
nnes
106
Resources and Energy Quarterly June 2021
Aluminium, alumina and bauxite output set to rise over the outlook period World primary aluminium production is forecast to increase at an average annual rate of 1.8% in 2022 and 2023, to reach nearly 70 million tonnes by 2023 (Figure 11.1). The gains are expected to be driven by additional capacity in China.
Shenhuo’s 450,000 tonnes per year Shenhuo Wenshan aluminium smelter — a greenfield aluminium project — is expected to start commercial production in the second half of 2021. East Hope’s 330,000 tonnes a year East Hope Jinzhong aluminium expansion project is expected to be commissioned in 2022. Chongqing Shunbo Aluminium’s 400,000 tonnes a year Anhui green aluminium project is expected to start commercial production in 2023.
In China, more greenfield aluminium smelters are anticipated, located in regions (such as Yunnan province, southwest China) where power is usually cheap and abundant. China’s Hongqiao — the world’s largest private sector aluminium producer — is expected to move more primary aluminium smelting capacity to Yunnan. In 2019, Hongqiao moved 2.0 million tonnes of annual capacity from Shandong province in eastern China to Yunan. The company is planning to transfer another 1.0 million tonnes in 2021, as a response to the Chinese government’s pledge to peak carbon emissions by 2030.
China’s primary aluminium output is forecast to reach 39 million tonnes by 2023. This is edging closer to the capacity cap of 45 million tonnes of primary aluminium per year — a policy introduced by China’s government in 2017, in response to environmental and oversupply concerns. The Chinese government’s Five Year Plan (2021–25), set in October 2020, calls for China’s production and capacity of both primary aluminium and alumina to peak by 2025. The closer China edges to its primary aluminium capacity cap, the greater the opportunity for other primary aluminium producing nations — such as Russia and Saudi Arabia — to fill the output gap.
Central and provincial authorities in China are expected to implement strict environmental regulations — restricting energy consumption and emissions — from 2021 onwards. In April 2021, China’s Industry and Information Technology Ministry started collecting energy consumption from smelters and refineries in energy intensive industries such as steel and aluminium. The Ministry is also conducting ongoing inspections to ensure the tiered electricity pricing systems for the aluminium industry are being properly implemented.
In March 2021, the provincial authority of Inner Mongolia in China requested two aluminium smelters in Baotou city to reduce output by 23,000 tonnes, in order to meet regional energy consumption targets. The Yunnan Electric Power Dispatching Control Centre reduced the power supply to aluminium smelters in the Yunnan province between 10 and 20 May 2021. This power usage control is expected to remove 30,000 tonnes of primary aluminium output from the province. It is likely that the same restrictions will be applied to other primary aluminium smelters in China.
On 12 May 2021, Rio Tinto’s 360,000 tonnes a year Tiwai Point aluminium smelter in New Zealand entered into an agreement with its energy supplier (Meridian) to reduce its electricity usage by 11MW by cutting production, to help avoid energy shortfalls.
World alumina supply is forecast to rise at an average annual rate of 0.7% in 2022 and 2023, reaching 138 million tonnes in 2023 (Figure 11.2). This growth will be driven by India and other small alumina refining nations.
In India, bauxite sourcing has improved, with Vedanta planning to lift capacity at its Lanjigarh refinery to 2.7 million tonnes in the short term, and to 6.0 million tonnes in the medium term. Hindalco’s 1.5 million tonnes per year Utkal Alumina Refinery is expected to come online in 2022.
In Vietnam, Vietnam Coal and Minerals Industries Group’s 650,000 tonnes a year Tan Rai Alumina Refinery is expected to commence commercial production in 2023.

107
Resources and Energy Quarterly June 2021
In Indonesia, China Hongqiao and joint-venture partners’ 2.0 million tonnes per year Well Harvest alumina refinery expansion project is expected to come online in 2022.
World bauxite output is forecast to grow at an average annual rate of 1.6% in 2022 and 2023, reaching 396 million tonnes by 2023 (Figure 11.3). The gains are expected to be driven by newly added capacity in Guinea, where production is rapidly rising.
Guinea’s bauxite output is forecast to grow at an average 7.0% a year in 2022 and 2023. The Compagnie des Bauxites de Guinée mine in Guinea, which expanded from 13 to 18 million tonnes a year in 2019, is due to expand to 28 million tonnes by 2022. Emirates Global Aluminium is planning to ramp up output at its bauxite mine in Guinea, targeting 12 million tonnes per year towards the end of the outlook period.
Green aluminium and alumina continues to evolve Green aluminium has continued to evolve since the release of the March 2021 Resources and Energy Quarterly. On 21 May 2021, the Australian Renewable Energy Agency (ARENA) granted $11.3 million to Alcoa Australia to explore the usage of a renewable energy process, Mechanical Vapor Recompression (MVR). The MVR process collects energy from waste vapor to convert liquid water into steam, which would then be used to power the alumina refining process. The MVR technology is expected to cut the carbon emission of alumina refinery by 70%.
In Norway, aluminium producer Norsk Hydro has worked in partnership with Everfuel (a Danish green hydrogen infrastructure company) to install and fuel hydrogen electrolysers for their aluminium smelters.
11.4 Prices Mixed price movements for aluminium and alumina in the first half of 2021 The London Metal Exchange (LME) spot price for primary aluminium has increased by 22% in 2021, to US$2,459 a tonne on 15 June 2021 — compared to an average of US$1,809 a tonne in the second half of 2020.
Rising demand is the main contributor to the price increase. Primary aluminium demand rose by 3.3% in the March quarter 2021, consistent with the rise in global industrial production and the global economic recovery. The gain in the aluminium price is also related to energy related constraints placed on Chinese aluminium smelters (see Section 11.4 production).
LME stocks reached a 4-year high in April 2021, at 1.8 million tonnes. SHFE stocks rose in the March quarter 2021, but have fallen since April 2021. LME off-warrant stocks rose in the year after the data was first released in early 2020, but have fallen since March 2021 (Figure 11.4).
China’s industrial production is forecast to grow by almost 8.0% in 2021, indicating strong short term demand conditions from the world’s largest base metals consumer.
The global roll out of the COVID-19 vaccines is also expected to provide support for primary aluminium prices. As a result, the aluminium LME spot price is forecast to increase by 25% in 2021, to average US$2,134 a tonne (Figure 11.5).
Figure 11.4: Exchange aluminium stocks
Source: London Metal Exchange (2021); World Bureau of Metals Statistics (2021)
0
1
2
3
4
5
6
Jun-12 Dec-13 Jun-15 Dec-16 Jun-18 Dec-19 Jun-21M
illio
n to
nnes
LME aluminium stocks Shanghai aluminium stocksOff-Warrant stocks
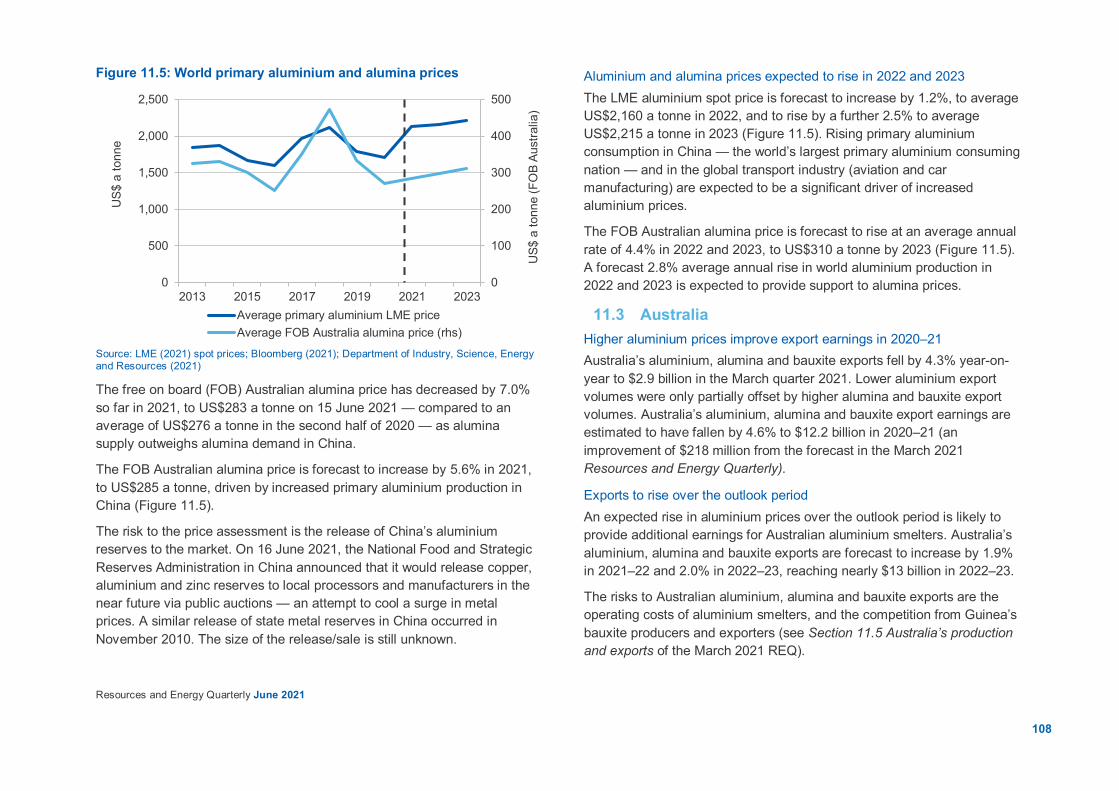
108
Resources and Energy Quarterly June 2021
Figure 11.5: World primary aluminium and alumina prices
Source: LME (2021) spot prices; Bloomberg (2021); Department of Industry, Science, Energy and Resources (2021)
The free on board (FOB) Australian alumina price has decreased by 7.0% so far in 2021, to US$283 a tonne on 15 June 2021 — compared to an average of US$276 a tonne in the second half of 2020 — as alumina supply outweighs alumina demand in China.
The FOB Australian alumina price is forecast to increase by 5.6% in 2021, to US$285 a tonne, driven by increased primary aluminium production in China (Figure 11.5).
The risk to the price assessment is the release of China’s aluminium reserves to the market. On 16 June 2021, the National Food and Strategic Reserves Administration in China announced that it would release copper, aluminium and zinc reserves to local processors and manufacturers in the near future via public auctions — an attempt to cool a surge in metal prices. A similar release of state metal reserves in China occurred in November 2010. The size of the release/sale is still unknown.
Aluminium and alumina prices expected to rise in 2022 and 2023 The LME aluminium spot price is forecast to increase by 1.2%, to average US$2,160 a tonne in 2022, and to rise by a further 2.5% to average US$2,215 a tonne in 2023 (Figure 11.5). Rising primary aluminium consumption in China — the world’s largest primary aluminium consuming nation — and in the global transport industry (aviation and car manufacturing) are expected to be a significant driver of increased aluminium prices.
The FOB Australian alumina price is forecast to rise at an average annual rate of 4.4% in 2022 and 2023, to US$310 a tonne by 2023 (Figure 11.5). A forecast 2.8% average annual rise in world aluminium production in 2022 and 2023 is expected to provide support to alumina prices.
11.3 Australia Higher aluminium prices improve export earnings in 2020–21 Australia’s aluminium, alumina and bauxite exports fell by 4.3% year-on-year to $2.9 billion in the March quarter 2021. Lower aluminium export volumes were only partially offset by higher alumina and bauxite export volumes. Australia’s aluminium, alumina and bauxite export earnings are estimated to have fallen by 4.6% to $12.2 billion in 2020–21 (an improvement of $218 million from the forecast in the March 2021 Resources and Energy Quarterly).
Exports to rise over the outlook period An expected rise in aluminium prices over the outlook period is likely to provide additional earnings for Australian aluminium smelters. Australia’s aluminium, alumina and bauxite exports are forecast to increase by 1.9% in 2021–22 and 2.0% in 2022–23, reaching nearly $13 billion in 2022–23.
The risks to Australian aluminium, alumina and bauxite exports are the operating costs of aluminium smelters, and the competition from Guinea’s bauxite producers and exporters (see Section 11.5 Australia’s production and exports of the March 2021 REQ).
0
100
200
300
400
500
0
500
1,000
1,500
2,000
2,500
2013 2015 2017 2019 2021 2023
US$
a to
nne
(FO
B Au
stra
lia)
US$
a to
nne
Average primary aluminium LME priceAverage FOB Australia alumina price (rhs)

109
Resources and Energy Quarterly June 2021
March quarter 2021 mixed for aluminium, alumina and bauxite output Australia’s primary aluminium production increased by 0.2% year-on-year to 389,000 tonnes in the March quarter 2021. The increase is attributed to a 4.1% year-on-year rise in Portland aluminium smelter in Victoria.
Australia’s alumina output fell by 2.5% year-on-year to 4.9 million tonnes in the March quarter 2021. The fall was due to the planned maintenance of South 32’s Worsley alumina refinery in WA.
Australia’s bauxite production fell by 2.0% year-on-year to 25 million tonnes in the March quarter 2021, as the temporary shutdown of Metro Mining’s Bauxite Hills operation in Queensland for maintenance continued in the March quarter 2021.
Steady aluminium, alumina and bauxite production over the outlook No expansions or major disruptions are expected at existing aluminium and alumina operations in Australia over the outlook period. Australia’s aluminium output is forecast to remain at about 1.6 million tonnes a year out to 2022–23 (Figure 11.6). Alumina output is expected to remain at about 20 million tonnes per annum over the outlook period (Figure 11.7).
Australia’s bauxite production is estimated to have fallen by 3.8% to 103 million tonnes in 2020–21 (Figure 11.8). This fall was related to the suspension of operations at Metro Mining’s 6.0 million tonnes a year Bauxite Hills mine in Queensland from September 2020 to March 2021, due to the wet season shutdown and planned maintenance. Output is forecast to rise at an average annual rate of 3.0% in 2021–22 and 2022–23, reaching 109 million tonnes in 2022–23.
In June 2020, Alcoa Australia applied to the Western Australia Environmental Protection Authority (WA EPA) to increase alumina production at its Pinjarra refinery from 5.0 to 5.25 million tonnes a year. The company also applied to the WA EPA to increase bauxite production at its Huntly mine (annual production of 26 million tonnes). Both applications are being assessed by the WA EPA.
Figure 11.6: Australia’s aluminium exports and production
Source: ABS (2021) International Trade in Goods and Services, 5368.0; Department of Industry, Science, Energy and Resources (2021)
Figure 11.7: Australia’s alumina exports and production
Source: ABS (2021) International Trade in Goods and Services, 5368.0; Department of Industry, Science, Energy and Resources (2021)
0
1
2
3
4
5
0.0
0.4
0.8
1.2
1.6
2.0
2012–13 2014–15 2016–17 2018–19 2020–21 2022–23
A$ b
illio
n
Mill
ion
tonn
es
Aluminium production Export volumes Export nominal values (rhs)
0
2
4
6
8
10
12
0
4
8
12
16
20
24
2012–13 2014–15 2016–17 2018–19 2020–21 2022–23
A$ b
illio
n
Mill
ion
tonn
esAlumina production Export volumes Export nominal values (rhs)
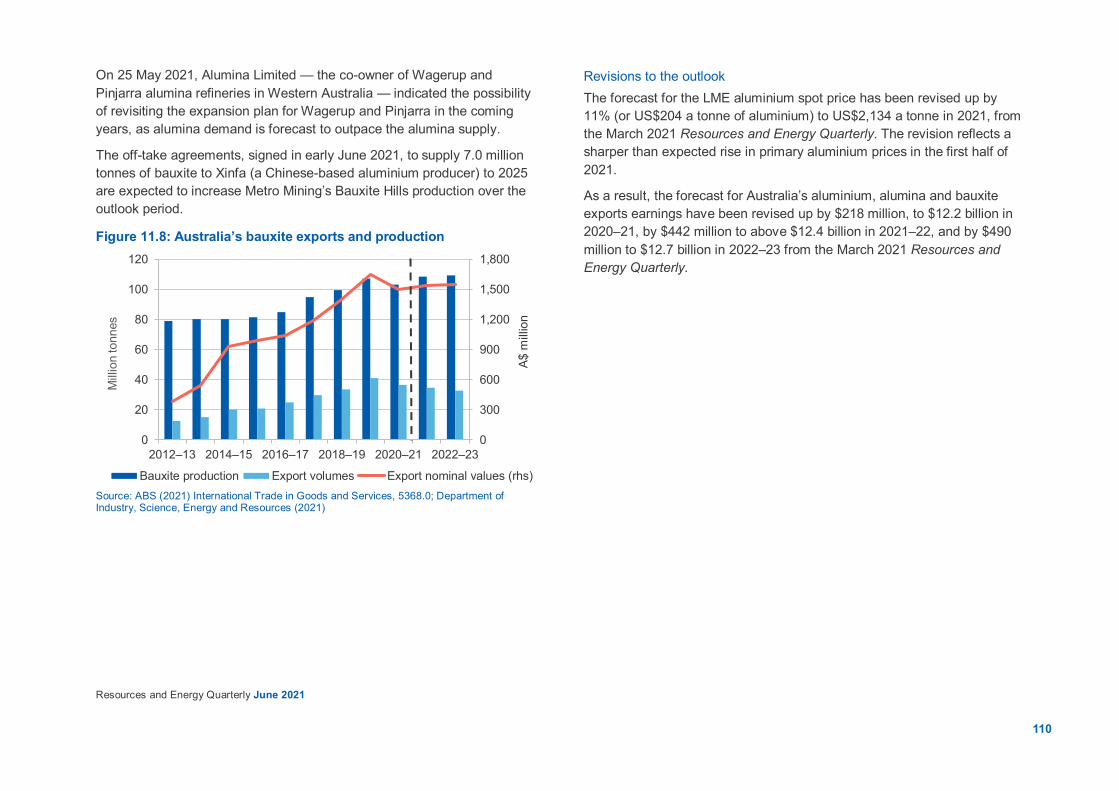
110
Resources and Energy Quarterly June 2021
On 25 May 2021, Alumina Limited — the co-owner of Wagerup and Pinjarra alumina refineries in Western Australia — indicated the possibility of revisiting the expansion plan for Wagerup and Pinjarra in the coming years, as alumina demand is forecast to outpace the alumina supply.
The off-take agreements, signed in early June 2021, to supply 7.0 million tonnes of bauxite to Xinfa (a Chinese-based aluminium producer) to 2025 are expected to increase Metro Mining’s Bauxite Hills production over the outlook period.
Figure 11.8: Australia’s bauxite exports and production
Source: ABS (2021) International Trade in Goods and Services, 5368.0; Department of Industry, Science, Energy and Resources (2021)
Revisions to the outlook The forecast for the LME aluminium spot price has been revised up by 11% (or US$204 a tonne of aluminium) to US$2,134 a tonne in 2021, from the March 2021 Resources and Energy Quarterly. The revision reflects a sharper than expected rise in primary aluminium prices in the first half of 2021.
As a result, the forecast for Australia’s aluminium, alumina and bauxite exports earnings have been revised up by $218 million, to $12.2 billion in 2020–21, by $442 million to above $12.4 billion in 2021–22, and by $490 million to $12.7 billion in 2022–23 from the March 2021 Resources and Energy Quarterly.
0
300
600
900
1,200
1,500
1,800
0
20
40
60
80
100
120
2012–13 2014–15 2016–17 2018–19 2020–21 2022–23
A$ m
illio
n
Mill
ion
tonn
es
Bauxite production Export volumes Export nominal values (rhs)
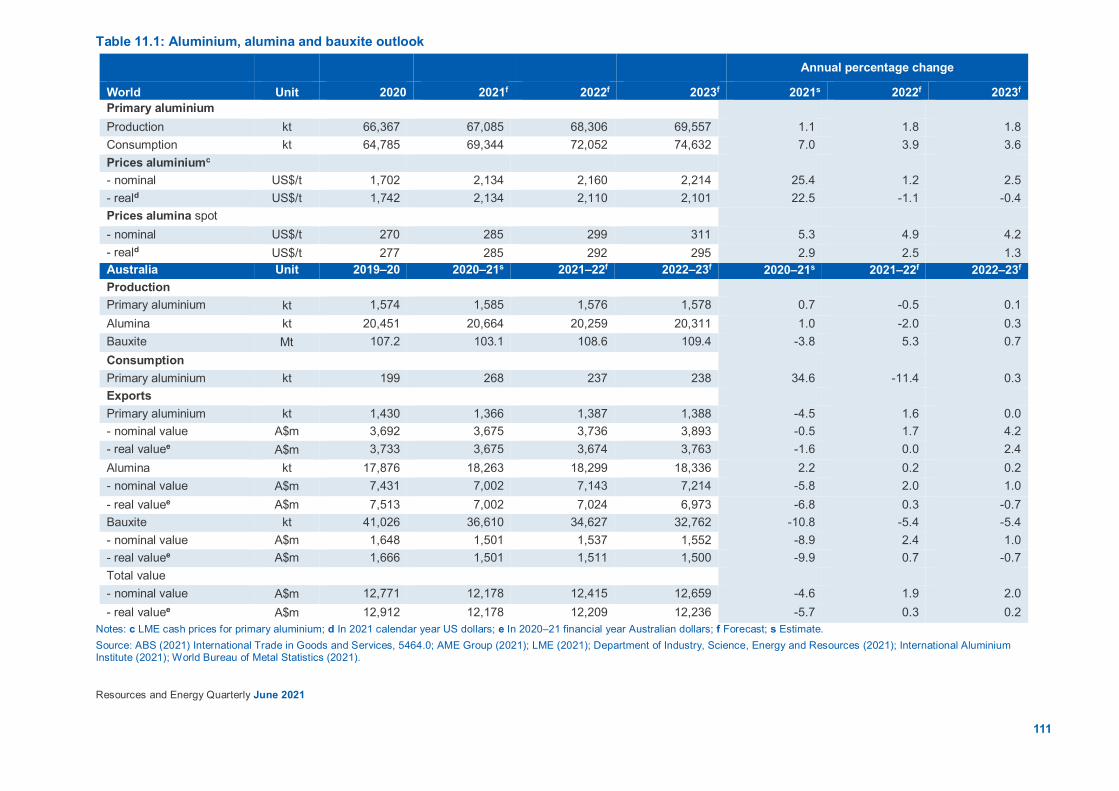
111
Resources and Energy Quarterly June 2021
Table 11.1: Aluminium, alumina and bauxite outlook
Annual percentage change
World Unit 2020 2021f 2022f 2023f 2021s 2022f 2023f Primary aluminium Production kt 66,367 67,085 68,306 69,557 1.1 1.8 1.8 Consumption kt 64,785 69,344 72,052 74,632 7.0 3.9 3.6 Prices aluminiumc - nominal US$/t 1,702 2,134 2,160 2,214 25.4 1.2 2.5 - reald US$/t 1,742 2,134 2,110 2,101 22.5 -1.1 -0.4 Prices alumina spot - nominal US$/t 270 285 299 311 5.3 4.9 4.2 - reald US$/t 277 285 292 295 2.9 2.5 1.3 Australia Unit 2019–20 2020–21s 2021–22f 2022–23f 2020–21s 2021–22f 2022–23f Production Primary aluminium kt 1,574 1,585 1,576 1,578 0.7 -0.5 0.1 Alumina kt 20,451 20,664 20,259 20,311 1.0 -2.0 0.3 Bauxite Mt 107.2 103.1 108.6 109.4 -3.8 5.3 0.7 Consumption Primary aluminium kt 199 268 237 238 34.6 -11.4 0.3 Exports Primary aluminium kt 1,430 1,366 1,387 1,388 -4.5 1.6 0.0 - nominal value A$m 3,692 3,675 3,736 3,893 -0.5 1.7 4.2 - real valuee A$m 3,733 3,675 3,674 3,763 -1.6 0.0 2.4 Alumina kt 17,876 18,263 18,299 18,336 2.2 0.2 0.2 - nominal value A$m 7,431 7,002 7,143 7,214 -5.8 2.0 1.0 - real valuee A$m 7,513 7,002 7,024 6,973 -6.8 0.3 -0.7 Bauxite kt 41,026 36,610 34,627 32,762 -10.8 -5.4 -5.4 - nominal value A$m 1,648 1,501 1,537 1,552 -8.9 2.4 1.0 - real valuee A$m 1,666 1,501 1,511 1,500 -9.9 0.7 -0.7 Total value - nominal value A$m 12,771 12,178 12,415 12,659 -4.6 1.9 2.0 - real valuee A$m 12,912 12,178 12,209 12,236 -5.7 0.3 0.2
Notes: c LME cash prices for primary aluminium; d In 2021 calendar year US dollars; e In 2020–21 financial year Australian dollars; f Forecast; s Estimate. Source: ABS (2021) International Trade in Goods and Services, 5464.0; AME Group (2021); LME (2021); Department of Industry, Science, Energy and Resources (2021); International Aluminium Institute (2021); World Bureau of Metal Statistics (2021).
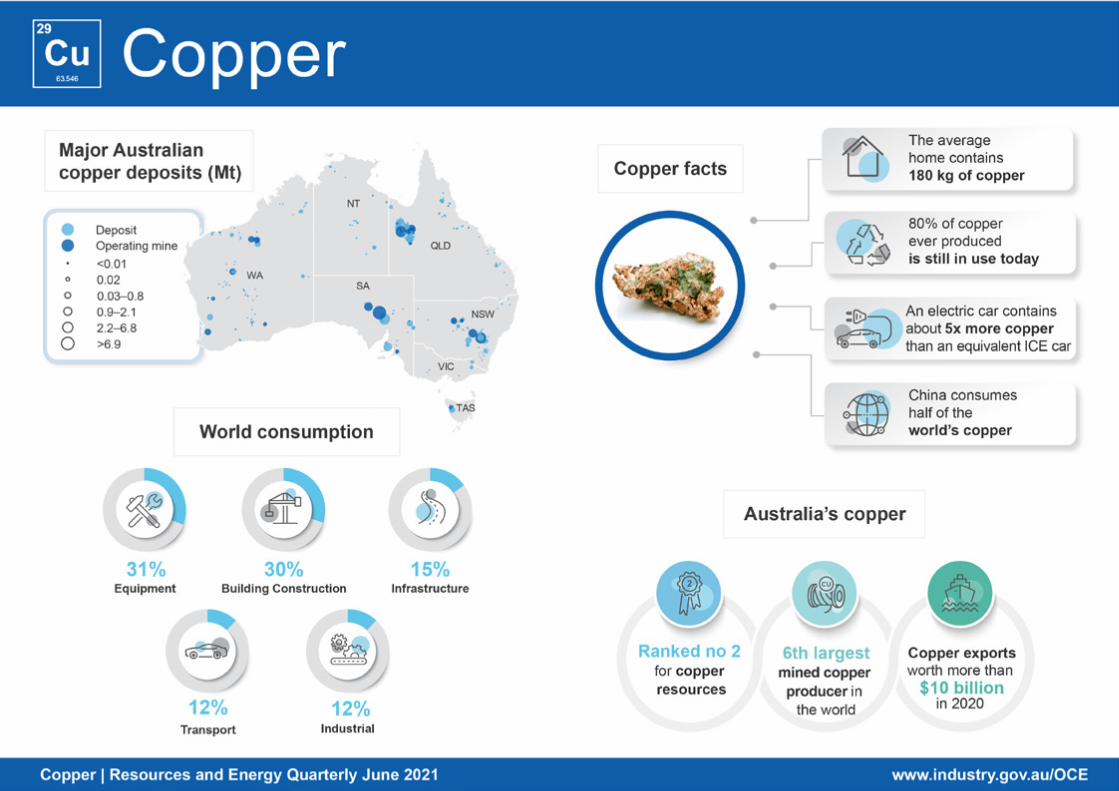
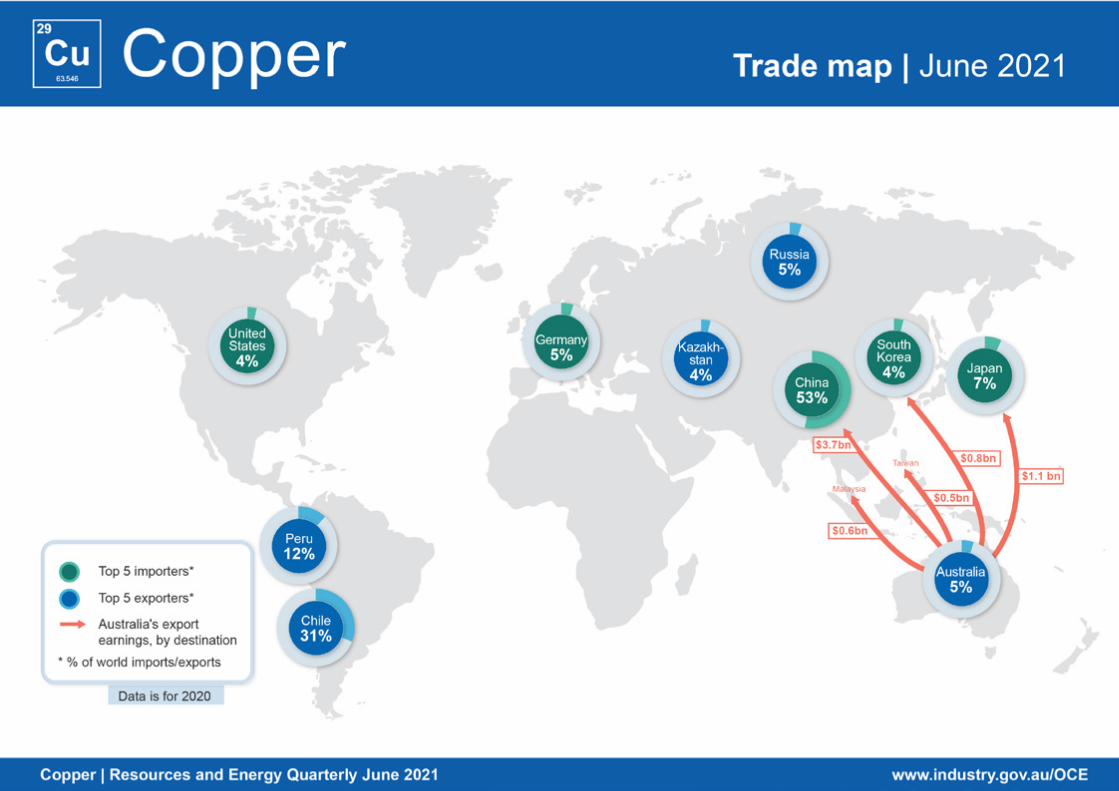

114Resources and Energy Quarterly June 2021
12.1 Summary After reaching a record high in May, the copper price is expected to
moderate over the outlook period. Economic recovery and expanding use in low-emissions technologies is expected to see prices average US$8,840 a tonne in 2021 and US$7,890 a tonne in 2023.
Australia’s copper export volumes are expected to be moderate over the outlook period, from 924,000 tonnes in 2020–21 to around 909,000 tonnes in 2022–23 (in metal content terms) (see Australia section).
Australia’s copper export earnings are expected to increase in-line with higher prices. Export earnings are forecast to reach $13 billion in 2021–22, up from $10 billion in 2019–20.
12.1 World consumption Consumption boosted by infrastructure and ‘green’ stimulus A strong recovery in economic activity, supported by significant economic stimulus packages, saw copper consumption increase in the March quarter 2021, up by 4% year-on-year. After increasing in 2020, refined copper consumption is forecast to increase by 5% in 2021, to reach 26 million tonnes (Figure 12.1). Copper has benefited from both infrastructure-focused stimulus spending and ‘green’ stimulus spending. Stimulus spending, including policies to subsidise EVs, renewable energy generation and transmission, are expected to influence consumption over the medium term due to copper’s use in EVs, batteries and grid infrastructure. In-line with recovering economic activity, total world consumption is forecast to reach 27 million tonnes in 2023, up an average 3% a year (Figure 12.2).
China’s consumption supports copper market China consumes half of the world’s copper, and was the dominant driver of copper market tightness towards the end of 2020 (Figure 12.2). China’s March quarter consumption was up by 12% year-on-year, supported by high import levels and industrial production growing 14% year-on-year, following subdued activity in the March 2020 quarter.
Figure 12.1: Outlook for refined copper consumption
Source: World Bureau of Metal Statistics (2021); Department of Industry, Science, Energy and Resources (2021)
Figure 12.2: Refined copper consumption by major market
Source: World Bureau of Metal Statistics (2021)
0
5
10
15
20
25
30
2012 2013 2014 2015 2016 2017 2018 2019 2020
Mill
ion
tonn
es
China ROW Europe US Japan
-5
0
5
10
0
10
20
30
2013 2015 2017 2019 2021 2023
Per c
ent
Mill
ion
tonn
es
Refined copper consumption Annual change (rhs)
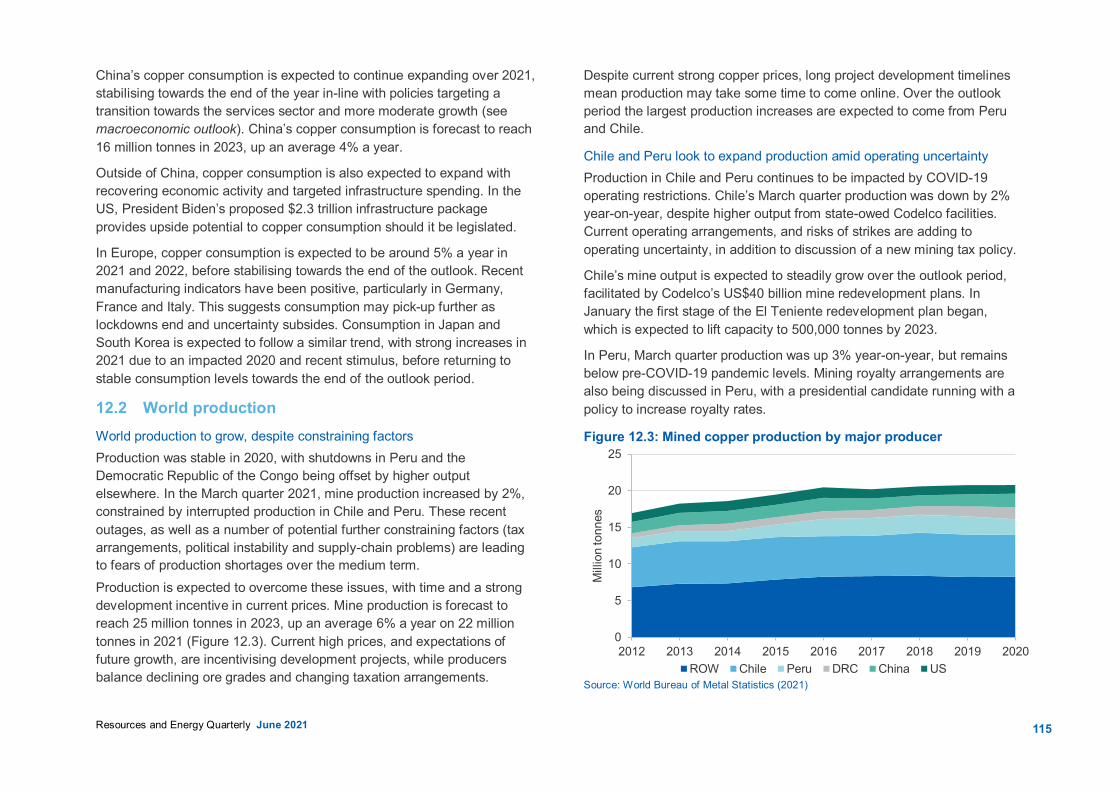
115Resources and Energy Quarterly June 2021
China’s copper consumption is expected to continue expanding over 2021, stabilising towards the end of the year in-line with policies targeting a transition towards the services sector and more moderate growth (see macroeconomic outlook). China’s copper consumption is forecast to reach 16 million tonnes in 2023, up an average 4% a year.
Outside of China, copper consumption is also expected to expand with recovering economic activity and targeted infrastructure spending. In the US, President Biden’s proposed $2.3 trillion infrastructure package provides upside potential to copper consumption should it be legislated.
In Europe, copper consumption is expected to be around 5% a year in 2021 and 2022, before stabilising towards the end of the outlook. Recent manufacturing indicators have been positive, particularly in Germany, France and Italy. This suggests consumption may pick-up further as lockdowns end and uncertainty subsides. Consumption in Japan and South Korea is expected to follow a similar trend, with strong increases in 2021 due to an impacted 2020 and recent stimulus, before returning to stable consumption levels towards the end of the outlook period.
12.2 World production World production to grow, despite constraining factors Production was stable in 2020, with shutdowns in Peru and the Democratic Republic of the Congo being offset by higher output elsewhere. In the March quarter 2021, mine production increased by 2%, constrained by interrupted production in Chile and Peru. These recent outages, as well as a number of potential further constraining factors (tax arrangements, political instability and supply-chain problems) are leading to fears of production shortages over the medium term. Production is expected to overcome these issues, with time and a strong development incentive in current prices. Mine production is forecast to reach 25 million tonnes in 2023, up an average 6% a year on 22 million tonnes in 2021 (Figure 12.3). Current high prices, and expectations of future growth, are incentivising development projects, while producers balance declining ore grades and changing taxation arrangements.
Despite current strong copper prices, long project development timelines mean production may take some time to come online. Over the outlook period the largest production increases are expected to come from Peru and Chile.
Chile and Peru look to expand production amid operating uncertainty Production in Chile and Peru continues to be impacted by COVID-19 operating restrictions. Chile’s March quarter production was down by 2% year-on-year, despite higher output from state-owed Codelco facilities. Current operating arrangements, and risks of strikes are adding to operating uncertainty, in addition to discussion of a new mining tax policy.
Chile’s mine output is expected to steadily grow over the outlook period, facilitated by Codelco’s US$40 billion mine redevelopment plans. In January the first stage of the El Teniente redevelopment plan began, which is expected to lift capacity to 500,000 tonnes by 2023.
In Peru, March quarter production was up 3% year-on-year, but remains below pre-COVID-19 pandemic levels. Mining royalty arrangements are also being discussed in Peru, with a presidential candidate running with a policy to increase royalty rates.
Figure 12.3: Mined copper production by major producer
Source: World Bureau of Metal Statistics (2021)
0
5
10
15
20
25
2012 2013 2014 2015 2016 2017 2018 2019 2020
Mill
ion
tonn
es
ROW Chile Peru DRC China US
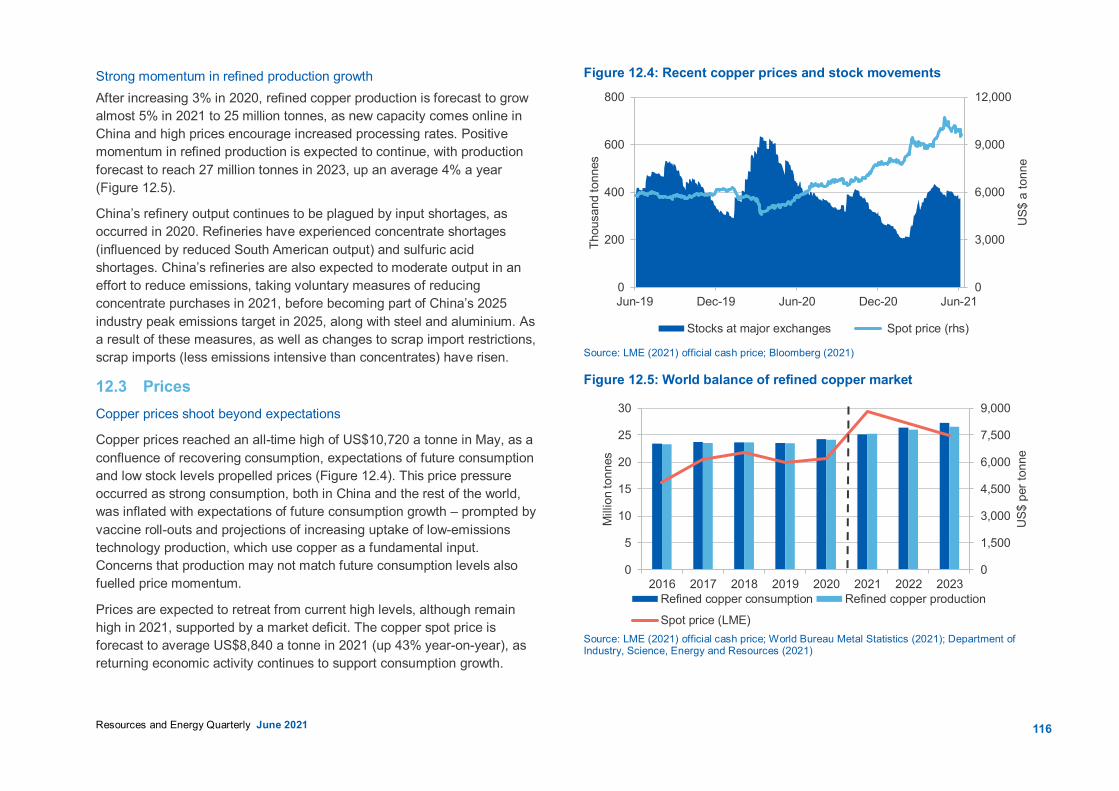
116Resources and Energy Quarterly June 2021
Strong momentum in refined production growth After increasing 3% in 2020, refined copper production is forecast to grow almost 5% in 2021 to 25 million tonnes, as new capacity comes online in China and high prices encourage increased processing rates. Positive momentum in refined production is expected to continue, with production forecast to reach 27 million tonnes in 2023, up an average 4% a year (Figure 12.5).
China’s refinery output continues to be plagued by input shortages, as occurred in 2020. Refineries have experienced concentrate shortages (influenced by reduced South American output) and sulfuric acid shortages. China’s refineries are also expected to moderate output in an effort to reduce emissions, taking voluntary measures of reducing concentrate purchases in 2021, before becoming part of China’s 2025 industry peak emissions target in 2025, along with steel and aluminium. As a result of these measures, as well as changes to scrap import restrictions, scrap imports (less emissions intensive than concentrates) have risen.
12.3 Prices Copper prices shoot beyond expectations
Copper prices reached an all-time high of US$10,720 a tonne in May, as a confluence of recovering consumption, expectations of future consumption and low stock levels propelled prices (Figure 12.4). This price pressure occurred as strong consumption, both in China and the rest of the world, was inflated with expectations of future consumption growth – prompted by vaccine roll-outs and projections of increasing uptake of low-emissions technology production, which use copper as a fundamental input. Concerns that production may not match future consumption levels also fuelled price momentum.
Prices are expected to retreat from current high levels, although remain high in 2021, supported by a market deficit. The copper spot price is forecast to average US$8,840 a tonne in 2021 (up 43% year-on-year), as returning economic activity continues to support consumption growth.
Figure 12.4: Recent copper prices and stock movements
Xx Paste figure here xx Source: LME (2021) official cash price; Bloomberg (2021)
Figure 12.5: World balance of refined copper market t figure here xx
Source: LME (2021) official cash price; World Bureau Metal Statistics (2021); Department of Industry, Science, Energy and Resources (2021)
0
1,500
3,000
4,500
6,000
7,500
9,000
0
5
10
15
20
25
30
2016 2017 2018 2019 2020 2021 2022 2023
US$
per
tonn
e
Mill
ion
tonn
esRefined copper consumption Refined copper production
Spot price (LME)
0
3,000
6,000
9,000
12,000
0
200
400
600
800
Jun-19 Dec-19 Jun-20 Dec-20 Jun-21
US$
a to
nne
Thou
sand
tonn
es
Stocks at major exchanges Spot price (rhs)
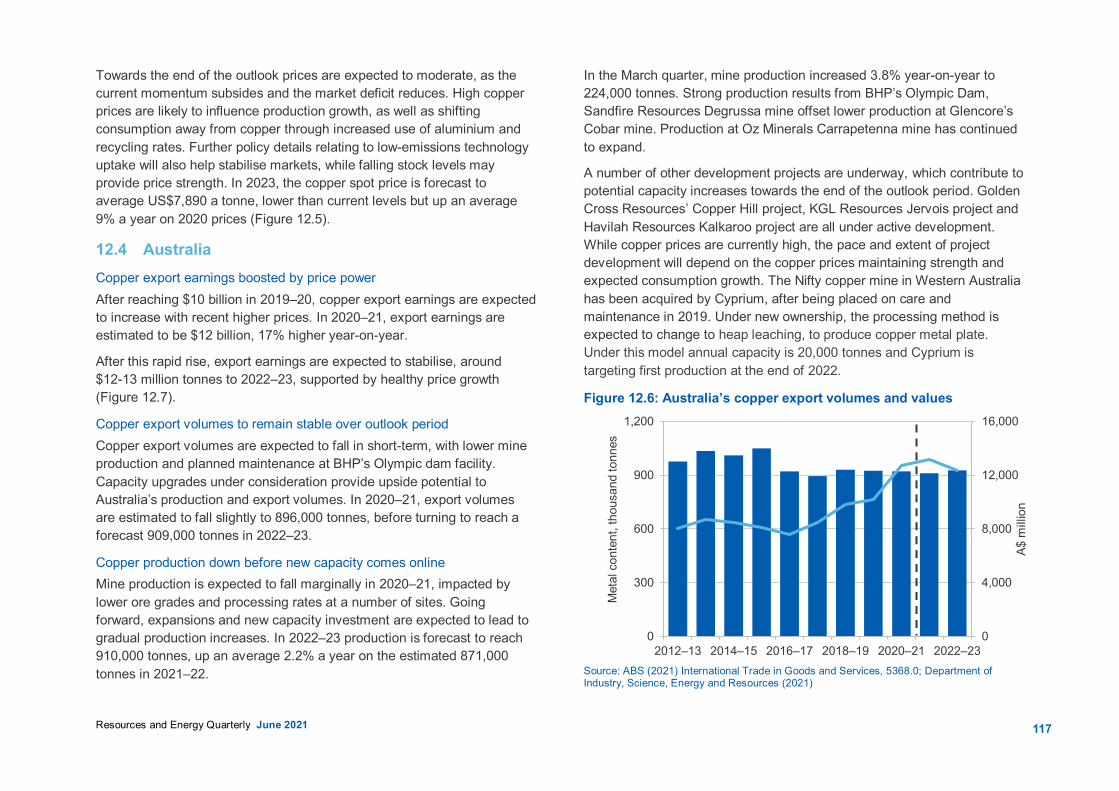
117Resources and Energy Quarterly June 2021
Towards the end of the outlook prices are expected to moderate, as the current momentum subsides and the market deficit reduces. High copper prices are likely to influence production growth, as well as shifting consumption away from copper through increased use of aluminium and recycling rates. Further policy details relating to low-emissions technology uptake will also help stabilise markets, while falling stock levels may provide price strength. In 2023, the copper spot price is forecast to average US$7,890 a tonne, lower than current levels but up an average 9% a year on 2020 prices (Figure 12.5).
12.4 Australia Copper export earnings boosted by price power After reaching $10 billion in 2019–20, copper export earnings are expected to increase with recent higher prices. In 2020–21, export earnings are estimated to be $12 billion, 17% higher year-on-year.
After this rapid rise, export earnings are expected to stabilise, around $12-13 million tonnes to 2022–23, supported by healthy price growth (Figure 12.7).
Copper export volumes to remain stable over outlook period Copper export volumes are expected to fall in short-term, with lower mine production and planned maintenance at BHP’s Olympic dam facility. Capacity upgrades under consideration provide upside potential to Australia’s production and export volumes. In 2020–21, export volumes are estimated to fall slightly to 896,000 tonnes, before turning to reach a forecast 909,000 tonnes in 2022–23.
Copper production down before new capacity comes online Mine production is expected to fall marginally in 2020–21, impacted by lower ore grades and processing rates at a number of sites. Going forward, expansions and new capacity investment are expected to lead to gradual production increases. In 2022–23 production is forecast to reach 910,000 tonnes, up an average 2.2% a year on the estimated 871,000 tonnes in 2021–22.
In the March quarter, mine production increased 3.8% year-on-year to 224,000 tonnes. Strong production results from BHP’s Olympic Dam, Sandfire Resources Degrussa mine offset lower production at Glencore’s Cobar mine. Production at Oz Minerals Carrapetenna mine has continued to expand.
A number of other development projects are underway, which contribute to potential capacity increases towards the end of the outlook period. Golden Cross Resources’ Copper Hill project, KGL Resources Jervois project and Havilah Resources Kalkaroo project are all under active development. While copper prices are currently high, the pace and extent of project development will depend on the copper prices maintaining strength and expected consumption growth. The Nifty copper mine in Western Australia has been acquired by Cyprium, after being placed on care and maintenance in 2019. Under new ownership, the processing method is expected to change to heap leaching, to produce copper metal plate. Under this model annual capacity is 20,000 tonnes and Cyprium is targeting first production at the end of 2022.
Figure 12.6: Australia’s copper export volumes and values
Source: ABS (2021) International Trade in Goods and Services, 5368.0; Department of Industry, Science, Energy and Resources (2021)
0
4,000
8,000
12,000
16,000
0
300
600
900
1,200
2012–13 2014–15 2016–17 2018–19 2020–21 2022–23
A$ m
illio
n
Met
al c
onte
nt, t
hous
and
tonn
es
Volumes Values (rhs)
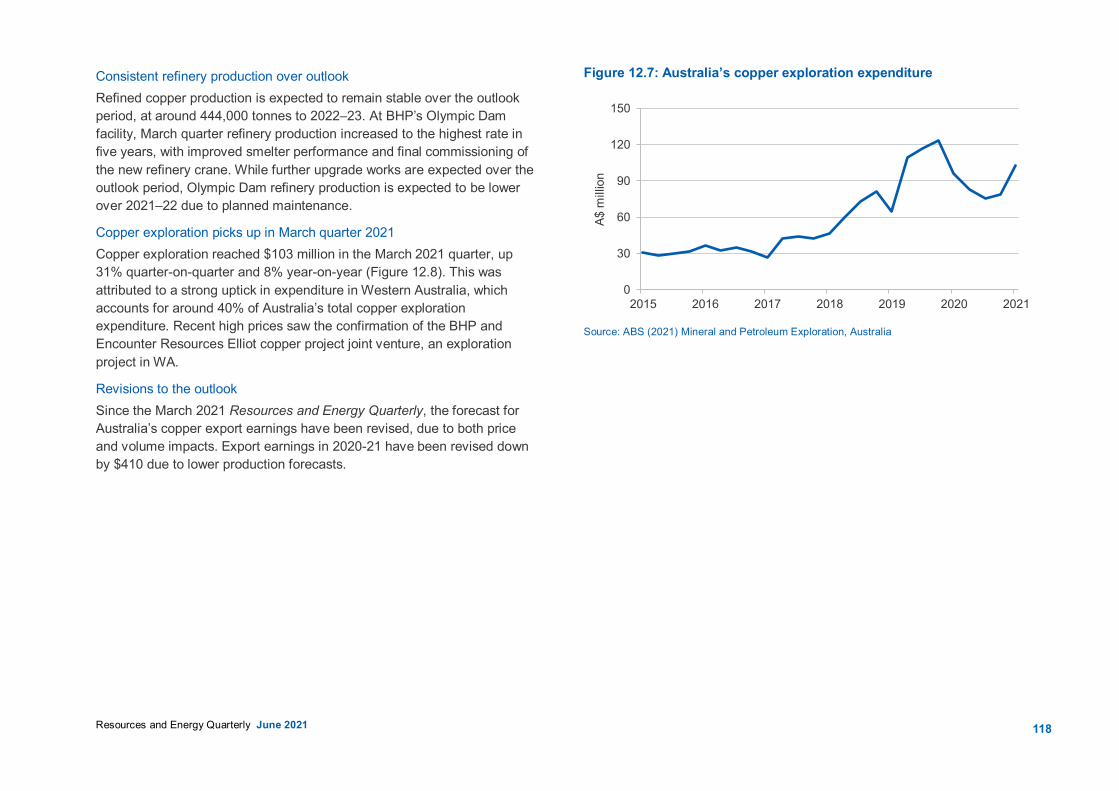
118Resources and Energy Quarterly June 2021
Consistent refinery production over outlook Refined copper production is expected to remain stable over the outlook period, at around 444,000 tonnes to 2022–23. At BHP’s Olympic Dam facility, March quarter refinery production increased to the highest rate in five years, with improved smelter performance and final commissioning of the new refinery crane. While further upgrade works are expected over the outlook period, Olympic Dam refinery production is expected to be lower over 2021–22 due to planned maintenance.
Copper exploration picks up in March quarter 2021 Copper exploration reached $103 million in the March 2021 quarter, up 31% quarter-on-quarter and 8% year-on-year (Figure 12.8). This was attributed to a strong uptick in expenditure in Western Australia, which accounts for around 40% of Australia’s total copper exploration expenditure. Recent high prices saw the confirmation of the BHP and Encounter Resources Elliot copper project joint venture, an exploration project in WA.
Revisions to the outlook Since the March 2021 Resources and Energy Quarterly, the forecast for Australia’s copper export earnings have been revised, due to both price and volume impacts. Export earnings in 2020-21 have been revised down by $410 due to lower production forecasts.
Figure 12.7: Australia’s copper exploration expenditure Xx Past e figure here xx
Source: ABS (2021) Mineral and Petroleum Exploration, Australia
0
30
60
90
120
150
2015 2016 2017 2018 2019 2020 2021
A$ m
illio
n
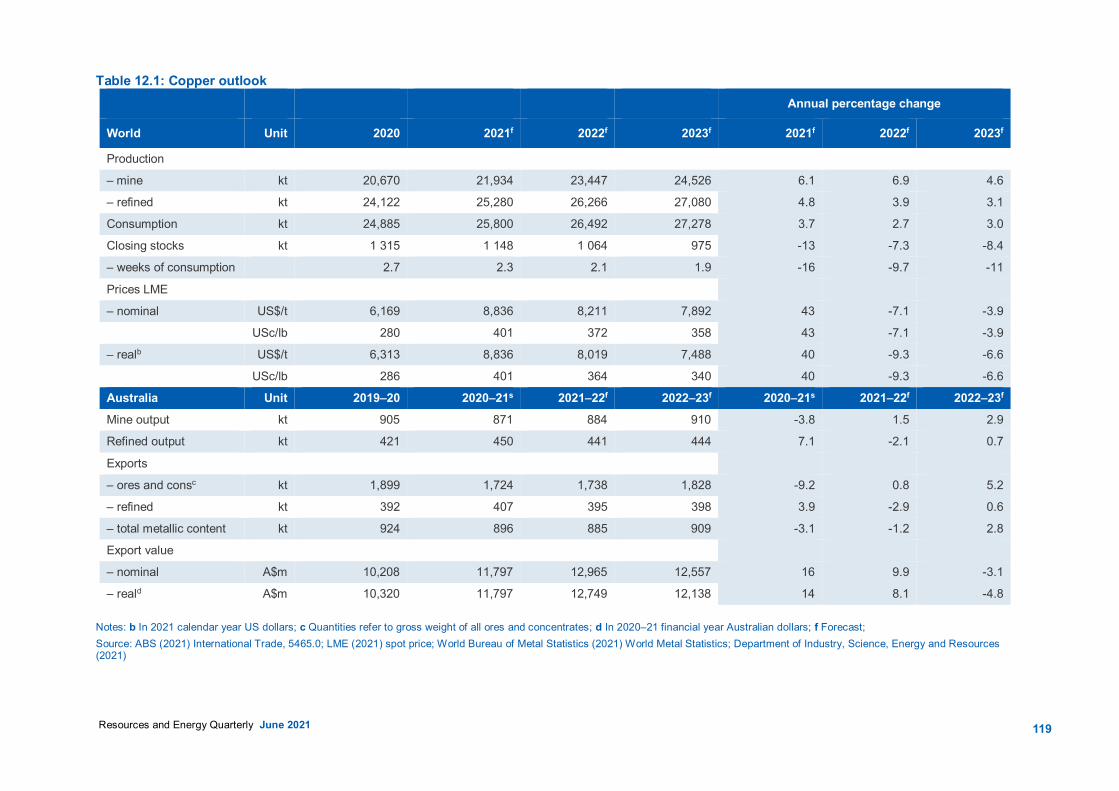
119 Resources and Energy Quarterly June 2021
Table 12.1: Copper outlook Annual percentage change
World Unit 2020 2021f 2022f 2023f 2021f 2022f 2023f
Production
– mine kt 20,670 21,934 23,447 24,526 6.1 6.9 4.6
– refined kt 24,122 25,280 26,266 27,080 4.8 3.9 3.1
Consumption kt 24,885 25,800 26,492 27,278 3.7 2.7 3.0
Closing stocks kt 1 315 1 148 1 064 975 -13 -7.3 -8.4
– weeks of consumption 2.7 2.3 2.1 1.9 -16 -9.7 -11
Prices LME
– nominal US$/t 6,169 8,836 8,211 7,892 43 -7.1 -3.9
USc/lb 280 401 372 358 43 -7.1 -3.9
– realb US$/t 6,313 8,836 8,019 7,488 40 -9.3 -6.6
USc/lb 286 401 364 340 40 -9.3 -6.6
Australia Unit 2019–20 2020–21s 2021–22f 2022–23f 2020–21s 2021–22f 2022–23f Mine output kt 905 871 884 910 -3.8 1.5 2.9
Refined output kt 421 450 441 444 7.1 -2.1 0.7
Exports
– ores and consc kt 1,899 1,724 1,738 1,828 -9.2 0.8 5.2
– refined kt 392 407 395 398 3.9 -2.9 0.6
– total metallic content kt 924 896 885 909 -3.1 -1.2 2.8
Export value
– nominal A$m 10,208 11,797 12,965 12,557 16 9.9 -3.1
– reald A$m 10,320 11,797 12,749 12,138 14 8.1 -4.8 Notes: b In 2021 calendar year US dollars; c Quantities refer to gross weight of all ores and concentrates; d In 2020–21 financial year Australian dollars; f Forecast; Source: ABS (2021) International Trade, 5465.0; LME (2021) spot price; World Bureau of Metal Statistics (2021) World Metal Statistics; Department of Industry, Science, Energy and Resources (2021)


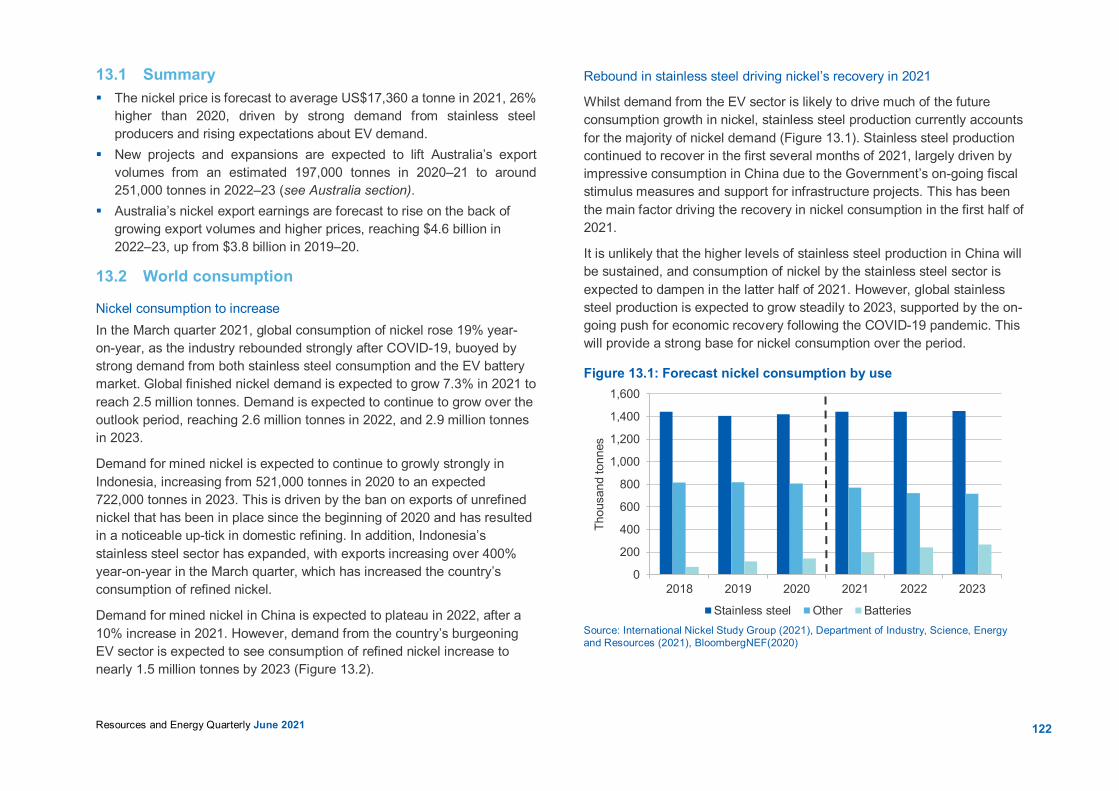
122Resources and Energy Quarterly June 2021
13.1 Summary The nickel price is forecast to average US$17,360 a tonne in 2021, 26%
higher than 2020, driven by strong demand from stainless steel producers and rising expectations about EV demand.
New projects and expansions are expected to lift Australia’s export volumes from an estimated 197,000 tonnes in 2020–21 to around 251,000 tonnes in 2022–23 (see Australia section).
Australia’s nickel export earnings are forecast to rise on the back of growing export volumes and higher prices, reaching $4.6 billion in 2022–23, up from $3.8 billion in 2019–20.
13.2 World consumption
Nickel consumption to increase In the March quarter 2021, global consumption of nickel rose 19% year-on-year, as the industry rebounded strongly after COVID-19, buoyed by strong demand from both stainless steel consumption and the EV battery market. Global finished nickel demand is expected to grow 7.3% in 2021 to reach 2.5 million tonnes. Demand is expected to continue to grow over the outlook period, reaching 2.6 million tonnes in 2022, and 2.9 million tonnes in 2023.
Demand for mined nickel is expected to continue to growly strongly in Indonesia, increasing from 521,000 tonnes in 2020 to an expected 722,000 tonnes in 2023. This is driven by the ban on exports of unrefined nickel that has been in place since the beginning of 2020 and has resulted in a noticeable up-tick in domestic refining. In addition, Indonesia’s stainless steel sector has expanded, with exports increasing over 400% year-on-year in the March quarter, which has increased the country’s consumption of refined nickel.
Demand for mined nickel in China is expected to plateau in 2022, after a 10% increase in 2021. However, demand from the country’s burgeoning EV sector is expected to see consumption of refined nickel increase to nearly 1.5 million tonnes by 2023 (Figure 13.2).
Rebound in stainless steel driving nickel’s recovery in 2021
Whilst demand from the EV sector is likely to drive much of the future consumption growth in nickel, stainless steel production currently accounts for the majority of nickel demand (Figure 13.1). Stainless steel production continued to recover in the first several months of 2021, largely driven by impressive consumption in China due to the Government’s on-going fiscal stimulus measures and support for infrastructure projects. This has been the main factor driving the recovery in nickel consumption in the first half of 2021.
It is unlikely that the higher levels of stainless steel production in China will be sustained, and consumption of nickel by the stainless steel sector is expected to dampen in the latter half of 2021. However, global stainless steel production is expected to grow steadily to 2023, supported by the on-going push for economic recovery following the COVID-19 pandemic. This will provide a strong base for nickel consumption over the period.
Figure 13.1: Forecast nickel consumption by use
Source: International Nickel Study Group (2021), Department of Industry, Science, Energy and Resources (2021), BloombergNEF(2020)
0
200
400
600
800
1,000
1,200
1,400
1,600
2018 2019 2020 2021 2022 2023Th
ousa
nd to
nnes
Stainless steel Other Batteries
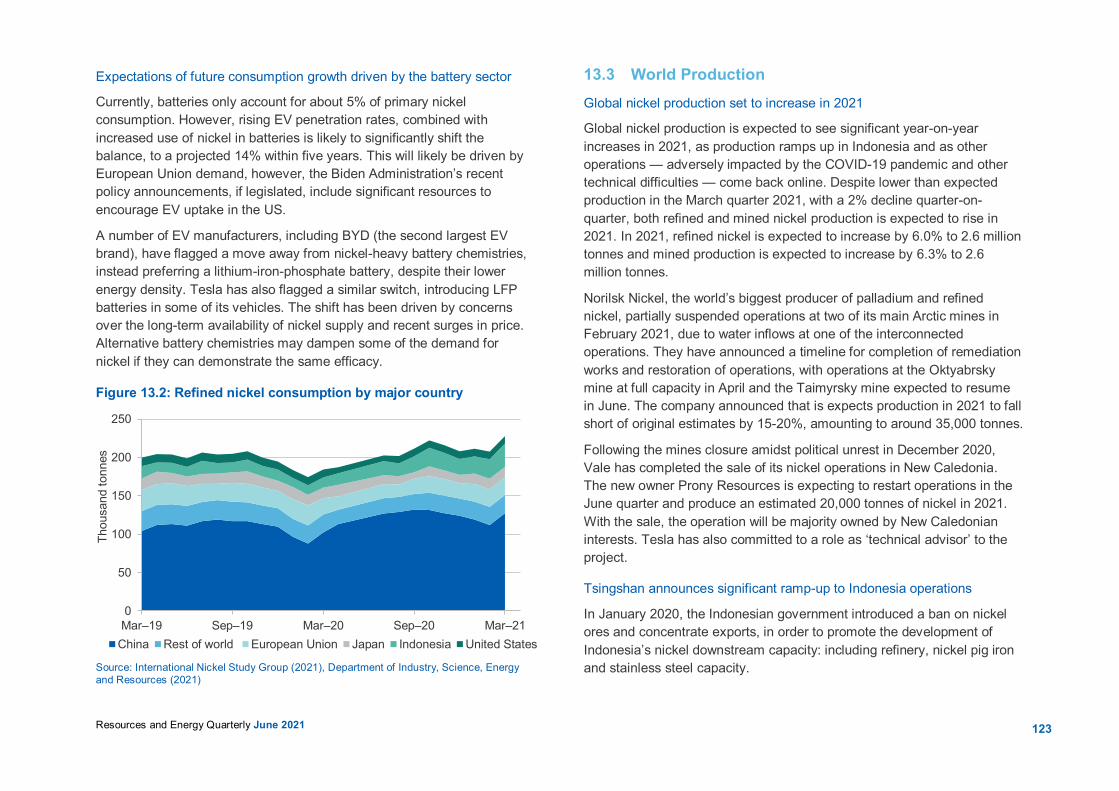
123Resources and Energy Quarterly June 2021
Expectations of future consumption growth driven by the battery sector
Currently, batteries only account for about 5% of primary nickel consumption. However, rising EV penetration rates, combined with increased use of nickel in batteries is likely to significantly shift the balance, to a projected 14% within five years. This will likely be driven by European Union demand, however, the Biden Administration’s recent policy announcements, if legislated, include significant resources to encourage EV uptake in the US.
A number of EV manufacturers, including BYD (the second largest EV brand), have flagged a move away from nickel-heavy battery chemistries, instead preferring a lithium-iron-phosphate battery, despite their lower energy density. Tesla has also flagged a similar switch, introducing LFP batteries in some of its vehicles. The shift has been driven by concerns over the long-term availability of nickel supply and recent surges in price. Alternative battery chemistries may dampen some of the demand for nickel if they can demonstrate the same efficacy.
Figure 13.2: Refined nickel consumption by major country
Xx Paste figure here xx
Source: International Nickel Study Group (2021), Department of Industry, Science, Energy and Resources (2021)
13.3 World Production Global nickel production set to increase in 2021
Global nickel production is expected to see significant year-on-year increases in 2021, as production ramps up in Indonesia and as other operations — adversely impacted by the COVID-19 pandemic and other technical difficulties — come back online. Despite lower than expected production in the March quarter 2021, with a 2% decline quarter-on-quarter, both refined and mined nickel production is expected to rise in 2021. In 2021, refined nickel is expected to increase by 6.0% to 2.6 million tonnes and mined production is expected to increase by 6.3% to 2.6 million tonnes.
Norilsk Nickel, the world’s biggest producer of palladium and refined nickel, partially suspended operations at two of its main Arctic mines in February 2021, due to water inflows at one of the interconnected operations. They have announced a timeline for completion of remediation works and restoration of operations, with operations at the Oktyabrsky mine at full capacity in April and the Taimyrsky mine expected to resume in June. The company announced that is expects production in 2021 to fall short of original estimates by 15-20%, amounting to around 35,000 tonnes.
Following the mines closure amidst political unrest in December 2020, Vale has completed the sale of its nickel operations in New Caledonia. The new owner Prony Resources is expecting to restart operations in the June quarter and produce an estimated 20,000 tonnes of nickel in 2021. With the sale, the operation will be majority owned by New Caledonian interests. Tesla has also committed to a role as ‘technical advisor’ to the project.
Tsingshan announces significant ramp-up to Indonesia operations
In January 2020, the Indonesian government introduced a ban on nickel ores and concentrate exports, in order to promote the development of Indonesia’s nickel downstream capacity: including refinery, nickel pig iron and stainless steel capacity.
0
50
100
150
200
250
Mar–19 Sep–19 Mar–20 Sep–20 Mar–21
Thou
sand
tonn
es
China Rest of world European Union Japan Indonesia United States
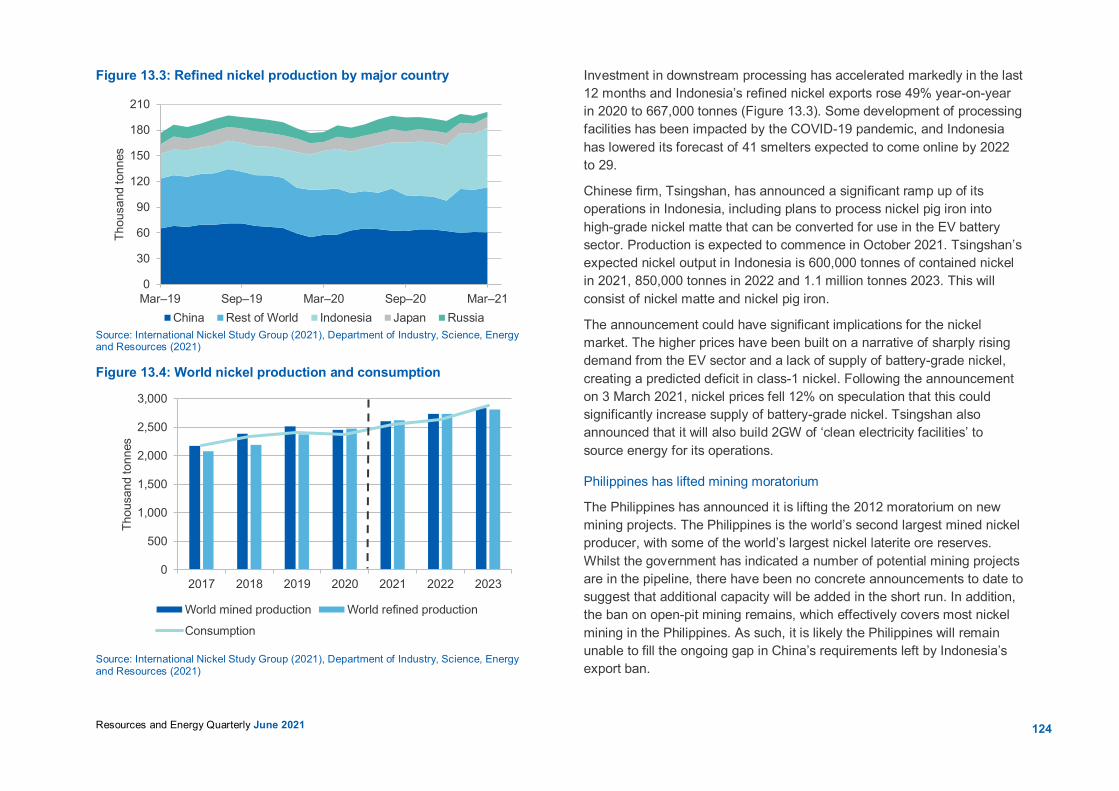
124Resources and Energy Quarterly June 2021
Figure 13.3: Refined nickel production by major country
Source: International Nickel Study Group (2021), Department of Industry, Science, Energy and Resources (2021)
Figure 13.4: World nickel production and consumption
Xx Paste figure here xx Source: International Nickel Study Group (2021), Department of Industry, Science, Energy
and Resources (2021)
Investment in downstream processing has accelerated markedly in the last 12 months and Indonesia’s refined nickel exports rose 49% year-on-year in 2020 to 667,000 tonnes (Figure 13.3). Some development of processing facilities has been impacted by the COVID-19 pandemic, and Indonesia has lowered its forecast of 41 smelters expected to come online by 2022 to 29.
Chinese firm, Tsingshan, has announced a significant ramp up of its operations in Indonesia, including plans to process nickel pig iron into high-grade nickel matte that can be converted for use in the EV battery sector. Production is expected to commence in October 2021. Tsingshan’s expected nickel output in Indonesia is 600,000 tonnes of contained nickel in 2021, 850,000 tonnes in 2022 and 1.1 million tonnes 2023. This will consist of nickel matte and nickel pig iron.
The announcement could have significant implications for the nickel market. The higher prices have been built on a narrative of sharply rising demand from the EV sector and a lack of supply of battery-grade nickel, creating a predicted deficit in class-1 nickel. Following the announcement on 3 March 2021, nickel prices fell 12% on speculation that this could significantly increase supply of battery-grade nickel. Tsingshan also announced that it will also build 2GW of ‘clean electricity facilities’ to source energy for its operations.
Philippines has lifted mining moratorium
The Philippines has announced it is lifting the 2012 moratorium on new mining projects. The Philippines is the world’s second largest mined nickel producer, with some of the world’s largest nickel laterite ore reserves. Whilst the government has indicated a number of potential mining projects are in the pipeline, there have been no concrete announcements to date to suggest that additional capacity will be added in the short run. In addition, the ban on open-pit mining remains, which effectively covers most nickel mining in the Philippines. As such, it is likely the Philippines will remain unable to fill the ongoing gap in China’s requirements left by Indonesia’s export ban.
0
500
1,000
1,500
2,000
2,500
3,000
2017 2018 2019 2020 2021 2022 2023
Thou
sand
tonn
es
World mined production World refined production
Consumption
0
30
60
90
120
150
180
210
Mar–19 Sep–19 Mar–20 Sep–20 Mar–21
Thou
sand
tonn
es
China Rest of World Indonesia Japan Russia
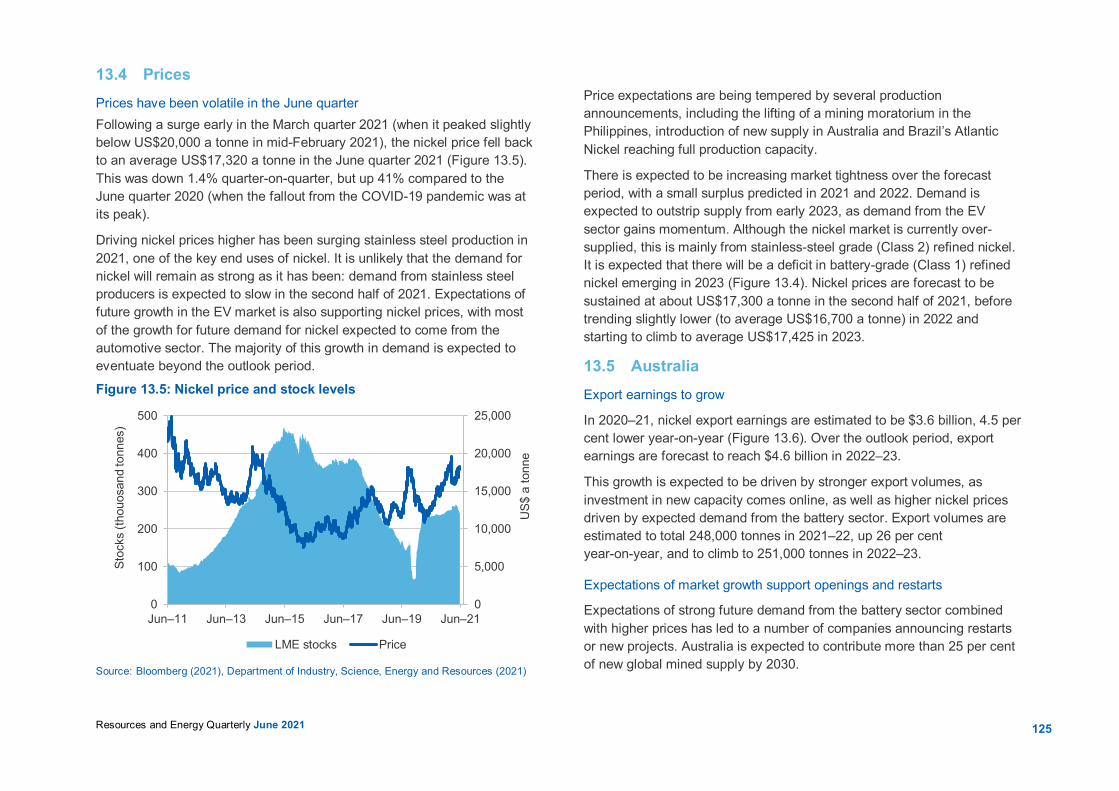
125Resources and Energy Quarterly June 2021
13.4 Prices Prices have been volatile in the June quarter Following a surge early in the March quarter 2021 (when it peaked slightly below US$20,000 a tonne in mid-February 2021), the nickel price fell back to an average US$17,320 a tonne in the June quarter 2021 (Figure 13.5). This was down 1.4% quarter-on-quarter, but up 41% compared to the June quarter 2020 (when the fallout from the COVID-19 pandemic was at its peak).
Driving nickel prices higher has been surging stainless steel production in 2021, one of the key end uses of nickel. It is unlikely that the demand for nickel will remain as strong as it has been: demand from stainless steel producers is expected to slow in the second half of 2021. Expectations of future growth in the EV market is also supporting nickel prices, with most of the growth for future demand for nickel expected to come from the automotive sector. The majority of this growth in demand is expected to eventuate beyond the outlook period.
Figure 13.5: Nickel price and stock levels
here Source: Bloomberg (2021), Department of Industry, Science, Energy and Resources (2021)
Price expectations are being tempered by several production announcements, including the lifting of a mining moratorium in the Philippines, introduction of new supply in Australia and Brazil’s Atlantic Nickel reaching full production capacity.
There is expected to be increasing market tightness over the forecast period, with a small surplus predicted in 2021 and 2022. Demand is expected to outstrip supply from early 2023, as demand from the EV sector gains momentum. Although the nickel market is currently over-supplied, this is mainly from stainless-steel grade (Class 2) refined nickel. It is expected that there will be a deficit in battery-grade (Class 1) refined nickel emerging in 2023 (Figure 13.4). Nickel prices are forecast to be sustained at about US$17,300 a tonne in the second half of 2021, before trending slightly lower (to average US$16,700 a tonne) in 2022 and starting to climb to average US$17,425 in 2023.
13.5 Australia Export earnings to grow
In 2020–21, nickel export earnings are estimated to be $3.6 billion, 4.5 per cent lower year-on-year (Figure 13.6). Over the outlook period, export earnings are forecast to reach $4.6 billion in 2022–23.
This growth is expected to be driven by stronger export volumes, as investment in new capacity comes online, as well as higher nickel prices driven by expected demand from the battery sector. Export volumes are estimated to total 248,000 tonnes in 2021–22, up 26 per cent year-on-year, and to climb to 251,000 tonnes in 2022–23.
Expectations of market growth support openings and restarts
Expectations of strong future demand from the battery sector combined with higher prices has led to a number of companies announcing restarts or new projects. Australia is expected to contribute more than 25 per cent of new global mined supply by 2030.
0
5,000
10,000
15,000
20,000
25,000
Jun–11 Jun–13 Jun–15 Jun–17 Jun–19 Jun–210
100
200
300
400
500
US$
a to
nne
Stoc
ks (t
houo
sand
tonn
es)
LME stocks Price
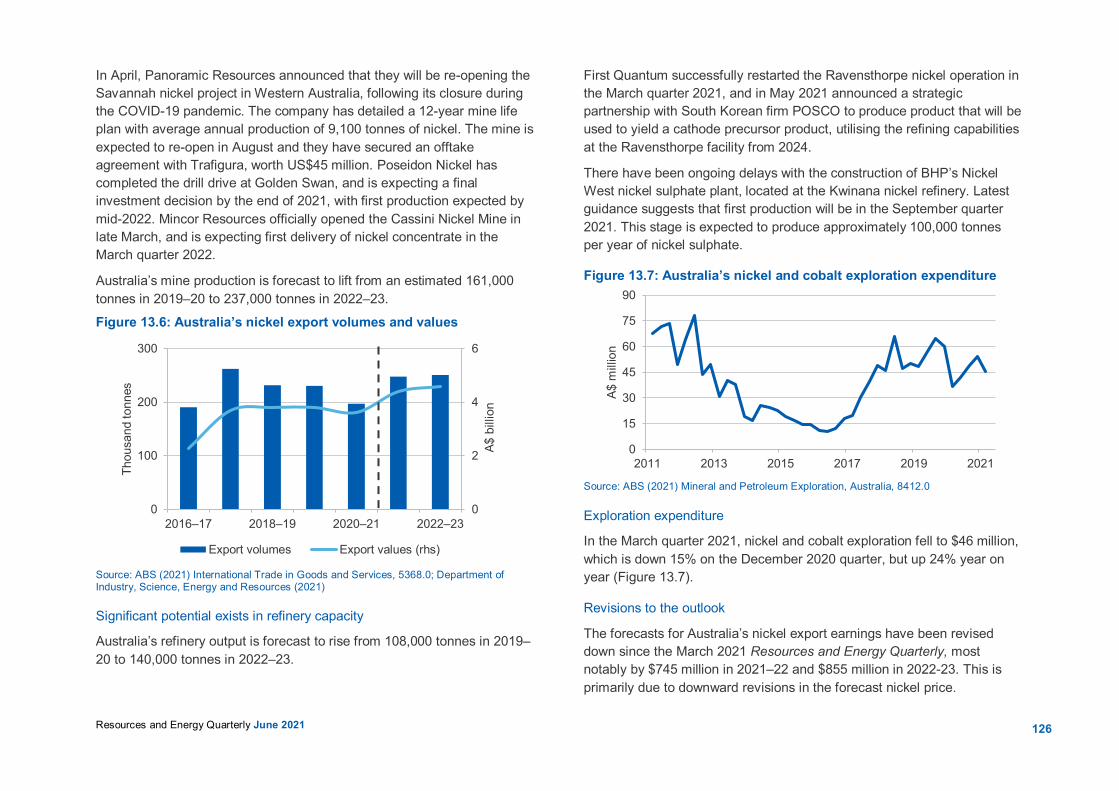
126Resources and Energy Quarterly June 2021
In April, Panoramic Resources announced that they will be re-opening the Savannah nickel project in Western Australia, following its closure during the COVID-19 pandemic. The company has detailed a 12-year mine life plan with average annual production of 9,100 tonnes of nickel. The mine is expected to re-open in August and they have secured an offtake agreement with Trafigura, worth US$45 million. Poseidon Nickel has completed the drill drive at Golden Swan, and is expecting a final investment decision by the end of 2021, with first production expected by mid-2022. Mincor Resources officially opened the Cassini Nickel Mine in late March, and is expecting first delivery of nickel concentrate in the March quarter 2022.
Australia’s mine production is forecast to lift from an estimated 161,000 tonnes in 2019–20 to 237,000 tonnes in 2022–23.
Figure 13.6: Australia’s nickel export volumes and values
Xx Paste figure here xx Source: ABS (2021) International Trade in Goods and Services, 5368.0; Department of
Industry, Science, Energy and Resources (2021)
Significant potential exists in refinery capacity
Australia’s refinery output is forecast to rise from 108,000 tonnes in 2019–20 to 140,000 tonnes in 2022–23.
First Quantum successfully restarted the Ravensthorpe nickel operation in the March quarter 2021, and in May 2021 announced a strategic partnership with South Korean firm POSCO to produce product that will be used to yield a cathode precursor product, utilising the refining capabilities at the Ravensthorpe facility from 2024.
There have been ongoing delays with the construction of BHP’s Nickel West nickel sulphate plant, located at the Kwinana nickel refinery. Latest guidance suggests that first production will be in the September quarter 2021. This stage is expected to produce approximately 100,000 tonnes per year of nickel sulphate. Figure 13.7: Australia’s nickel and cobalt exploration expenditure
Xx Paste figure here xx
Source: ABS (2021) Mineral and Petroleum Exploration, Australia, 8412.0
Exploration expenditure
In the March quarter 2021, nickel and cobalt exploration fell to $46 million, which is down 15% on the December 2020 quarter, but up 24% year on year (Figure 13.7).
Revisions to the outlook
The forecasts for Australia’s nickel export earnings have been revised down since the March 2021 Resources and Energy Quarterly, most notably by $745 million in 2021–22 and $855 million in 2022-23. This is primarily due to downward revisions in the forecast nickel price.
0
2
4
6
0
100
200
300
2016–17 2018–19 2020–21 2022–23
A$ b
illio
n
Thou
sand
tonn
es
Export volumes Export values (rhs)
0
15
30
45
60
75
90
2011 2013 2015 2017 2019 2021
A$ m
illio
n
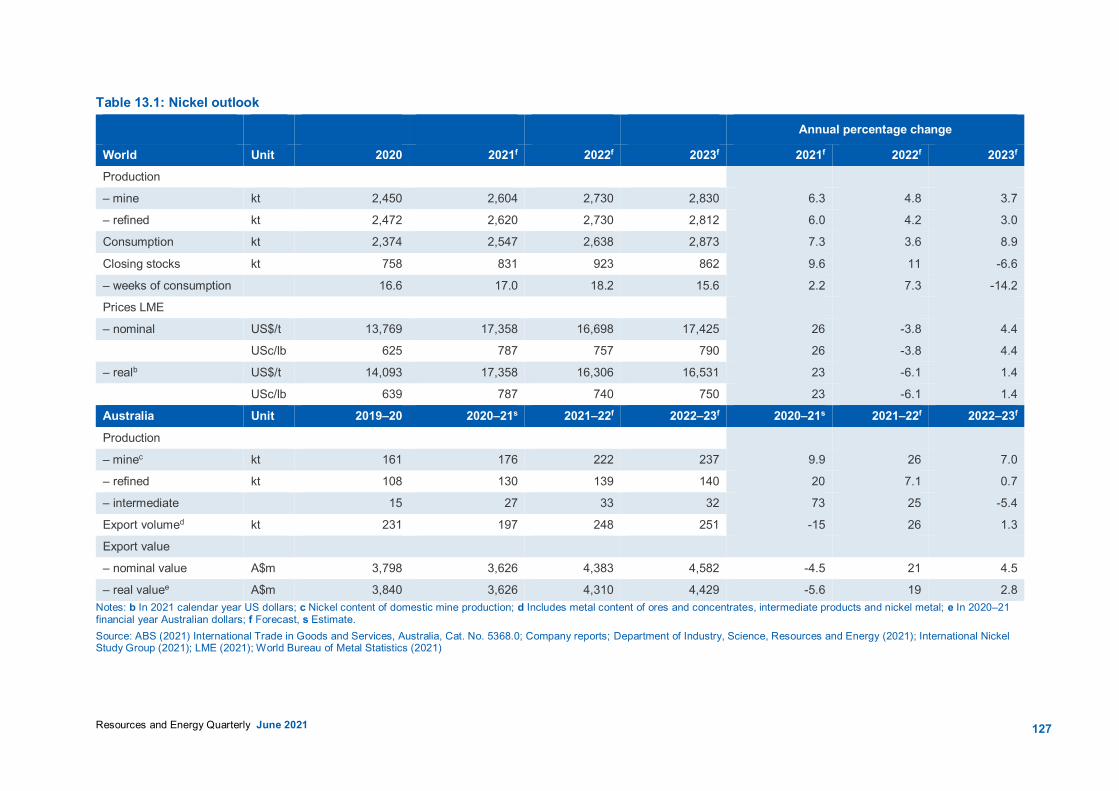
127Resources and Energy Quarterly June 2021
Table 13.1: Nickel outlook
Annual percentage change
World Unit 2020 2021f 2022f 2023f 2021f 2022f 2023f Production
– mine kt 2,450 2,604 2,730 2,830 6.3 4.8 3.7
– refined kt 2,472 2,620 2,730 2,812 6.0 4.2 3.0
Consumption kt 2,374 2,547 2,638 2,873 7.3 3.6 8.9
Closing stocks kt 758 831 923 862 9.6 11 -6.6
– weeks of consumption 16.6 17.0 18.2 15.6 2.2 7.3 -14.2
Prices LME
– nominal US$/t 13,769 17,358 16,698 17,425 26 -3.8 4.4
USc/lb 625 787 757 790 26 -3.8 4.4
– realb US$/t 14,093 17,358 16,306 16,531 23 -6.1 1.4
USc/lb 639 787 740 750 23 -6.1 1.4
Australia Unit 2019–20 2020–21s 2021–22f 2022–23f 2020–21s 2021–22f 2022–23f
Production
– minec kt 161 176 222 237 9.9 26 7.0
– refined kt 108 130 139 140 20 7.1 0.7
– intermediate 15 27 33 32 73 25 -5.4
Export volumed kt 231 197 248 251 -15 26 1.3
Export value
– nominal value A$m 3,798 3,626 4,383 4,582 -4.5 21 4.5
– real valuee A$m 3,840 3,626 4,310 4,429 -5.6 19 2.8 Notes: b In 2021 calendar year US dollars; c Nickel content of domestic mine production; d Includes metal content of ores and concentrates, intermediate products and nickel metal; e In 2020–21 financial year Australian dollars; f Forecast, s Estimate. Source: ABS (2021) International Trade in Goods and Services, Australia, Cat. No. 5368.0; Company reports; Department of Industry, Science, Resources and Energy (2021); International Nickel Study Group (2021); LME (2021); World Bureau of Metal Statistics (2021)
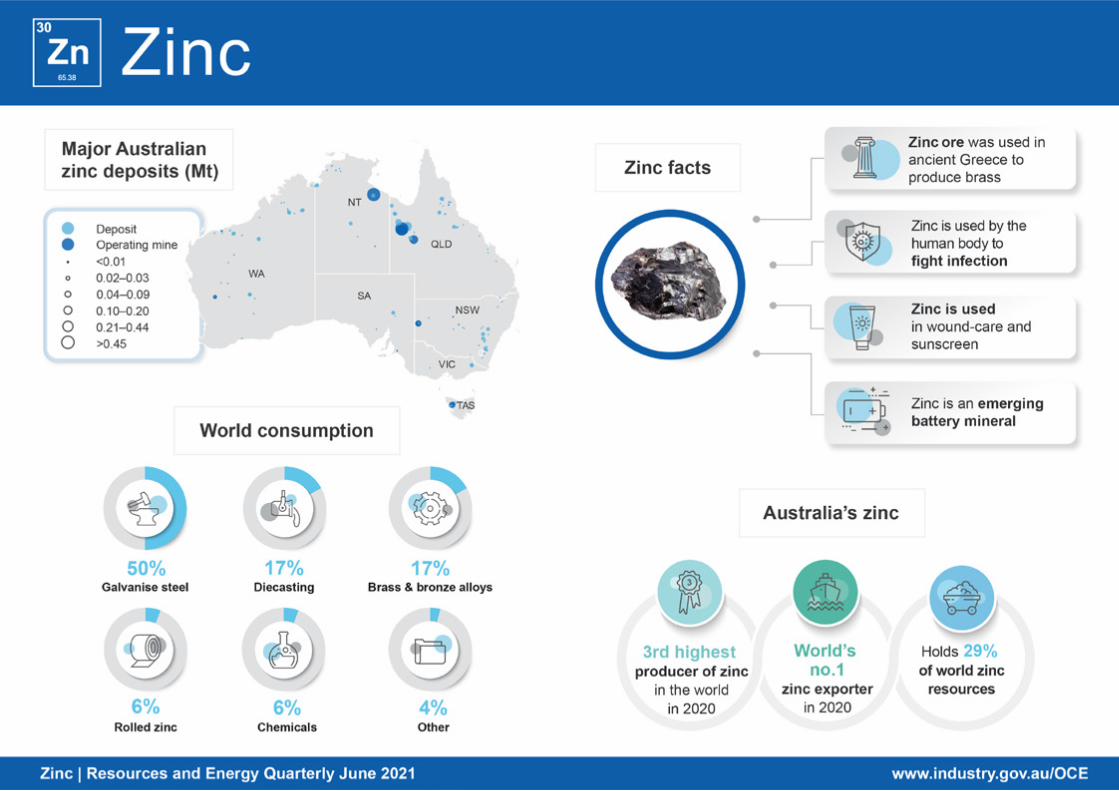
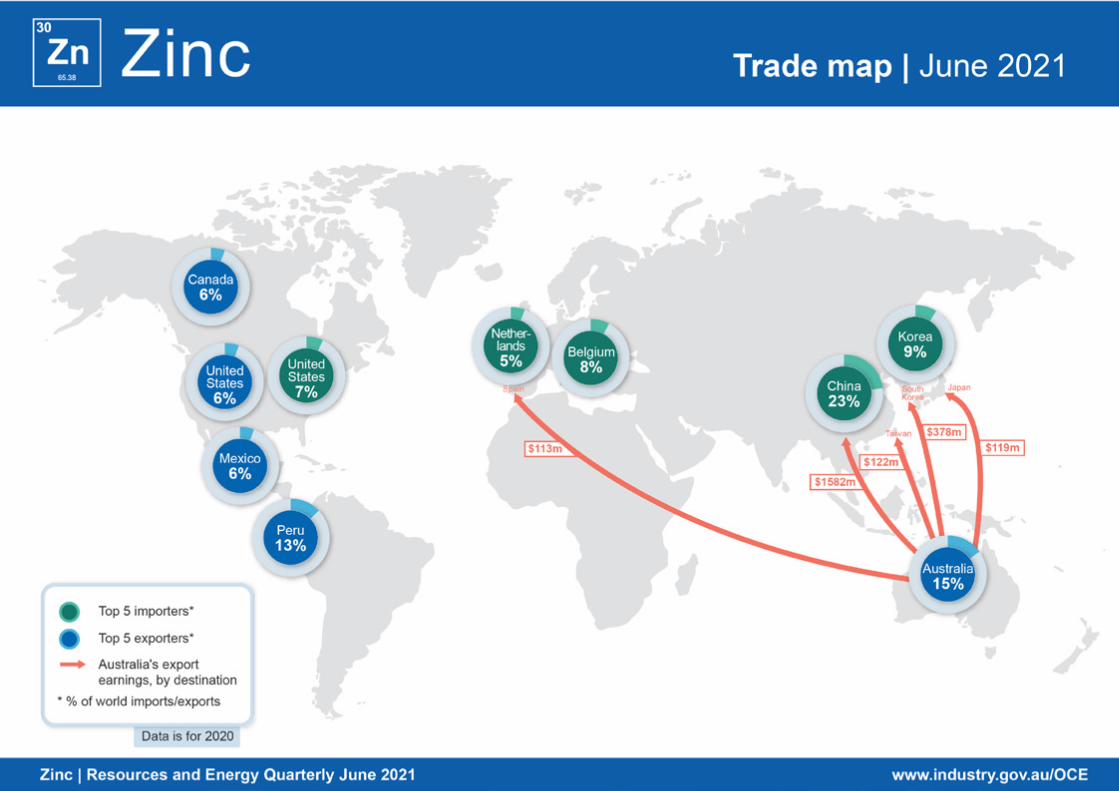
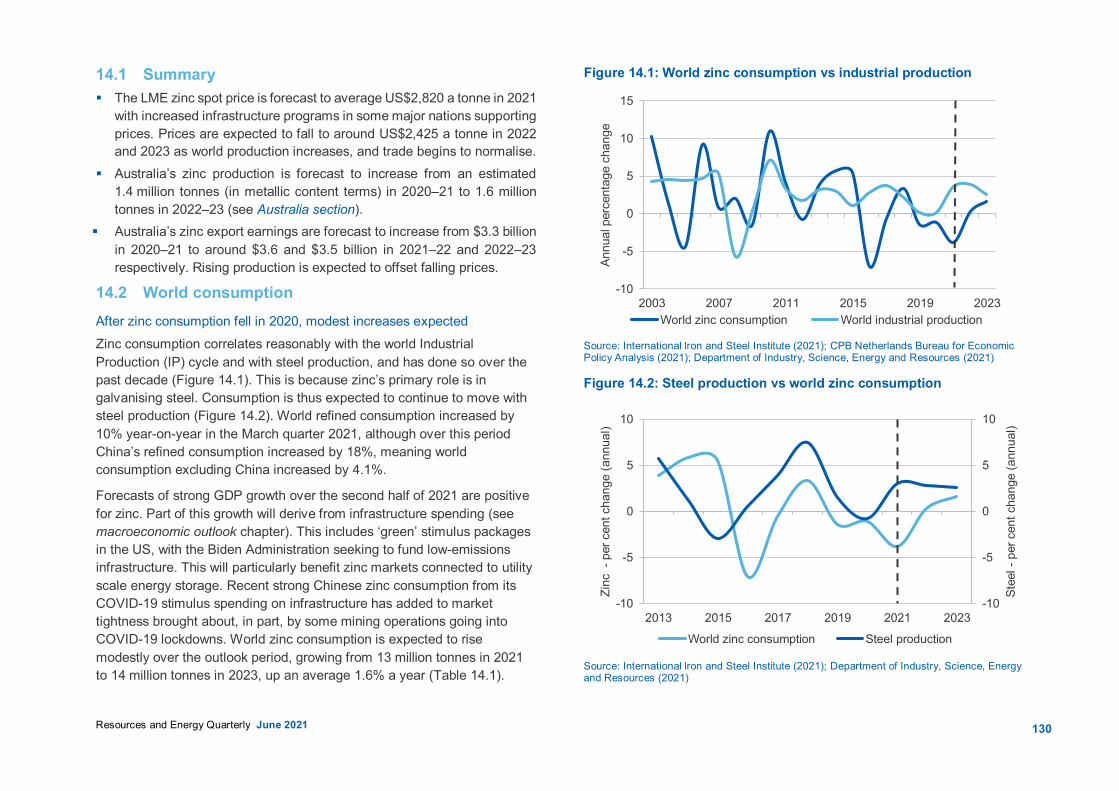
130Resources and Energy Quarterly June 2021
14.1 Summary The LME zinc spot price is forecast to average US$2,820 a tonne in 2021
with increased infrastructure programs in some major nations supporting prices. Prices are expected to fall to around US$2,425 a tonne in 2022 and 2023 as world production increases, and trade begins to normalise.
Australia’s zinc production is forecast to increase from an estimated 1.4 million tonnes (in metallic content terms) in 2020–21 to 1.6 million tonnes in 2022–23 (see Australia section).
Australia’s zinc export earnings are forecast to increase from $3.3 billion in 2020–21 to around $3.6 and $3.5 billion in 2021–22 and 2022–23 respectively. Rising production is expected to offset falling prices.
14.2 World consumption After zinc consumption fell in 2020, modest increases expected Zinc consumption correlates reasonably with the world Industrial Production (IP) cycle and with steel production, and has done so over the past decade (Figure 14.1). This is because zinc’s primary role is in galvanising steel. Consumption is thus expected to continue to move with steel production (Figure 14.2). World refined consumption increased by 10% year-on-year in the March quarter 2021, although over this period China’s refined consumption increased by 18%, meaning world consumption excluding China increased by 4.1%.
Forecasts of strong GDP growth over the second half of 2021 are positive for zinc. Part of this growth will derive from infrastructure spending (see macroeconomic outlook chapter). This includes ‘green’ stimulus packages in the US, with the Biden Administration seeking to fund low-emissions infrastructure. This will particularly benefit zinc markets connected to utility scale energy storage. Recent strong Chinese zinc consumption from its COVID-19 stimulus spending on infrastructure has added to market tightness brought about, in part, by some mining operations going into COVID-19 lockdowns. World zinc consumption is expected to rise modestly over the outlook period, growing from 13 million tonnes in 2021 to 14 million tonnes in 2023, up an average 1.6% a year (Table 14.1).
Figure 14.1: World zinc consumption vs industrial production Xx Paste
e here xx Source: International lron and Steel Institute (2021); CPB Netherlands Bureau for Economic Policy Analysis (2021); Department of Industry, Science, Energy and Resources (2021)
Figure 14.2: Steel production vs world zinc consumption Xx Paste
figure here xx Source: International lron and Steel Institute (2021); Department of Industry, Science, Energy and Resources (2021)
-10
-5
0
5
10
15
2003 2007 2011 2015 2019 2023
Annu
al p
erce
ntag
e ch
ange
World zinc consumption World industrial production
-10
-5
0
5
10
-10
-5
0
5
10
2013 2015 2017 2019 2021 2023
Stee
l -pe
r cen
t cha
nge
(ann
ual)
Zinc
-pe
r cen
t cha
nge
(ann
ual)
World zinc consumption Steel production
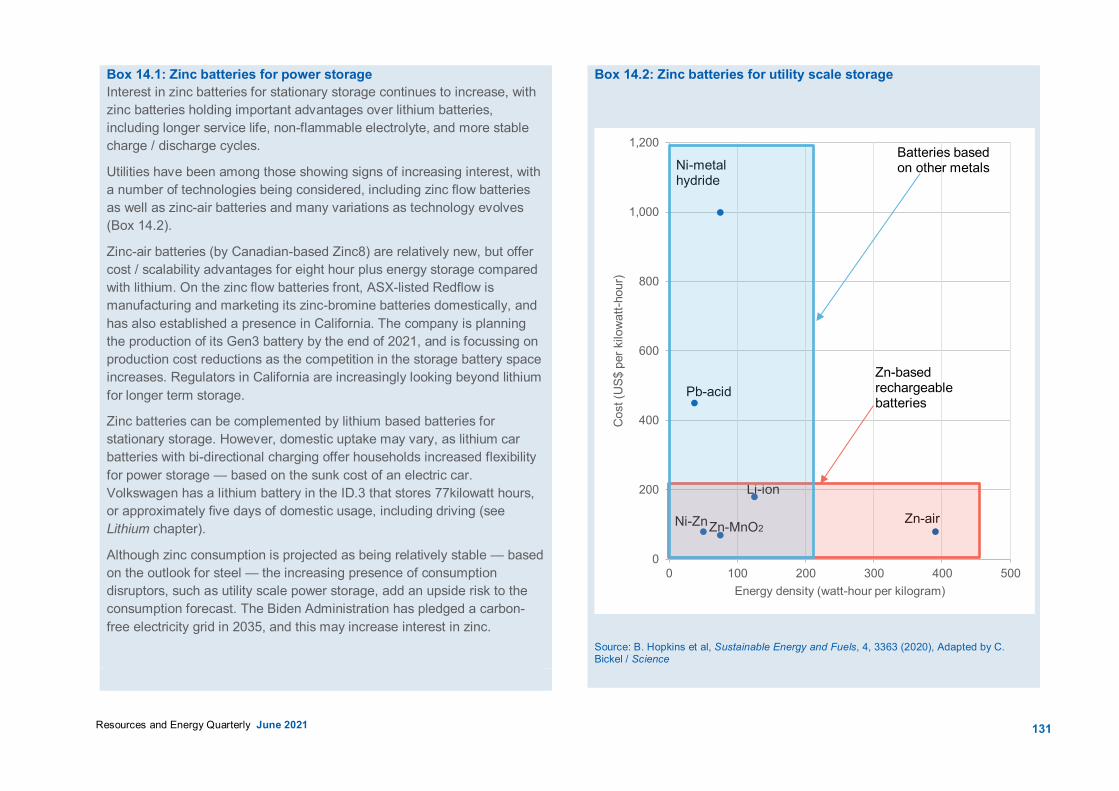
131Resources and Energy Quarterly June 2021
Box 14.1: Zinc batteries for power storage Interest in zinc batteries for stationary storage continues to increase, with zinc batteries holding important advantages over lithium batteries, including longer service life, non-flammable electrolyte, and more stable charge / discharge cycles.
Utilities have been among those showing signs of increasing interest, with a number of technologies being considered, including zinc flow batteries as well as zinc-air batteries and many variations as technology evolves (Box 14.2).
Zinc-air batteries (by Canadian-based Zinc8) are relatively new, but offer cost / scalability advantages for eight hour plus energy storage compared with lithium. On the zinc flow batteries front, ASX-listed Redflow is manufacturing and marketing its zinc-bromine batteries domestically, and has also established a presence in California. The company is planning the production of its Gen3 battery by the end of 2021, and is focussing on production cost reductions as the competition in the storage battery space increases. Regulators in California are increasingly looking beyond lithium for longer term storage.
Zinc batteries can be complemented by lithium based batteries for stationary storage. However, domestic uptake may vary, as lithium car batteries with bi-directional charging offer households increased flexibility for power storage — based on the sunk cost of an electric car. Volkswagen has a lithium battery in the ID.3 that stores 77kilowatt hours, or approximately five days of domestic usage, including driving (see Lithium chapter).
Although zinc consumption is projected as being relatively stable — based on the outlook for steel — the increasing presence of consumption disruptors, such as utility scale power storage, add an upside risk to the consumption forecast. The Biden Administration has pledged a carbon-free electricity grid in 2035, and this may increase interest in zinc.
Box 14.2: Zinc batteries for utility scale storage
Source: B. Hopkins et al, Sustainable Energy and Fuels, 4, 3363 (2020), Adapted by C. Bickel / Science
0
200
400
600
800
1,000
1,200
0 100 200 300 400 500
Cos
t (U
S$ p
er k
ilow
att-h
our)
Energy density (watt-hour per kilogram)
Ni-ZnZn-MnO2
Li-ion
Zn-air
Pb-acid
Ni-metal hydride
Zn-based rechargeable batteries
Batteries based on other metals
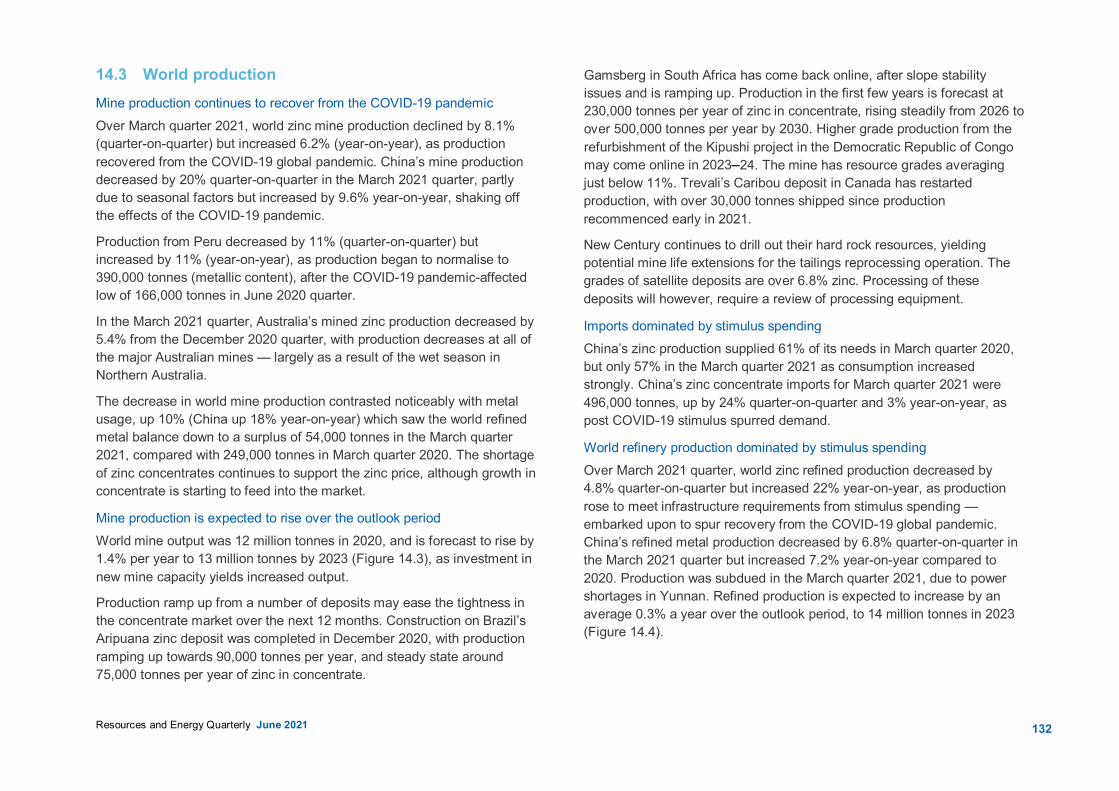
132Resources and Energy Quarterly June 2021
14.3 World production Mine production continues to recover from the COVID-19 pandemic Over March quarter 2021, world zinc mine production declined by 8.1% (quarter-on-quarter) but increased 6.2% (year-on-year), as production recovered from the COVID-19 global pandemic. China’s mine production decreased by 20% quarter-on-quarter in the March 2021 quarter, partly due to seasonal factors but increased by 9.6% year-on-year, shaking off the effects of the COVID-19 pandemic.
Production from Peru decreased by 11% (quarter-on-quarter) but increased by 11% (year-on-year), as production began to normalise to 390,000 tonnes (metallic content), after the COVID-19 pandemic-affected low of 166,000 tonnes in June 2020 quarter.
In the March 2021 quarter, Australia’s mined zinc production decreased by 5.4% from the December 2020 quarter, with production decreases at all of the major Australian mines — largely as a result of the wet season in Northern Australia.
The decrease in world mine production contrasted noticeably with metal usage, up 10% (China up 18% year-on-year) which saw the world refined metal balance down to a surplus of 54,000 tonnes in the March quarter 2021, compared with 249,000 tonnes in March quarter 2020. The shortage of zinc concentrates continues to support the zinc price, although growth in concentrate is starting to feed into the market.
Mine production is expected to rise over the outlook period World mine output was 12 million tonnes in 2020, and is forecast to rise by 1.4% per year to 13 million tonnes by 2023 (Figure 14.3), as investment in new mine capacity yields increased output.
Production ramp up from a number of deposits may ease the tightness in the concentrate market over the next 12 months. Construction on Brazil’s Aripuana zinc deposit was completed in December 2020, with production ramping up towards 90,000 tonnes per year, and steady state around 75,000 tonnes per year of zinc in concentrate.
Gamsberg in South Africa has come back online, after slope stability issues and is ramping up. Production in the first few years is forecast at 230,000 tonnes per year of zinc in concentrate, rising steadily from 2026 to over 500,000 tonnes per year by 2030. Higher grade production from the refurbishment of the Kipushi project in the Democratic Republic of Congo may come online in 2023–24. The mine has resource grades averaging just below 11%. Trevali’s Caribou deposit in Canada has restarted production, with over 30,000 tonnes shipped since production recommenced early in 2021.
New Century continues to drill out their hard rock resources, yielding potential mine life extensions for the tailings reprocessing operation. The grades of satellite deposits are over 6.8% zinc. Processing of these deposits will however, require a review of processing equipment.
Imports dominated by stimulus spending China’s zinc production supplied 61% of its needs in March quarter 2020, but only 57% in the March quarter 2021 as consumption increased strongly. China’s zinc concentrate imports for March quarter 2021 were 496,000 tonnes, up by 24% quarter-on-quarter and 3% year-on-year, as post COVID-19 stimulus spurred demand.
World refinery production dominated by stimulus spending Over March 2021 quarter, world zinc refined production decreased by 4.8% quarter-on-quarter but increased 22% year-on-year, as production rose to meet infrastructure requirements from stimulus spending —embarked upon to spur recovery from the COVID-19 global pandemic. China’s refined metal production decreased by 6.8% quarter-on-quarter in the March 2021 quarter but increased 7.2% year-on-year compared to 2020. Production was subdued in the March quarter 2021, due to power shortages in Yunnan. Refined production is expected to increase by an average 0.3% a year over the outlook period, to 14 million tonnes in 2023 (Figure 14.4).
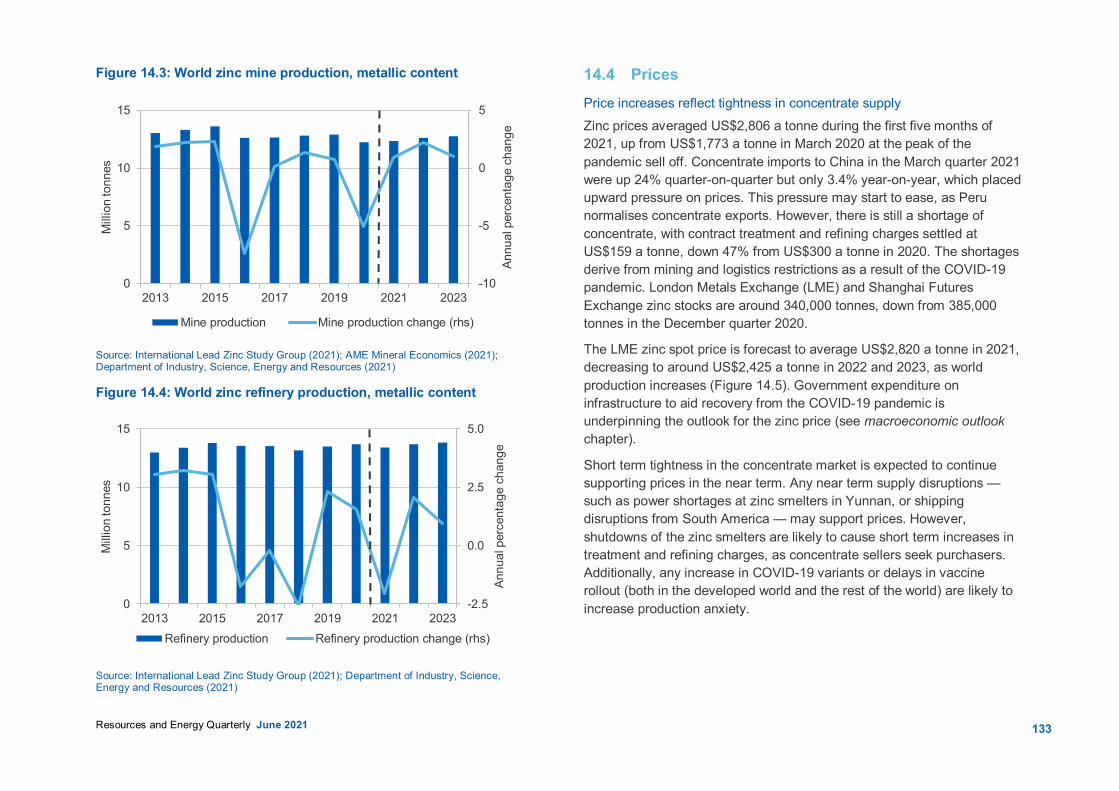
133Resources and Energy Quarterly June 2021
Figure 14.3: World zinc mine production, metallic content Xx Paste
Source: International Lead Zinc Study Group (2021); AME Mineral Economics (2021); Department of Industry, Science, Energy and Resources (2021)
Figure 14.4: World zinc refinery production, metallic content Xx Pas
figure here xx Source: International Lead Zinc Study Group (2021); Department of Industry, Science, Energy and Resources (2021)
14.4 Prices Price increases reflect tightness in concentrate supply Zinc prices averaged US$2,806 a tonne during the first five months of 2021, up from US$1,773 a tonne in March 2020 at the peak of the pandemic sell off. Concentrate imports to China in the March quarter 2021 were up 24% quarter-on-quarter but only 3.4% year-on-year, which placed upward pressure on prices. This pressure may start to ease, as Peru normalises concentrate exports. However, there is still a shortage of concentrate, with contract treatment and refining charges settled at US$159 a tonne, down 47% from US$300 a tonne in 2020. The shortages derive from mining and logistics restrictions as a result of the COVID-19 pandemic. London Metals Exchange (LME) and Shanghai Futures Exchange zinc stocks are around 340,000 tonnes, down from 385,000 tonnes in the December quarter 2020.
The LME zinc spot price is forecast to average US$2,820 a tonne in 2021, decreasing to around US$2,425 a tonne in 2022 and 2023, as world production increases (Figure 14.5). Government expenditure on infrastructure to aid recovery from the COVID-19 pandemic is underpinning the outlook for the zinc price (see macroeconomic outlook chapter).
Short term tightness in the concentrate market is expected to continue supporting prices in the near term. Any near term supply disruptions — such as power shortages at zinc smelters in Yunnan, or shipping disruptions from South America — may support prices. However, shutdowns of the zinc smelters are likely to cause short term increases in treatment and refining charges, as concentrate sellers seek purchasers. Additionally, any increase in COVID-19 variants or delays in vaccine rollout (both in the developed world and the rest of the world) are likely to increase production anxiety.
-10
-5
0
5
0
5
10
15
2013 2015 2017 2019 2021 2023
Annu
al p
erce
ntag
e ch
ange
Mill
ion
tonn
es
Mine production Mine production change (rhs)
-2.5
0.0
2.5
5.0
0
5
10
15
2013 2015 2017 2019 2021 2023
Annu
al p
erce
ntag
e ch
ange
Mill
ion
tonn
es
Refinery production Refinery production change (rhs)
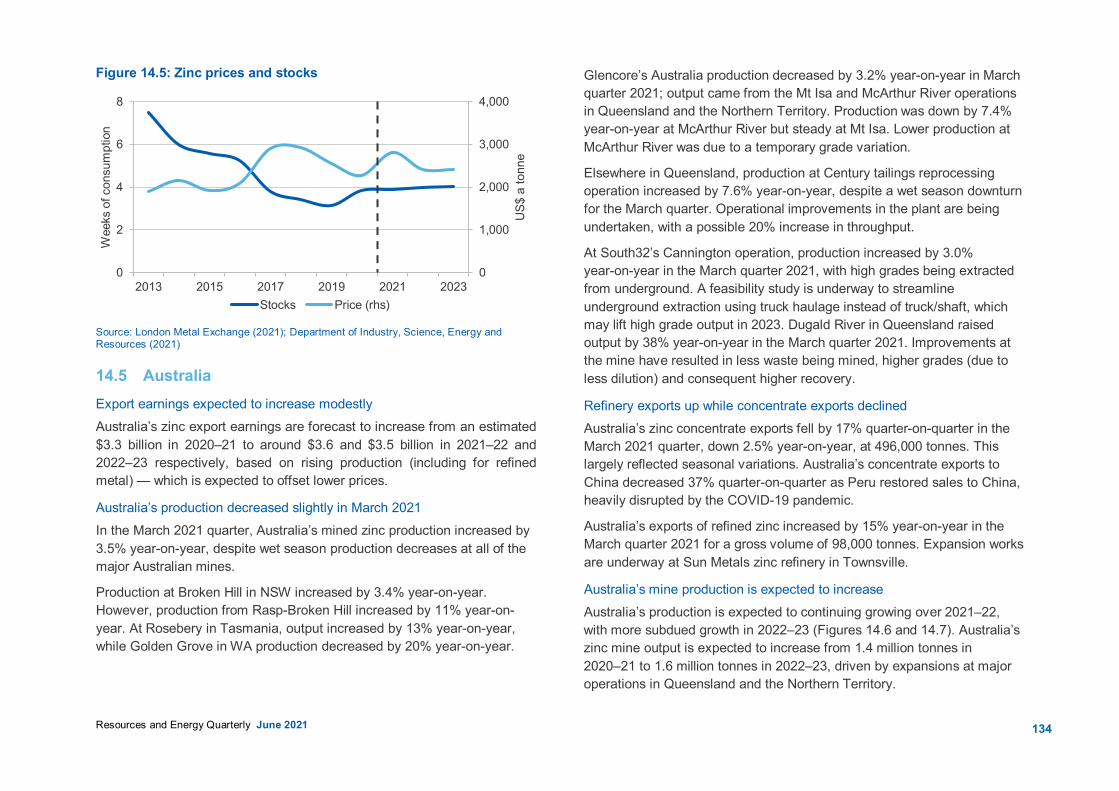
134Resources and Energy Quarterly June 2021
Figure 14.5: Zinc prices and stocks Xx Paste fig
re xx Source: London Metal Exchange (2021); Department of Industry, Science, Energy and Resources (2021)
14.5 Australia Export earnings expected to increase modestly Australia’s zinc export earnings are forecast to increase from an estimated $3.3 billion in 2020–21 to around $3.6 and $3.5 billion in 2021–22 and 2022–23 respectively, based on rising production (including for refined metal) — which is expected to offset lower prices.
Australia’s production decreased slightly in March 2021 In the March 2021 quarter, Australia’s mined zinc production increased by 3.5% year-on-year, despite wet season production decreases at all of the major Australian mines.
Production at Broken Hill in NSW increased by 3.4% year-on-year. However, production from Rasp-Broken Hill increased by 11% year-on-year. At Rosebery in Tasmania, output increased by 13% year-on-year, while Golden Grove in WA production decreased by 20% year-on-year.
Glencore’s Australia production decreased by 3.2% year-on-year in March quarter 2021; output came from the Mt Isa and McArthur River operations in Queensland and the Northern Territory. Production was down by 7.4% year-on-year at McArthur River but steady at Mt Isa. Lower production at McArthur River was due to a temporary grade variation.
Elsewhere in Queensland, production at Century tailings reprocessing operation increased by 7.6% year-on-year, despite a wet season downturn for the March quarter. Operational improvements in the plant are being undertaken, with a possible 20% increase in throughput.
At South32’s Cannington operation, production increased by 3.0% year-on-year in the March quarter 2021, with high grades being extracted from underground. A feasibility study is underway to streamline underground extraction using truck haulage instead of truck/shaft, which may lift high grade output in 2023. Dugald River in Queensland raised output by 38% year-on-year in the March quarter 2021. Improvements at the mine have resulted in less waste being mined, higher grades (due to less dilution) and consequent higher recovery.
Refinery exports up while concentrate exports declined Australia’s zinc concentrate exports fell by 17% quarter-on-quarter in the March 2021 quarter, down 2.5% year-on-year, at 496,000 tonnes. This largely reflected seasonal variations. Australia’s concentrate exports to China decreased 37% quarter-on-quarter as Peru restored sales to China, heavily disrupted by the COVID-19 pandemic.
Australia’s exports of refined zinc increased by 15% year-on-year in the March quarter 2021 for a gross volume of 98,000 tonnes. Expansion works are underway at Sun Metals zinc refinery in Townsville.
Australia’s mine production is expected to increase Australia’s production is expected to continuing growing over 2021–22, with more subdued growth in 2022–23 (Figures 14.6 and 14.7). Australia’s zinc mine output is expected to increase from 1.4 million tonnes in 2020–21 to 1.6 million tonnes in 2022–23, driven by expansions at major operations in Queensland and the Northern Territory.
0
1,000
2,000
3,000
4,000
0
2
4
6
8
2013 2015 2017 2019 2021 2023
US$
a to
nne
Wee
ks o
f con
sum
ptio
n
Stocks Price (rhs)

135Resources and Energy Quarterly June 2021
Refined production Increasing refined zinc production from the expansion of Korean-owned Sun Metals’ smelter is due in 2021, adding 50,000 tonnes per year once fully ramped up. Sun Metals’ zinc smelter is located near Townsville. Australia’s refined production is forecast to be steady after 2022.
Exploration expenditure decreased in the March quarter 2021 Exploration expenditure for silver, lead and zinc decreased by 43% quarter-on-quarter for the March quarter 2021. However, over the same period the zinc price appreciated by 4.6% quarter-on-quarter (Figure 14.8). This decline in exploration is likely related to Northern Australia wet season factors. When comparing year-on-year, exploration increased 94% for the March quarter 2021, while the zinc price appreciated 29% over the corresponding period, thus demonstrating the more traditional relationship between commodity prices and exploration.
Figure 14.8 Quarterly exploration expenditure versus zinc prices
re xx
Source: ABS (2021) Mineral and Petroleum Exploration, Australia, 8412.0; Company reports; Department of Industry, Science, Energy and Resources (2021)
Figure 14.6: Australia’s zinc mine output by state, metallic content
re xx
Source: Company reports; Department of Industry, Science, Energy and Resources (2021)
Figure 14.7: Australia’s zinc exports, metallic content
re xx
Source: Source: ABS (2021) International Trade in Goods and Services, 5368.0; Department of Industry, Science, Energy and Resources (2021)
0
10
20
30
40
0
1,000
2,000
3,000
4,000
Mar-11 Mar-13 Mar-15 Mar-17 Mar-19 Mar-21
A$ m
illio
n
US$
a to
nne
Silver, lead, and zinc exploration expenditure (rhs)LME zinc price
0
500
1,000
1,500
2,000
2012–13 2014–15 2016–17 2018–19 2020–21 2022–23
Thou
sand
tonn
es
QLD NT NSW WA TAS SA VIC
0
2
4
6
8
0
500
1,000
1,500
2,000
2012–13 2014–15 2016–17 2018–19 2020–21 2022–23
A$ b
illio
n
Thou
sand
tonn
es
Volumes Values (rhs)
136Resources and Energy Quarterly June 2021
14.6 Revisions to the outlook Australia’s zinc export earnings are estimated at $3.3 billion for 2020–21 and forecast at $3.6 and $3.5 billion for 2021–22 and 2022–23 respectively.
Compared with the March 2021 Resources and Energy Quarterly, estimates for export revenue were revised down 3.6% for 2020–21, due to wet season events in Northern Australia that affected mine production at Century as well as other mine specific events. Revenue forecasts for the remainder for the outlook period have been revised up, by 6.7% for 2021– 22 and 1.0% for 2022–23. This resulted from a combination of higher forecast mined volume as well as slightly increased refined output.
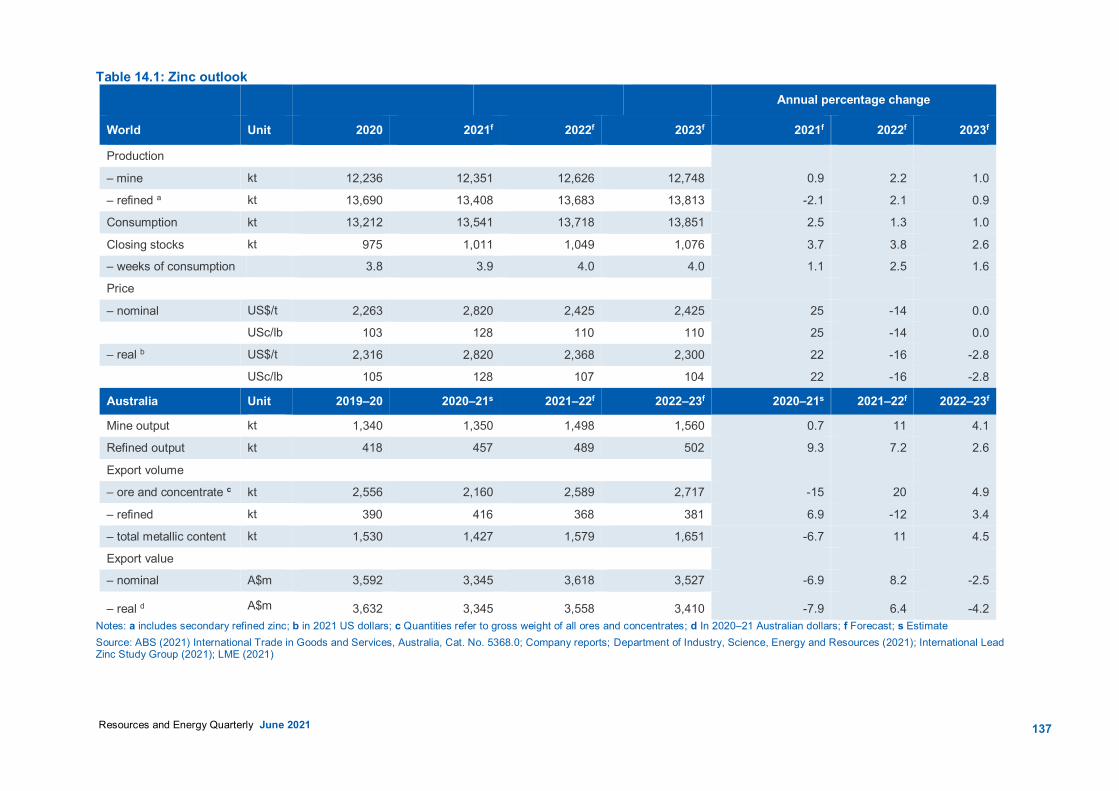
137 Resources and Energy Quarterly June 2021
Table 14.1: Zinc outlook Annual percentage change
World Unit 2020 2021f 2022f 2023f 2021f 2022f 2023f
Production
– mine kt 12,236 12,351 12,626 12,748 0.9 2.2 1.0
– refined a kt 13,690 13,408 13,683 13,813 -2.1 2.1 0.9
Consumption kt 13,212 13,541 13,718 13,851 2.5 1.3 1.0
Closing stocks kt 975 1,011 1,049 1,076 3.7 3.8 2.6
– weeks of consumption 3.8 3.9 4.0 4.0 1.1 2.5 1.6
Price
– nominal US$/t 2,263 2,820 2,425 2,425 25 -14 0.0
USc/lb 103 128 110 110 25 -14 0.0
– real b US$/t 2,316 2,820 2,368 2,300 22 -16 -2.8
USc/lb 105 128 107 104 22 -16 -2.8
Australia Unit 2019–20 2020–21s 2021–22f 2022–23f 2020–21s 2021–22f 2022–23f
Mine output kt 1,340 1,350 1,498 1,560 0.7 11 4.1
Refined output kt 418 457 489 502 9.3 7.2 2.6
Export volume
– ore and concentrate c kt 2,556 2,160 2,589 2,717 -15 20 4.9
– refined kt 390 416 368 381 6.9 -12 3.4
– total metallic content kt 1,530 1,427 1,579 1,651 -6.7 11 4.5
Export value
– nominal A$m 3,592 3,345 3,618 3,527 -6.9 8.2 -2.5
– real d A$m 3,632 3,345 3,558 3,410 -7.9 6.4 -4.2 Notes: a includes secondary refined zinc; b in 2021 US dollars; c Quantities refer to gross weight of all ores and concentrates; d In 2020–21 Australian dollars; f Forecast; s Estimate Source: ABS (2021) International Trade in Goods and Services, Australia, Cat. No. 5368.0; Company reports; Department of Industry, Science, Energy and Resources (2021); International Lead Zinc Study Group (2021); LME (2021)
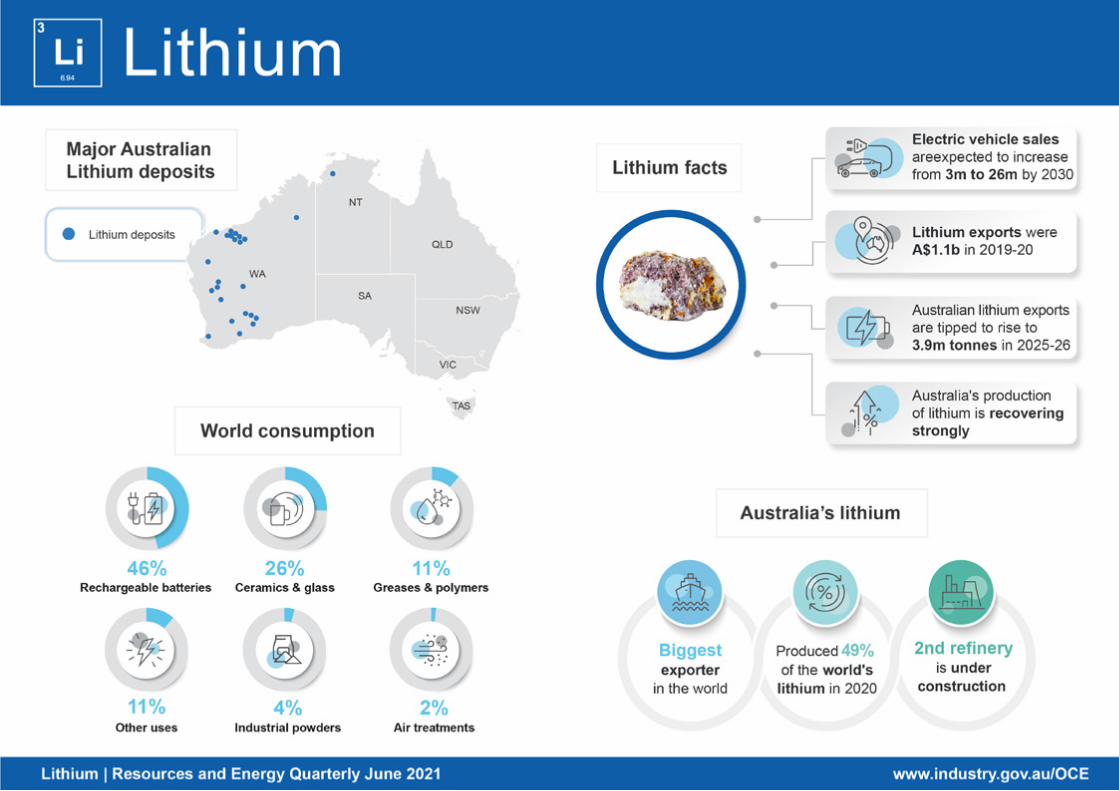
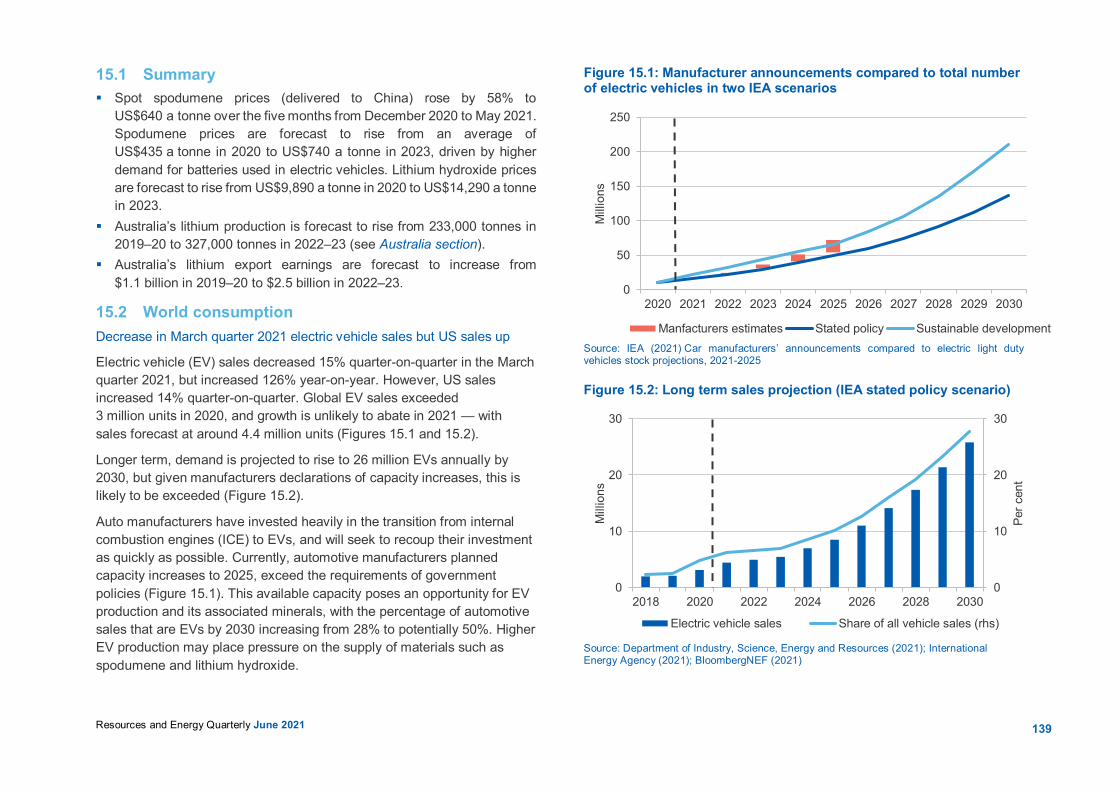
139Resources and Energy Quarterly June 2021
15.1 Summary Spot spodumene prices (delivered to China) rose by 58% to
US$640 a tonne over the five months from December 2020 to May 2021. Spodumene prices are forecast to rise from an average of US$435 a tonne in 2020 to US$740 a tonne in 2023, driven by higher demand for batteries used in electric vehicles. Lithium hydroxide prices are forecast to rise from US$9,890 a tonne in 2020 to US$14,290 a tonne in 2023.
Australia’s lithium production is forecast to rise from 233,000 tonnes in 2019–20 to 327,000 tonnes in 2022–23 (see Australia section).
Australia’s lithium export earnings are forecast to increase from $1.1 billion in 2019–20 to $2.5 billion in 2022–23.
15.2 World consumption Decrease in March quarter 2021 electric vehicle sales but US sales up
Electric vehicle (EV) sales decreased 15% quarter-on-quarter in the March quarter 2021, but increased 126% year-on-year. However, US sales increased 14% quarter-on-quarter. Global EV sales exceeded 3 million units in 2020, and growth is unlikely to abate in 2021 — with sales forecast at around 4.4 million units (Figures 15.1 and 15.2).
Longer term, demand is projected to rise to 26 million EVs annually by 2030, but given manufacturers declarations of capacity increases, this is likely to be exceeded (Figure 15.2).
Auto manufacturers have invested heavily in the transition from internal combustion engines (ICE) to EVs, and will seek to recoup their investment as quickly as possible. Currently, automotive manufacturers planned capacity increases to 2025, exceed the requirements of government policies (Figure 15.1). This available capacity poses an opportunity for EV production and its associated minerals, with the percentage of automotive sales that are EVs by 2030 increasing from 28% to potentially 50%. Higher EV production may place pressure on the supply of materials such as spodumene and lithium hydroxide.
Figure 15.1: Manufacturer announcements compared to total number of electric vehicles in two IEA scenarios
Source: IEA (2021) Car manufacturers’ announcements compared to electric light duty vehicles stock projections, 2021-2025
Figure 15.2: Long term sales projection (IEA stated policy scenario)
Source: Department of Industry, Science, Energy and Resources (2021); International Energy Agency (2021); BloombergNEF (2021)
0
50
100
150
200
250
2020 2021 2022 2023 2024 2025 2026 2027 2028 2029 2030
Mill
ions
Manfacturers estimates Stated policy Sustainable development
0
10
20
30
0
10
20
30
2018 2020 2022 2024 2026 2028 2030
Per c
ent
Mill
ions
Electric vehicle sales Share of all vehicle sales (rhs)
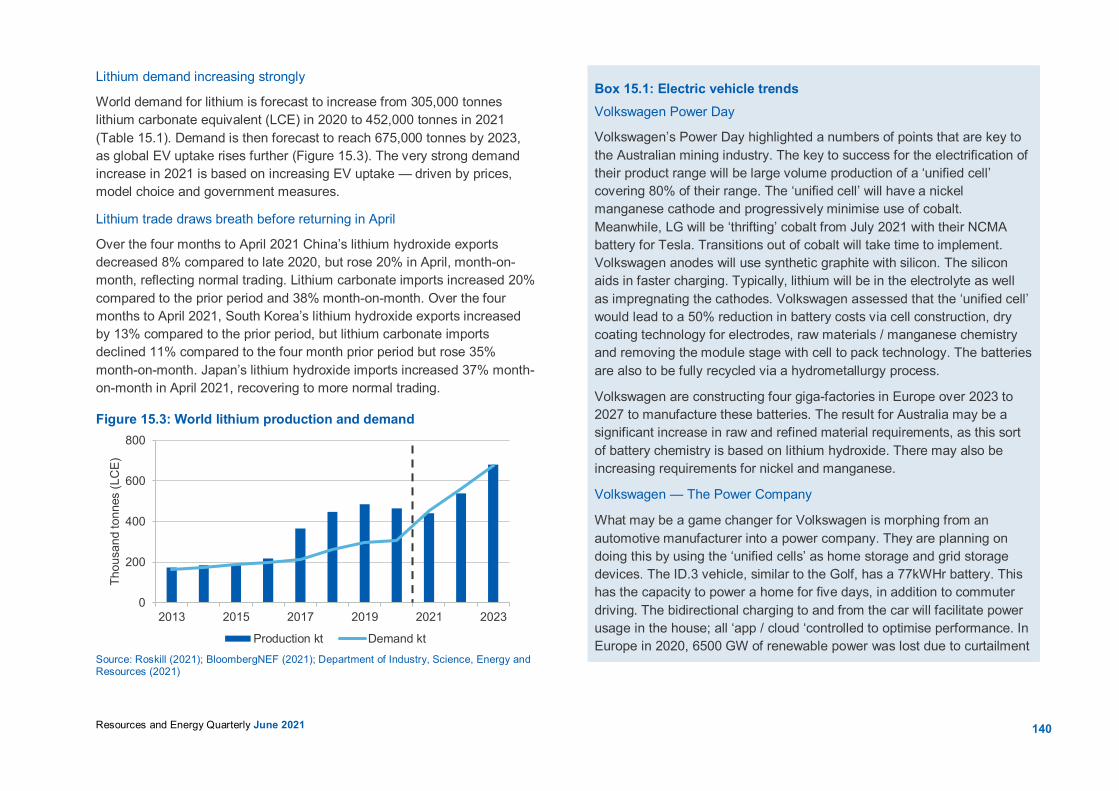
140Resources and Energy Quarterly June 2021
Lithium demand increasing strongly
World demand for lithium is forecast to increase from 305,000 tonnes lithium carbonate equivalent (LCE) in 2020 to 452,000 tonnes in 2021 (Table 15.1). Demand is then forecast to reach 675,000 tonnes by 2023, as global EV uptake rises further (Figure 15.3). The very strong demand increase in 2021 is based on increasing EV uptake — driven by prices, model choice and government measures.
Lithium trade draws breath before returning in April
Over the four months to April 2021 China’s lithium hydroxide exports decreased 8% compared to late 2020, but rose 20% in April, month-on-month, reflecting normal trading. Lithium carbonate imports increased 20% compared to the prior period and 38% month-on-month. Over the four months to April 2021, South Korea’s lithium hydroxide exports increased by 13% compared to the prior period, but lithium carbonate imports declined 11% compared to the four month prior period but rose 35% month-on-month. Japan’s lithium hydroxide imports increased 37% month-on-month in April 2021, recovering to more normal trading.
Figure 15.3: World lithium production and demand
Source: Roskill (2021); BloombergNEF (2021); Department of Industry, Science, Energy and Resources (2021)
Box 15.1: Electric vehicle trends Volkswagen Power Day
Volkswagen’s Power Day highlighted a numbers of points that are key to the Australian mining industry. The key to success for the electrification of their product range will be large volume production of a ‘unified cell’ covering 80% of their range. The ‘unified cell’ will have a nickel manganese cathode and progressively minimise use of cobalt. Meanwhile, LG will be ‘thrifting’ cobalt from July 2021 with their NCMA battery for Tesla. Transitions out of cobalt will take time to implement. Volkswagen anodes will use synthetic graphite with silicon. The silicon aids in faster charging. Typically, lithium will be in the electrolyte as well as impregnating the cathodes. Volkswagen assessed that the ‘unified cell’ would lead to a 50% reduction in battery costs via cell construction, dry coating technology for electrodes, raw materials / manganese chemistry and removing the module stage with cell to pack technology. The batteries are also to be fully recycled via a hydrometallurgy process.
Volkswagen are constructing four giga-factories in Europe over 2023 to 2027 to manufacture these batteries. The result for Australia may be a significant increase in raw and refined material requirements, as this sort of battery chemistry is based on lithium hydroxide. There may also be increasing requirements for nickel and manganese.
Volkswagen — The Power Company
What may be a game changer for Volkswagen is morphing from an automotive manufacturer into a power company. They are planning on doing this by using the ‘unified cells’ as home storage and grid storage devices. The ID.3 vehicle, similar to the Golf, has a 77kWHr battery. This has the capacity to power a home for five days, in addition to commuter driving. The bidirectional charging to and from the car will facilitate power usage in the house; all ‘app / cloud ‘controlled to optimise performance. In Europe in 2020, 6500 GW of renewable power was lost due to curtailment
0
200
400
600
800
2013 2015 2017 2019 2021 2023
Thou
sand
tonn
es (L
CE)
Production kt Demand kt
141Resources and Energy Quarterly June 2021
which could have been reduced with more energy storage. The implementation of a cheap ‘unified cell’ via the ID.3 and other vehicles could be a significant development for Europe in terms of energy storage, utilisation and emissions reduction. It could also be a game changer for Australia in terms of raw and refined battery-materials demand.
US Green deal
Unprecedented expenditure by the US Administration to offset the impact of the COVID-19 pandemic is underway, with fiscal measures potentially equalling 25% of GDP. The current package before Congress is aimed at ‘green’ infrastructure (see overview and macroeconomic chapters). This expenditure, along with the EU’s plans, are underpinning the growth story for battery minerals.
Fast charging and solid state batteries
Silicon used for fast charging is one step towards an 80% charge of a standard car battery in 30 minutes. However, the move to solid state batteries, along with lithium anodes, may reduce charge times for 80% of standard car batteries to around 12 minutes. The move to solid state would likely increase the demand for lithium again, although it is not due to be rolled out extensively until around 2030. Solid state technology has a longer driving range and is safer. Volkswagen are working with Quantum Scape in California; one of the main solid state battery developers. Other producers from Japan and China are set to launch solid state batteries beyond the outlook period (2026) but Toyota may do this sooner.
Recycling
The Volkswagen recycling plant for lithium batteries in Salzgitter, Germany, will be essential to delivering on its ESG credentials and supplying recycled materials vital to its supply chain. The plant is small scale, but will be used to develop and scale up technology in this area, as large lithium batteries become available for end-of-life recycling. Statutory requirements covering battery life cycle and supply chain in Europe may come into effect by 1 January 2022.
15.3 World production Security of supply being sought, as world demand lifts
Output in 2021 is forecast at 441,000 tonnes LCE, while production is forecast at 538,000 tonnes LCE in 2022, and 679,000 tonnes by 2023. At this stage, supply may fall short of demand unless mine and brine operations are expanded beyond initial projections.
‘Green’ stimulus packages are adding tightness to the market, apparent in the appreciation of the spodumene price. Additionally, offtake and equity investments continue, suggesting security of supply may be a significant issue going forward.
Project development is accelerating
Galaxy Resources and Orocobre are joining forces with key operations in Argentina to produce lithium carbonate. This will make the merged company the 5th largest lithium producer in the world, after Gangfeng, Albemarle, Tianqi and Sociedad Quimica y Minera de Chile (SQM). The company will be based in Buena Aries, along with a corporate presence on Australia’s east coast and an office in Perth. Spodumene production from Mt Cattlin will continue, with James Bay in Canada being considered for development for spodumene.
Galaxy’s Sal de Vida project is planned to commence at 10,700 tonnes per year lithium carbonate equivalent (LCE), increasing in stages to 32,000 tonnes. Early works are underway and first output of lithium carbonate is possible in 2022. Meanwhile production from Orocobre’s Olaroz operation was 12,000 tonnes per year LCE in 2021, with construction underway for 22,000 tonnes in 2022 and feasibility studies for further expansions.
Chile’s SQM is positioning itself to more than double production over the next few years. It plans to raise annual Chilean production from 70,000 tonnes of lithium carbonate to 120,000 by the end of 2021 and 180,000 tonnes by 2023. Lithium hydroxide annual production capacity is expected to increase from 13,500 to 21,000 tonnes by the end of 2021, before reaching 30,000 tonnes by 2023.

142Resources and Energy Quarterly June 2021
Livent is planning to increase annual lithium carbonate production from 20,000 tonnes to 40,000 tonnes by the end of 2024 via its Argentine assets. They are also incrementing annual lithium hydroxide production from 25,000 to 30,000 tonnes by late 2022. Albemarle’s La Negra III and IV expansion projects in Chile, with an additional 40,000 tonnes per year of LCE capacity, are due for completion in 2022. Albemarle’s Kemerton lithium refinery in Western Australia is due to ramp up in 2022 towards 50,000 tonnes per year of lithium hydroxide.
In Australia, Kathleen Valley, near Kalgoorlie, is due to complete their feasibility in 2021, with production possible in 2024 at 50,000 tonnes per year (LCE). The deposit is similar in size and grade to Mt Holland. In the Democratic Republic of Congo, ASX listed AVZ Minerals signed additional offtake agreements, with 80% of production now contracted. Yibin Tianqi currently holds about 8% of the company’s stock. Production is forecast at 100,000 tonnes per year (LCE). In Mali, ASX listed Firefinch have signed a joint venture with Gangfeng at 65,000 tonnes per year (LCE). For all proposed increases, full output may take longer than initially scheduled.
Ternary battery or lithium iron phosphate battery?
Lithium iron phosphate (LFP) battery usage has continued strongly, but there are limitations on the driving range, despite recent cell to pack layout (CTP) improvements. CTP can also be used in ternary batteries and thus increase driving range, lowering the advantage of LFP batteries. Lithium hydroxide is generally used in ‘ternary’ batteries; thereby increasing demand for hydroxide. Ternary batteries generally also contain nickel plus two other metals; often cobalt plus manganese.
Outlook positive for battery grade lithium products
Demand for battery grade lithium hydroxide is projected to grow at an annual average rate of 27% over 2020 to 2030, whilst demand for battery grade carbonate is projected to grow by 17% per year (Figures 15.4 and 15.5). Bottlenecks in supply at refineries may cause short term supply issues.
Figure 15.4: World demand and Australian lithium hydroxide output
Notes: Lithium hydroxide projections are subject to uncertainty, due to construction disruption from the COVID-19 pandemic and ramp up risks. Source: BNEF (2021); Department of Industry, Science, Energy and Resources (2021)
Figure 15.5: Refined lithium demand
Notes: Units in terms of lithium carbonate equivalent (LCE); TG is technical grade; BG is battery grade Source: Roskill (2021); Department of Industry, Science, Energy and Resources (2021)
0
5
10
15
20
0
200
400
600
800
2020 2021 2022 2023 2024 2025 2026
Perc
enta
ge o
f glo
bal p
rodu
ctio
n
Thou
sand
tonn
es
Global demand Australian production (rhs)
0
500
1,000
1,500
2,000
2,500
0
20
40
60
80
100
2020 2022 2024 2026 2028 2030
Thou
sand
tonn
es L
CE
Perc
enta
ge o
f ref
ined
dem
and
Carbonate BG Hydroxide BG Mineral conc. TGCarbonate TG Hydroxide TG OtherTotal
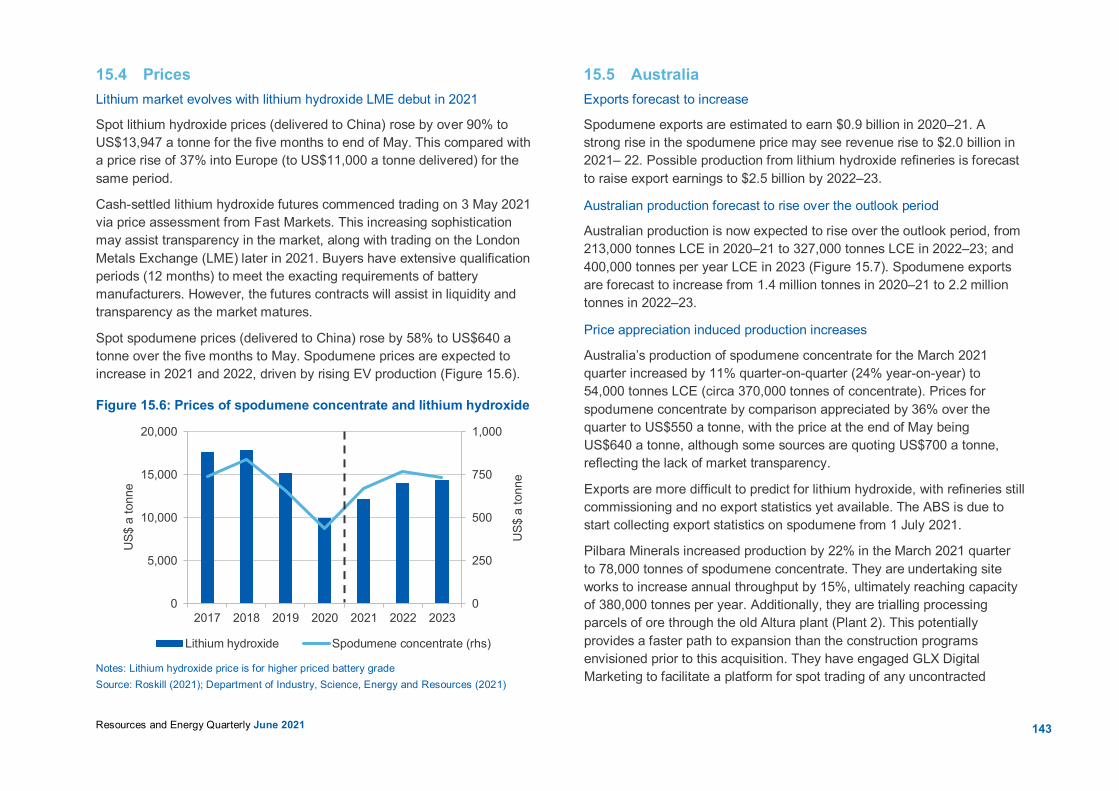
143Resources and Energy Quarterly June 2021
15.4 Prices Lithium market evolves with lithium hydroxide LME debut in 2021
Spot lithium hydroxide prices (delivered to China) rose by over 90% to US$13,947 a tonne for the five months to end of May. This compared with a price rise of 37% into Europe (to US$11,000 a tonne delivered) for the same period.
Cash-settled lithium hydroxide futures commenced trading on 3 May 2021 via price assessment from Fast Markets. This increasing sophistication may assist transparency in the market, along with trading on the London Metals Exchange (LME) later in 2021. Buyers have extensive qualification periods (12 months) to meet the exacting requirements of battery manufacturers. However, the futures contracts will assist in liquidity and transparency as the market matures.
Spot spodumene prices (delivered to China) rose by 58% to US$640 a tonne over the five months to May. Spodumene prices are expected to increase in 2021 and 2022, driven by rising EV production (Figure 15.6).
Figure 15.6: Prices of spodumene concentrate and lithium hydroxide
Notes: Lithium hydroxide price is for higher priced battery grade Source: Roskill (2021); Department of Industry, Science, Energy and Resources (2021)
15.5 Australia Exports forecast to increase
Spodumene exports are estimated to earn $0.9 billion in 2020–21. A strong rise in the spodumene price may see revenue rise to $2.0 billion in 2021– 22. Possible production from lithium hydroxide refineries is forecast to raise export earnings to $2.5 billion by 2022–23.
Australian production forecast to rise over the outlook period
Australian production is now expected to rise over the outlook period, from 213,000 tonnes LCE in 2020–21 to 327,000 tonnes LCE in 2022–23; and 400,000 tonnes per year LCE in 2023 (Figure 15.7). Spodumene exports are forecast to increase from 1.4 million tonnes in 2020–21 to 2.2 million tonnes in 2022–23.
Price appreciation induced production increases
Australia’s production of spodumene concentrate for the March 2021 quarter increased by 11% quarter-on-quarter (24% year-on-year) to 54,000 tonnes LCE (circa 370,000 tonnes of concentrate). Prices for spodumene concentrate by comparison appreciated by 36% over the quarter to US$550 a tonne, with the price at the end of May being US$640 a tonne, although some sources are quoting US$700 a tonne, reflecting the lack of market transparency.
Exports are more difficult to predict for lithium hydroxide, with refineries still commissioning and no export statistics yet available. The ABS is due to start collecting export statistics on spodumene from 1 July 2021.
Pilbara Minerals increased production by 22% in the March 2021 quarter to 78,000 tonnes of spodumene concentrate. They are undertaking site works to increase annual throughput by 15%, ultimately reaching capacity of 380,000 tonnes per year. Additionally, they are trialling processing parcels of ore through the old Altura plant (Plant 2). This potentially provides a faster path to expansion than the construction programs envisioned prior to this acquisition. They have engaged GLX Digital Marketing to facilitate a platform for spot trading of any uncontracted
0
250
500
750
1,000
0
5,000
10,000
15,000
20,000
2017 2018 2019 2020 2021 2022 2023
US$
a to
nne
US$
a to
nne
Lithium hydroxide Spodumene concentrate (rhs)
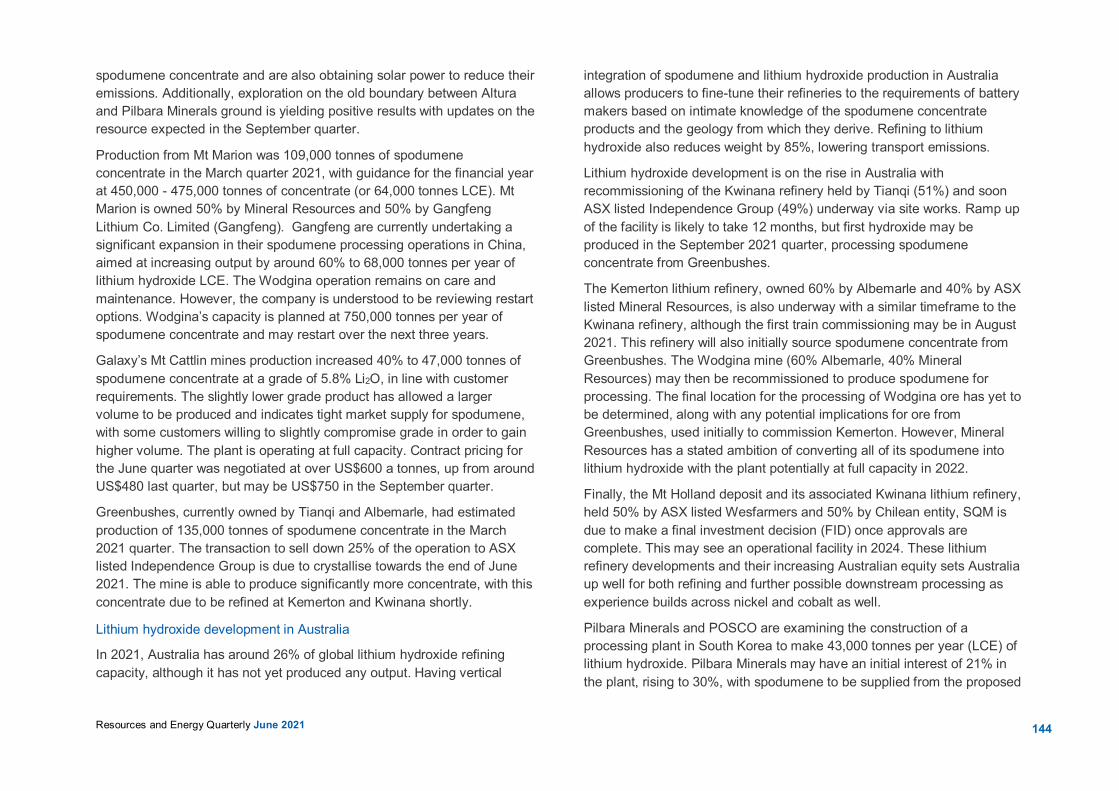
144Resources and Energy Quarterly June 2021
spodumene concentrate and are also obtaining solar power to reduce their emissions. Additionally, exploration on the old boundary between Altura and Pilbara Minerals ground is yielding positive results with updates on the resource expected in the September quarter.
Production from Mt Marion was 109,000 tonnes of spodumene concentrate in the March quarter 2021, with guidance for the financial year at 450,000 - 475,000 tonnes of concentrate (or 64,000 tonnes LCE). Mt Marion is owned 50% by Mineral Resources and 50% by Gangfeng Lithium Co. Limited (Gangfeng). Gangfeng are currently undertaking a significant expansion in their spodumene processing operations in China, aimed at increasing output by around 60% to 68,000 tonnes per year of lithium hydroxide LCE. The Wodgina operation remains on care and maintenance. However, the company is understood to be reviewing restart options. Wodgina’s capacity is planned at 750,000 tonnes per year of spodumene concentrate and may restart over the next three years.
Galaxy’s Mt Cattlin mines production increased 40% to 47,000 tonnes of spodumene concentrate at a grade of 5.8% Li2O, in line with customer requirements. The slightly lower grade product has allowed a larger volume to be produced and indicates tight market supply for spodumene, with some customers willing to slightly compromise grade in order to gain higher volume. The plant is operating at full capacity. Contract pricing for the June quarter was negotiated at over US$600 a tonnes, up from around US$480 last quarter, but may be US$750 in the September quarter.
Greenbushes, currently owned by Tianqi and Albemarle, had estimated production of 135,000 tonnes of spodumene concentrate in the March 2021 quarter. The transaction to sell down 25% of the operation to ASX listed Independence Group is due to crystallise towards the end of June 2021. The mine is able to produce significantly more concentrate, with this concentrate due to be refined at Kemerton and Kwinana shortly.
Lithium hydroxide development in Australia
In 2021, Australia has around 26% of global lithium hydroxide refining capacity, although it has not yet produced any output. Having vertical
integration of spodumene and lithium hydroxide production in Australia allows producers to fine-tune their refineries to the requirements of battery makers based on intimate knowledge of the spodumene concentrate products and the geology from which they derive. Refining to lithium hydroxide also reduces weight by 85%, lowering transport emissions.
Lithium hydroxide development is on the rise in Australia with recommissioning of the Kwinana refinery held by Tianqi (51%) and soon ASX listed Independence Group (49%) underway via site works. Ramp up of the facility is likely to take 12 months, but first hydroxide may be produced in the September 2021 quarter, processing spodumene concentrate from Greenbushes.
The Kemerton lithium refinery, owned 60% by Albemarle and 40% by ASX listed Mineral Resources, is also underway with a similar timeframe to the Kwinana refinery, although the first train commissioning may be in August 2021. This refinery will also initially source spodumene concentrate from Greenbushes. The Wodgina mine (60% Albemarle, 40% Mineral Resources) may then be recommissioned to produce spodumene for processing. The final location for the processing of Wodgina ore has yet to be determined, along with any potential implications for ore from Greenbushes, used initially to commission Kemerton. However, Mineral Resources has a stated ambition of converting all of its spodumene into lithium hydroxide with the plant potentially at full capacity in 2022.
Finally, the Mt Holland deposit and its associated Kwinana lithium refinery, held 50% by ASX listed Wesfarmers and 50% by Chilean entity, SQM is due to make a final investment decision (FID) once approvals are complete. This may see an operational facility in 2024. These lithium refinery developments and their increasing Australian equity sets Australia up well for both refining and further possible downstream processing as experience builds across nickel and cobalt as well.
Pilbara Minerals and POSCO are examining the construction of a processing plant in South Korea to make 43,000 tonnes per year (LCE) of lithium hydroxide. Pilbara Minerals may have an initial interest of 21% in the plant, rising to 30%, with spodumene to be supplied from the proposed

145Resources and Energy Quarterly June 2021
Stage 2 expansion of Pilgangoora. The expansion is expected to supply 315,000 tonnes additional concentrate annually, but an FID hasn’t been made. Pilbara Minerals is also conducting a scoping study into the production of ‘lithium salts’ — a ‘mid-stream product’ on the way to lithium hydroxide, allowing for more refining before sale. The scoping study is being conducted on a vertical kiln, as opposed to the traditional ‘rotary kiln’, which may offer flexibility advantages compared with the Kwinana and Kemerton refineries. Potential production from lithium hydroxide is forecast to lift export earnings to $2.5 billion by 2022–23 (Figure 15.8).
Core Lithium is in the process of completing a definitive feasibility study for its Finniss deposit, close to Darwin. The project recently gained ‘Major Project’ status and successfully applied for a mineral lease; granting Core mining rights. Core have produced lithium hydroxide from samples of spodumene. Core are also undertaking further exploration, with a view to extending their proposed mine life.
Cathode precursor development in Australia
First Quantum have announced the sale of 30% of their Ravensthorpe nickel and cobalt mine to POSCO. Production from the mine may now be used to yield a cathode precursor product (see nickel chapter). The Future Batteries Industry Cooperative Research Centre at Curtin University is undertaking pilot plant production of cathode precursor with a number of sponsors, including BASF from Germany, BHP and Independence Group. Value-adding continues along the supply chain, with many Australian companies participating and most spodumene miners considering refining. There is growing interest in US listings by potential electrode and cell manufacturers (Tables 15.2 & 15.3, Figure 15.9).
Revisions to the outlook
Exports in 2021–22 have been revised up by 44%, from $1.4 billion to $2.0 billion, reflecting the very strong gains in the spodumene price. Spodumene prices closed at US$405 a tonne at the end of 2020, but have appreciated to US$640 a tonne; well above the March forecast of US$508 a tonne for 2021.
Figure 15.7: Australia’s spodumene concentrate production
Notes: Lithium hydroxide is not included. Source: Company reports; Roskill (2021); Department of Industry, Science, Energy and Resources (2021)
Figure 15.8: Australia’s lithium exports
Notes: Income figures include lithium hydroxide and spodumene volumes contain hydroxide. Source: Company reports; Roskill (2021); Department of Industry, Science, Energy and Resources (2021)
0
100
200
300
400
500
2015 2017 2019 2021 2023
Thou
sand
tonn
es L
CE
0
1,000
2,000
3,000
4,000
0
100
200
300
400
2014–15 2016–17 2018–19 2020–21 2022–23
A$ m
illio
n
Thou
sand
tonn
es L
CE
Volumes Values (rhs)

146 Resources and Energy Quarterly June 2021
Figure 15.9: Projected global value of lithium supply chain (& zinc utility scale batteries)
Notes: Values are for lithium batteries only. Redflow is currently producing zinc batteries in Australia. Zinc batteries are suitable for utility scale storage. Source: Adapted from Porteous et al, Office of the Chief Scientist (2018) Taking Charge: The Energy Storage Opportunity for Australia
EnginesCars
ChargersPower
• Tritium (US NASDAQ Listing?)
• GB Auto• HyperPower
• Safescape• ASEAN Powerlink
VALUE 2025: ?
Electric vehicle & charging
Manufacture, deploy, manage
• Energy Renaissance
• Redflow (Zinc batteries)
VALUE 2025: $1680 billion
Battery pack assembly
Sinter / Assemble
• Magnis Energy (US NASDAQ listing)?
• Redflow (Zinc batteries)
VALUE 2025: $550 billion
Battery cell production
Li(NixMnyCoz)O2
LiMnFePGraphite
• FBICRC• BHP• IGO
• BASF• Rensacor
• Novonix (Seelking NASDAQ Listing)• Lithium Australia
VALUE 2025: $385 billion
Precursor / battery chemical
LiOH, Li2CO3
• Tianqi• IGO
• Albemarle• Mineral Resources
• Pilbara
VALUE 2025: $63 billion
Refine / Process
Hard rock vs brinePilbara Minerals
• Tianqi• IGO
• Albemarle• Mineral Resources
• Core Lithium• Galaxy / Orocobre
(Australia, Argentina, Canada)
• Liontown Resources
• Piedmont (US -NASDAQ listed)• Vulcan Energy
(Germany)
VALUE 2025:$26 billion
Mine / Concentrate
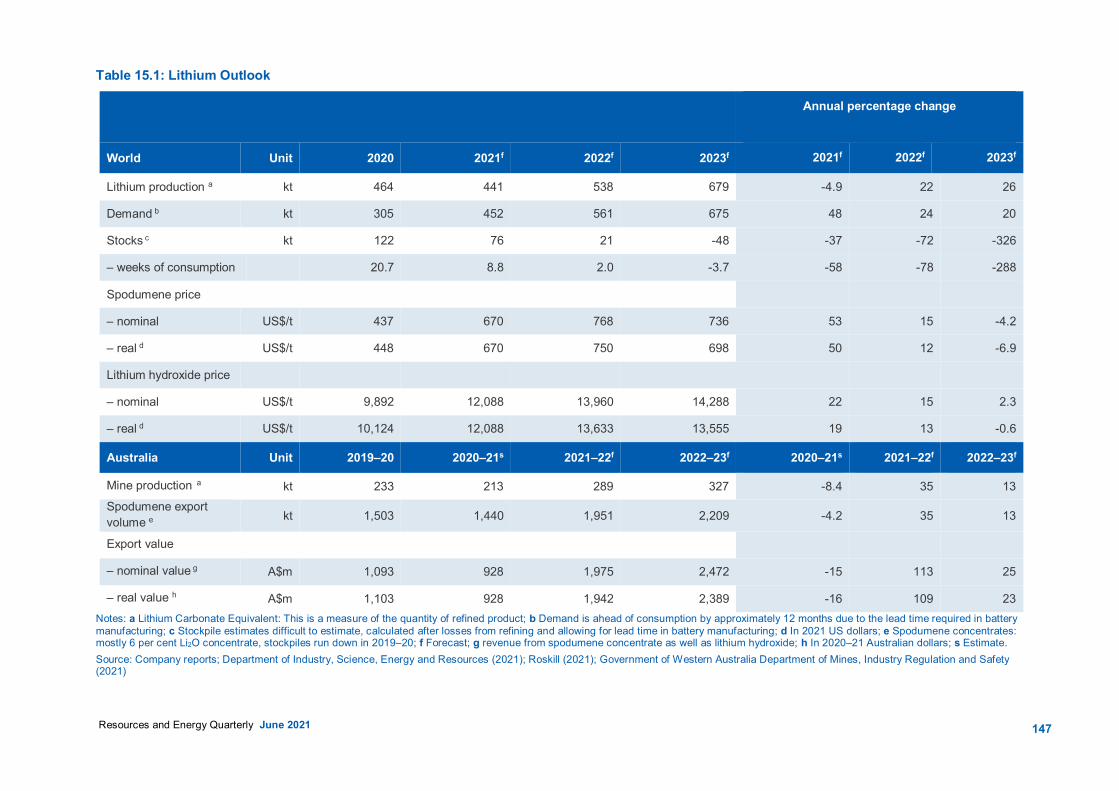
147 Resources and Energy Quarterly June 2021
Table 15.1: Lithium Outlook
Annual percentage change
World Unit 2020 2021f 2022f 2023f 2021f 2022f 2023f
Lithium production a kt 464 441 538 679 -4.9 22 26
Demand b kt 305 452 561 675 48 24 20
Stocks c kt 122 76 21 -48 -37 -72 -326
– weeks of consumption 20.7 8.8 2.0 -3.7 -58 -78 -288
Spodumene price
– nominal US$/t 437 670 768 736 53 15 -4.2
– real d US$/t 448 670 750 698 50 12 -6.9
Lithium hydroxide price
– nominal US$/t 9,892 12,088 13,960 14,288 22 15 2.3
– real d US$/t 10,124 12,088 13,633 13,555 19 13 -0.6
Australia Unit 2019–20 2020–21s 2021–22f 2022–23f 2020–21s 2021–22f 2022–23f
Mine production a kt 233 213 289 327 -8.4 35 13 Spodumene export volume e kt 1,503 1,440 1,951 2,209 -4.2 35 13
Export value
– nominal value g A$m 1,093 928 1,975 2,472 -15 113 25
– real value h A$m 1,103 928 1,942 2,389 -16 109 23 Notes: a Lithium Carbonate Equivalent: This is a measure of the quantity of refined product; b Demand is ahead of consumption by approximately 12 months due to the lead time required in battery manufacturing; c Stockpile estimates difficult to estimate, calculated after losses from refining and allowing for lead time in battery manufacturing; d In 2021 US dollars; e Spodumene concentrates: mostly 6 per cent Li2O concentrate, stockpiles run down in 2019–20; f Forecast; g revenue from spodumene concentrate as well as lithium hydroxide; h In 2020–21 Australian dollars; s Estimate. Source: Company reports; Department of Industry, Science, Energy and Resources (2021); Roskill (2021); Government of Western Australia Department of Mines, Industry Regulation and Safety (2021)
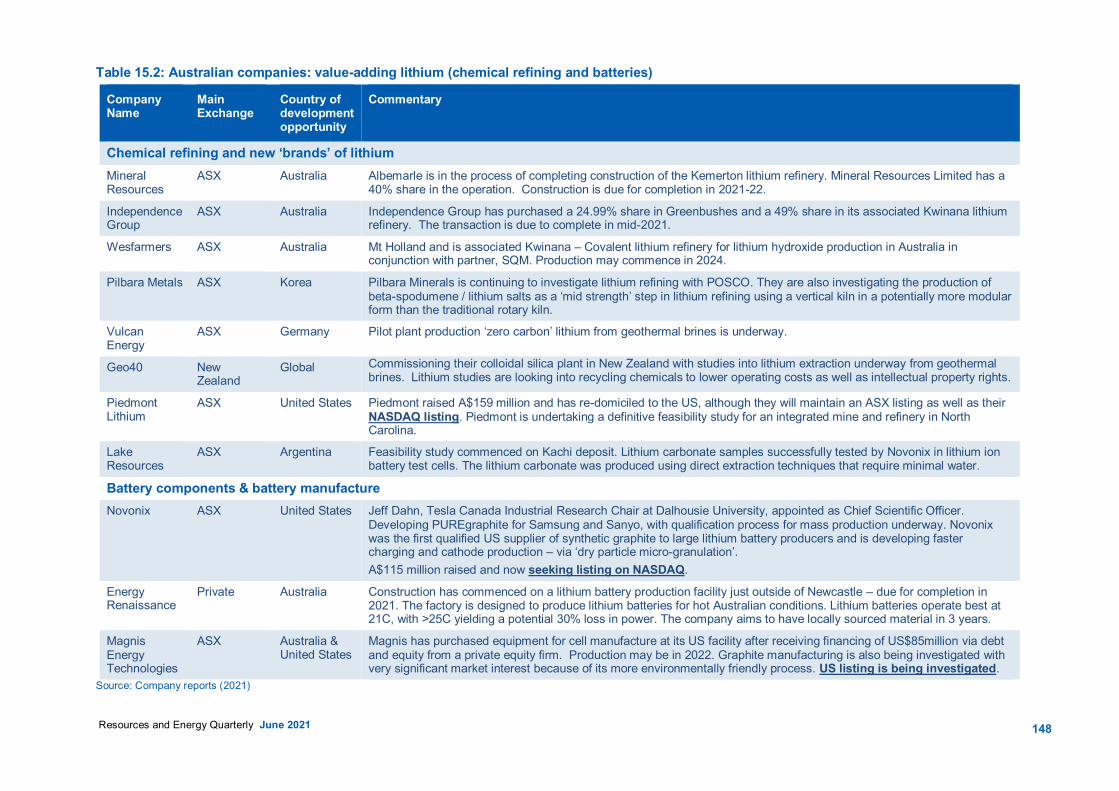
148 Resources and Energy Quarterly June 2021
Table 15.2: Australian companies: value-adding lithium (chemical refining and batteries)
Company Name
Main Exchange
Country of development opportunity
Commentary
Chemical refining and new ‘brands’ of lithium Mineral Resources
ASX Australia Albemarle is in the process of completing construction of the Kemerton lithium refinery. Mineral Resources Limited has a 40% share in the operation. Construction is due for completion in 2021-22.
Independence Group
ASX Australia Independence Group has purchased a 24.99% share in Greenbushes and a 49% share in its associated Kwinana lithium refinery. The transaction is due to complete in mid-2021.
Wesfarmers ASX Australia Mt Holland and is associated Kwinana – Covalent lithium refinery for lithium hydroxide production in Australia in conjunction with partner, SQM. Production may commence in 2024.
Pilbara Metals ASX Korea Pilbara Minerals is continuing to investigate lithium refining with POSCO. They are also investigating the production of beta-spodumene / lithium salts as a ‘mid strength’ step in lithium refining using a vertical kiln in a potentially more modular form than the traditional rotary kiln.
Vulcan Energy
ASX Germany Pilot plant production ‘zero carbon’ lithium from geothermal brines is underway.
Geo40 New Zealand
Global Commissioning their colloidal silica plant in New Zealand with studies into lithium extraction underway from geothermal brines. Lithium studies are looking into recycling chemicals to lower operating costs as well as intellectual property rights.
Piedmont Lithium
ASX United States Piedmont raised A$159 million and has re-domiciled to the US, although they will maintain an ASX listing as well as their NASDAQ listing. Piedmont is undertaking a definitive feasibility study for an integrated mine and refinery in North Carolina.
Lake Resources
ASX Argentina Feasibility study commenced on Kachi deposit. Lithium carbonate samples successfully tested by Novonix in lithium ion battery test cells. The lithium carbonate was produced using direct extraction techniques that require minimal water.
Battery components & battery manufacture Novonix ASX United States Jeff Dahn, Tesla Canada Industrial Research Chair at Dalhousie University, appointed as Chief Scientific Officer.
Developing PUREgraphite for Samsung and Sanyo, with qualification process for mass production underway. Novonix was the first qualified US supplier of synthetic graphite to large lithium battery producers and is developing faster charging and cathode production – via ‘dry particle micro-granulation’. A$115 million raised and now seeking listing on NASDAQ.
Energy Renaissance
Private Australia Construction has commenced on a lithium battery production facility just outside of Newcastle – due for completion in 2021. The factory is designed to produce lithium batteries for hot Australian conditions. Lithium batteries operate best at 21C, with >25C yielding a potential 30% loss in power. The company aims to have locally sourced material in 3 years.
Magnis Energy Technologies
ASX Australia & United States
Magnis has purchased equipment for cell manufacture at its US facility after receiving financing of US$85million via debt and equity from a private equity firm. Production may be in 2022. Graphite manufacturing is also being investigated with very significant market interest because of its more environmentally friendly process. US listing is being investigated.
Source: Company reports (2021)
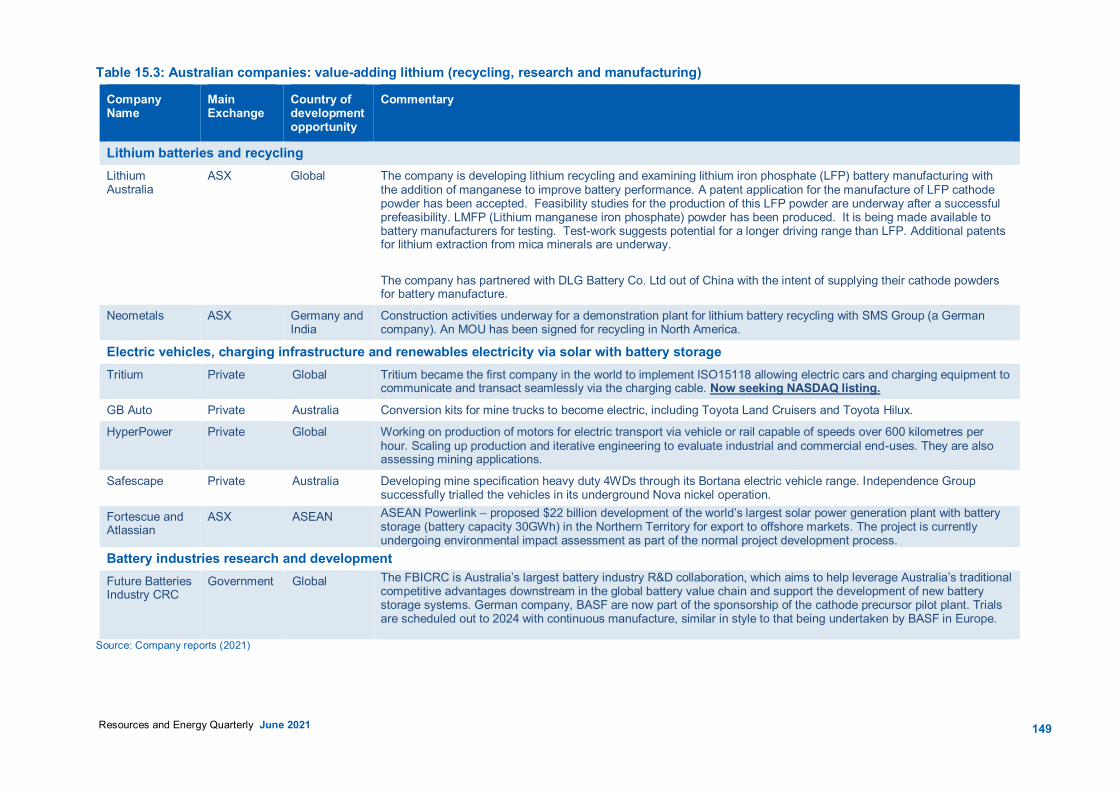
149 Resources and Energy Quarterly June 2021
Table 15.3: Australian companies: value-adding lithium (recycling, research and manufacturing)
Company Name
Main Exchange
Country of development opportunity
Commentary
Lithium batteries and recycling Lithium Australia
ASX Global The company is developing lithium recycling and examining lithium iron phosphate (LFP) battery manufacturing with the addition of manganese to improve battery performance. A patent application for the manufacture of LFP cathode powder has been accepted. Feasibility studies for the production of this LFP powder are underway after a successful prefeasibility. LMFP (Lithium manganese iron phosphate) powder has been produced. It is being made available to battery manufacturers for testing. Test-work suggests potential for a longer driving range than LFP. Additional patents for lithium extraction from mica minerals are underway. The company has partnered with DLG Battery Co. Ltd out of China with the intent of supplying their cathode powders for battery manufacture.
Neometals ASX Germany and India
Construction activities underway for a demonstration plant for lithium battery recycling with SMS Group (a German company). An MOU has been signed for recycling in North America.
Electric vehicles, charging infrastructure and renewables electricity via solar with battery storage Tritium Private Global Tritium became the first company in the world to implement ISO15118 allowing electric cars and charging equipment to
communicate and transact seamlessly via the charging cable. Now seeking NASDAQ listing.
GB Auto Private Australia Conversion kits for mine trucks to become electric, including Toyota Land Cruisers and Toyota Hilux.
HyperPower Private Global Working on production of motors for electric transport via vehicle or rail capable of speeds over 600 kilometres per hour. Scaling up production and iterative engineering to evaluate industrial and commercial end-uses. They are also assessing mining applications.
Safescape Private Australia Developing mine specification heavy duty 4WDs through its Bortana electric vehicle range. Independence Group successfully trialled the vehicles in its underground Nova nickel operation.
Fortescue and Atlassian
ASX ASEAN ASEAN Powerlink – proposed $22 billion development of the world’s largest solar power generation plant with battery storage (battery capacity 30GWh) in the Northern Territory for export to offshore markets. The project is currently undergoing environmental impact assessment as part of the normal project development process.
Battery industries research and development Future Batteries Industry CRC
Government Global The FBICRC is Australia’s largest battery industry R&D collaboration, which aims to help leverage Australia’s traditional competitive advantages downstream in the global battery value chain and support the development of new battery storage systems. German company, BASF are now part of the sponsorship of the cathode precursor pilot plant. Trials are scheduled out to 2024 with continuous manufacture, similar in style to that being undertaken by BASF in Europe.
Source: Company reports (2021)

Trade summary charts and tables
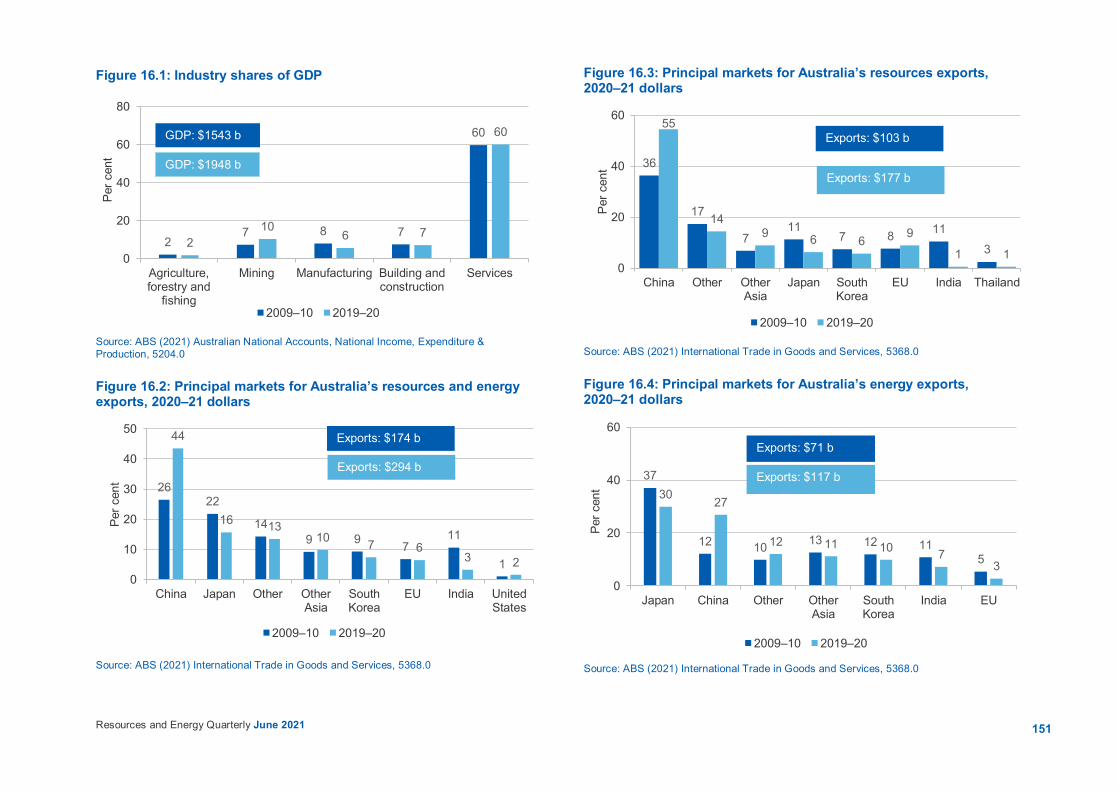
151
Resources and Energy Quarterly June 2021
Figure 16.1: Industry shares of GDP
Source: ABS (2021) Australian National Accounts, National Income, Expenditure & Production, 5204.0 Figure 16.2: Principal markets for Australia’s resources and energy exports, 2020–21 dollars
Source: ABS (2021) International Trade in Goods and Services, 5368.0
Figure 16.3: Principal markets for Australia’s resources exports, 2020–21 dollars
Source: ABS (2021) International Trade in Goods and Services, 5368.0 Figure 16.4: Principal markets for Australia’s energy exports, 2020–21 dollars
Source: ABS (2021) International Trade in Goods and Services, 5368.0
27 8 7
60
210
6 7
60
0
20
40
60
80
Agriculture,forestry and
fishing
Mining Manufacturing Building andconstruction
Services
Per c
ent
2009–10 2019–20
GDP: $1543 b
GDP: $1948 b
2622
149 9 7
11
1
44
16 1310 7 6
3 20
10
20
30
40
50
China Japan Other OtherAsia
SouthKorea
EU India UnitedStates
Per c
ent
2009–10 2019–20
Exports: $294 b
Exports: $174 b
36
17
711
7 8 113
55
149 6 6 9
1 10
20
40
60
China Other OtherAsia
Japan SouthKorea
EU India Thailand
Per c
ent
2009–10 2019–20
Exports: $103 b
Exports: $177 b
37
12 10 13 12 115
30 27
12 11 10 73
0
20
40
60
Japan China Other OtherAsia
SouthKorea
India EUPe
r cen
t
2009–10 2019–20
Exports: $71 b
Exports: $117 b

152
Resources and Energy Quarterly June 2021
Figure 16.5: Principal markets for Australia's total exports, 2020–21 dollars
Source: ABS (2021) International Trade in Goods and Services, 5368.0
Figure 16.6: Australia's total imports by country of origin, 2020–21 dollars
Source: ABS (2021) International Trade in Goods and Services, 5368.0
Figure 16.7: Proportion of goods and services exports by sector
Source: ABS (2021) Balance of Payments and International Investment Position, 5302.0
Figure 16.8: Proportion of merchandise exports by sector
Source: ABS (2021) Balance of Payments and International Investment Position, 5302.0
2318
8 85 4 4
30
39
147 5 4 3 3
25
0
20
40
60
China Japan SouthKorea
India UnitedStates
HongKong
NewZealand
Other
Per c
ent
2009–10 2019–20
Exports: $247 b
Exports: $386 b
1811 9 6 5 5
46
27
126 5 5 4
41
0
20
40
60
China UnitedStates
Japan SouthKorea
Thailand Germany Other
Per c
ent
2009–10 2019–20
Imports: $252 b
Imports: $302 b
12
53
1222
12
55
1222
10
58
1121
10
60
1119
0
20
40
60
80
Rural Mineralresources
Othermerchandise
Services
Per c
ent
2016–17 2017–18 2018–19 2019–20
16
68
1615
70
1513
73
1412
74
14
0
20
40
60
80
Rural Mineral resources Other merchandise
Per c
ent
2016–17 2017–18 2018–19 2019–20
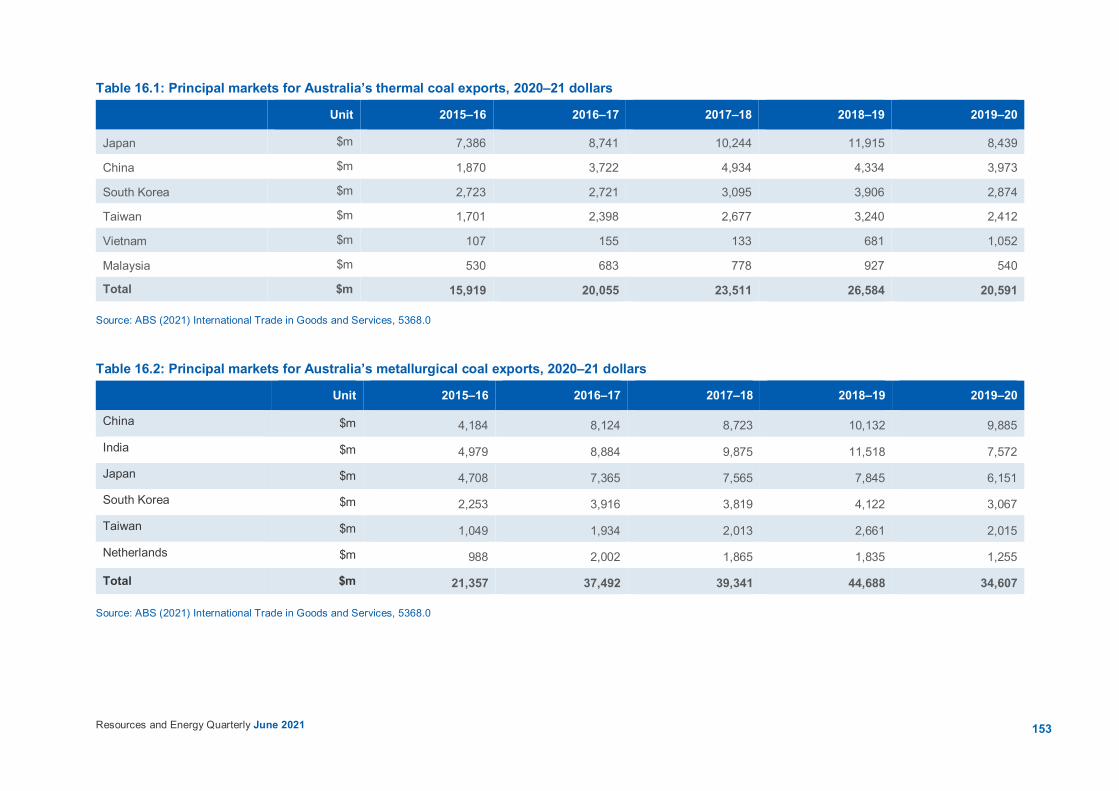
153
Resources and Energy Quarterly June 2021
Table 16.1: Principal markets for Australia’s thermal coal exports, 2020–21 dollars
Unit 2015–16 2016–17 2017–18 2018–19 2019–20 Japan $m 7,386 8,741 10,244 11,915 8,439 China $m 1,870 3,722 4,934 4,334 3,973 South Korea $m 2,723 2,721 3,095 3,906 2,874 Taiwan $m 1,701 2,398 2,677 3,240 2,412 Vietnam $m 107 155 133 681 1,052 Malaysia $m 530 683 778 927 540 Total $m 15,919 20,055 23,511 26,584 20,591
Source: ABS (2021) International Trade in Goods and Services, 5368.0
Table 16.2: Principal markets for Australia’s metallurgical coal exports, 2020–21 dollars Unit 2015–16 2016–17 2017–18 2018–19 2019–20
China $m 4,184 8,124 8,723 10,132 9,885
India $m 4,979 8,884 9,875 11,518 7,572
Japan $m 4,708 7,365 7,565 7,845 6,151
South Korea $m 2,253 3,916 3,819 4,122 3,067
Taiwan $m 1,049 1,934 2,013 2,661 2,015
Netherlands $m 988 2,002 1,865 1,835 1,255
Total $m 21,357 37,492 39,341 44,688 34,607
Source: ABS (2021) International Trade in Goods and Services, 5368.0

154
Resources and Energy Quarterly June 2021
Table 16.3: Principal markets for Australia’s crude oil and refinery feedstocks exports, 2020–21 dollars Unit 2015–16 2016–17 2017–18 2018–19 2019–20
Singapore $m 680 1,075 1,222 1,994 1,375
China $m 761 750 656 1,033 1,044
Malaysia $m 156 453 610 1,680 1,024
Indonesia $m 382 974 1,362 664 769
Thailand $m 750 598 1,201 1,148 625
South Korea $m 485 477 720 711 341
Total $m 5,878 5,812 7,246 9,294 9,108
Note: Some country details have been confidentialised by the Australian Bureau of Statistics. Source: ABS (2021) International Trade in Goods and Services, 5368.0
Table 16.4: Principal markets for Australia’s LNG exports, 2020–21 dollars Unit 2015–16 2016–17 2017–18 2018–19 2019–20
Japan $m 11,370 12,007 15,112 21,730 20,152
China $m 3,173 6,054 9,956 17,910 16,460
South Korea $m 1,812 2,712 3,840 5,437 5,220
Taiwan $m 173 270 778 2,401 2,622
Malaysia $m 203 222 378 894 1,472
Singapore $m 429 1,518 1,183 1,267 1,051
Total $m 17,895 23,679 32,185 50,945 48,047
Notes: Department of Industry, Science, Energy and Resources estimates based on International Trade Centre data, except for 2016–17 where ABS trade data is available. Source: ABS (2021) International Trade in Goods and Services, 5368.0; International Trade Centre (2021) International Trade Statistics
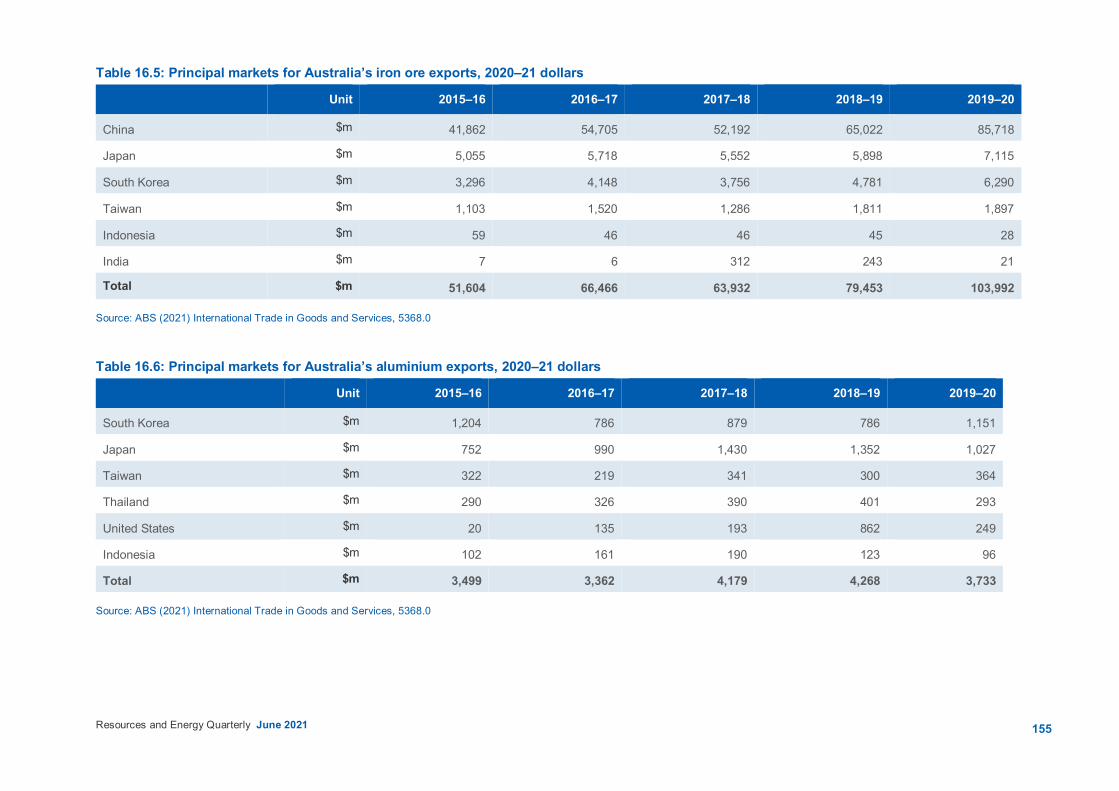
155
Resources and Energy Quarterly June 2021
Table 16.5: Principal markets for Australia’s iron ore exports, 2020–21 dollars Unit 2015–16 2016–17 2017–18 2018–19 2019–20
China $m 41,862 54,705 52,192 65,022 85,718
Japan $m 5,055 5,718 5,552 5,898 7,115
South Korea $m 3,296 4,148 3,756 4,781 6,290
Taiwan $m 1,103 1,520 1,286 1,811 1,897
Indonesia $m 59 46 46 45 28
India $m 7 6 312 243 21
Total $m 51,604 66,466 63,932 79,453 103,992
Source: ABS (2021) International Trade in Goods and Services, 5368.0
Table 16.6: Principal markets for Australia’s aluminium exports, 2020–21 dollars Unit 2015–16 2016–17 2017–18 2018–19 2019–20
South Korea $m 1,204 786 879 786 1,151
Japan $m 752 990 1,430 1,352 1,027
Taiwan $m 322 219 341 300 364
Thailand $m 290 326 390 401 293
United States $m 20 135 193 862 249
Indonesia $m 102 161 190 123 96
Total $m 3,499 3,362 4,179 4,268 3,733
Source: ABS (2021) International Trade in Goods and Services, 5368.0
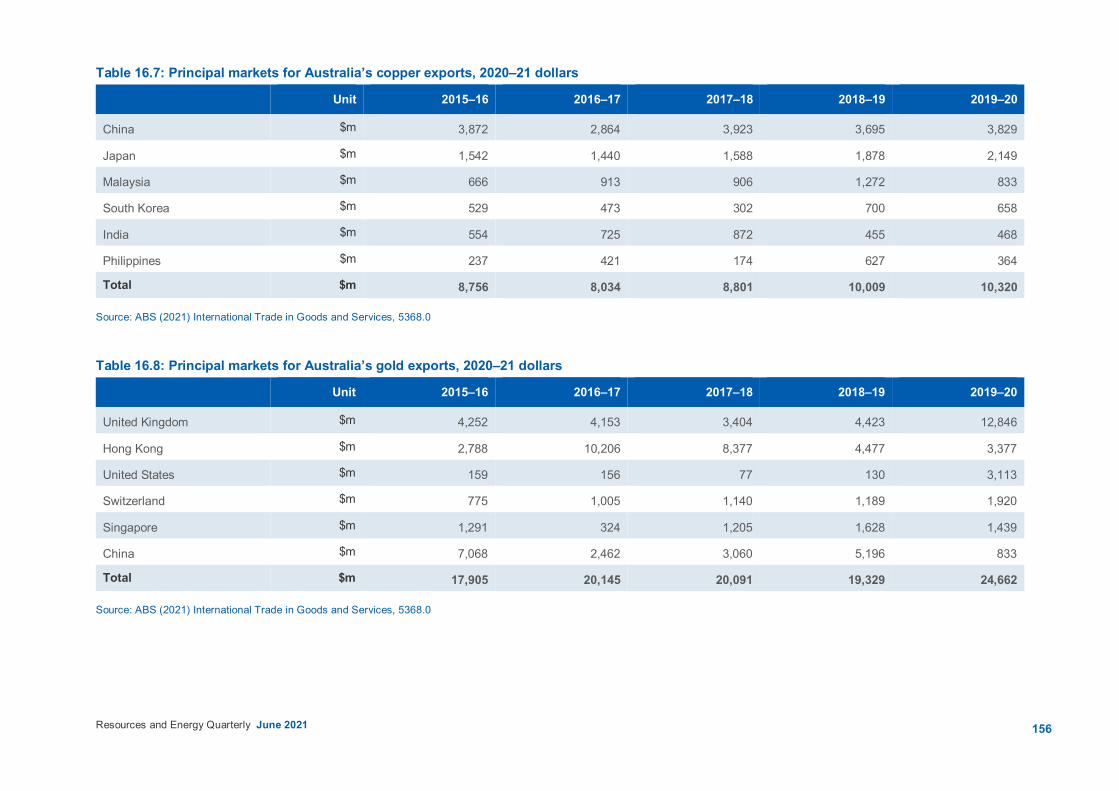
156
Resources and Energy Quarterly June 2021
Table 16.7: Principal markets for Australia’s copper exports, 2020–21 dollars Unit 2015–16 2016–17 2017–18 2018–19 2019–20
China $m 3,872 2,864 3,923 3,695 3,829
Japan $m 1,542 1,440 1,588 1,878 2,149
Malaysia $m 666 913 906 1,272 833
South Korea $m 529 473 302 700 658
India $m 554 725 872 455 468
Philippines $m 237 421 174 627 364
Total $m 8,756 8,034 8,801 10,009 10,320
Source: ABS (2021) International Trade in Goods and Services, 5368.0
Table 16.8: Principal markets for Australia’s gold exports, 2020–21 dollars Unit 2015–16 2016–17 2017–18 2018–19 2019–20
United Kingdom $m 4,252 4,153 3,404 4,423 12,846
Hong Kong $m 2,788 10,206 8,377 4,477 3,377
United States $m 159 156 77 130 3,113
Switzerland $m 775 1,005 1,140 1,189 1,920
Singapore $m 1,291 324 1,205 1,628 1,439
China $m 7,068 2,462 3,060 5,196 833
Total $m 17,905 20,145 20,091 19,329 24,662
Source: ABS (2021) International Trade in Goods and Services, 5368.0

Appendices

158Resources and Energy Quarterly June 2021
Appendix A Definitions and classifications A.1 Exchange rates In this report, the AUD/USD exchange rate (Australian dollar relative to the US dollars) is based on the median of economic forecasters at the time that the report is prepared. The source is the Bloomberg survey of economic forecasters.
World commodity prices are typically denominated in US dollars, and exchange rate movements can have a significant effect on the actual outcomes of commodity prices and export earnings. A change in the value of the US dollar against other floating international currencies can influence movements in world resources and energy prices. A change in the Australian dollar against the US dollar will impact on export earnings for domestic commodity exporters and producers. There is substantial uncertainty surrounding any exchange rate forecast, with changes to exchange rates influenced by changes in financial market sentiment, sometimes resulting in strong volatility.
A.2 Conversion to real dollars Nominal values and prices are converted to real dollars using Australian and US consumer price indexes (CPI). The Australian and US CPI forecasts are based on the median of economic forecasters at the time that the report was prepared. The source is the Bloomberg survey of economic forecasters.
A.3 Time periods The terms ‘estimate’, ‘forecast’ and ‘projection’ refer to different time periods in this report. Estimate refers to a time period that has passed, but for which full historical data is not yet available, while ‘forecast’ and ‘projection’ refer to different periods in the future. It is important to distinguish between different future time horizons, as factors affecting production, consumption and prices in the short-term differ from factors affecting these components in the medium to long-term. Forecasts also become increasingly imprecise over longer time horizons, due to increased risk and uncertainty. For these reasons, the Department of Industry, Science, Energy and Resources’ Office of the Chief Economist (DISER OCE) uses different terminology to distinguish between short-term forecasts and medium to long-term projections, as outlined in Table A2.
Table A1: OCE terminology for different time periods/horizons
Period Years Terminology
Historical Time period has passed but complete data for the period is not yet available
Estimate
Short-term 1 to 2 years Forecast
Medium-term 3 to 5 years Projection
Long-term Beyond 5 years n/a
Source: Department of Industry, Science, Energy and Resources (2021)

159Resources and Energy Quarterly June 2021
A.4 Commodity classifications The DISER OCE defines exports for each commodity by a selected set of 8-digit Australian Harmonised Export Commodity Classification (AHECC) codes. Where possible, the choice of AHECC codes is based on alignment with international trade data, to ensure that direct comparisons can be made. For example, groupings for various commodities are aligned with classifications used by the International Energy Agency, World Steel Association, International Nickel Study Group, International Lead and Zinc Study Group, International Copper Study Group and World Bureau of Metal Statistics.
In this report, benchmark prices and Australian production and exports are forecast for 21 commodities, as shown in Table A2. In estimating a total for Australia’s resources and energy exports, the remaining commodities, defined as ‘other resources’ and ‘other energy’, are forecast as a group.
Table A2: Resources and energy commodities groupings and definitions
Resources (non-energy) Energy
Definition Resource commodities are non-energy minerals and semi-manufactured products produced from non-energy minerals
Energy commodities are minerals and petroleum products that are typically used for power generation
Australian Harmonised Export Commodity Classification (AHECC) chapters
25 (part); 26 (part); 28 (part); 31 (part); 73 (part); 74; 75; 76; 78; 79; 80; 81 27 (part)
Commodities for which data is published, forecasts are made and analysed in detail in this report
Aluminium; alumina; bauxite; copper; gold; iron ore; crude steel; nickel; zinc, lithium
Crude oil and petroleum products; LNG; metallurgical coal; thermal coal; uranium
Notes: The AHECC chapter is the first two digits of the trade code. Groupings are made at the 8-digit level. Source: Department of Industry, Science, Energy and Resources (2021)
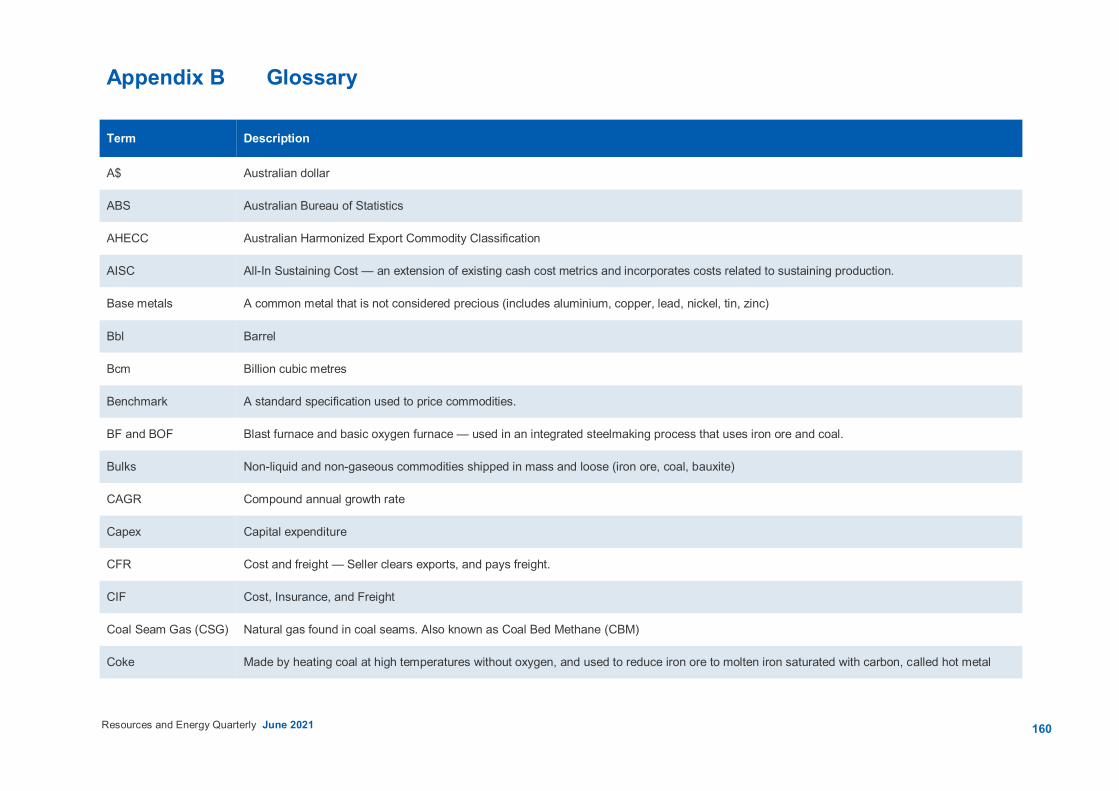
160 Resources and Energy Quarterly June 2021
Appendix B Glossary
Term Description
A$ Australian dollar
ABS Australian Bureau of Statistics
AHECC Australian Harmonized Export Commodity Classification
AISC All-In Sustaining Cost — an extension of existing cash cost metrics and incorporates costs related to sustaining production.
Base metals A common metal that is not considered precious (includes aluminium, copper, lead, nickel, tin, zinc)
Bbl Barrel
Bcm Billion cubic metres
Benchmark A standard specification used to price commodities.
BF and BOF Blast furnace and basic oxygen furnace — used in an integrated steelmaking process that uses iron ore and coal.
Bulks Non-liquid and non-gaseous commodities shipped in mass and loose (iron ore, coal, bauxite)
CAGR Compound annual growth rate
Capex Capital expenditure
CFR Cost and freight — Seller clears exports, and pays freight.
CIF Cost, Insurance, and Freight
Coal Seam Gas (CSG) Natural gas found in coal seams. Also known as Coal Bed Methane (CBM)
Coke Made by heating coal at high temperatures without oxygen, and used to reduce iron ore to molten iron saturated with carbon, called hot metal
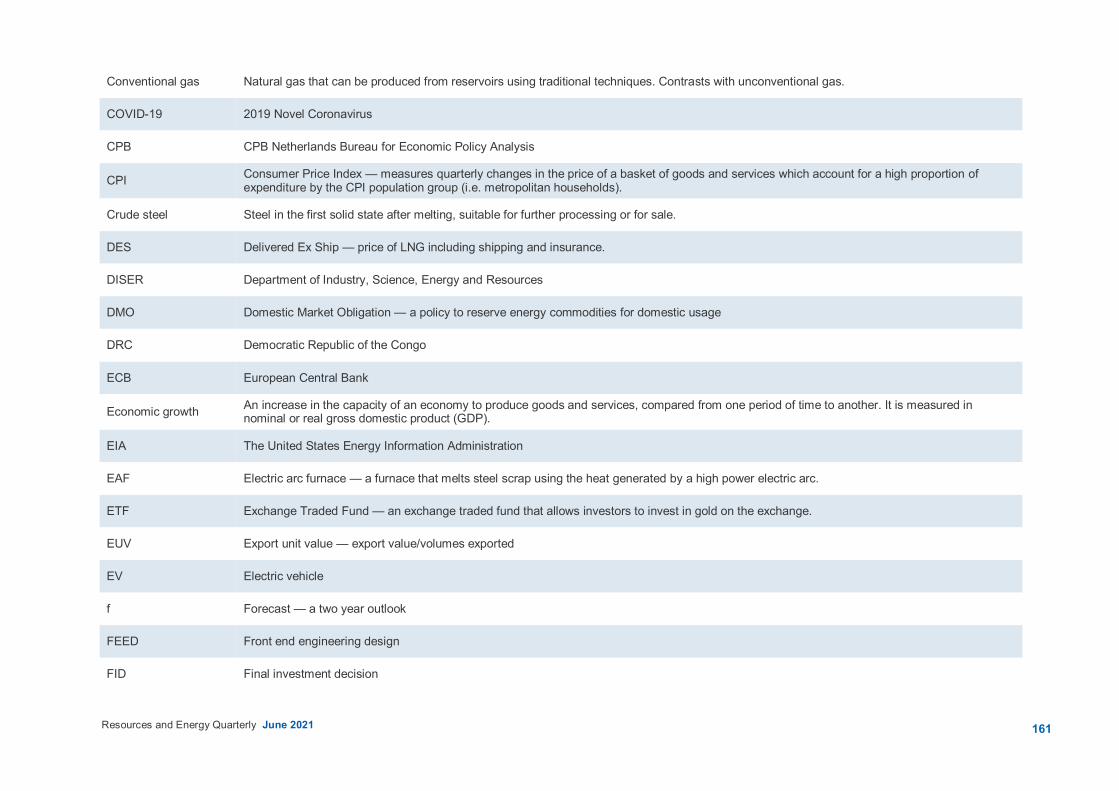
161 Resources and Energy Quarterly June 2021
Conventional gas Natural gas that can be produced from reservoirs using traditional techniques. Contrasts with unconventional gas.
COVID-19 2019 Novel Coronavirus
CPB CPB Netherlands Bureau for Economic Policy Analysis
CPI Consumer Price Index — measures quarterly changes in the price of a basket of goods and services which account for a high proportion of expenditure by the CPI population group (i.e. metropolitan households).
Crude steel Steel in the first solid state after melting, suitable for further processing or for sale.
DES Delivered Ex Ship — price of LNG including shipping and insurance.
DISER Department of Industry, Science, Energy and Resources
DMO Domestic Market Obligation — a policy to reserve energy commodities for domestic usage
DRC Democratic Republic of the Congo
ECB European Central Bank
Economic growth An increase in the capacity of an economy to produce goods and services, compared from one period of time to another. It is measured in nominal or real gross domestic product (GDP).
EIA The United States Energy Information Administration
EAF Electric arc furnace — a furnace that melts steel scrap using the heat generated by a high power electric arc.
ETF Exchange Traded Fund — an exchange traded fund that allows investors to invest in gold on the exchange.
EUV Export unit value — export value/volumes exported
EV Electric vehicle
f Forecast — a two year outlook
FEED Front end engineering design
FID Final investment decision
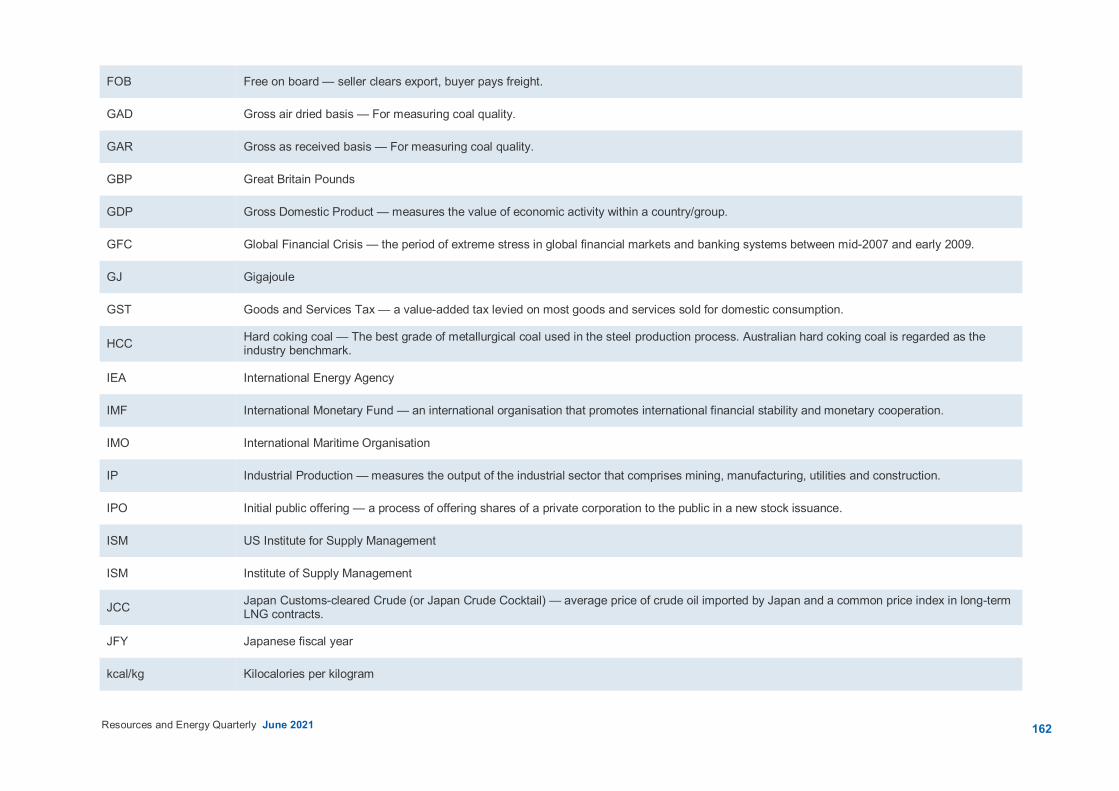
162 Resources and Energy Quarterly June 2021
FOB Free on board — seller clears export, buyer pays freight.
GAD Gross air dried basis — For measuring coal quality.
GAR Gross as received basis — For measuring coal quality.
GBP Great Britain Pounds
GDP Gross Domestic Product — measures the value of economic activity within a country/group.
GFC Global Financial Crisis — the period of extreme stress in global financial markets and banking systems between mid-2007 and early 2009.
GJ Gigajoule
GST Goods and Services Tax — a value-added tax levied on most goods and services sold for domestic consumption.
HCC Hard coking coal — The best grade of metallurgical coal used in the steel production process. Australian hard coking coal is regarded as the industry benchmark.
IEA International Energy Agency
IMF International Monetary Fund — an international organisation that promotes international financial stability and monetary cooperation.
IMO International Maritime Organisation
IP Industrial Production — measures the output of the industrial sector that comprises mining, manufacturing, utilities and construction.
IPO Initial public offering — a process of offering shares of a private corporation to the public in a new stock issuance.
ISM US Institute for Supply Management
ISM Institute of Supply Management
JCC Japan Customs-cleared Crude (or Japan Crude Cocktail) — average price of crude oil imported by Japan and a common price index in long-term LNG contracts.
JFY Japanese fiscal year
kcal/kg Kilocalories per kilogram

163 Resources and Energy Quarterly June 2021
kt Thousand tonnes
ktpa Kilotonnes per annum
LBMA London Bullion Market Association
LCE Lithium Content Equivalent
Li OH Lithium Hydroxide
LME London Metal Exchange
LNG Liquefied natural gas
LNY Lunar New Year
LPG Liquefied petroleum gas
LVPCI Low volatile pulverised coal injection — a type of low volatile coal used in the PCI process
m Million
MMbtu Million British thermal units
Mt Million tonnes
mtpa Million tonnes per annum
MW Megawatts
Nameplate capacity The theoretical maximum annual production capacity
NAR Net as received basis — For measuring coal quality
NDRC China’s National Development and Reform Commission
NEV New energy vehicle — term used for plug-in electric vehicles eligible for public subsidies (battery electric vehicles and plug-in hybrid vehicles)
164 Resources and Energy Quarterly June 2021
OCE Office of the Chief Economist
OECD Organisation for Economic Co-operation and Development
OPEC Organisation of Petroleum Exporting Countries, a formal alliance of 14 countries to collaborate to manage the world oil market
OPEC+ Informal term for agreements between OPEC and ten other oil-producing countries (which are not members of OPEC)
Oz Ounce
PCE Personal Consumption Expenditure — a measure of the changes in price of consumer services and goods.
PCI Pulverised coal injection — PCI coal is used for its heat value and injected directly into blast furnaces as a supplementary fuel, which reduces the amount of coke required.
PCI Pulverised coal injection — a process used in blast furnace operations
PM The afternoon price of gold set at 3.00pm each business day at the London Bullion Market Association
PMI Purchasing Managers Index — an indicator of economic health for manufacturing and service sectors.
PPP Purchasing Power Parity — a way of measuring economic variables in different countries that equalise the purchasing power of different currencies
RoW Rest of world
s Estimate — Incomplete data or subject to revision
Shale gas Natural gas found in shales
SDR Special drawing right
SHFE Shanghai Futures Exchange
SSCC Semi-soft coking coal — A type of metallurgical coal used in the steel production process alongside hard coking coal, but results in a lower coke quality and more impurities.
Tariff A tax on imports or exports that is used by governments to generate revenue or to protect domestic industries from competition.
Tight gas Natural gas found in low quality reservoirs
165 Resources and Energy Quarterly June 2021
TWI Trade Weighted Index — a measure of the foreign exchange value of the US dollar against a basket of major foreign currencies.
U3O8 Triuranium octoxide — a compound of uranium.
UAE United Arab Emirates
UK United Kingdom
Unconventional gas Natural gas that is more difficult to extract, including coal seam gas, shale gas and tight gas. Contrasts with conventional gas.
US United States
US$ United States dollar
WEO The International Energy Agency’s World Energy Outlook
WTI West Texas Intermediate crude oil price
z Projection a five year outlook