Embed Size (px)
Citation preview
Amnis Imagestream,Imaging,Cytometer• 20x,&40x,&60x&objectives• Violet,&Blue,&Green,&and&Red&lasers• Staff&support&for&data&acquisition&and&analysis• Up&to&5000&cells/second&with&realFtime&compensation• Intuitive&image&analysis&that&incorporates&traditional&flow&cytometry gating
.To&provide&comprehensive&cytoflourometric&analysis&and&sorting&to&the&YCC&investigators.&The&facility¬&only&provides,&maintains,&and&operates&the&instruments,&but&also&trains&users,&develops&techniques,&provides&protocols,&and&manages&access&and&the&financial&aspects&of&the&Shared&Resource
• Multiparameter flow&cytometric analysis&(user&operated)• Multiparameter fluorescence&activated&high&speed&cell&sorting&(operatorFassisted)
• Training&in&the&use&of&FACS&analyzers&and&the&FACSAria sorters.&• Consultation&on&experimental&design&and&interpretation.• Data&analysis&stations&with&stateFofFtheFart&analysis&software
Purpose
Key&Services
Major&Equipment&and&Locations
Fluorophore&Detection
Index&Sorting
Specialty&Sorting
Remote&Data&Access
Amnis Imagestream
BD,FACS,Arias•Locations&F 300&George&St.&2320H,&Amistad&416,&and&TAC&&&&&&617&and&633•Temperature&controlled&sorting•Tube,&IndexFsorting,&and&Slide&or&PlateFsorting•70,&85,&100,&130Fmicron&nozzles
FACS,Aria,Sorters,in,Bio4safety,Cabinets•Locations&F LEPH&901B&and&Amistad&416•Sorting&Unscreened&Human&Material•LEPH:&BSLF2&and&BSLF3&Pathogen&Sorting&
MoFlo•Location&– TAC&S617•3Flaser,&8Fcompensated&color&sorting•Tube,&slide,&or&plate&sorting•Sorting&Concentrations&up&to&6x10^7&
LSRII•Locations&– 300&George&St.&2320H,&Amistad&416,&and&TAC&&533&and&613•3,&4,&and&5&laser&systems•12&to&18FPMTs&for&fluorescence&detection
Stratedigm•Locations&– TAC&S533&and&S613•3&and&4&lasers&systems•8&or&13&PMTs&for&fluorescence&detection•Plate&loader&acquisition&capability
Amnis•Location&– TAC&S613•Rapid&acquisition&of&flow&cytometric&data&and&high&resolution&images&of&individual&cells•20x,&40x,&and&60x&objectives
• A&data&mirror&system&allows&users&to&access&their&exported&data&remotely.& A&server&synchronizes&with&the&.fcs&export&folder&of&each&of&the&LSRII&computers&daily.&Copies&of&the&export&folders&are&created&each&morning&between&4F6&am.&&The&data&is&then&accessible&for&users&to&retrieve&remotely&from&the&server&or&from&our&stand&alone&computers&workstations&outside&of&TAC&S613.
• It&is&also&possible&to&export&data&within&Diva&software&at&a&hallway&workstation.&Sample&acquisition&can&take&longer&than&expected,&so&when&time&is&short&at&the&cytomer,&data&export&can&now&be&completed&away&from&the&cytometer.&This&also&obviates&the&need&to&reserve&more&time&on&the&equipment&later&simply&to&export&your&data.
Index sorting provides sort information oneventFbyFevent basis. The index sortmode creates an FCS file containingdata on the X and Y coordinates of thecells that can be traced back to the flowcharacteristics of the cell or combinationof cells sorted, providing a complete flowphenotype for every sorted cell. Indexsorting can be an important tool in stemcell sorting, clonal selection, singleFcellsequencing, and drug testing.
The&FCSR&cells&sorters&have&a&variety&of&specialFeatures¬&realized&by&many&users:• Temperature&Controlled&collection&(cooling&or&heated&collection)
• Plate,&Eppendorf,&and&slide&deposition• SingleFcell&plate&sorting• Amplifying&sort&collection• Multiple&nozzle&options&to&accommodate&a&cells&from&0.5&to&65Fmicrons&using&sheath&pressures&from&5&to&70+&PSI
Fig 1. (A) Optical path of a standard flow cytomer, allowing for detectionof distinct populations based off FSC, SSC and fluorescence, (B) List ofcommon fluorochromes and associated laser best suited for theirexcitation, (C) Emission spectrum and detection channels offluorochoromes excited sequentially by lasers (bottom to top) 355nm,488nm laser, 407nm laser, 532nm laser, and 633nm laser.
Fig 3. (Above) – Various sort collection devices for the BD FACS AriafEppendorf, 5Fml, and 15Fml collection holdersf 96Fwell and slide collectionholders. (Below) 96Fwell plate sort layout. This sort is for a graduatedcollection of larger numbers of gated cells. The plate was segmented bythree populations (MEP, MKP, and CMP cells) and collected by increasingnumbers of cells per well from a single cell to 75,000 per well.
Fig 4. (Above) – An index sortlayout of single cellsdeposited in individual wells.Fluorescent intensityinformation is retained,allowing for backFgating later.(Left) – A Flowjo derived heatmap that displays valuesbased on a yellowFbluegradient.
Image&from&http://docs.flowjo.com/
Images&from:thermofisher.com
A
B
C
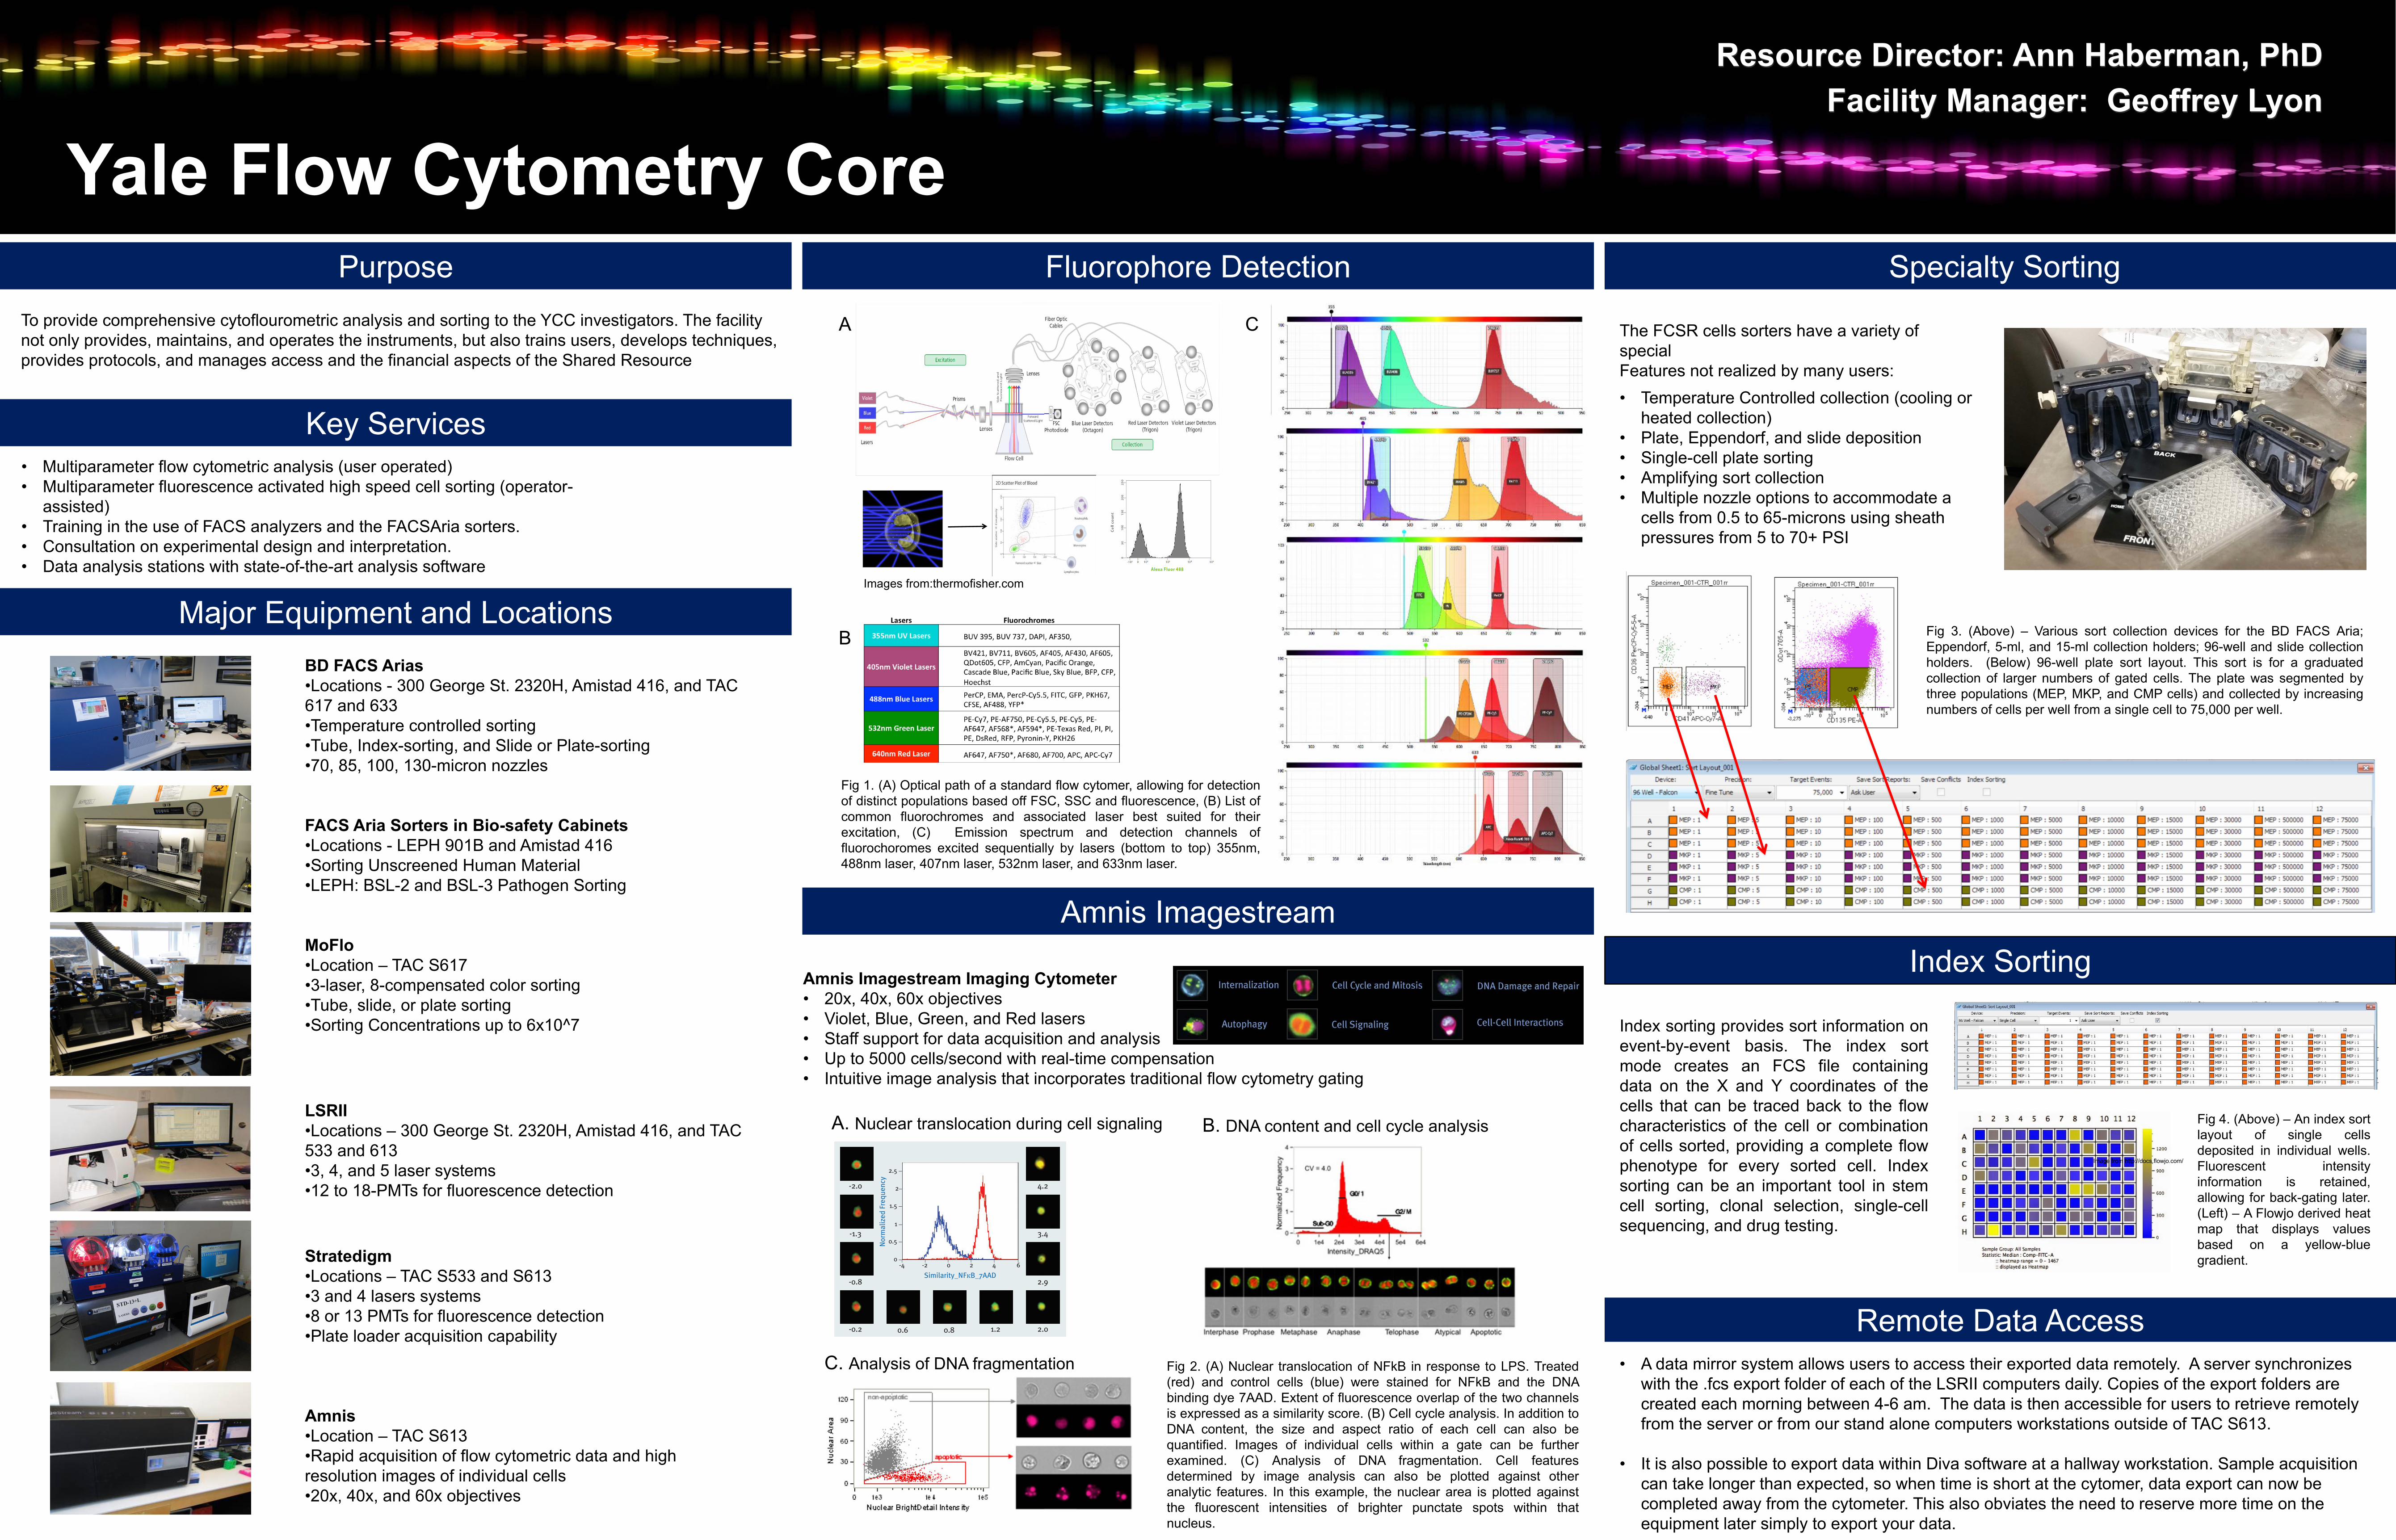
Fig 2. (A) Nuclear translocation of NFkB in response to LPS. Treated(red) and control cells (blue) were stained for NFkB and the DNAbinding dye 7AAD. Extent of fluorescence overlap of the two channelsis expressed as a similarity score. (B) Cell cycle analysis. In addition toDNA content, the size and aspect ratio of each cell can also bequantified. Images of individual cells within a gate can be furtherexamined. (C) Analysis of DNA fragmentation. Cell featuresdetermined by image analysis can also be plotted against otheranalytic features. In this example, the nuclear area is plotted againstthe fluorescent intensities of brighter punctate spots within thatnucleus.
FlowSight
FS
NFˍ
B Tr
ansl
ocat
ion
Quantitating NFˍB translocation using the Amnis® FlowSight® imaging cytometer and optimized reagent kit
Introduction
Nuclear Factor kappa B (NFˍB) is a transcription factor which plays a central role in regulating many key processes in mammalian cells, including proliferation, inflammation, immune and stress responses. NFˍB is held in an inactive state in the cytoplasm by its inhibitor IˍB. Upon activation, IˍB is targeted for ubiq-uitination, allowing phosphorylation of the NFˍB, facilitating its translocation into the nucleus1. Classical biochemical techniques are semi-quantitative in nature and do not provide per-cell translocation measure-ments. Manual microscopy allows visual identification of nuclear translocation on a per-cell basis, but an objective and statistically rigorous assessment is difficult to obtain.
To overcome these problems we used the FlowSight® imaging cytometry platform, which combines the quantitative power of flow cytometry with the spatial information provided by microscopy in one system. Here a case study is presented demonstrating the Amnis® NFˍB Translocation kit for monitoring of NFˍB translocation in HL-60 human promyelocytic leukemia cells on the FlowSight® image cytometry platform.
Quantitation of NFˍB translocation in HL-60 cells
In this experiment, the FlowSight® imaging cytometer, equipped with a 488 nm laser and the Quantitative Imaging (QI) option, was used to assess the nuclear translocation of NFˍB in control and 10 ng/mL tumor necrosis factor Ƚ (TNFȽ) treated HL-60 cells. The Amnis® NFˍB Translocation kit (Catalogue No. ACS10000) was used to fix, permeabilize and label the cells with Alexa Fluor® 488 conjugated anti-Human NFˍB and the nuclear dye 7AAD. Images from 10,000 cells were acquired for each sample. Image analysis was per-formed using the Nuclear Localization Wizard available in the IDEAS® 6.0 image analysis software package.
Analysis of NFˍB translocation using the Nuclear Localization Wizard
The Nuclear Localization Wizard in the IDEAS® 6.0 software creates an analysis template for measuring the nuclear localization of a probe, in this case the NFˍB detection antibody. The Nuclear Translocation Wizard uses the Similarity feature, which does a pixel-by-pixel correlation between the channel containing the NFˍB image and the channel with the nuclear image. The wizard gives each cell a score that represents how similar the nuclear 7AAD image is to the Alexa Fluor® 488 conjugated anti-Human NFˍB image. A high Similarity score indicates the two images are similar, where low scores indicate that the images are dissimilar (Figure 1). The Similarity score has previously been validated to measure NFˍB translocation on the Amnis® ImageStream® platform1.
Figure 1. Analysis of NFкB translocation using the Nuclear Localization Wizard. The Nuclear Localization Wizard assigns each cell a score from which population statistics can be generated. Histograms of control (blue) and 10 ng/mL TNFȽ-treated (red) HL-60 cells are shown along with composite images of NFˍB (green) and 7AAD (red) demonstrating untranslocated, partially translocated and fully translocated cells.
-2.0 4.2
-1.3 3.4
-0.8 2.9
-0.2 0.6 1.20.8 2.0
Nor
mal
ized
Fre
quen
cy
Similarity_NFˍB_7AAD
2.5 _
2_
1.5 _
1 _
0.5 _
0 _
_
_ _ _ _ _
-4 -2 0 2 4 6
A.&Nuclear&translocation&during&cell&signaling B.&DNA&content&and&cell&cycle&analysis
C.&Analysis&of&DNA&fragmentation
Yale,Flow,Cytometry,Core
Resource,Director:,Ann,Haberman,,PhDFacility,Manager:,,Geoffrey,Lyon