Embed Size (px)
Citation preview

ARTICLE IN PRESS
Journal of Network and Computer Applications 32 (2009) 760– 769
Contents lists available at ScienceDirect
Journal of Network and Computer Applications
1084-80
doi:10.1
� Corr
E-m
journal homepage: www.elsevier.com/locate/jnca
Resource scheduling with conflicting objectives in grid environments:Model and evaluation
Li Chunlin �, Zhong Jin Xiu, Li Layuan
Department of Computer Science, Wuhan University of Technology, Wuhan 430063, PR China
a r t i c l e i n f o
Article history:
Received 17 August 2007
Received in revised form
9 May 2008
Accepted 9 May 2008
Keywords:
Grid
Scheduling model
Evaluation
45/$ - see front matter & 2008 Elsevier Ltd. A
016/j.jnca.2008.05.001
esponding author.
ail addresses: [email protected], jwtu@pub
a b s t r a c t
The paper is to consider resource scheduling with conflicting objectives in the grid environment. The
objectives of the grid users, the grid resources and the grid system clash with each other. Grid users
want to access enough system resources to achieve the desired level of quality of service (QoS). Resource
providers pay more attention to the performance of their resources. Our resource scheduling employs
market strategies to determine which jobs are executed at what time on which resources and at what
prices. A grid resource provider uses its utility function to maximize its profit and a grid user uses its
utility function to complete tasks while minimizing its spending. The paper proposes grid system
objective optimization scheduling that provides a joint optimization of objectives for both the resource
provider and grid user, which combines the benefits of both resource provider objective optimization
and user objective optimization. Experiments are designed to study the performances of three resource-
scheduling optimization algorithms. Performance metrics are classified into efficiency metrics, utility
metrics and time metrics.
& 2008 Elsevier Ltd. All rights reserved.
1. Introduction
Grid computing uses the resources of many separate compu-ters connected by a network (usually internet) to solve large-scalecomputational problems. The resources may involve CPU cycles,memory, bandwidth, disk, applications, databases on remotesystems, scientific data in few organizations for research pur-poses, etc. These heterogeneous resources are distributed andowned geographically by different organizations for solving large-scale computational and data-intensive problems in science,engineering and commerce. The tremendously large number andthe heterogeneous potential of grid resources cause the resourcemanagement challenge to be a significant effort topic in gridenvironments. These resource management scenarios ofteninclude resource discovery, resource inventories, fault isolation,resource provisioning, resource monitoring, a variety of auto-nomic capabilities and service-level management activities.
There are many quality of service (QoS)-based resourcemanagement and scheduling researches. Golconda and Ozguner(2004) compared five QoS-based scheduling heuristics from theliterature, in terms of three performance parameters, namelynumber of satisfied users, makespan and total utility of the meta-task. Al-Ali et al. (2002, 2003) extend the service abstraction in
ll rights reserved.
lic.wh.hb.cn (L. Chunlin).
the OGSA for QoS properties. The realization of QoS often requiresmechanisms such as advance or on-demand reservation ofresources, varying in type and implementation, and indepen-dently controlled and monitored. Lee et al. (1999) used resource-utility functions in a QoS management framework with the goal tomaximize the total utility of the system. End users’ qualitypreferences are taken into account when system resources areapportioned across multiple applications such that the net systemutility accrued to the end users’ is maximized. They propose twoapproximation algorithms, and compare the run times andsolution quality with an optimal solution. Buyya et al. (2001,2002) have proposed and developed a distributed computationaleconomy-based framework, called Nimrod/G, for resource alloca-tion and to regulate supply and demand of the available resources.Nam and Youn (2004) proposed a quorum-based resourcemanagement scheme, Resource Quorum, which includes middle-ware entity and network entity, both satisfying the requirementsof application QoS. They suggest a heuristic configurationalgorithm in order to optimize the performance and usage costof Resource Quorum. In Dogan and Ozguner (2002), Atakan Doganet al. consider the problem of scheduling a set of independenttasks with multiple QoS requirements, which may includetimeliness, reliability, security, version and priority, in a gridcomputing system in which resource prices can vary with timeduring scheduling time intervals. Foster et al. (2004) describe aGeneral-purpose Architecture for Reservation and Allocation(GARA) that supports flow-specific QoS specification, immediate

ARTICLE IN PRESS
L. Chunlin et al. / Journal of Network and Computer Applications 32 (2009) 760–769 761
and advance reservation, and online monitoring and control ofboth individual resources and heterogeneous resource ensembles.Ernemann (2002) addresses the idea of applying economic modelsto the scheduling task. A scheduling infrastructure and a market-economic method are presented. The efficiency of this approach isevaluated by simulations with real workload traces. Ghosh et al.(2003, 2004) present scalable QoS optimization algorithms forallocating resources to tasks in a multi-processor environment.The algorithms are extensions of QoS-based Resource AllocationModel (Q-RAM), can select a QoS operating point, the number ofreplicas for fault-tolerance and the processors on which to run thereplicas so as to maximize the overall system QoS.
The main contribution of the paper is to consider resourcescheduling with conflicting objectives in a grid environment. Theobjectives of the grid users, the grid resources and the grid systemclash with each other. Grid users want to access enough systemresources to achieve the desired level of QoS. Resource providerspay more attention to the performance of their resources. Ourresource scheduling employs market strategies to determinewhich jobs are executed at what time on which resources and atwhat prices. A grid resource provider uses its utility function tomaximize its profit and a grid user uses its utility function tocomplete tasks while minimizing its spending. The paperproposes grid system objective optimization scheduling thatprovides a joint optimization of objectives for both the resourceprovider and grid user, which combines the benefits of bothresource provider objective optimization and user objectiveoptimization. Experiments are designed to study the perfor-mances of three resource-scheduling optimization algorithms.Performance metrics are classified into efficiency metrics, utilitymetrics and time metrics.
The rest of the paper is structured as follows. Section 2presents resource scheduling with conflicting objectives. Section 3describes resource scheduling algorithms. In Section 4 theexperiments are presented and discussed. Section 5 concludesthe paper.
2. Resource scheduling with conflicting objectives
2.1. Mathematical model
It is assumed that the grid system consists of a collection ofsites S connected by a communication network. The set S containsn sites, labeled as s1, s2, y, si. Each site may contain multiplecomputing nodes. The sites in the grid system may have differentresources such as network, storage and computing power. Theprocessing power of a grid site si is measured by the average CPUspeed across all computing nodes within the grid site si. For anysite siAS, there are jobs arriving at si. The jobs are assumed to becomputationally intensive, mutually independent, and can beexecuted at any site. As soon as a job arrives, it must be assignedto one site for processing. When a job is completed, the executingsite will return the results to the originating site of the job. We useJ to denote the set of all jobs generated at S, J ¼ {J1, J2, y, Jk}. Aresource set including n resources can be represented as R ¼ {R1,R2, y, Rj}. Resource Rj (1pjpn) can be described as a triplet (RN,cj, pj), in which RN stands for the number of resource owned by Rj,cj for capacity of grid resource j and pj for the unit price. A job setcontaining m jobs is represented as J ¼ {J1, J2, y, Jk}. Job Jk isdescribed as (tn
i , qni ), in which tn
i stands for the time taken by theith grid user to complete the nth job, qn
i for the size of the griduser’s nth job. There are no dependencies among the jobs; so thesubmission order and completion order will not impact on theexecution result. A user set is represented as V ¼ {V1, V2, y, Vi}, for1pipN; User Vi submits a job, together with parameters including
Ti, which is the deadline limit of job completion time, and Ei,which is the budget limit for all jobs. This model assumes that auser can get all of the needed resources from the resourceprovider with necessary payment. The grid scheduler has ‘‘societalgoals’’ and attempts to maximize the aggregate user utilities andrevenue of the resource provider, as opposed to providers and gridusers that have individualistic goals; each provider wishes tomaximize its revenue, while each user wishes to maximize itsutility and do so for as little cost as possible. A utility function is aconcave function of the allotted resource that reflects usersatisfaction. The choice of utility function depends on the userapplication (e.g. data, video). The global grid system objective is tomaximize the sum utility. Maximizing sum utility serves as acommon objective of system-oriented scheduling to createincentives for grid user of application layer and resource providerto interplay (Li and Li, 2003, 2004a, b, c, 2005, 2006).
In our study, the network resource QoS is primarily concernedwith the capacity of bandwidth. The computation resource QoS isconcerned with computation cost and computation deadline. Inmodeling the QoS requirements, each grid user is assumed toassociate a number of QoS requirements with its grid user. Each ql
i
is a finite set of quality choices for the ith grid user’s lth QoSdimension. Let M denote the number of QoS requirements of griduser i. q1
i , q2i ;y, qM
i are the QoS dimensions associated with griduser i. qi ¼ ½q
1i ; . . . ; qM
i � defines an M-dimensional space of theQoS choices of grid user i. Associated with each QoS dimension isa utility function, which defines the user’s benefit in choosing acertain value of QoS choices in that dimension. Formally, theutility function associated with the lth QoS dimension of grid useri is Ul
iðqliÞ. One-dimensional utility functions can express grid
users’ benefits in individual QoS dimensions, but a grid resource-scheduling system needs multi-dimensional QoS requirements toevaluate the overall benefits of the grid users. Our QoS model iscomposed of two dimensions: payment and deadline. Paymentrepresents the cost associated with the execution of grid jobs.Payment can be broken down into two parts, which includecomputation cost and bandwidth cost. Deadline is a common anduniversal measure of performance. Deadline corresponds to theoverall time a job is processed in the grid. The deadline can bebroken down into two parts that include process time and delaytime. Multi-dimensional QoS requirements can be formulated as asum of its each dimensional QoS utility functions. The utilityfunction associated with grid user i is denoted by Ui(qi), which canbe defined as the sum of Ul
iðqliÞ:
UiðqiÞ ¼XMl¼1
Uliðq
liÞ
2.2. Resource scheduling for resource provider objective optimization
Each resource provider is concerned only about managingaccess to itself and not about other resources or applicationsrunning on other resources. Resource providers need to formulateQoS-aware offers in order to gain the highest possible profit. Thebenefit function of a resource provider can be expressed asfollows:
Ures ¼XN
i¼1
uji log xj
i
where xji is the resource sold to grid user i by grid provider j. uj
i
represents money paid to the grid resource provider j by grid useri.PN
i¼1uji log xj
i presents the revenue obtained by grid resourceprovider j from grid users. The grid resource provider, given theamounts that the grid users are willing to pay, u ¼ (u1, u2, y, un),

ARTICLE IN PRESS
L. Chunlin et al. / Journal of Network and Computer Applications 32 (2009) 760–769762
attempts to maximize the benefit functionP
uji log xj
i. So the gridresource provider’s optimization problem can be formulated asfollows:
max Ures
s:t: cjX
XN
i¼1
xji
cjXP
ixjidenotes that a grid resource provider cannot sell
resources to a grid user more than its capacity cj, which is theupper limit of the resources presented by grid resource provider j.
We take the derivative and second derivative with respect toxj
i:
U0ðxjiÞ ¼
uji
xji
; U00ðxjiÞ ¼ �
uji
xj2
i
U00ðxjiÞo0 is negative due to 0ouj
i. The extreme point is the uniquevalue maximizing the revenue of grid resource provider. TheLagrangian for Ures is L(x)
LðxjiÞ ¼
XN
i¼1
uji log xj
i þ l cj �XN
i¼1
xji
!
¼XN
i¼1
ðuji log xj
i � lxjiÞ þ lcj
where l is the Lagrangian constant. From Karush–Kuhn–Tuckertheorem, we know that the optimal solution is given byqLðxÞ=qxj
i ¼ 0 for l40:
qLðxjiÞ
qxji
¼uj
i
xji
� l
Let qLðxÞ=qxji ¼ 0 to obtain
xji ¼
uji
l
Using this result in the constraint equation, we can determine las
cj ¼1
l
Xmk¼1
ujk; l ¼
Pmk¼1uj
k
cj
We obtain
xj�
i ¼uj
icjPmk¼1uj
k
where xj�
i is the unique optimal solution to Ures. It means that theresource provider allocates xj�
i to the grid user to maximize itsrevenue.
2.3. Resource scheduling for user objective optimization
For user objective optimization scheduling, there are twoattributes that affect grid users. The first factor is payment. Welimit every grid user’s monetary resources, so a grid user that paysa higher price for a grid resource effectively limits the amount ofutility it can generate in the future. The second factor iscompletion time. This is dependent on resource congestion andthe hardware-providing service. There could be other qualitiesbesides completion time. In information retrieval tasks, accuracyis another factor. A grid user begins with an endowment of Ei tospend to complete its job and wishes to minimize the total timetaken to complete a sequence of jobs given its budget constraint.We assume that there are W types of resources and that each griduser may need many types to complete a job. Assume that there isa set W ¼ {1, 2, y, W} of different types of resources that the grid
allocates to each user in order to complete the job. The user’s jobcan be represented as the sequence fqn
i gn¼Wn¼1 , where qn
i is the size ofthe ith grid user’s nth job.
Let the pricing policy p, p ¼ (p1, p2, y, pj), denote the unitprices set of resource. The ith grid user receives resourcesproportional to its payment relative to the sum of the gridprovider’s revenue, cj is the capacity in computational units of jthgrid provider. Let xj
i be the fraction of resource units allocated togrid user i by resource provider j. If the ith grid user’ s payment inthe jth grid provider is uj
i , and uj ¼ ½uj1 . . .u
jN� represents all
payments of grid users for the jth grid resource provider, thenthe total number of computation resource units allocated to griduser i is
xji ¼
uji
pj
The time taken by the ith grid user to complete its nth job is:tj
i ¼ qni =cjx
ji.
The grid user wants to complete a sequence of jobs in aspecified amount of time, Ti, while minimizing the cost accrued.The utility function of a grid user can be expressed as thefollowing:
Uðxji;u
jiÞapp ¼ Ti � K
XWn¼1
qni
cjxji
þ D
!þ Ei �
XN
i¼1
uji
where D is the delay, which includes waiting times, transfertimes between various nodes in the grid. K is the relativeimportance of payments and times to complete a grid task; agrid user with larger value of K would indicate a greaterpreference to reduce its completion time. When K is 1, it meansthat payments and times are equally important. Ti is an upperbound on the total completion time of each grid user i.
Puj
i
is the total payment of the ith grid user paid to all neededservices. ðEi �
Pju
jiÞ represents the surplus of a grid user, which is
obtained by budgets subtracting the payments to resourceproviders.
Every grid user tries to maximize its benefit regardless ofothers, subject to the availability of budgets and complete timelimits. For a given grid resource pricing policy p, the grid useroptimization problem can be written as
max Uapp
s:t: TiX
XWn¼1
tni
The Lagrangian for the grid user’s utility is L(u):
LðujiÞ ¼ Ti � K
XWn¼1
qni
cjxji
þ D
!þ Ei �
XN
i¼1
uji þj Ti �
XWn¼1
tni
!
We substitute xji ¼ uj
i=pj to obtain
LðujiÞ ¼ Ti �
XN
i¼1
uji � K
XWn¼1
qni pj
cjuji
þjXWn¼1
qni pj
cjuji
þ KD
!þ Ei þjTi
where j is the Lagrangian constant. From Karush–Kuhn–Tuckertheorem, we know that the optimal solution is given byqLðuj
iÞ=quji ¼ 0 for l40:
qLðujiÞ
quji
¼ �1þ KXWn¼1
qni pj
cjðujiÞ
2þj
XWn¼1
qni pj
cjðujiÞ
2
Let qLðujiÞ=quj
i ¼ 0, to obtain
uji ¼
ðK þjÞqni pj
cj
� �1=2

ARTICLE IN PRESS
L. Chunlin et al. / Journal of Network and Computer Applications 32 (2009) 760–769 763
Using this result in the constraint equation, we can determiney ¼ k+j as
ðyÞ�1=2¼
TiPWk¼1ðpkqk
i =ckÞ1=2
We substitute (y)�1/2 to obtain uj�
i :
uj�
i ¼qn
i pj
cj
� �1=2PWk¼1ðq
ki pk=ckÞ
1=2
Ti
uj�
i is the unique optimal solution to the application-oriented QoSscheduling optimization.
2.4. Resource scheduling for system objective optimization
Grid systems will strive to find an optimal relation betweenuser satisfaction and resource utilization. The utility function of agrid system can be expressed as the following:
Usys ¼ Ti � KXWn¼1
qni
cjxji
þ D
!þ Ei �
XN
i¼1
uji þXN
i¼1
uji log xj
i
Expressed succinctly, the grid system optimization problem is
max Usys
s:t: cjX
XN
i¼1
xji; TiX
XWn¼1
tni
The utility function of a grid system combines the satisfaction ofthe grid user and benefit of a grid resource provider; Ti �
K½PW
n¼1ðqni =cjx
jiÞ þ D� þ Ei �
Pju
ji represents the grid user’s satis-
faction, which includes two factors: payment and completiontime. The objective of the grid user is to minimize completiontime and payment under the constraint of deadline.
Puj
i log xji
represents the grid resource provider’s benefits. The Lagrangianassociated with problem max Usys is L(u, x):
Lðx;uÞ ¼ Ti � KXWn¼1
qni
cjxji
þ D
!þ Ei �
XN
i¼1
uji þXN
i¼1
uji log xj
i
þ l cj �XN
i
xji
!þj Ti �
XWn¼1
tni
!
¼ Ti � KXWn¼1
qni
cjxji
þ KDþjXWn¼1
tni
!þ Ei �
XN
i¼1
uji
þXN
i¼1
uji log xj
i � lXN
i
xji þ lcj þjTi
Since the Lagrangian is separable, this maximization of theLagrangian L(x, u) over uj
i, xji can be conducted in parallel as the
following two problems:
Papp ¼max Ti � KXWn¼1
qni
cjxji
þ KDþjXWn¼1
tni
!þ Ei �
XN
i¼1
uji
Pres ¼maxXN
i¼1
uji log xj
i � lXN
i¼1
xji
Problem Papp is conducted at the application level; the grid usergives the unique optimal payment to the resource provider underdeadline constraint to maximize the user’s satisfaction. ðEi �
Pju
jiÞ
represents the surplus of a grid user, which is obtained frombudgets, subtracting the payments to resource providers. Ti �
ðK þjÞP
ntni represents the saving times for the user, which is
obtained from time limit, subtracting the actual spending time.So, the objective of problem Papp is to get more surpluses of moneyand complete task for grid user as soon as possible. Problem Pres is
conducted at the resource layer; different resource providerscompute optimal resource allocation for maximizing the revenueof their own and resource surplus; the objective of resourceproviders is to maximize
Puj
i log xji � l
Pxj
i , which representsthe obtained revenue subtracting allotted resource:
Papp ¼ max Ti � KXWn¼1
qni
cjxji
þ KDþjXWn¼1
tni
!þ Ei �
XN
i¼1
uji
¼ max Ti �XN
i¼1
uji � ðK þjÞ
XWn¼1
qni pj
cjuji
� KDþ Ei
where j is the Lagrangian constant. From Karush–Kuhn–Tuckertheorem, we know that the optimal solution is given as qPapp/qu ¼ 0 for l40. We can obtain uj�
i , which is the unique optimalsolution to Papp:
uj�
i ¼qn
i pj
cj
� �1=2PNk¼1ðq
ki pk=ckÞ
1=2
Ti
Secondly, we consider the second sub-problem:
Pres ¼ maxXN
i¼1
uji log xj
i � lXN
i¼1
xji
where l is the Lagrangian constant. From Karush–Kuhn–Tuckertheorem, we know that the optimal solution is available givenqPres=qxj
i ¼ 0 for l40. We can obtain xj�
i , which is the uniqueoptimal solution to Pres. It means that resource provider allocatesxj�
i to grid user to maximize its revenue:
xj�
i ¼uj
icjPmk¼1uj
k
3. Resource scheduling algorithms
3.1. Algorithm 1. Resource provider objective optimization algorithm
(ROA)
Grid resource provider at iteration n:
(1)
Receives optimal payments ujðnÞi from grid user.�ðnþ1Þ
(2)
Calculates its optimal allocation to the grid user xji tomaximize Ures based on the payments ujðnÞ
i from grid user.
(3) Computes a new resource price according to the followingformula:
pðnþ1Þj ¼ max �;pðnÞj þ Z
Xn
i¼1
xji þ xj�ðnþ1Þ
i � cj
!( )
where Z40 is a step size parameter, n is the iteration number.Let e40 be a sufficiently small constant preventing prices toapproach zero. It is consistent with the law of supply anddemand: if the demand for grid resource exceeds the resourcesupply cj, then the price pðnþ1Þ
j is raised; otherwise, the price isreduced.
(4)
Communicates the new price pðnþ1Þj to all grid users.3.2. Algorithm 2. User objective optimization algorithm (UOA)
Grid user at iteration n:
(1)
Receives the price pðnÞj from the grid resource provider j.j�ðnþ1Þ(2)
Grid user calculates its optimal payments ui for resourceprovider i to maximize Uapp.�ðnþ1Þ
(3)
Communicates new optimal payments uji to resourceprovider i.

ARTICLE IN PRESS
L. Chunlin et al. / Journal of Network and Computer Applications 32 (2009) 760–769764
3.3. Algorithm 3. System objective optimization algorithm (SOA)
3.3.1. Resource provider action
(1)
Resource provider receives optimal payment uj�ðnÞi from griduser i.
�ðnþ1Þ
(2)
Calculates its optimal allocation to the grid user xji tomaximize Pres based on the payments uj�ðnÞ
i .
(3) Computes a new resource price according to the followingformula.
pðnþ1Þj ¼ max �; pðnÞj þ Z
Xn
i¼1
xji þ xj�ðnþ1Þ
i � cj
!( )
where Z40 is a step size parameter, n is the iteration number.Let e40 be a sufficiently small constant preventing pricesfrom approaching zero. It is consistent with the law of supplyand demand: if the demand for grid resource exceeds theresource supply cj, then the price pðnþ1Þ
j is increased; other-wise, the price is reduced.
(4)
Communicates the new price pðnþ1Þj to all grid users.3.3.2. User action
(1)
Grid user receives the price pðnÞj from the resource provider j.j�ðnþ1Þ(2)
Grid user calculates its optimal payments ui for resourceprovider i to maximize Papp.�ðnþ1Þ
(3)
Grid user communicates new optimal payments uji toresource provider i.
Table 1Simulation parameters
Simulation parameter Value
Number of clusters 100
Number of nodes in each cluster 50
Bandwidth [100 Mbps, 1 Gbps]
Network transferring time 200 ms
Processor capability (MIPS) [220, 580]
Job size [20 Kbytes, 2 Mbytes]
Job result size [10 Kbytes, 5 Mbytes]
Arrival time [100 ms, 400 ms]
Total number of users 600
Total number of resource providers 150
Reschedule interval 600 ms
Initial price of computing power [10, 500]
Deadline of users [100, 800]
Budget of users [100, 1500]
Resource capacities [50, 500]
Job arrival rate [0.1, 0.3]
4. Simulations
In this section, we study the performance of three resourcescheduling optimization algorithms under different system para-meters via simulations. The grid simulator is implemented on topof the JAVASIM network simulator. Network generator BRITEgenerates the computer network topology. BRITE is a randomnetwork topology generator used to generate the simulation testbed. With the BRITE, the user can configure the complexity of thenetwork to specify the number of nodes and connectivity, and itwill generate a random network with the specified properties. Thelink propagation delays and bandwidth can be set freely. In orderto simulate the dynamics and heterogeneity of the grid, all valuesof networks can be changed after topology generation. The gridsystem consists of n sites. Sites may have different processingpower. We simulate a grid system consisting of 100 clusters. Thenumber of nodes of these clusters is a random variable normallydistributed with the mean of 50 and the standard deviation of 20.The network bandwidth in the grid clusters is from 100 Mbps to1 Gbps. For each set of clusters, the attributes of the clusterinclude the number of nodes, processor capacity, the amount ofmain memory and the disk capacity. This setup makes this gridenvironment non-dedicated, heterogeneous and dynamic. Forexample, the resource vector for a node with one 1.3 GHz CPU,1 GB of memory and a 30 GB disk is (1.3 GHz; 1 GB 30 GB). Thereare a total of 150 resources and 600 users that are taken forexperimental evaluation of the system. We assume that each ofthe grid users can submit jobs to any of the resources. Jobs arriveat each site si, i ¼ 1, 2, y, n according to a Poisson process withrate a. Based on the average request interval, we define therequest rate by s ¼ 1/a. To take into account the wide dispersionin the job sizes in real grid applications, the sizes of the jobs aretaken randomly from the uniform distribution in the interval [1,100]. It was assumed that the job size ranged from 20 Kbytes to2 Mbytes, and the size of a job’s result ranged from 10 Kbytes to
5 Mbytes. The capacities of the resources were also chosenuniformly in the interval [50, 500]. The resource cost can beexpressed in grid dollar, which can be defined as processing costper MIPS. Processor capacity varies from 220 to 580 MIPS. Theinitial price of the resource is set from 10 to 500 grid dollars. Userssubmit their jobs with varying deadlines. The deadlines ofusers are chosen from 100 to 800 ms. The budgets of users areset from 100 to 1500 grid dollars. Simulation parameters are listedin Table 1.
4.1. Performance metrics
We mainly examine six performance metrics in this simula-tion:
The response time (RT) is defined as the time interval betweenthe point when a request arrives at the grid node and the pointwhen the grid node sends the response.Throughput (T) is defined as the number of tasks that could beallocated to available resources. It is an important element tobe considered, especially while considering very large-scalesystems.Resource utilization ratio (UE) is defined as the percentage ofallocated resources among all available resources.Allocation efficiency (AE) is a measure of the efficiency of theallocation process, which is computed using the number ofrequests and number of accepts:
AE ¼ accepts=requests
Job success ratio (SR) is defined as the ratio of the number ofjobs whose constraints are met over the total number of jobsrequesting service.User satisfaction (US) is defined as the utility of user in thesystem (normalized to the interval 0.0 and 1.0). A low valuemeans that a user can complete its goals successfully. A highvalue means that the user can achieve good results satisfyingits requirements.
4.2. Effect of the grid size
The following experiments are to test the scalability effect ofthe grid site. Figs. 1–6 compare the performances of SOA, UOA,ROA and Round-Robin under different grid sizes. In this experi-ment, grid sizes vary from 50 to 500 (S ¼ 50, 150, 250, 500).

ARTICLE IN PRESS
0
100
200
300
400
500
50
grid size
Res
pons
e tim
e (m
s)
UOA ROA
SOA Round
150 250 500
Fig. 1. Response time with grid size.
0
100
200
300
400
50
grid size
thro
ughp
ut
UOA ROA
SOA Round
150 250 500
Fig. 2. Throughput with grid size.
0
0.2
0.4
0.6
0.8
1
50
grid size
reso
urce
util
izat
ion
UOA ROA
SOA Round
150 250 500
Fig. 3. Resource utilization with grid size.
0
0.2
0.4
0.6
0.8
1
50
grid size
allo
catio
n ef
fici
ency
UOA ROA
SOA Round
150 250 500
Fig. 4. Allocation efficiency with grid size.
0
0.2
0.4
0.6
0.8
1
50
grid size
job
succ
ess
ratio
UOA ROA SOA Round
150 250 500
Fig. 5. Job success ratio at different grid sizes.
0
0.2
0.4
0.6
0.8
1
50
grid size
user
sat
isfa
ctio
n
UOA ROA SOA Round
150 250 500
Fig. 6. User satisfaction at different grid sizes.
L. Chunlin et al. / Journal of Network and Computer Applications 32 (2009) 760–769 765
Initially, jobs are processed in the grid consisting of the smallestsize (S ¼ 50, 100); then more grid nodes are added to the gridenvironment until all 500 nodes are used. Let us consider howdifferent grid size takes the effect on the response time. From theresults in Fig. 13, for both four strategies, smaller grid size leads tofaster response time. But, when the size of grid is larger, theresponse time of Round-Robin allocation increases quickly; theresponse time of SOA can be as much as 44% shorter than thatusing the Round-Robin allocation. On a big-size grid, Round-Robinallocation takes more time to allocate appropriate resources.Under a small-size grid (S ¼ 50), response times of the fourmethods are close to each other; when the size of grid increases(S ¼ 500), the response time of SOA can be as much as 18% shorterthan ROA. As shown in Fig. 1, for a different-size grid, the SOA andUOA outperform ROA and the conventional Round-Robin alloca-tion. Fig. 2 shows the throughput with varying number of gridnodes; SOA achieves good throughput in a small-size gridscenario, with UOA and ROA closely behind. However, as gridsize increases, the Round-Robin and UOA deteriorate quicker thanthe SOA. Under a large-size grid, the decrease of ROA and SOA islower than UOA and Round-Robin. When grid size reaches 500,the throughput of ROA and UOA reduces quickly. Throughput ofSOA is as much as 20% larger than that using the Round-Robinallocation. As can be observed from Fig. 3, SOA outperforms UOAand ROA and Round-Robin in terms of resource utilization in allcases. A further observation is that the advantage of SOA over UOAbecomes more pronounced as the grid size increases. SOAconsiders the resource provider’s benefit. When grid users feelfrustrated due to increasing waiting time as grid size increases,the resource provider can decrease the price to attract more usersto use the resource. When grid size reaches 500, the resourceutilization of ROA reduces to 67%; UOA reduces to 60%. Resource

ARTICLE IN PRESS
L. Chunlin et al. / Journal of Network and Computer Applications 32 (2009) 760–769766
utilization using SOA is as much as 17% larger than that using theRound-Robin allocation. The results of allocation efficiency areshown in Fig. 4. It becomes clear that both allocation schemeswork best under a small-size grid. The SOA achieves to matchnearly 90% of all requests in a small-size grid scenario, with UOAand ROA closely behind. However, as grid size increases, theRound-Robin allocation and UOA soon lose comparably moreperformance than the SOA. Under a large-size grid, the decrease ofROA and SOA is lower than UOA and Round-Robin. When grid sizereaches 500, the resource allocation efficiency of ROA reduces to70%; UOA reduces to 56%. Resource allocation efficiency using SOAis as much as 34% larger than that using the Round-Robinallocation. It can be observed from Fig. 5 that, as the number ofgrid nodes increased, job success ratio of the four methodsworsened. This is easily understood. As more grid nodes wereadded, more times were needed for searching for computationalresources to meet the user’s requirement. This was reflected by adecrease in the percentage of tasks that met their deadlines.When grid size reaches 500, the job success ratio of ROA reducesto 62%; UOA reduces to 73%. Job success ratio of SOA is as much as20% larger than that using the ROA. Fig. 6 shows for both fourstrategies, smaller grid size leads to greater user satisfaction.When S ¼ 500, user satisfaction ratio is as much as 18% less thanthat by S ¼ 50. The smaller the S, the lesser the time needed forthe user to match the resource and the users wait less time, andexperience higher satisfaction. So the larger the S, the lower theuser satisfaction ratio.
0
100
200
300
400
0.05
task resource ratio
thro
ughp
ut
UOA ROA
SOA Round
0.1 0.2 0.5 0.7 1 2 4 8
Fig. 8. Throughput at different task resource ratios.
4.3. Effect of task-to-resource ratio
Task-to-resource ratio, denoted as rtr, is the ratio of the numberof tasks and the number of resources. When the numbers of taskand resources are equal, the task-to-resource ratio equals 1(rtr ¼ 1). When there are more tasks than resources, the task-to-resource ratio is more than 1 (rtr41). When the resources aremore than the tasks, the task-to-resource ratio is less than 1(rtro1).
As shown in Fig. 7, with increasing the value of the ratio rtr, theresponse time goes down as the task-to-resource ratio isdecreased. The reason is that the more the grid resources offered,the lesser that the tasks need to wait for resource. UOA, SOA, ROAand Round-Robin allocation present good results when the valueof the task-to-resource ratio is small. But, when the value of theratio is larger, the response time of Round-Robin allocationincreases quickly; the response time using UOA can be as muchas 30% shorter than that using ROA and the Round-Robinallocation. Round-Robin allocation takes more time to allocateappropriate resources. When the number of tasks increases, many
0
100
200
300
400
500
0.05
task resource ratio
resp
onse
tim
e (m
s)
UOA ROA SOA Round
0.1 0.2 0.5 0.7 1 2 4 8
Fig. 7. Response time at different task resource ratios.
tasks will get wasted or will have to wait for a long time to find amatch. The SOA outperforms the ROA, UOA and conventionalRound-Robin allocation. From the result of Fig. 8, before rtr45, thethroughput will increase as the task-to-resource ratio is increased.After rtro5, the number of tasks is higher than the capacity of theresource, the throughput will not increase anymore. Duringresource overload, the throughput might even decrease sincetime is wasted on requests that cannot be processed and areeventually discarded. The throughput of Round-Robin allocationdecreases quickly; the throughput of SOA can be as much as 15%more than that using UOA and the Round-Robin allocation.Considering the resource utilization, from the results in Fig. 9,before rtr44, the resource utilization increases, as task-to-resource ratio increases. In a task-intensive case, there are moretasks waiting for a match than the resources. As there is moredemand than supply, the price for the resources increases. Whenrtr ¼ 4, the resource utilization is almost 100%; this is because ofthe high demand for resources. After rtr44, as task-to-resourceratio is higher, the resource utilization becomes lower. Becausewhen task-to-resource ratio increases quickly, the grid resourcesupply is not enough to be allocated to the user, the unit price ofthe resource will increase, and some users cannot afford the gridresources. When rtr ¼ 4, the resource utilization of SOA is 12%more than the utilization of UOA and 27% more than Round-Robinallocation. From the results in Fig. 10, when the task-to-resourceratio is low, the allocation efficiency using SOA is 9% larger thanthat using the ROA and 15% larger than that using the UOA. Withincreasing the value of the ratio, SOA performs better than UOA,ROA and Round-Robin. Fig. 11 shows that when task-to-resourceratio is low (rtr ¼ 0.10), the system is capable of handling allrequests and the corresponding plots overlap with each other;during the steady state, the job success ratio is 1. When task-to-
0
0.2
0.4
0.6
0.8
1
0.05
task resource ratio
reso
urce
util
izat
ion
UOA ROA
SOA Round
0.1 0.2 0.5 0.7 1 2 4 8
Fig. 9. Resource utilization at different task resource ratios.
ARTICLE IN PRESS
0
0.2
0.4
0.6
0.8
1
0.05
task resource ratio
allo
catio
n ef
fici
ency
UOA ROA SOA Round
0.1 0.2 0.5 0.7 1 2 4 8
Fig. 10. Allocation efficiency at different task resource ratios.
0
0.2
0.4
0.6
0.8
1
0.05
task resource ratio
job
succ
ess
ratio
UOA ROA SOA Round
0.1 0.2 0.5 0.7 1 2 4 8
Fig. 11. Job success ratio at different task resource ratios.
0
0.2
0.4
0.6
0.8
1
0.05
task resource ratio
user
sat
isfa
ctio
n
UOA ROA SOA Round
0.1 0.2 0.5 0.7 1 2 4 8
Fig. 12. User satisfaction at different task resource ratios.
0
100
200
300
400
500
600
100
budget
resp
onse
tim
e (m
s)
SOA UOA ROA
250 500 800 1000 1500
Fig. 13. Response time vs. budget.
0
100
200
300
400
500
100
budget
thro
ughp
ut
SOA UOA ROA
250 500 800 1000 1500
Fig. 14. Throughput vs. budget.
0.4
0.6
0.8
1
esou
rce
utili
zatio
n
L. Chunlin et al. / Journal of Network and Computer Applications 32 (2009) 760–769 767
resource ratio is high (rtr ¼ 4.0), some user requests are droppedand job success ratio of ROA decreases to 0.5; when job successratio of UOA decreases to 0.58, SOA is better than others. As shownin Fig. 12, the user satisfaction drops as the task-to-resource ratioincreases; the smaller the rtr, the earlier that the system reachesthe steady state and the higher the user satisfaction. When task-to-resource ratio is low (rtr ¼ 0.10), the resources are enough to beallocated to users; the user can choose appropriate resources tocomplete tasks under the deadline, and so user QoS requirementcan be well satisfied. When rtr increases to 4.0, the availableresources are not enough to be allocated and some users cannotachieve the objective.
0
0.2
100
budget
r
SOA UOA ROA
250 500 800 1000 1500
Fig. 15. Resource utilization vs. budget.
4.4. Effect of budget
How the user budget affects the response time, throughput,resource utilization, allocation efficiency, user satisfaction and job
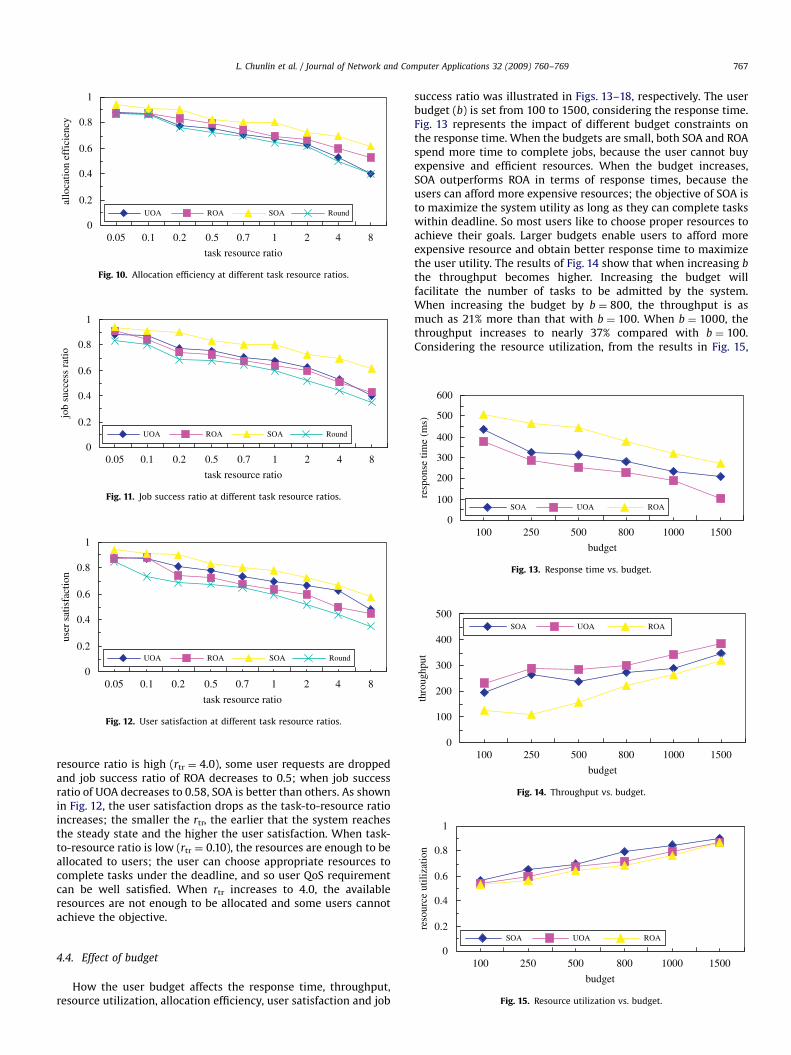
success ratio was illustrated in Figs. 13–18, respectively. The userbudget (b) is set from 100 to 1500, considering the response time.Fig. 13 represents the impact of different budget constraints onthe response time. When the budgets are small, both SOA and ROAspend more time to complete jobs, because the user cannot buyexpensive and efficient resources. When the budget increases,SOA outperforms ROA in terms of response times, because theusers can afford more expensive resources; the objective of SOA isto maximize the system utility as long as they can complete taskswithin deadline. So most users like to choose proper resources toachieve their goals. Larger budgets enable users to afford moreexpensive resource and obtain better response time to maximizethe user utility. The results of Fig. 14 show that when increasing b
the throughput becomes higher. Increasing the budget willfacilitate the number of tasks to be admitted by the system.When increasing the budget by b ¼ 800, the throughput is asmuch as 21% more than that with b ¼ 100. When b ¼ 1000, thethroughput increases to nearly 37% compared with b ¼ 100.Considering the resource utilization, from the results in Fig. 15,

ARTICLE IN PRESS
0
0.2
0.4
0.6
0.8
1
100
budget
job
succ
ess
ratio
SOA UOA ROA
250 500 800 1000 1500
Fig. 17. Job success ratio vs. budget.
0
0.2
0.4
0.6
0.8
1
100
budget
user
sat
ifac
tion
SOA UOA ROA
250 500 800 1000 1500
Fig. 18. User satisfaction vs. budget.
1000
0.2
0.4
0.6
0.8
1
budget
allo
catio
n ef
fici
ency
SOA UOA ROA
250 500 800 1000 1500
Fig. 16. Allocation efficiency vs. budget.
L. Chunlin et al. / Journal of Network and Computer Applications 32 (2009) 760–769768
as the budget is higher, the resource utilization becomes higher.When b ¼ 1000, the resource utilization is as much as 38% morethan utilization by b ¼ 100, because when the budget decreasesquickly the users will be prevented from obtaining resources.Considering the resource allocation efficiency, from the results inFig. 16, when increasing budget values, the resource allocationefficiency of SOA becomes higher. A larger budget brings outhigher resource allocation efficiency. Fig. 17 shows the effect ofbudget on job success ratio. When increasing budget values, thejob success ratio becomes higher. A larger budget enables grid theuser to afford more expensive resources to complete the taskbefore its deadline. When budget increases (b ¼ 1000), jobsuccess ratio is as much as 36% more than that with b ¼ 100.Under the same task deadline (b ¼ 800), SOA has higher jobsuccess ratio than ROA by 23%. Considering the user satisfaction,from the results in Fig. 18, when increasing budget values, the usersatisfaction of SOA becomes higher than ROA by 30%, whenb ¼ 1000. A larger budget brings out user satisfaction ratio.Because grid users can use expensive resources to complete thetasks within the deadline, they can maximize their satisfactionutilities.
5. Conclusions
This paper considers resource scheduling with conflictingobjectives in a grid environment. Grid users want to accessenough system resources to achieve the desired level of QoS.Resource providers pay more attention to the performanceof their resources. Our resource scheduling employs marketstrategies to determine which jobs are executed at whattime on which resources and at what prices. A grid resourceprovider uses its utility function to maximize its profit anda grid user uses its utility function to complete tasks whileminimizing its spending. The grid system composed of re-sources and grid users strives to find an optimal relation betweenuser satisfaction and resource provider benefits. The paperproposes grid system objective optimization scheduling thatprovides a joint optimization of objectives for both the resourceprovider and grid user, which combines the benefits of bothresource provider objective optimization and user objectiveoptimization algorithm.
Acknowledgments
The authors thank the editors and the anonymous reviewers fortheir helpful comments and suggestions. The work is supported bythe National Natural Science Foundation of China (NSF) underGrants nos. 60773211 and 60672137, Program for New CenturyExcellent Talents in University (NCET), and the China SpecializedResearch Fund for the Doctoral Program of Higher Education underGrant no. 20060497015, and the Natural Science Foundation ofHuBei Province under Grant no. 2008CDB335.
References
Al-Ali R, Rana O, Walker D, Jha S, Sohail S. G-QoSM: grid service discoveryusing QoS properties. Comput Inf J Spec Issue Grid Comput 2002;21(4):363–82.
Al-Ali R, ShaikhAli A, Rana O, Walker D. Supporting QoS-based discovery inservice-oriented grids. In: Proceedings of IEEE heterogeneous computingworkshop (HCW’03), Nice, France, 2003.
BRITE, /http://www.cs.bu.edu/briteS.Buyya R, Giddy J, Abramson D. A case for economy grid architecture for service-
oriented grid computing. In: HCW 2001 in conjunction with IPDPS 2001, SanFrancisco, CA, USA, April 2001.
Buyya R, Murshed Manzur, Abramson David. A deadline and budget constrainedcost-time optimization algorithm for scheduling task farming applications onglobal grids. In: PDPTA’02, Las Vegas, USA, June 24–27, 2002.
Dogan Atakan, Ozguner F. Scheduling independent tasks with QoS requirements ingrid computing with time-varying resource prices. In: Proceedings of GRID2002. New York: Springer; 2002. p. 58–69 [LNCS 2536].
Ernemann Carsten. Economic scheduling in grid computing. In: Proceedingsof the eighth international workshop on job scheduling strategies forparallel processing, Lecture notes in computer science, UK, July 24, 2002.p. 128–52.
Foster I, Fidler M, Roy A, Sander V, Winkler L. End-to-end quality of service forhigh-end applications. Elsevier Comput Commun J 2004;27(14):1375–88.
Ghosh Sourav, Rajkumar Ragunathan, Hansen Jeffery, Lehoczky John. Scalableresource allocation for multi-processor QoS optimization. In: Proceedings ofthe 23rd international conference on distributed computing systems, May2003. p. 174–83.
Ghosh Sourav, Rajkumar Ragunathan, Hansen Jeffery, Lehoczky John. Integratedresource management and scheduling with multi-resource constraints. In:Proceedings of 25th the IEEE real-time systems symposium, 2004.
Golconda Kavitha S, Ozguner F. A comparison of static QoS-based schedulingheuristics for a meta-task with multiple QoS dimensions in heterogeneouscomputing. In: IPDPS’04, 2004.
JAVASIM, /http://javasim.ncl.ac.ukS.Lee Chen, Lehoczky John, Rajkumar Raj, Siewiorek Dan. On quality of service
optimization with discrete QoS options. In: Proceedings of the IEEE real-timetechnology and applications symposium, June 1999.
Li Chunlin, Li Layuan. Applying agents to build grid service management. J NetwComput Appl 2003;26(4):323–40.
Li Chunlin, Li Layuan. Agent framework to support computational grid. J SystSoftware 2004a;70(1–2):177–87.

ARTICLE IN PRESS
L. Chunlin et al. / Journal of Network and Computer Applications 32 (2009) 760–769 769
Li Chunlin, Li Layuan. Competitive proportional resource allocation policy forcomputational grid. Future Gener Comput Syst 2004b;20(6):1041–54.
Li Chunlin, Li Layuan. The use of economic agents under price driven mechanism ingrid resource management. J Syst Archit 2004c;50(9):521–35.
Li Chunlin, Li Layuan. A distributed utility-based two level market solution for optimalresource scheduling in computational grid. Parallel Comput 2005;31(3–4):332–51.
Li Chunlin, Li Layuan. Multi economic agent interaction for optimizing theaggregate utility of grid users in computational grid. Appl Intell 2006;25(2):147–58.
Nam Dong Su, Youn Chan-Hyun. QoS-constrained resource allocation for a grid-based multiple source electrocardiogram application. In: ICCSA 2004; 2004.p. 352–9 [LNCS 3043].