Embed Size (px)
Citation preview
McKinsey Global InstituteSustainability and Resource Productivity Practice
Overview of conclusions February 15th, 2011
CONFIDENTIAL AND PROPRIETARYAny use of this material without specific permission of McKinsey & Company is strictly prohibited
Resource Revolution: Meeting the world’s energy, materials, food and water needs

McKinsey & Company 1|
Contents
▪ Overview
▪ Key exhibits
McKinsey & Company 2|
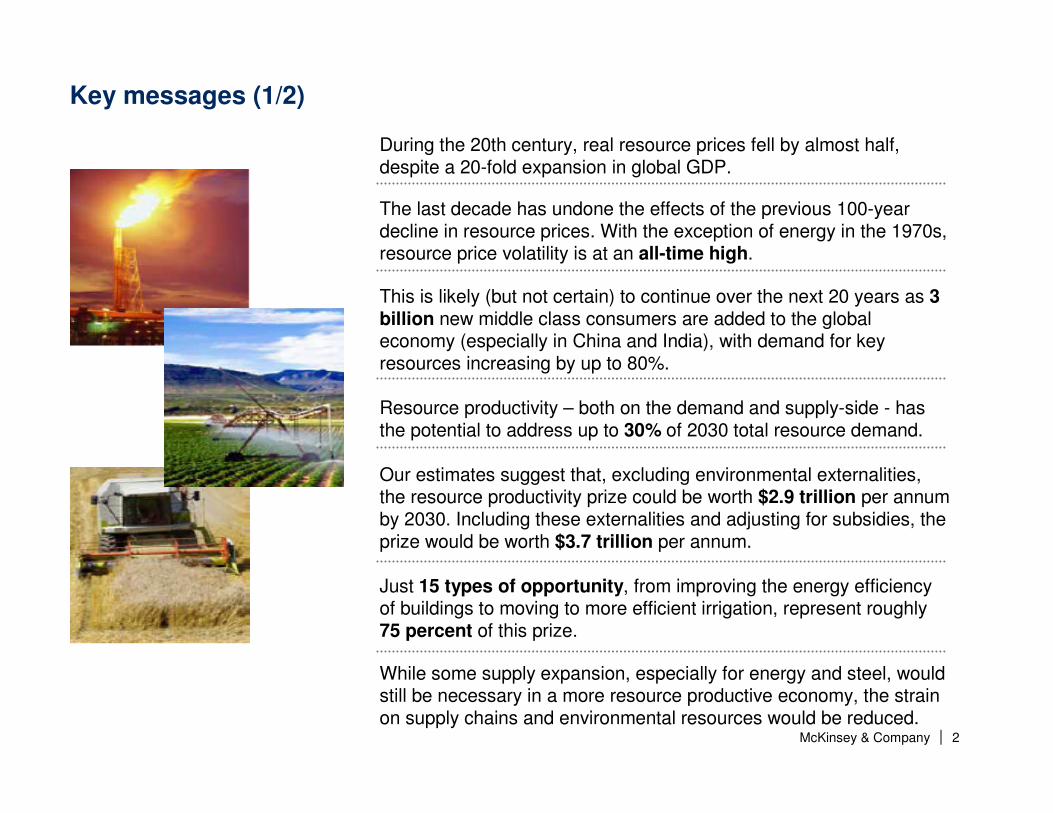
Key messages (1/2)
During the 20th century, real resource prices fell by almost half, despite a 20-fold expansion in global GDP.
The last decade has undone the effects of the previous 100-year decline in resource prices. With the exception of energy in the 1970s, resource price volatility is at an all-time high.
This is likely (but not certain) to continue over the next 20 years as 3 billion new middle class consumers are added to the global economy (especially in China and India), with demand for key resources increasing by up to 80%.
Resource productivity – both on the demand and supply-side - has the potential to address up to 30% of 2030 total resource demand.
Our estimates suggest that, excluding environmental externalities, the resource productivity prize could be worth $2.9 trillion per annum by 2030. Including these externalities and adjusting for subsidies, the prize would be worth $3.7 trillion per annum.
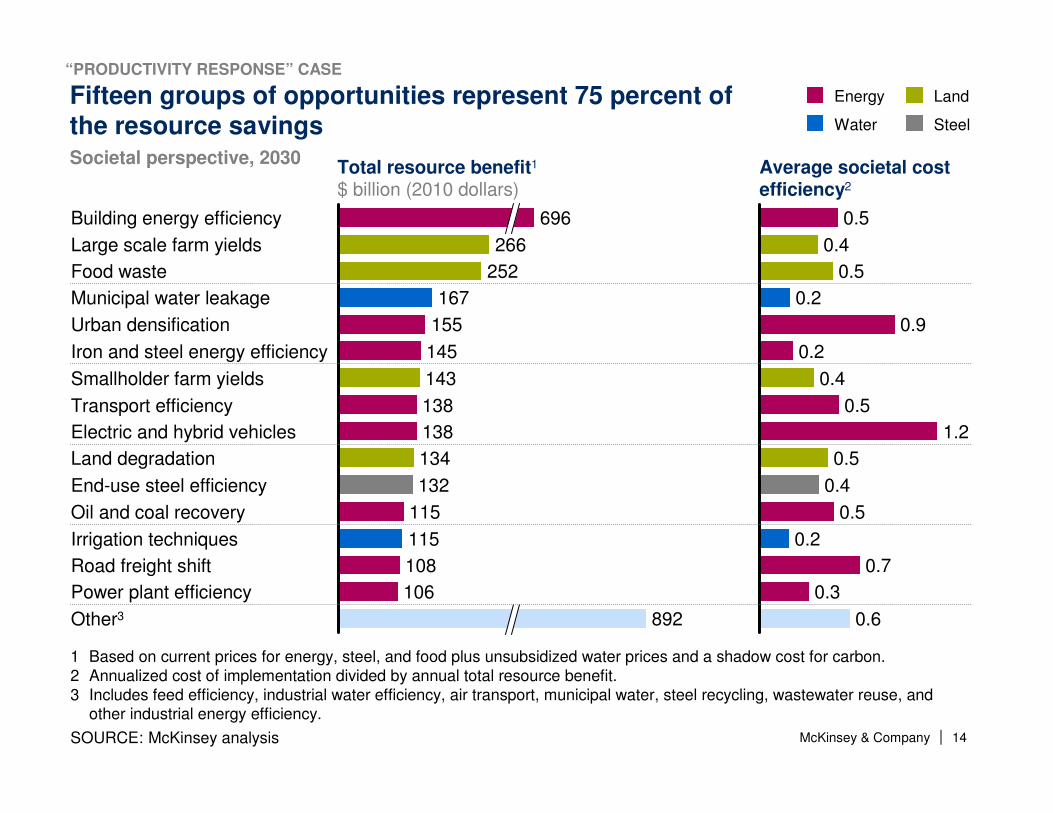
Just 15 types of opportunity, from improving the energy efficiency of buildings to moving to more efficient irrigation, represent roughly 75 percent of this prize.
While some supply expansion, especially for energy and steel, would still be necessary in a more resource productive economy, the strain on supply chains and environmental resources would be reduced.

McKinsey & Company 3|
Key messages (2/2)
Addressing climate change and ensuring universal energy access would require further action – requiring an additional ~$400b of annual investment over the next 20 years.
Tackling this resource agenda must start with new institutional mindsets and mechanisms that can develop more coordinated approaches to the challenge of resources.
In addition, there are 3 critical priorities for policymakers1.Unleash the power of the market by strengthening market signals, including removing the $1.1 trillion of resources subsidies and supporting stability in long-term prices2.This must be supported by addressing (non-price) market failures, including property rights, agency issues, access to capital and innovation3.Create long-term resilience by building awareness of risks and appropriate safety nets, strengthening and deepening innovation systems, and addressing consumer mindsets
For the private sector, 9 resource-related trends will shape competitive dynamics across a range of sectors. Successful firmsmust place resource issues at the heart of their business strategy, including mitigating resource risk in operations through building knowledge of relevant risks and capturing available efficiency opportunities, and aggressively going after new growth opportunities.
McKinsey & Company 4|
Contents
▪ Overview
▪ Key exhibits
McKinsey & Company 5|
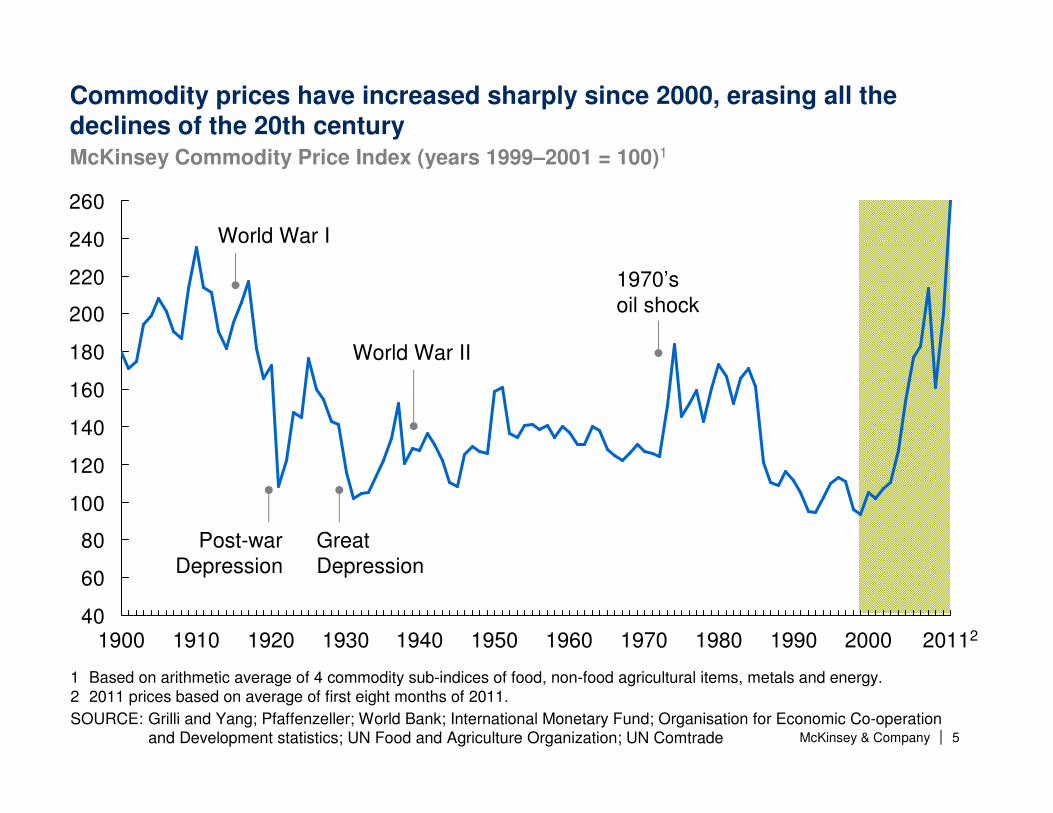
Commodity prices have increased sharply since 2000, erasing all the declines of the 20th century
40
60
80
100
120
140
160
180
200
220
240
260
1970 201122000199019801960195019401930192019101900
World War I
Post-warDepression
Great Depression
World War II
1970’soil shock
McKinsey Commodity Price Index (years 1999–2001 = 100)1
1 Based on arithmetic average of 4 commodity sub-indices of food, non-food agricultural items, metals and energy. 2 2011 prices based on average of first eight months of 2011.
SOURCE: Grilli and Yang; Pfaffenzeller; World Bank; International Monetary Fund; Organisation for Economic Co-operation and Development statistics; UN Food and Agriculture Organization; UN Comtrade

McKinsey & Company 6|
Resource price volatility is at an all-time high, with the exception of energy in the 1970s Annual price volatility1
%
32
6
21
93
13171110
25
7
28
102120
89151514
87
26
131110917
11202424
15
201189 99796959493929191909
Energy
Food
Metals
Agricultural materials
39
14
38
56
471513
212220
SOURCE: Grilli and Yang; Pfaffenzeller; World Bank; International Monetary Fund; Organisation for Economic Co-operation and Development statistics; UN Food and Agriculture Organization; UN Comtrade
1 Calculated as the standard deviation of the commodity subindex divided by the average of the subindex over the time frame.
McKinsey & Company 7|
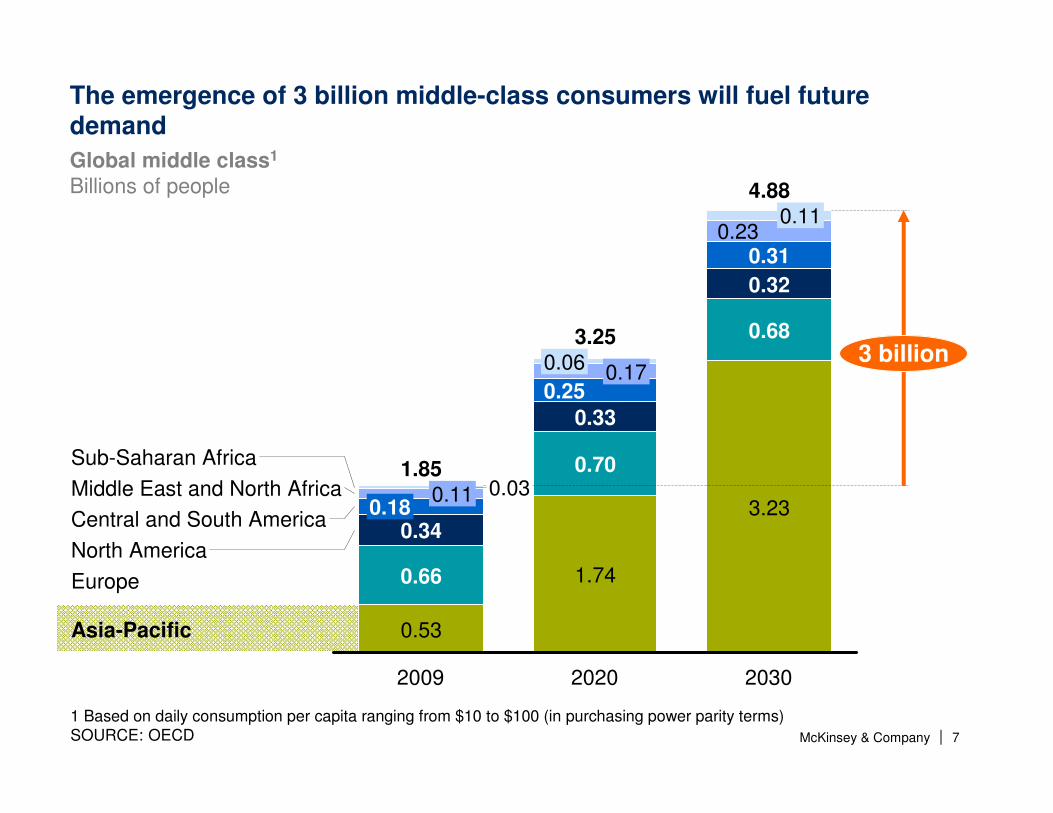
The emergence of 3 billion middle-class consumers will fuel future demand
Global middle class1
Billions of people
Middle East and North Africa
Sub-Saharan Africa
2030
3.23Central and South America
4.88
3 billion
Asia-Pacific
North America
Europe
0.68
0.32
0.310.23
0.11
2020
3.25
1.74
0.70
0.33
0.250.170.06
2009
1.85
0.53
0.66
0.340.18
0.11 0.03
1 Based on daily consumption per capita ranging from $10 to $100 (in purchasing power parity terms)SOURCE: OECD

McKinsey & Company 8|
0
50
100
150
200
250
0 5,000 10,000 15,000 20,000 25,000 30,000 35,000 40,000 45,000
Per capita GDPReal 2005 $PPP per person
Per capita energy consumption, 1970–2008, projected to 2030 for India and ChinaMillion British thermal units per person
Many countries have shown that as incomes rise, demand for resource increases—and a similar curve is likely in China and India
SOURCE: IEA; Global Insight; McKinsey analysis
ENERGY EXAMPLE
2030 projected
2030 projected
India
China
South Korea Japan
Germany
France
United Kingdom
United States
Australia
Historical range for energy consumption evolution
Historic (1970-2008)
Projected
McKinsey & Company 9|SOURCE: McKinsey analysis
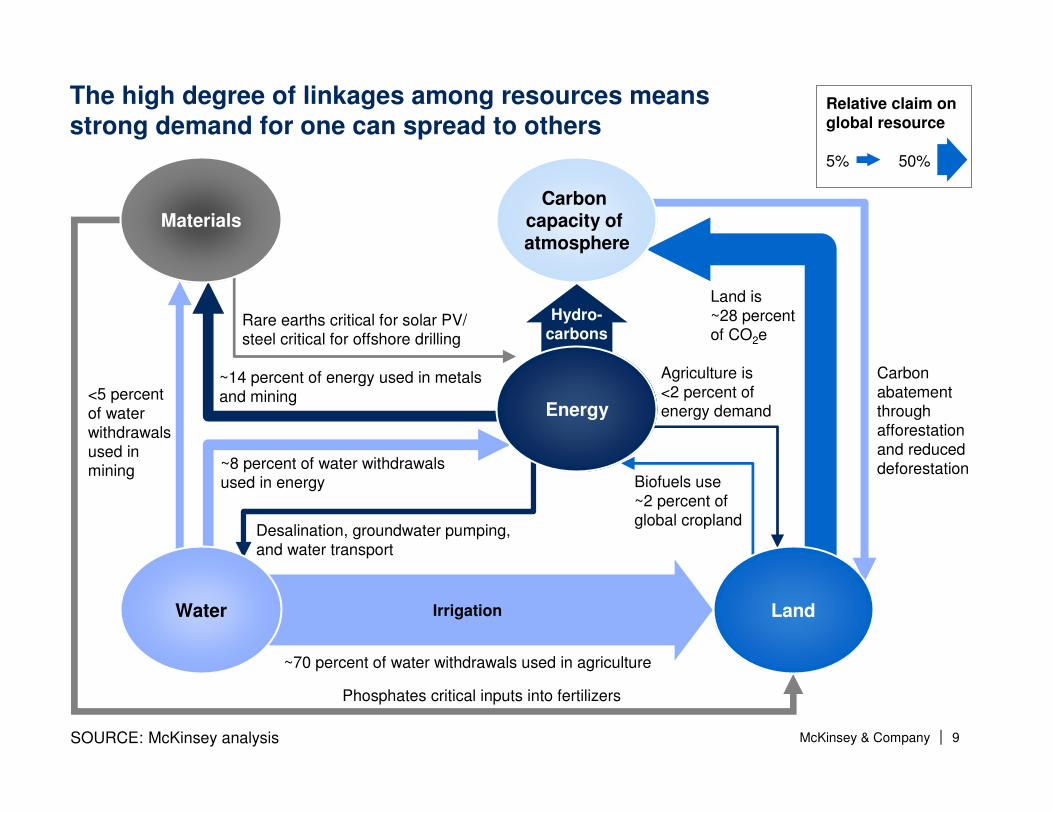
The high degree of linkages among resources means strong demand for one can spread to others
Irrigation
Desalination, groundwater pumping, and water transport
Biofuels use ~2 percent of global cropland
Land is ~28 percent of CO2e
Carbon abatement throughafforestation and reduced deforestation
~70 percent of water withdrawals used in agriculture
~8 percent of water withdrawals used in energy
~14 percent of energy used in metals and mining
Rare earths critical for solar PV/ steel critical for offshore drilling
Agriculture is<2 percent of energy demand
<5 percent of water withdrawals used in mining
Hydro-carbons
Relative claim on global resource
5% 50%
Phosphates critical inputs into fertilizers
Energy
Water
Carbon capacity of atmosphere
Land
Materials

McKinsey & Company 10|
IMF estimates that a 10 percent increase in the price of crude reduces global GDP by 0.2%-0.3% in one year
World Bank estimates that recent food price increases drove 44 million people into poverty
At least 8 countries commit 5 percent or more of their GDP to energy subsidies. In 2005, government subsidies were estimated to account for 14 percent of India’s GDP
These resource trends pose several risks to global growth and welfare
Just four countries—Iran, Iraq, Saudi Arabia, and Venezuela—hold almost 50 percent of known oil reserves
A recent study by the Economics of Climate Adaptation Working Group suggests that some regions are at risk of losing up to 12 percent of their annual GDP by 2030 as a result of existing climate patterns

McKinsey & Company 11|
In our productivity response case, there are opportunities that could meet 13 to 29 percent of resources demand
1 Productivity improvements include supply-side measures, such as enhanced oil recovery that lower effective remaining demand.
2 Supply-side levers such as improving recovery rates and the conversion rate in mining and coke do not save steel and are not reflected in this exhibit. We have included effective steel savings from higher scrap recycling.
SOURCE: McKinsey analysis
512655
143492
1,9952,290
2951,270
6,3505,000–5,2001,150–1,3504,500
1,210–1,320
Remaining 2030 demand
Productivity improvements
435–500
2030 base-casedemand
1,710–1,755
2010 demand
1,535
-22%
-13%
-18 to -21%
-25 to -29%
WaterCubic kilometers
LandMillion cropland hectares
Primary energy1
QBTU
Steel2
Million tonnessteel equivalent
“PRODUCTIVITY RESPONSE” CASE
McKinsey & Company 12|
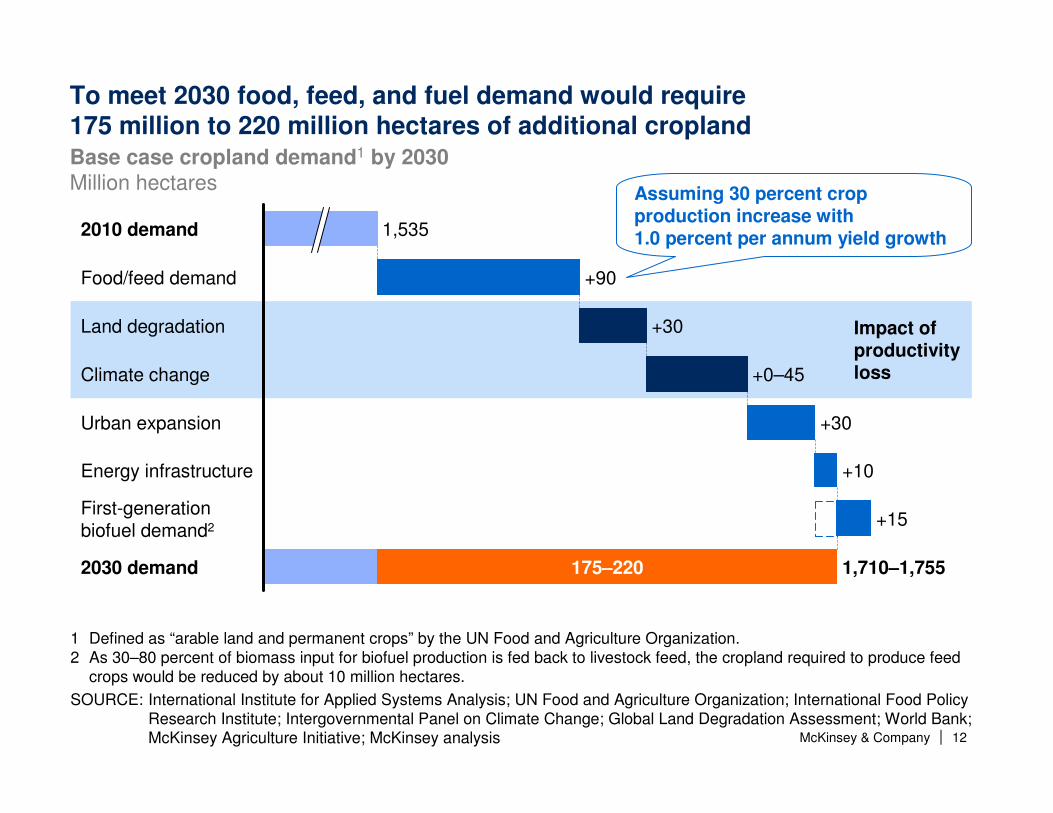
To meet 2030 food, feed, and fuel demand would require 175 million to 220 million hectares of additional croplandBase case cropland demand1 by 2030Million hectares
2030 demand 1,710–1,755175–220
First-generationbiofuel demand2 +15
Energy infrastructure +10
Urban expansion +30
Climate change +0–45
Land degradation +30
Food/feed demand +90
2010 demand 1,535
Impact of productivity loss
1 Defined as “arable land and permanent crops” by the UN Food and Agriculture Organization. 2 As 30–80 percent of biomass input for biofuel production is fed back to livestock feed, the cropland required to produce feed
crops would be reduced by about 10 million hectares.
SOURCE: International Institute for Applied Systems Analysis; UN Food and Agriculture Organization; International Food Policy Research Institute; Intergovernmental Panel on Climate Change; Global Land Degradation Assessment; World Bank; McKinsey Agriculture Initiative; McKinsey analysis
Assuming 30 percent crop production increase with 1.0 percent per annum yield growth
McKinsey & Company 13|
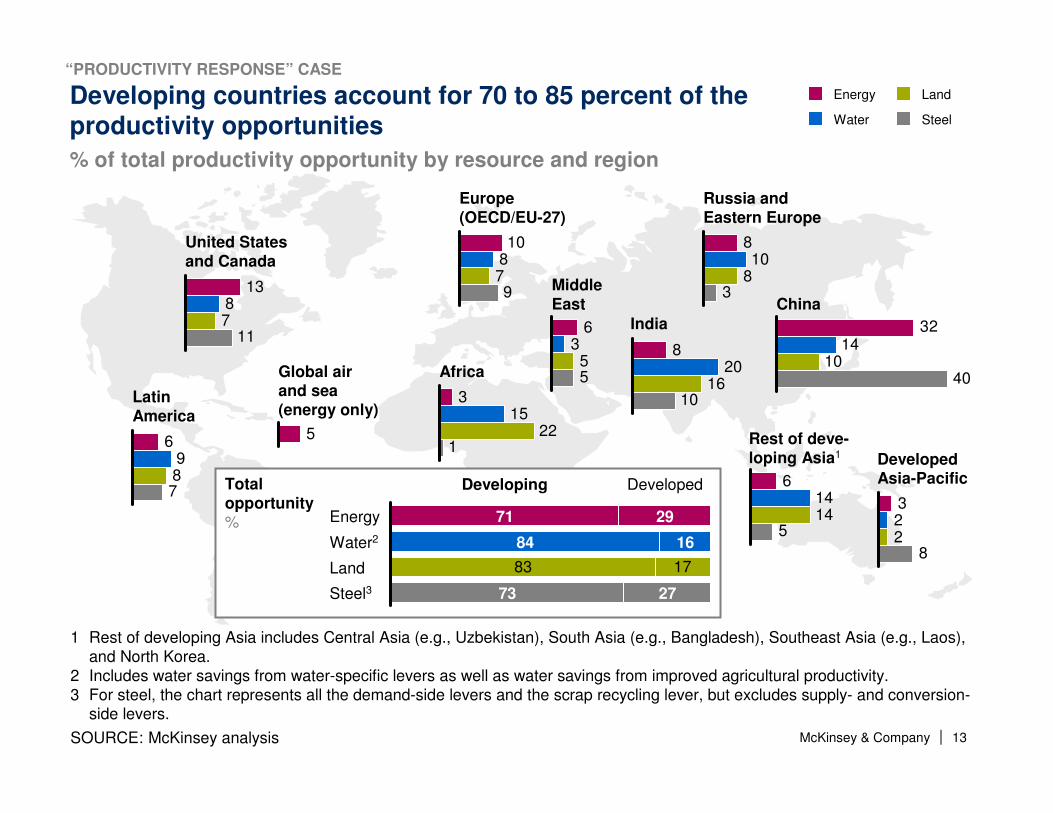
Developing countries account for 70 to 85 percent of the productivity opportunities
% of total productivity opportunity by resource and region
1387
11
Energy
SteelWater
Land
820
1610
3214
1040
315
221
SOURCE: McKinsey analysis
1 Rest of developing Asia includes Central Asia (e.g., Uzbekistan), South Asia (e.g., Bangladesh), Southeast Asia (e.g., Laos), and North Korea.
2 Includes water savings from water-specific levers as well as water savings from improved agricultural productivity.3 For steel, the chart represents all the demand-side levers and the scrap recycling lever, but excludes supply- and conversion-
side levers.
322
8
61414
5
63
55
10879
810
83
6987
5
United States and Canada
India
China
Africa
Developed Asia-Pacific
Rest of deve-loping Asia1
Middle East
Europe (OECD/EU-27)
Russia and Eastern Europe
Latin America
Global air and sea (energy only)
83 17
73
DevelopedDeveloping
27
Land
Water2
Energy 71
84
29
16
Steel3
Total opportunity%
“PRODUCTIVITY RESPONSE” CASE
McKinsey & Company 14|
Fifteen groups of opportunities represent 75 percent ofthe resource savings
Electric and hybrid vehicles 138
134Land degradation
143Smallholder farm yields
138Transport efficiency
155Urban densification
145Iron and steel energy efficiency
252Food waste
167Municipal water leakage
696Building energy efficiency
266Large scale farm yields
Other3 892
Power plant efficiency 106
Road freight shift 108
Irrigation techniques 115
Oil and coal recovery 115
End-use steel efficiency 132
Total resource benefit1
$ billion (2010 dollars)Average societal cost efficiency2
0.6
0.3
0.7
0.2
0.5
0.4
0.5
1.2
0.5
0.4
0.2
0.9
0.2
0.5
0.4
0.5
Energy
Water
Land
Steel
1 Based on current prices for energy, steel, and food plus unsubsidized water prices and a shadow cost for carbon.2 Annualized cost of implementation divided by annual total resource benefit.3 Includes feed efficiency, industrial water efficiency, air transport, municipal water, steel recycling, wastewater reuse, and
other industrial energy efficiency.
SOURCE: McKinsey analysis
Societal perspective, 2030
“PRODUCTIVITY RESPONSE” CASE

McKinsey & Company 15|
Annual resource benefit$ billion, 2030
We have developed an integrated resource cost curve to compare productivity levers across resources
1.0
Lever width quantifies annual resource savings calculated as the resource volume saved (e.g., barrels of oil) times today’s price (e.g., $100/barrel of oil)
Lever height quantifies the cost efficiency of investment (i.e., the cost of implementation divided by the resource benefit)
Productivity opportunities with returns higher than the assumed hurdle rate
Productivity opportunities with returns lower than the assumed hurdle rate
Cost efficiency$ cost of implementation per $ resource benefit
SOURCE: McKinsey analysis
“PRODUCTIVITY RESPONSE” CASE

McKinsey & Company 16|
5
3
1
-1
-3
4,0003,5003,0002,5002,0001,5001,0005000
7
7
5
3
1
-1
-3
4,0003,5003,0002,5002,0001,5001,0000 500
Resource productivity opportunities could create societal benefits of up to $3.7 trillion, with 90 percent of opportunities above the hurdle rate
Steel
Land
Water
Energy
1 Based on current prices for energy, steel, and food, less energy taxes, plus subsidies, and a shadow cost for carbon (at $30 per tonne of carbon dioxide equivalent).
SOURCE: McKinsey analysis
2030
Societal perspective▪Societal prices1
▪Discount rate 4%
+800 billion
Cost efficiency of investment
Total annual resource benefit, $ billion
70% of productivity opportunities above
hurdle rate
90% of productivity opportunities above
hurdle rate
Investor perspective▪Current
prices▪Discount
rate 10%
“PRODUCTIVITY RESPONSE” CASE
McKinsey & Company 17|
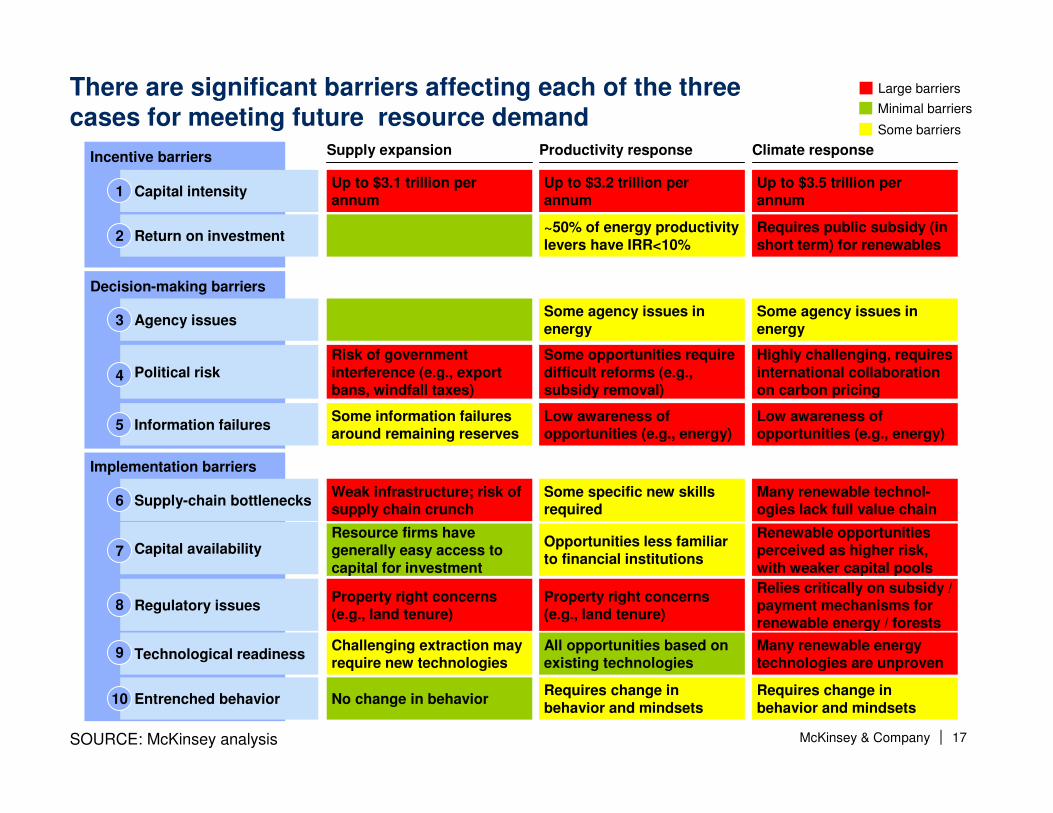
There are significant barriers affecting each of the three cases for meeting future resource demand
SOURCE: McKinsey analysis
Minimal barriers
Some barriers
Large barriers
Incentive barriersIncentive barriers
Decision-making barriers
Supply expansion
Up to $3.1 trillion per annum
Capital intensity1
Agency issues3
Risk of government interference (e.g., export bans, windfall taxes)
Political risk4
Some information failures around remaining reserves
Information failures5
Return on investment2
Productivity response
Up to $3.2 trillion per annum
Some agency issues in energy
Some opportunities require difficult reforms (e.g., subsidy removal)
Low awareness of opportunities (e.g., energy)
~50% of energy productivity levers have IRR<10%
Climate response
Up to $3.5 trillion per annum
Some agency issues in energy
Highly challenging, requires international collaboration on carbon pricing
Low awareness of opportunities (e.g., energy)
Requires public subsidy (in short term) for renewables
Weak infrastructure; risk of supply chain crunch
Resource firms have generally easy access to capital for investment
Property right concerns (e.g., land tenure)
Challenging extraction may require new technologies
Some specific new skills required
Opportunities less familiar to financial institutions
Property right concerns (e.g., land tenure)
All opportunities based on existing technologies
Requires change in behavior and mindsets
Many renewable technol-ogies lack full value chain
Renewable opportunities perceived as higher risk, with weaker capital pools
Relies critically on subsidy / payment mechanisms for renewable energy / forests
Many renewable energy technologies are unproven
Requires change in behavior and mindsets
No change in behavior
Implementation barriers
Supply-chain bottlenecks6
Capital availability7
Regulatory issues8
Technological readiness9
Entrenched behavior10
McKinsey & Company 18|
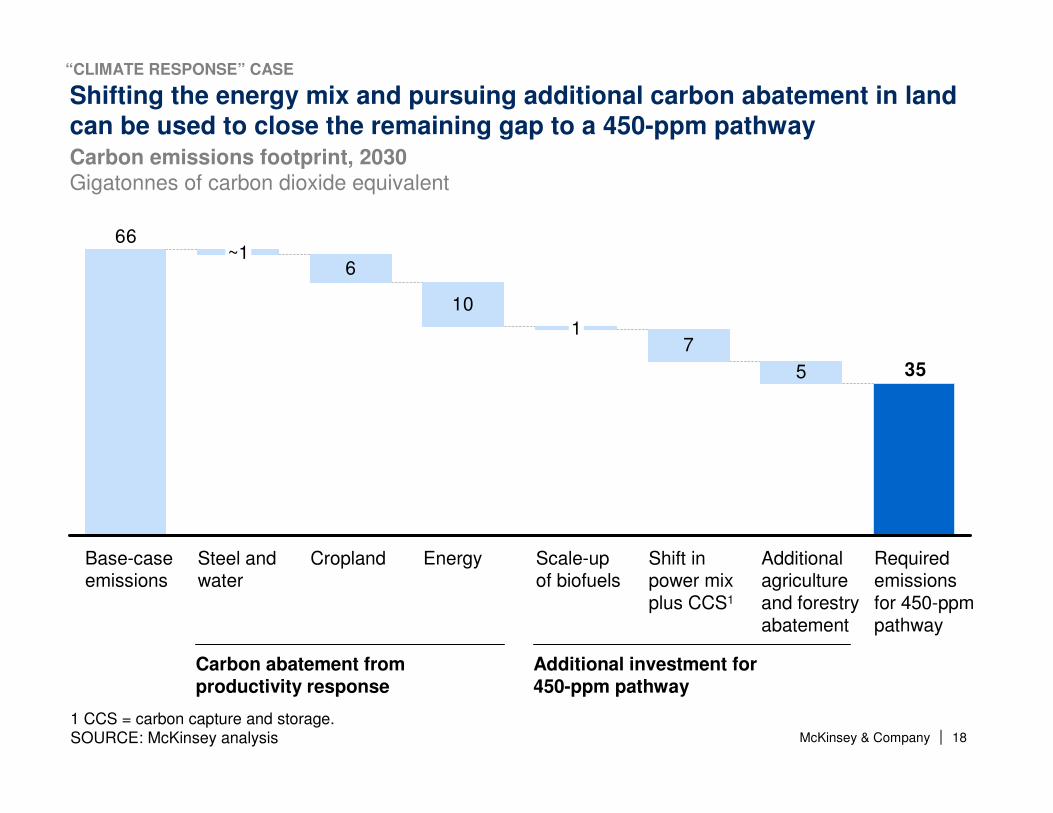
Additional investment for 450-ppm pathway
1 CCS = carbon capture and storage.SOURCE: McKinsey analysis
Shifting the energy mix and pursuing additional carbon abatement in land can be used to close the remaining gap to a 450-ppm pathway
6
10
7
5
66
35
Required emissions for 450-ppmpathway
Additional agriculture and forestry abatement
Shift in power mix plus CCS1
Scale-up of biofuels
1
Energy
~1
CroplandSteel and water
Base-case emissions
Carbon abatement from productivity response
Carbon emissions footprint, 2030Gigatonnes of carbon dioxide equivalent
“CLIMATE RESPONSE” CASE

McKinsey & Company 19|
Climateresponse
1,990–
2,140
Productivityresponse
1,690–
1,730
Supplyexpansion
1,400–
1,440
1,000
Capital investment could increase significantly under all three cases
SOURCE: McKinsey analysis
Average annual capital expenditure requirement, 2010–301
$ billion (2010 dollars)
1 Does not include capital expenditure for base-case productivity improvements; includes impact of capital price spikes due to supply constraints.
2030 cases
2010 capital expenditure
Energy SteelWater Land
445–
475
445–
475
500–
550
350
425–
515
425–
515
555–
675
270
375–
445
365–
435
345–
405
310
2,800–3,070
2,925–3,155
1,930
3,235–3,575
Total
ADDRESS NON-PRICE MARKET FAILURES

McKinsey & Company 20|
Power mix shifts significantly in a climate response case
Share of global power production%; terawatt hours
Climate response
Supply expansion/ productivity response1
1 Same power mix assumed in both the supply expansion and productivity response cases. End demand varies between the two cases—the first number shown on the 100% line refers to supply expansion; the second number to productivity response.
2 RE = Renewables. Other RE include dedicated biomass, geothermal, and marine.
SOURCE: McKinsey analysis
2
3
2030 4332,582/26,617
210
11
12 4150
1
2
14 5 1 3
202027,519/24,593
42 21
3
9
2
72030
2020 24,59312 16 925 27
26,61713
06
6 17151121 1
Coal
CCS
Nuclear HydroWind
Solar Other RE2
Gas Oil
Current state 5 171322
022 02010 40 21,022
100% =
“CLIMATE RESPONSE” CASE
McKinsey & Company 21|
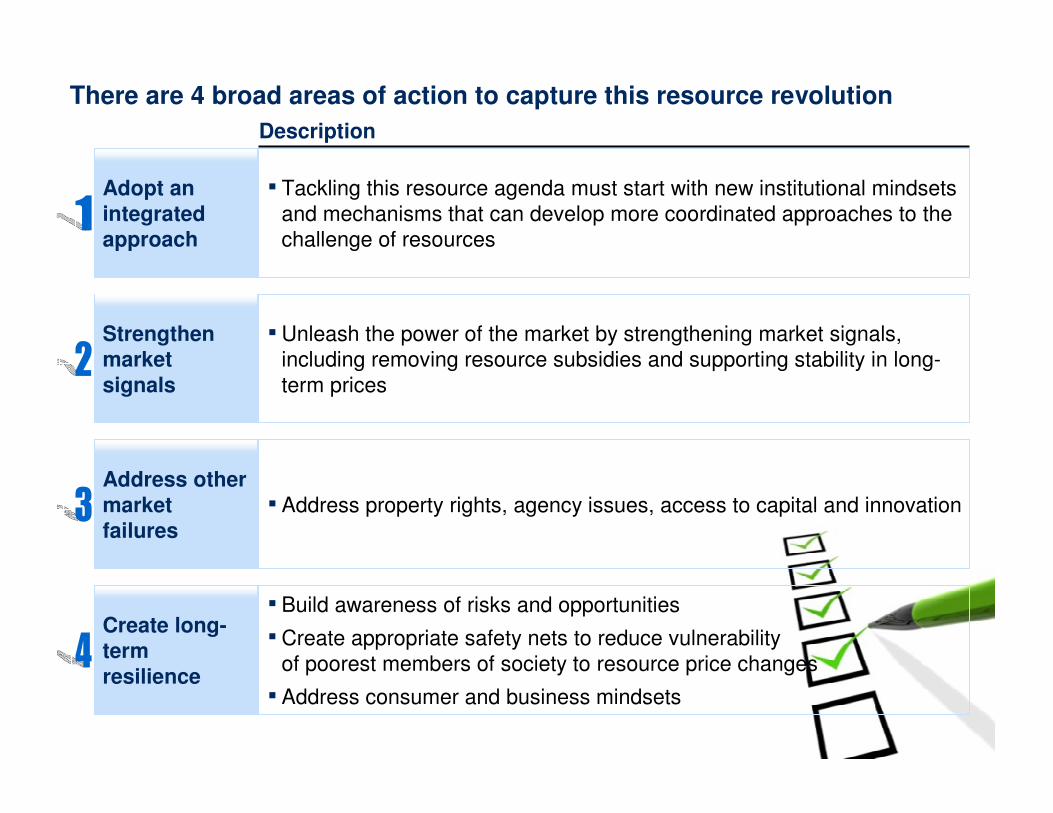
Create long-term resilience
▪ Build awareness of risks and opportunities
▪Create appropriate safety nets to reduce vulnerability of poorest members of society to resource price changes
▪ Address consumer and business mindsets
There are 4 broad areas of action to capture this resource revolution
Description
Adopt an integrated approach
▪ Tackling this resource agenda must start with new institutional mindsets and mechanisms that can develop more coordinated approaches to the challenge of resources
Strengthen market signals
▪Unleash the power of the market by strengthening market signals,including removing resource subsidies and supporting stability in long-term prices
Address other market failures
▪ Address property rights, agency issues, access to capital and innovation

McKinsey & Company 22|
Disruptive trends in three broad categories could shape private-sector competitive dynamics and value creation
Disruptive force
Industry
Illustrative facts
1 CPG = consumer packaged goods.SOURCE: McKinsey analysis
High
Medium
Low
Impact on sector
CPG1 MiningOil and gas
Resource cost-related forces
Regulation-related forces
Resource-related techno-logical forces
Rising volatility and correlation
Rising environmental costs
Rising geopolitical concerns
Public policy push to realize true cost of resources
The new social contract for access to resources
Supply-chain efficiency opportunities
Impact of technology on competitive advantage
More expensive resource input costs
The average cost per oil well doubled from 2000 to 2010
Potential impact on yields of greater than 10 percent in next 20 years
Annual volatility across resources is at its highest level of the past 100 years
>80 percent of available arable land is in countries with infrastructure or political issues
Current subsidies for agriculture, energy, and water total up to $1.1 trillion per year
Maintaining social license to operate is a top-four issue for metals/mining executives
CPG players can reduce energy consumption by 20 to 50 percent on average
Learning curves for renewable power sources range from 10 to 20 percent
Demand for resource-efficient products
Half of shoppers consider green attributes in their purchasing decisions