Embed Size (px)
Citation preview

Resource Analyzer Administrator'sand User's ManualVersion 7 Release 7.08
April 06, 2018

Active Technologies, EDA, EDA/SQL, FIDEL, FOCUS, Information Builders, the Information Builders logo, iWay, iWaySoftware, Parlay, PC/FOCUS, RStat, Table Talk, Web390, WebFOCUS, WebFOCUS Active Technologies, and WebFOCUSMagnify are registered trademarks, and DataMigrator and Hyperstage are trademarks of Information Builders, Inc.
Adobe, the Adobe logo, Acrobat, Adobe Reader, Flash, Adobe Flash Builder, Flex, and PostScript are either registeredtrademarks or trademarks of Adobe Systems Incorporated in the United States and/or other countries.
Due to the nature of this material, this document refers to numerous hardware and software products by theirtrademarks. In most, if not all cases, these designations are claimed as trademarks or registered trademarks by theirrespective companies. It is not this publisher's intent to use any of these names generically. The reader is thereforecautioned to investigate all claimed trademark rights before using any of these names other than to refer to the productdescribed.
Copyright © 2018, by Information Builders, Inc. and iWay Software. All rights reserved. Patent Pending. This manual, orparts thereof, may not be reproduced in any form without the written permission of Information Builders, Inc.

Contents
Preface . . . . . . . . . . . . . . . . . . . . . . . . . . . . . . . . . . . . . . . . . . . . . . . . . . . . . . . . . . . . . . . . . . . . . . . . . 9
Conventions . . . . . . . . . . . . . . . . . . . . . . . . . . . . . . . . . . . . . . . . . . . . . . . . . . . . . . . . . . . . . . . . . . . . . . . . 10
Related Publications . . . . . . . . . . . . . . . . . . . . . . . . . . . . . . . . . . . . . . . . . . . . . . . . . . . . . . . . . . . . . . . . . 11
Customer Support . . . . . . . . . . . . . . . . . . . . . . . . . . . . . . . . . . . . . . . . . . . . . . . . . . . . . . . . . . . . . . . . . . . 11
Information You Should Have . . . . . . . . . . . . . . . . . . . . . . . . . . . . . . . . . . . . . . . . . . . . . . . . . . . . . . . . . .11
User Feedback . . . . . . . . . . . . . . . . . . . . . . . . . . . . . . . . . . . . . . . . . . . . . . . . . . . . . . . . . . . . . . . . . . . . . . 12
iWay Software Training and Professional Services . . . . . . . . . . . . . . . . . . . . . . . . . . . . . . . . . . . . . . . . 13
1. What Is Resource Analyzer? . . . . . . . . . . . . . . . . . . . . . . . . . . . . . . . . . . . . . . . . . . . . . . . . . . 15
Resource Analyzer Overview . . . . . . . . . . . . . . . . . . . . . . . . . . . . . . . . . . . . . . . . . . . . . . . . . . . . . . . . . . .15
Resource Analyzer for Decision Support Analysis . . . . . . . . . . . . . . . . . . . . . . . . . . . . . . . . . . . . . . . . .16
Uses for Resource Analyzer: Performance Analysis . . . . . . . . . . . . . . . . . . . . . . . . . . . . . . . . . . . . . . . 17
Benchmarking and Service Management. . . . . . . . . . . . . . . . . . . . . . . . . . . . . . . . . . . . . . . . . . . 17
Identifying Dormant Data. . . . . . . . . . . . . . . . . . . . . . . . . . . . . . . . . . . . . . . . . . . . . . . . . . . . . . . . .17
Summarization and Pre-Aggregation. . . . . . . . . . . . . . . . . . . . . . . . . . . . . . . . . . . . . . . . . . . . . . . 18
Denormalization. . . . . . . . . . . . . . . . . . . . . . . . . . . . . . . . . . . . . . . . . . . . . . . . . . . . . . . . . . . . . . . . 18
Data Marting. . . . . . . . . . . . . . . . . . . . . . . . . . . . . . . . . . . . . . . . . . . . . . . . . . . . . . . . . . . . . . . . . . . 18
Change Impact: Effects of Application Revision. . . . . . . . . . . . . . . . . . . . . . . . . . . . . . . . . . . . . .19
Quantifying Return on Investments. . . . . . . . . . . . . . . . . . . . . . . . . . . . . . . . . . . . . . . . . . . . . . . . 19
Usage-Based Billing and Performance. . . . . . . . . . . . . . . . . . . . . . . . . . . . . . . . . . . . . . . . . . . . . .19
End-User Education. . . . . . . . . . . . . . . . . . . . . . . . . . . . . . . . . . . . . . . . . . . . . . . . . . . . . . . . . . . . . 19
Re-Hosting. . . . . . . . . . . . . . . . . . . . . . . . . . . . . . . . . . . . . . . . . . . . . . . . . . . . . . . . . . . . . . . . . . . . . 19
Introduction to Data Access and Performance Analysis With Resource Analyzer . . . . . . . . . . . . . . .20
Data Access Management. . . . . . . . . . . . . . . . . . . . . . . . . . . . . . . . . . . . . . . . . . . . . . . . . . . . . . . 20
Overview of Data Access Concepts. . . . . . . . . . . . . . . . . . . . . . . . . . . . . . . . . . . . . . . . . . . . . . . . 20
Usage Information. . . . . . . . . . . . . . . . . . . . . . . . . . . . . . . . . . . . . . . . . . . . . . . . . . . . . . . . . 20
Sample Data Access Questions . . . . . . . . . . . . . . . . . . . . . . . . . . . . . . . . . . . . . . . . . . . . . . . . . . . . . . . 21
How Resource Analyzer Works . . . . . . . . . . . . . . . . . . . . . . . . . . . . . . . . . . . . . . . . . . . . . . . . . . . . . . . . .23
Software Prerequisites . . . . . . . . . . . . . . . . . . . . . . . . . . . . . . . . . . . . . . . . . . . . . . . . . . . . . . . . . . . . . . . 24
Overview: Resource Analyzer Software Components. . . . . . . . . . . . . . . . . . . . . . . . . . . . . . . . . .24
Overview of the Web Console . . . . . . . . . . . . . . . . . . . . . . . . . . . . . . . . . . . . . . . . . . . . . . . . . . . . . . . . . 24
Overview of Resource Analyzer Administration. . . . . . . . . . . . . . . . . . . . . . . . . . . . . . . . . . . . . . .24
Overview of Reporting With Resource Analyzer . . . . . . . . . . . . . . . . . . . . . . . . . . . . . . . . . . . . . . . . . . . 25
Resource Analyzer Administrator's and User's Manual 3

Integrating Resource Analyzer With WebFOCUS, Managed Reporting, and ReportCaster . . . . . . . .28
2. Configuring and Administering Resource Management . . . . . . . . . . . . . . . . . . . . . . . . . .29
Resource Management Interface . . . . . . . . . . . . . . . . . . . . . . . . . . . . . . . . . . . . . . . . . . . . . . . . . . . . . . 29
Ribbon. . . . . . . . . . . . . . . . . . . . . . . . . . . . . . . . . . . . . . . . . . . . . . . . . . . . . . . . . . . . . . . . . . . . . . . . 30
Sidebar. . . . . . . . . . . . . . . . . . . . . . . . . . . . . . . . . . . . . . . . . . . . . . . . . . . . . . . . . . . . . . . . . . . . . . . .30
Configuring Resource Management . . . . . . . . . . . . . . . . . . . . . . . . . . . . . . . . . . . . . . . . . . . . . . . . . . . . 30
Configuring Many-to-One Monitoring. . . . . . . . . . . . . . . . . . . . . . . . . . . . . . . . . . . . . . . . . . . . . . . 38
Configuring Resource Analyzer. . . . . . . . . . . . . . . . . . . . . . . . . . . . . . . . . . . . . . . . . . . . . . . 38
Administering Resource Management From the Web Console . . . . . . . . . . . . . . . . . . . . . . . . . . . . . . 39
Resource Management Configuration Maintenance. . . . . . . . . . . . . . . . . . . . . . . . . . . . . . . . . . 41
Enabling or Disabling Monitoring. . . . . . . . . . . . . . . . . . . . . . . . . . . . . . . . . . . . . . . . . . . . . 42
Logging. . . . . . . . . . . . . . . . . . . . . . . . . . . . . . . . . . . . . . . . . . . . . . . . . . . . . . . . . . . . . . . . . . 42
Archive Log Files. . . . . . . . . . . . . . . . . . . . . . . . . . . . . . . . . . . . . . . . . . . . . . . . . . . . . . . . . . .45
List Unarchived Log Files. . . . . . . . . . . . . . . . . . . . . . . . . . . . . . . . . . . . . . . . . . . . . . . . . . . 53
Working With Repository Maintenance. . . . . . . . . . . . . . . . . . . . . . . . . . . . . . . . . . . . . . . . 54
Reconfiguring the Repository. . . . . . . . . . . . . . . . . . . . . . . . . . . . . . . . . . . . . . . . . . . . . . . . 64
Migration. . . . . . . . . . . . . . . . . . . . . . . . . . . . . . . . . . . . . . . . . . . . . . . . . . . . . . . . . . . . . . . . . 69
Configuration Maintenance. . . . . . . . . . . . . . . . . . . . . . . . . . . . . . . . . . . . . . . . . . . . . . . . . .70
Resource Management Properties. . . . . . . . . . . . . . . . . . . . . . . . . . . . . . . . . . . . . . 70
Configuring Application Paths. . . . . . . . . . . . . . . . . . . . . . . . . . . . . . . . . . . . . . . . . . 80
Migrating Resource Management. . . . . . . . . . . . . . . . . . . . . . . . . . . . . . . . . . . . . . . 81
Working With License Keys. . . . . . . . . . . . . . . . . . . . . . . . . . . . . . . . . . . . . . . . . . . . 81
Removing Resource Management. . . . . . . . . . . . . . . . . . . . . . . . . . . . . . . . . . . . . . .81
Working With Application Directories. . . . . . . . . . . . . . . . . . . . . . . . . . . . . . . . . . . . . . . . . . . . . . .82
Monitoring at the Application Level. . . . . . . . . . . . . . . . . . . . . . . . . . . . . . . . . . . . . . . . . . . 82
Monitoring Individual Data Sources. . . . . . . . . . . . . . . . . . . . . . . . . . . . . . . . . . . . . . . . . . .85
Monitoring Relational Adapters. . . . . . . . . . . . . . . . . . . . . . . . . . . . . . . . . . . . . . . . . . . . . . . . . . . 89
Relational Adapter Properties. . . . . . . . . . . . . . . . . . . . . . . . . . . . . . . . . . . . . . . . . . . . . . . .89
Monitoring Relational Data Adapter Sources. . . . . . . . . . . . . . . . . . . . . . . . . . . . . . . . . . . 91
Monitoring at the Data Service Level. . . . . . . . . . . . . . . . . . . . . . . . . . . . . . . . . . . . . . . . . . . . . . .96
Migrating the Resource Management Repository . . . . . . . . . . . . . . . . . . . . . . . . . . . . . . . . . . . . . . . . . 98
Requirements for Migrating the Resource Management Repository. . . . . . . . . . . . . . . . . . . . .98
Contents
4 Information Builders

Migrating a Resource Management Repository for a New Server Install. . . . . . . . . . . . . . . . . 98
Migrating a Resource Management Repository After a Server Refresh. . . . . . . . . . . . . . . . . 103
Migrating a Resource Management Repository on MVS. . . . . . . . . . . . . . . . . . . . . . . . . . . . . 107
Event Routing . . . . . . . . . . . . . . . . . . . . . . . . . . . . . . . . . . . . . . . . . . . . . . . . . . . . . . . . . . . . . . . . . . . . . .110
3. Resource Analyzer Report Options . . . . . . . . . . . . . . . . . . . . . . . . . . . . . . . . . . . . . . . . . . . 111
Reports Overview . . . . . . . . . . . . . . . . . . . . . . . . . . . . . . . . . . . . . . . . . . . . . . . . . . . . . . . . . . . . . . . . . . .111
Resource Analyzer Reporting . . . . . . . . . . . . . . . . . . . . . . . . . . . . . . . . . . . . . . . . . . . . . . . . . . . . . . . . . 112
Resource Analyzer Report Options . . . . . . . . . . . . . . . . . . . . . . . . . . . . . . . . . . . . . . . . . . . . . . . . . . . . 114
Report Filters. . . . . . . . . . . . . . . . . . . . . . . . . . . . . . . . . . . . . . . . . . . . . . . . . . . . . . . . . . . . . . . . . 114
Online Help. . . . . . . . . . . . . . . . . . . . . . . . . . . . . . . . . . . . . . . . . . . . . . . . . . . . . . . . . . . . . . . . . . . 118
Drilling Down With Reports. . . . . . . . . . . . . . . . . . . . . . . . . . . . . . . . . . . . . . . . . . . . . . . . . . . . . . 119
Monitor Preference and Reports. . . . . . . . . . . . . . . . . . . . . . . . . . . . . . . . . . . . . . . . . . . . . . . . . 119
Alternate Reporting Output. . . . . . . . . . . . . . . . . . . . . . . . . . . . . . . . . . . . . . . . . . . . . . . . . . . . . . 119
General Reports . . . . . . . . . . . . . . . . . . . . . . . . . . . . . . . . . . . . . . . . . . . . . . . . . . . . . . . . . . . . . . . . . . . .120
Monitored Sessions. . . . . . . . . . . . . . . . . . . . . . . . . . . . . . . . . . . . . . . . . . . . . . . . . . . . . . . . . . . .120
Monitored Commands. . . . . . . . . . . . . . . . . . . . . . . . . . . . . . . . . . . . . . . . . . . . . . . . . . . . . . . . . . 121
Repository Statistics. . . . . . . . . . . . . . . . . . . . . . . . . . . . . . . . . . . . . . . . . . . . . . . . . . . . . . . . . . . 121
Data Sources Never Used. . . . . . . . . . . . . . . . . . . . . . . . . . . . . . . . . . . . . . . . . . . . . . . . . . . . . . .122
Procedures Never Used. . . . . . . . . . . . . . . . . . . . . . . . . . . . . . . . . . . . . . . . . . . . . . . . . . . . . . . . .122
Resource Analyzer Reports . . . . . . . . . . . . . . . . . . . . . . . . . . . . . . . . . . . . . . . . . . . . . . . . . . . . . . . . . . 123
Usage Analysis Reports. . . . . . . . . . . . . . . . . . . . . . . . . . . . . . . . . . . . . . . . . . . . . . . . . . . . . . . . 123
Usage Analysis Categories. . . . . . . . . . . . . . . . . . . . . . . . . . . . . . . . . . . . . . . . . . . . . . . . .124
Types of Usage Analysis. . . . . . . . . . . . . . . . . . . . . . . . . . . . . . . . . . . . . . . . . . . . . . . . . . .125
Users Reports. . . . . . . . . . . . . . . . . . . . . . . . . . . . . . . . . . . . . . . . . . . . . . . . . . . . . . . . . . . 125
Users Report by Frequency of Use. . . . . . . . . . . . . . . . . . . . . . . . . . . . . . . . . . . . . 126
Users Report by Resources Used. . . . . . . . . . . . . . . . . . . . . . . . . . . . . . . . . . . . . . 127
Users Report by Historical Use. . . . . . . . . . . . . . . . . . . . . . . . . . . . . . . . . . . . . . . . 128
Users Report by Top N. . . . . . . . . . . . . . . . . . . . . . . . . . . . . . . . . . . . . . . . . . . . . . . 129
Procedures Reports. . . . . . . . . . . . . . . . . . . . . . . . . . . . . . . . . . . . . . . . . . . . . . . . . . . . . . .129
Procedures Report by Frequency of Use. . . . . . . . . . . . . . . . . . . . . . . . . . . . . . . . 130
Procedures Report by Resources Used. . . . . . . . . . . . . . . . . . . . . . . . . . . . . . . . . 131
Procedures Report by Historical Use. . . . . . . . . . . . . . . . . . . . . . . . . . . . . . . . . . . 132
Contents
Resource Analyzer Administrator's and User's Manual 5

Procedures Report by Top N. . . . . . . . . . . . . . . . . . . . . . . . . . . . . . . . . . . . . . . . . . 133
Data Sources Reports. . . . . . . . . . . . . . . . . . . . . . . . . . . . . . . . . . . . . . . . . . . . . . . . . . . . .133
Data Sources Report by Frequency of Use. . . . . . . . . . . . . . . . . . . . . . . . . . . . . . 134
Data Sources Report by Resources Used. . . . . . . . . . . . . . . . . . . . . . . . . . . . . . . 135
Data Sources Report by Historical Use. . . . . . . . . . . . . . . . . . . . . . . . . . . . . . . . . 137
Data Sources Report by Top N. . . . . . . . . . . . . . . . . . . . . . . . . . . . . . . . . . . . . . . . 139
Exception Analysis Report. . . . . . . . . . . . . . . . . . . . . . . . . . . . . . . . . . . . . . . . . . . . . . . . . . . . . . .139
Errors and Messages. . . . . . . . . . . . . . . . . . . . . . . . . . . . . . . . . . . . . . . . . . . . . . . . . . . . . 139
Procedure with Errors. . . . . . . . . . . . . . . . . . . . . . . . . . . . . . . . . . . . . . . . . . . . . . . . . . . . . 140
Domain Analysis Report. . . . . . . . . . . . . . . . . . . . . . . . . . . . . . . . . . . . . . . . . . . . . . . . . . . . . . . . 141
Domain Usage Report. . . . . . . . . . . . . . . . . . . . . . . . . . . . . . . . . . . . . . . . . . . . . . . . . . . . . 142
Impact Analysis Report. . . . . . . . . . . . . . . . . . . . . . . . . . . . . . . . . . . . . . . . . . . . . . . . . . . . . . . . . 142
Change Impact for Column Report. . . . . . . . . . . . . . . . . . . . . . . . . . . . . . . . . . . . . . . . . . 143
Performance Analysis Reports. . . . . . . . . . . . . . . . . . . . . . . . . . . . . . . . . . . . . . . . . . . . . . . . . . . 145
Procedure Benchmarks Report. . . . . . . . . . . . . . . . . . . . . . . . . . . . . . . . . . . . . . . . . . . . . 146
Excessive Resources Report. . . . . . . . . . . . . . . . . . . . . . . . . . . . . . . . . . . . . . . . . . . . . . . 147
Long-running Requests Report. . . . . . . . . . . . . . . . . . . . . . . . . . . . . . . . . . . . . . . . . . . . . .148
Large Volume Requests Report. . . . . . . . . . . . . . . . . . . . . . . . . . . . . . . . . . . . . . . . . . . . . 149
Dormant Data Report. . . . . . . . . . . . . . . . . . . . . . . . . . . . . . . . . . . . . . . . . . . . . . . . . . . . . 149
Excessive Joins Report. . . . . . . . . . . . . . . . . . . . . . . . . . . . . . . . . . . . . . . . . . . . . . . . . . . . 151
Repeated Aggregations Report. . . . . . . . . . . . . . . . . . . . . . . . . . . . . . . . . . . . . . . . . . . . . 152
Candidates for Column Index Report. . . . . . . . . . . . . . . . . . . . . . . . . . . . . . . . . . . . . . . . 153
Optimization. . . . . . . . . . . . . . . . . . . . . . . . . . . . . . . . . . . . . . . . . . . . . . . . . . . . . . . . . . . . . 154
Network Analysis Reports. . . . . . . . . . . . . . . . . . . . . . . . . . . . . . . . . . . . . . . . . . . . . . . . . . . . . . . 155
Bandwidth by Procedure Report. . . . . . . . . . . . . . . . . . . . . . . . . . . . . . . . . . . . . . . . . . . . .156
Resources by Connection. . . . . . . . . . . . . . . . . . . . . . . . . . . . . . . . . . . . . . . . . . . . . . . . . .156
Graph Reports. . . . . . . . . . . . . . . . . . . . . . . . . . . . . . . . . . . . . . . . . . . . . . . . . . . . . . . . . . . . . . . . .157
Cumulative Hourly Use and Peak Transaction/Resource Periods Reports. . . . . . . . . 158
Query Volume vs. Resource Utilization Report. . . . . . . . . . . . . . . . . . . . . . . . . . . . . . . . 158
4. Getting Help . . . . . . . . . . . . . . . . . . . . . . . . . . . . . . . . . . . . . . . . . . . . . . . . . . . . . . . . . . . . . . . . 161
Resource Management Administration Help . . . . . . . . . . . . . . . . . . . . . . . . . . . . . . . . . . . . . . . . . . . . 161
Web Console Help. . . . . . . . . . . . . . . . . . . . . . . . . . . . . . . . . . . . . . . . . . . . . . . . . . . . . . . . . . . . . 161
Contents
6 Information Builders

Reporting Application Context-Sensitive Help From Reports . . . . . . . . . . . . . . . . . . . . . . . . . . . . . . .163
A. Administrative Usage Monitoring Tables Column Descriptions . . . . . . . . . . . . . . . . . 165
Usage Monitoring Table (RMLDB.MAS) . . . . . . . . . . . . . . . . . . . . . . . . . . . . . . . . . . . . . . . . . . . . . . . . 165
SMSERVERS Segment. . . . . . . . . . . . . . . . . . . . . . . . . . . . . . . . . . . . . . . . . . . . . . . . . . . . . . . . . .165
SMSESS Segment. . . . . . . . . . . . . . . . . . . . . . . . . . . . . . . . . . . . . . . . . . . . . . . . . . . . . . . . . . . . . 166
SMRPCS Segment. . . . . . . . . . . . . . . . . . . . . . . . . . . . . . . . . . . . . . . . . . . . . . . . . . . . . . . . . . . . . 170
SMRPCCMD Segment. . . . . . . . . . . . . . . . . . . . . . . . . . . . . . . . . . . . . . . . . . . . . . . . . . . . . . . . . . 172
SMRPCWF Segment. . . . . . . . . . . . . . . . . . . . . . . . . . . . . . . . . . . . . . . . . . . . . . . . . . . . . . . . . . . .172
SMQUERY Segment. . . . . . . . . . . . . . . . . . . . . . . . . . . . . . . . . . . . . . . . . . . . . . . . . . . . . . . . . . . . 173
SMCMDLN Segment. . . . . . . . . . . . . . . . . . . . . . . . . . . . . . . . . . . . . . . . . . . . . . . . . . . . . . . . . . . 177
SMGOVEND Segment. . . . . . . . . . . . . . . . . . . . . . . . . . . . . . . . . . . . . . . . . . . . . . . . . . . . . . . . . . 178
SMRMTS Segment. . . . . . . . . . . . . . . . . . . . . . . . . . . . . . . . . . . . . . . . . . . . . . . . . . . . . . . . . . . . .179
SMFNCTNS Segment. . . . . . . . . . . . . . . . . . . . . . . . . . . . . . . . . . . . . . . . . . . . . . . . . . . . . . . . . . . 180
SMRELTNS Segment. . . . . . . . . . . . . . . . . . . . . . . . . . . . . . . . . . . . . . . . . . . . . . . . . . . . . . . . . . . 181
SMFROMS Segment. . . . . . . . . . . . . . . . . . . . . . . . . . . . . . . . . . . . . . . . . . . . . . . . . . . . . . . . . . . 182
SMCOLMNS Segment. . . . . . . . . . . . . . . . . . . . . . . . . . . . . . . . . . . . . . . . . . . . . . . . . . . . . . . . . . 183
SMAUDIT Segment. . . . . . . . . . . . . . . . . . . . . . . . . . . . . . . . . . . . . . . . . . . . . . . . . . . . . . . . . . . . .184
Usage Monitoring RDBMS Table Sizing . . . . . . . . . . . . . . . . . . . . . . . . . . . . . . . . . . . . . . . . . . . . . . . . 185
B. Time Fields in Resource Management . . . . . . . . . . . . . . . . . . . . . . . . . . . . . . . . . . . . . . . . 189
Time Field Definitions . . . . . . . . . . . . . . . . . . . . . . . . . . . . . . . . . . . . . . . . . . . . . . . . . . . . . . . . . . . . . . . 189
C. Using DDL Statements to Create the Internal Tables . . . . . . . . . . . . . . . . . . . . . . . . . . 195
Overview of Creating the Resource Analyzer and Resource Governor Internal Tables . . . . . . . . . 195
Contents
Resource Analyzer Administrator's and User's Manual 7

Contents
8 Information Builders

Preface
This content describes how to administer Resource Analyzer. It provides instructions forconfiguring the Resource Analyzer Usage Monitoring facility, and explains how to deleteextraneous data from the Resource Analyzer Usage Monitoring and administrative databases.It also provides a description of the various Resource Analyzer reports and how to accessthem. It is intended for the DBA, systems administrator, data warehouse designer, or anyoneelse who needs to monitor request, user, and resource activity.
How This Manual Is Organized
This manual includes the following chapters:
Chapter/Appendix Contents
1 What Is Resource Analyzer? Introduces Resource Analyzer and describes itsability to analyze site activity and contribute toperformance analysis. Provides an introduction toResource Analyzer Usage Monitoring and reportingfeatures.
2 Configuring andAdministering ResourceManagement
Describes how to configure and administerResource Management from the Web Console.
3 Resource Analyzer ReportOptions
Describes the different categories of ResourceAnalyzer reports, the individual reports within thesecategories, and the process for displaying reports.
4 Getting Help Describes Resource Analyzer online help anddocumentation options.
A Administrative UsageMonitoring Tables ColumnDescriptions
Summarizes the fields in the Resource Analyzeradministrative (system) and Usage Monitoringdatabases.
B Time Fields in ResourceManagement
Describes the time fields in the specifiedsynonyms.
C Using DDL Statements toCreate the Internal Tables
Explains how to use DDL statements to create theResource Analyzer and Resource Governor internaltables.
Resource Analyzer Administrator's and User's Manual 9

Conventions
The following table describes the conventions that are used in this manual.
Convention Description
THIS TYPEFACE
or
this typeface
Denotes syntax that you must enter exactly as shown.
this typeface Represents a placeholder (or variable) in syntax for a value thatyou or the system must supply.
underscore Indicates a default setting.
this typeface Represents a placeholder (or variable), a cross-reference, or animportant term. It may also indicate a button, menu item, ordialog box option that you can click or select.
Key + Key Indicates keys that you must press simultaneously.
{ } Indicates two or three choices. Type one of them, not the braces.
[ ] Indicates a group of optional parameters. None are required, butyou may select one of them. Type only the parameter in thebrackets, not the brackets.
| Separates mutually exclusive choices in syntax. Type one of them,not the symbol.
... Indicates that you can enter a parameter multiple times. Type onlythe parameter, not the ellipsis (...).
.
.
.
Indicates that there are (or could be) intervening or additionalcommands.
Conventions
10 Information Builders

Related Publications
Visit our Technical Content Library at http://documentation.informationbuilders.com. You canalso contact the Publications Order Department at (800) 969-4636.
Customer Support
Do you have any questions about this product?
Join the Focal Point community. Focal Point is our online developer center and more than amessage board. It is an interactive network of more than 3,000 developers from almost everyprofession and industry, collaborating on solutions and sharing tips and techniques. AccessFocal Point at http://forums.informationbuilders.com/eve/forums.
You can also access support services electronically, 24 hours a day, with InfoResponseOnline. InfoResponse Online is accessible through our website, http://www.informationbuilders.com. It connects you to the tracking system and known-problemdatabase at the Information Builders support center. Registered users can open, update, andview the status of cases in the tracking system and read descriptions of reported softwareissues. New users can register immediately for this service. The technical support section ofwww.informationbuilders.com also provides usage techniques, diagnostic tips, and answers tofrequently asked questions.
Call Information Builders Customer Support Services (CSS) at (800) 736-6130 or (212)736-6130. Customer Support Consultants are available Monday through Friday between 8:00a.m. and 8:00 p.m. EST to address all your questions. Information Builders consultants canalso give you general guidance regarding product capabilities. Please be ready to provide yoursix-digit site code number (xxxx.xx) when you call.
To learn about the full range of available support services, ask your Information Buildersrepresentative about InfoResponse Online, or call (800) 969-INFO.
Information You Should Have
To help our consultants answer your questions most effectively, be ready to provide thefollowing information when you call:
Your six-digit site code (xxxx.xx).
Your iWay Software configuration:
The iWay Software version and release. You can find your server version and releaseusing the Version option in the Web Console.
Note: The MVS and VM servers do not use the Web Console.
Preface
Resource Analyzer Administrator's and User's Manual 11

The communications protocol (for example, TCP/IP or LU6.2), including vendor andrelease.
The stored procedure (preferably with line numbers) or SQL statements being used inserver access.
The database server release level.
The database name and release level.
The Master File and Access File.
The exact nature of the problem:
Are the results or the format incorrect? Are the text or calculations missing ormisplaced?
Provide the error message and return code, if applicable.
Is this related to any other problem?
Has the procedure or query ever worked in its present form? Has it been changed recently?How often does the problem occur?
What release of the operating system are you using? Has it, your security system,communications protocol, or front-end software changed?
Is this problem reproducible? If so, how?
Have you tried to reproduce your problem in the simplest form possible? For example, if youare having problems joining two data sources, have you tried executing a query containingjust the code to access the data source?
Do you have a trace file?
How is the problem affecting your business? Is it halting development or production? Doyou just have questions about functionality or documentation?
User Feedback
In an effort to produce effective documentation, the Technical Content Management staffwelcomes your opinions regarding this document. You can contact us through our website, http://documentation.informationbuilders.com/connections.asp.
Thank you, in advance, for your comments.
User Feedback
12 Information Builders

iWay Software Training and Professional Services
Interested in training? Our Education Department offers a wide variety of training courses foriWay Software and other Information Builders products.
For information on course descriptions, locations, and dates, or to register for classes, visitour website (http://education.informationbuilders.com) or call (800) 969-INFO to speak to anEducation Representative.
Interested in technical assistance for your implementation? Our Professional Servicesdepartment provides expert design, systems architecture, implementation, and projectmanagement services for all your business integration projects. For information, visit ourwebsite (http://www.informationbuilders.com/support).
Preface
Resource Analyzer Administrator's and User's Manual 13

iWay Software Training and Professional Services
14 Information Builders

Chapter1What Is Resource Analyzer?
Resource Analyzer provides Information Systems (IS) organizations with the ability tomanage the growing volume and unpredictable nature of ad hoc data access. Togetherwith its partner product Resource Governor, Resource Analyzer is designed specifically tohelp IS organizations analyze and control end-user data access.
Resource Analyzer is accessed through the Web Console.
In this chapter:
Resource Analyzer Overview
Resource Analyzer for Decision Support Analysis
Uses for Resource Analyzer: Performance Analysis
Introduction to Data Access and Performance Analysis With Resource Analyzer
Sample Data Access Questions
How Resource Analyzer Works
Software Prerequisites
Overview of the Web Console
Overview of Reporting With Resource Analyzer
Integrating Resource Analyzer With WebFOCUS, Managed Reporting, and ReportCaster
Resource Analyzer Overview
Since the Internet is now the medium of choice for disseminating enterprise informationthroughout many corporations, user and usage data is critical. This environment exposessystems to more access to more data by more users, placing increased stress on datawarehouses, self-service applications, and corporate communications applications. As a result,tuning applications for high performance, high availability, and fast response times is crucial.
Resource Analyzer Administrator's and User's Manual 15

Web access also causes the user base to grow exponentially, triggering a need to mapchanging usage patterns. Web administrators need information about who is accessing whatdata and when, through which applications, and how frequently, as well as information aboutthe concurrency of user access. Resource Analyzer can help answer these questions andothers by letting administrators analyze the performance of any WebFOCUS or iWay-enabledapplication. In addition to web administrators, WebFOCUS developers, DBAs, and performanceanalysts will find Resource Analyzer crucial to decision-support analysis at their sites.
Resource Analyzer monitors data usage activity by collecting the attributes of requests andstoring them in a set of Usage Monitoring tables. It automatically keeps track of each request,which data sources and columns it accessed, when it was run, how long it took, whichresources it consumed, and more. Resource Analyzer allows you to report on, graph, andanalyze end-user request traffic.
Resource Analyzer for Decision Support Analysis
Web administrators, DBAs, and application developers require a variety of information todetermine how to optimize reporting environments. Resource Analyzer offers decision supportanalysis, which helps administrators decide how to organize their sites by supplying usefulinformation about the following types of issues:
Monitoring and managing the impact of web-based reporting on Online TransactionProcessing (OLTP) operational systems.
Balancing decision support systems (DSS) reporting with OLTP workload to allow the two tocoexist and to ward off threats posed by reporting on OLTP data.
Determining if data-access design meets the needs of users.
Removing resource-consuming data that is never used (dormant data).
Determining the best times to schedule maintenance, backups, data-warehouseextractions, and batch processes.
Determining an allowable amount of downtime.
Deciding how fast users must be able to recover from software failure or disk drivecrashes.
Discovering performance "hot spots" that must be targeted for correction before theybecome major problems.
Analyzing how mixed workloads pattern themselves and change over time (trend analysis).
Determining how to educate the user community on efficient request writing, overnightbatch processing, report bursting, and other areas, in order to avoid performance problems.
Resource Analyzer for Decision Support Analysis
16 Information Builders

Deciding how the organization can quantify return on investments for new data-warehouseand intranet data-dissemination initiatives and justifying these expenses to management.
Uncovering the revenue-generating potential in web-based data. This information can thenbe sold to partners, customers, or external market researchers.
Considering if and when the enterprise should decide to charge back the users of data.
These issues are discussed in greater detail throughout this chapter.
Uses for Resource Analyzer: Performance Analysis
There are a number of areas of application development and site maintenance for whichResource Analyzer can be useful. This section describes some of these areas, which all fallunder the category of performance analysis. Resource Analyzer has several reports that arespecifically geared toward these performance analysis issues. For more information see Performance Analysis Reports on page 145.
Benchmarking and Service Management
Most organizations do not consider the performance of the request environment until it hasalready begun to deteriorate. By this time, the data source design is complete and theprograms are in production. Companies must then implement service management, or ServiceLevel Agreements (SLAs), to manage the high-performance production environment at anappropriate, justifiable cost.
The application developer can use data in Resource Analyzer reports and graphs to evaluateconditions in test environments before the investment is made on a viable productionenvironment, and also later to determine if SLAs are being implemented effectively.
Identifying Dormant Data
As Internet/intranet, OLTP, and data-warehouse systems grow, large volumes of unused (ordormant) data accumulate, making the process of searching for more critical data lessefficient. There are two categories of dormant data that Resource Analyzer identifies:
Entire data sources that are never accessed.
Dormant columns in particular tables.
Resource Analyzer lets you examine the use of data selections and relations in requests atyour site to determine what data is largely bypassed by the request activity of your site. Thisdata can then be deleted or archived to allow for better performance.
1. What Is Resource Analyzer?
Resource Analyzer Administrator's and User's Manual 17

Summarization and Pre-Aggregation
When reports are run multiple times, column totals and averages are calculated repeatedly. Itis much more efficient, and less costly, to calculate column values once and store the resultsin summary tables for repeated use. This technique is known as pre-aggregation orsummarization. Resource Analyzer reports can show you which data is most frequentlysummarized, providing valuable information for building summarization tables.
Denormalization
Although traditional theories about data-source design encourage normalization to maintainreferential integrity, denormalization can be efficient and resource-cutting when planned andimplemented judiciously. On the one hand, denormalization can increase expenses forupdating data as well as increase the amount of redundant data, thus leading to increaseddisk usage. Nevertheless, with denormalized data sources, you may cut CPU time by 40-50%and see 25-30% faster response times. Resource Analyzer offers join reports, which supplyinformation on which you can base your denormalizing strategies.
Data Marting
Individual departments often need to analyze only a subset of the data found in OLTPapplication systems and data warehouses. For these purposes, data marts offer bettercustomization and control than dealing with the entire system. Moving data into a data mart ona departmental machine can reduce processing and storage costs, as well as allow you greatercontrol over several areas of data-source design and maintenance, for example:
Limiting the amount of historical/legacy data funneled into the data mart.
Restructuring keys and indexes of the original data as it is copied to the data mart.
Re-sequencing, editing, and converting the data.
Remapping the names of columns.
Summarizing the data.
Merging the data with department data found only in that particular line of business.
Rolling up the data with respect to time intervals.
Resource Analyzer lets you focus in on which data, data sources, and columns are most usedby particular departments to determine the most effective strategies for designing your datamarts.
Uses for Resource Analyzer: Performance Analysis
18 Information Builders

Change Impact: Effects of Application Revision
Think how useful it would be to be able to project how proposed changes will affect the activityof your site. Resource Analyzer helps you assess how end users and applications will beaffected by data source schema change. Resource Analyzer reports help you identify every userof a data source and column, and pinpoint every field accessed by requests in order to judgethe overall impact of impending changes.
Quantifying Return on Investments
Resource Analyzer contributes to capacity planning by helping you determine who "visits" datasources and which applications are most mission-critical to your user community. Thequantifiable data supplied by Resource Analyzer justifies the expenses of data warehouses,Internet applications, new release software, and hardware upgrades.
Usage-Based Billing and Performance
Information analysis has become a commodity that can be sold to business partners, vendors,customers, and external resellers. Resource Analyzer Usage Monitoring functionality lets youtrack who is accessing your data sources in order to implement usage-based billing and user-chargeback systems.
End-User Education
Educating the end-user community about request preparation is crucial to improving systemperformance. Resource Analyzer Usage Monitoring capabilities let you track what users aredoing wrong so you can best determine what areas they need to be informed about and trainedin. Resource Analyzer can also help you implement a chargeback system at your site to informindividual users about their resource consumption and encourage them to improve theirtechniques.
Re-Hosting
When you are considering downsizing and right-sizing, it is crucial that you understand whatdata is used, how it is used, and who uses it at what times. The usage details supplied byResource Analyzer identify the least active data sources, those with the smallest audiences,the least active and most seldom-used fields, and a variety of other information to help youdevelop a clear road map for data migration.
1. What Is Resource Analyzer?
Resource Analyzer Administrator's and User's Manual 19

Introduction to Data Access and Performance Analysis With Resource Analyzer
Resource Analyzer gives you a very thorough understanding of data access at your site. Thissection discusses some of the ways you can use Resource Analyzer to understand and analyzethe data access patterns and issues of your organization.
Data Access Management
As a data access management and performance analysis tool, Resource Analyzer helps youmake knowledgeable decisions about managing access to corporate and departmental data.These decisions typically require balancing system performance and capacity (for example,CPU cycles and disk space availability) with the demands of ad hoc access to information fordecision-making. By using the information provided by Resource Analyzer, IS organizationshave significantly improved their system performance, enabled faster data access for endusers, and finely tuned the informational content of their data sources.
Overview of Data Access Concepts
Resource Analyzer specifically provides detailed information about the following four major dataaccess variables:
Request usage
Data usage
Resource usage
Usage over time
Usage Information
Resource Analyzer request usage information helps you identify the following:
Who is using the requests?
Which requests are being run?
When are requests being run?
Where are requests getting data?
How are requests using data (that is, detail or aggregation, extract file or report, online oroffline)?
Introduction to Data Access and Performance Analysis With Resource Analyzer
20 Information Builders
Resource Analyzer data usage information enables you to learn the following:
What is the most and least popular data being accessed?
What columns are potential index candidates?
Who is accessing the data?
What data is being accessed?
What data is not being accessed?
When is the data being accessed?
How is the data being used?
Resource Analyzer resource usage information lets you know the following:
Who are the high-resource users?
Which requests use the most resources?
When are the peak resource usage time periods?
How can you reduce system resource utilization?
Resource Analyzer usage over time information helps you confirm the following:
Who is running requests during peak periods?
Which requests are running during peak periods?
When are the best times to offload high resource requests?
How do you better balance resource usage for improved performance and response time?
How does request volume relate to resource usage over time?
How has usage changed over time?
Sample Data Access Questions
Before you begin analyzing the access activity of your site, you should review the followingsample data access questions, which can be answered using Resource Analyzer. Followingeach question are a few of the important decisions you can make based on ResourceAnalyzer's answers. You will see that getting answers to even fairly simple questions can helpyou reduce system usage costs, improve query performance, reduce your administrativeefforts, increase IS service levels to end users, and improve effective use of information byend users.
1. What Is Resource Analyzer?
Resource Analyzer Administrator's and User's Manual 21

Question: Who is running requests?
All service organizations can benefit by initially confirming who their users or customers are.
Question: What are the implications of request results being stored? For example, how muchreport writing is done from screen display, or how much output is to files, spreadsheets, orsaved data sources?
Reports that users produce on a regular basis can be scheduled and automatically distributed.Knowing how much output goes to extract or flat files provides estimates on temporary diskspace requirements. Data placed in spreadsheets or saved data sources may prove useful toothers.
Question: Which requests run the longest?
Long-running requests are typically good candidates for performance-tuning improvements. Thereorganization of logic or even the simple addition of an index can save hours of processingtime for a single request. Long-running requests can be scheduled to run at off-peak hours toreduce the performance impact on the overall system.
Question: How frequently are certain requests run?
The same request run multiple times by different users, each producing the same output,could be executed once with a distribution of the report to the necessary users. Requests thatare run regularly by users may be scheduled.
Question: Which requests use which data sources, views, or columns?
Data sources often require column revision or content modification. Knowing which requestsuse these data sources and/or columns provides quantitative information for determining theimpact of such revisions and allows for a complete implementation of the necessary changes.
Question: Which columns are often used in WHERE conditions and which WHERE conditionsare frequently used in combination?
Columns that are often used in equality conditions may be good candidates for indexing.Combinations of WHERE conditions identify a potential new data source of information that canbe placed in a warehouse environment or otherwise adapted to provide for faster access of therequired information.
Question: What data is not used at all?
Unused information can be removed, thereby reducing disk-space usage and improving requestperformance. Evidence of unused, or dormant, data may also indicate that the needs of theusers require better analysis.
Sample Data Access Questions
22 Information Builders

Question: How detailed is the use of the data? Are most users summarizing or averaging thedata, and on which columns?
Information about how data is used can identify columns that should be precalculated forfaster access or reduced storage requirements.
Question: What time periods are being accessed? Do users examine only the last five of the10 years you have made available? Do users visit the archive?
Information about which data is used allows intelligent decisions to be made concerning whichportion of the data should be archived for efficient use of system storage.
Additional Questions You May Want to Investigate With Resource Analyzer:
When are users running requests?
When are data sources being accessed?
When are data sources not being accessed?
Which users consistently execute long-running requests?
Which users consistently grab very large answer sets?
This section has introduced just a few of the issues that can be addressed using ResourceAnalyzer. You can begin your analysis of ad hoc data access at your site by seeking answers tothese and other questions. Once you are comfortable with the capabilities of ResourceAnalyzer, you can formulate further questions specifically designed to meet the needs of yourorganization. The questions you choose to ask will help you decide how to configure ResourceAnalyzer Usage Monitoring capabilities and, later, which Resource Analyzer reports to view.
How Resource Analyzer Works
Resource Analyzer monitors request activity, logging the attributes of each request to a log file.At predetermined intervals (At server start, upon the processing of a user scheduled job, oreither after a certain number of user sessions or a specified time period), the log file will bearchived, using the Deferred Execution service of the server, to the Usage Monitoring tables,also referred to as the repository. At configuration time, FOCUS database or Relational tablescan be selected for the repository. Once an adequate amount of Usage Monitoring data hasbeen collected, you can run Resource Analyzer reports, which illustrate (in both tabular andgraphical format) various aspects of request activity at your site.
You access Resource Analyzer administrative and reporting features through the server WebConsole.
1. What Is Resource Analyzer?
Resource Analyzer Administrator's and User's Manual 23

Note: We use the term MVS to refer to z/OS - PDS deployment. We use the term z/OS to referto z/OS - HFS deployment using UNIX System Services.
Software Prerequisites
Only site administrators should have access to configuring Resource Analyzer administrativesettings.
Overview: Resource Analyzer Software Components
On all other platforms, Resource Analyzer is comprised of only one component.
Server. A server must be installed and configured for Resource Analyzer. The deferredexecution service, DFM_DEFAULT, and the SCHEDULER Special Service should also be activeon the server. It is the server that houses the Resource Analyzer internal tables and processesthe data access requests of the user. For more information, see the Server Installationmanuals for your platform.
Overview of the Web Console
All Resource Analyzer administration functions are performed from the Web Console.
Overview of Resource Analyzer Administration
Before Resource Analyzer can monitor request information, it must know your monitoringrequirements. You specify these requirements through the Web Console of the server, usingthe Resource Management Administration Tool. You can specify a range of monitoringconfigurations depending on your needs. The following image shows sources being monitoredfrom the Web Console of the server.
Software Prerequisites
24 Information Builders

The monitoring process is as follows:
1. A request is issued by a user trying to access data from a data source.
2. This request is processed by the server, which calls the Usage Monitor just prior toretrieving the first record for the request.
3. The Usage Monitor captures the request attributes and stores them until the requestfinishes retrieving data.
4. The Usage Monitor is called once more to gather resource usage statistics.
5. The logged information is stored in the Usage Monitoring tables. For more informationabout Usage Monitoring, see Administrative Usage Monitoring Tables Column Descriptionson page 165.
Over time, you may find that Usage Monitoring data that has accumulated is no longer relevantto your current activity and analysis. When this is the case, Resource Analyzer allows you todelete this data from the Usage Monitoring tables by using the Web Console of the server.
For more information about using the Web Console of the server to set monitoringconfigurations and delete data, see Configuring and Administering Resource Management onpage 29.
Overview of Reporting With Resource Analyzer
Resource Analyzer offers tabular and graphical reports that show content planningrequirements, user activity profiles, usage profiles over time, typical request structures, andcolumns used. These reports are accessed from the Web Console of the server. For moreinformation on each individual report, see Resource Analyzer Report Options on page 114.
Note: On MVS, only data that has been archived to the repository is available for reporting.
Monitored Sessions. Shows the number of connections and the amount of resources used.
Monitored Commands. Shows the commands issued and the amount of resources used.
Repository Statistics. Shows the total number of records collected during the time periodspecified.
Data Sources Never Used. Opens the Unused Master File Descriptions report, which liststhe data sources that have never been used.
Procedures Never Used. Opens the Procedures Never Used report, which lists theprocedures that have never been executed.
1. What Is Resource Analyzer?
Resource Analyzer Administrator's and User's Manual 25

Usage Analysis Reports. These reports represent the types of analysis most commonlyused for research. They provide detailed information on users, procedures, or data sources.The three basic categories are:
Users
Procedures
Data Sources
Usage Analysis Reports comprise four categories of analysis:
Frequency of Use
Resources Used
Historical Use
Top n
Exception Analysis Reports. There reports provide information on error situations byprocedure name. There are two types of error reports:
Errors and Messages
Procedure with Errors
Domain Analysis Reports. The available report provides information on the usage of theWebFOCUS domains and their reports and users.
Domain Usage
Impact Analysis Reports. The available report provides information on response times andthe effects of column changes.
Change Impact for Column
Performance Analysis Reports. These reports are designed to help reduce excessiveoverhead. They help identify costly requests and unused data sources that may need to bereviewed to determine if the resource or storage usage could be reduced. The performanceanalysis reports available are:
Procedure Benchmarks
Excessive Resources
Long-running Requests
Overview of Reporting With Resource Analyzer
26 Information Builders

Large Volume Requests
Dormant Data
Excessive Joins
Repeated Aggregations
Candidates for Column Index
Optimization
Network Analysis Reports. These reports provide information about the network traffic onthe web server for requests. There are two network analysis reports:
Bandwidth by Procedure
Resources by Connection
Graph Reports. From this page, you can select one of several graphical reports:
Cumulative Hourly Use
Query Volume vs. Resource Utilization
Peak Transaction Periods
By Hour of Day
By Day of Week
By Month
Peak Resource Periods
By Hour of Day
By Day of Week
By Month
Resource Analyzer reports are initially displayed in tabular format. Reports can also bereformatted as EXCEL, PDF, PowerPoint and, if available, active reports. For information, see Alternate Reporting Output on page 119.
You can also re-sort reports by different columns and drill down on various hyperlinks to viewmore detailed information and different reports.
You can specify date-range selection criteria for the reports by accessing a calendar throughthe Date drop-down list.
1. What Is Resource Analyzer?
Resource Analyzer Administrator's and User's Manual 27

For more information on running and viewing these reports and graphs, see Resource AnalyzerReport Options on page 114.
Integrating Resource Analyzer With WebFOCUS, Managed Reporting, and ReportCaster
If you use Resource Analyzer with WebFOCUS Managed Reporting or ReportCaster, ResourceAnalyzer monitors the execution of all procedures initiated from those products and collectsthe following information:
Descriptive name of the procedure being monitored.
Physical file name (also known as logical name).
Domain name where the monitored procedure resides.
Application directory of the procedure in the application path of the server application path.
User ID that ran the procedure.
Basedir setting for WebFOCUS.
Scheduler ID assigned to the procedure (when monitoring ReportCaster only).
Internal procedure name used by distribution server for a scheduled procedure (whenmonitoring ReportCaster only).
Integrating Resource Analyzer With WebFOCUS, Managed Reporting, and ReportCaster
28 Information Builders
Chapter2 Configuring and AdministeringResource Management
The Web Console enables you to configure and administer Resource Management.
In this chapter:
Resource Management Interface
Configuring Resource Management
Administering Resource Management From the Web Console
Migrating the Resource Management Repository
Event Routing
Resource Management Interface
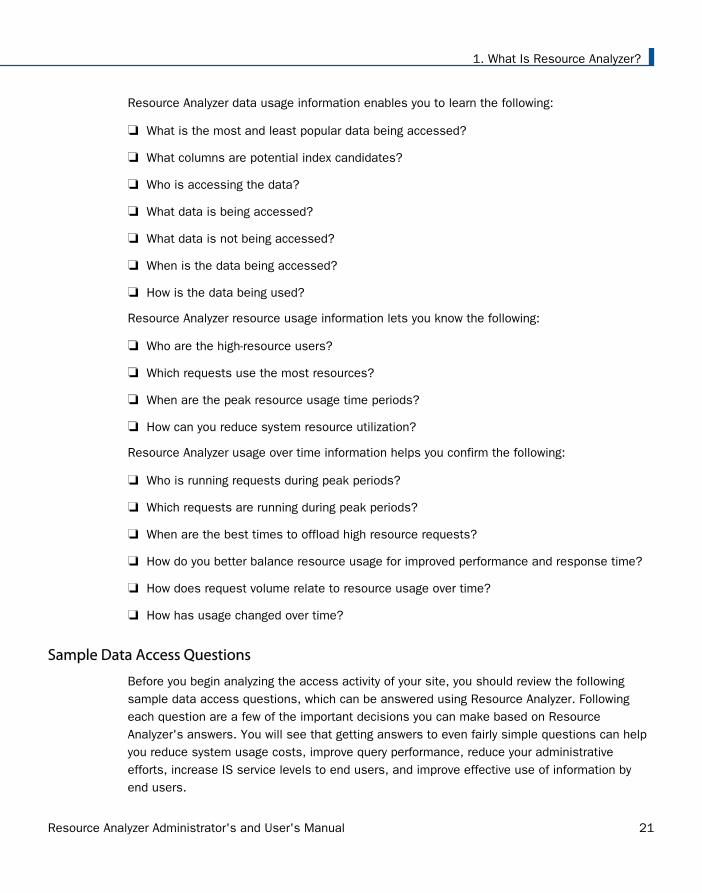
The Resource Management Web Console functionality is available through a ribbon at the topof the interface. The Resource Management ribbon replaces traditional toolbars with a single,rectangular region that spans the width of the application window.
There are two ribbons in Resource Management. The following image shows the ribbon beforeconfiguration has taken place.
The following image shows the default ribbon in Resource Management that can be seen onceconfigured.
Resource Analyzer Administrator's and User's Manual 29

Ribbon
The Resource Management ribbon represents a subset of controls and commands that areorganized into related groups depending on function or relationship. All groups are labeled andall icons represent a control or command.
From the ribbon you can perform actions such as enabling or disabling monitoring, archivinglogs, and setting logging properties. For more information on all of the commands shown in theribbon, see Resource Management Configuration Maintenance on page 41.
Note: You can hide the ribbon by clicking the ribbon menu button . This will remain thedefault view until you choose to show the ribbon using the same button.
The ribbon provides the same options that are available from the right-click menus of the topnodes in the navigation pane.
Sidebar
You can use the sidebar to manage your server environment. From the sidebar, you canperform actions such as:
Select, add, and configure data adapters.
Create and manage adapter metadata.
Launch the Resource Management Web Console.
You can toggle the sidebar by clicking the toggle button to expand or collapse it.
Configuring Resource Management
At run time, Resource Management collects usage monitoring data in a log file. Atpredetermined times, such as during server startup or a user request, the log data collected isarchived to a permanent repository. Before collecting the data, Resource Management must beconfigured.
To configure Resource Management, after the server is installed, you must:
1. Consider security authorization for RM files and libraries.
There are two levels of security to consider:
Administrator: MVS requires read and write authority to all datasets allocated toEDACCFG, EDACMAS, EDACACX, and SMARTLIB DD statements of the server. All otherplatforms require read and write authority to EDACONF/catalog and EDACONF/catalog/rm.
Configuring Resource Management
30 Information Builders

Basic user: MVS requires read authority to the dataset allocated to the SMARTLIB DDstatement.
2. Enable Resource Management from the Web Console.
3. Type your license key and select a repository type. Resource Management can beconfigured to create Usage Monitoring tables in a FOCUS repository or in a relationalrepository. The repository holds data on resource usage.
4. Configure the repository.
Procedure: How to Configure Resource Management Using a FOCUS or Relational Repository
To enable Resource Management, you must have a valid license key. After typing the key, youcan specify the type of repository to be used for Usage Monitoring. The Usage Monitoringtables are then created. This procedure shows how to create Usage Monitoring tables in aFOCUS or relational repository using a license code for Resource Analyzer.
Before performing the following steps, make sure the server is running.
1. On a Windows system, click the Start menu, and then click Programs. If using Windows10, click All Apps.
2. Select iWay Software (or Information Builders, if you have a WebFOCUS server installation),then the server type, and click Web Console.
If you are using an operating system other than Windows, enter
http://ipaddress:port
where:
ipaddress
Identifies the server where Resource Analyzer is to be configured. Do not use localhostwhen accessing the Web Console for Resource Management initial configuration.
port
Is the port number for that server.
Note: On the Programs or All Apps menu under iWay Software, the server types caninclude iWay Full-Function Server, or iWay DataMigrator Server. On the Programs or AllApps menu under Information Builders, the server type can include a WebFOCUS Server.Resource Analyzer can be configured on any of these servers.
2. Configuring and Administering Resource Management
Resource Analyzer Administrator's and User's Manual 31

The Web Console opens, as shown in the following image.
3. Click the Resource Management button on the sidebar.
The Resource Management page opens, as shown in the following image.
4. Click Configure on the ribbon or right-click Resource Management in the navigation paneand click Configure.
5. Type the license key from the packing slip. There are different keys: one for ResourceAnalyzer, one for Resource Governor, and one if both products are licensed.
6. Click Next.
The Resource Management Configuration pane opens.
Configuring Resource Management
32 Information Builders

7. For a FOCUS Repository:
a. Type a Server Name, which is used by Resource Analyzer as the server name incollected data and on reports. Any identifier of up to 48 characters is acceptable, butthe value should be unique across all servers where Resource Analyzer is installed.Host server (computer) name, along with the port used by the server, is the default. Itis recommended that this value is not changed.
Note: If you need to change the server name after configuring Resource Management,you have to remove the current configuration and reconfigure it using the new servername. Note that removing the current configuration of Resource Management willdelete all of your collected data.
b. Select FOCUS from the Repository drop-down menu.
c. Go to step 8g.
8. For a Relational Repository:
a. Type a Server Name. Used by Resource Analyzer as the server name in collected dataand on reports. Any identifier up to 48 characters is acceptable, but the value shouldbe unique across all servers where Resource Analyzer is installed. Host server(computer) name, along with the port used by the server, is the default. It isrecommended that this value is not changed.
Note: If you need to change the server name after configuring Resource Management,you have to remove the current configuration and reconfigure it using the new servername. Note that removing the current configuration of Resource Management willdelete all of your collected data.
2. Configuring and Administering Resource Management
Resource Analyzer Administrator's and User's Manual 33

b. Select Relational from the Repository drop-down menu. The following image shows theadditional fields that become available.
Note: If no certified Resource Management adapter has been configured, the onlyoption in the drop-down menu will be FOCUS.
c. Select an adapter from the Data Adapter drop-down menu. This adapter identifies thedata adapter and the connection name to be used for storing Resource AnalyzerUsage Monitoring data. The connection name is the logical name used to identify aparticular set of connection attributes. This setting also determines the SUFFIX usedwhen creating the Master Files for these tables.
The current list of certified relational engines is:
Db2
Informix
MariaDB
MS SQL Server
MySQL
Oracle
PostgreSQL
Configuring Resource Management
34 Information Builders

Sybase
Teradata
Vertica
Generic ODBC/JDBC for Sybase SQL Anywhere Release 12 non-Unicode only.
Note:
The Sybase ASA database used for the Resource Management repository mustbe created with the Ignore trailing blanks in string comparisons option (or the -boption in the dbinit command).
If Db2 is going to be the target for the Resource Management repository, theDBA of the site should investigate the use of the parameter LOCKSIZE andchange it to ANY if large volumes of data are to be stored. This value ofLOCKSIZE will prevent the Db2 error message:
The limit on the number of locks has been exceeded for the tablespace within Db2.
If the DDL Only option is used at configuration time, then this parameter can beadded to the DDL that is generated. Otherwise, the DBA of the site can add itto the existing Resource Management environment.
d. Set Create Repository to Yes, unless the repository has already been created usingthe native Data Definition Language (DDL) of the data adapter or you are configuring amany-to-one environment.
When No is selected, the configuration process will not issue DROP TABLE, DROPINDEX, CREATE FILE, and CREATE INDEX commands. Because the configurationprocess will always initialize the repository with default data and issue the defaultGRANTS, the repository must exist when the commands are executed or theconfiguration will fail. Yes is the default value.
For more information, see Using DDL Statements to Create the Internal Tables on page195. For more information on many-to-one, see Configuring Many-to-One Monitoring onpage 38.
e. Provide an Owner/Schema. By default, the tables are created for the specified owner/schema in the default database, and the owner/schema must be authorized to createtables in the database.
2. Configuring and Administering Resource Management
Resource Analyzer Administrator's and User's Manual 35

If the tables are to be created in an alternate database that the owner has rights to,and the technique is supported by the RDBMS, the database name must be specifiedas well (for example, database.owner). Consult the appropriate RDBMS documentationfor the appropriate syntax. On the System I platform, the Owner Name will be shownas Library.
f. For servers running on z/OS, HFS, or PDS deployment where Db2 has been selectedas the data adapter, provide a Db2 DBSPACE. The format of the input required isDatabase or Database.tablespace.
g. Set Global Settings, which has the following options:
Data Request Monitoring
Indicates whether Data Request Monitoring is on or off. When Global DataRequest Monitoring is enabled, or set to On, Resource Analyzer collectsinformation on all SQL SELECT and FOCUS TABLE, TABLEF, MATCH, GRAPH,MODIFY, and MAINTAIN requests. The default value is Off. Monitoring will be byindividually selected data sources.
Note: On initial configuration it is recommended that this value is set to On sothat all default monitoring data can be collected for an initial period after whichreports can be run to determine at what level future monitoring should be set.Default monitoring is down to the Field/Column level, which could amount to alarge volume of Repository data. If, after reviewing the available reports, it isdetermined that, for example, this level of monitoring is not required, it can beturned off. For more information, see How to Set Repository Properties on page74.
Procedure Request Monitoring
Indicates the level of Procedure Request Monitoring. The following options areavailable:
Execute and Include. All executed procedures and any procedure that used -INCLUDE will be monitored. This is the default value.
Execute Only. Any procedure that is executed using EX or EXEC will bemonitored.
Primary Execute Only. The only procedure monitored will be the primaryprocedure. Any procedure executed from within the primary (-INCLUDE or EX)will not be monitored.
Configuring Resource Management
36 Information Builders

WebFOCUS System Procedure MonitoringDetermines whether WebFOCUS internal system procedures will be monitored.The following options are available:
Off. Internal system procedures will not be monitored. This is the defaultsetting.
On. Internal system procedures will be monitored.
9. Click Configure.
The Repository Statistics page opens, and the navigation pane appears on the left, as shownin the following image.
Note: The server that you are connected to is shown in bold text.
After a successful configuration, a confirmation dialog box opens, as shown in the followingimage.
You can now select monitoring levels for Resource Analyzer. For more information, see How toSet Repository Properties on page 74.
Click OK.
2. Configuring and Administering Resource Management
Resource Analyzer Administrator's and User's Manual 37

Configuring Many-to-One Monitoring
Several considerations and steps must be taken in order to configure Resource Managementto gather monitor data for multiple servers into a single repository. This can only be done usingrelational adapters. Access must be available from each server machine to the selectedrelational engine, and a license will be needed for each individual adapter. All servers must beat the same major release level.
All servers in a cluster environment, or multiple servers on UNIX, IBM i/MVS/PDS, andWindows platforms, can collect monitor data into a single repository. If you have environmentswith multiple WebFOCUS or iWay servers configured for Resource Management and want tocollect monitor data from those servers into a single repository, the steps in the followingprocedure show how to configure Resource Management using the Web Console of theservers.
Configuring Resource Analyzer
If you have not used the Resource Management DDL to create the repository tables, then youneed to pick a server to do the initial configuration that will create the repository tables. Usingthe Web Console of the server, you will need to perform the steps in How to Configure the FirstServer on page 38. If the Resource Management DDL was used to create the repositorytables, then go to How to Configure Additional Servers on page 39.
Procedure: How to Configure the First Server
For the first server, configure Resource Management from the Web Console of the server usingthe following steps:
1. Configure the relational data adapter for the repository, if it does not yet exist.
2. Configure Resource Analyzer from the Resource Management Configuration pane.
3. Enter the Resource Management license key. Click Continue.
4. Select Relational from the Repository Type drop-down menu.
5. Enter a unique name in the Server Name field, or accept the default.
6. Select a Data Adapter and the appropriate connection name from the drop-down menu.
7. Set Create Repository to Yes.
8. Provide an Owner/Schema name for the relational adapter that Resource Analyzer will useto create the repository tables.
9. Click Configure.
After configuration is complete, select the monitoring level for Resource Analyzer. For moreinformation, see How to Set Repository Properties on page 74.
Configuring Resource Management
38 Information Builders

Procedure: How to Configure Additional Servers
For additional servers that will use the same repository, configure Resource Management fromthe Web Console of the server using the following steps:
1. Configure the relational data adapter for the repository, if it does not yet exist, thatconnects to the same database used in step 1 in How to Configure the First Server onpage 38.
2. Configure Resource Analyzer from the Resource Management Configuration pane.
3. Enter the Resource Management license key. Click Continue.
4. Select Relational from the Repository Type drop-down menu.
5. Enter a unique name in the Server Name field, or accept the default.
6. Select a Data Adapter and the appropriate connection name from the drop-down menu.
7. Set Create Repository to No.
Note: Create Repository must be set to No on each additional server. If set to Yes, anerror message will be displayed stating that the repository already exists.
If the relational repository tables were created by the DBA using the DDLs provided withthe product, then all servers have to be configured using Create Repository No.
8. Provide an Owner/Schema name for the relational adapter that Resource Analyzer will useto create the repository tables.
9. Click Configure.
After configuration is complete, select the monitoring level for Resource Analyzer. For moreinformation, see How to Set Repository Properties on page 74.
Note: All administration for Resource Analyzer must be done on each of the servers configuredto use the same repository tables.
Administering Resource Management From the Web Console
Resource Analyzer Usage Monitoring facility allows you to monitor requests as they aresubmitted by users, and logs information about request usage. This information includes theusage statistics associated only with data retrieval, or data manipulation in the case ofMODIFY or MAINTAIN. This request information is stored in Resource Analyzer UsageMonitoring tables. You can specify the Monitor Preference, which allows you to change whatinformation is collected for monitored data sources.
The Web Console enables you to administer Resource Management.
2. Configuring and Administering Resource Management
Resource Analyzer Administrator's and User's Manual 39

You can:
Enable/disable monitoring.
Maintain the repository.
Reconfigure the repository from FOCUS to relational, or one relational environment toanother relational environment.
Remove Resource Management.
Enable/disable global monitoring.
Set monitoring preferences.
Add data sources to be monitored.
View the properties of data sources and the sample data they produce.
Monitor Data Services.
Access reports.
Access to these tasks is provided by the Resource Management button on the sidebar.
Administering Resource Management From the Web Console
40 Information Builders

The following image shows the hierarchical navigation menu that is available when theResource Management button is selected.
Resource Management Configuration Maintenance
The Resource Management ribbon provides options for configuring Resource Management, asshown in the following image.
The following sections provide detailed explanations for each option in the ribbon.
Note: You can also access these options by right-clicking Resource Management node in thenavigation pane.
2. Configuring and Administering Resource Management
Resource Analyzer Administrator's and User's Manual 41

Enabling or Disabling Monitoring
When you enable Resource Management, it automatically turns on monitoring. However, youcan disable and re-enable monitoring at any time.
Procedure: How to Enable or Disable Monitoring
1. Launch the Web Console.
2. Click the Resource Management option on the sidebar.
3. On the ribbon, in the Monitoring group, click Enable/Disable.
or
From the navigation pane, right-click Resource Management and click Enable/Disable.
When disabling Resource Management, a confirmation window will be displayed. Click OK todisable Resource Management or Cancel to leave it enabled.
Logging
The Reporting Server will write all information regarding monitored sources to a log file. Thislog file is then archived to the Resource Management repository at predetermined intervals orlimits, while the server is running. The current log is also archived when the server starts orwhen the administrator submits a job from the Web Console of a running server.
The intervals or limits can be configured from the Logging option in the Resource ManagementWeb Console. When configured, the log file of an active server will be archived based on themaximum number of sessions or the days set, or based on a scheduled job configured by theadministrator.
Procedure: How to Set Logging Properties
Logging properties can be configured in the Resource Management Web Console. Whenconfigured, the log files will be archived based on the maximum number of sessions and daysset, or based on a scheduled job configured by the administrator.
1. Launch the Web Console.
2. Click the Resource Management option on the sidebar.
3. On the ribbon, in the Logs group, click Logging, and then click Properties.
or
From the navigation pane, right-click Resource Management, point to Logging, and thenclick Properties.
Administering Resource Management From the Web Console
42 Information Builders

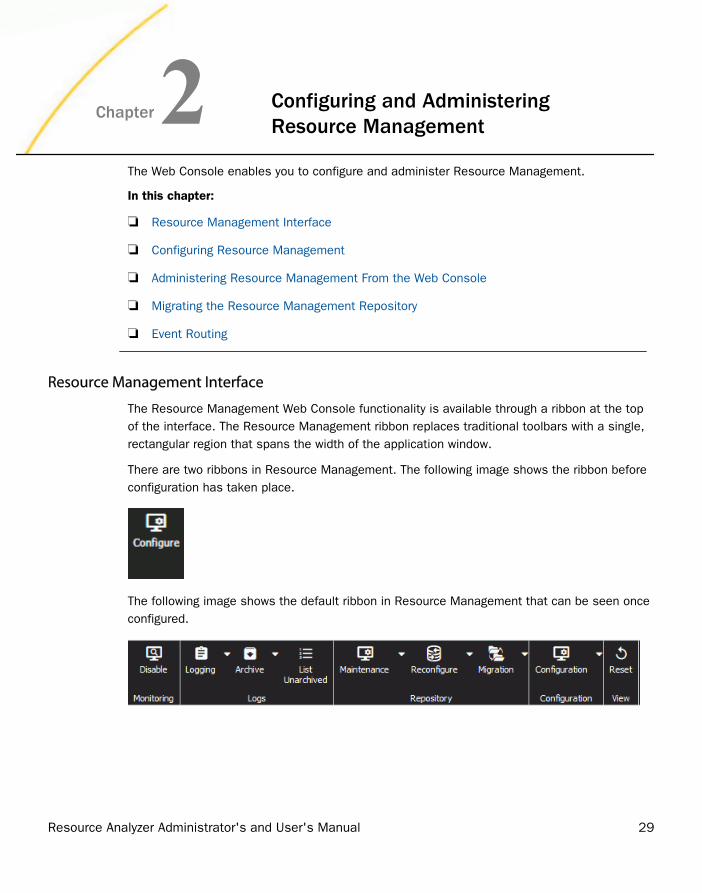
The Resource Management Logging Properties pane opens, as shown in the followingimage.
The following options are available:
Maximum sessions per log
The number of sessions recorded in the active log file before the log is archived and anew log is started. The default value is 10000. This option is only available ifSchedule Archive is set to No.
Maximum days per log
The number of days an active log file is kept open before it is archived and a new logis started. The default value is 1. This option is only available if Schedule Archive isset to No.
Schedule Archive When set to Yes, only the Limit Agent memory option for interim log records is shownand the administrator has to configure the schedule archive settings. For moreinformation, see How to Schedule an Archive on page 46.
When set to No, automatic archiving is active and based on the two additionalsettings. The default value is No.
Note: To use the scheduler feature for archiving the log file, the server Schedulerprocess must be running. To check this, from the Web Console, click the Workspaceoption on the sidebar. Expand the Special Services and Listeners folder, right-clickSCHEDULER, and click Start. If the Start option is not available, the scheduler isalready running. If Resource Management and setting Schedule Archive to Yes aredone in the same Web Console session, the Scheduler will need to be restarted. Todo so, right-click SCHEDULER and click Stop, followed by Start.
2. Configuring and Administering Resource Management
Resource Analyzer Administrator's and User's Manual 43

Limit Agent memory
This setting is used for a connection during which multiple procedures are run withinthe session. This type of connection can cause the Resource Management loggingprocess to use a large amount of memory before the log records are written to thephysical disk file (rmldata.log).
When set to Yes, enter a value between 5 and 99 (in megabytes). When thisparameter is set to Yes and the specified amount of memory is reached, theconnected user log records in memory are written to a temp disk file and the memoryis freed.
At this point any new log records generated will be written to disk instead of memoryuntil the end of the session. At this time, all the log records in the temporary disk fileare written to the physical disk file (rmldata.log). This setting should only be used ifexcessive memory usage is observed and users are connected for long periods.
4. Make your desired changes and click Save.
Procedure: How to View Logs
1. Launch the Web Console.
2. Click the Resource Management option on the sidebar.
3. On the ribbon, in the Logs group, click Logging, and then click View Logs.
or
From the navigation pane, right-click Resource Management and point to Logging, and thenclick View Logs.
The Data log list pane opens, as shown in the following image.
If you right-click any item in any column, the following options are available:
View. Opens the log file for the selected data log. You can also double-click the logname to view the file.
Administering Resource Management From the Web Console
44 Information Builders

Download. Saves the selected log to your Downloads folder. In Windows, the defaultlocation of this folder is C:\users\username\Downloads.
Archive Log Files
When this option is selected, a context menu is shown with the following options:
Schedule and E-Mail
Note: This option is only available when Schedule Archive is set to Yes. For moreinformation on logging properties, see How to Set Logging Properties on page 42.
Submit job
View jobs
These give the administrator the option to archive the current log file (a new log file isautomatically started), as well as view previous archive jobs including any that were submitteddue to server restart or any of the intervals or limits mentioned above having been reached.For more information, see How to Submit an Archive of the Current Log File on page 52.
Note: After a successful archive, the log file is deleted. If the archive fails, the log file willremain available for archiving. The failure should be investigated and corrected. Once this isdone, the List Unarchived Log Files option can be used to archive the data. For moreinformation, see List Unarchived Log Files on page 53.
Reference: Bulk Load Support
The archive process uses two steps. The first step will use the Bulk Load facility to move themonitored data to a staging/temporary table and then issue a SQL MERGE syntax to insert thedata into the repository. This means that the adapter connection to the repository environmentmust have correct privileges to create a table.
If the RDBMS repository vendor supported by Resource Management supports bulk load andthe environment is correct, the archive process will attempt to issue bulk load commands. Ifthey fail, the archive will fall back to previous methods of inserting monitored data.
Bulk load is transparent except for the following:
Microsoft SQL Server on Windows. This requires the BCP utility to be available in thewindows search PATH. Bulk load is not available on non Windows platforms.
2. Configuring and Administering Resource Management
Resource Analyzer Administrator's and User's Manual 45
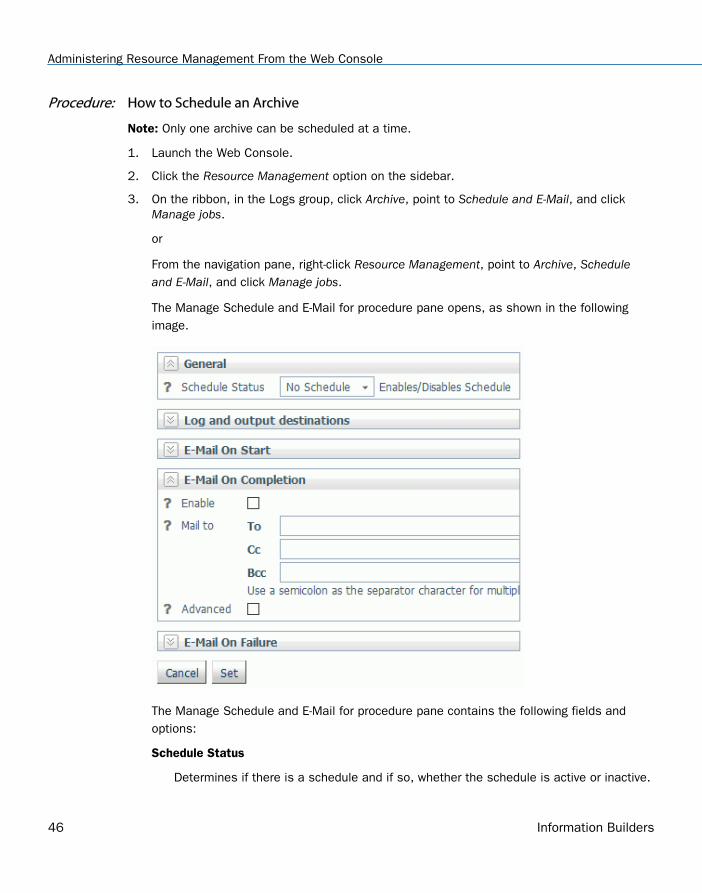
Procedure: How to Schedule an Archive
Note: Only one archive can be scheduled at a time.
1. Launch the Web Console.
2. Click the Resource Management option on the sidebar.
3. On the ribbon, in the Logs group, click Archive, point to Schedule and E-Mail, and clickManage jobs.
or
From the navigation pane, right-click Resource Management, point to Archive, Scheduleand E-Mail, and click Manage jobs.
The Manage Schedule and E-Mail for procedure pane opens, as shown in the followingimage.
The Manage Schedule and E-Mail for procedure pane contains the following fields andoptions:
Schedule Status
Determines if there is a schedule and if so, whether the schedule is active or inactive.
Administering Resource Management From the Web Console
46 Information Builders

Log and output destinations
These options control where the log information from the Maintenance Job should besent when the Job finishes.
The following options are available:
ETLLOG. The log is sent to the DataMigrator log.
EDAPRINT. The log is sent to the Server log.
E-Mail. The log is sent as an attachment to an email message if specified in JobProperties.
Send HTML output as inline message. When selected, if any stored procedurescalled by the flow generate an output, the message is included as message textinstead of as an attachment. This option is only available in the E-Mail OnCompletion section.
Multiple options can be selected. ETLLOG and E-Mail are selected by default.
Note:
If the job is run from the DMC or Web Console, information will go to the consolelog regardless of this setting.
The E-Mail On Start and E-Mail On Completion options are not relevant to theResource Management Archive job and should not be used.
Enable
Select this to enable when an email should be sent.
Mail to
The email addresses where the messages will be sent. Place each email address (oruser ID configured on the server with an associated email address) on a new line withno separators.
Advanced
Select this option to get the following options:
Mail to addresses defined in procedure. You can send the messages to emailaddresses defined in the procedure by either typing in the location of theprocedure, or clicking the ellipsis button and manually selecting it from the SelectProcedure dialog box.
Importance. Select the importance for the e-mail from the drop-down menu.Choices are Low, Normal, or High.
2. Configuring and Administering Resource Management
Resource Analyzer Administrator's and User's Manual 47

Subject. The subject line of the message.
E-Mail Message. The body of the message.
4. If you select Active or Inactive from the Schedule Status drop-down menu, the ManageSchedule and E-Mail for procedure pane opens with more fields, as shown in the followingimage.
Administering Resource Management From the Web Console
48 Information Builders

The Manage Schedule and E-Mail for procedure pane contains the following additionalfields and options:
Schedule Type
Determines whether a process flow will execute once, on a recurring basis, on severalspecific days (multi-day), or when the server starts.
Interval Type
Specifies the interval in which a process flow will be executed. For example, if youselect Month as your Interval Type, and select 2 as your Interval Number, the flow willexecute every two months. This option is only available if the schedule type is set toRecurring.
Interval Value
Specifies the frequency at which a process flow will be executed. For example, if youselect Week as your Interval Type, and select 2 as your Interval Value, the flow willexecute every two weeks. This option is only available if the schedule type is set toRecurring.
Start Date
Specifies the start date for the execution of the process flow.
Start Time
Specifies the start time for the execution of the process flow using 24-hour time.
Specify Stop Time
Allows you to specify an end time for the execution of the process flow using 24-hourtime. This option is only available if the schedule type is set to Run Once or Multi-Day.
Specify End Date Allows you to specify an end date and time for the execution of the process flow. Thisoption is only available if the schedule type is set to Recurring or Multi-Day.
End Date
Specifies the end date for the execution of the process flow. This option is available ifSpecify End Date is selected.
End Time
Specifies the end time for the execution of the process flow using 24-hour time. Thisoption is available if Specify End Date is selected.
2. Configuring and Administering Resource Management
Resource Analyzer Administrator's and User's Manual 49

Days of the Week
Specifies the day of the week on which the process flow will be executed. This optionis only available if the schedule type is set to Recurring or Multi-Day.
Days of the Month
Specifies the day of the month on which the process flow will be executed. This optionis only available if the schedule type is set to Recurring or Multi-Day.
Intraday Start
Specifies the beginning of the daily time span of the process flow using 24-hour time.This option is only available if the schedule type is set to Recurring and the intervaltype is set to time, such as Minutes.
Intraday End
Specifies the end of the daily time span of the process flow using 24-hour time. Thisoption is only available if the schedule type is set to Recurring and the interval type isset to time, such as Minutes.
Run on Holidays
Specifies the option to execute the process flow on desired holidays.
The following options are available:
Skip. Excludes run on desired holidays.
Only. Only run on desired holidays.
This option is only available if the schedule type is set to Recurring or Multi-Day.
5. Click Set.
A confirmation dialog box opens.
6. Click OK.
Procedure: How to View Scheduler Agents
This report runs for the user whose ID value is stored in the sched_scan_id of a Scheduler.The Scheduler must be active to run the Scheduler Agents report.
1. Launch the Web Console.
2. Click the Resource Management option on the sidebar.
3. On the ribbon, in the Logs group, click Archive, point to Schedule and E-Mail, and clickScheduler Agents.
or
Administering Resource Management From the Web Console
50 Information Builders

From the navigation pane, right-click Resource Management, point to Archive, then point toSchedule and E-Mail, and click Scheduler Agents.
The Scheduler Agents pane opens, as shown in the following image.
The following buttons are available on the Scheduler Agents pane:
Choose StatesAllows you to select the states that are displayed on the Scheduler Agents pane.
Activate SelectedAllows you to enable the Scheduler for the selected procedure.
Deactivate SelectedAllows you to disable the Scheduler for the selected procedure.
If you right-click a drill-down item in the Procedure column, the following options areavailable:
Manage Schedule/E-MailOpens the Manage Schedule and E-Mail for procedure pane, which allows you to editthe schedule settings for the selected procedure.
View Scheduled EventsOpens the Scheduled Events pane, which allows you to view jobs scheduled to startduring a specified time range.
View LogOpens the Log report for the selected procedure.
View StatisticsOpens the Statistics report for the selected procedure.
Quiesce Scheduler AgentAllows you to stop the selected scheduled procedure from running.
Procedure: How to View Scheduled Events
Note: The Scheduler must be active to run the Scheduler Events report.
1. Launch the Web Console.
2. Click the Resource Management option on the sidebar.
3. On the ribbon, in the Logs group, click Archive, point to Schedule and E-Mail, and clickScheduled Events.
or
2. Configuring and Administering Resource Management
Resource Analyzer Administrator's and User's Manual 51

From the navigation pane, right-click Resource Management, point to Archive, then point toSchedule and E-Mail, and click Scheduled Events.
The Scheduled Events pane opens, as shown in the following image.
4. Set the desired time range and click View Report.
The report opens, as shown in the following image.
This report shows all flows and procedures scheduled to run during the time period youselected. The Run Date and Run Time columns show their scheduled run times. The User IDcolumn shows the user ID used when running the flow or procedure.
Procedure: How to Submit an Archive of the Current Log File
1. Launch the Web Console.
2. Click the Resource Management option on the sidebar.
3. On the ribbon, in the Logs group, click Archive and then click Submit job.
or
From the navigation pane, right-click Resource Management, point to Archive, and thenclick Submit job.
Administering Resource Management From the Web Console
52 Information Builders

The Select an Option dialog box opens, as shown in the following image.
4. Click OK to save the log data.
Procedure: How to List Previous Archive Jobs
1. Launch the Web Console.
2. Click the Resource Management option on the sidebar.
3. On the ribbon, in the Logs group, click Archive and then click View jobs.
or
From the navigation pane, right-click Resource Management, point to Archive, and thenclick View jobs.
The Deferred List opens showing the saved logs, as shown in the following image.
If you right-click an item in the Defer ID column, the following options are available:
View. Opens the output of the selected item.
Download. Saves the selected log to your Downloads folder. In Windows, the defaultlocation of this folder is C:\users\username\Downloads.
Delete. Deletes the selected item.
List Unarchived Log Files
Select this option to show a list, if any, of previous log files that have not been archived.
2. Configuring and Administering Resource Management
Resource Analyzer Administrator's and User's Manual 53

Procedure: How to List Unarchived Logs
1. Launch the Web Console.
2. Click the Resource Management option on the sidebar.
3. On the ribbon, in the Logs group, click List Unarchived.
or
From the navigation pane, right-click Resource Management and click List Unarchived.
The Resource Management unarchived logs list opens, listing the non-archived logs, asshown in the following image.
4. Select an unarchived log and click Next to archive the desired unarchived logs.
5. Select a date and time to archive and click Continue.
Working With Repository Maintenance
Repository data can be deleted once it has been used or reported on. This deletion can be bydate range or, if sufficient data has been stored, the data can be deleted if it is more thanone, three, or six months old.
Procedure: How to Schedule a Repository Maintenance
1. Launch the Web Console.
2. Click the Resource Management option on the sidebar.
3. On the ribbon, in the Repository group, click Maintenance, point to Schedule and E-Mail,and click Add job.
or
From the navigation pane, right-click Resource Management, point to Maintenance, thenpoint to Schedule and E-Mail, and click Add Job.
Administering Resource Management From the Web Console
54 Information Builders

The Resource Management Schedule Repository Maintenance - Add pane opens, asshown in the following image.
4. If you have multiple servers available, select the server from the list shown.
5. Select the time range of data that you want to schedule.
6. Click Next.
2. Configuring and Administering Resource Management
Resource Analyzer Administrator's and User's Manual 55

The Manage Schedule and E-Mail for procedure pane opens, as shown in the followingimage.
The Manage Schedule and E-Mail for procedure pane contains the following fields andoptions:
Schedule Status
Determines if there is a schedule and if so, whether the schedule is active or inactive.
Log and output Destinations
These options control where the log information from the Maintenance Job should besent when the Job finishes.
The following options are available:
ETLLOG. The log is sent to the DataMigrator log.
EDAPRINT. The log is sent to the Server log.
E-Mail. The log is sent as an attachment to an email message if specified in JobProperties.
Administering Resource Management From the Web Console
56 Information Builders

Send HTML output as inline message. When selected, if any stored procedurescalled by the flow generate an output, the message is included as message textinstead of as an attachment. This option is only available in the E-Mail OnCompletion section.
Multiple options can be selected. ETLLOG and E-Mail are selected by default.
Note:
If the job is run from the DMC or Web Console, information will go to the consolelog regardless of this setting.
The E-Mail On Start and E-Mail On Completion options are not relevant to theResource Management Archive job and should not be used.
Enable
Select this to enable when an email should be sent.
Mail to
The email addresses where the messages will be sent. Place each email address (oruser ID configured on the server with an associated email address) on a new line withno separators.
Advanced
Select this option to get the following options:
Mail to addresses defined in procedure. You can send the messages to emailaddresses defined in the procedure by either typing in the location of theprocedure, or clicking the ellipsis button and manually selecting it from the SelectProcedure dialog box.
Importance. Select the importance for the e-mail from the drop-down menu.Choices are Low, Normal, or High.
Subject. The subject line of the message.
E-Mail Message. The body of the message.
2. Configuring and Administering Resource Management
Resource Analyzer Administrator's and User's Manual 57

7. If you select Active or Inactive from the Schedule Status drop-down menu, the ManageSchedule and E-Mail for procedure pane opens with more fields, as shown in the followingimage.
Administering Resource Management From the Web Console
58 Information Builders

The Manage Schedule and E-Mail for procedure pane contains the following additionalfields and options:
Schedule Type
Determines whether a process flow will execute once, on a recurring basis, on severalspecific days (multi-day), or when the server starts.
Interval Type
Specifies the interval in which a process flow will be executed. For example, if youselect Month as your Interval Type, and select 2 as your Interval Number, the flow willexecute every two months. This option is only available if the schedule type is set toRecurring.
Interval Value
Specifies the frequency at which a process flow will be executed. For example, if youselect Week as your Interval Type, and select 2 as your Interval Value, the flow willexecute every two weeks. This option is only available if the schedule type is set toRecurring.
Start Date
Specifies the start date for the execution of the process flow.
Start Time
Specifies the start time for the execution of the process flow using 24-hour time.
Specify Stop Time
Allows you to specify an end time for the execution of the process flow using 24-hourtime. This option is only available if the schedule type is set to Run Once or Multi-Day.
Specify End Date Allows you to specify an end date and time for the execution of the process flow. Thisoption is only available if the schedule type is set to Recurring or Multi-Day.
End Date
Specifies the end date for the execution of the process flow. This option is available ifSpecify End Date is selected.
End Time
Specifies the end time for the execution of the process flow using 24-hour time. Thisoption is available if Specify End Date is selected.
2. Configuring and Administering Resource Management
Resource Analyzer Administrator's and User's Manual 59

Days of the Week
Specifies the day of the week on which the process flow will be executed. This optionis only available if the schedule type is set to Recurring or Multi-Day.
Days of the Month
Specifies the day of the month on which the process flow will be executed. This optionis only available if the schedule type is set to Recurring or Multi-Day.
Intraday Start
Specifies the beginning of the daily time span of the process flow using 24-hour time.This option is only available if the schedule type is set to Recurring and the intervaltype is set to time, such as Minutes.
Intraday End
Specifies the end of the daily time span of the process flow using 24-hour time. Thisoption is only available if the schedule type is set to Recurring and the interval type isset to time, such as Minutes.
Run on Holidays
Specifies the option to execute the process flow on desired holidays.
The following options are available:
Skip. Excludes run on desired holidays.
Only. Only run on desired holidays.
This option is only available if the schedule type is set to Recurring or Multi-Day.
8. Click Set.
A confirmation dialog box opens.
9. Click OK.
Procedure: How to View Scheduled Jobs
1. Launch the Web Console.
2. Click the Resource Management option on the sidebar.
3. On the ribbon, in the Repository group, click Maintenance, point to Schedule and E-Mail,and click List jobs.
or
From the navigation pane, right-click Resource Management, point to Maintenance, thenSchedule and E-Mail, and click List jobs.
Administering Resource Management From the Web Console
60 Information Builders

The Schedule Repository Maintenance - Update pane opens, as shown in the followingimage.
If you right-click a drill-down item in a column, the following options are available:
Name Column
Log and Statistics. Opens the Log and Statistics pane that enables you to view a logor statistics report.
The following options are available:
Report Type. Allows you to select either a log or statistics report.
Report Range. Allows you to select to view the last report, all the reports, or areport specified within a select time range.
Completion Status. Allows you to view all reports, all completed reports, allsuccessfully completed reports, or all completed reports that contained errors.
Run by. Allows you to view reports for all flows, as well as those initiated by thescheduler or submit.
Application or Flow Name. Allows you to select a specific application or flow namefor the report.
Status Column
Manage Schedule. Opens the Manage Schedule and E-Mail for procedure pane.For more information on this pane, see How to Schedule a Repository Maintenanceon page 54.
Scheduler Agents. Runs a report for the user whose ID value is stored in thesched_scan_id of a Scheduler. The Scheduler must be active to run the SchedulerAgents report.
Scheduled Events. Opens a pane that shows all jobs scheduled to run during aspecified time range.
2. Configuring and Administering Resource Management
Resource Analyzer Administrator's and User's Manual 61

The Scheduler must be active to run the Scheduler Events report.
This report shows all flows and procedures scheduled to run during the time periodyou selected. The Run Date and Run Time columns show their scheduled runtimes.
The User ID column shows the user ID used when running the flow or procedure.
Months Column
Older than. Opens the Resource Management Schedule Repository Maintenance -Change pane. Select the new time range of data that you want to delete and clickSave.
Procedure: How to Delete Scheduled Jobs
1. Launch the Web Console.
2. Click the Resource Management option on the sidebar.
3. On the ribbon, in the Repository group, click Maintenance, point to Schedule and E-Mail,and click Delete jobs.
or
From the navigation pane, right-click Resource Management, point to Maintenance, thenSchedule and E-Mail, and click Delete jobs.
The Schedule Repository Maintenance - Delete pane opens.
4. Select the scheduled jobs you want to delete, as shown in the following image.
5. Click Delete.
Administering Resource Management From the Web Console
62 Information Builders

Procedure: How to Submit a Maintenance Job
1. Launch the Web Console.
2. Click the Resource Management option on the sidebar.
3. On the ribbon, in the Repository group, click Maintenance and then click Submit job.
or
From the navigation pane, right-click Resource Management, point to Maintenance, andclick Submit job.
The Resource Management Repository Maintenance pane opens, as shown in thefollowing image.
Note:
The options for deleting data will vary based on how much data is in the repository.
4. Enter a Start Date and End Date for deletion of data through that range, or click the downarrow to choose the dates.
5. Click Submit.
Note: Caution should be used when using this utility. Make sure you have a backup of thedata before you proceed.
The Submit Repository Maintenance Job pane opens.
6. Enter a date and time for the maintenance job to be executed. Click Submit.
A Deferred Execution pane opens confirming your request.
2. Configuring and Administering Resource Management
Resource Analyzer Administrator's and User's Manual 63

Procedure: How to View a List of Scheduled Maintenance Jobs
1. Launch the Web Console.
2. Click the Resource Management option on the sidebar.
3. On the ribbon, in the Repository group, click Maintenance and then click View jobs.
or
From the navigation pane, right-click Resource Management, point to Maintenance, andclick View jobs.
The list of jobs opens, as shown in the following image.
4. To delete any of the scheduled maintenance jobs, select the check box next to the job youwant to delete, and click Delete Selected.
Reconfiguring the Repository
This option allows you to convert the repository from either FOCUS to Relational or Relationalto Relational. Before starting the reconfiguration process, you must create an adapterconnection that points to the location of the new repository.
Procedure: How to Reconfigure the Repository
1. Launch the Web Console.
2. Click the Resource Management option on the sidebar.
3. On the ribbon, in the Repository group, click Reconfigure and then click Create new SQLrepository.
Administering Resource Management From the Web Console
64 Information Builders
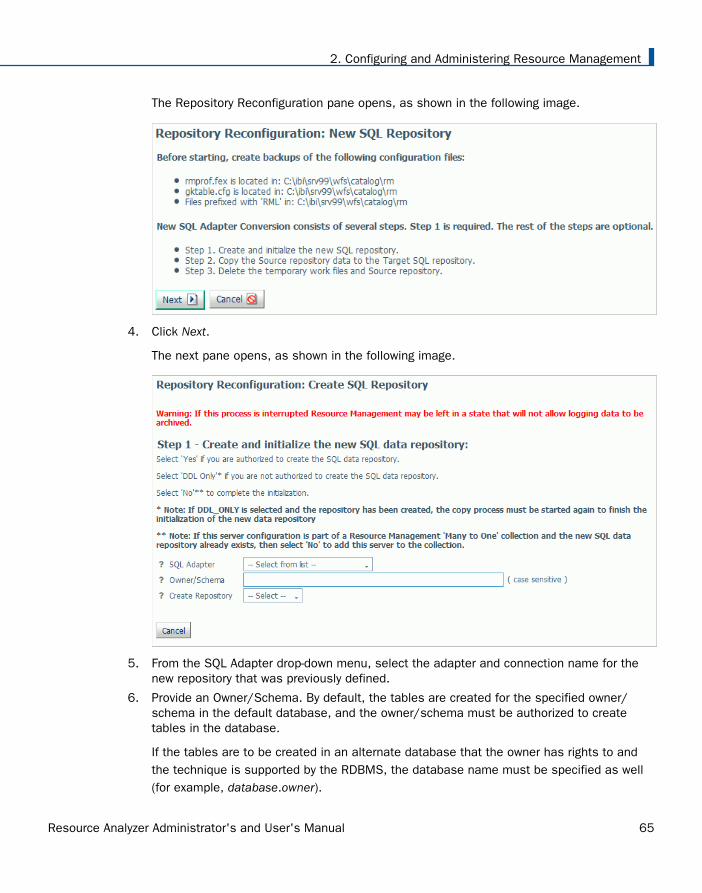
The Repository Reconfiguration pane opens, as shown in the following image.
4. Click Next.
The next pane opens, as shown in the following image.
5. From the SQL Adapter drop-down menu, select the adapter and connection name for thenew repository that was previously defined.
6. Provide an Owner/Schema. By default, the tables are created for the specified owner/schema in the default database, and the owner/schema must be authorized to createtables in the database.
If the tables are to be created in an alternate database that the owner has rights to andthe technique is supported by the RDBMS, the database name must be specified as well(for example, database.owner).
2. Configuring and Administering Resource Management
Resource Analyzer Administrator's and User's Manual 65

7. From the Create Repository drop-down menu, select Yes, unless the repository has alreadybeen created using the native Data Definition Language (DDL) of the data adapter or youare reconfiguring a many-to-one environment.
When No is selected, the configuration process will not issue DROP TABLE, DROP INDEX,CREATE FILE, and CREATE INDEX commands. Because the configuration process willalways initialize the repository with default data and issue the default GRANTS, therepository must exist when the commands are executed or the configuration will fail.
If you are not authorized to create the SQL data repository, select DDL Only.
8. Click Next.
The Submit Job pane opens, as shown in the following image.
9. From the Copy data drop-down menu, select Yes.
Administering Resource Management From the Web Console
66 Information Builders

Once you select Yes, you can select a date range to copy data in smaller portions, insteadof all at once, using the calendar fields provided.
10. Click Copy data.
Once the data has been copied, a Deferred Execution pane opens showing the request.
Procedure: How to Submit a Reconfiguration Job
Once you have created and initialized a SQL data repository, you can resubmit a copy job. Thisis done if there were any errors during the initial copy job, if the job did not run to completion,or if you want to select a different data range to copy. To submit a new job:
1. Launch the Web Console.
2. Click the Resource Management option on the sidebar.
3. On the ribbon, in the Repository group, click Reconfigure, and then click Copy Data.
or
From the navigation pane, right-click Resource Management, point to Reconfigure, andthen click Copy Data.
The Repository Reconfiguration: Copy Data pane opens.
4. Specify the date range for the repository copy job.
5. Click Submit job.
Once the data has been copied, a Deferred Execution pane opens showing the request.
2. Configuring and Administering Resource Management
Resource Analyzer Administrator's and User's Manual 67

Procedure: How to View a Reconfiguration Job
1. Launch the Web Console.
2. Click the Resource Management option on the sidebar.
3. On the ribbon, in the Repository group, click Reconfigure, and then click View jobs.
or
From the navigation pane, right-click Resource Management, point to Reconfigure, andthen click View jobs.
The Deferred List pane opens, as shown in the following image.
If you right-click an item in the Defer ID column, the following options are available:
Get. Opens the output of the selected item.
Download. Saves the selected log to your Downloads folder. In Windows, the defaultlocation of this folder is C:\users\username\Downloads.
Delete. Deletes the selected item.
Procedure: How to Delete Work Files
Once new repository and support files are created, you can delete temporary and old repositorywork files. To delete these files:
1. Launch the Web Console.
2. Click the Resource Management option on the sidebar.
3. On the ribbon, in the Repository group, click Reconfigure, and then click Delete work files.
or
From the navigation pane, right-click Resource Management, point to Reconfigure, andthen click Delete work files.
Administering Resource Management From the Web Console
68 Information Builders

The Repository Reconfiguration: Delete work files pane opens, as shown in the followingimage.
4. Click Delete.
5. Click OK to confirm the deletion.
The Repository Statistics pane opens, as shown in the following image.
Migration
For more information on how to migrate Resource Management, see Migrating the ResourceManagement Repository on page 98
2. Configuring and Administering Resource Management
Resource Analyzer Administrator's and User's Manual 69

Configuration Maintenance
The Configuration command has the following options:
Properties
Configure Application Path
Change License Key
Delete Configuration
These give the administrator the option to see current configuration settings, as well aschange the viewable application directories, change a license key, and remove the currentResource Management configuration.
Resource Management Properties
Setting monitor properties enables you to select global settings and the component levels tobe monitored. Components are split into two categories, Procedure and Command. Theinformation that Resource Analyzer monitors is stored in the Usage Monitoring tables. Thedefault setting for Global Data Request monitoring is Off and the default setting for ComponentLevel is Command. Session records are always captured.
Procedure: How to View Resource Management Properties
To view Resource Management Properties:
1. Launch the Web Console.
2. Click the Resource Management option on the sidebar.
3. On the ribbon, in the Configuration group, click Configuration, point to Properties, and thenclick General.
or
From the navigation pane, right-click Resource Management, point to Configuration, then toProperties, and then click General.
Administering Resource Management From the Web Console
70 Information Builders

The Resource Management Properties pane opens, as shown in the following image.
The Resource Management Properties pane shows the following fields:
Configured
The date that Resource Management was configured or reconfigured.
Configuration TypeThe product that is currently configured to Resource Management. Depending onwhich license key was used, the configuration type will be Resource Analyzer,Resource Governor, or Resource Analyzer Resource Governor.
Repository Type
The repository that is being used.
Data Adapter Connection
The data adapter connection of the current configuration.
2. Configuring and Administering Resource Management
Resource Analyzer Administrator's and User's Manual 71

Owner/schema
The owner/schema name for the relational adapter that Resource Analyzer will use tocreate the repository tables.
Global Data Request monitoring
Indicates whether Data Request Monitoring is on or off. When Global Data RequestMonitoring is enabled, or set to On, Resource Analyzer collects information on all SQLSELECT and FOCUS TABLE, TABLEF, MATCH, GRAPH, MODIFY, and MAINTAINrequests. The default value is Off. Monitoring will be done by individually selected datasources.
Procedure Request Monitoring
Indicates the level of Procedure Request Monitoring.
WebFOCUS System Procedure MonitoringDetermines whether WebFOCUS internal system procedures will be monitored. Thedefault setting is Off.
Data Sources monitored
The number of application data sources and relational pass-thru data sources thathave been enabled for monitoring. This will show Global monitor enabled if DataRequest Monitoring is on. See the Global Settings section below for more information.
Data Sources not monitored
The number of application data sources and relational pass-thru data sources thathave been disabled by setting the monitoring setting to OFF.
Excluded Procedure count
The number of procedures that have been excluded from monitoring.
Last Maintenance Date
The date the repository was modified using the Repository Maintenance pane.
Last Repository Update
The last time the repository updated to include data from a log file.
Procedure: How to Set Monitor Properties
To set Resource Management Properties:
1. Launch the Web Console.
2. Click the Resource Management option on the sidebar.
Administering Resource Management From the Web Console
72 Information Builders

3. On the ribbon, in the Configuration group, click Configuration, point to Properties, and clickMonitoring.
or
From the navigation pane, right-click Resource Management, point to Configuration, then toProperties, and then click Monitoring.
The Monitoring Properties pane opens, as shown in the following image.
The Resource Management Monitoring Properties pane has the following options:
Data Request Monitoring
Indicates whether Data Request Monitoring is on or off. When Global Data RequestMonitoring is enabled, or set to On, Resource Analyzer collects information on all SQLSELECT and FOCUS TABLE, TABLEF, MATCH, GRAPH, MODIFY, and MAINTAINrequests. The default value is Off. Monitoring will be done by individually selected datasources.
Procedure Request Monitoring
Indicates the level of Procedure Request Monitoring. The following options areavailable:
Execute and INCLUDE. All executed procedures and any procedure that used -INCLUDE will be monitored. This is the default value.
Execute only. Any procedure that is executed using EX or EXEC will be monitored.
Primary Execute only. The only procedure monitored will be the primary procedure.Any procedure executed from within the primary (-INCLUDE or EX) will not bemonitored.
WebFOCUS System Procedure MonitoringDetermines whether WebFOCUS internal system procedures will be monitored. Thedefault setting is Off.
2. Configuring and Administering Resource Management
Resource Analyzer Administrator's and User's Manual 73

4. Select the monitoring properties desired.
5. Click Update.
Procedure: How to Set Repository Properties
The amount of data stored in the repository can be controlled by selecting the record typeslogged for each connected session. Collecting all of the records can give a complete overviewof what each connected user is doing and is a good first step in determining what resourcesare being consumed and which procedures, data sources, and fields are being used and bywhom. But collecting everything can stress the data repository, whether a FOCUS or RelationalDatabase Management system is being used. Some of the tables are more geared towardsthe Resource Governor feature and others are used just for the Resource Analyzer feature. TheFunctions and WHERE/IF records are mainly used by the Resource Governor, but there areseveral reports in Resource Analyzer that will report on that data as well. From the WebConsole Resource Management tab you have the option to add or remove any record type fromthe logging process using the Configuration/Properties/Repository menu in the Web Consoleribbon or the Resource Management node on the tree.
To set Resource Management Repository Properties:
1. Launch the Web Console.
2. Click the Resource Management option on the sidebar.
3. On the ribbon, in the Configuration group, click Configuration, point to Properties, and thenclick Repository.
or
From the navigation pane, right-click Resource Management, point to Configuration, then toProperties, and then click Repository.
Administering Resource Management From the Web Console
74 Information Builders

The Repository Properties pane opens. The pane, as shown in the image below, shows thedefault record types collected. You can enable or disable any items on the pane to controlwhen they are to be collected. Some records are required for others to be collected, so byselecting one record, it may cause dependent records to be selected automatically.
2. Configuring and Administering Resource Management
Resource Analyzer Administrator's and User's Manual 75

By default all procedures (focexec or SQL Stored Procedure) are monitored unless theProcedure requests log record has been disabled or the procedure has been removed frommonitoring using the Remove Procedures from Monitor pane. By default, no data requestsare collected unless one or more Data Requests log record types are selected and eitherGlobal Monitoring is enabled or at least one data source has been enabled for monitoringusing the Add Data Sources to Monitor pane for each application folder. Also, theapplication must have Monitoring enabled in the Application properties pane.
Note: The All Data option in Release 7.6 also collects SORT and Functions. In Release7.7, SORT has been included in Fields, and Functions has its own dialog box.
The Commands option in Release 7.7 also collects information about remote requestsfrom a HUB-SUB configuration.
Resource Management will always collect session records and this feature cannot beturned off.
By default, command records (for example, a TABLE command being issued) will also becollected for a data resource that is not being monitored.
The following table shows the relationship between the Repository Properties and the logrecord types, as well as the corresponding repository entries.
RepositoryProperty
Record Type Repository Location Comments
Procedure Requests
Procedure RLFX SMRPCS Each Procedure (for example, FOCEXEC orSQL Stored Procedure) executed will cause aRLFX record to be collected.
RLFW SMRPCWF The RLFW record will only be collected if thesession was started by a connection fromthe WebFOCUS Client or WebFOCUS self-service application. The RLFW record isadded to the SMRPCWF table or segment.Only one RLFW record will be collected forthe primary procedure, but several RLFX maybe collected for a session.
Administering Resource Management From the Web Console
76 Information Builders

RepositoryProperty
Record Type Repository Location Comments
Procedurestatements andparameters
RLFC SMRPCREQUESTS(table)
SMRPCSCMD(segment)
Contains the EX statement and theparameters or the -INCLUDE record. Theactual command is executed. The RLFCrecords are collected if enabled and theProcedures are being collected.
Data Requests
RLCD SMQUERY These settings allow for the customization ofcommand data to be collected. The RLCDrecord is collected and added to theSMQUERY table or segment. Each datarequest (for example, TABLE FILE… or SQLSELECT…) executed will cause a RLCDrecord to be collected. The RLCD cangenerate two additional child records, RLDG(Governor) and RLDE (request usingSUFFIX=EDA data source). These tworecords cannot be disabled and will alwaysbe collected if generated.
RLDG SMGOVERN (table)
SMGOVEND (segment)
RLDE SMREMOTES (table)
SMRMTS (segment)
Data Request Details
RequestStatements
RLCC SMRPCREQUESTS(table)
SMCMDLN (segment)
Contains the complete request. Forexample, TABLE FILE CAR PRINT CAR END.
Functions RLDU SMFUNCTIONS (table)
SMFNCTNS (segment)
Data about aggregate functions used onfields. There is one record for each functionused containing the aggregation functionused and the field it was used on.
2. Configuring and Administering Resource Management
Resource Analyzer Administrator's and User's Manual 77

RepositoryProperty
Record Type Repository Location Comments
WHERE/IF RLDR SMRELATIONS (table)
SMRELTNS (segment)
Data on the Relational tests used in arequest, such as the operator, literals, ordate and time values used. There is onerecord for each WHERE/IF/AND/OR andeach record contains the right and/or leftdata source and field used. It also has theliteral, if one was used on the left or right-hand side of the clause, and otherinformation pertinent to a relational testclause.
Data Sources RLDS SMFROMS The Master File Description/Synonym nameor RDBMS table or tables used in a request.There is one record for each data sourceused in a request. This includes cross-referenced data sources or data sourcesjoined using the JOIN or COMBINEcommand.
Field RLDF SMCOLUMNS (table)
SMCOLMNS (segment)
The fields used, the type of field, andwhether it was used in a sort or group in arequest. There is one record for each fieldselected to return data in the request or in aBY or ORDER BY/GROUP BY statement. Thisrecord is not collected for fields used infunctions or relational tests.
Fields used byReference
RLDF SMCOLUMNS (table)
SMCOLMNS (segment)
Information about any DEFINE fields used orreferenced in a request. The Fields used byReference are indicated when the SMDEFINEfield is set to 5 (Referenced). Referencedfields are fields that are used in a DEFINE inthe MFD, DEFINE FILE, or COMPUTEstatement to create a virtual field, and thevirtual field is used in the request.
Audit Records
Administering Resource Management From the Web Console
78 Information Builders

RepositoryProperty
Record Type Repository Location Comments
Translations RLAU SMAUDIT Contains the translated request iftranslation is required. If a WebFOCUSTABLE request is for a relational datasource, the translated SQL, which is sent tothe RDBMS, will be monitored. The RLAUrecords are collected if enabled and the datarequest statements are being collected.
Messages RLAU SMAUDIT Messages that are issued during theprocessing of a request will be monitored.
Access Control RLAU SMAUDIT Information about the changes to serverconfiguration files, applications, and files.The data shows the timestamp, the user IDof who made the change, and the TCPaddress the change originated.
The following table shows the comparisons between the Monitoring settings in 7.6, andearlier releases, and the Command Log Records settings in Release 7.7.
Release 7.6 Release 7.7
Monitoring Settings Command Log Records
All Data Select all
Query, Froms, Relations, and Columns Commands, Request, Data Sources,WHERE/IF, and Fields
Query, Froms, and Relations Commands, Request, Data Sources, andWHERE/IF
Query and Froms Commands, Request, and Data Sources
Query only Commands and Requests
4. Click Update.
2. Configuring and Administering Resource Management
Resource Analyzer Administrator's and User's Manual 79

Configuring Application Paths
You can configure the application path to set the viewable directories for Resource Analyzer.
Procedure: How to Configure an Application Path
1. Launch the Web Console.
2. Click the Resource Management option on the sidebar.
3. On the ribbon, in the Configuration group, click Configuration and then click ConfigureApplication Path.
or
From the navigation pane, right-click Resource Management, point to Configuration, andclick Configure Application Path.
The Application Path Configuration pane opens, as shown in the following image.
4. To add or remove a directory from the application path, right-click the application and clickAdd to Path or Remove from Path, respectively.
5. Click Save when finished.
Refresh the navigation pane to see the newly added or removed directory.
Administering Resource Management From the Web Console
80 Information Builders

Migrating Resource Management
For more information on how to migrate Resource Management, see Migrating the ResourceManagement Repository on page 98.
Working With License Keys
A license key is required to run Resource Analyzer. You can change the license key you areusing from within Resource Management at any time.
Procedure: How to Change the License Key
1. Launch the Web Console.
2. Click the Resource Management option on the sidebar.
3. On the ribbon, in the Configuration group, click Configuration and then click ChangeLicense Key.
or
From the navigation pane, right-click Resource Management, point to Configuration, andclick Change License Key.
The Resource Management Configuration pane opens showing your current license.
4. Enter the new license into the License field and click Save.
Removing Resource Management
You can remove Resource Management from the server from the Resource ManagementConfiguration pane. This is required if you want to change the repository type from FOCUS torelational, or relational to FOCUS.
Procedure: How to Remove Resource Management
1. Launch the Web Console.
2. Click the Resource Management option on the sidebar.
3. On the ribbon, in the Configuration group, click Configuration and click DeleteConfiguration.
or
From the navigation pane, right-click Resource Management, point to Configuration, andclick Delete Configuration.
The Delete Configuration pane opens.
2. Configuring and Administering Resource Management
Resource Analyzer Administrator's and User's Manual 81

4. Click Delete to remove Resource Management from the server. All system files and therepository will be removed from the server.
Working With Application Directories
When you right-click an application directory, a context menu is available, as shown in thefollowing image.
The following sections provide detailed explanations for each option in this context menu.
Monitoring at the Application Level
Monitoring Data Sources can be set at the application level to monitor all data sources or atthe individual level.
Note: Monitoring at the individual data source level will take precedence over the applicationlevel. For more information, see Monitoring Individual Data Sources on page 85.
Procedure: How to View Application Name Properties
1. Launch the Web Console.
2. Click the Resource Management option on the sidebar.
3. Expand the Application Directories folder in the tree.
4. To view the data source properties, right-click an application directory and click Properties.
Administering Resource Management From the Web Console
82 Information Builders

The Properties for Application pane opens, as shown in the following image.
The Application pane has the following fields/options:
First Used
Is the date the application was first accessed.
Last Used
Is the date the application was last accessed.
Data Sources
Monitor On
The number of data sources with monitoring on.
Monitor Off
The number of data sources with monitoring off.
Not Monitored
The number of data sources not being monitored.
Total
The total number of data sources in the selected application directory.
2. Configuring and Administering Resource Management
Resource Analyzer Administrator's and User's Manual 83

Procedures
Monitor On
The number of procedures with monitoring on.
Monitor Off
The number of procedures with monitoring off.
Total
The total number of procedures in the selected application directory.
Monitor Status
For more information on setting monitor status, see How to Set Monitor Status at theApplication Level on page 84.
Note: The samples application directory ibisamp, created at product installation, hasmonitoring turned off, by default.
Procedure: How to Set Monitor Status at the Application Level
Data sources in an application can have monitoring turned on or off at the application level.When On is selected, the Usage Monitor will collect information about all requests for all datasources in the application. When Off is selected, no monitored data for data sources in theapplication is collected.
If Application monitoring has never been used, the Monitor Status will be Not Set. This is thedefault value.
To set monitor status for an application:
1. Launch the Web Console.
2. Click the Resource Management option on the sidebar.
3. Expand an application directory in the tree.
4. To view the Application properties, right-click an application name and click the Propertiesoption from the context menu.
The Properties for Application pane opens.
5. Select the monitoring status you want to use from the Monitor Status drop-down menu.The options are:
Not Set. This is the same as Off and is the default. The status will not be shown in thenavigation tree when viewing data sources.
Administering Resource Management From the Web Console
84 Information Builders

On. Turns monitoring for the application on and can be seen in the navigation treewhen viewing the Application list.
Off. Turns monitoring for the application off and can be seen in the navigation treewhen viewing the Application list.
Monitoring Individual Data Sources
When you right-click an application directory and point to Manage monitoring, a context menu isavailable, as shown in the following image.
Procedure: How to Monitor Individual Data Sources
Data sources must be monitored to provide monitor data, which can then be used to analyzeperformance.
1. Launch the Web Console.
2. Click the Resource Management option on the sidebar.
3. Right-click an application directory in the navigation pane, point to Manage monitoring, andclick Add Data Sources for monitoring.
2. Configuring and Administering Resource Management
Resource Analyzer Administrator's and User's Manual 85

The Add Data Sources for monitoring pane opens to display all synonyms in the selectedapplication directory, as shown in the following image.
4. Select the check boxes for the data sources you want to monitor, or select the Select Allcheck box next to the Data Source Name column to select all of the data sources listed.
5. Click Add.
The Add Data Sources for monitoring - Status pane opens displaying the selected datasources with monitoring enabled, as shown in the following image.
Administering Resource Management From the Web Console
86 Information Builders

6. Click the Close button.
The data sources you selected now appear in the tree, as shown in the following image.
Procedure: How to Remove a Monitored Data Source From Being Monitored
You can remove a data source from being monitored as follows.
1. Launch the Web Console.
2. Click the Resource Management option on the sidebar.
3. Right-click an application directory in the navigation pane, point to Manage monitoring, andclick Remove Data Sources from monitoring.
A list of available data sources opens.
4. Select the data sources that you want to remove from monitoring or select the Select Allcheck box next to the Data Source Name column, and click Remove.
The Remove Data Sources from monitoring - Status pane opens, confirming that theselected data source was removed.
5. Click Close.
Procedure: How to Remove a Procedure From Being Monitored
By default, all application data source procedures are monitored. You can remove a procedurefrom being monitored as follows.
1. Launch the Web Console.
2. Click the Resource Management option on the sidebar.
3. Right-click an application directory in the navigation pane, point to Manage monitoring, andclick Remove Procedures from monitoring.
2. Configuring and Administering Resource Management
Resource Analyzer Administrator's and User's Manual 87

A list of available procedures opens.
4. Select the procedures that you want to remove from monitoring or select the Select Allcheck box next to the Procedure Name column, and click Remove.
The Remove Procedures from monitoring - Status pane opens, confirming that the selectedprocedure was removed.
5. Click Close.
Procedure: How to Monitor Procedures
To have the ability to add procedures, they will need to be removed from monitoring first. Formore details, see How to Remove a Procedure From Being Monitored on page 87.
1. Launch the Web Console.
2. Click the Resource Management option on the sidebar.
3. Right-click an application directory in the navigation pane, point to Manage monitoring, andclick Add Procedures for monitoring.
The Add Procedures to monitoring pane opens to display all procedures in the selectedapplication directory, as shown in the following image.
4. Select the check boxes for the procedures you want to monitor, or select the Select Allcheck box next to the Procedure Name column to select all of the procedures listed.
Administering Resource Management From the Web Console
88 Information Builders

5. Click Add.
The Add Procedures to monitoring - Status pane opens displaying the selected procedureswith monitoring enabled, as shown in the following image.
6. Click the Close button.
Monitoring Relational Adapters
When you right-click a relational adapter folder, a context menu appears, as shown in thefollowing image.
The following sections provide detailed explanations for each option in this context menu.
Relational Adapter Properties
Procedure: How to View Relational Adapter Properties
1. Launch the Web Console.
2. Configuring and Administering Resource Management
Resource Analyzer Administrator's and User's Manual 89

2. Click the Resource Management option on the sidebar.
3. Expand the Relational Adapters folder.
4. Right-click a relational adapter directory in the tree and select Properties.
5. Select a connection name from the Connection Name drop-down menu.
Note: If there is only one connection name available, the properties for that connection willbe shown immediately.
The Properties for Relational Adapter pane opens for the selected connection, as shown inthe following image.
The Properties for Relational Adapter pane has the following fields/options:
Connection Name
Allows you to select the connection name from the drop-down menu.
First Used
Is the date the relational adapter was first accessed.
Last Used
Is the date the relational adapter was last accessed.
Administering Resource Management From the Web Console
90 Information Builders

Data Sources
Monitored
The number of data sources with monitoring on.
Monitor Off
The number of data sources with monitoring off.
Not Monitored
The number of data sources not being monitored.
Total
The total number of data sources in the selected application directory.
Procedures
Monitor Off
The number of procedures with monitoring off.
Total
The total number of procedures in the selected application directory.
Monitoring Relational Data Adapter Sources
When you right-click a relational adapter and point to Manage monitoring, a context menu isavailable, as shown in the following image.
In the example shown, MS SQL Server ODBC is the adapter selected for relational sourcemonitoring.
2. Configuring and Administering Resource Management
Resource Analyzer Administrator's and User's Manual 91
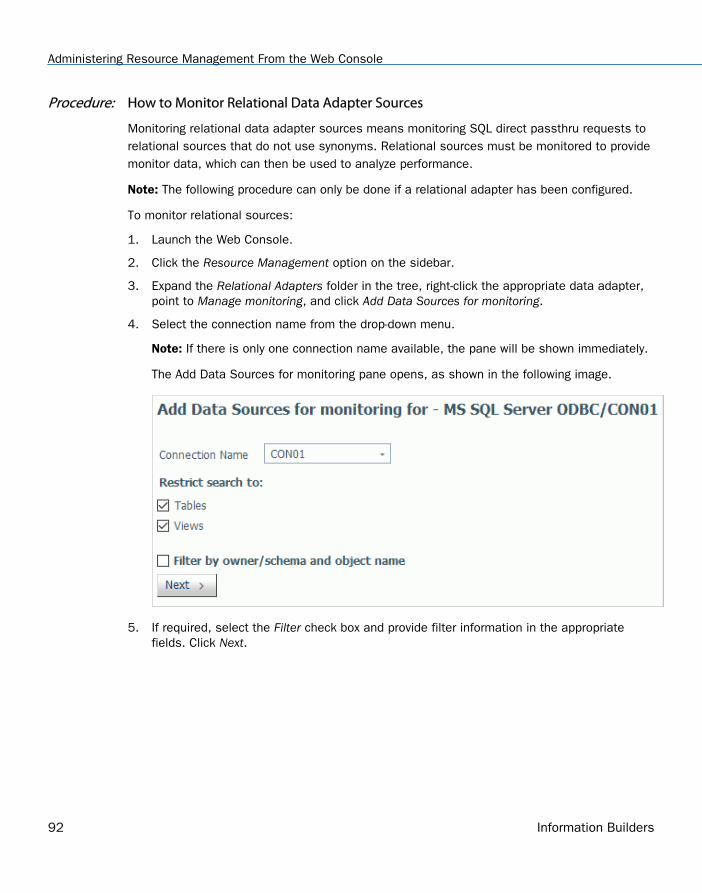
Procedure: How to Monitor Relational Data Adapter Sources
Monitoring relational data adapter sources means monitoring SQL direct passthru requests torelational sources that do not use synonyms. Relational sources must be monitored to providemonitor data, which can then be used to analyze performance.
Note: The following procedure can only be done if a relational adapter has been configured.
To monitor relational sources:
1. Launch the Web Console.
2. Click the Resource Management option on the sidebar.
3. Expand the Relational Adapters folder in the tree, right-click the appropriate data adapter,point to Manage monitoring, and click Add Data Sources for monitoring.
4. Select the connection name from the drop-down menu.
Note: If there is only one connection name available, the pane will be shown immediately.
The Add Data Sources for monitoring pane opens, as shown in the following image.
5. If required, select the Filter check box and provide filter information in the appropriatefields. Click Next.
Administering Resource Management From the Web Console
92 Information Builders

The Add Data Sources for monitoring pane opens for the connection, as shown in thefollowing image.
6. Select the check boxes for the data sources you want to monitor, or select the Select Allcheck box next to the Data Source column to select all of the data sources listed.
7. From the Monitor As column, select one of the following options from the drop-down menu:
Table. Monitor the data source using the one part name.
Owner.Table. Monitor the data source using the two part name. This is the defaultvalue.
Both. Monitor the data source using both the one part and two part names.
8. Click Add.
The Add Data Sources pane reopens displaying the selected data sources with monitoringenabled.
9. Click OK to close the confirmation dialog box.
10. Click Close. The relational data sources you selected now appear in the tree under theadapter/connection folder.
Procedure: How to Remove a Data Source for a Relational Adapter From Being Monitored
You can remove a data source from being monitored as follows.
1. Launch the Web Console.
2. Click the Resource Management option on the sidebar.
2. Configuring and Administering Resource Management
Resource Analyzer Administrator's and User's Manual 93

3. Right-click a relational adapter directory, point to Manage monitoring, and click RemoveData Sources from monitoring.
The Remove Data Sources from monitoring pane opens.
4. Select the connection name from the drop-down menu.
5. If required, select the Filter check box and provide filter information in the appropriatefields. Click Next.
The Remove Data Sources pane opens.
6. Select the check boxes for the data sources you want to remove, or select the Select Allcheck box next to the Data Source column to select all of the data sources listed. ClickRemove.
The Remove Data Sources pane reopens, displaying the data sources that were removed.
7. Click OK to close the confirmation dialog box.
8. Click Close.
Procedure: How to Remove a Procedure for a Relational Adapter From Being Monitored
By default, all relational procedures are monitored. You can remove a procedure from beingmonitored as follows.
1. Launch the Web Console.
2. Click the Resource Management option on the sidebar.
3. Right-click a relational adapter directory, point to Manage monitoring, and click RemoveProcedures from monitoring.
The Remove Stored Procedures from monitoring pane opens, as shown in the followingimage.
4. Select the connection name from the drop-down menu.
5. If required, select the Filter check box and provide filter information in the appropriatefields. Click Next.
Administering Resource Management From the Web Console
94 Information Builders

The Remove Stored Procedures from monitoring pane opens, showing the list of availableprocedures.
6. Select the procedures you want to remove from monitoring, and click Remove.
The Remove Procedures from Monitor - Status pane opens, confirming that the selectedprocedure was removed.
7. Click OK to close the confirmation dialog box.
8. Click Close.
Procedure: How to Monitor Procedures
To have the ability to add procedures, they will need to be removed from monitoring first. Formore details, see How to Remove a Procedure for a Relational Adapter From Being Monitoredon page 94.
1. Launch the Web Console.
2. Click the Resource Management option on the sidebar.
3. Right-click a relational adapter directory in the navigation pane, point to Managemonitoring, and click Add Procedures for monitoring.
The Add Stored Procedures to monitoring pane opens.
4. Select the connection name from the drop-down menu.
5. If required, select the Filter check box and provide filter information in the appropriatefields. Click Next.
6. Select the check boxes for the procedures you want to monitor, or select the Select Allcheck box next to the Stored Procedure column to select all of the listed procedures.
7. Click Add.
The Add Stored Procedure for monitoring pane opens displaying the selected procedureswith monitoring enabled, as shown in the following image.
8. Click OK to close the confirmation dialog box.
2. Configuring and Administering Resource Management
Resource Analyzer Administrator's and User's Manual 95

9. Click the Close button.
Monitoring at the Data Service Level
When you expand the Data Services folder in the navigation pane, the data services availableon the server are listed. An example is shown in the following image.
Procedure: How to Disable Monitoring on Data Services
All defined Data Services are displayed in the Resource Management navigation pane.
By default, all Data Services are monitored. To disable monitoring:
1. Launch the Web Console.
2. Click the Resource Management option on the sidebar.
3. Expand the Data Services folder.
4. Right-click the Data Service you wish to disable and click Properties.
The Data Services Properties pane opens, as shown in the following image.
5. Select OFF from the Monitor drop-down menu.
Administering Resource Management From the Web Console
96 Information Builders

6. Click Update.
A confirmation dialog box opens.
7. Click OK.
The Data Services node in the navigation pane now shows the Data Service withmonitoring disabled, as shown in the following image.
Procedure: How to Enable Monitoring on Data Services
All defined Data Services are displayed in the Resource Management navigation pane.
To enable monitoring on a Data Service that was previously disabled:
1. Launch the Web Console.
2. Click the Resource Management option on the sidebar.
3. Expand the Data Services folder.
4. Right-click the disabled Data Service you wish to enable and click Properties.
The Data Services Properties pane opens.
5. Select ON from the Monitor drop-down menu.
6. Click Update.
A confirmation dialog box opens.
7. Click OK.
The Data Services node in the navigation pane now shows the Data Service withmonitoring enabled.
2. Configuring and Administering Resource Management
Resource Analyzer Administrator's and User's Manual 97
Migrating the Resource Management Repository
If you want to access monitor data from a previous release when upgrading Resource Analyzer,you must migrate the previous Resource Management repository contents into the new releaserepository.
Requirements for Migrating the Resource Management Repository
The following conditions are required to migrate the Resource Management repository.
Monitoring must be turned off on both the host and target server before running themigration procedure. Also, the host log file must be archived to the repository before it ismigrated to the new repository.
To turn off monitoring, use the server Web Console to Disable Monitoring & Governing. Ifyou turn monitoring back on and continue to monitor in the old release, you must re-run themigration in order to migrate the newly monitored data.
When migrating monitor data stored in FOCUS, the tables must be available duringmigration. No actively running sink machine (SU) process is recommended or required.
When migrating monitor data stored in a relational repository, an appropriate databaseadapter must be configured with a connection pointing to the data from the prior release. Ifthe new relational repository is to be stored in the same location as the old data,appropriate values for owner, creator, and so on must be used to differentiate the two setsof data.
For both relational and FOCUS migration, the repository tables in the old release locationsremain where they were and can be used as backup.
Note: When you run the migration more than once, which is necessary if you continuedmonitoring in the old release after migration and want the newly monitored data to bemigrated, you will get a duplicate record error message. The duplicates are ignored and thenew records are added.
Migrating a Resource Management Repository for a New Server Install
You can migrate a Resource Management repository on UNIX, Windows, UNIX SystemServices, and IBM i for a new server install. For these platforms, the migration procedure isexecuted in a Web Console session.
Note: IBM i was formerly known as i5/OS.
Migrating the Resource Management Repository
98 Information Builders

Procedure: How to Migrate a Resource Management Repository for a New Server Install
To start the migration job:
1. Click the Resource Management option in the sidebar.
2. On the ribbon, in the Repository group, click Migration and click Migrate old release.
or
From the navigation pane, right-click Resource Management, point to Migration, and thenclick Migrate old release.
Note: You can also perform this task by clicking the Workspace option in the sidebar, right-clicking Workspace in the navigation pane, and clicking Migrate.
3. The Repository Migration page opens, as shown in the following image.
4. From the drop-down menu, select the release number from which you are migrating.Options include 7703, 7704, 7705, and 7706.
5. For all releases, you must enter the path to the EDACONF directory of the release beingmigrated. Examples are C:\ibi\srv77\wfs for Windows and /home1/ibi/srv77/wfs forUNIX.
6. Enter the path to the EDAHOME directory of the release being migrated. Examples are C:\ibi\srv77\home for Windows and /home1/ibi/srv77/home for UNIX.
Note: This is only required if the old release is Version 7.7.03.
7. Click Next.
2. Configuring and Administering Resource Management
Resource Analyzer Administrator's and User's Manual 99

The Resource Management Migration: Submit Migration Job pane opens, as shown in thefollowing image.
Migrating the Resource Management Repository
100 Information Builders

8. From the System Database Migrate drop-down menu, select Yes if you want to migrate theold release system database. If you select Yes, additional options become available, asshown in the following image.
The additional Configuration data options are:
Log record preferencesSelect Yes to migrate the old release log record preference settings to the systemrepository of the current server. Migrating this data will cause any existing log recordpreference data to be replaced with the data from the old release.
Logging PropertiesSelect Yes to migrate the old release logging property settings to the systemrepository of the current server. Migrating this data will cause any existing loggingproperties data to be replaced with the data from the old release.
9. From the Data Repository Migrate drop-down menu, select Yes if the previous release datarepository should be migrated. If Yes is selected, SMCNTRL, SMPRMTRS, and SMPRL datawill be migrated. The default value is No.
2. Configuring and Administering Resource Management
Resource Analyzer Administrator's and User's Manual 101

If you select Yes, additional options become available, as shown in the following image.
The additional options let you migrate data in smaller portions, instead of all at once. Theavailable options are:
Start DateThe starting date of the data to be migrated. The default value is the earliest date inthe old repository.
End DateThe ending date of the data to be migrated. The default value is the latest date in theold repository.
10. Accept the default dates, or enter a specific date that you want the migration to run.
11. Click Submit Job. A confirmation of the request appears, stating that the deferredexecution request is in the queue.
12. On the ribbon, in the Repository group, click Migration and then click View jobs.
or
From the navigation pane, right-click Resource Management, point to Migration, and clickView jobs.
The Deferred List pane opens, displaying the list of deferred requests, and showing therequest name that was displayed when the deferred migration job was scheduled.Examples of request names are listed in the Defer ID column, as seen in the followingimage.
Migrating the Resource Management Repository
102 Information Builders

The Status column shows the state of the deferred request, which can be Queued,Executing, or Ready. To see if the status has changed to Ready, either keep refreshing thepage using the refresh options located at the top of the page, or redisplay the page at alater time. Once the status is Ready, right-click the request line and click Get to review thejob output.
13. You can choose whether to remove the old configuration files or perform this action in thefuture.
On the ribbon, in the Repository group, click Migration and then click Delete work files.
or
From the navigation pane, right-click Resource Management point to Migration, and clickDelete work files.
a. Click Delete and then OK to confirm.
Note: Once you choose to remove the old configuration files, the option to migrate datawill no longer be available.
Migrating a Resource Management Repository After a Server Refresh
You can migrate a Resource Management repository on UNIX, Windows, UNIX SystemServices, and IBM i after a server refresh. The migration information described below is onlyapplicable if the server environment has been upgraded by performing the refresh option duringthe installation process. To refresh the server, follow the instructions in the Installation Guidefor your platform.
Migration Usage Notes:
The migration process must be applied to the original server that was refreshed. If a cloneserver was set up and the Resource Management repository was copied to this server forthe purpose of testing, the migration process will not work. There are inter-dependencies inthe Resource Analyzer repository data based on the machine name and port number usedwhen first configured.
The migration of the Resource Management repository on MVS PDS deployment after arefresh is not supported. A new server environment is required.
Once the refresh process has completed successfully, start the server and then the WebConsole.
The migration is performed from the Web Console and consists of three phases:
Migrate configuration file (Required).
2. Configuring and Administering Resource Management
Resource Analyzer Administrator's and User's Manual 103

Migrate repository (Optional).
Remove old files (Optional).
For these platforms, the migration procedure is executed on a Web Console session.
Note: IBM i was formerly known as i5/OS.
If you start the Web Console session with security ON, a message is displayed, as shown inthe following image.
This message indicates that the structure of the Resource Management repository haschanged. A migration process is required in order to update the existing repository so that newdata columns can be archived to the repository. If the migration process is not run, monitordata will still be collected and archived but without the new data columns.
You can:
Ignore the message contents by closing the message window. The repository will still havethe old structure and the warning message will continue to be shown for a total of 10times, or until the migration process has been performed.
Start the migration process by clicking Continue and then clicking Resource Management.
The Resource Management Migration pane opens. The sequence of panes is slightly differentdepending on the repository type.
Note: If you start the Web Console session with security OFF, you will not see the message asdescribed above. The Resource Management Migration pane will be immediately available afterclicking Resource Management.
Procedure: How to Migrate a Repository After a Server Refresh
The following procedure details the steps for migrating a FOCUS or relational repository after aserver refresh.
1. Click the Resource Management option in the sidebar.
2. For a FOCUS Repository: Phase 1 - Migrate Configuration, the pane opens in Phase 1.
a. Click Reconfigure to complete Phase 1.
Migrating the Resource Management Repository
104 Information Builders

3. For a Relational Repository: Phase 1 - Migrate Configuration, the pane opens in Phase 1.
The options in the Create Repository drop-down menu are Yes, No, and DDL Only.
For Phase 1 - Create Repository Yes:
Select this option if you have DBA authority over the existing Resource Managementrepository tables. New repository tables will be created with a suffix of _nnnn, where nnnnreflects the release number. The process will continue at Phase 2.
a. Select Yes from the Create Repositories drop-down menu. A list of actions that will beperformed is displayed.
b. Click Reconfigure to go to step 4 and begin Phase 2.
For Phase 1 - Create Repository DDL Only:
Select this option if you do not have DBA authority over the existing ResourceManagement repository tables. This option creates a file, rmldb.sql, which containsRDBMS specific DDL.
a. Select DDL Only from the Create Repositories drop-down menu.
b. Click Create DDL. The instructions for the location of the rmldb.sql file are displayed.Give this file to the DBA for processing.
c. Click Exit. You will be returned to the first migration screen. You must create thetables before continuing.
Note: Your DBA must create the new repository tables in the same location as theoriginal 7.7 tables, and both sets of tables have to be accessible on the sameadapter connection on the server. The new tables will have the release numberappended to the name. The format will be tablename_release.
d. Once the repository tables have been created, return to the Web Console and clickResource Management.
e. Go to step 4 to begin Phase 2.
4. Phase 2 - Migrate data, select the Migration data option from the drop-down menu.
The options are Yes or No.
Note:
If you selected DDL Only in the previous step, click Reconfigure.
When returning to this page after selecting DDL Only, the default value is No. Do notselect Yes or an error will occur.
For Phase 2 - Migrate data Yes:
2. Configuring and Administering Resource Management
Resource Analyzer Administrator's and User's Manual 105

Select this option to copy data from the old repository to the new one. When this option isselected, additional options become available.
The additional options let you migrate data in smaller portions, instead of all at once. Theavailable options are:
Start DateThe starting date of the data to be migrated. The default value is the earliest date inthe old repository.
End DateThe ending date of the data to be migrated. The default value is the latest date in theold repository.
a. Click Submit Job to schedule the migration procedure. A confirmation of the requestappears, stating that the deferred execution request is in the queue.
b. Go to step 7.
For Phase 2 - Migrate data No:
Select this option if you do not want data to be copied from the old repository to the newone.
To run the migration process at a later date, select Resource Management on the sidebarand on the ribbon, in the Repository group, click Migration, and click Submit job.
or
From the navigation pane, right-click Resource Management, point to Migration, and clickSubmit job.
The Resource Management Migration: Submit Migration Job pane will open on Phase 2.
a. Click Exit to continue.
b. Optionally, review step 5.
5. To view the Migration Job page if migration was selected, on the ribbon, in the Repositorygroup, click Migration, and then click View job.
or
From the navigation pane, right-click Resource Management, point to Migration, and clickView job.
The Deferred List pane opens.
6. Right-click on the job and click Get to see if there are any FOCUS errors.
7. Phase 3 - Remove old configuration and data files, you can choose whether to removethe old configuration files or perform this action in the future.
Migrating the Resource Management Repository
106 Information Builders

On the ribbon, in the Repository group, click Migration and then click Delete work files.
or
From the navigation pane, right-click Resource Management, point to Migration, and clickDelete work files.
a. Click Delete and then OK to confirm.
Note: Once you choose to remove the old configuration files, the option to migrate datawill no longer be available.
Migrating a Resource Management Repository on MVS
This option is only available when migrating data from a new server install of Release 7.7.Repository migration is not available from earlier releases.
Procedure: How to Migrate a Resource Management Repository on MVS
To start the migration job:
1. Click the Resource Management option in the sidebar.
2. On the ribbon, in the Repository group, click Migration and click Migrate old release.
or
From the navigation pane, right click Resource Management, point to Migration, and thenclick Migrate old release.
3. The Resource Management Migration page opens.
4. To migrate data from the release, use the drop-down menu to select the release numberfrom which you are migrating. The options include 7700-7702, 7703, 7704, 7705, and7706. Depending on the release selected, one or more of the following options will beavailable.
Note: For help in identifying the dataset names required on the next two panes, see thechart in Step 6.
GKTABLE dataset nameThe dataset name of the Resource Management parameter file.
REPOSITORY dataset nameThe dataset name of the FOCUS repository from the previous release.
RMLSYS dataset nameThe dataset that contains Resource Management system information.
2. Configuring and Administering Resource Management
Resource Analyzer Administrator's and User's Manual 107

CONFIGURATION dataset nameFor old release selections of 7703 or 7704, this is the dataset name that containsthe Master File profile members. They are RMLPD773 (7703) or RMLPD774 (7704)and RMLPRFSY (both releases).
5. Click Next to continue.
6. The Submit Migration Job pane opens.
For all other releases, the same pane will show but without the Create 7.6 compatibilitymasters option available. The following options are available:
Migrate system dataSelect Yes if the previous releases system data should be migrated. If Yes is selected,SMCNTRL, SMPRMTRS and SMPRL data will be migrated. Only custom BRL memberswill be migrated. The SMKNBNAME value in SMCNTRL will not be migrated and anyGovern and/or Advise values will be set to OFF. Any compiled rule files must be rebuiltafter the migration is completed, and new Govern and/or Advise values must be set.The default value is No.
For releases 7700 – 7702, 7703 and 7704, if Yes is selected, one or two additionalinput boxes are shown depending on the old release selection.
All of the names in the following chart require QUALIF.servertype as a prefix.
Where servertype can be FFS, WFS, or DM.
Dataset name 7704-7706
GKTABLE CONF.PRF
REPOSITORY** RMLDB.FOCUS
RMLSYS* RMLSYS.FOCUS
CONFIGURATION CONF.CFG
* Only required when migrating system data.
** Only required if old repository is FOCUS.
7. From the Data Repository Migrate drop-down menu, select Yes if the data repository for theprevious release should be migrated. If Yes is selected, SMCNTRL, SMPRMTRS, andSMPRL data will be migrated. The default value is No.
If you select Yes, additional options become available.
Migrating the Resource Management Repository
108 Information Builders

The additional options let you migrate data in smaller portions, instead of all at once. Theavailable options are:
Start DateThe starting date of the data to be migrated. The default value is the earliest date inthe old repository.
End DateThe ending date of the data to be migrated. The default value is the latest date in theold repository.
8. Accept the default dates, or enter a specific date that you want the migration to run.
9. Click Submit Job. A confirmation of the request appears, stating that the deferredexecution request is in the queue.
10. On the ribbon, in the Repository group, click Migration and then click View job.
or
From the navigation pane, right-click Resource Management, point to Migration, and clickView job.
The Deferred List pane opens, displaying the list of deferred requests and showing therequest name that was displayed when the deferred migration job was scheduled.Examples of request names are listed in the Defer ID column.
The Status column shows the state of the deferred request, which can be Queued,Executing, or Ready. To see if the status has changed to Ready, either keep refreshing thepage using the refresh options located at the top of the page, or redisplay the page at alater time. Once the status is Ready, right-click the request line and click Get to review thejob output.
11. You can choose whether to remove the old configuration files or perform this action in thefuture.
On the ribbon, in the Repository group, click Migration and then click Delete work files.
or
From the navigation pane, right-click Resource Management, point to Migration, and clickDelete work files.
a. Click Delete and then OK to confirm.
Note: Once you choose to remove the old configuration files, the option to migrate datawill no longer be available.
2. Configuring and Administering Resource Management
Resource Analyzer Administrator's and User's Manual 109

Event Routing
Event routing allows you to launch procedures or send email based on different server events.This feature includes five new pre-defined notifications having to do with five different types ofevents that can occur in Resource Analyzer. The notifications will be captured and visible onthe edaprint and can be sent through email.
Error messages:
36029 - Resource Management repository is not valid for this release,
archive failed
36154 - Agent failed to log Resource Management session data
Warning messages:
36048 - Resource Governor canceled a request
36097 - Resource Management logging did not archive all data
36037 - Resource Management has unarchived logs
For more information on event routing and how to customize it, see the Event Routing sectionin the Server Administration manual.
Event Routing
110 Information Builders

Chapter3Resource Analyzer Report Options
After you have enabled Usage Monitoring for a period of time and Resource Analyzer hascollected a reasonable amount of data, you can display several reports and graphs aboutthe monitored data. This chapter describes the various reports you can run and view withResource Analyzer.
In this chapter:
Reports Overview
Resource Analyzer Reporting
Resource Analyzer Report Options
General Reports
Resource Analyzer Reports
Reports Overview
Resource Analyzer produces a range of different reports, depending on the type of informationyou want and the types of issues you are addressing:
Monitored Sessions. Shows the number of user sessions by date.
Monitored Commands. Shows the number of connections and the amount of resourcesused.
Repository Statistics. Shows the total number of records collected during the time periodspecified.
Data Sources Never Used. Opens the Unused Master File Descriptions report, which liststhe data sources which have never been used.
Procedures Never Used. Opens the Procedures Never Used report, which lists theprocedures in the APP PATH which have never been executed.
The Resource Analyzer Reports folder contains the following reports:
Usage Analysis Reports. These reports represent the types of analysis most commonlyused for research. They provide detailed information on users, procedures, or data sources.
Resource Analyzer Administrator's and User's Manual 111

Exception Analysis Report. This report shows any error situations by Procedure name.
Domain Analysis Reports. This report provides information on the usage of the WebFOCUSdomains and their reports and users.
Impact Analysis Report. This report provides information on the effects of column changes.
Performance Analysis Reports. These reports are designed to help reduce excessiveoverhead. They help identify costly requests and unused data sources that may need to bereviewed to determine if the resource or storage usage could be reduced.
Network Analysis Reports. These reports show network traffic on the web server forrequests.
Graph Reports. These reports provide a graphical view of peak transaction and resourceperiods, cumulative usage, and query volume versus resource utilization.
Resource Analyzer Reporting
For all platforms, Resource Analyzer reporting is accessed from the Web Console.
Procedure: How to Access Resource Analyzer Reports
To access Resource Analyzer reports:
1. Launch the server Web Console.
Resource Analyzer Reporting
112 Information Builders
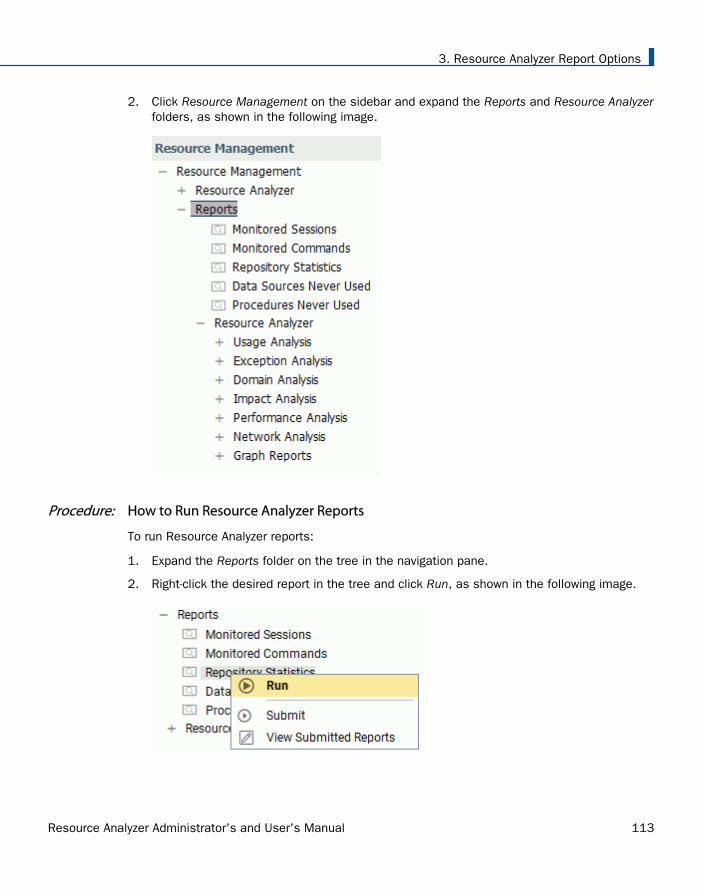
2. Click Resource Management on the sidebar and expand the Reports and Resource Analyzerfolders, as shown in the following image.
Procedure: How to Run Resource Analyzer Reports
To run Resource Analyzer reports:
1. Expand the Reports folder on the tree in the navigation pane.
2. Right-click the desired report in the tree and click Run, as shown in the following image.
3. Resource Analyzer Report Options
Resource Analyzer Administrator's and User's Manual 113

Note: In addition to Run, the Reports context menu also contains Submit and ViewSubmitted Reports. Submit prompts you for a date and time to execute the report andsubmits the report to the deferred queue. View Submitted Reports lists the reports thathave been run in deferred mode.
3. The Report Filter window opens. Make any desired changes and click View Report. Formore information, see Report Filters on page 114.
Resource Analyzer Report Options
There is general information that applies to all Resource Analyzer reports. This informationincludes setting date ranges for report selection criteria, drilling down on reports for moredetails, displaying reports in graphical format, and the online help.
Report Filters
Before you execute a report, you can select the date range of usage monitoring data to includealong with other criteria used in the report. To specify these options, right-click the report youwant to run and click Run.
Resource Analyzer Report Options
114 Information Builders

The Report Filter window opens, as shown in the following image.
The above image is an example of the filter pane. Different reports may have different optionsavailable. See Performance Analysis Reports on page 145.
All other reports will only have the first three options available.
The following options are available:
Select serverThe server, or servers, you want to report on. Multiple server support is only available if theserver you are connected to is part of a many-to-one configured repository.
Local serverThe name of the server that is currently connect to the Web Console. This option is onlyavailable if the server you are connected to is part of a many-to-one configured repository.
3. Resource Analyzer Report Options
Resource Analyzer Administrator's and User's Manual 115

Visualize DataAllows you to add visualization to numeric resource values, such as CPU and durationtimes. This option is enabled by default.
Report formatAllows you to select the output format of the report. The available options are HTML, activereport, PDF, Excel, and PowerPoint. The default value is HTML.
Report periodThe time range that the report will be run on.
Start DateAllows you to select the first date of the reporting range.
End DateAllows you to select the first date of the reporting range. The default end date is thecurrent date.
The information you supply here will apply to any report you run. To change this information,return to this screen by running another report and changing the filters.
Resource Analyzer report selection criteria information is saved for the same browser session,so you will not need to reset it when you reconnect to the server.
Procedure: How to Turn Off Data Visualization
You have the option of turning off data visualization when displaying reports. By default, theVisualize Data checkbox is selected, indicating that data visualization is on.
To turn off data visualization:
1. Clear the Visualize Data checkbox.
2. Click View Report.
Procedure: How to Format a Report
To change the report format:
1. Click the Report format drop-down menu.
Resource Analyzer Report Options
116 Information Builders

The following image shows all of the report options available. If you are licensed for activereports, you can choose that as your report format. For more information on active reports,see the WebFOCUS Managed Reporting End User's Manual.
2. Select a report format from the drop-down menu. The following options are available:
HTML
active report
Excel
PowerPoint
3. Click View Report.
Note: Both Excel and PowerPoint reformatted reports are accessed using the downloadlink in your browser. Drill down links in PowerPoint reports will only be active if PowerPointis in display mode. Additional pop-up messages may be displayed by these two productswhen following the drill-down links. These messages are outside of the control of theResource Management product.
3. Resource Analyzer Report Options
Resource Analyzer Administrator's and User's Manual 117

Procedure: How to Set Selection Criteria Dates for Reports
By default, suggested dates are shown in the Start and End Date input boxes. You may changethese values by typing directly into the boxes, or by selecting dates from a pop-up calendar. Toset selection criteria dates for reports:
1. Type a date into the date input box on the left (Start Date).
or
Click the calendar icon that appears to the right of the date input box.
A calendar appears from which you can choose the month, day, and year for the Start Dateof the data on which you want to report.
2. Type a date into the End Date input box or select a date from the pop-up calendar. If nodate is selected, the current date will be used by default.
3. Click View Report.
Online Help
When you run any of the reports, you have an online help feature at your disposal, accessiblethrough the ? Help button in the report window. The online help provides backgroundinformation about the report you are running.
For more information about the help features, see Getting Help on page 161.
Resource Analyzer Report Options
118 Information Builders

Drilling Down With Reports
Initially, when you execute reports, you will usually see a general summary report for thecategory. Most of the column headings of the reports are hyperlinked. Click the columnheading links to re-sort the report by different columns. In addition, other hyperlinks in thereport let you drill down to more detailed information. These hyperlinked drill-down options aredescribed in more detail throughout this chapter.
The following sections describe the individual reports. Some of these sections contain a tableof drill-down links. In these tables, terms shown in italic represent placeholders, indicating theterm can have different values, depending on the selections for that report.
Monitor Preference and Reports
If you change the Monitor Preference setting and do not collect all the information, somereports will have missing data. When those reports are executed, a message will be displayedinforming the user that no data is available.
Alternate Reporting Output
Many reports can be output in both tabular and graphical formats. Reports can also bereformatted into a number of different outputs.
Reports initially appear in the format specified by the Report format setting in the ResourceManagement report filter window, as shown in the following image.
3. Resource Analyzer Report Options
Resource Analyzer Administrator's and User's Manual 119

Once in the report, you can change its format by selecting a different option from the drop-down menu located on the upper left of the report page, as shown in the following image.
The drop-down menu list the different report outputs, allowing you to change the display of thecurrent report. Reports run from the tree will use the Report format set in the ResourceManagement: Report Filter window.
General Reports
These reports provide overviews of the data sources and procedures being monitored, as wellas those procedures in the server application path that have never been executed. GeneralReports appear only on the Web Console.
To access any of the reports in the Web Console, click Resource Management on the sidebarand expand the Reports folder. Right-click the desired report, and click Run from the contextmenu. After specifying report filters, click View Report.
Monitored Sessions
The Monitored Sessions report provides an overview of the procedures and commands that arebeing monitored, including the number of records processed, and the rows returned.
The following image shows the Monitored Sessions report.
This report has one hyperlink that allows you to drill down to other reports, as described in thefollowing table.
General Reports
120 Information Builders

Click a hyperlink in the: Report Generated Description
Date column Session Summary Report byHour, then by Quarter, andthen by detail.
Monitored Commands
The Monitored Commands report provides an overview of the resources being used by eachcommand, including the execution, CPU, and wait time.
The following image shows the Monitored Commands report.
Repository Statistics
The Repository Statistics report provides an overview of the total number of records collectedduring the time period specified.
The following image shows the Repository Statistics report.
3. Resource Analyzer Report Options
Resource Analyzer Administrator's and User's Manual 121

Data Sources Never Used
The Data Sources Never Used report provides an overview of unused data sources, includingthe application directory they are found in, and the last modification date and time.
The following image shows the Data Sources Never Used report.
Procedures Never Used
The Procedures Never Used report lists those procedures in the application path of the serverthat have never been executed.
General Reports
122 Information Builders

The following image shows the Procedures Never Used report.
Resource Analyzer Reports
The following section provides a description of each report in the Resource Analyzer folder.
To access these reports in the Web Console, expand the Resource Analyzer folder in the tree,right-click the desired report, and click Run.
Usage Analysis Reports
Usage Analysis reports provide information on reporting activity. To access Usage Analysisreports in the Web Console, expand the Usage Analysis folder in the tree and then expand theappropriate Usage Analysis report folder (Users, Procedures, or Data Sources). Right-click thedesired type of usage analysis (Frequency of Use, Resources Used, or Historical Use) and clickRun from the context menu.
3. Resource Analyzer Report Options
Resource Analyzer Administrator's and User's Manual 123

The following image shows the Usage Analysis and Users report folders expanded.
Usage Analysis Categories
There are three basic Usage Analysis categories:
Users. Provides a variety of information about the users at your site, such as how manyrequests each user submits, the dates and resource consumption of those requests, thedata sources certain users are accessing the most, and whether they are issuing ad hoc orcataloged requests, summarized or detailed requests, and so on.
Procedures. Gives a variety of information about the remote procedures used to submitrequests, including the actual syntax of the requests.
Resource Analyzer Reports
124 Information Builders

Data Sources. Shows how your data sources are being accessed, what kind of activitypatterns are occurring at your site, and the earliest and latest data access dates. Thesereports show more detailed information, such as aggregate functions used againstcolumns, and column use in relations, sorting, and grouping.
Types of Usage Analysis
Usage Analysis reports can measure three types of usage:
Frequency of Use. Focuses on how frequently particular data sources are accessed, usersmake requests, or procedures are executed.
Resources Used. Focuses on the resources consumed by requests to particular datasources, by particular users, or with particular procedures.
Historical Use. Shows data source, user, and procedure information over time.
Top n. Shows usage data for the top number of users, procedures, or data sourcesspecified for the Top n report. The available options for top number are 5, 10, 15, 20, and25. The default value is 10.
Users Reports
One of the best techniques for improving system performance is to educate users aboutrequest preparation. Education involves familiarizing users with what data is available and whatconstitutes the designs of different data sources. If users understand what is required of themin executing requests, their expectations about system response will be more realistic. Aftereducating users, you can then organize elements of the data according to user needs, takinginto account efficient grouping and clustering of this data. Some questions to consider aboutusers are:
Are users familiar with the cardinality of the data sources and the impact of multiple joins?
Have the profiles of the users been identified?
Who are the novices, who are the experienced users, and what are their habits andperformance expectations?
Do users visit data very often or sporadically?
Are user profiles predictable or do they operate in binary mode, where most of the time theyimpose no activity on the system but sometimes they consume every computer resourcepossible?
3. Resource Analyzer Report Options
Resource Analyzer Administrator's and User's Manual 125

The Users reports help you analyze the activity of users at your site and determine suchinformation as: whether users are novice or experienced, which data sources they areaccessing most often, when they are using the most resources, and so on.
Users Report by Frequency of Use
The following image shows the Users Report by Frequency of Use, which provides a summaryof user activity. This report lists users on the left, followed by columns with hyperlinkedheadings that indicate the number of requests the users submitted, their percentage of totalrequests and resource usage, and their first and last access dates. Click any of thehyperlinked column headings to sort the report by that column.
This report has several hyperlinks that allow you to drill down to additional reports. Thefollowing table lists and describes these hyperlinks.
Hyperlink in the: Report Generated Description
% Total Commandscolumn.
Procedure Use byUser
Lists the procedures executed by theuser with information about how oftenand when the executions haveoccurred. Also allows you to drill downto see detailed request information foreach procedure as well as the actualrequest syntax
% Total Procedurescolumn.
Procedure Summaryfor User
Lists the procedures used for requestsby the specified user, along withrequest and resource information anddates of access. Also allows you to drilldown to see detailed requestinformation for each procedure as wellas the actual request syntax.
Resource Analyzer Reports
126 Information Builders

Hyperlink in the: Report Generated Description
% Total Resourcescolumn.
Resources used byUser
Summarizes the resource usage of thespecified user, including number ofrequests, elapsed time, CPU seconds,I/Os, rows returned, and access dates.
Users Report by Resources Used
The following image shows the Users Report by Resources Used, which provides informationon resource utilization by user. This report lists users along with the number of requests theysubmitted, total and average elapsed time, CPU seconds, I/Os, rows, and their first and lastaccess dates. Click any of the hyperlinked column headings to sort the report by that column.
This report has one hyperlink that allows you to drill down to another report, as described inthe following table.
Hyperlink in the: Report Generated Description
User column. Data Source Use byUser
Lists the data sources accessed by thespecified user, information about therequests, and dates of access. Alsoallows you to drill down to see columnand data type information, as well asprocedures used in requests by thespecified user.
3. Resource Analyzer Report Options
Resource Analyzer Administrator's and User's Manual 127

Users Report by Historical Use
The following image shows the Users Report by Historical Use, which provides information onhistorical activity by user. This report lists users along with the number of requests theysubmitted in a particular year and the percentages of their requests and resource usage out ofthe totals of that year. Click any of the hyperlinked column headings to sort the report by thatcolumn.
This report has several hyperlinks that allow you to drill down to additional reports,summarized in the following table.
Hyperlink in the: Report Generated Description
User column. Data Source Use byUser
Lists the data sources accessed by thespecified user, information about therequests, and dates of access. Alsoallows you to drill down to see columnand data type information, as well asprocedures used in requests by thespecified user.
Year column. Access per Month forUser during Year
Summarizes by month the number ofrequests made by the specified user,along with the percentage of the userrequests and resource usage out of theparticular date totals.
% Total Procedurescolumn.
Procedures used byUser
Summarizes the procedure access ofthe specified user, including number ofexecutions and % of resources used.
Resource Analyzer Reports
128 Information Builders

Users Report by Top N
The following image shows the Users Report by Top n Users, which shows the usage data forthe top number of users specified. The number of users is specified in the Top number drop-down menu of the Report Filter. The available options for top number are 5, 10, 15, 20, and25. The default value is 10. The Name column in this report can use a file that decodes theUser ID shown in the User column. The format for the file is userid,name. The default filesearched for is names.txt in the baseapp folder.
Procedures Reports
The Procedures reports supply a variety of information about the procedures with which userssubmit requests at your site. This information helps you compare the relative resource usageof cataloged versus ad hoc requests, find out which procedures are the most popular andfrequently executed, and thereby determine the truly mission-critical applications run at yoursite.
3. Resource Analyzer Report Options
Resource Analyzer Administrator's and User's Manual 129

Procedures Report by Frequency of Use
The following image shows the Procedures Report by Frequency of Use, which provides asummary of procedures being executed. This report lists procedures executed at your site bytype, along with statistics about each execution.
This report has one hyperlink that allows you to drill down to another report, as described inthe following table.
Hyperlink in the: Report Generated Description
Procedure Typecolumn.
Request fromProcedure Ad hoc
or
Procedure Summary
(depending onprocedure typeselected)
Lists the date and time, user, resource,and execution information for allprocedures of the specified type. Alsoallows you to drill down further to seethe actual request syntax.
Resource Analyzer Reports
130 Information Builders

Procedures Report by Resources Used
The following image shows the Procedures Report by Resources Used, which provides asummary of resource utilization by procedure. This report summarizes the resource usage forthe procedures executed at your site, including their percentage of total procedures andresources used, as well as total CPU seconds, elapsed time, I/Os, rows, and first and lastexecution.
This report has one hyperlink that allows you to drill down to another report, as described inthe following table.
Hyperlink in the: Report Generated Description
Procedure Typecolumn.
Procedure ResourceUtilization
Summarizes the executions, users,total and average resource usage, andexecution dates for procedures of alltypes. Also lets you drill down onprocedure names to see more detailedusage information as well as the actualrequest syntax.
3. Resource Analyzer Report Options
Resource Analyzer Administrator's and User's Manual 131

Procedures Report by Historical Use
The following image shows the Procedures Report by Historical Use, which providesinformation on historical activity by procedures. This report summarizes by year the number ofexecutions, users, and percentage of executions and resources used by the types ofprocedures at your site. Click any of the hyperlinked column headings to sort the report by thatcolumn.
This report has one hyperlink that allows you to drill down to another report, described in thefollowing table.
Hyperlink in the: Report Generated Description
Year column. Procedure Access byYear by Month
Lists the month for all executedprocedures of the specified proceduretype and year. Also lists their numberand percentage of executions, theirnumber of users, and their resourceusage percentage.
Resource Analyzer Reports
132 Information Builders

Procedures Report by Top N
The following image shows the Procedures Report by Top n Users, which shows the topnumber of procedures executed by the user. The number of procedures is specified in the Topnumber drop-down menu of the Report Filter. The available options for top number are 5, 10,15, 20, and 25. The default value is 10.
This report has one hyperlink that allows you to drill down to another report, described in thefollowing table.
Hyperlink in the: Report Generated Description
Procedure/Reportcolumn.
Procedure executioncount by User
Shows how many times the selectedprocedure was executed by the user.
Data Sources Reports
In order to improve system performance at your site, it is helpful to determine which datasources are most mission-critical, most popular among your users, and most resource-intensive. The Data Sources reports show you how your data sources are being accessed, aswell as illustrate various activity patterns at your site and the earliest and latest dates thatdata was accessed.
3. Resource Analyzer Report Options
Resource Analyzer Administrator's and User's Manual 133

Data Sources Report by Frequency of Use
The following image shows the Data Sources Report by Frequency of Use, which provides asummary of data sources being used. This report lists all accessed data sources along withthe number and percentage of requests to each data source, the number of users, thepercentage of resources consumed, and access dates. Click any of the hyperlinked columnheadings to sort the report by that column.
This report has several hyperlinks that allow you to drill down to additional reports,summarized in the following table.
Hyperlink in the: Report Generated Description
Data Source column. Column Level for DataSource Data Source
Shows usage for the columns for thespecified data source, includingwhether they were used with functions,relations, selects, sorts, and groups,and how many days the column hasbeen unused. Also allows you to drilldown to see more information aboutwhen the columns were used.
Data Type column. Data Sources of typeData Type
Lists all the data sources of thespecified data type (the engine used inyour enterprise) along with the dates offirst and last access for each datasource.
Resource Analyzer Reports
134 Information Builders

Hyperlink in the: Report Generated Description
Number of Times Usedcolumn.
Request Activity forData Source: DataSource
Shows request activity for all users ofthe specified data source, includingI/Os, rows returned, and elapsed time.Also allows you to drill down further tosee the actual request syntax.
Number of DistinctUsers column.
Users of Data Source Lists all users of the specified datasource along with a summary of theresources they have used.
% Total Requestscolumn.
Procedures UsingData Source
Lists the procedures used to accessthe specified data source, along withtheir resource usage and dates ofaccess. Also allows you to drill down ona procedure name to see requestinformation for that procedure and theactual request syntax.
Data Sources Report by Resources Used
Understanding the patterns of resource usage at your site, including CPU and elapsed time,I/Os, and rows returned, can be helpful in several ways. This information can help youdetermine which data sources might be good candidates for pre-joining, pre-aggregation, ordenormalization, and help you decide which data to index. In addition, you can monitor usersand inform them of their resource usage to encourage them to plan their requests moreefficiently. Accessing the Data Sources report category by the Resource Utilization mode ofanalysis can help you with all of these issues.
3. Resource Analyzer Report Options
Resource Analyzer Administrator's and User's Manual 135

The following image shows the Data Sources Report by Resources Used, which provides asummary of resource utilization by data source. This report summarizes the resources used byall data sources at your site, including both total and average elapsed time, CPU seconds,I/Os, and returned rows. Click any of the hyperlinked column headings to sort the report bythat column.
This report has several hyperlinks that allow you to drill down to additional reports,summarized in the following table.
Hyperlink in the: Report Generated Description
Data Source column. Column Level for DataSource Data Source
Shows usage for the columns for thespecified data source, includingwhether they were used with functions,relations, selects, sorts, and groups,and how many days the column hasbeen unused. Also allows you to drilldown to see more information aboutwhen the columns were used.
Number of Times Usedcolumn.
Procedures UsingData Source
Lists the procedures used to accessthe specified data source, along withtheir resource usage and dates ofaccess. Also allows you to drill down ona procedure name to see requestinformation for that procedure and theactual request syntax.
Resource Analyzer Reports
136 Information Builders

Data Sources Report by Historical Use
The accessibility of a web environment makes rapid growth of your user base inevitable. Asmore users are accessing more data, monitoring site activity becomes more important, offeringyou information about the following areas:
How much data is being requested.
What the busiest times of the day, week, and month are.
Which users are most active against which data sources.
What standard response times have been.
Accessing the Data Sources report category by historical analysis lets you analyze user activityto determine the peaks and valleys in system usage, supplying you with a solid basis fordeciding how to schedule requests, educate users, and so on.
The following image shows the Data Sources Report by Historical Use, which providesinformation on historical activity by data source. This report summarizes request activity byyear and month for all accessed data sources at your site. Click any of the hyperlinked columnheadings to sort the report by that column.
This report has several hyperlinks that allow you to drill down to additional reports,summarized in the following table.
3. Resource Analyzer Report Options
Resource Analyzer Administrator's and User's Manual 137

Hyperlink in the: Report Generated Description
Data Source column. Column Level for DataSource Data Source
Shows usage for the columns for thespecified data source, includingwhether they were used with functions,relations, selects, sorts, and groups,and how many days the column hasbeen unused. Also allows you to drilldown to see more information aboutwhen the columns were used.
Year column. Data Access for DataSource during Year
Shows data access information for thespecified data source and year,including number of requests, elapsedprocessing time, CPU seconds, I/Os,and rows returned. Also allows you todrill down on a specific date (month,day, and year) to see requestinformation for that date as well as theactual request syntax.
Resource Analyzer Reports
138 Information Builders

Data Sources Report by Top N
The following image shows the Data Sources Report by Top n, which shows the top number ofdata sources used by the user. The number of data sources is specified in the Top numberdrop-down menu of the Report Filter. The available options for top number are 5, 10, 15, 20,and 25. The default value is 10.
Exception Analysis Report
The Exception Analysis folder contains the Errors and Messages and Procedure with Errorsreports, which provides information on error situations by procedure name.
Errors and Messages
The Errors and Messages report provides an overview of error messages that ResourceManagement has monitored.
3. Resource Analyzer Report Options
Resource Analyzer Administrator's and User's Manual 139

The following image shows the Errors and Messages report.
This report has one hyperlink that allows you to drill down to other reports, as described in thefollowing table.
Hyperlink in the: Report Generated Description
Errors and Messagescolumn.
Errors and Messages Shows the procedure and commandcount by user for the specified errormessage. You can drill down intoprocedures that issued the messagesor to the command that issues themessage, and then to all of themessages issued for the selectedprocedure.
If you click the hyperlink in that report, you generate a final report which shows the errormessage in red. Click the red hyperlink to open the All Messages report, which shows all of themessages generated by the selected procedure.
Procedure with Errors
The Procedure with Errors report provides information on error situations by Procedure Name.
Resource Analyzer Reports
140 Information Builders

The following image shows the Procedure with Errors report.
This report has one hyperlink that allows you to drill down to another report, as described inthe following table.
Hyperlink in the: Report Generated Description
Procedure Namecolumn.
Requests Executedwith Errors
Provides a list of requests that resultedin an error.
If you click the hyperlink in the Requests Executed with Errors report, the Error Message reportopens. This report shows all of the error messages generated.
Domain Analysis Report
The Domain Analysis report provides information on the usage of the WebFOCUS domains andtheir reports and users. This report supplies you with information that helps you understandthe usage of the domain reports and the users that run them, and provides a summary line ofeach domain that has been monitored..
Note: In the tables of drill-down links, terms shown in italic represent placeholders, indicatingthe term can have different values, depending on the selections for that report.
3. Resource Analyzer Report Options
Resource Analyzer Administrator's and User's Manual 141
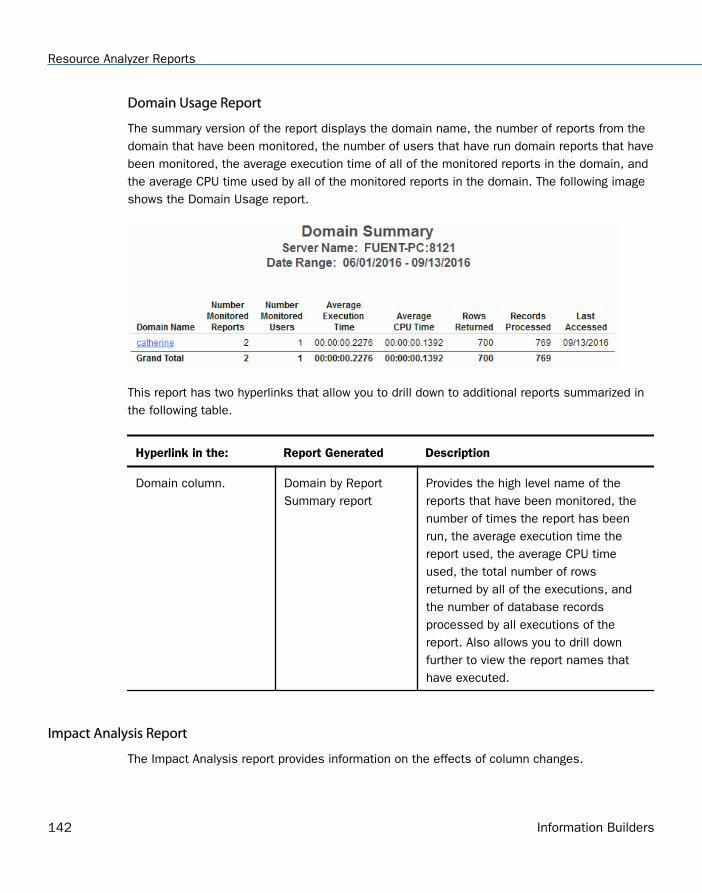
Domain Usage Report
The summary version of the report displays the domain name, the number of reports from thedomain that have been monitored, the number of users that have run domain reports that havebeen monitored, the average execution time of all of the monitored reports in the domain, andthe average CPU time used by all of the monitored reports in the domain. The following imageshows the Domain Usage report.
This report has two hyperlinks that allow you to drill down to additional reports summarized inthe following table.
Hyperlink in the: Report Generated Description
Domain column. Domain by ReportSummary report
Provides the high level name of thereports that have been monitored, thenumber of times the report has beenrun, the average execution time thereport used, the average CPU timeused, the total number of rowsreturned by all of the executions, andthe number of database recordsprocessed by all executions of thereport. Also allows you to drill downfurther to view the report names thathave executed.
Impact Analysis Report
The Impact Analysis report provides information on the effects of column changes.
Resource Analyzer Reports
142 Information Builders

To access the Impact Analysis report in the Web Console, click Resource Management on thesidebar and expand the Reports and Resource Analyzer folders. Expand the Impact Analysisfolder. Right-click the available report, and click Run from the context menu.
The available report is the Change Impact for Column report. It provides information aboutwhich procedures and end users will be affected by changes to column names and format.This report supplies you with information that can help you understand the rippling effects ofdata schema changes.
Note: In the tables of drill-down links, terms shown in italic represent placeholders, indicatingthe term can have different values, depending on the selections for that report.
Change Impact for Column Report
It is very useful to determine in advance which users and applications will be most affected byimpending data source schema changes. The Change Impact for Column reports determinehow data-source modifications affect users and their applications.
Once you select the report, select the column for which you want to examine information underthe Column name drop-down menu and click View Report. Any use of a column with that namein any monitored table is reported.
3. Resource Analyzer Report Options
Resource Analyzer Administrator's and User's Manual 143
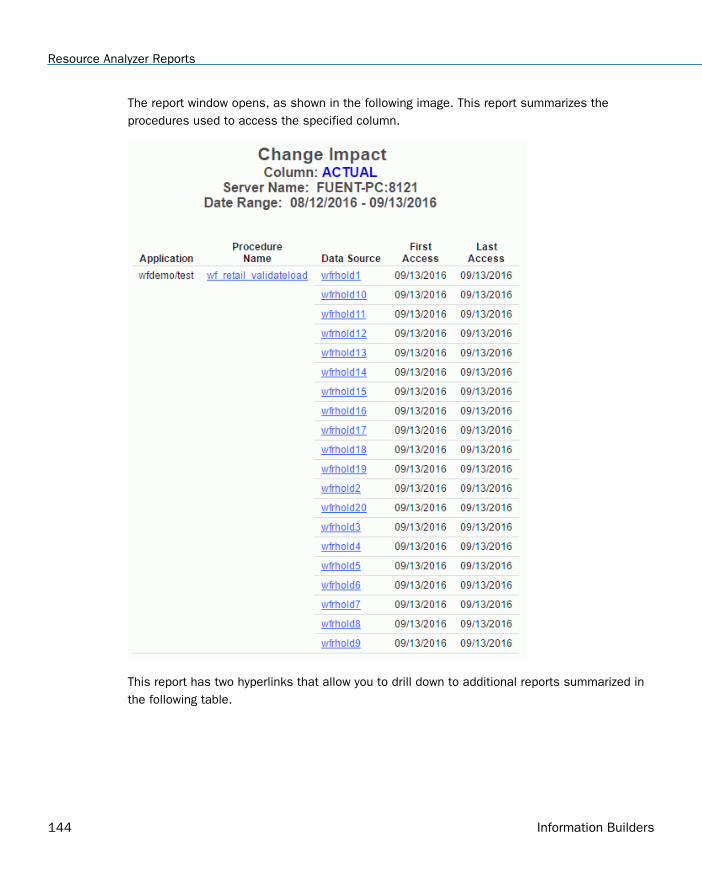
The report window opens, as shown in the following image. This report summarizes theprocedures used to access the specified column.
This report has two hyperlinks that allow you to drill down to additional reports summarized inthe following table.
Resource Analyzer Reports
144 Information Builders

Hyperlink in the: Report Generated Description
Procedure Namecolumn.
Requests fromProcedure ProcedureName
Shows a variety of information,including date and time, user, CPUseconds, elapsed execution time, I/Os,and rows returned, about the requestsmade with the specified procedure.Also allows you to drill down further tosee the actual request syntax.
Data Source column. Column Level for DataSource Data Source
Shows usage for the columns for thespecified data source, includingwhether they were used with functions,relations, selects, sorts, or groups, or ifthey were never used. Also allows youto drill down to see more informationabout when the columns were used.
Performance Analysis Reports
Performance Analysis reports are designed to help reduce excessive overhead. They helpidentify costly requests and unused data sources that may need to be reviewed to determine ifthe resource or storage usage could be reduced.
To access Performance Analysis reports in the Web Console, click Resource Management onthe sidebar and expand the Reports and Resource Analyzer folders. Expand the PerformanceAnalysis folder. Right-click the desired report, and click Run from the context menu.
The following reports are available:
Procedure Benchmarks Report. Measures iterative improvements in resource expenditureand analyzes the response time of requests to determine whether Service Level Agreement(SLA) standards are being met.
Excessive Resources Report. Uncovers procedures with long-running requests, which useexcessive resources and result in long waits for users.
Long-running Requests Report. Identifies procedures with long-running requests, which useexcessive resources.
Large Volume Requests Report. Identifies requests returning more data than necessaryand target them for optimization.
3. Resource Analyzer Report Options
Resource Analyzer Administrator's and User's Manual 145

Dormant Data Report. Uncovers which data sources, columns, and data are infrequently ornever accessed, which can make response times slower and batch updates morecumbersome. This helps you decide how to better organize your data sources.
Excessive Joins Report. Reveals which columns are frequently joined, helping youdetermine how to create pre-joined tables. Joining too many tables is expensive and slow.
Repeated Aggregations Report. Shows which data sources might be the best candidatesfor summarization or pre-aggregation, to improve performance. Aggregations can causebottlenecks during query execution.
Candidates for Column Index Report. Identifies columns that should be indexed.
Optimization Report. For WebFOCUS language reports, for example, TABLE FILE, that arerun against a relational data source, the drill-down options in this report will lead the userto a report that will show the original code, which is translated SQL with a drill-down link toany aggregation messages. The Repository Log record for Translations must be selected forthe drill-down report to be available.
For more information on the resource and performance analysis issues related to the Resourceand Performance Analysis Reports, see What Is Resource Analyzer? on page 15.
Note: In the tables of drill-down links, terms shown in italic represent a placeholder, indicatingthe term can have different values, depending on the selections for that report.
Procedure Benchmarks Report
Benchmarking is a process by which you determine whether your site's service levelagreements (SLAs) are being met. Use the Procedure Benchmarks reports to identify responsetimes for requests and other information for analyzing site performance.
From the Procedure Name drop-down menu, select the name of the procedure for which youwant to examine information and click View Report.
Resource Analyzer Reports
146 Information Builders

The following image shows the Procedure Benchmarks report appears, as shown in thefollowing image. This report shows information about executions of the specified procedure,including execution date and time, user, CPU and elapsed time, usage type, and client type.Click any of the hyperlinked column headings to sort the report by that column.
Excessive Resources Report
Some of the most helpful information Resource Analyzer can provide is about which requestsare using the most resources. This kind of information helps you identify causes of networkand machine-use bottlenecks and enables you to decide what data needs to be indexed, whatrequests need to be scheduled, or which users need to be educated. The Excessive Resourcesreports help you with this investigation.
For a request to be included in the report, it need only exceed one of the resource valuesspecified, not all. Specify criteria to limit your report to information on requests that consumeresource usage values above a certain average, and click View Report.
3. Resource Analyzer Report Options
Resource Analyzer Administrator's and User's Manual 147

The following image shows the Excessive Resources report. This report lists the mostresource-intensive procedures: those whose average resource usage values, including CPUseconds, elapsed time, I/Os, and rows returned, exceed at least one of the limits youspecified. The report also lists the average resource usage values for each procedure. Clickany of the hyperlinked column headings to sort the report by that column.
This report has one hyperlink that allows you to drill down to another report, as described inthe following table.
Hyperlink in the: Report Generated Description
Procedure Namecolumn.
Requests fromProcedure Procedure
Lists the date and time, user, andresource information for each requestof the specified procedure. Also allowsyou to drill down further to see theactual request syntax.
Long-running Requests Report
Procedures with long running requests use excessive resources, a particular problem whendealing with operational systems. These procedures should be targeted for optimization.
The following image shows the Long-running Requests report. By default, the report is sortedby Average Elapsed Seconds and Average CPU Seconds.
Resource Analyzer Reports
148 Information Builders

This report has one hyperlink that allows you to drill down to another report, as described inthe following table.
Hyperlink in the: Report Generated Description
Procedure Namecolumn.
Requests fromProcedure: ProcedureName
Shows the requests that were executedfrom the selected procedure. Alsoallows you to drill down further to seethe actual request syntax.
Large Volume Requests Report
Large volume requests are requests that return more data than might be necessary. Theserequests can be targeted for optimization. You can identify these reports with the LargeVolume Requests report.
The following image shows the Large Volume Requests report. By default the report is sortedby the highest Average Rows.
This report has one hyperlink that allows you to drill down to another report, as described inthe following table.
Hyperlink in the: Report Generated Description
Procedure Namecolumn.
Requests fromProcedure Name
Shows the requests that were executedfrom the selected procedure. Alsoallows you to drill down further to seethe actual request syntax.
Dormant Data Report
Dormant data, or data that is very infrequently accessed, can slow response times on yoursite. Use the Dormant Data reports to identify which data sources and columns have been lessrecently or never queried and can be deleted or archived to improve performance.
3. Resource Analyzer Report Options
Resource Analyzer Administrator's and User's Manual 149

The following image shows the Dormant Data report. This report shows a variety of informationabout each data source, such as number of requests, users, resource usage, and accessdates. The Days Since Used column indicates the number of days that have passed since thedata source was last accessed. By default, the report is sorted by access dates, with thosedata sources that have no access dates (and are therefore dormant) listed first, and includesall data sources in the application path, including those that aren't being monitored.
This report has one hyperlink that allows you to drill down to another report, as described inthe following table.
Hyperlink in the: Report Generated Description
Data Source column. Dormant DataSummary: ColumnLevel for Data Source
Shows which columns were neveraccessed in the specified data source,and also lists all accessed columnsalong with last access time in days.Shows usage for the columns, includingwhether they were used with functions,relations, selects, sorts, and groups.
Resource Analyzer Reports
150 Information Builders

Excessive Joins Report
Joining too many tables can be slow and costly. Denormalization can be an effective methodfor cutting CPU time and improving response times. The Excessive Joins reports help youdetermine which data is most frequently joined by user requests and help you decide how toplan your de-normalizing strategies.
The following image shows the Excessive Joins report. This report lists the most frequentlyjoined data sources along with the procedures used to join them.
This report has one hyperlink that allows you to drill down to another report, as described inthe following table.
3. Resource Analyzer Report Options
Resource Analyzer Administrator's and User's Manual 151

Hyperlink in the: Report Generated Description
Procedure Namecolumn.
Requests fromProcedure JoiningData source1, Datasource2, Data sourcen
Shows a variety of information,including date and time, user, CPUseconds, elapsed execution time, I/Os,and rows returned, about the requestsmaking the specified join. Also allowsyou to drill down further to see theactual request syntax.
Repeated Aggregations Report
Efficiencies can be created by calculating column values once and storing the results insummary tables for repeated use. This saves the cost of calculating these values every time areport is run.
The following image shows the Repeated Aggregations report. This report shows how manyrequests used different functions on certain columns of data sources, along with the dates ofaccess. Click any of the hyperlinked column headings to sort the report by that column.
Resource Analyzer Reports
152 Information Builders

This report has one hyperlink that allows you to drill down to another report, as described inthe following table.
Hyperlink in the: Report Generated Description
Function column. Procedure Summary -Frequency of UseUsing Function onData Source.ColumnName
Summarizes the procedure types(Application and Ad_Hoc) that haveexecuted the specified function for thespecified data source and column,along with statistics about eachexecution. Also allows you to drill downfurther to see a list of the catalogedprocedures and information aboutthem.
Candidates for Column Index Report
Indexing columns that are frequently used in selection criteria for reports can improveefficiency. This report identifies columns that should be indexed.
This report shows how often columns were used as selection criteria in requests, as shown inthe following image. Click any of the hyperlinked column headings to sort the report by thatcolumn.
3. Resource Analyzer Report Options
Resource Analyzer Administrator's and User's Manual 153

Optimization
For WebFOCUS language reports, for example, TABLE FILE, that are run against a relationaldata source, the drill-down options in this report lead users to a report that will show theoriginal code, which is translated SQL with a drill-down link to any aggregation messages.
This report has one hyperlink that allows you to drill down to another report, as described inthe following table.
Hyperlink in the: Report Generated Description
Optimization Messagescolumn.
All OptimizationMessages
Shows the procedure and commandcount by user for the selectedmessage.
If you drill down on the Command Count hyperlink, a report opens that lists the CommandNames. If that column has an active drilldown, you can click that link and open the Original/Translated/Messages report, as shown in the following image.
The following columns are available:
Resource Analyzer Reports
154 Information Builders

Column Description
Original Request Shows the original request contents.
Translated Request Shows the SQL that was sent to the RDBMS, if the originalrequest was for a relational table.
Messages Indicates if any messages were issued for this request.
If you click the drilldown in the Messages column, the report shows that the reason therequest was not optimized is because optimization was disabled by the user, as shown in thefollowing image.
Network Analysis Reports
This new category of Resource Analyzer reports shows network traffic for requests on the webserver, for example, the users for each connected IP address.
To access Network Analysis reports in the Web Console, click Resource Management on thesidebar and expand the Reports and Resource Analyzer folders. Expand the Network Analysisfolder. Right-click the desired report, and click Run from the context menu.
3. Resource Analyzer Report Options
Resource Analyzer Administrator's and User's Manual 155

The following reports are available:
Bandwidth by Procedure. Shows the number of bytes retrieved to the web server forrequests. The report analyzes the bandwidth by database type for each year/monthcombination.
Resources by Connection. Shows the resources consumed by the different IP connections.
Note: In the tables of drill-down links, terms shown in italic represent a placeholder, indicatingthat the term can have different values, depending on the selections for that report.
Bandwidth by Procedure Report
The Bandwidth by Procedure report shows the number of bytes retrieved to the web server forrequests. The report analyzes the bandwidth by database type for each year/monthcombination.
The following image shows the Bandwidth by Procedure report.
Resources by Connection
Resources by Connection report shows the resources consumed by the different IPconnections.
Resource Analyzer Reports
156 Information Builders

The following image shows the Resources by Connection report.
This report has one hyperlink that allows you to drill down to another report, described in thefollowing table.
Hyperlink in the: Report Generated Description
Connection column. Resources byConnection in NetworkNode
Shows the resources for eachconnection address.
Graph Reports
Resource Analyzer provides a number of graphs for resource and performance analysis.
To access Graph Reports in the Web Console, click Resource Management on the sidebar andexpand the Reports and Resource Analyzer folders. Expand the Graph Reports folder. Right-clickthe desired report, and click Run from the context menu.
The eight Graph Reports appear in the tree:
Cumulative Hourly Use. Determine hourly system usage.
Query Volume vs. Resource Utilization. Profile query volume against system resourceutilization.
3. Resource Analyzer Report Options
Resource Analyzer Administrator's and User's Manual 157

Peak Transaction Periods
By Hour of Day. Determine transaction-bottleneck periods by hourly request activity.
By Day of Week. Determine transaction-bottleneck periods by daily request activity.
By Month. Determine transaction-bottleneck periods by monthly request activity.
Peak Resource Periods
By Hour of Day. Determine transaction-bottleneck periods by hourly resource usage.
By Day of Week. Determine transaction-bottleneck periods by daily resource usage.
By Month. Determine transaction-bottleneck periods by monthly resource usage.
Cumulative Hourly Use and Peak Transaction/Resource Periods Reports
These graph reports allow you to determine transaction-bottleneck periods of request activityor resource usage by different time periods.
You can filter a report by data source name and/or user name by selecting a valid data sourcename and/or user name from the drop-down menu, or by selecting ALL, to indicate all datasources and all users. The default is ALL. After you select your data sources or accept thedefault, click View Report.
Query Volume vs. Resource Utilization Report
Un-tuned queries frequently return more data than necessary. Identify the procedures runningthese requests and target them for optimization.
This report compares the number of requests to one of four factors of resource usage: CPUseconds, elapsed execution time in seconds, rows returned, and I/Os (all mapped on thevertical axis). This information is shown for each hour of the day, with the hours mapped alongthe horizontal axis. The values on the vertical axis are cumulative for the time period of thedates you select for Usage Monitoring data for reports. For more information on setting reportdate ranges, see How to Set Selection Criteria Dates for Reports on page 118.
By default, the first graph that appears shows requests graphed against CPU Time.
Resource Analyzer Reports
158 Information Builders

The following image shows the Query Volume vs. Resource Utilization Report.
3. Resource Analyzer Report Options
Resource Analyzer Administrator's and User's Manual 159

Resource Analyzer Reports
160 Information Builders

Chapter4Getting Help
The following section explains the help features of Resource Management in the WebConsole.
In this chapter:
Resource Management Administration Help
Reporting Application Context-Sensitive Help From Reports
Resource Management Administration Help
Online help for Resource Management is available from the Web Console.
Web Console Help
To access online help from the Web Console, click the Help button located in the upper rightcorner of the console window and click Contents and Search, as shown in the following image.
The Web Console server help page opens.
Resource Analyzer Administrator's and User's Manual 161

The following image shows the Web Console server page, which displays several available helptopics, including two administration topics: Resource Analyzer and Resource Governor andResource Analyzer Report Options. The first topic is selected in this image.
Resource Management Administration Help
162 Information Builders

Reporting Application Context-Sensitive Help From Reports
Resource Management reports offer context-sensitive online help from almost every report. Toaccess the online help for a specific report, run a report and then click the Help link thatappears at the top of the report.
When you click the Help link in a report, a new browser window opens to display a topicrelevant to that report. The window also displays a table of contents that allows you to easilynavigate to help topics for other reports. Simply click a topic on the left, and the informationdisplays on the right. For example, when you click the Help link while viewing the MonitoredSessions report, the window displays the Monitored Sessions topic, as shown in the followingimage.
4. Getting Help
Resource Analyzer Administrator's and User's Manual 163

Reporting Application Context-Sensitive Help From Reports
164 Information Builders

AppendixA Administrative Usage Monitoring TablesColumn Descriptions
This appendix provides descriptions of the Administrative and Usage Monitoring tables.Each description shows the table column definitions.
In this appendix:
Usage Monitoring Table (RMLDB.MAS)
Usage Monitoring RDBMS Table Sizing
Usage Monitoring Table (RMLDB.MAS)
This section lists the data definitions that comprise the Resource Analyzer Usage MonitoringTable, and provides an explanation of the segments and field values.
Note:
The CPU, Elapsed, Wait, DBMS, and zIIP time values in all segments are in 10,000th of asecond increments and are indicated by a double asterisk (**) next to the field name.
An asterisk (*) next to a field name denotes that its length has changed. A hash tag (#)next to a field denotes that it is new in this release.
On MVS, for both HFS and PDS deployments, the MVSAPP entry in the servers edasprofprofile should not be removed. If it is, some data field values may not be collected and willbe blank.
SMSERVERS Segment
This segment keeps track of server related information. It is the root segment record and it isupdated every time the database is updated with new log information and when systemmaintenance is performed to remove old data.
The following table lists the available fields, their values, and descriptions.
Field Value Description
SMSRVNAMES* Alphanumeric,length=128V
SERVERNAME value.
Resource Analyzer Administrator's and User's Manual 165
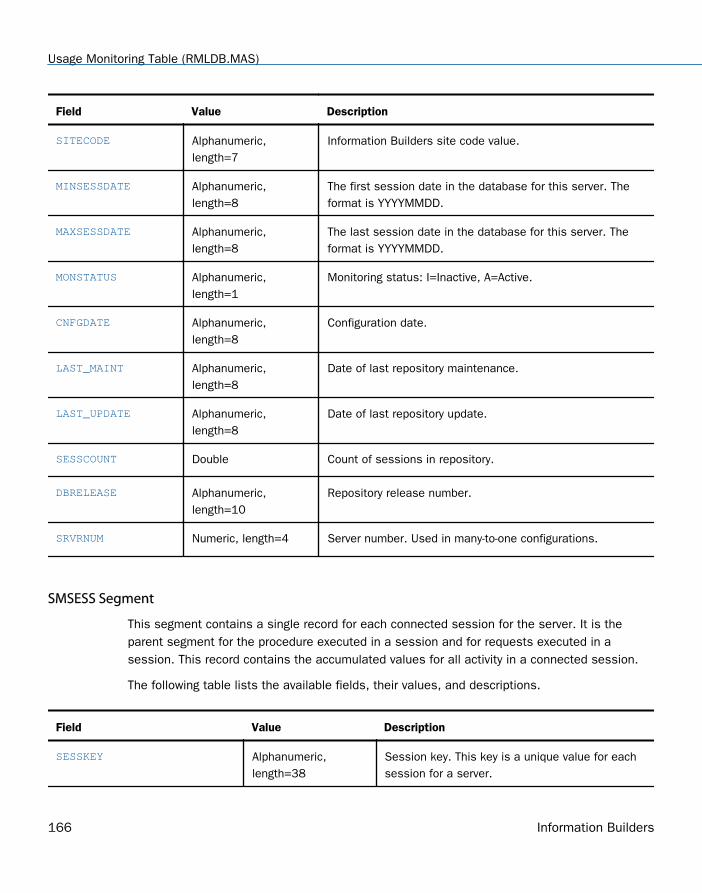
Field Value Description
SITECODE Alphanumeric,length=7
Information Builders site code value.
MINSESSDATE Alphanumeric,length=8
The first session date in the database for this server. Theformat is YYYYMMDD.
MAXSESSDATE Alphanumeric,length=8
The last session date in the database for this server. Theformat is YYYYMMDD.
MONSTATUS Alphanumeric,length=1
Monitoring status: I=Inactive, A=Active.
CNFGDATE Alphanumeric,length=8
Configuration date.
LAST_MAINT Alphanumeric,length=8
Date of last repository maintenance.
LAST_UPDATE Alphanumeric,length=8
Date of last repository update.
SESSCOUNT Double Count of sessions in repository.
DBRELEASE Alphanumeric,length=10
Repository release number.
SRVRNUM Numeric, length=4 Server number. Used in many-to-one configurations.
SMSESS Segment
This segment contains a single record for each connected session for the server. It is theparent segment for the procedure executed in a session and for requests executed in asession. This record contains the accumulated values for all activity in a connected session.
The following table lists the available fields, their values, and descriptions.
Field Value Description
SESSKEY Alphanumeric,length=38
Session key. This key is a unique value for eachsession for a server.
Usage Monitoring Table (RMLDB.MAS)
166 Information Builders

Field Value Description
SMSERVER* Alphanumeric,length=128V
The server the session ran on. This is a requiredfield to support relational databases used by thecluster master.
SESSDATE Alphanumeric,length=8
The session date. The format is YYYYMMDD.
SESSSTART Alphanumeric,length=9
The session start time. The format isHHMMSSNNN.
SESSTOP Alphanumeric,length=9
The session end time. The format isHHMMSSNNN.
SESSDUR** Double The session duration time.
SESSCPU** Double The session CPU time.
SESSWAIT** Double The session wait time.
SESSIOS Double The number of I/O operations used in thesession.
SESSRECORDS Double The number of RECORDS processed in thesession.
SESSTRANS Double The number of TRANSACTIONS processed in thesession.
SESSLINES Double The number of LINES returned or held in thesession.
SMUSERID* Alphanumeric,length=128V
The effective user ID for the session. This is theconnection user ID unless overridden.
USERIDTYPE Alphanumeric,length=1
GKE %(M)RE USERID |
GKE %(U)SERID override value. Values are M, U,or blank.
A. Administrative Usage Monitoring Tables Column Descriptions
Resource Analyzer Administrator's and User's Manual 167

Field Value Description
SMLIVE Alphanumeric,length=1
Indicates the type of session. Values are 0, 1, 2,3, 4, or 5.
See the SESSTYPE definition for descriptivevalues.
SESSFEXCNT Numeric, length=4 Number of FOCEXECs monitored during thesession.
SESSCMDCNT Numeric, length=4 Number of commands monitored throughout thesession.
SESSPREF Alphanumeric,length=64
Monitor preference setting when session started.
SMCONNTYPE Alphanumeric,length=1
See NETWORK DEFINE.
SMCONNID* Alphanumeric,length=128V
Connection user ID.
SMGROUP* Alphanumeric,length=128V
Security group for SMCONNID.
SMCONNADDR* Alphanumeric,length=48
Network connection address.
CONNRETCODE Alphanumeric,length=10
Connection return code.
SMCLIENTTYPE Alphanumeric,length=32
CLIENT value if sent from the client.
SMFOCREL Alphanumeric,length=30
Usage Monitor release and build number.
SMSEZIIPTIME** Double The zIIP processor time used. This value is onlyavailable on MF processors running z/OS.
SMSEZIIPONCP** Double The zIIP on CP value. This value is only availableon MF processors running z/OS.
Usage Monitoring Table (RMLDB.MAS)
168 Information Builders

Field Value Description
SMSEZIIPON Alphanumeric,length=1
Indicates if zIIP was enabled. Values are Y, N, orblank. This value is only available on MFprocessors running z/OS.
SESSCPUID Alphanumeric,length=48
CPUID value.
SESSLPARNM Alphanumeric,length=8
The LPAR name the session ran on. This value isonly available on MF processors running z/OS.
SESSMODELID Alphanumeric,length=8
The CPU model ID the session ran on. This valueis only available on MF processors running z/OS.
SMCLNTCODEPG Double The code page of the NLS client.
SMJOBID Alphanumeric,length=63
Job ID of the scheduled or deferred job.
SMFOCUSIO Double The number of FOCUS I/O operations in thesession.
SMDBMSIO Double The number of RDBMS adapter I/O operationsused in the session.
SMDBMSTIME** Double Elapsed time spent in RDBMS.
SMMEMUSAGE Double Megabytes of memory used in the session. Thisvalue includes Fixed Memory on MF processorsrunning z/OS.
SMDISKUSAGE Double Kilobytes of disk space used in the session.
SMSVCNAME Alphanumeric,length=64
Agent Service Name.
SESSSRVRNUM Numeric, length=4 Server number. Used in many-to-oneconfigurations.
SMMEMORY# Double Kilobytes(KB) of swappable memory used.
A. Administrative Usage Monitoring Tables Column Descriptions
Resource Analyzer Administrator's and User's Manual 169

Field Value Description
SMMEMFIXED# Double Kilobytes(KB) of fixed memory used. This value isonly available on MF processors running z/OS.
SMRPCS Segment
This segment contains a single record for each executed or included procedure. It is the parentsegment for SMRPCCMD and SMRPCWF segments. The resource values in the segment are asubset of the resource values of its parent segment, and it contains the resource values usedby the FOCUS or SQL requests it may execute.
The following table lists the available fields, their values, and descriptions.
Field Value Description
SMRPCKEY Alphanumeric,length=38
Session key value.
SMRPCNUM Numeric, length=4 The execution order number. Values are 1 to2,147,483,647.
SMRPCDATE Alphanumeric,length=8
The date the procedure was executed. Theformat is YYYYMMDD.
SMRPCTIME Alphanumeric,length=9
The time the procedure was started. The formatis HHMMSSNNN.
SMRPCSTOP Alphanumeric,length=9
The time the procedure ended. The format isHHMMSSNNN.
SMFEXNAME Alphanumeric,length=577V
The procedure name. This is the WebFOCUSphysical name. The path to the file is located inSMRPCWF.SMWFBASEDIR
SMRPCETIME** Double The procedure execution time.
SMRPCCTIME** Double The procedure CPU time.
SMRPCWTIME** Double The procedure wait time.
SMRPCIOS Double The number of I/O operations by the procedure.
Usage Monitoring Table (RMLDB.MAS)
170 Information Builders

Field Value Description
SMRPCRECORDS Double The number of RECORDS processed by theprocedure.
SMRPCTRANS Double The number of TRANSACTIONS processed bythe procedure.
SMRPCLINES Double The number of LINES returned or held by theprocedure.
SMRPCPNUM Alphanumeric,length=4
Parent procedure number or 0.
SMRPCTYPE Alphanumeric,length=1
Type of procedure. I (-INCLUDE), E (EX), M(MFD_profile), or S (Stored Procedure Call).
SMRPCEND Alphanumeric,length=1
Indicates how the procedure ended. Values areE, Q, or blank.
E = Exit or Run, Q = Quit.
SMRPCWF# Alphanumeric,length=1
Request originated from WebFOCUS.
SMRPCWC# Alphanumeric,length=1
Request originated from Web Console.
SMRPCLOC Alphanumeric,length=254V
Physical location of the procedure.
SMRPCZIIPTIME** Double The zIIP processor time used. This value is onlyavailable on MF processors running z/OS.
SMRPCZIIPONCP** Double The zIIP on CP values. This value is onlyavailable on MF processors running z/OS.
SMRPCZIIPON Alphanumeric,length=1
Indicates if zIIP was enabled. Values are Y, N,or blank. This value is only available on MFprocessors running z/OS.
SMRPCFOCUSIO Double The number of FOCUS I/O operations by theprocedure.
A. Administrative Usage Monitoring Tables Column Descriptions
Resource Analyzer Administrator's and User's Manual 171

Field Value Description
SMRPCDBMSIO Double The number of RDBMS adapter I/O operationsby the procedure.
SMRPCDBMSTIME** Double Elapsed time spent in RDBMS.
SMRPCSRVRNUM Numeric, length=4 Server number. Used in many-to-oneconfigurations.
SMRPCCMD Segment
This segment contains one or more records that comprise the execution statement with allparameter names and their values that were supplied.
The following table lists the available fields, their values, and descriptions.
Field Value Description
SMRCLKEY Alphanumeric,length=38
Session key value.
SMRLNNUM Numeric, length=4 Procedure number.
SMRPCSEGNUM Numeric, length=4 Procedure line segment number.
SMRPPARMS Alphanumeric,length=1024V
Procedure parameter and value (1 pair per record).
SMRPCCSRVRNUM Numeric, length=4 Server number. Used in many-to-one configurations.
SMRPCWF Segment
This segment contains a single record that contains information sent to the Reporting Serverfrom WebFOCUS or ReportCaster.
The following table lists the available fields, their values, and descriptions.
Usage Monitoring Table (RMLDB.MAS)
172 Information Builders

Field Value Description
SMRWFKEY Alphanumeric,length=38
Session key value.
SMRWFNUM Numeric, length=4 Procedure number.
SMWFFEXNAME Alphanumeric,length=577V
WebFOCUS procedure name. Also DEFINE asSMWFRPCNAME.
SMWFBASEDIR Alphanumeric,length=254V
WebFOCUS base directory path value. Also DEFINEas SMBASEDIR.
SMWFDOMAIN Alphanumeric,length=254V
WebFOCUS MR domain name value. Also DEFINEas SMDOMAIN.
SMWFAPPPATH Alphanumeric,length=254V
WebFOCUS MR application directory value. AlsoDEFINE as SMAPPDIR.
SMRCSCHEDID Alphanumeric,length=66
ReportCaster scheduler ID.
SMRCPROCID Alphanumeric,length=66
ReportCaster process ID.
SMWFMRGROUP Alphanumeric,length=A128V
Reserved for a future release.
SMWFSRVRNUM Numeric, length=4 Server number. Used in many-to-oneconfigurations.
SMQUERY Segment
This segment contains a record for each monitored request executed. It is the parent segmentfor SMCMDLN, SMRMTS, SMFROMS, SMFNCTNS and SMRELTNS segments. The resourcevalues in the segment are a subset of the resource values of its parent segment.
The following table lists the available fields, their values, and descriptions.
A. Administrative Usage Monitoring Tables Column Descriptions
Resource Analyzer Administrator's and User's Manual 173

Field Value Description
SMKEY Alphanumeric,length=38
Session key value.
SMCMDNUM Numeric, length=4 Request number.
SMCMDNAME Alphanumeric,length=12
The name of the FOCUS or SQL request type.
SMDATE Alphanumeric,length=8
The date the command was executed. Format isYYYYMMDD.
SMTIME Alphanumeric,length=9
The time the command started. The format isHHMMSSNNN.
SMSTOP Alphanumeric,length=9
The time the command ended. The format isHHMMSSNNN.
SMELAPTIME** Double The request execution time.
SMCPUTIME** Double The request CPU time.
SMWAITTIME** Double The request wait time.
SMIOS Double The number of I/O operations used by therequest.
SMRECORDS Double The number of RECORDS processed by therequest.
SMTRANS Double The number of TRANSACTIONS processed by therequest.
SMROWS Double The number of LINES returned or held by therequest.
SMROWLEN Numeric, length=4 Longest record length of rows held/returned.
SMOUTLIMIT Numeric, length=4 SQL and FOCUS request max output limit.
SMRECLIMIT Numeric, length=4 FOCUS requests of max RECORDS read.
SQL requests of max OUTPUT records.
Usage Monitoring Table (RMLDB.MAS)
174 Information Builders

Field Value Description
SMREADLIMIT Numeric, length=4 Max READS for MODIFY requests.
SMRETCODE Numeric, length=4 Command return code.
SMUNIONS Numeric, length=4 Number of SQL UNION statements.
SMUNIONALLS Numeric, length=4 Number of SQL UNION ALL statements.
SMNUMFROMS Numeric, length=4 Number of data sources used.
SMNUMCOLUMNS Numeric, length=4 Number of columns used.
SMNUMRELATIONS Numeric, length=4 Number of relational clauses.
SMNUMGROUPBYS Numeric, length=4 Number of GROUP BYs.
SMNUMORDERBYS Numeric, length=4 Number of SQL ORDER BY or FOCUS BY.
SMNUMFUNCTIONS Numeric, length=4 Number of functions used.
SMNUMREMOTES Numeric, length=4 Number of remote connections used.
SMSORTIO Double Number of sort I/O operations used.
SMEXTSORT Alphanumeric,length=1
Indicates whether an external sort was used.Values are Y or N.
SMREQTYPE Alphanumeric,length=1
Type of request. See REQUESTTYPE DEFINE in theMaster File.
SMMDIFYTYPE Alphanumeric,length=1
Type of MODIFY or MAINTAIN. See MODIFYTYPEDEFINE in the Master File.
SMCOLLECT Alphanumeric,length=1
Reason for collection. See SMSTATUS DEFINE inthe Master File.
A. Administrative Usage Monitoring Tables Column Descriptions
Resource Analyzer Administrator's and User's Manual 175

Field Value Description
SMALLROWS Alphanumeric,length=1
Indicates whether all rows were returned:
0 = Incomplete.
1 = Complete.
2 = Data adapter limited.
SMALLCOLS Alphanumeric,length=1
Indicates whether a SELECT * or PRINT * used.Values are Y or N.
SMSETALL Alphanumeric,length=1
Indicates whether SET ALL was used:
0 = OFF
1 = ON
2 = PASS
SMCORRQRY Alphanumeric,length=1
Indicates whether the SQL request was correlated.Values are Y, N, or blank.
SMHLDTYPE Alphanumeric,length=1
Type of HOLD file. See HOLDTYPE DEFINE in theMaster File.
SMHLDFORMAT Alphanumeric,length=2
Format of hold file. See HOLDFORMAT DEFINE inthe Master File.
SMHLDNAME Alphanumeric,length=577V
HOLD file name.
SMRPCNAME Alphanumeric,length=577V
Procedure name the request originated from.Blanks = Ad hoc.
SMFEXLNO Alphanumeric,length=10
Procedure line number if SMRPCNAME is notblank.
SMFEXLOC Alphanumeric,length=254V
Physical location of the procedure if SMRPCNAMEis not blank.
SMZIIPTIME** Double The zIIP processor time used. This value is onlyavailable on MF processors running z/OS.
SMZIIPONCP** Double The zIIP on CP value. This value is only availableon MF processors running z/OS.
Usage Monitoring Table (RMLDB.MAS)
176 Information Builders

Field Value Description
SMZIIPON Alphanumeric,length=1
Indicates if zIIP was enabled. Values are Y, N, orblank. This value is only available on MFprocessors running z/OS.
SMCMDFOCUSIO Double The number of FOCUS I/O operations by therequest.
SMCMDDBMSIO Double The number of RDBMS adapter I/O operations bythe request.
SMRPCDBMSTIME** Double Elapsed time spent in RDBMS.
SMQPRIMRPCNUM Numeric, length=4 SMRPCS.SMRPCNUM value of the primaryprocedure or 0.
SMQRPCNUM Numeric, length=4 SMRPCS.SMRPCNUM value or 0.
SMREMARKS Alphanumeric,length=254V
Notes from admins, updated by GKE %REMARKcommand.
SMQSRVRNUM Numeric, length=4 Server number. Used in many-to-oneconfigurations.
SMCMDLN Segment
This segment contains one or more records that comprise the original request.
The following table lists the available fields, their values, and descriptions.
Field Value Description
SMCLNKEY Alphanumeric,length=38
Session key value.
SMCLNNUM Numeric, length=4 Command number.
SMCMDSEGNUM Numeric, length=4 Command line segment number.
SMCMDLINE Alphanumeric,length=72V
Command line.
A. Administrative Usage Monitoring Tables Column Descriptions
Resource Analyzer Administrator's and User's Manual 177

Field Value Description
SMCLSRVRNUM Numeric, length=4 Server number. Used in many-to-one configurations.
SMGOVEND Segment
This segment is updated if the Governor cancels the request and issues a Cancel message orissues an Advise message.
The following table lists the available fields, their values, and descriptions.
Note: Field values in the SMGOVEND segment with an exclamation point (!) after the nameindicate the length value for the field has changed from 8 to 48. Due to limitations of theoperating system, the PDS deployed servers will only allow a maximum of eight characters tobe stored in the field.
Field Value Description
SMGOVKEY Alphanumeric,length=38
The session key.
SMGOVNUM Numeric, length=4 Request number.
SMKBNAME Alphanumeric,length=48
Compiled rule file used.
SMRULENUM Alphanumeric,length=4
Rule number that determined the result or decision.
SMTHRESHTYPE Alphanumeric,length=8
Type of threshold exceeded.
SMTHRESHHOLD Alphanumeric,length=10
Value of threshold exceeded.
SMGDBMS Alphanumeric,length=8
EDA or SQL engine suffix.
SMGKNBTYPE Alphanumeric,length=6
Type of compiled rule file. Values are Both, Data,Custom, or Global.
Usage Monitoring Table (RMLDB.MAS)
178 Information Builders

Field Value Description
SMGDSNAME Alphanumeric,length=577V
Data source for compiled rule file.
SMGOVNTYPE Alphanumeric,length=1
C = Canceled, A = Advised
SMGSRVRNUM Numeric, length=4 Server number. Used in many-to-one configurations.
SMRMTS Segment
This segment contains the remote statistics for a request that retrieves data from a subserver.The resource values of this segment are in addition to the resource values of its parentsegment.
The following table lists the available fields, their values, and descriptions.
Field Value Description
SMRMTKEY Alphanumeric,length=38
The session key.
SMRMTNUM Numeric, length=4 The request number.
SMRMTSEGNUM Numeric, length=4 Remote number.
SMRMTETIME Double Remote session duration time.
SMRMTCTIME Double Remote session CPU time.
SMRMTIOS Double The number of I/O operations used in the remotesession.
SMRMTROWS Double The number of rows returned from the remotesession.
SMRMTSQLCODE Alphanumeric,length=11
The SQL return code from the remote request.
SMRMTPID Alphanumeric,length=11
Process ID of the session on the remote server.
A. Administrative Usage Monitoring Tables Column Descriptions
Resource Analyzer Administrator's and User's Manual 179

Field Value Description
SMRMTDATE Alphanumeric,length=8
The local date on the remote server.
SMRMTTIME Alphanumeric,length=9
Local time on the remote server.
SMRMTNAME* Alphanumeric,length=128V
Remote server name.
SMRMTSRVRNUM Numeric, length=4 Server number. Used in many-to-one configurations.
SMFNCTNS Segment
This segment contains a record for each function used in a monitored request.
The following table lists the available fields, their values, and descriptions.
Field Value Description
SMFUNKEY Alphanumeric,length=38
The session key.
SMFUNNUM Numeric, length=4 The request number.
SMFSEGNUM Numeric, length=4 The function number.
SMFUNCTION Alphanumeric,length=12
The function name.
SMFNAME Alphanumeric,length=577V
The data source that the field used.
SMFCOLUMN Alphanumeric,length=512V
The field that the function used.
SMASTKUSED Alphanumeric,length=1
Indicates whether or not an asterisk was used by thefunction. Values are Y or N.
SMFLITERAL Alphanumeric,length=32
The literal value, if used.
Usage Monitoring Table (RMLDB.MAS)
180 Information Builders

Field Value Description
SMFSRVRNUM Numeric, length=4 Used in many-to-one configurations.
SMRELTNS Segment
This segment contains a record for each WHERE or IF clause used in a monitored request.
The following table lists the available fields, their values, and descriptions.
Field Value Description
SMRELKEY Alphanumeric,length=38
The session key.
SMRELNUM Numeric, length=4 The request number.
SMRSEGNUM Numeric, length=4 The relation number.
SMLNAME Alphanumeric,length=577V
Data source name used in the LHS.
SMLCOLUMN Alphanumeric,length=512V
Field name used in the LHS.
SMRNAME Alphanumeric,length=577V
Data source name used in the RHS, or blanks.
SMRCOLUMN Alphanumeric,length=512V
Field name used in the RHS, or blanks.
SMOPERATOR Alphanumeric,length=8
Operator used in the clause. For example, <, =, !=, etc.
SMANDOR Alphanumeric,length=3
The AND or OR relational connector used.
SMNOT Alphanumeric,length=1
The NOT keyword used. Values are Y or N.
SMALL Alphanumeric,length=1
The ALL keyword used. Values are Y or N.
A. Administrative Usage Monitoring Tables Column Descriptions
Resource Analyzer Administrator's and User's Manual 181

Field Value Description
SMANY Alphanumeric,length=1
The ANY keyword used. Values are Y or N.
SMLITERAL Alphanumeric,length=32
The literal value, if used.
SMRSRVRNUM Numeric, length=4 Server number. Used in many-to-one configurations.
SMFROMS Segment
This segment contains a record for each data source used in a monitored request. It is theparent segment for the SMCOLMNS segments.
The following table lists the available fields, their values, and descriptions.
Field Value Description
SMFRMKEY Alphanumeric, length=38 The session key.
SMFRMNUM Numeric, length=4 The request number.
SMDSNUM Numeric, length=4 The data source number.
SMNAME Alphanumeric, length=577V The data source name.
SMSUFFIX Alphanumeric, length=8 The data source suffix, or blanks.
SMDBMS Alphanumeric, length=8 The EDA or SQL engine suffix.
SMDATATYPE Alphanumeric, length=1 The data source type:
P = Permanent
T = Temporary
R = Relational
SMMORE Alphanumeric, length=1 Used as MORE FILE. Values are Y, N, orblank.
Usage Monitoring Table (RMLDB.MAS)
182 Information Builders

Field Value Description
SMSUNAME Alphanumeric, length=8 The SU identifier.
SMALIAS Alphanumeric, length=128V The USE AS alias name.
SMDBLOC* Alphanumeric, length=577V The data source location.
Formerly named SMDBNAME.
SMMASLOC* Alphanumeric, length=577V The Master File location.
SMTBLNAME# Alphanumeric, length=577V Table name of the relational table.
SMFRSRVRNUM Numeric, length=4 Server number. Used in many-to-oneconfigurations.
SMCOLMNS Segment
This segment contains a record for each field retrieved from a data source in a monitoredrequest.
The following table lists the available fields, their values, and descriptions.
Field Value Description
SMCOLKEY Alphanumeric,length=38
The session key.
SMCCMDNUM Numeric,length=4
The request number.
SMCDSNUM Numeric,length=4
The data source number.
SMCSEGNUM Numeric,length=4
The column number.
SMCOLUMN Alphanumeric,length=512V
The column/field name.
A. Administrative Usage Monitoring Tables Column Descriptions
Resource Analyzer Administrator's and User's Manual 183

Field Value Description
SMDEFINE Alphanumeric,length=1
Column type:
0 = UNKNOWN
1 = REAL
2 = PERMANENT DEFINE
3 = TEMPORARY DEFINE
4 = COMPUTE
SMIDXKEY Alphanumeric,length=1
The indexed field. Values are Y or N.
SMBYTYPE# Alphanumeric,length=1
BY type:
1 = ORDER BY or BY
2 = GROUP BY
3 = ORDER BY & GROUP BY, or blank. Not used with BY.
SMBYORDER Alphanumeric,length=1
Sort order: ascending (A), descending (D), or blank.
SMCOLSRVRNUM Numeric,length=4
Server number. Used in many-to-one configurations.
SMDVPROP# Alphanumeric,length=1
Dimension Property: Dimension (D), Measure (M), or blank.
SMAUDIT Segment
This segment will contain the translated request if the original submitted request wastransformed from SQL to FOCUS or from FOCUS to SQL. It will also contain any messagesissued.
The following table lists the available fields, their values, and descriptions.
Field Value Description
SMAUDITKEY Alphanumeric,length=38
Session key.
Usage Monitoring Table (RMLDB.MAS)
184 Information Builders

Field Value Description
SMAUDITNUM Numeric, length=4 Audit Sequence number.
SMAUDITFEXNUM Numeric, length=4 Procedure number that caused this record to becreated.
SMAUDITCMDNUM Numeric, length=4 Request number that caused this record to becreated.
SMAUDITTYPE Alphanumeric,length=12
Audit record type. Values are:
Focus2SQL
Transform
SQL2Focus
SQL2SQL
SMAUDITREC Alphanumeric,length=512V
Audit record.
SMAUDITSRVRNUM Numeric, length=4 Server number. Used in many-to-one configurations.
SMAUDITEMGSRV# Alphanumeric,length=1
Y (Message was displayed), N (Message was notdisplayed), or blank (Not a message record).
Usage Monitoring RDBMS Table Sizing
The recommended size of the relational database tables will vary from one implementation toanother. The following are the major factors to consider:
Type of configuration: Standard or Many-to-One.
How many requests are anticipated from all configured servers?
The level of monitoring that will be used on each server:
There are two levels of detail in Stored Procedure monitoring.
There are seven levels of detail in Command monitoring.
A. Administrative Usage Monitoring Tables Column Descriptions
Resource Analyzer Administrator's and User's Manual 185

For more information on what levels of detail are available, see Configuring and AdministeringResource Management on page 29. The sizing example below assumes that all levels arebeing monitored.
The storage values shown in the table below are estimates. Resource Management usesVARCHAR for character fields that are greater than or equal to 120 bytes in length, except forthe SMREQUESTS and SMRPCREQUESTS tables, which use 72 byte VARCHAR fields. AllVARCHAR fields are the ACTUAL size plus 2 bytes. This size difference is used in the TableSize chart but not in the tables used to describe each field.
Note: The table with a $ is used by Resource Governor. It must be allocated, but the size canbe reduced if you are not using Resource Governor.
Table Name Number ofRows
Row Size Table Size inKB*
Notes
SMSERVERS 1 220 1 1-n rows. Where n is the number ofconfigured servers in the repository.
SMSESSIONS 30000 1111 56960 One row per session.
SMQUERY 300000 2273 1165356 One row per data request.
SMREQUESTS 3000000 124 635724 1-n rows per data request, where n is thenumber of 72 character segments in thedata request.
SMGOVERN$ 15000 710 18175 One row per governed request.
SMREMOTES 20000 251 8579 1-n rows per suffix=EDA data request,where n is the number of subservers usedin the request.
SMFROMS 750000 2522 3232544 One row for each data source used.
SMCOLUMNS 1500000 573 1466309 One row per column returned or held.
SMFUNCTIONS 50000 1188 101514 One row per function used.
SMRELATIONS 150000 2282 584985 One row per relational test.
SMRPCS 35000 1335 79852 One row per stored procedure.
Usage Monitoring RDBMS Table Sizing
186 Information Builders

Table Name Number ofRows
Row Size Table Size inKB*
Notes
SMRPCREQUESTS 40000 1076 73555 One row per parameter pass to theprocedure. For example, EX MYCARPARM1=A, PARM2=B will create two rows. Ifthe procedure is executed without anyparameters, then no rows are created.
SMRPCWF 35000 2624 156953 One row per stored procedure fromWebFOCUS.
SMAUDIT 3000000 581 2973633 1-n rows per translated request or messageissued in a session.
Example of a WebFOCUS procedure:
EX MYWFFEX PAY=50000
Where MYWFFEX contains:
SELECT E.NAME, E.ADDRESS, E.JOBTITLE, J.JOBDESCRIPTION, J.PAYFROM EMPLOYEE E, JOBS JWHERE E.JOBTITLE = J.JOBTITLE AND J.PAY < &PAYORDER BY J.JOBTITLE, J.PAY;
Stores:
1 SMSESSION (1 * 1111) 11111 SMQUERY (1 * 2273) 22735 SMREQUESTS (4 * 124) 4962 SMFROMS (2 * 2522) 50445 SMCOLUMNS (5 * 573) 28652 SMRELATIONS (2 * 2282) 45641 SMRPCS (1 * 1335) 13351 SMRPCREQUESTS (1 * 1076) 10761 SMRPCWF (1 * 2624) 2624 ------ 21388 bytes of storage
To determine the average storage needed, take the average of the least complex monitoredrequest and the most complex, and multiply that value by the number of requests that couldbe monitored in a month or year.
A. Administrative Usage Monitoring Tables Column Descriptions
Resource Analyzer Administrator's and User's Manual 187

The size of the table is calculated using a CP size, or character size, of 1. If the server is usinga UNICODE code page (for example, CP65001), the size of the rows should be recalculatedusing a CP size of 3 to obtain the correct table size. The formula for calculating the table sizeis defined as:
(Rows * (Size * CP size) * 1.75) / 1024 = KB.
When creating a Db2 TABLESPACE, this value should be used for PRIQTY.
If the RDBMS being used for the repository uses a different byte size for nvarchar fields, usethe value used by the RDBMS. A general rule is that nvarchar fields will use three bytes torepresent a character. All table sizes have been rounded up as necessary.
Usage Monitoring RDBMS Table Sizing
188 Information Builders

AppendixBTime Fields in Resource Management
This appendix explains the time fields available in Resource Management.
In this appendix:
Time Field Definitions
Time Field Definitions
All of the fields listed in this appendix can be found in the RMLDATA/RMLDB synonyms.
The following field contents are based on "wall clock" time and are stored in A9 fields in date/time (HHMMSSNNN) format. DEFINE fields are provided for individual components.
Session table - SMSESS
SESSSTART - SESSSTOPThese two fields cover the time a connection request causes the ResourceManagement (RM) code to be called and the time the connection is terminated.
RPC table - SMRPCS
SMRPCTIME - SMRPCSTOPThese two fields cover the start and stop time of all the Remote Procedure Call (RPC)requests in a session. There is at least one RPC request per session but there can bemore.
Command table - SMQUERY
SMTIME - SMSTOPThese two fields cover the start and stop time of the Command (for example, TABLE,TABLEF, and MODIFY). There can be one or more Commands processed per RPC persession.
The following fields are based on machine timers and the data is stored in 10,000th of asecond. DEFINE fields are provided for times converted to seconds, Minutes, and Hours.
Session table - SMSESS
SESSDUR This field contains the total duration of the session.
SESSCPU This field contains the total CPU used during the session.
Resource Analyzer Administrator's and User's Manual 189

SMDBMSTIME This field is the total of all SMCMDDBMSTIME values for all commands executedduring the session.
RPC table - SMRPCS
SMRPCETIME This field is the total elapsed time from the start of the RPC to the end of the RPCrequest.
SMRPCCTIME This field is the total CPU time used from the start of the RPC to the end of the RPCrequest.
SMRPCDBMSTIME This field is the total of all SMCMDDBMSTIME values for all commands executed bythe RPC.
Command table - SMQUERY
SMELAPETIME This field is the total elapsed time from the start of a command to the end of thecommand. This value contains the elapsed time of the command and also includesthe elapsed time spent processing a command that uses DBMS time.
SMCPUTIME This field is the total CPU time from the start of a command to the end of thecommand.
SMCMDDBMSTIME This field is the total elapsed time from the start of the servers SQL Adapterprocessing to the end of the SQL adapters data retrieval.
This time field is only created at the request level and is the length of time spent bythe various server processes that prepare the request, sends the request to theRDBMS server, and processes the answer set received. The DBMS time values for aSMRPCDBMSTIME and SMDBMSTIME field are accumulation values derived from all ofthe commands executed in the session.
When a SQL request that accesses data starts, the DBMS start timer is set to thecurrent time in 10,000th of a second. When the SQL request ends, the DBMS endtimer is set to the current time in 10,000th of a second. The DBMS time is a subsetof time spent while the SQL request was being processed between the time ResourceAnalyzer started monitoring the request and the time Resource Analyzer finished. TheCPU time consumed by the RDBMS while processing the request is not available toRM and is not included.
Time Field Definitions
190 Information Builders

There are two different ways the DMBS timer is used:
Direct Passthru Requests
Synonym Requests
Synonym Requests
Synonym Requests
There are two different ways the DMBS timer is used:
Direct Passthru Requests
Synonym Requests
Direct Passthru Requests:
The SMCMDDBMSTIME timer starts when the DPT processor is called and ends when the DPTprocessor finishes processing. The length of time spent in this process is stored in therepository and is used in reporting as HH:MM:SS.nnnn. This type of request will have a smalldifference between the SMELAPTIME and the SMCMDDBMSTIME because of the minimalamount of time used by the server to prepare the request for processing. As stated before,SMCMDDBMSTIME is only an elapsed time value and includes both server SQL adapter timeand RDBMS server time.
Synonym Requests:
As with Direct Passthru requests, the SMCMDDBMSTIME timer starts when the request typeprocessor is called and ends when the processor finishes processing. The length of time spentin this process is stored in the repository and is used in reporting as HH:MM:SS.nnnn. Thistype of request will have a larger difference between the SMELAPTIME and theSMCMDDBMSTIME because of the additional processing time used to transform and optimizethe request to SQL syntax that meets the requirements of the RDBMS server. The differencealso includes the processing of the synonym before transformation and optimization andprocessing the returned answer set.
B. Time Fields in Resource Management
Resource Analyzer Administrator's and User's Manual 191

The following image shows an example of a session that executes one RPC that executes twocommands.
The session duration and CPU timers are started when the connection to the server isestablished and ends when the session disconnects. At session start time, no DBMS timer isstarted. The RPC duration and CPU timers are started when the server calls the ResourceManagement RPC processor. Just like the session processing no DBMS timer is started. Whenan RPC executes a monitored command, the Resource Management command processor iscalled for initialization. After initialization finishes and Resource Management returns control tothe server, one of two paths will be taken, either Direct Passthru or Synonym processing.
For an SQL command that uses a Direct Passthru command, the processor starts the serverDBMS timer. When the answer set is retrieved, control is returned to the server and the DBMStimer is stopped. The Resource Management command processor is then called to end itsprocessing.
Time Field Definitions
192 Information Builders

For a synonym command that accesses data on a DBMS server the request is transformed andoptimized, if needed, and then calls the SQL processor, which starts DBMS timer. When theanswer set is retrieved, control is returned to the server and the DBMS timer is stopped. Whenthe answer set has been formatted, Resource Management command process is called to endits processing.
During the call to end the Resource Management command process at the end of a request,the DBMS timer value of the server is copied to the SMCMDDBMSTIME field. It is also addedto the SMRPCDBMSTIME and SMDBMSTIME fields. If the current RPC processes anothercommand, the process outlined above is repeated.
B. Time Fields in Resource Management
Resource Analyzer Administrator's and User's Manual 193

Time Field Definitions
194 Information Builders

AppendixC Using DDL Statements to Create theInternal Tables
This appendix explains how to use DDL statements to create the Resource Managementinternal tables.
In this appendix:
Overview of Creating the Resource Analyzer and Resource Governor Internal Tables
Overview of Creating the Resource Analyzer and Resource Governor Internal Tables
The Resource Management internal tables are created using the server Web Console. If youneed or prefer to create the internal tables yourself, as required by your site, you can createthem for any supported relational database.
Procedure: How to Create the Internal Tables
To create the Resource Management repository table:
1. Start the Web Console of the server on which Resource Management will be configured.
2. Verify that the data adapter is configured to the database where the ResourceManagement repository will be created. If the data adapter is not configured, you must doso now before continuing.
Note: The same Connection Name used when configuring the data adapter is required.
3. Configure Resource Management.
a. Click the Resource Management link on the sidebar.
b. Click Configure in the ribbon or right-click Resource Management in the navigationpane and select Configure.
c. Enter the license key from the packing slip and click Next.
Note: For more information, see Configuring Resource Management on page 30.
4. Enter the server name and select Relational from the Repository drop-down menu.
5. Select DDL Only from the Create Repository drop-down menu.
Resource Analyzer Administrator's and User's Manual 195

6. Enter the necessary information required to configure the repositories, as shown in thefollowing image.
Note: For Data Adapter and Owner/Schema, you must use the same values you usedwhen configuring the adapter.
7. Click Create DDL.
8. Edit the file as needed for use at your site:
a. Add any additional site-specific requirements. Consult the appropriate RDBMSmanuals for additional information.
b. Using a command shell, or another product, execute the modified DDL to create theResource Management repository tables.
Note: The DDL statements are created without a semi colon at the end of eachCREATE command. If your platform requires this, for example, Mainframe Db2 via ISPFSPUFI, the semi colon must be added. Do not add it if your environment is UDB.
9. Configure Resource Management.
a. Click the Resource Management link on the sidebar.
b. Click Configure in the ribbon or right-click Resource Management in the navigationpane and click Configure.
Overview of Creating the Resource Analyzer and Resource Governor Internal Tables
196 Information Builders

c. Enter the license key from the packing slip and click Continue.
Note: For more information, see Configuring Resource Management on page 30
10. Select No from the Create Repository drop-down menu.
11. Enter the same information that you used in step 6.
12. Click Configure.
C. Using DDL Statements to Create the Internal Tables
Resource Analyzer Administrator's and User's Manual 197

Overview of Creating the Resource Analyzer and Resource Governor Internal Tables
198 Information Builders

Index
A
accessing columns 144
activity graphs
hyperlinks 112
administration 25
hyperlinks 25
administrator 25
aggregation 18
analysis modes 17
frequency of use 134
historical 128, 132, 137
performance 17, 20
resource utilization 127, 131
application development 17
application revisions 19
B
benchmarking 17, 25
billing resource usage 19
browsers help 163
C
calculating column values 18
calendar 25
candidates for denormalization reports 151
candidates for summary level databases reports
153
change impact 19, 144
changes 25, 144
chargeback 17, 19
columns 18, 23, 133, 134, 137, 150
calculating values 18
dormant 17, 145, 150
functions 153
common reports 25, 112, 144, 145
candidates for denormalization 151
candidates for summary level databases 153
change impact 144
CPU bound reports 148
dormant data summary 150
I/O bound reports 148
large answer set procedures 148
menu 145
optimization 154
configuring resource management 30
using a FOCUS repository 30
using a relational repository 30
configuring the repository 30
context-sensitive help 163
CPU bound reports 148
CPU time 25, 128, 136, 137, 148
reducing 18
custom reports 112
hyperlinks 112
Resource Analyzer Administrator's and User's Manual 199

D
data 17, 18
analyzing 18
deleting 25
dormant 17, 23, 145, 150
moving/migrating 19
redundant 18
return on investments 19
sources 150
usage monitoring 25, 112
dates for reports 25
decision support analysis 17
denormalization 18, 25, 136, 145, 151
displaying reports 112
dormant data 17, 23, 25, 136, 145, 150
drilling down on reports 119
E
EDA 16
educating users 17, 19, 136, 145, 148
enabling and disabling monitoring 39
Excel 25, 119
expense justification 17
F
field descriptions 165
formats 25, 119
frequency of use 120, 130, 134
functions 153
G
graphical reports 119
guides 112
H
help 118, 161, 163
historical 128, 132, 137
horizontal graphs 25
hyperlinks 25, 112
I
I/O bound reports 128, 134, 136, 137, 144, 148,
151
identifying dormant data 17
identifying users 19
impact reports 144
improving performance 17
indexing 18, 23, 136
introductory window 112
J
joins 18
L
large answer set procedures reports 148
license key 30
Index
200 Information Builders

M
Main menu 134, 136, 145
administration hyperlink 25
migrating data 19
migrating the repository 98
modes of analysis 25, 112
frequency of use 120, 130, 134
historical 128, 132, 137
resource utilization 131
monitor preference 39
resetting 39
monitoring data 39
monitoring
data sources 39
enabling and disabling 39
relational sources 39
moving data 19
N
normalization 18
O
OLTP 17, 18
online help 118, 163
optimization report 154
options 114
over time 137
P
PDF 25, 119
peer graphics 25
performance 17
analysis 17, 20, 112, 145
usage 19
pre-aggregation 18, 136, 145, 153
pre-joining 18, 136, 145, 151
procedures reports 25, 129, 144
frequency of use 120, 130, 134
historical 128, 132, 137
resource utilization 131, 136
Q
quantifying return on investments 19
R
re-hosting data 19
re-sorting reports 119
reducing CPU time 18
redundant data 18
Reformat As icon 25, 119
relational sources 39
monitoring 39
reports 25, 114, 134, 144
activity graphs 112
candidates for denormalization 151
candidates for summary level databases 153
categories 145
change impact 144
Index
Resource Analyzer Administrator's and User's Manual 201

reports 25, 114, 134, 144
common reports 112, 145, 148, 150, 151,
153, 154
CPU bound 148
custom reports 112
data Sources 133
displaying 112
dormant data summary 150
drilling down 119
formats 119
frequency of use 120, 126, 130, 134
graphical 119
help 118
historical 128, 132, 137
hyperlinks 112, 145
I/O bound 148
large answer set procedures 148
Main menu 112, 126, 131, 133
optimization 154
options 114
performance analysis 112
procedures reports 131
re-sorting 119
resource utilization 131
selection criteria 148
usage 112
users 126
repository 30
configuring 30
migrating 98
requests 23, 129, 144, 148, 151
frequency of use 120, 130, 134
historical 128, 132, 137
resource utilization 131, 136
resource-intensive 131, 145
tracking 16
usage 21
using functions 153
volume 145
resetting monitor preference 39
Resource Analyzer 16
guides 112
resource management 30, 98
configuring 30
enabling 30
removing 39
repository 30
repository maintenance 39
resource usage 19, 21, 128, 134, 136, 145, 148
billing 19
requests 131
tracking 16, 25
resource-intensive 129
return on investments 19
returned rows 128, 134, 136, 137, 144, 148,
151
revisions 19
ribbon 30
organization 30
ROI 19
Index
202 Information Builders

rows 134, 136, 144, 148, 151
running reports 112
S
sample data access questions 23
selection criteria 25, 148
selling 17
service management 17
SLAs 17, 145
SMCOLUMNS table 165
SMDSNS table 165
SMFROMS table 165
SMFUNCTIONS table 165
SMGOVERN table 165
SMGROUPBYS table 165
SMORDERBYS table 165
SMQUERY table 165
SMRELATIONS table 165
SMREQUESTS table 165
sorting 25
summarization 18, 23, 25, 136, 145, 151, 153
T
tables 165
SMCOLUMNS 165
SMDSNS 165
SMFROMS 165
SMFUNCTIONS 165
SMGOVERN 165
SMGROUPBYS 165
tables 165
SMORDERBYS 165
SMQUERY 165
SMRELATIONS 165
SMREQUESTS 165
usage monitoring 16, 165
tabular reports 119
testing designs 17, 18
tracking requests 16
tracking resource usage 16
trends 17
U
usage monitoring 21
billing 19
data sources 136
performance 19
reports 112, 144
tables 16
users 134, 137
chargeback 19
educating 19, 145, 148
identifying 19
reports 126
V
vertical graphs 25
viewing reports 112
volume 128
Index
Resource Analyzer Administrator's and User's Manual 203

Index
204 Information Builders

FeedbackCustomer success is our top priority. Connect with us today!
Information Builders Technical Content Management team is comprised of many talentedindividuals who work together to design and deliver quality technical documentation products.Your feedback supports our ongoing efforts!
You can also preview new innovations to get an early look at new content products andservices. Your participation helps us create great experiences for every customer.
To send us feedback or make a connection, contact Sarah Buccellato, Technical Editor,Technical Content Management at [email protected].
To request permission to repurpose copyrighted material, please contact Frances Gambino,Vice President, Technical Content Management at [email protected].

Information Builders, Inc.Two Penn PlazaNew York, NY 10121-2898
Resource Analyzer Administrator's and User's ManualVersion 7 Release 7.08
DN3501986.0418