Embed Size (px)
Citation preview
Resonance structures in elastic and Raman scatteringfrom microspheres
Chak K. Chan, Richard C. Flagan, and John H. Seinfeld
To study the interactions between Mie scattering and Raman emissions of spherical particles, we measured
the Raman spectra together with the elastically scattered light of the excitation source of an evaporating
aqueous sodium nitrate droplet. Resonance structures were observed in the temporal profiles of the
elastically scattered light and Raman nitrate and water emissions. The resonance structures in these three
profiles occurred in a concerted mode but sometimes occurred independently of each other. A model of
inelastic scattering by microspheres by Kerker et al. ["Raman and Fluorescent Scattering by Molecules
Embedded in Spheres with Radii up to Several Multiples of the Wavelength," Appl. Opt. 18, 1172-1179
(1979); "Lorenz-Mie Scattering by Spheres: Some Newly Recognized Phenomena," Aerosol Sci. Technol. 1,
275-291 (1982); "Inelastic Light Scattering," in Aerosol Microphysics I: Particle Interaction, W. H. Marlow,
Ed. (Springer-Verlag, New York, 1980); "Model for Raman and Fluorescent Scattering by Molecules Embed-
ded in Small Particles," Phys. Rev. A 13, 396-404 (1976)] and the behavior of low order Mie resonances were
used to explain the data. This type of data can be used for the determination of chemical compositions of
spherical particles.
1. Introduction
Spectroscopic techniques such as Raman spectros-copy can be used to determine the chemical composi-tion of single suspended particles.1 Raman spectros-copy of aerosol particles was first applied by analyzingmicroparticles on a substrate.2 Recently, Ramanspectroscopy has been applied to levitated single mi-croparticles using either the electrodynamic balance oroptical levitation. Preston et al. 3 measured the Ra-man spectra of optically levitated dioctyl phthalatedroplets. Thurn and Kiefer also used optical levita-tion to study Raman emissions of glass microspheres4 5
and of water and glycerol droplets.6 Using an electro-dynamic balance, Fung and Tang7-10 studied Ramanemissions from droplets of aqueous solutions of vari-ous inorganic salts such as sulfates and nitrates. Byusing a high resolution monochromator, they observedfine spectral structures indicating phase transitions insupersaturated droplets and cation effects on the Ra-man spectra of anions (e.g., sulfates and nitrates).
All authors are with Department of Chemical Engineering, Cali-
fornia Institute of Technology, Pasadena, California 91125.Received 22 February 1990.0003-6935/91/040459-09$05.00/0.© 1991 Optical Society of America.
Although identification of the chemical nature ofsingle suspended particles using Raman spectroscopyhas been demonstrated, quantitative Raman analysisof spherical particles for chemical composition deter-mination is complicated because of the coupling withMie scattering. Benner et al.1 observed structuralresonances in the fluorescence spectra from dye im-pregnated polystyrene microspheres suspended in wa-ter. Resonance structures in Raman spectra of levi-tated spherical particles have also been reported.Thurn et al. 6 observed resonance structures superim-posed on the broad spectrum seen in bulk samplespectra in the 0-H stretching region of the Ramanspectra of a 1:6 water-glycerol droplet mixture. Theyidentified individual peaks of the measured Ramanspectrum as Mie resonance peaks. Preston et al.3
reported similar resonance structures in the Ramanspectra of the C-H stretching region of optically levi-tated dioctyl phthalate droplets. As the droplet evap-orated due to heating from the argon laser used as theexcitation source and also that for optical levitation,the resonance peaks in the Raman spectra shifted sys-tematically with time. Moreover, the observed reso-nance structures in the measured Raman spectrachanged when different droplet sizes were used.
The resonance peaks in inelastic spectra of sphericalparticles reported by the above mentioned researcherscan be attributed to morphology dependent reso-nances that are strong functions of particle size andoptical properties. Since a minute change in size that
1 February 1991 / Vol. 30, No. 4 / APPLIED OPTICS 459
occurs during slow evaporation can result in large fluc-tuations in scattering intensity, this sensitivity of thescattered light intensity can be used to determine par-ticle size to 1 part in 105. The refractive index of theparticle and the size parameter, which is the ratio ofparticle circumference to the optical wavelength ofinterest, determine the locations of these resonances.In Raman scattering, the wavelengths involved are theexcitation laser wavelength and those of the Ramanemissions. If any wavelength involved in the processcorresponds to a resonant wavelength of the particle,the scattered intensity will be significantly affected byMie resonances.
Raman emissions can be envisioned to occur as aresult of a two-step process. The first is the excitationof the Raman active molecules by absorption of pho-tons of incident frequency. The second step is therelease of photons at a shifted frequency when theexcited molecules fall back to their ground states. Thelocal emitted Raman intensity is proportional to thelocal excitation field intensity. For a bulk sample, thelocal field strength is relatively uniform or can becorrected for the Gaussian nature of the excitationlaser beam when the dimension of the scattering vol-ume is comparable to or larger than the beam waist ofthe laser beam. On the other hand, in the case of Miescattering, the local excitation field intensity insidethe particle is strongly dependent on the size and re-fractive index of the particle. Hence Raman scatter-ing from spherical particles can be complicated by Miescattering in two ways. Since the internal excitationfield drives the Raman emissions, one expects Ramanemissions at all wavelengths to be enhanced when theincident excitation itself is at a Mie resonance. Whenthe Raman shifted light corresponds to a resonantwavelength, the emission intensity at that particularwavelength will be selectively enhanced.
Understanding of the interactions of Mie scatteringand Raman emissions is crucial to the application ofquantitative Raman spectroscopy of spherical parti-cles. Kerker and associates2 -15 have modeled inelas-tic scattering from microspheres, predicting the inten-sities of the elastically scattered light and the Ramanemissions as a function of particle size and opticalproperties. Although resonance peaks in Ramanspectra have been reported by various researchers,3 -8systematic studies of resonance peaks in the elasticallyscattered light and Raman emissions as a function ofthe size parameter have not been presented. Suchdata are necessary for the validation of quantitativemodels of Raman scatterings from microspheres andthe ultimate application of this technique to quantita-tive analysis.
We present results of some experimental studiesrelating to the interactions of resonances in the inten-sity profiles of the elastic and Raman scattering of anevaporating aqueous sodium nitrate droplet. We firstdescribe Kerker's model and present some of the keyresults for elastic and Raman scattering from micro-spheres. From these equations, the relationships be-tween resonances in elastic and Raman spectra can be
understood. Experimental measurements of the elas-tically scattered light and Raman emissions from anevaporating sodium nitrate droplet will then be report-ed.
II. Inelastic Scattering of Microspheres
Kerker and co-workers12 -15 developed a detailedmodel for inelastic scattering from microspheres. Themicrosphere is assumed to contain a Raman activemolecule arbitrarily located at position r' and that theboundary of the particle only affects the local excitingfield inside the particle and the emitted radiation butnot the molecular transitions. The field inside theparticle consists of two parts, the internal field due tothe incident excitation of frequency wo and a secondaryfield of a different frequency that represents theRaman emissions. The Raman emission is classicallyviewed as generated by a dipole representing the Ra-man active molecule located at r', which undergoesforced oscillations at frequency w induced by the localexcitation field. The strength of the induced dipole pon which the Raman field depends is described as theproduct of an effective polarizability a and the localexcitation field. The secondary field of frequency inthe particle is the sum of the induced dipole field andan internal field due to the medium of the microspherewhich is postulated to account for the effects of theboundary of the particle. Outside the particle, thereare two outgoing fields: one of frequency w due toRaman scattering from the particle and another offrequency coo from the elastic scattering. Here wepresent the key expressions for the elastic internal andexternal fields and inelastic external fields for Ramanemissions. Using these equations, we examine therelationship of resonances of elastic and Raman scat-tering from a spherical particle. This analysis is im-portant to the interpretation of resonance peaks in theRaman spectra reported later in this paper.
In the following equations, the media inside andoutside the particle are labeled 1 and 2, respectively,with magnetic permeabilities Aul and ,2, wavenumbersk, and k2, and refractive indices n1 and n2. The parti-cle radius is a. The local excitation electric field E(r)and magnetic field B(r) of frequency wo at location rinside the particle, which were also called the transmit-ted fields in Chew et al.,
15 may be written as a series ofvector spherical harmonics:
El(r) = E V(ic/n'0)YE(,m)VxUI(klr)Yllm()]
+ yM(1,m)jj(klr)Yjjm(P)}, (1)
B1 (r) = Z h'E(1,m)jl(klr)Yjjm(r)I'm
- (iC/awo),Ym(ls m)Vx[Jl(klr)Yll m( )]I, (2)
where r = IjrJI and r = r/r. The units and othernotation are the same as in Jackson,16 except for thevector spherical harmonics which follow Edmonds.17The internal field coefficients YE(l,m) and yM(l,m) are
460 APPLIED OPTICS / Vol. 30, No. 4 1 February 1991
(inj/Aj/k2 a)aE(1,m)
n2 2jj(kja) [k2ah(1 )(k2 a)]'-n2yjh(1)(k2a) [kjajj(kja)j'
(3)
'YM(lmn) = -(i'l/k 2 a)arM(1,m)
1i2 h(')(k 2 a)[kjaj(kja)]'- Aijj(kja)[k 2 ah(1)(k2a)]' )
where Ii and h(l) denote spherical Bessel functions oforder 1,
cM(l,m)
-(i' 2/kla)aM(1,m)
1 2h(1)(k2a)[kajj(kja)]' - Alj,(kja) [k2ah(1)(k2a)I''(
It should be noted that some of the field coefficientslisted above are not identically the same as those inChew et al.15 We have substituted the dielectric con-stant E, which was used in their original equations with,u and n, using
n2 = gll 2 = fsni Alel, n~2 22 (13)
and aE(l,rn) and aM(l,m) are the incident field coeffi-cients, functions of 1 and m only.
Similarly, the external elastically scattered fieldoutside the particle can be described as
Ejr) = E I(ic/n2W0)IE(l,m) Vx[h(1)(k2r)Yllm(ij]I,m
+ flM(I,m)h,()(k 2 r)Yllm(P)j, (5)
Bjr) = 1 fE(,m)h(1)(k 2r)Yujm(P)I,m
-(ic/WO)1M(l,m) vx[h(l)(k 2 r) Yllm(5)]I, (6)
where the external elastically scattered field coeffi-cients 13 E(l,m) and f3M(l,m) are
flE(1,m)
in2 jij(k2a) [klajj(kja)'- n 22il(kia) [k2ajj(k 2a)]'kaE(1,m)
n1A2jj(kja)[k2ahj()(k2a)I'- n2/h(1)(k 2a)[kajj(kia)]'
M(I,m)
uljl(kla) [k2al(k2a)]'-,u2jl(k 2a)[klajil(kla)]'IaM(l,m)
1 i2 h(')(k2 a)[klajl(ka)]'-Aijl(kla)[k 2 ah(l)(k 2a)]'
Note that the kia and k2a terms in the y and fl termsrefer to light of frequency wo, the incident light fre-quency. The poles of the y and f terms determine theconditions for resonances. Since the coefficients aE
and lE, am and 1M have the same denominators, boththe internal and external fields will exhibit resonancewhen wo is coincident with a resonance frequency of theparticle. In a similar fashion, the Raman field atfrequency w outside the particle can also be written as
E2(r) = J $(ic/n2 )cE(lm)Vx[h,()(k 2r)Yllm(ii]
+ cM(l,m)h(1)(k2 r)Yjm(r)), (9)
B2 (r) = 1 {cE(,m)h(1)(k2 r)YIjm(r)
-(ic/w)cM(l,m)vx[h(')(k 2 r)Ylum(9]I} (10)
where the Raman outgoing field coefficients cE(l,m)
and cM(l,m) are
cE(l,m)
(in2 2/kla)aE(11m)
n'1A2 j1 (ka)[k 2ahj()(k 2 a)]'- n2Agh(1)(k2a)[kjaj 1 (kja)]'
so that the field coefficients can be compared moreclearly.
The coefficients aE and aM in Eqs. (11) and (12),respectively, are the dipole field coefficients referringto a specific dipole representing a Raman active mole-cule localized at r'. However, they are proportional tothe dipole moment p which can be described by theproduct of an effective polarizability a and the localtransmitted field El(r) of frequency wo. Hence CE andCM are both proportional to El(r'). If wo correspondsto a resonance frequency for El (r'), the Raman scatter-ing field will also be at resonance, regardless of thefrequency co at which the Raman emissions occur.Therefore, one can expect that resonances in the entireRaman spectrum at all c's and in the elastic spectrumcan occur simultaneously. More precisely, resonancein the elastic scattering is a necessary and sufficientcondition for simultaneous resonances of Raman emis-sions at all frequencies.
Note that the -YE and CE (and similarly -yM and CM)
have the same form of denominator, although the argu-ment in the latter refers to the Raman emission fre-quency co, while that of the former refers to the incidentexcitation frequency wo. Since YE and CE have thesame form of denominator, one can see that resonancein the Raman scattering field can occur in a similarfashion as in elastic scattering. When w correspondsto a resonant frequency, resonance occurs and theRaman emission at this particular frequency will beselectively enhanced. Therefore, one can expect reso-nances in a Raman spectrum to occur at selected wave-lengths independent of each other as have been ob-served in broadband Raman spectra of droplets3 78
and glass microspheres. 4 -6
III. Evaporation of an Aqueous NaNO 3 Droplet Levitated
in an Electrodynamic Balance
A conventional bihyperboloidal electrodynamicblance was used to trap and levitate a droplet station-ary for the Raman experiment. Details of the appara-tus, which is illustrated in Fig. 1, have been reportedelsewhere.'8 A droplet of sodium nitrate solution wascharged and introduced into the balance. After it wasdried at vacuum, water vapor from a thermostatedwater reservoir was introduced, and the droplet wasequilibrated to a constant size. Then, as the pressurein the balance was slowly reduced, the droplet evapo-rated and the elastically scattered light exhibited sev-eral resonance peaks during this size change. Both the
1 February 1991 / Vol. 30, No. 4 / APPLIED OPTICS 461

Ncedlc valvecontrolling vacuum
optics
Temperature ath
Fig. 1. Electrodynamic balance.
Raman spectra and elastically scattered light were re-corded as a function of time.
To illustrate the two types of resonance describedabove, the solution studied should contain at least oneRaman active component, preferably two, so that thescattering intensities for different Raman shifts can becompared. The Raman spectrum of a sodium nitratesolution exhibited a nitrate peak at -1040 cm-' and abroad water peak at 3200-4000 cm-'. Another advan-tage of using a sodium nitrate droplet is that one cancontrol the rate of evaporation easily. The rate ofevacuation was manually adjusted using a needle valveso that appreciable change in the intensity of the elas-tically scattered light could be observed. The originalsize of the droplet was -20 jum in diameter. Theevaporation of water caused an 12% reduction inweight, i.e., a 4% reduction in particle size.
IV. Elastic and Raman Scattering Intensity Profiles of anEvaporating NaNO 3 Droplet
Figure 2 shows the apparatus used to measure theRaman scattering from single particles. A Spectra-Physics 2020 Ar-ion laser at 488.0 nm was used as theexcitation source. It was operated at a nominal powerof 0.5 W. The laser beam was focused on the particleby a lens with a focal length of 125 cm. The spectra of90° scattered light, containing the scattered laser lightand the Raman nitrate and water peaks, were recordedby a Princeton Instrument IRY 700 optical multichan-nel analyzer (OMA). The OMA was operated at 200Cwith the photocathode cooled to about -25o C by flow-ing chilled methanol. It was attached to a SPEX 340Emonochromator with a dispersion of 10 nm/mm using a300-groove/mm grating, which has a spectral rangesufficient to cover the laser scattered light and theRaman nitrate and water peaks. The OMA was con-trolled by a Princeton Instrument ST120 controllerwhich was interfaced to an AT compatible computer.The measured Raman spectra were automaticallystored in a hard disk via direct memory access.
B ea mn 1 11 I ".Splitter Detector _ ! F* Z 9
Laser Line Filter L ch iiio I
t Ar +
Fig. 2. Raman spectroscopy of single particles using an OMA.
Since the laser scattered light was orders of magni-tude more intense than the Raman signal, a series oflong pass filters was employed to attenuate the intensi-ty of the elastically scattered light until the laser lightand Raman signal fell into the same dynamic range ofthe OMA. By multiplexing the spectra using theOMA, the laser scattered light and Raman emissionsfrom the particle were monitored simultaneously inreal time as the droplet evaporated. Because the di-electric filter used was very sensitive to optical align-ments, light scattered from the particle was collimatedby a f/3 lens before passing through the filters. Afterthe filters, it was focused on the slit of the monochro-mator by a f/5.9 lens, which matches the f/No. of themonochromator. To shorten the integration time ofeach Raman measurement, the slit of the monochro-mator was adjusted to 200,gm. Beyond this value, thepeak of the laser light only broadened without increas-ing its peak value. This slit width limits the spectralresolution to 14-19 cm-'. The integration time em-ployed was 1.6 s.
462 APPLIED OPTICS / Vol. 30, No. 4 / 1 February 1991
LASER
3000 2500~~~~~~~
1000 2000iavenumbef cm- ")
0Q
1500
500
3000 4000 a:0
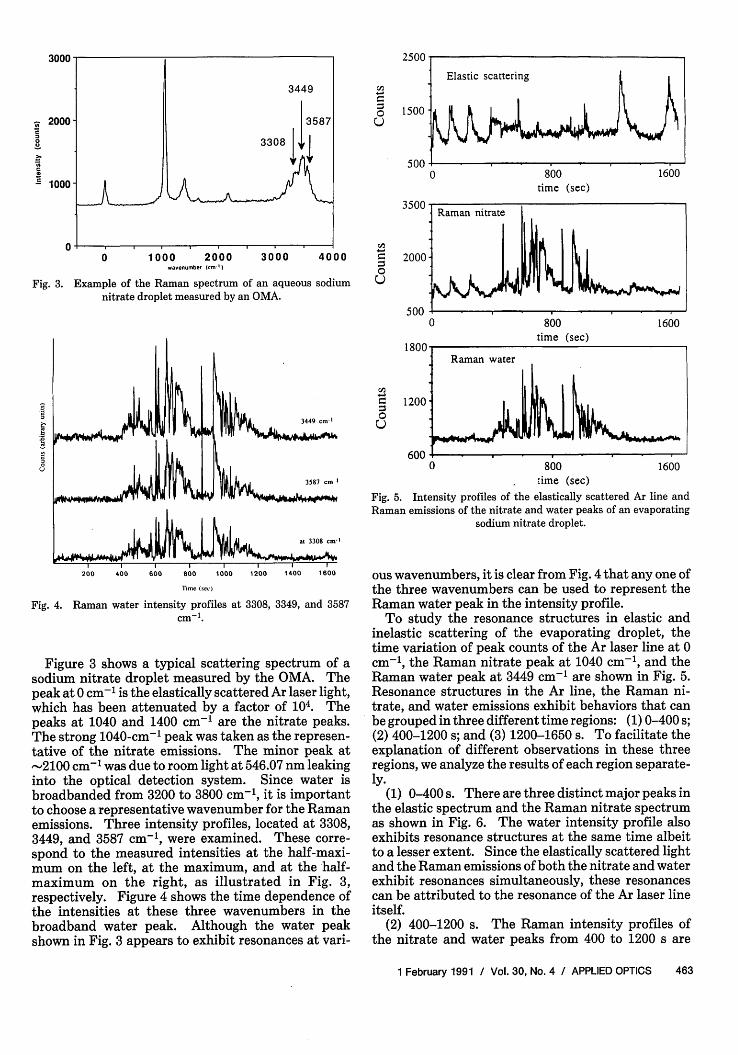
Fig. 3. Example of the Raman spectrum of an aqueousnitrate droplet measured by an OMA.
sodium k%)
0 800 1600time (sec)
0 800 1600time (sec)
Fig. 4. Raman water
i-c
intensity profiles atcm-1
3308, 3349, and 3587
Figure 3 shows a typical scattering spectrum of asodium nitrate droplet measured by the OMA. Thepeak at 0 cm-' is the elastically scattered Ar laser light,which has been attenuated by a factor of 104. Thepeaks at 1040 and 1400 cm-' are the nitrate peaks.The strong 1040-cm-1 peak was taken as the represen-tative of the nitrate emissions. The minor peak at-2100 cm-1 was due to room light at 546.07 nm leakinginto the optical detection system. Since water isbroadbanded from 3200 to 3800 cm-', it is importantto choose a representative wavenumber for the Ramanemissions. Three intensity profiles, located at 3308,3449, and 3587 cm-l, were examined. These corre-spond to the measured intensities at the half-maxi-mum on the left, at the maximum, and at the half-maximum on the right, as illustrated in Fig. 3,respectively. Figure 4 shows the time dependence ofthe intensities at these three wavenumbers in thebroadband water peak. Although the water peakshown in Fig. 3 appears to exhibit resonances at vari-
C-
0U
0 800 1600
time (sec)
Fig. 5. Intensity profiles of the elastically scattered Ar line andRaman emissions of the nitrate and water peaks of an evaporating
sodium nitrate droplet.
ous wavenumbers, it is clear from Fig. 4 that any one ofthe three wavenumbers can be used to represent theRaman water peak in the intensity profile.
To study the resonance structures in elastic andinelastic scattering of the evaporating droplet, thetime variation of peak counts of the Ar laser line at 0cm-', the Raman nitrate peak at 1040 cm-1 , and theRaman water peak at 3449 cm- 1 are shown in Fig. 5.Resonance structures in the Ar line, the Raman ni-trate, and water emissions exhibit behaviors that canbe grouped in three different time regions: (1) 0-400 s;(2) 400-1200 s; and (3) 1200-1650 s. To facilitate theexplanation of different observations in these threeregions, we analyze the results of each region separate-ly.
(1) 0-400 s. There are three distinct major peaks inthe elastic spectrum and the Raman nitrate spectrumas shown in Fig. 6. The water intensity profile alsoexhibits resonance structures at the same time albeitto a lesser extent. Since the elastically scattered lightand the Raman emissions of both the nitrate and waterexhibit resonances simultaneously, these resonancescan be attributed to the resonance of the Ar laser lineitself.
(2) 400-1200 s. The Raman intensity profiles ofthe nitrate and water peaks from 400 to 1200 s are
1 February 1991 / Vol. 30, No. 4 / APPLIED OPTICS 463
3449
3308 j3587
2000
1000-
00
200 400 600 800 1000 1200 1400 1600
lime (c)
25003000
en
.C
Z-
I
2I

0d
0
U
Cd,
0U
850
0U
0 200time (sec)
21
0
c
.C
C
Ea:
400
C
C
7
200time (sec)
775.- 9 I l qwkr 1
700II0 200
time (sec)
Fig. 6. Scattering intensity profiles from 0 to 400 s.
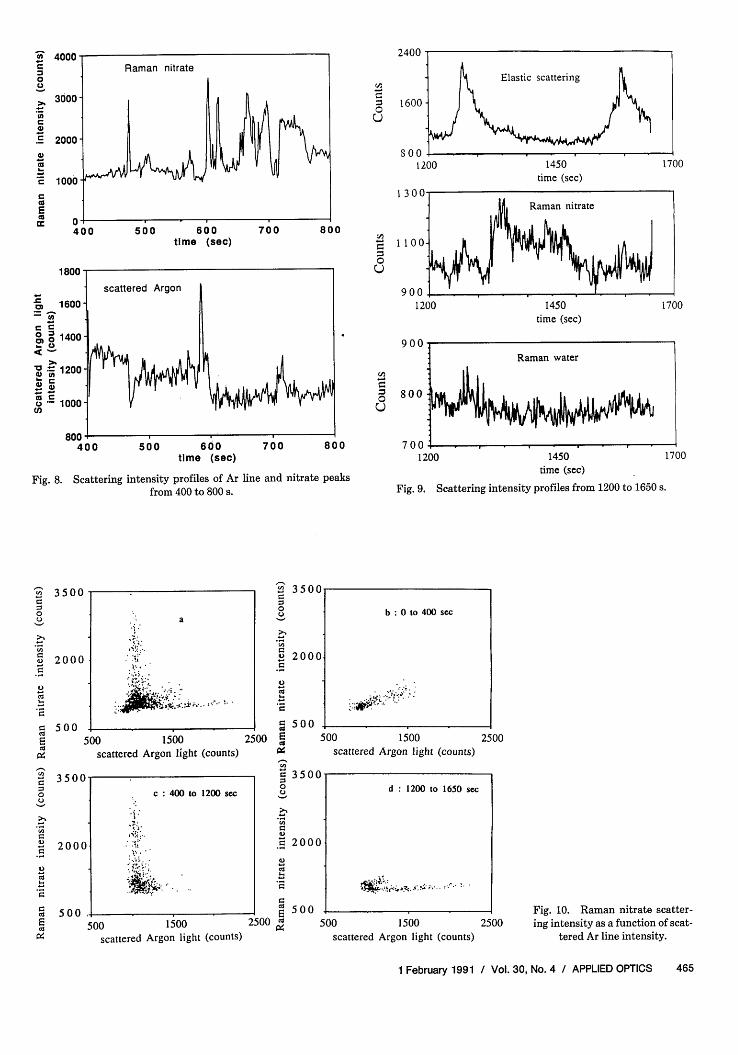
shown in Fig. 7. One can clearly observe that thenitrate and water profiles have exactly the same struc-tures. Also, the peaks here are much sharper thanthose three appearing in Fig. 6. The simultaneousappearance of resonances of the nitrate and water Ra-man peak should be due to the internal resonance ofthe elastic scattered light. However, the resonance ofthe elastically scattered Ar laser light appeared at loca-tions different from those of the Raman emissions. Toillustrate this with a better resolution, Fig. 8 shows theelastically scattered Ar light intensity profile and theRaman nitrate intensity profile only between 400 and800 s. It is clear that resonances of the two intensityprofiles occur at totally different locations, whichseems to contradict the above criterion for the concur-rent appearance of the Raman nitrate and water reso-nances. We explain this observation with the natureof low-order resonance peaks later.
(3) 1200-1650 s. There are two distinct resonancepeaks in the elastic spectrum, but the correspondingpeaks in the Raman emissions are much weaker asdepicted in Fig. 9. On the other hand, there are severalsmall peaks in the nitrate spectrum occurring at-1350-1475 s. They may be due to selective reso-nance of the nitrate peak when the nitrate wavelengthcorresponds to a resonant wavelength of the droplet ata particular size.
nC0
.C
a
4'
CCUEcoc;
400 600 800time (sec)
600 1400 600 800
time (sec)
1000 1 200
1000 1 200
Fig. 7. Scattering intensity profiles of nitrate and water peaks from400 to 1200 s.
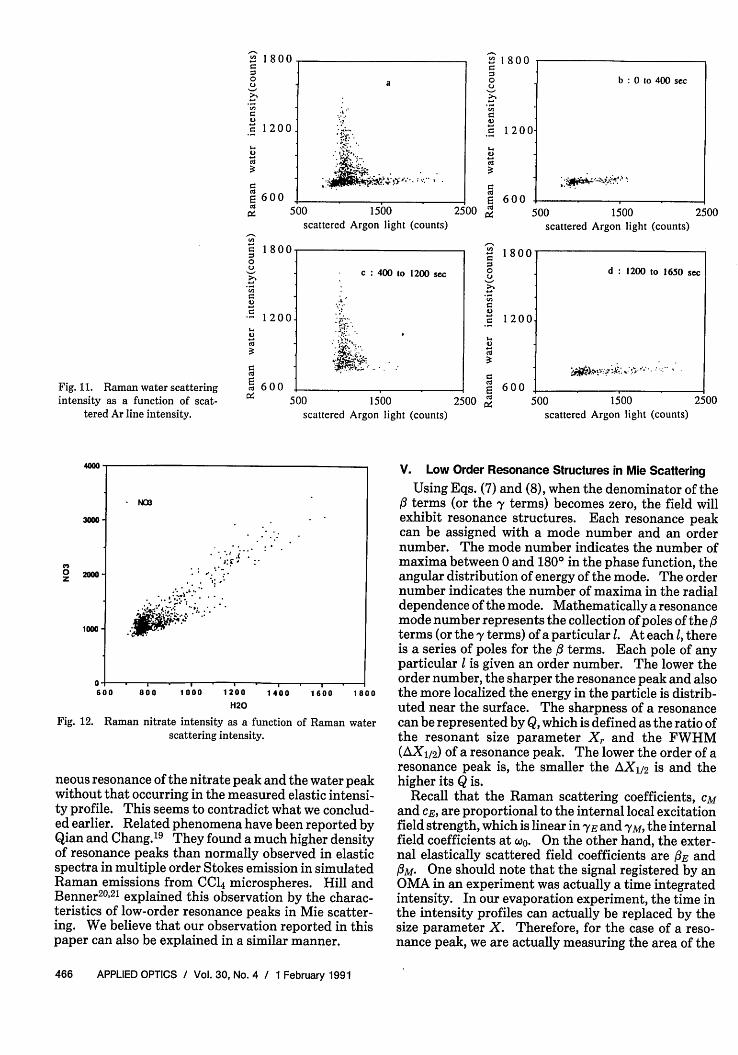
Efforts to use Raman spectroscopy to follow chemi-cal reactions within aerosol particles depend on therelative intensities of different Raman lines and theelastically scattered light. It is, therefore, interestingto examine the Raman nitrate intensity and the, Ra-man water intensity as a function of the Ar scatteredintensity at various times. Figure 10(a) shows that theRaman nitrate vs Ar line plot exhibits a L shapedcurve. Figure 10(b)-(d) show the contributions ofdata from regions (1) 0-400 s, (2) 400-1200 s, and (3)1200-1650 s. The three temporal regions in the aboveanalysis contribute to different regions of the L shapeplot. Figures 11(a)-(d) show similar plots for waterintensity vs Ar line intensity. Figure 12 depicts thenitrate peak intensity as a function of the water peakintensity. In light of observations in Fig. 10 or 11individually, it might be somewhat surprising to seethat all the data points collapse into a rather linearzone as shown in Fig. 12. However, our analysis re-vealed that most of the resonance structures observedin this experiment were the result of resonance of theincident excitation light, which caused intensity en-hancement of both the nitrate and water peaks to asimilar extent. Therefore, a more or less linear rela-tionship between the nitrate and water peak intensi-ties can be expected. The location of this zone mightgive information regarding the concentration of thedroplet (mole ratio of nitrate to water) albeit with alimited precision.
As emphasized in Fig. 7 and 8, we observed simulta-
464 APPLIED OPTICS / Vol. 30, No. 4 / 1 February 1991
4000
0
3000Ca
.' 2000
' 1000
cC O
0400
1800 -
scat' 1600--U'
CC
1400
Z1200-
o 1000
800400
Fig. 8. Scattering
I
500 600 700time (sec)
I I
500 600 700time (sec)
intensity profiles of Ar linefrom 400 to 800 s.
2400
c0U
800
1600
Soo12(
C-,
0U
0 17001450time (sec)
1200 1450time (sec)
900
Co
0U
800
and nitrate peaks
800
700 -1200 1450 ]
time (sec)
Fig. 9. Scattering intensity profiles from 1200 to 1650 s.
1700
700
3500
2000
500500 1500
scattered Argon light (counts)
3500
2000
500500 1500
scattered Argon light (counts)
- 3500
0C)
C_
2 00C
c
4)
_ 5 0 02500 E
lu- 3500
1 .o
20002
rs
2 5 2500
500 1500scattered Argon light (counts)
500 1500scattered Argon light (counts)
2500
I Fig. 10. Raman nitrate scatter-500 ing intensity as a function of scat-
tered Ar line intensity.
1 February 1991 / Vol. 30, No. 4 / APPLIED OPTICS 465
.,' a
. .
hi:,: .4 An::
. . at
A: * -
'>;r, .
'' ws 'i4;%,.:.''. t
b: 0 to 400 sec
.; ..~q- I.: ...
1:0
._U
. _
tP4
tC
0,CU
E
rtCU
E0
P4
c: 400 to 1200 sec
:3R
d: 1200 to 1650 sec
. . s - .
ad | w
..
1
Elastic scattering
1800
0C-
C:._
1 200.
._
C4 5'
Fig. 11. Raman water scatteringintensity as a function of scat-
tered Ar line intensity.
c 1 80
aI0
0
a.)
120
cU 600
- :
00 1500scattered Argon light (counts)
500 1500scattered Argon light (counts)
!2 1 800ZZ0
c:-
E 1 200
e.)
60000
I0
'C.
CECU._A:
2500 pC
1 800
1 200
600
500 1500scattered Argon light (counts)
500 1500scattered Argon light (counts)
4000
3000-
C.)0z 2000
1000-
6 00 800 1 000 1 200 1 400H20
1 600 1 800
Fig. 12. Raman nitrate intensity as a function of Raman waterscattering intensity.
neous resonance of the nitrate peak and the water peakwithout that occurring in the measured elastic intensi-ty profile. This seems to contradict what we conclud-ed earlier. Related phenomena have been reported byQian and Chang.19 They found a much higher densityof resonance peaks than normally observed in elasticspectra in multiple order Stokes emission in simulatedRaman emissions from CC14 microspheres. Hill andBenner20'21 explained this observation by the charac-teristics of low-order resonance peaks in Mie scatter-ing. We believe that our observation reported in thispaper can also be explained in a similar manner.
V. Low Order Resonance Structures in Mie Scattering
Using Eqs. (7) and (8), when the denominator of thea terms (or the y terms) becomes zero, the field willexhibit resonance structures. Each resonance peakcan be assigned with a mode number and an ordernumber. The mode number indicates the number ofmaxima between 0 and 1800 in the phase function, theangular distribution of energy of the mode. The ordernumber indicates the number of maxima in the radialdependence of the mode. Mathematically a resonancemode number represents the collection of poles of the fiterms (or the -y terms) of a particular 1. At each 1, thereis a series of poles for the f terms. Each pole of anyparticular I is given an order number. The lower theorder number, the sharper the resonance peak and alsothe more localized the energy in the particle is distrib-uted near the surface. The sharpness of a resonancecan be represented by Q, which is defined as the ratio ofthe resonant size parameter X and the FWHM(AX1/2) of a resonance peak. The lower the order of aresonance peak is, the smaller the X1 /2 is and thehigher its Q is.
Recall that the Raman scattering coefficients, cMand CE, are proportional to the internal local excitationfield strength, which is linear in YE and yM, the internalfield coefficients at wo. On the other hand, the exter-nal elastically scattered field coefficients are /3E and3M. One should note that the signal registered by an
OMA in an experiment was actually a time integratedintensity. In our evaporation experiment, the time inthe intensity profiles can actually be replaced by thesize parameter X. Therefore, for the case of a reso-nance peak, we are actually measuring the area of the
466 APPLIED OPTICS / Vol. 30, No. 4 / 1 February 1991
2500
d: 1200 to 1650 sec
* N03
2500w | w
u l {{{{{{{{{{{{{{{{{{{{{{{{{{{{{{{{{{{{{{{{{{{{{{{{{{{{{{{{{{{{{{{{{{{{{{{{{{{{{{{{{{{{{{{{{{{{{{{{{{{{{{{{{ .
AV
.1 ..
.�5. .-�W'
'' -.- .. - . .
.;- A . 117 !.�; 11.1 .. : I .....4 �v .."�
peak which can be approximated by the product ofpeak intensity and AX112. Resonance structures withQ > 105 are not generally observed in elastic spectrabecause the external field coefficients 13E and OiM areonly an order of unity even at resonance. Hence theintegrated area under a low order resonance peak inthe elastic spectra approaches zero as Q becomes verylarge (i.e., AX1/21/3EI2 and AX1/21fMI2 go to zero). Onthe other hand, the internal field coefficients YE and,YM can increase as Q becomes large so that the productA/X1I21YEI2 and AX1/21,yMI2 can increase slowly to anorder of about unity. This is basically due to thedifference in the numerators of the : and y terms.Physically most of the energy in a high Q or highquality resonance is confined within a particle insteadof leaking out as scattered light. Therefore, Ramanenhancements due to low order internal resonance ofthe excitation field can occur without resonance in theelastic spectra being measured. This explains why thenitrate and water resonances occurred simultaneouslywhile resonance in the elastic spectra was not mea-sured. The sharpness of the peaks in Fig. 7 also sup-ports this argument since they are much narrower thanthose observed in Fig. 6, where both the nitrate peakand elastically scattered light exhibit resonances.
VI. Conclusions
By measuring simultaneously the elastically scat-tered light and Raman emissions from an evaporatingaqueous sodium nitrate droplet as a function of time,one can study the interactions of Mie scattering withRaman emissions for spherical particles. We foundthat resonances of the elastically scattered light, Ra-man nitrate peak, and Raman water peak can occur ina concerted mode and can also occur independent ofeach other. These observations can be explained byKerker's 13 -15 model of inelastic scattering from micro-spheres and the behavior of low order resonance struc-tures in Mie scattering. This type of measurementcan be potentially used to test the validity of existingmodels of Raman emissions from microspheres. Oneapplication of this type of data would be quantitativedetermination of the chemical compositions of spheri-cal particles. One could use the elastic spectra toobtain the refractive index and particle size of thedroplet and then use accurate models of Raman emis-sions from spherical particles with the known particlesize and refractive index to determine the chemicalcomposition of the particle.
This research was supported by the Caltech Consor-tium in Chemistry and Chemical Engineering; found-ing members: E.I. du Pont de Nemours and Co., Inc.,Eastman Kodak Co., Minnesota Mining and Manufac-turing Co., and Shell Development Co.
References
1. S. Arnold, "Spectroscopy of Single Levitated Micron Sized Par-ticles," in Optical Effects Associated with Small Particles, P.W. Barber and R. K. Chang, Ed. (World Scientific, Singapore,1988).
2. G. J. Rosasco, E. S. Etz, and W. A. Cassatt, "The Analysis ofDiscrete Fine Particle by Raman Spectroscopy," Appl. Spec-trosc. 29, 396-404 (1975).
3. R. E. Preston, T. R. Lettieri, and H. G. Semerjian, "Character-ization of Single Levitated Droplets by Raman Spectroscopy,"Langmuir 1, 365-367 (1985).
4. R. Thurn and W. Kiefer, "Observations of Structural Reso-nances in the Raman Spectra of Optically Levitated DielectricMicrospheres," J. Raman Spectrosc. 15, 411-413 (1984).
5. R. Thurn and W. Kiefer, "Raman-Microsampling TechniqueApplying Optical Levitation by Radiation Pressure," Appl.Spectrosc. 38, 78-83 (1984).
6. R. Thurn and W. Kiefer, "Structural Resonances Observed inthe Raman Spectra of Optically Levitated Liquid Droplets,"Appl. Opt. 24, 1515-1519 (1985).
7. K. H. Fung and I. N. Tang, "Raman Scattering from SingleSolution Droplets," Appl. Opt. 27, 206-208 (1988).
8. K. H. Fung and I. N. Tang, "Raman Spectra of Singly Suspend-ed Supersaturated Ammonium Bisulfate Droplets," Chem.Phys. Lett. 147, 509-513 (1988).
9. K. H. Fung and I. N. Tang, "Composition Analysis of SuspendedAerosol Particles by Raman Spectroscopy: Sulfates and Nitra-tes," J. Colloid and Interface Sci. 130, 219-224 (1989).
10. I. N. Tang and K. H. Fung, "Characterization of Inorganic SaltParticles by Raman Spectroscopy," J. Aerosol Sci. 20, 609-617(1989).
11. R. E. Benner, P. W. Barber, J. F. Owen, and R. K. Chang,"Observation of Structure Resonances in the FluorescenceSpectra from Microspheres," Phys. Rev. Lett. 44, 475-478(1980).
12. M. Kerker and S. D. Druger, "Raman and Fluorescent Scatter-ing by Molecules Embedded in Spheres with Radii up to SeveralMultiples of the Wavelength," Appl. Opt. 18, 1172-1179 (1979).
13. M. Kerker, "Lorenz-Mie Scattering by Spheres: Some NewlyRecognized Phenomena," Aerosol. Sci. Technol. 1, 275-291(1982).
14. P. J. McNulty, H. W. Chew, and M. Kerker, "Inelastic LightScattering," in Aerosol Microphysics I: Particle Interaction,W. H. Marlow, Ed. (Springer-Verlag, Berlin, 1980).
15. H. Chew, P. J. McNulty, and M. Kerker, "Model for Raman andFluorescent Scattering by Molecules Embedded in Small Parti-cles," Phys. Rev. A 13, 396-404 (1976).
16. J. D. Jackson, Classical Electrodynamics (Wiley, New York,1962).
17. A. R. Edmonds, Angular Momentum in Quantum Mechanics(Princeton U.P., Princeton, NJ, 1957).
18. G. Sageev, R. C. Flagan, J. H. Seinfeld, and S. Arnold, "Conden-sation Rate of Water on Aqueous Droplets in the TransitionRegime," J. Colloid. Interface Sci. 113, 421-429 (1986).
19. S.-X. Qian and R. K. Chang, "Multi-Order Stokes Emissionsfrom Micrometer Sized Droplets," Phys. Rev. Lett. 56, 926(1986).
20. S. C. Hill and R. E. Benner, "Morphology-Dependent Reso-nances Associated with Stimulated Processes in Microspheres,"J. Opt. Soc. Am. B 3, 1509-1514 (1986).
21. S. C. Hill and R. E. Benner, "Morphology-Dependent Resonan-ces," in Optical Effects Associated with Small Particles, P. W.Barber and R. K. Chang, Ed. (World Scientific, Singapore,1988).
1 February 1991 / Vol. 30, No. 4 / APPLIED OPTICS 467