Embed Size (px)
Citation preview
2180
Abstract
This paper deals with the behaviour of welded “T” joints
between RHS sections submitted to tension brace loading combined with chord axial loading. In the companion paper (part I) a finite element model and a study without axial load in the chord, focusing on the joint behaviour as a func-tion of the significant geometrical variables, were presented. In this part II paper, tension loading on the brace is incre-mented up to the joint failure, but is combined with differ-ent chord load levels in tension or compression, that are kept constant for each case. The same geometries and geo-metric variables as in the companion paper are used, and therefore the influence of these features together with the chord load level (in tension or compression) on the connec-tion’s response is evaluated. The force-displacement curves from the different geometries and chord load levels are an-alysed and compared, with a special attention on the influ-ence of the chord load on the joint resistance and stiffness. Finally, a comparison of the numerical results with the Eu-rocode 3 (2005) and the newer ISO 14346 (2013) provisions is presented and discussed. Keywords
Finite element method; hollow section joints; combined loading; deformation limit; resistance evaluation.
Resistance and Elastic Stiffness of RHS “T” Joints:
Part II - Combined Axial Brace and Chord Loading
1 INTRODUCTION
In the first part of the current paper “Resistance and Elastic Stiffness of RHS T Joints: Part I - Axial Brace Loading”, some advantages in the structural applications of hollow section joints, and some inconveniences associated with their joint design and assembly were referred. Also, available approaches to derive the resistance and stiffness of T joints were referred, and some models to predict these features were presented and discussed.
R.M.M.P. de Matosa
L.F. Costa-Nevesb
L.R.O. de Limac
P.C.G.S. Vellascod
J.G.S. da Silvae
aISISE - Civil Engineering Department, Univer-sity of Coimbra, Portugal bINESCC, Civil Engineering Department, University of Coimbra, Portugal c,d,eUERJ - State University of Rio de Janeiro, Brasil Corresponding author: [email protected] [email protected] [email protected] [email protected] [email protected] http://dx.doi.org/10.1590/1679-78251791 Received 19.12.2014 Accepted 30.05.2015 Available online 07.07.2015
2181 R.M.M.P. de Matos et al. / Resistance and elastic stiffness of RHS “T” joints: part II – combined axial brace and chord loading
Latin American Journal of Solids and Structures 12 (2015) 2180-2207
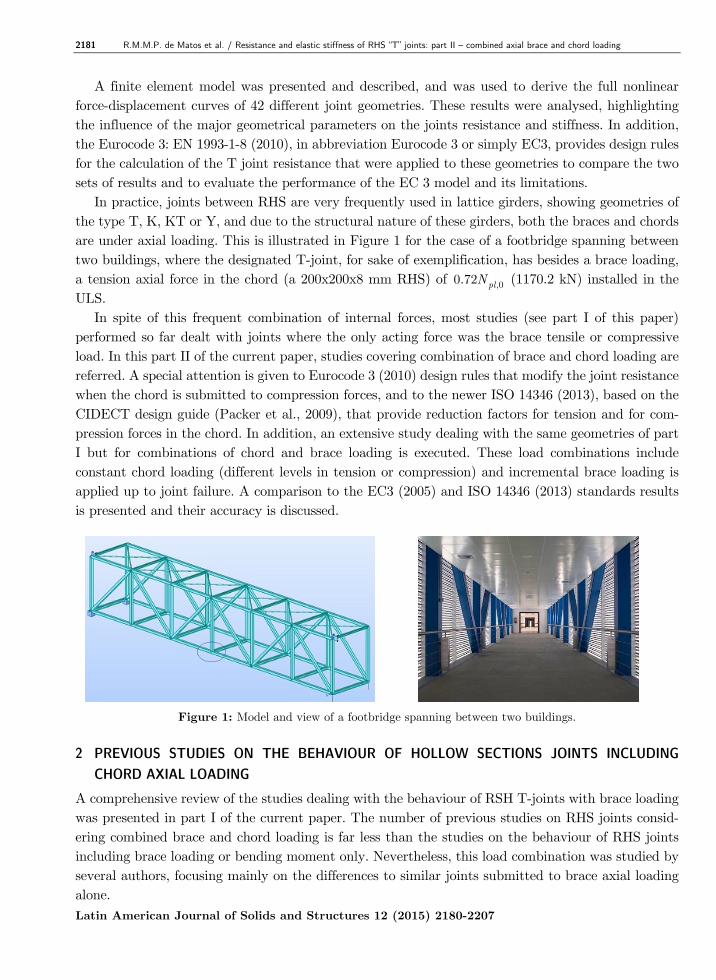
A finite element model was presented and described, and was used to derive the full nonlinear force-displacement curves of 42 different joint geometries. These results were analysed, highlighting the influence of the major geometrical parameters on the joints resistance and stiffness. In addition, the Eurocode 3: EN 1993-1-8 (2010), in abbreviation Eurocode 3 or simply EC3, provides design rules for the calculation of the T joint resistance that were applied to these geometries to compare the two sets of results and to evaluate the performance of the EC 3 model and its limitations. In practice, joints between RHS are very frequently used in lattice girders, showing geometries of the type T, K, KT or Y, and due to the structural nature of these girders, both the braces and chords are under axial loading. This is illustrated in Figure 1 for the case of a footbridge spanning between two buildings, where the designated T-joint, for sake of exemplification, has besides a brace loading, a tension axial force in the chord (a 200x200x8 mm RHS) of ,00.72 plN (1170.2 kN) installed in the ULS. In spite of this frequent combination of internal forces, most studies (see part I of this paper) performed so far dealt with joints where the only acting force was the brace tensile or compressive load. In this part II of the current paper, studies covering combination of brace and chord loading are referred. A special attention is given to Eurocode 3 (2010) design rules that modify the joint resistance when the chord is submitted to compression forces, and to the newer ISO 14346 (2013), based on the CIDECT design guide (Packer et al., 2009), that provide reduction factors for tension and for com-pression forces in the chord. In addition, an extensive study dealing with the same geometries of part I but for combinations of chord and brace loading is executed. These load combinations include constant chord loading (different levels in tension or compression) and incremental brace loading is applied up to joint failure. A comparison to the EC3 (2005) and ISO 14346 (2013) standards results is presented and their accuracy is discussed.
Figure 1: Model and view of a footbridge spanning between two buildings.
2 PREVIOUS STUDIES ON THE BEHAVIOUR OF HOLLOW SECTIONS JOINTS INCLUDING
CHORD AXIAL LOADING
A comprehensive review of the studies dealing with the behaviour of RSH T-joints with brace loading was presented in part I of the current paper. The number of previous studies on RHS joints consid-ering combined brace and chord loading is far less than the studies on the behaviour of RHS joints including brace loading or bending moment only. Nevertheless, this load combination was studied by several authors, focusing mainly on the differences to similar joints submitted to brace axial loading alone.
R.M.M.P. de Matos et al. / Resistance and elastic stiffness of RHS “T” joints: part II – combined axial brace and chord loading 2182
Latin American Journal of Solids and Structures 12 (2015) 2180-2207
Cao et al. (1998a; 1998b) concluded that when RHS are transversally loaded by welded vertical plates the connection resistance is not adversely affected by moderate tension axial load in the chord, and in some situations the elastic stiffness and membrane stiffness of the joint may be improved due to an effect similar to pre-stress. However, when compression forces are applied to the chord, no significant changes were observed in the joint elastic stiffness, but both resistance and membrane stiffness were adversely affected; being observed that membrane stiffness vanished for compressive loads of about 75%
plN . These authors proposed in Cao et al. (1998a) a parameter ( )f n affecting the joint resistance to consider this effect.
France (1997) corroborated experimentally these findings, concluding as well that elastic stiffness is not significantly affected by axial chord loading that nevertheless affects resistance and membrane stiffness if acting in compression.
Considering the plastic analysis of transversally loaded plates, that is the basis of the established yielding mechanisms to predict the chord failure mode in bending, modified equations based in the yield line method considering the effect of chord axial loading were proposed by Kosteski et al. (2003).
Liu et al. (2004) and Wardenier et al. (2007) proposed new chord stress functions for rectangular hollow section T and X-joints, accounting for the effect of chord axial load.
van der Vegte and Makino (2006) presented a FE study of CHS uniplanar T-joints under axial brace loading with additional axial chord load. The study identified the effects of tensile and com-pressive chord pre-load of the axially loaded T-joints for a wide range of brace-to-chord diameter ratio β and chord-diameter-to-chord -wall thickness ratio 2γ , establishing a new strength formulation for this joint configuration and describing the load interaction.
Lima et al. (2005) suggested that EC3 (2005) provisions may be unsafe for some geometries of T joints, especially with significant chord axial loading, and these results were corroborated by Bitten-court (2008). In another study, Lima (2012) evaluated welded T joints submitted to chord loads of 10%, 40%, 60% and 80% of the chord plastic load, concluding that EC3 (2005) gives acceptable results when this action acts in compression, but when chord tensile forces are applied, the assumption of the Eurocode 3, of not reducing the T joint resistance, is unsafe and significant for chord compression forces greater than 0.40 plN .
This is reflected by the EN 1993-1-8: EC3 (2005) and in the NBR 16239 (2013) design codes, preconizing a T-joint resistance reduction if compressive loading is acting in the chord. Though, the second edition of the CIDECT design guide for RHS joints (Packer et al., 2009) and ISO 14346 (2013) preconize a joint resistance reduction for both cases, i.e., tensile and compressive chord stresses.
Mendes (2008) developed a numerical model for the study of T joints between RHS chords and CHS braces, and Silva (2012) and Silva et al. (2012) for T joints between CHS sections, concluding that the results predicted by CIDECT (Packer et al., 2009), later adopted by ISO 14346 (2013) are closer to the results obtained numerically than those obtained by the EC3 (2005).
For K joints of RHS and CHS sections, Santos et al. (2011a; 2011b) stated that for some geometries EC3 (2005) leads to safe predictions of the joint failure load, for which ISO 14346 (2013) overestimates this value. These authors concluded that the reduction of the joint capacity increases with increasing chord compression load levels.
2183 R.M.M.P. de Matos et al. / Resistance and elastic stiffness of RHS “T” joints: part II – combined axial brace and chord loading
Latin American Journal of Solids and Structures 12 (2015) 2180-2207
Oliveira et al. (2011) studied T joints between CHS sections under chord and brace loading and also concluded (in line with ISO 14346 (2013) formulation) that chord axial loading decreases the joint capacity both for chord tension and compression loading.
Nizer (2014) studied experimentally and numerically the influence of tension and compression chord stresses on the resistance of T-joint geometries with RHS chords and SHS braces. Addition-ally, Lipp and Ummenhofer (2014) based on experimental and numerical results as well, proposed a new chord load function for CHS joints subjected to tensile chord stresses reducing the joint resistance.
3 DESIGN RECOMENDATIONS
The major design recommendations to deal with T-joints with acting axial chord load in addition to brace loading are the Eurocode 3: EN 1993-1-8 (2010), and the improved formulation more recently proposed by the CIDECT – Packer et al. (2009) and also adopted by ISO 14346 (2013).
3.1 Eurocode 3: EN 1993-1-8 (2010) design provisions
In addition to the Eurocode 3 (2010) provisions presented in part I of the present paper, when addi-tional chord axial load is acting in the joint the parameter nk is introduced to expresses the influence of that chord axial loading over the chord face resistance ,i RdN , if β ≤ 0.85:
( )
20 0
, 5
24 1
1 sin sin
n y
i Rd Mi i
k f tN
ηβ γ
β θ θ
= + − − (1)
This formulation assumes that compressive chord axial loading reduces the joint resistance, but has no influence if acting in tension (i.e. nk = 1):
0.4
1.3n
nk
β= − ( 0n > for compression) with 0 0
,0 ,0pl pl
N Mn
N M= + the chord face (2)
but 1nk ≤
The reducing factor nk is explicitly considered for β ≤ 0.85 but is implicitly considered for β >0.85 as well since the predicted failure load for the joint is obtained by an interpolation of the failure loads corresponding to β ≤ 0.85 for the chord face and to β = 1, when chord side wall buckling governs design.
3.2 CIDECT – Packer et al. (2009) and ISO 14346 (2013)
As a refinement of the provisions included in the EC3 (2005), a new formulation to cope with axial chord loading was proposed by Packer et al. (2009) and more recently adopted by ISO 14346 (2013). This formulation includes a coefficient Qf that reduces the joint failure load for compression and tension in the chord:
R.M.M.P. de Matos et al. / Resistance and elastic stiffness of RHS “T” joints: part II – combined axial brace and chord loading 2184
Latin American Journal of Solids and Structures 12 (2015) 2180-2207
Qf = (1 – |n|)C1 with n = N0/Npl,0 + M0/Mpl,0 in the connection face (3)
C1 = 0.6 – 0.5β (n < 0 for compression) and C1 = 0.1 (n > 0 for tension) (4)
4 NUMERICAL STUDY
4.1 Finite element model
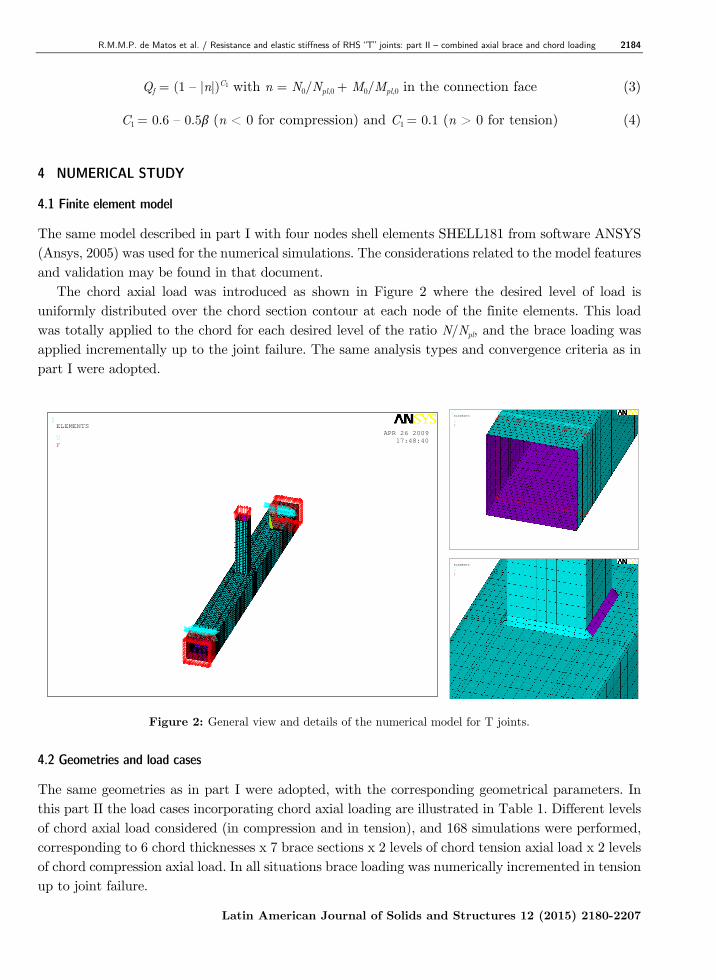
The same model described in part I with four nodes shell elements SHELL181 from software ANSYS (Ansys, 2005) was used for the numerical simulations. The considerations related to the model features and validation may be found in that document. The chord axial load was introduced as shown in Figure 2 where the desired level of load is uniformly distributed over the chord section contour at each node of the finite elements. This load was totally applied to the chord for each desired level of the ratio N/Npl, and the brace loading was applied incrementally up to the joint failure. The same analysis types and convergence criteria as in part I were adopted.
Figure 2: General view and details of the numerical model for T joints.
4.2 Geometries and load cases
The same geometries as in part I were adopted, with the corresponding geometrical parameters. In this part II the load cases incorporating chord axial loading are illustrated in Table 1. Different levels of chord axial load considered (in compression and in tension), and 168 simulations were performed, corresponding to 6 chord thicknesses x 7 brace sections x 2 levels of chord tension axial load x 2 levels of chord compression axial load. In all situations brace loading was numerically incremented in tension up to joint failure.
1
X
Y
Z
APR 26 2009
17:48:40
ELEMENTS
U
F
1
APR 26 2009
17:49:28
ELEMENTS
U
F
1
APR 26 2009
17:49:51
ELEMENTS
U
F
2185 R.M.M.P. de Matos et al. / Resistance and elastic stiffness of RHS “T” joints: part II – combined axial brace and chord loading
Latin American Journal of Solids and Structures 12 (2015) 2180-2207
Designation of each model adopted in this document follows from: E (thickness of the chord face; always with b = 300 mm), M (dimension of the brace; always with a thickness of 12 mm). For ex-ample, E8M220 stands for an 8 mm thick chord of 300x300 mm connected to a 220x220x12 mm brace. As far as the load case is concerned, BTC0.5T stands for brace in tension and chord with 0.5 plN in tension; BTC0.5C for brace in tension and chord with 0.5 plN in compression; BTC0.8T for brace in tension and chord with 0.8 plN in tension; and BTC0.8C stands for brace in tension and chord with 0.8 plN in compression (brace load is always in tension).
Chord (mm) brace (mm) brace load chord load ( plN N )
SHS 300x300x t t = 6, 8, 10, 12, 14, 16
SHS 100x100x12 SHS 150x150x12 SHS 180x180x12 SHS 220x220x12 SHS 250x250x12 SHS 260x260x12 SHS 285x285x12
tension
0.5 (tension) 0.5 (compression)
0.8 (tension) 0.8 (compression)
Table 1: Overview of the numerical simulations.
Similarly to part I, the value of 1b considered for the calculation of β is derived by adding the width of the brace to twice the effective width of the welds, assumed as 0.8 wt . Also, the width of the welds was considered as 12 mm except for the 285 mm braces. All geometrical parameters may be found in part I of the paper.
5 RESULTS
5.1 General results
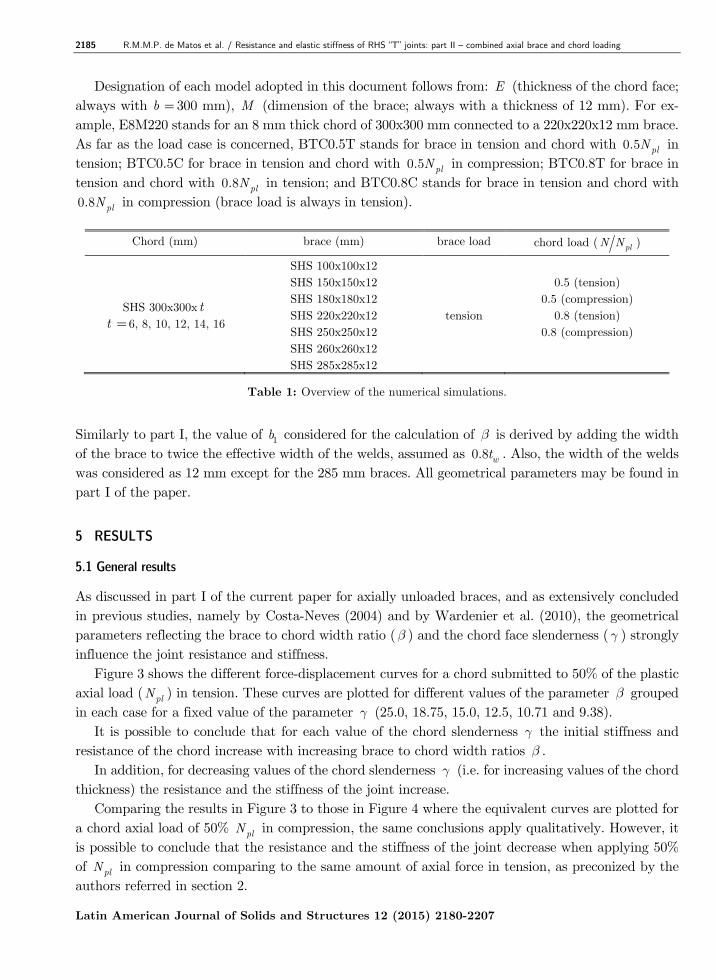
As discussed in part I of the current paper for axially unloaded braces, and as extensively concluded in previous studies, namely by Costa-Neves (2004) and by Wardenier et al. (2010), the geometrical parameters reflecting the brace to chord width ratio (β ) and the chord face slenderness ( γ ) strongly influence the joint resistance and stiffness. Figure 3 shows the different force-displacement curves for a chord submitted to 50% of the plastic axial load (
plN ) in tension. These curves are plotted for different values of the parameter β grouped in each case for a fixed value of the parameter γ (25.0, 18.75, 15.0, 12.5, 10.71 and 9.38). It is possible to conclude that for each value of the chord slenderness γ the initial stiffness and resistance of the chord increase with increasing brace to chord width ratios β . In addition, for decreasing values of the chord slenderness γ (i.e. for increasing values of the chord thickness) the resistance and the stiffness of the joint increase. Comparing the results in Figure 3 to those in Figure 4 where the equivalent curves are plotted for a chord axial load of 50%
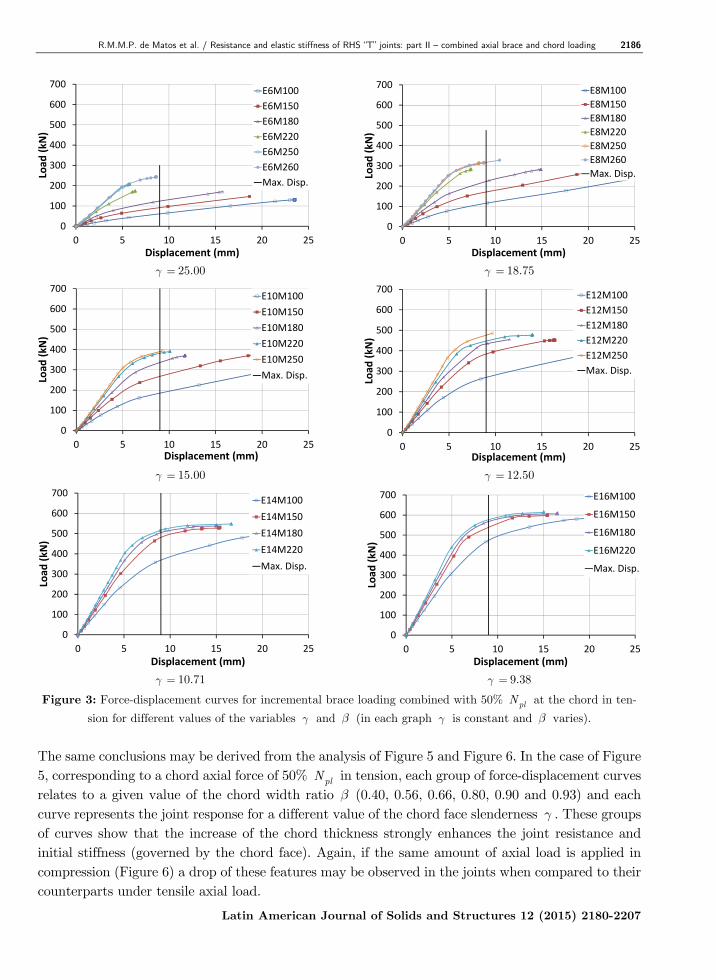
plN in compression, the same conclusions apply qualitatively. However, it is possible to conclude that the resistance and the stiffness of the joint decrease when applying 50% of
plN in compression comparing to the same amount of axial force in tension, as preconized by the authors referred in section 2.
R.M.M.P. de Matos et al. / Resistance and elastic stiffness of RHS “T” joints: part II – combined axial brace and chord loading 2186
Latin American Journal of Solids and Structures 12 (2015) 2180-2207
γ = 25.00 γ = 18.75
γ = 15.00 γ = 12.50
γ = 10.71 γ = 9.38
Figure 3: Force-displacement curves for incremental brace loading combined with 50% plN at the chord in ten-
sion for different values of the variables γ and β (in each graph γ is constant and β varies).
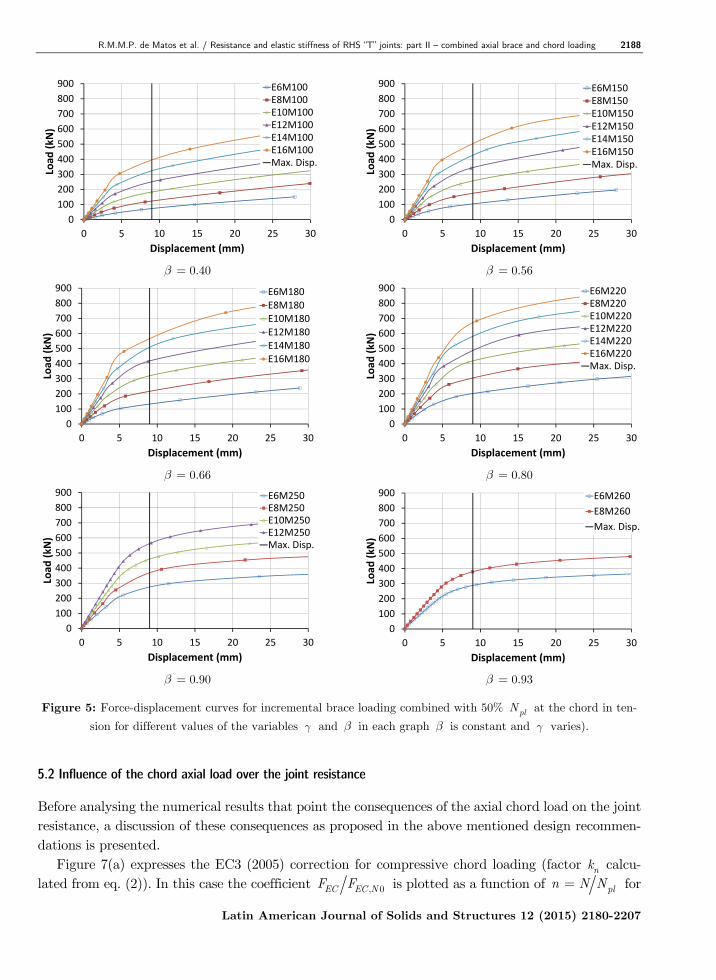
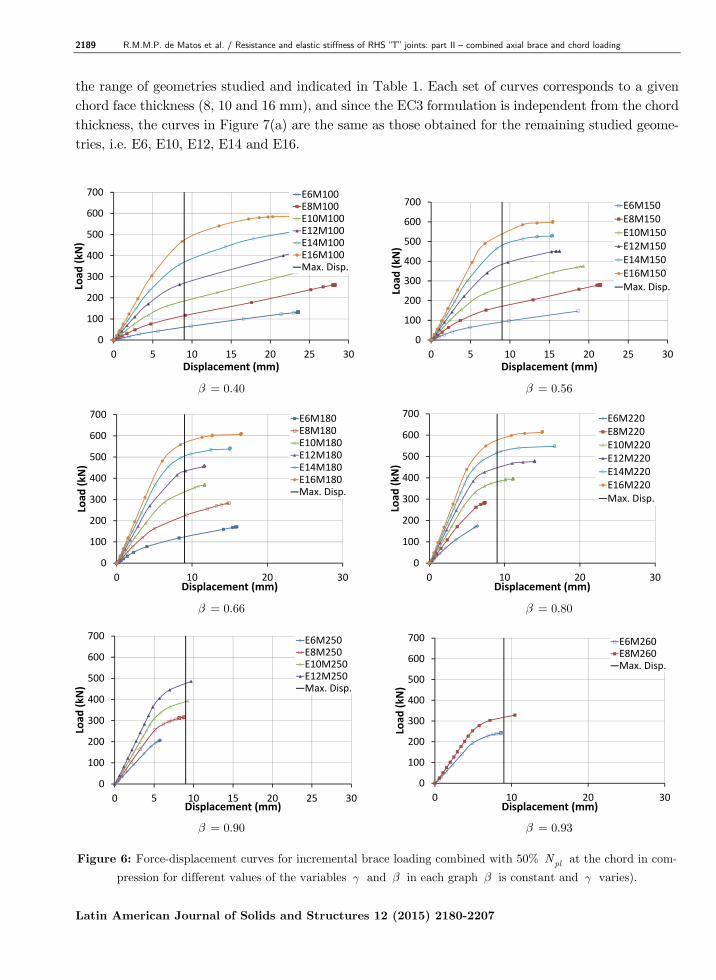
The same conclusions may be derived from the analysis of Figure 5 and Figure 6. In the case of Figure 5, corresponding to a chord axial force of 50%
plN in tension, each group of force-displacement curves relates to a given value of the chord width ratio β (0.40, 0.56, 0.66, 0.80, 0.90 and 0.93) and each curve represents the joint response for a different value of the chord face slenderness γ . These groups of curves show that the increase of the chord thickness strongly enhances the joint resistance and initial stiffness (governed by the chord face). Again, if the same amount of axial load is applied in compression (Figure 6) a drop of these features may be observed in the joints when compared to their counterparts under tensile axial load.
0
100
200
300
400
500
600
700
0 5 10 15 20 25
Loa
d (
kN
)
Displacement (mm)
E6M100
E6M150
E6M180
E6M220
E6M250
E6M260
Max. Disp.
0
100
200
300
400
500
600
700
0 5 10 15 20 25
Loa
d (
kN
)
Displacement (mm)
E8M100
E8M150
E8M180
E8M220
E8M250
E8M260
Max. Disp.
0
100
200
300
400
500
600
700
0 5 10 15 20 25
Loa
d (
kN
)
Displacement (mm)
E10M100
E10M150
E10M180
E10M220
E10M250
Max. Disp.
0
100
200
300
400
500
600
700
0 5 10 15 20 25
Loa
d (
kN
)
Displacement (mm)
E12M100
E12M150
E12M180
E12M220
E12M250
Max. Disp.
0
100
200
300
400
500
600
700
0 5 10 15 20 25
Loa
d (
kN
)
Displacement (mm)
E14M100
E14M150
E14M180
E14M220
Max. Disp.
0
100
200
300
400
500
600
700
0 5 10 15 20 25
Loa
d (
kN
)
Displacement (mm)
E16M100
E16M150
E16M180
E16M220
Max. Disp.
2187 R.M.M.P. de Matos et al. / Resistance and elastic stiffness of RHS “T” joints: part II – combined axial brace and chord loading
Latin American Journal of Solids and Structures 12 (2015) 2180-2207
γ = 25.00 γ = 18.75
γ = 15.00 γ = 12.50
γ = 10.71 γ = 9.38
Figure 4: Force-displacement curves for incremental brace loading combined with 50% plN at the chord in com-
pression for different values of the variables γ and β in each graph γ is constant and β varies).
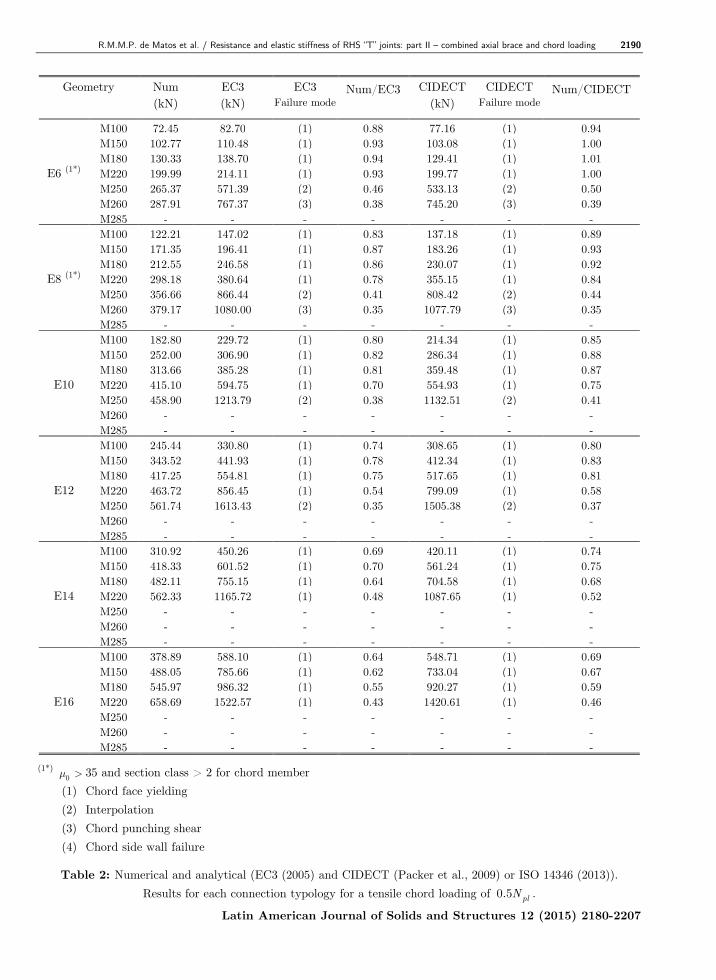
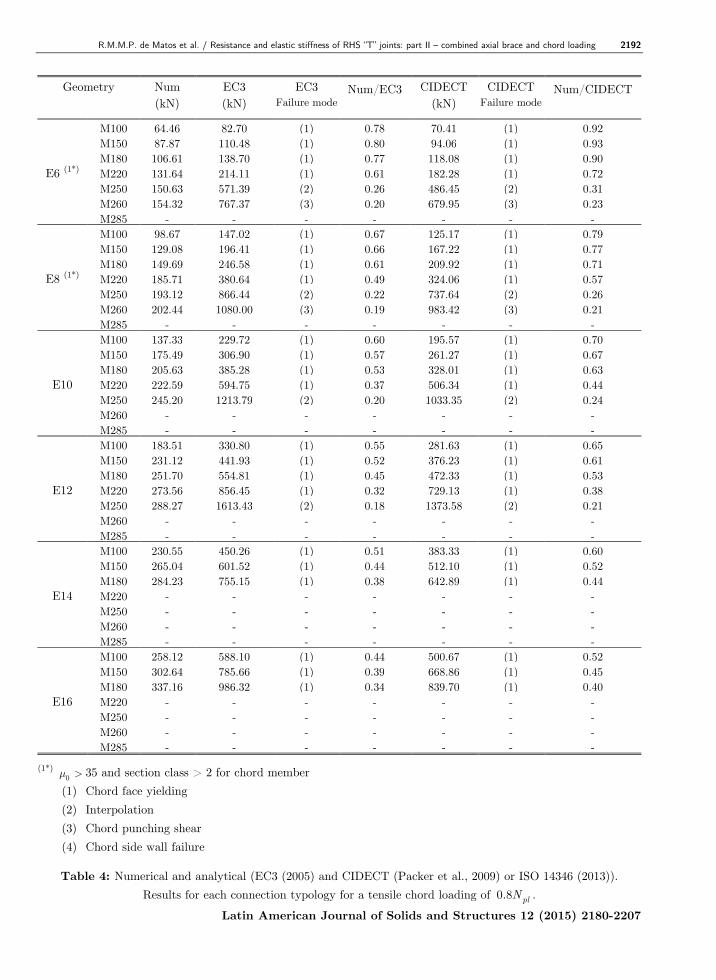
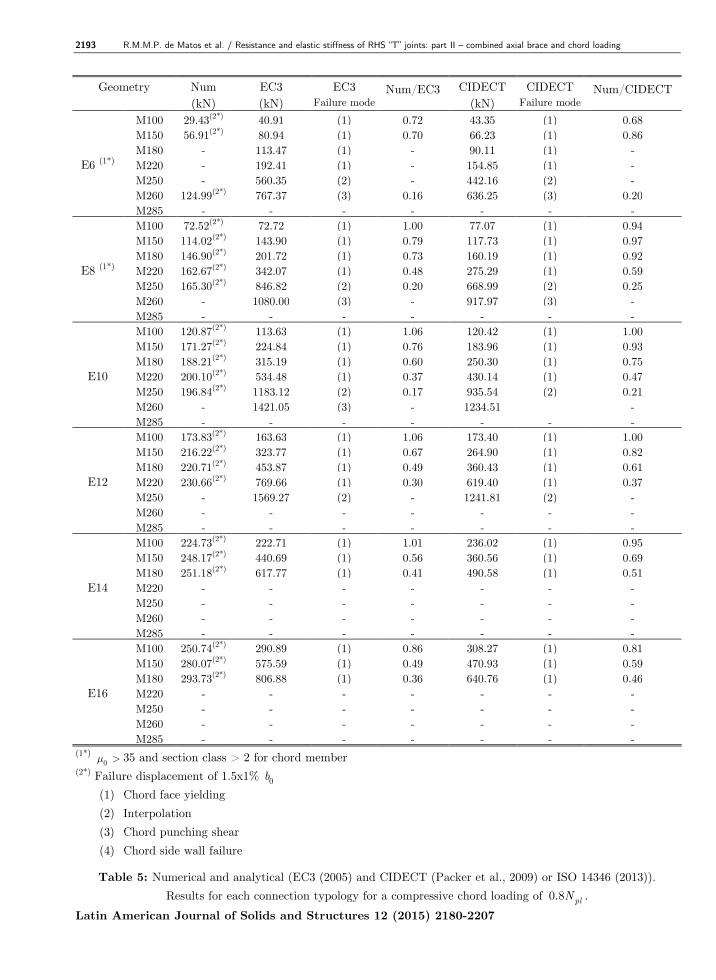
These trends may be further observed in Table 2 to Table 5 where the values of the numerical resistance of all the studied joints are depicted (first column). This numerical resistance derives from the limiting displacement corresponding to the establishment of the chord face failure load. As previ-ously discussed, a limit of 3% 0b was adopted except when the criterion for the serviceability limit state governs, as stated in Lu et al. (1994), where the failure load corresponds to 1.5 times the load for which a 1% 0b displacement of the chord face occurs. A note should be addressed to the blank values present in these tables, corresponding to convergence problems in the numerical simulations not reaching the desired load and displacement levels.
0
100
200
300
400
500
600
700
800
900
0 10 20 30
Loa
d (
kN
)
Displacement (mm)
E6M100
E6M150
E6M180
E6M220
E6M250
E6M260
Max. Disp.
0
100
200
300
400
500
600
700
800
900
0 10 20 30
Loa
d (
kN
)
Displacement (mm)
E8M100
E8M150
E8M180
E8M220
E8M250
E8M260
Max. Disp.
0
100
200
300
400
500
600
700
800
900
0 10 20 30
Loa
d (
kN
)
Displacement (mm)
E10M100
E10M150
E10M180
E10M220
E10M250
Max. Disp.
0
100
200
300
400
500
600
700
800
900
0 10 20 30
Loa
d (
kN
)
Displacement (mm)
E12M100
E12M150
E12M180
E12M220
E12M250
Max. Disp.
0
100
200
300
400
500
600
700
800
900
0 10 20 30
Loa
d (
kN
)
Displacement (mm)
E14M100
E14M150
E14M180
E14M220
Max. Disp.
0
100
200
300
400
500
600
700
800
900
0 10 20 30
Loa
d (
kN
)
Displacement (mm)
E16M100
E16M150
E16M180
E16M220
Max. Disp.
R.M.M.P. de Matos et al. / Resistance and elastic stiffness of RHS “T” joints: part II – combined axial brace and chord loading 2188
Latin American Journal of Solids and Structures 12 (2015) 2180-2207
β = 0.40 β = 0.56
β = 0.66 β = 0.80
β = 0.90 β = 0.93
Figure 5: Force-displacement curves for incremental brace loading combined with 50% plN at the chord in ten-
sion for different values of the variables γ and β in each graph β is constant and γ varies).
5.2 Influence of the chord axial load over the joint resistance
Before analysing the numerical results that point the consequences of the axial chord load on the joint resistance, a discussion of these consequences as proposed in the above mentioned design recommen-dations is presented. Figure 7(a) expresses the EC3 (2005) correction for compressive chord loading (factor nk calcu-lated from eq. (2)). In this case the coefficient , 0EC EC NF F is plotted as a function of pln N N= for
0
100
200
300
400
500
600
700
800
900
0 5 10 15 20 25 30
Loa
d (
kN
)
Displacement (mm)
E6M100
E8M100
E10M100
E12M100
E14M100
E16M100
Max. Disp.
0
100
200
300
400
500
600
700
800
900
0 5 10 15 20 25 30
Loa
d (
kN
)
Displacement (mm)
E6M150
E8M150
E10M150
E12M150
E14M150
E16M150
Max. Disp.
0
100
200
300
400
500
600
700
800
900
0 5 10 15 20 25 30
Loa
d (
kN
)
Displacement (mm)
E6M180
E8M180
E10M180
E12M180
E14M180
E16M180
0
100
200
300
400
500
600
700
800
900
0 5 10 15 20 25 30
Loa
d (
kN
)
Displacement (mm)
E6M220
E8M220
E10M220
E12M220
E14M220
E16M220
Max. Disp.
0
100
200
300
400
500
600
700
800
900
0 5 10 15 20 25 30
Loa
d (
kN
)
Displacement (mm)
E6M250
E8M250
E10M250
E12M250
Max. Disp.
0
100
200
300
400
500
600
700
800
900
0 5 10 15 20 25 30
Loa
d (
kN
)
Displacement (mm)
E6M260
E8M260
Max. Disp.
2189 R.M.M.P. de Matos et al. / Resistance and elastic stiffness of RHS “T” joints: part II – combined axial brace and chord loading
Latin American Journal of Solids and Structures 12 (2015) 2180-2207
the range of geometries studied and indicated in Table 1. Each set of curves corresponds to a given chord face thickness (8, 10 and 16 mm), and since the EC3 formulation is independent from the chord thickness, the curves in Figure 7(a) are the same as those obtained for the remaining studied geome-tries, i.e. E6, E10, E12, E14 and E16.
β = 0.40 β = 0.56
β = 0.66 β = 0.80
β = 0.90 β = 0.93
Figure 6: Force-displacement curves for incremental brace loading combined with 50% plN at the chord in com-
pression for different values of the variables γ and β in each graph β is constant and γ varies).
0
100
200
300
400
500
600
700
0 5 10 15 20 25 30
Loa
d (
kN
)
Displacement (mm)
E6M100
E8M100
E10M100
E12M100
E14M100
E16M100
Max. Disp.
0
100
200
300
400
500
600
700
0 5 10 15 20 25 30
Loa
d (
kN
)
Displacement (mm)
E6M150
E8M150
E10M150
E12M150
E14M150
E16M150
Max. Disp.
0
100
200
300
400
500
600
700
0 10 20 30
Loa
d (
kN
)
Displacement (mm)
E6M180
E8M180
E10M180
E12M180
E14M180
E16M180
Max. Disp.
0
100
200
300
400
500
600
700
0 10 20 30
Loa
d (
kN
)
Displacement (mm)
E6M220
E8M220
E10M220
E12M220
E14M220
E16M220
Max. Disp.
0
100
200
300
400
500
600
700
0 5 10 15 20 25 30
Loa
d (
kN
)
Displacement (mm)
E6M250
E8M250
E10M250
E12M250
Max. Disp.
0
100
200
300
400
500
600
700
0 10 20 30
Loa
d (
kN
)
Displacement (mm)
E6M260
E8M260
Max. Disp.
R.M.M.P. de Matos et al. / Resistance and elastic stiffness of RHS “T” joints: part II – combined axial brace and chord loading 2190
Latin American Journal of Solids and Structures 12 (2015) 2180-2207
Geometry Num (kN)
EC3 (kN)
EC3 Failure mode
Num/EC3
CIDECT (kN)
CIDECT Failure mode
Num/CIDECT
E6 (1*)
M100 72.45 82.70 (1) 0.88 77.16 (1) 0.94 M150 102.77 110.48 (1) 0.93 103.08 (1) 1.00 M180 130.33 138.70 (1) 0.94 129.41 (1) 1.01 M220 199.99 214.11 (1) 0.93 199.77 (1) 1.00 M250 265.37 571.39 (2) 0.46 533.13 (2) 0.50 M260 287.91 767.37 (3) 0.38 745.20 (3) 0.39 M285 - - - - - - -
E8 (1*)
M100 122.21 147.02 (1) 0.83 137.18 (1) 0.89 M150 171.35 196.41 (1) 0.87 183.26 (1) 0.93 M180 212.55 246.58 (1) 0.86 230.07 (1) 0.92 M220 298.18 380.64 (1) 0.78 355.15 (1) 0.84 M250 356.66 866.44 (2) 0.41 808.42 (2) 0.44 M260 379.17 1080.00 (3) 0.35 1077.79 (3) 0.35 M285 - - - - - - -
E10
M100 182.80 229.72 (1) 0.80 214.34 (1) 0.85 M150 252.00 306.90 (1) 0.82 286.34 (1) 0.88 M180 313.66 385.28 (1) 0.81 359.48 (1) 0.87 M220 415.10 594.75 (1) 0.70 554.93 (1) 0.75 M250 458.90 1213.79 (2) 0.38 1132.51 (2) 0.41 M260 - - - - - - - M285 - - - - - - -
E12
M100 245.44 330.80 (1) 0.74 308.65 (1) 0.80 M150 343.52 441.93 (1) 0.78 412.34 (1) 0.83 M180 417.25 554.81 (1) 0.75 517.65 (1) 0.81 M220 463.72 856.45 (1) 0.54 799.09 (1) 0.58 M250 561.74 1613.43 (2) 0.35 1505.38 (2) 0.37 M260 - - - - - - - M285 - - - - - - -
E14
M100 310.92 450.26 (1) 0.69 420.11 (1) 0.74 M150 418.33 601.52 (1) 0.70 561.24 (1) 0.75 M180 482.11 755.15 (1) 0.64 704.58 (1) 0.68 M220 562.33 1165.72 (1) 0.48 1087.65 (1) 0.52 M250 - - - - - - - M260 - - - - - - - M285 - - - - - - -
E16
M100 378.89 588.10 (1) 0.64 548.71 (1) 0.69 M150 488.05 785.66 (1) 0.62 733.04 (1) 0.67 M180 545.97 986.32 (1) 0.55 920.27 (1) 0.59 M220 658.69 1522.57 (1) 0.43 1420.61 (1) 0.46 M250 - - - - - - - M260 - - - - - - - M285 - - - - - - -
(1*) 0µ > 35 and section class > 2 for chord member
(1) Chord face yielding
(2) Interpolation
(3) Chord punching shear
(4) Chord side wall failure
Table 2: Numerical and analytical (EC3 (2005) and CIDECT (Packer et al., 2009) or ISO 14346 (2013)).
Results for each connection typology for a tensile chord loading of 0.5 plN .
2191 R.M.M.P. de Matos et al. / Resistance and elastic stiffness of RHS “T” joints: part II – combined axial brace and chord loading
Latin American Journal of Solids and Structures 12 (2015) 2180-2207
Geometry Num (kN)
EC3 (kN)
EC3 Failure mode
Num/EC3
CIDECT (kN)
CIDECT Failure mode
Num/CIDECT
E6 (1*)
M100 60.91 65.88 (1) 0.92 62.62 (1) 0.97 M150 91.36 104.45 (1) 0.87 88.63 (1) 1.03 M180 123.50 138.53 (1) 0.89 115.19 (1) 1.07 M220 142.75(2*) 214.11 (1) 0.67 186.22 (1) 0.77 M250 173.08(2*) 571.39 (2) 0.30 511.63 (2) 0.34 M260 177.92(2*) 767.37 (3) 0.23 724.13 (3) 0.25 M285 - - - - - - -
E8 (1*)
M100 115.35 117.13 (1) 0.98 111.32 (1) 1.04 M150 169.52 185.69 (1) 0.91 157.56 (1) 1.08 M180 222.77 246.28 (1) 0.90 204.78 (1) 1.09 M220 207.34(2*) 380.64 (1) 0.54 331.06 (1) 0.63 M250 227.92(2*) 866.44 (2) 0.26 775.08 (2) 0.29 M260 317.04 1080.00 (3) 0.29 1046.21 (3) 0.30 M285 - - - - - - -
E10
M100 183.19 183.01 (1) 1.00 173.94 (1) 1.05 M150 264.26 290.14 (1) 0.91 246.19 (1) 1.07 M180 333.22 384.82 (1) 0.87 319.97 (1) 1.04 M220 381.37 594.75 (1) 0.64 517.29 (1) 0.74 M250 389.78 1213.79 (2) 0.32 1084.98 (2) 0.36 M260 - - - - - - - M285 - - - - - - -
E12
M100 268.54 263.53 (1) 1.02 250.47 (1) 1.07 M150 379.33 417.80 (1) 0.91 354.51 (1) 1.07 M180 432.18 554.14 (1) 0.78 460.75 (1) 0.94 M220 445.03 856.45 (1) 0.52 744.89 (1) 0.60 M250 475.45 1613.43 (2) 0.29 1441.33 (2) 0.33 M260 - - - - - - - M285 - - - - - - -
E14
M100 365.97 358.70 (1) 1.02 340.92 (1) 1.07 M150 474.29 568.67 (1) 0.83 482.53 (1) 0.98 M180 503.07 754.24 (1) 0.67 627.13 (1) 0.80 M220 517.19 1165.72 (1) 0.44 1013.88 (1) 0.51 M250 - - - - - - - M260 - - - - - - - M285 - - - - - - -
E16
M100 471.08 468.50 (1) 1.01 445.28 (1) 1.06 M150 533.00 742.75 (1) 0.72 630.24 (1) 0.85 M180 564.70 985.14 (1) 0.57 819.11 (1) 0.69 M220 571.00 1522.57 (1) 0.38 1324.25 (1) 0.43 M250 - - - - - - - M260 - - - - - - - M285 - - - - - - -
(1*) 0µ > 35 and section class > 2 for chord member
(2*) Failure displacement of 1.5x1% 0b
(1) Chord face yielding
(2) Interpolation
(3) Chord punching shear
(4) Chord side wall failure
Table 3: Numerical and analytical (EC3 (2005) and CIDECT (Packer et al., 2009) or ISO 14346 (2013)).
Results for each connection typology for a compressive chord loading of 0.5 plN .
R.M.M.P. de Matos et al. / Resistance and elastic stiffness of RHS “T” joints: part II – combined axial brace and chord loading 2192
Latin American Journal of Solids and Structures 12 (2015) 2180-2207
Geometry Num (kN)
EC3 (kN)
EC3 Failure mode
Num/EC3
CIDECT (kN)
CIDECT Failure mode
Num/CIDECT
E6 (1*)
M100 64.46 82.70 (1) 0.78 70.41 (1) 0.92 M150 87.87 110.48 (1) 0.80 94.06 (1) 0.93 M180 106.61 138.70 (1) 0.77 118.08 (1) 0.90 M220 131.64 214.11 (1) 0.61 182.28 (1) 0.72 M250 150.63 571.39 (2) 0.26 486.45 (2) 0.31 M260 154.32 767.37 (3) 0.20 679.95 (3) 0.23 M285 - - - - - - -
E8 (1*)
M100 98.67 147.02 (1) 0.67 125.17 (1) 0.79 M150 129.08 196.41 (1) 0.66 167.22 (1) 0.77 M180 149.69 246.58 (1) 0.61 209.92 (1) 0.71 M220 185.71 380.64 (1) 0.49 324.06 (1) 0.57 M250 193.12 866.44 (2) 0.22 737.64 (2) 0.26 M260 202.44 1080.00 (3) 0.19 983.42 (3) 0.21 M285 - - - - - - -
E10
M100 137.33 229.72 (1) 0.60 195.57 (1) 0.70 M150 175.49 306.90 (1) 0.57 261.27 (1) 0.67 M180 205.63 385.28 (1) 0.53 328.01 (1) 0.63 M220 222.59 594.75 (1) 0.37 506.34 (1) 0.44 M250 245.20 1213.79 (2) 0.20 1033.35 (2) 0.24 M260 - - - - - - - M285 - - - - - - -
E12
M100 183.51 330.80 (1) 0.55 281.63 (1) 0.65 M150 231.12 441.93 (1) 0.52 376.23 (1) 0.61 M180 251.70 554.81 (1) 0.45 472.33 (1) 0.53 M220 273.56 856.45 (1) 0.32 729.13 (1) 0.38 M250 288.27 1613.43 (2) 0.18 1373.58 (2) 0.21 M260 - - - - - - - M285 - - - - - - -
E14
M100 230.55 450.26 (1) 0.51 383.33 (1) 0.60 M150 265.04 601.52 (1) 0.44 512.10 (1) 0.52 M180 284.23 755.15 (1) 0.38 642.89 (1) 0.44 M220 - - - - - - - M250 - - - - - - - M260 - - - - - - - M285 - - - - - - -
E16
M100 258.12 588.10 (1) 0.44 500.67 (1) 0.52 M150 302.64 785.66 (1) 0.39 668.86 (1) 0.45 M180 337.16 986.32 (1) 0.34 839.70 (1) 0.40 M220 - - - - - - - M250 - - - - - - - M260 - - - - - - - M285 - - - - - - -
(1*) 0µ > 35 and section class > 2 for chord member
(1) Chord face yielding
(2) Interpolation
(3) Chord punching shear
(4) Chord side wall failure
Table 4: Numerical and analytical (EC3 (2005) and CIDECT (Packer et al., 2009) or ISO 14346 (2013)).
Results for each connection typology for a tensile chord loading of 0.8 plN .
2193 R.M.M.P. de Matos et al. / Resistance and elastic stiffness of RHS “T” joints: part II – combined axial brace and chord loading
Latin American Journal of Solids and Structures 12 (2015) 2180-2207
Geometry Num (kN)
EC3 (kN)
EC3 Failure mode
Num/EC3
CIDECT (kN)
CIDECT Failure mode
Num/CIDECT
E6 (1*)
M100 29.43(2*) 40.91 (1) 0.72 43.35 (1) 0.68 M150 56.91(2*) 80.94 (1) 0.70 66.23 (1) 0.86 M180 - 113.47 (1) - 90.11 (1) - M220 - 192.41 (1) - 154.85 (1) - M250 - 560.35 (2) - 442.16 (2) - M260 124.99(2*) 767.37 (3) 0.16 636.25 (3) 0.20 M285 - - - - - - -
E8 (1*)
M100 72.52(2*) 72.72 (1) 1.00 77.07 (1) 0.94 M150 114.02(2*) 143.90 (1) 0.79 117.73 (1) 0.97 M180 146.90(2*) 201.72 (1) 0.73 160.19 (1) 0.92 M220 162.67(2*) 342.07 (1) 0.48 275.29 (1) 0.59 M250 165.30(2*) 846.82 (2) 0.20 668.99 (2) 0.25 M260 - 1080.00 (3) - 917.97 (3) - M285 - - - - - - -
E10
M100 120.87(2*) 113.63 (1) 1.06 120.42 (1) 1.00 M150 171.27(2*) 224.84 (1) 0.76 183.96 (1) 0.93 M180 188.21(2*) 315.19 (1) 0.60 250.30 (1) 0.75 M220 200.10(2*) 534.48 (1) 0.37 430.14 (1) 0.47 M250 196.84(2*) 1183.12 (2) 0.17 935.54 (2) 0.21 M260 - 1421.05 (3) - 1234.51 - M285 - - - - - - -
E12
M100 173.83(2*) 163.63 (1) 1.06 173.40 (1) 1.00 M150 216.22(2*) 323.77 (1) 0.67 264.90 (1) 0.82 M180 220.71(2*) 453.87 (1) 0.49 360.43 (1) 0.61 M220 230.66(2*) 769.66 (1) 0.30 619.40 (1) 0.37 M250 - 1569.27 (2) - 1241.81 (2) - M260 - - - - - - - M285 - - - - - - -
E14
M100 224.73(2*) 222.71 (1) 1.01 236.02 (1) 0.95 M150 248.17(2*) 440.69 (1) 0.56 360.56 (1) 0.69 M180 251.18(2*) 617.77 (1) 0.41 490.58 (1) 0.51 M220 - - - - - - - M250 - - - - - - - M260 - - - - - - - M285 - - - - - - -
E16
M100 250.74(2*) 290.89 (1) 0.86 308.27 (1) 0.81 M150 280.07(2*) 575.59 (1) 0.49 470.93 (1) 0.59 M180 293.73(2*) 806.88 (1) 0.36 640.76 (1) 0.46 M220 - - - - - - - M250 - - - - - - - M260 - - - - - - - M285 - - - - - - -
(1*) 0µ > 35 and section class > 2 for chord member
(2*) Failure displacement of 1.5x1% 0b
(1) Chord face yielding
(2) Interpolation
(3) Chord punching shear
(4) Chord side wall failure
Table 5: Numerical and analytical (EC3 (2005) and CIDECT (Packer et al., 2009) or ISO 14346 (2013)).
Results for each connection typology for a compressive chord loading of 0.8 plN .
R.M.M.P. de Matos et al. / Resistance and elastic stiffness of RHS “T” joints: part II – combined axial brace and chord loading 2194
Latin American Journal of Solids and Structures 12 (2015) 2180-2207
(a) EC3 (2005)
(b) CIDECT – Packer et al. (2009) and ISO 14346 (2013)
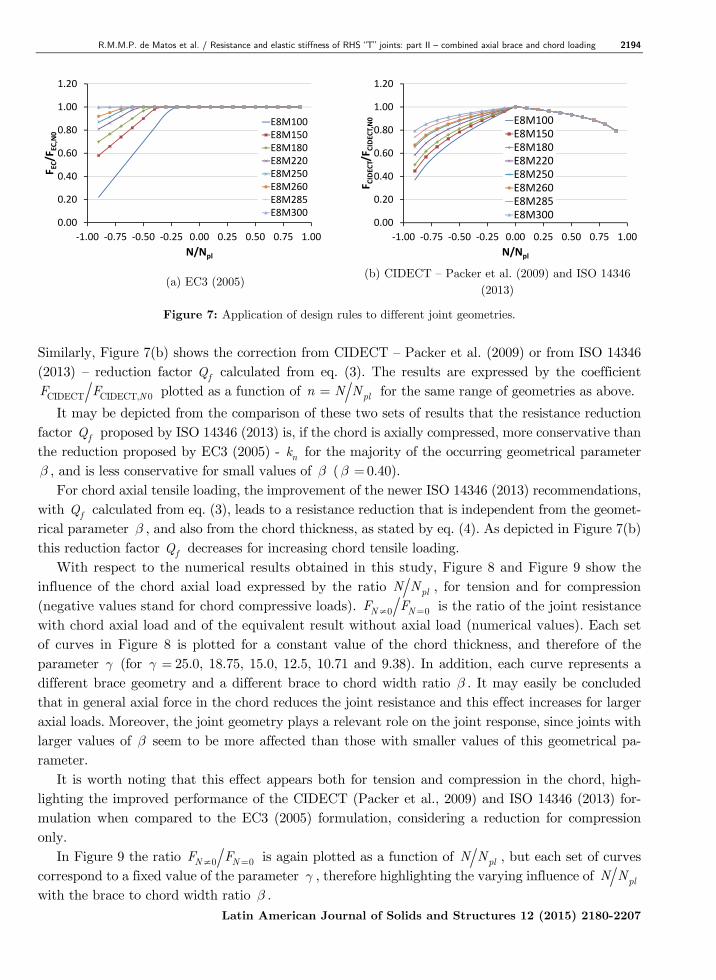
Figure 7: Application of design rules to different joint geometries.
Similarly, Figure 7(b) shows the correction from CIDECT – Packer et al. (2009) or from ISO 14346 (2013) – reduction factor
fQ calculated from eq. (3). The results are expressed by the coefficient
CIDECT CIDECT, 0NF F plotted as a function of pln N N= for the same range of geometries as above.
It may be depicted from the comparison of these two sets of results that the resistance reduction factor
fQ proposed by ISO 14346 (2013) is, if the chord is axially compressed, more conservative than the reduction proposed by EC3 (2005) - nk for the majority of the occurring geometrical parameter β , and is less conservative for small values of β (β = 0.40). For chord axial tensile loading, the improvement of the newer ISO 14346 (2013) recommendations, with
fQ calculated from eq. (3), leads to a resistance reduction that is independent from the geomet-rical parameter β , and also from the chord thickness, as stated by eq. (4). As depicted in Figure 7(b) this reduction factor
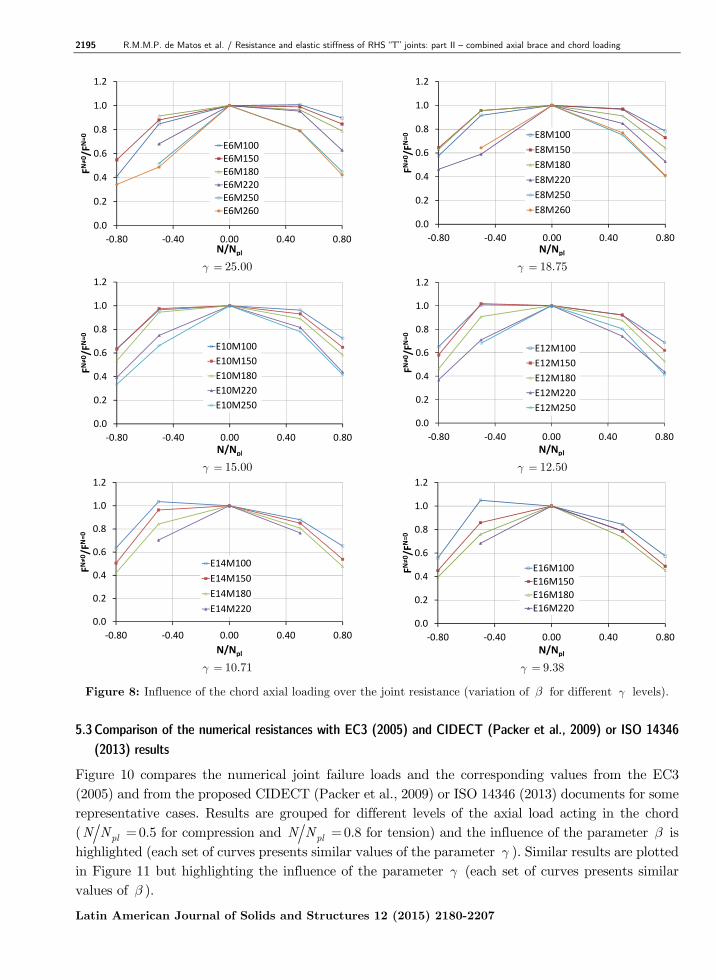
fQ decreases for increasing chord tensile loading. With respect to the numerical results obtained in this study, Figure 8 and Figure 9 show the influence of the chord axial load expressed by the ratio plN N , for tension and for compression (negative values stand for chord compressive loads). 0 0N NF F≠ = is the ratio of the joint resistance with chord axial load and of the equivalent result without axial load (numerical values). Each set of curves in Figure 8 is plotted for a constant value of the chord thickness, and therefore of the parameter γ (for γ = 25.0, 18.75, 15.0, 12.5, 10.71 and 9.38). In addition, each curve represents a different brace geometry and a different brace to chord width ratio β . It may easily be concluded that in general axial force in the chord reduces the joint resistance and this effect increases for larger axial loads. Moreover, the joint geometry plays a relevant role on the joint response, since joints with larger values of β seem to be more affected than those with smaller values of this geometrical pa-rameter. It is worth noting that this effect appears both for tension and compression in the chord, high-lighting the improved performance of the CIDECT (Packer et al., 2009) and ISO 14346 (2013) for-mulation when compared to the EC3 (2005) formulation, considering a reduction for compression only. In Figure 9 the ratio 0 0N NF F≠ = is again plotted as a function of plN N , but each set of curves correspond to a fixed value of the parameter γ , therefore highlighting the varying influence of plN N with the brace to chord width ratio β .
0.00
0.20
0.40
0.60
0.80
1.00
1.20
-1.00 -0.75 -0.50 -0.25 0.00 0.25 0.50 0.75 1.00
FE
C/F
EC
,N0
N/Npl
E8M100
E8M150
E8M180
E8M220
E8M250
E8M260
E8M285
E8M3000.00
0.20
0.40
0.60
0.80
1.00
1.20
-1.00 -0.75 -0.50 -0.25 0.00 0.25 0.50 0.75 1.00
FC
IDE
CT/
FC
IDE
CT,
N0
N/Npl
E8M100
E8M150
E8M180
E8M220
E8M250
E8M260
E8M285
E8M300
2195 R.M.M.P. de Matos et al. / Resistance and elastic stiffness of RHS “T” joints: part II – combined axial brace and chord loading
Latin American Journal of Solids and Structures 12 (2015) 2180-2207
γ = 25.00 γ = 18.75
γ = 15.00 γ = 12.50
γ = 10.71 γ = 9.38
Figure 8: Influence of the chord axial loading over the joint resistance (variation of β for different γ levels).
5.3 Comparison of the numerical resistances with EC3 (2005) and CIDECT (Packer et al., 2009) or ISO 14346
(2013) results
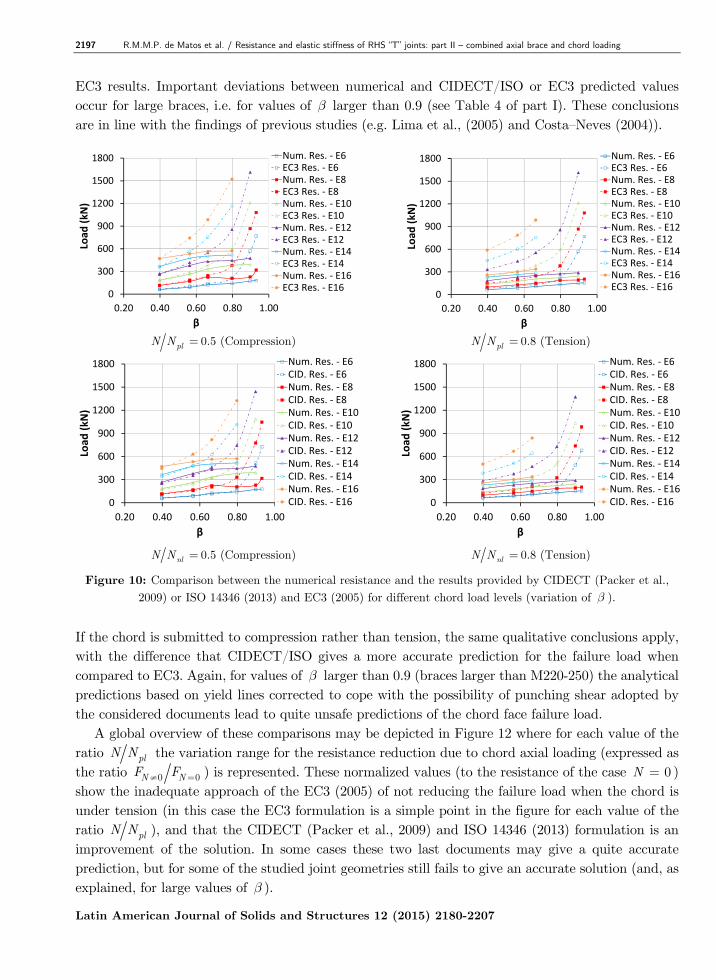
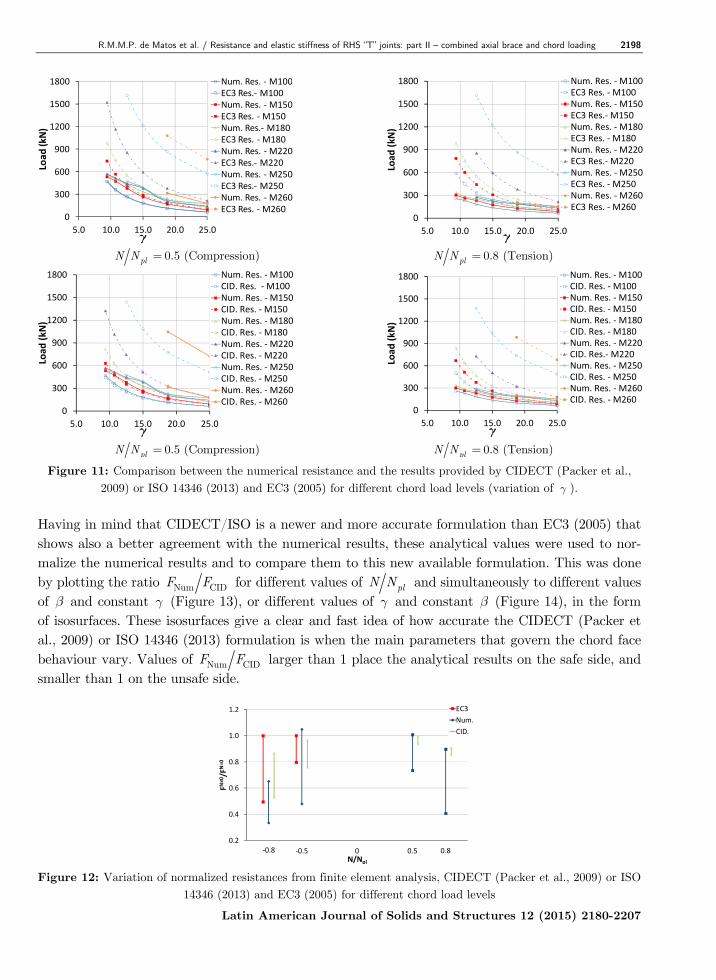
Figure 10 compares the numerical joint failure loads and the corresponding values from the EC3 (2005) and from the proposed CIDECT (Packer et al., 2009) or ISO 14346 (2013) documents for some representative cases. Results are grouped for different levels of the axial load acting in the chord ( plN N = 0.5 for compression and plN N = 0.8 for tension) and the influence of the parameter β is highlighted (each set of curves presents similar values of the parameter γ ). Similar results are plotted in Figure 11 but highlighting the influence of the parameter γ (each set of curves presents similar values of β ).
0.0
0.2
0.4
0.6
0.8
1.0
1.2
-0.80 -0.40 0.00 0.40 0.80
FN
≠0/F
N=
0
N/Npl
E6M100
E6M150
E6M180
E6M220
E6M250
E6M260
0.0
0.2
0.4
0.6
0.8
1.0
1.2
-0.80 -0.40 0.00 0.40 0.80
FN
≠0/F
N=
0
N/Npl
E8M100
E8M150
E8M180
E8M220
E8M250
E8M260
0.0
0.2
0.4
0.6
0.8
1.0
1.2
-0.80 -0.40 0.00 0.40 0.80
FN
≠0/F
N=
0
N/Npl
E10M100
E10M150
E10M180
E10M220
E10M250
0.0
0.2
0.4
0.6
0.8
1.0
1.2
-0.80 -0.40 0.00 0.40 0.80
FN≠
0/F
N=
0
N/Npl
E12M100
E12M150
E12M180
E12M220
E12M250
0.0
0.2
0.4
0.6
0.8
1.0
1.2
-0.80 -0.40 0.00 0.40 0.80
FN
≠0/F
N=
0
N/Npl
E14M100
E14M150
E14M180
E14M220
0.0
0.2
0.4
0.6
0.8
1.0
1.2
-0.80 -0.40 0.00 0.40 0.80
FN
≠0/F
N=
0
N/Npl
E16M100
E16M150
E16M180
E16M220
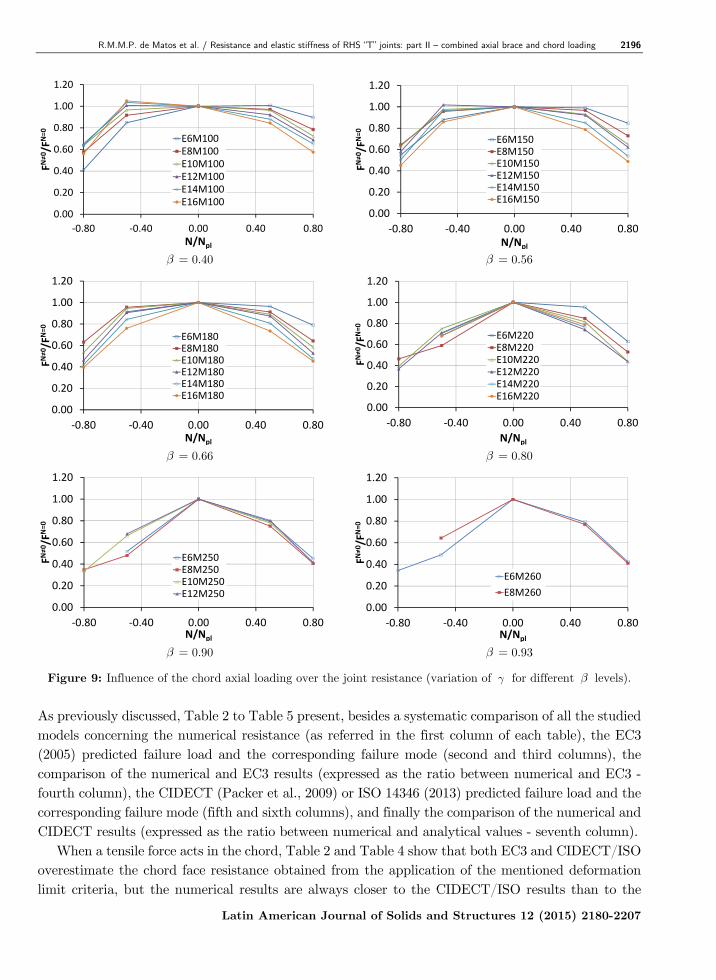
R.M.M.P. de Matos et al. / Resistance and elastic stiffness of RHS “T” joints: part II – combined axial brace and chord loading 2196
Latin American Journal of Solids and Structures 12 (2015) 2180-2207
β = 0.40 β = 0.56
β = 0.66 β = 0.80
β = 0.90 β = 0.93
Figure 9: Influence of the chord axial loading over the joint resistance (variation of γ for different β levels).
As previously discussed, Table 2 to Table 5 present, besides a systematic comparison of all the studied models concerning the numerical resistance (as referred in the first column of each table), the EC3 (2005) predicted failure load and the corresponding failure mode (second and third columns), the comparison of the numerical and EC3 results (expressed as the ratio between numerical and EC3 - fourth column), the CIDECT (Packer et al., 2009) or ISO 14346 (2013) predicted failure load and the corresponding failure mode (fifth and sixth columns), and finally the comparison of the numerical and CIDECT results (expressed as the ratio between numerical and analytical values - seventh column). When a tensile force acts in the chord, Table 2 and Table 4 show that both EC3 and CIDECT/ISO overestimate the chord face resistance obtained from the application of the mentioned deformation limit criteria, but the numerical results are always closer to the CIDECT/ISO results than to the
0.00
0.20
0.40
0.60
0.80
1.00
1.20
-0.80 -0.40 0.00 0.40 0.80
FN
≠0/F
N=
0
N/Npl
E6M100
E8M100
E10M100
E12M100
E14M100
E16M100
0.00
0.20
0.40
0.60
0.80
1.00
1.20
-0.80 -0.40 0.00 0.40 0.80
FN
≠0/F
N=
0
N/Npl
E6M150
E8M150
E10M150
E12M150
E14M150
E16M150
0.00
0.20
0.40
0.60
0.80
1.00
1.20
-0.80 -0.40 0.00 0.40 0.80
FN
≠0/F
N=
0
N/Npl
E6M180
E8M180
E10M180
E12M180
E14M180
E16M180
0.00
0.20
0.40
0.60
0.80
1.00
1.20
-0.80 -0.40 0.00 0.40 0.80
FN
≠0/F
N=
0
N/Npl
E6M220
E8M220
E10M220
E12M220
E14M220
E16M220
0.00
0.20
0.40
0.60
0.80
1.00
1.20
-0.80 -0.40 0.00 0.40 0.80
FN
≠0/F
N=
0
N/Npl
E6M250
E8M250
E10M250
E12M250
0.00
0.20
0.40
0.60
0.80
1.00
1.20
-0.80 -0.40 0.00 0.40 0.80
FN
≠0/F
N=
0
N/Npl
E6M260
E8M260
2197 R.M.M.P. de Matos et al. / Resistance and elastic stiffness of RHS “T” joints: part II – combined axial brace and chord loading
Latin American Journal of Solids and Structures 12 (2015) 2180-2207
EC3 results. Important deviations between numerical and CIDECT/ISO or EC3 predicted values occur for large braces, i.e. for values of β larger than 0.9 (see Table 4 of part I). These conclusions are in line with the findings of previous studies (e.g. Lima et al., (2005) and Costa–Neves (2004)).
plN N = 0.5 (Compression) plN N = 0.8 (Tension)
plN N = 0.5 (Compression) plN N = 0.8 (Tension)
Figure 10: Comparison between the numerical resistance and the results provided by CIDECT (Packer et al.,
2009) or ISO 14346 (2013) and EC3 (2005) for different chord load levels (variation of β ).
If the chord is submitted to compression rather than tension, the same qualitative conclusions apply, with the difference that CIDECT/ISO gives a more accurate prediction for the failure load when compared to EC3. Again, for values of β larger than 0.9 (braces larger than M220-250) the analytical predictions based on yield lines corrected to cope with the possibility of punching shear adopted by the considered documents lead to quite unsafe predictions of the chord face failure load. A global overview of these comparisons may be depicted in Figure 12 where for each value of the ratio plN N the variation range for the resistance reduction due to chord axial loading (expressed as the ratio 0 0N NF F≠ = ) is represented. These normalized values (to the resistance of the case 0N = ) show the inadequate approach of the EC3 (2005) of not reducing the failure load when the chord is under tension (in this case the EC3 formulation is a simple point in the figure for each value of the ratio plN N ), and that the CIDECT (Packer et al., 2009) and ISO 14346 (2013) formulation is an improvement of the solution. In some cases these two last documents may give a quite accurate prediction, but for some of the studied joint geometries still fails to give an accurate solution (and, as explained, for large values of β ).
0
300
600
900
1200
1500
1800
0.20 0.40 0.60 0.80 1.00
Loa
d (
kN
)
β
Num. Res. - E6
EC3 Res. - E6
Num. Res. - E8
EC3 Res. - E8
Num. Res. - E10
EC3 Res. - E10
Num. Res. - E12
EC3 Res. - E12
Num. Res. - E14
EC3 Res. - E14
Num. Res. - E16
EC3 Res. - E160
300
600
900
1200
1500
1800
0.20 0.40 0.60 0.80 1.00
Loa
d (
kN
)
β
Num. Res. - E6
EC3 Res. - E6
Num. Res. - E8
EC3 Res. - E8
Num. Res. - E10
EC3 Res. - E10
Num. Res. - E12
EC3 Res. - E12
Num. Res. - E14
EC3 Res. - E14
Num. Res. - E16
EC3 Res. - E16
0
300
600
900
1200
1500
1800
0.20 0.40 0.60 0.80 1.00
Loa
d (
kN
)
β
Num. Res. - E6
CID. Res. - E6
Num. Res. - E8
CID. Res. - E8
Num. Res. - E10
CID. Res. - E10
Num. Res. - E12
CID. Res. - E12
Num. Res. - E14
CID. Res. - E14
Num. Res. - E16
CID. Res. - E16 0
300
600
900
1200
1500
1800
0.20 0.40 0.60 0.80 1.00
Loa
d (
kN
)
β
Num. Res. - E6
CID. Res. - E6
Num. Res. - E8
CID. Res. - E8
Num. Res. - E10
CID. Res. - E10
Num. Res. - E12
CID. Res. - E12
Num. Res. - E14
CID. Res. - E14
Num. Res. - E16
CID. Res. - E16
R.M.M.P. de Matos et al. / Resistance and elastic stiffness of RHS “T” joints: part II – combined axial brace and chord loading 2198
Latin American Journal of Solids and Structures 12 (2015) 2180-2207
plN N = 0.5 (Compression) plN N = 0.8 (Tension)
plN N = 0.5 (Compression) plN N = 0.8 (Tension)
Figure 11: Comparison between the numerical resistance and the results provided by CIDECT (Packer et al.,
2009) or ISO 14346 (2013) and EC3 (2005) for different chord load levels (variation of γ ).
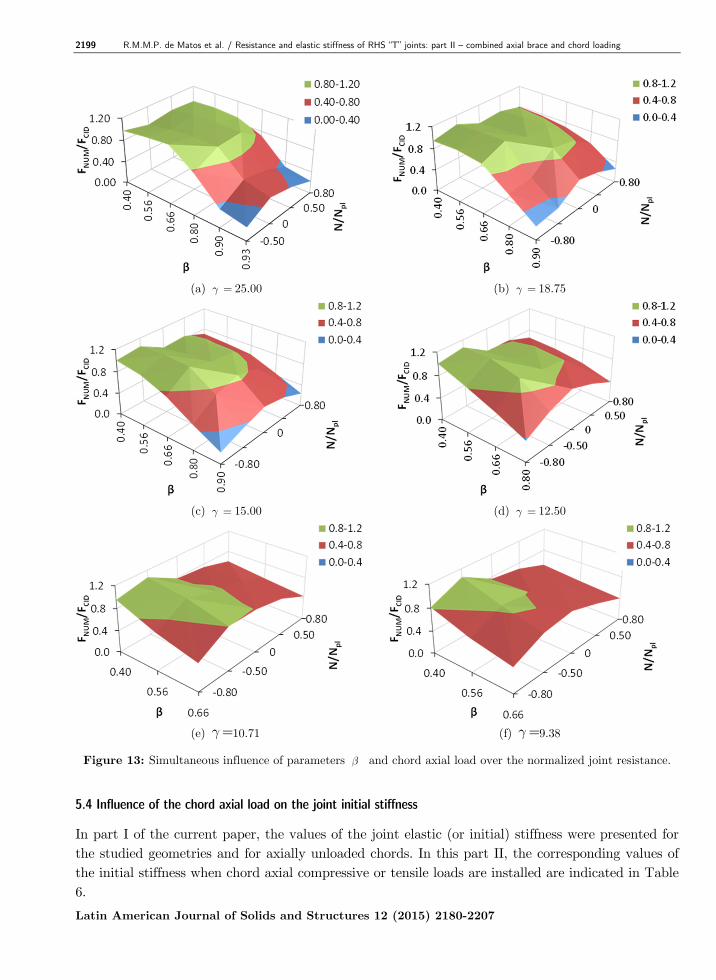
Having in mind that CIDECT/ISO is a newer and more accurate formulation than EC3 (2005) that shows also a better agreement with the numerical results, these analytical values were used to nor-malize the numerical results and to compare them to this new available formulation. This was done by plotting the ratio Num CIDF F for different values of plN N and simultaneously to different values of β and constant γ (Figure 13), or different values of γ and constant β (Figure 14), in the form of isosurfaces. These isosurfaces give a clear and fast idea of how accurate the CIDECT (Packer et al., 2009) or ISO 14346 (2013) formulation is when the main parameters that govern the chord face behaviour vary. Values of Num CIDF F larger than 1 place the analytical results on the safe side, and smaller than 1 on the unsafe side.
Figure 12: Variation of normalized resistances from finite element analysis, CIDECT (Packer et al., 2009) or ISO
14346 (2013) and EC3 (2005) for different chord load levels
0
300
600
900
1200
1500
1800
5.0 10.0 15.0 20.0 25.0
Loa
d(k
N)
γγγγ
Num. Res. - M100
EC3 Res.- M100
Num. Res. - M150
EC3 Res. - M150
Num. Res.- M180
EC3 Res. - M180
Num. Res. - M220
EC3 Res.- M220
Num. Res. - M250
EC3 Res.- M250
Num. Res. - M260
EC3 Res. - M2600
300
600
900
1200
1500
1800
5.0 10.0 15.0 20.0 25.0
Loa
d (
kN
)
γγγγ
Num. Res. - M100
EC3 Res. - M100
Num. Res. - M150
EC3 Res.- M150
Num. Res. - M180
EC3 Res. - M180
Num. Res. - M220
EC3 Res.- M220
Num. Res. - M250
EC3 Res. - M250
Num. Res. - M260
EC3 Res. - M260
0
300
600
900
1200
1500
1800
5.0 10.0 15.0 20.0 25.0
Loa
d(k
N)
γγγγ
Num. Res. - M100
CID. Res. - M100
Num. Res. - M150
CID. Res. - M150
Num. Res. - M180
CID. Res. - M180
Num. Res. - M220
CID. Res. - M220
Num. Res. - M250
CID. Res. - M250
Num. Res. - M260
CID. Res. - M2600
300
600
900
1200
1500
1800
5.0 10.0 15.0 20.0 25.0
Loa
d(k
N)
γγγγ
Num. Res. - M100
CID. Res. - M100
Num. Res. - M150
CID. Res. - M150
Num. Res. - M180
CID. Res. - M180
Num. Res. - M220
CID. Res.- M220
Num. Res. - M250
CID. Res. - M250
Num. Res. - M260
CID. Res. - M260
0.2
0.4
0.6
0.8
1.0
1.2
-1 -0.5 0 0.5 1
FN≠
0/F
N=
0
N/Npl
EC3
Num.
CID.
-0.8 0.8
2199 R.M.M.P. de Matos et al. / Resistance and elastic stiffness of RHS “T” joints: part II – combined axial brace and chord loading
Latin American Journal of Solids and Structures 12 (2015) 2180-2207
(a) γ = 25.00 (b) γ = 18.75
(c) γ = 15.00 (d) γ = 12.50
(e) γ=10.71 (f) γ=9.38
Figure 13: Simultaneous influence of parameters β and chord axial load over the normalized joint resistance.
5.4 Influence of the chord axial load on the joint initial stiffness
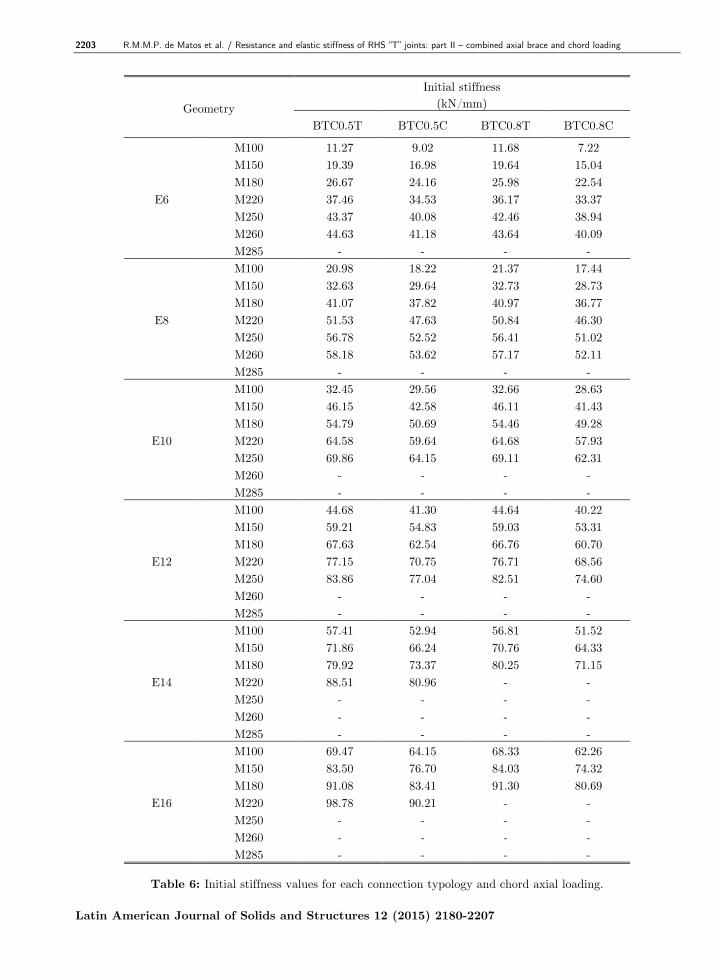
In part I of the current paper, the values of the joint elastic (or initial) stiffness were presented for the studied geometries and for axially unloaded chords. In this part II, the corresponding values of the initial stiffness when chord axial compressive or tensile loads are installed are indicated in Table 6.
R.M.M.P. de Matos et al. / Resistance and elastic stiffness of RHS “T” joints: part II – combined axial brace and chord loading 2200
Latin American Journal of Solids and Structures 12 (2015) 2180-2207
(a) β = 0.40 (b) β = 0.56
(c) β = 0.66 (d) β = 0.80
(e) β = 0.90 (f) β = 0.93
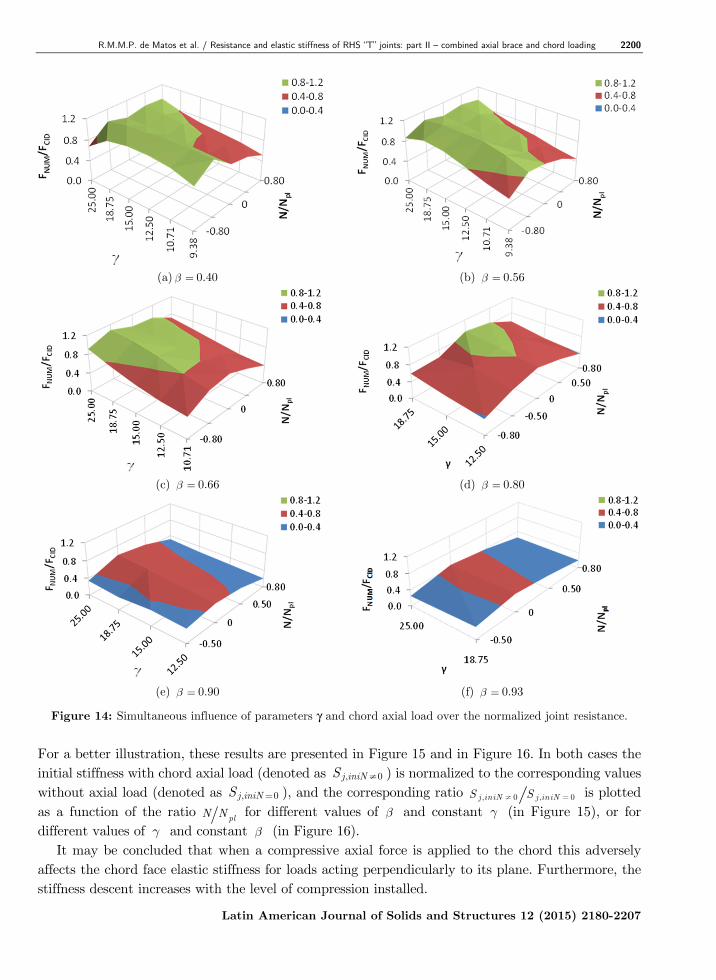
Figure 14: Simultaneous influence of parameters γ and chord axial load over the normalized joint resistance.
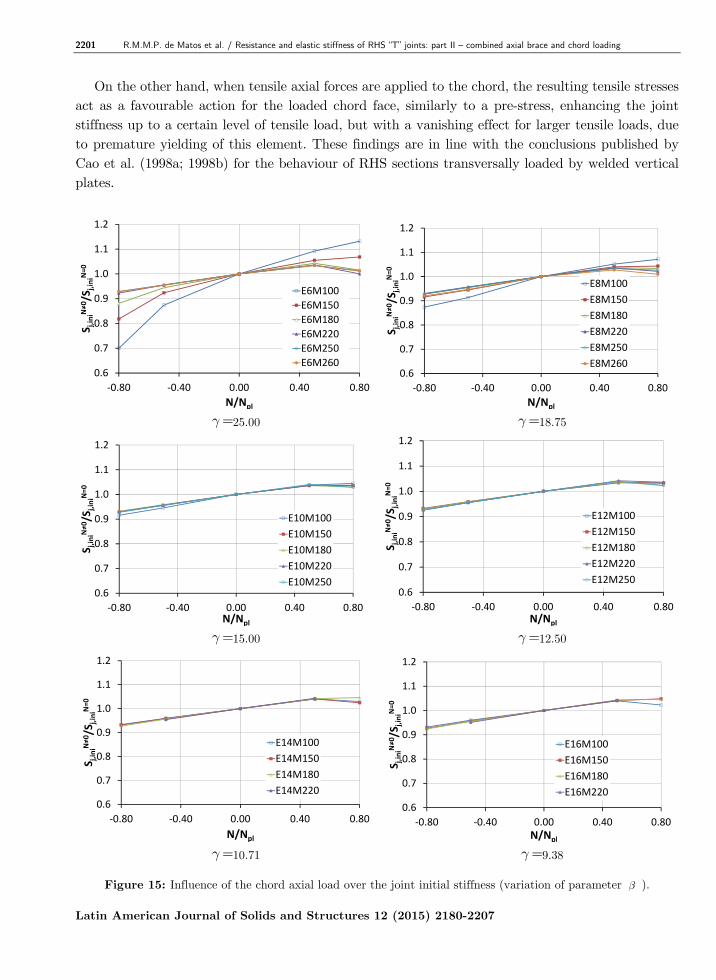
For a better illustration, these results are presented in Figure 15 and in Figure 16. In both cases the initial stiffness with chord axial load (denoted as , 0j iniNS ≠ ) is normalized to the corresponding values without axial load (denoted as , 0j iniNS = ), and the corresponding ratio , 0 , 0j iniN j iniNS S≠ = is plotted as a function of the ratio
plN N for different values of β and constant γ (in Figure 15), or for different values of γ and constant β (in Figure 16). It may be concluded that when a compressive axial force is applied to the chord this adversely affects the chord face elastic stiffness for loads acting perpendicularly to its plane. Furthermore, the stiffness descent increases with the level of compression installed.
2201 R.M.M.P. de Matos et al. / Resistance and elastic stiffness of RHS “T” joints: part II – combined axial brace and chord loading
Latin American Journal of Solids and Structures 12 (2015) 2180-2207
On the other hand, when tensile axial forces are applied to the chord, the resulting tensile stresses act as a favourable action for the loaded chord face, similarly to a pre-stress, enhancing the joint stiffness up to a certain level of tensile load, but with a vanishing effect for larger tensile loads, due to premature yielding of this element. These findings are in line with the conclusions published by Cao et al. (1998a; 1998b) for the behaviour of RHS sections transversally loaded by welded vertical plates.
γ=25.00 γ=18.75
γ=15.00 γ=12.50
γ=10.71 γ=9.38
Figure 15: Influence of the chord axial load over the joint initial stiffness (variation of parameter β ).
0.6
0.7
0.8
0.9
1.0
1.1
1.2
-0.80 -0.40 0.00 0.40 0.80
Sj,
iniN
≠0/S
j,in
iN=
0
N/Npl
E6M100
E6M150
E6M180
E6M220
E6M250
E6M2600.6
0.7
0.8
0.9
1.0
1.1
1.2
-0.80 -0.40 0.00 0.40 0.80S
j,in
iN≠
0/S
j,in
iN=
0
N/Npl
E8M100
E8M150
E8M180
E8M220
E8M250
E8M260
0.6
0.7
0.8
0.9
1.0
1.1
1.2
-0.80 -0.40 0.00 0.40 0.80
Sj,
iniN
≠0/S
j,in
iN=
0
N/Npl
E10M100
E10M150
E10M180
E10M220
E10M2500.6
0.7
0.8
0.9
1.0
1.1
1.2
-0.80 -0.40 0.00 0.40 0.80
Sj,
iniN
≠0/S
j,in
iN=
0
N/Npl
E12M100
E12M150
E12M180
E12M220
E12M250
0.6
0.7
0.8
0.9
1.0
1.1
1.2
-0.80 -0.40 0.00 0.40 0.80
Sj,
iniN
≠0/S
j,in
iN=
0
N/Npl
E14M100
E14M150
E14M180
E14M220
0.6
0.7
0.8
0.9
1.0
1.1
1.2
-0.80 -0.40 0.00 0.40 0.80
Sj,
iniN
≠0/S
j,in
iN=
0
N/Npl
E16M100
E16M150
E16M180
E16M220
R.M.M.P. de Matos et al. / Resistance and elastic stiffness of RHS “T” joints: part II – combined axial brace and chord loading 2202
Latin American Journal of Solids and Structures 12 (2015) 2180-2207
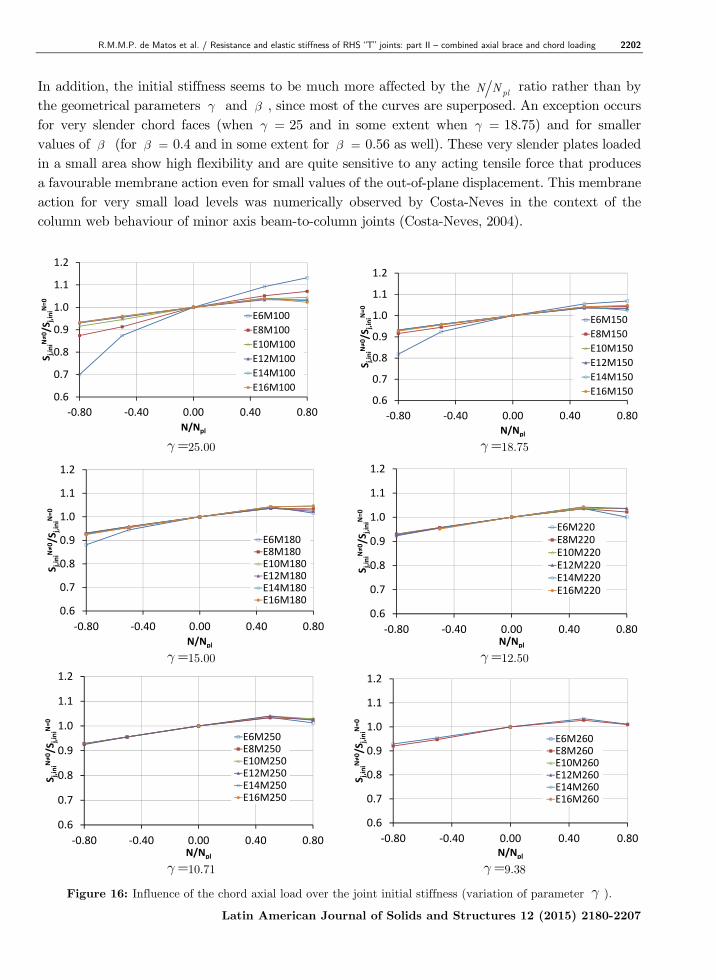
In addition, the initial stiffness seems to be much more affected by the plN N ratio rather than by
the geometrical parameters γ and β , since most of the curves are superposed. An exception occurs for very slender chord faces (when γ = 25 and in some extent when γ = 18.75) and for smaller values of β (for β = 0.4 and in some extent for β = 0.56 as well). These very slender plates loaded in a small area show high flexibility and are quite sensitive to any acting tensile force that produces a favourable membrane action even for small values of the out-of-plane displacement. This membrane action for very small load levels was numerically observed by Costa-Neves in the context of the column web behaviour of minor axis beam-to-column joints (Costa-Neves, 2004).
γ=25.00 γ=18.75
γ=15.00 γ=12.50
γ=10.71 γ=9.38
Figure 16: Influence of the chord axial load over the joint initial stiffness (variation of parameter γ ).
0.6
0.7
0.8
0.9
1.0
1.1
1.2
-0.80 -0.40 0.00 0.40 0.80
Sj,
iniN
≠0/S
j,in
iN=
0
N/Npl
E6M100
E8M100
E10M100
E12M100
E14M100
E16M100
0.6
0.7
0.8
0.9
1.0
1.1
1.2
-0.80 -0.40 0.00 0.40 0.80
Sj,
iniN
≠0/S
j,in
iN=
0
N/Npl
E6M150
E8M150
E10M150
E12M150
E14M150
E16M150
0.6
0.7
0.8
0.9
1.0
1.1
1.2
-0.80 -0.40 0.00 0.40 0.80
Sj,
iniN
≠0/S
j,in
iN=
0
N/Npl
E6M180
E8M180
E10M180
E12M180
E14M180
E16M180
0.6
0.7
0.8
0.9
1.0
1.1
1.2
-0.80 -0.40 0.00 0.40 0.80
Sj,
iniN
≠0/S
j,in
iN=
0
N/Npl
E6M220
E8M220
E10M220
E12M220
E14M220
E16M220
0.6
0.7
0.8
0.9
1.0
1.1
1.2
-0.80 -0.40 0.00 0.40 0.80
Sj,
iniN
≠0/S
j,in
iN=
0
N/Npl
E6M250
E8M250
E10M250
E12M250
E14M250
E16M250
0.6
0.7
0.8
0.9
1.0
1.1
1.2
-0.80 -0.40 0.00 0.40 0.80
Sj,
iniN
≠0/S
j,in
iN=
0
N/Npl
E6M260
E8M260
E10M260
E12M260
E14M260
E16M260
2203 R.M.M.P. de Matos et al. / Resistance and elastic stiffness of RHS “T” joints: part II – combined axial brace and chord loading
Latin American Journal of Solids and Structures 12 (2015) 2180-2207
Geometry
Initial stiffness (kN/mm)
BTC0.5T BTC0.5C BTC0.8T BTC0.8C
E6
M100 11.27 9.02 11.68 7.22
M150 19.39 16.98 19.64 15.04
M180 26.67 24.16 25.98 22.54
M220 37.46 34.53 36.17 33.37
M250 43.37 40.08 42.46 38.94
M260 44.63 41.18 43.64 40.09
M285 - - - -
E8
M100 20.98 18.22 21.37 17.44
M150 32.63 29.64 32.73 28.73
M180 41.07 37.82 40.97 36.77
M220 51.53 47.63 50.84 46.30
M250 56.78 52.52 56.41 51.02
M260 58.18 53.62 57.17 52.11
M285 - - - -
E10
M100 32.45 29.56 32.66 28.63
M150 46.15 42.58 46.11 41.43
M180 54.79 50.69 54.46 49.28
M220 64.58 59.64 64.68 57.93
M250 69.86 64.15 69.11 62.31
M260 - - - -
M285 - - - -
E12
M100 44.68 41.30 44.64 40.22
M150 59.21 54.83 59.03 53.31
M180 67.63 62.54 66.76 60.70
M220 77.15 70.75 76.71 68.56
M250 83.86 77.04 82.51 74.60
M260 - - - -
M285 - - - -
E14
M100 57.41 52.94 56.81 51.52
M150 71.86 66.24 70.76 64.33
M180 79.92 73.37 80.25 71.15
M220 88.51 80.96 - -
M250 - - - -
M260 - - - -
M285 - - - -
E16
M100 69.47 64.15 68.33 62.26
M150 83.50 76.70 84.03 74.32
M180 91.08 83.41 91.30 80.69
M220 98.78 90.21 - -
M250 - - - -
M260 - - - -
M285 - - - -
Table 6: Initial stiffness values for each connection typology and chord axial loading.
R.M.M.P. de Matos et al. / Resistance and elastic stiffness of RHS “T” joints: part II – combined axial brace and chord loading 2204
Latin American Journal of Solids and Structures 12 (2015) 2180-2207
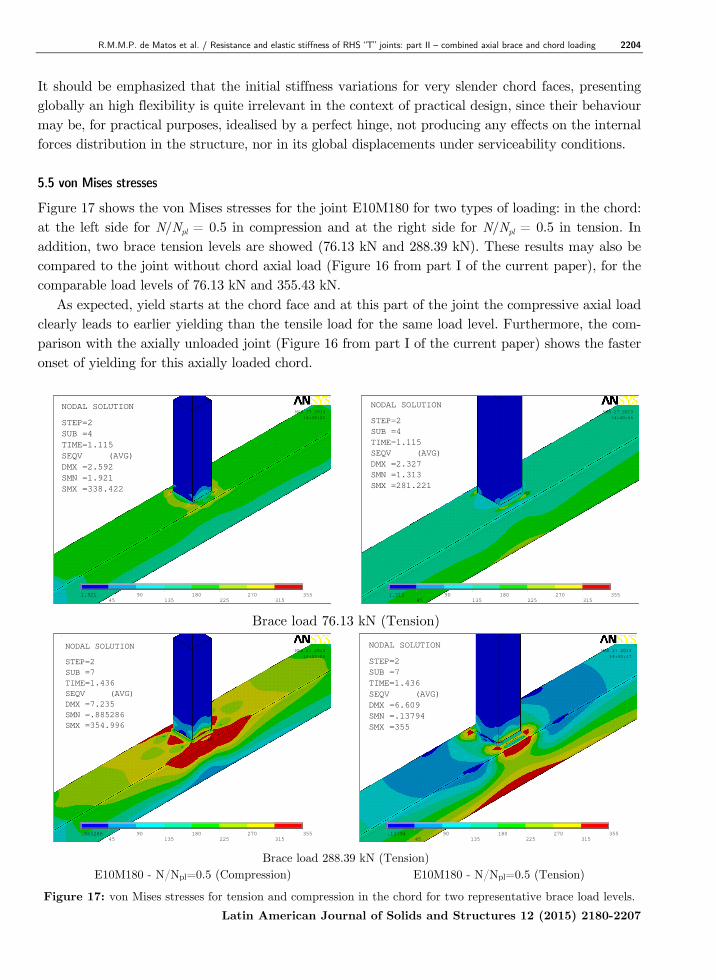
It should be emphasized that the initial stiffness variations for very slender chord faces, presenting globally an high flexibility is quite irrelevant in the context of practical design, since their behaviour may be, for practical purposes, idealised by a perfect hinge, not producing any effects on the internal forces distribution in the structure, nor in its global displacements under serviceability conditions. 5.5 von Mises stresses
Figure 17 shows the von Mises stresses for the joint E10M180 for two types of loading: in the chord: at the left side for N/Npl = 0.5 in compression and at the right side for N/Npl = 0.5 in tension. In addition, two brace tension levels are showed (76.13 kN and 288.39 kN). These results may also be compared to the joint without chord axial load (Figure 16 from part I of the current paper), for the comparable load levels of 76.13 kN and 355.43 kN. As expected, yield starts at the chord face and at this part of the joint the compressive axial load clearly leads to earlier yielding than the tensile load for the same load level. Furthermore, the com-parison with the axially unloaded joint (Figure 16 from part I of the current paper) shows the faster onset of yielding for this axially loaded chord.
Brace load 76.13 kN (Tension)
Brace load 288.39 kN (Tension)
E10M180 - N/Npl=0.5 (Compression) E10M180 - N/Npl=0.5 (Tension)
Figure 17: von Mises stresses for tension and compression in the chord for two representative brace load levels.
1
MX
1.921
45
90
135
180
225
270
315
355
MAR 27 2013
14:20:22
NODAL SOLUTION
STEP=2
SUB =4
TIME=1.115
SEQV (AVG)
DMX =2.592
SMN =1.921
SMX =338.422
1
MX
1.313
45
90
135
180
225
270
315
355
MAR 27 2013
14:40:55
NODAL SOLUTION
STEP=2
SUB =4
TIME=1.115
SEQV (AVG)
DMX =2.327
SMN =1.313
SMX =281.221
1
MX
.885286
45
90
135
180
225
270
315
355
MAR 27 2013
14:23:08
NODAL SOLUTION
STEP=2
SUB =7
TIME=1.436
SEQV (AVG)
DMX =7.235
SMN =.885286
SMX =354.996
1
MX
.13794
45
90
135
180
225
270
315
355
MAR 27 2013
14:40:17
NODAL SOLUTION
STEP=2
SUB =7
TIME=1.436
SEQV (AVG)
DMX =6.609
SMN =.13794
SMX =355
1
NODAL SOLUTION
STEP=2
SUB =4
TIME=1.115
SEQV (AVG)
DMX =2.592
SMN =1.921
SMX =338.422
1
NODAL SOLUTION
STEP=2
SUB =7
TIME=1.436
SEQV (AVG)
DMX =7.235
SMN =.885286
SMX =354.996
1
NODAL SOLUTION
STEP=2
SUB =4
TIME=1.115
SEQV (AVG)
DMX =2.327
SMN =1.313
SMX =281.221
1
NODAL SOLUTION
STEP=2
SUB =7
TIME=1.436
SEQV (AVG)
DMX =6.609
SMN =.13794
SMX =355
2205 R.M.M.P. de Matos et al. / Resistance and elastic stiffness of RHS “T” joints: part II – combined axial brace and chord loading
Latin American Journal of Solids and Structures 12 (2015) 2180-2207
6 CONCLUSIONS
This paper is the part II of an extensive study dealing with the resistance and elastic stiffness of RHS “T” joints under axial brace loading. In this part II combinations of constant chord loading (different levels in tension or compression) and incremental brace loading were considered. 168 simulations were performed, corresponding to 6 chord thicknesses x 7 brace sections x 2 levels of chord tension axial load x 2 levels of chord compression axial load. It was concluded that in general axial force in the chord reduces the joint resistance and this effect increases for larger axial loads. In addition, the joint geometry plays a relevant role on the joint response, since joints with larger values of β seem to be more affected than those with smaller values of this geometrical parameter. A systematic comparison of all the studied models concerning the numerical resistance and the analytical results predicted by the EC3 (2005) and by CIDECT (Packer et al., 2009) or ISO 14346 (2013) recommendations was performed, and it was concluded that when a tensile force acts in the chord, both EC3 and CIDECT/ISO lead to some overestimation of the chord face failure load. In addition, the CIDECT (Packer et al., 2009) or ISO 14346 (2013) as an improvement of the previous EC3 (2005) formulation, leads effectively to more accurate predictions. If the chord is submitted to compression rather than to tension, the same qualitative conclusions apply, again width CIDECT (Packer et al., 2009) or ISO 14346 (2013) improving the accuracy of the prediction for the failure load as well. Both documents lead to less accurate results for values of β larger than 0.9. A systematic comparison of the analytical and CIDECT (Packer et al., 2009) or ISO 14346 (2013) results was presented in the form of isosurfaces, giving a clear and fast idea of how accurate this new proposal is for the whole range of studied parameters, constituting a quite original approach for these comparisons and reflecting the vast extension of the presented study. Finally, the influence of the chord axial force over the joint initial stiffness was investigated, and it was concluded that when a compressive axial force is applied to the chord this adversely affects the chord face stiffness for any level of axial load, and that this adverse effect increases with the level of compression. However, when tension axial forces are applied to the chord, the joint stiffness is en-hanced up to a certain level of tensile load, and then stars to stabilize or to drop.
Acknowledgement
This work has been partially supported by the Portuguese Foundation for Science and Technology under pro-ject grant PEst-OE/ EEI/UI308/2014
References
ABNT NBR 16239, (2013). Design of steel and composite structures for buildings using hollow sections. Associação Brasileira de Normas Técnicas, São Paulo, Brazil (in portuguese).
Ansys 10.0 ® (2005), ANSYS – Inc., Theory Reference.
Bittencourt, M.C., (2008). Avaliação de ligações soldadas de perfis tubulares em estruturas de aço através do método dos elementos finitos. MsC Thesis (in Portuguese), UERJ – State University of Rio de Janeiro – PGECIV.
Cao, J.J., Packer, J.A., Kosteski, N., (1998a). Determination of connection strength between longitudinal plates and RHS columns. Journal of Constructional Steel Research 46: 1-3, paper nº 134.
R.M.M.P. de Matos et al. / Resistance and elastic stiffness of RHS “T” joints: part II – combined axial brace and chord loading 2206
Latin American Journal of Solids and Structures 12 (2015) 2180-2207
Cao, J.J., Packer, J.A., Young, G.J., (1998b). Yield line analysis of RHS connections with axial loads. Journal of Constructional Steel Research 48(1): 1-25.
Costa-Neves, L.F., (2004). Monotonic and cyclic behaviour of minor axis and tubular joints in steel and steel and concrete composite structures. PhD Thesis (in Portuguese), University of Coimbra, Portugal.
Eurocode 3, EN 1993-1-8, (2010). Design of steel structures - Part 1.8: Design of joints. CEN, European Committee for Standardization, Brussels.
France, J.E., (1997). Bolted connections between open section beams and box columns. PhD Thesis, University of Sheffield.
International Organization for Standardization (ISO), (2013). Static Design Procedure for Welded Hollow-Section Joints - Recommendations, ISO 14346:2013(E), Geneva, Switzerland.
Kosteski, N., Packer, J.A., Puthli, R.S., (2003). A finite element method based yield load determination procedure for hollow structural section connections. Journal of Constructional Steel Research 59: 453-471.
Lima, L.R.O., Neves, L.F.C., Silva, J.G.S., Vellasco, P.C.G.S., (2005). Análise paramétrica de ligações “T” com perfis tubulares em aço através de um modelo de elementos finitos. Proceedings of the XXVI CILAMCE - Iberian Latin American Congress on Computational Methods in Engineering, Guarapari, 1: 1-12.
Lima, N.S., (2012). Comportamento estrutural de ligações tubulares T e KT, MsC Thesis (in Portuguese), UERJ - State University of Rio de Janeiro – PGECIV.
Lipp, A., Ummenhofer, T., (2014). Influence of tensile chord stresses on the strength of circular hollow section joints. Steel Construction – Design and Research, ECCS, 7: 126-132.
Liu, D.K., Wardenier, J., van der Vegte, G.J., (2004). New chord stress functions for rectangular hollow section joints. Proceedings of the 14th. International Offshore and Polar Engineering Conference, Toulon, France, International So-ciety of Offshore and Polar Engineers, 23-28.
Lu, L.H., de Winkel, G.D., Yu, Y., Wardenier, J., (1994). Deformation limit for the ultimate strength of hollow section joints. 6th International Symposium on Tubular Structures, Melbourne, 341-347.
Mendes, F.C., (2008). Análise teórica-experimental de ligações tipo “T”, “K” e “KT” com perfis metálicos tubulares. MsC Thesis (in Portuguese), Federal University of Ouro Preto.
Nizer, A., (2014). Analysis of the influence of chord normal stresses on the behaviour of hollow sections connections. Master Dissertation (in Portuguese) PGECIV – Post Graduate Program in Civil Engineering, UERJ, Brazil.
Oliveira, A., Nobre, D., Lima, L., Vellasco, P., Silva, J., (2011). Comportamento de ligações tipo T entre perfis CHS sujeitas a esforços axiais no banzo. XXXII CILAMCE Congresso Ibero Latino Americano de Métodos Computacionais em Engenharia, Ouro Preto (in Portuguese).
Packer, J.A., Wardenier, J., Zhao, X.-L., van der Vegte, G.J., Kurobane Y., (2009). Design guide for rectangular hollow section (RHS) joints under predominantly static loading 3(2), CIDECT.
Santos, M., Lima, L., Freitas, A., Vellasco, P., Silva, J., (2011a). Comportamento de ligações tipo K entre RHS e CHS sujeitas a esforços axiais no banzo. XXXII CILAMCE Congresso Ibero Latino Americano de Métodos Computacionais em Engenharia, Ouro Negro, (in Portuguese).
Santos, M., Lima, L., Freitas, A., Vellasco, P., Silva, J., Neves, L., (2011b). Modelagem numérica de ligações K tubulares entre RHS e CHS. Congresso de Métodos Numéricos em Engenharia, Coimbra (in Portuguese).
Silva, R.S., (2012). Avaliação de ligações K e T entre perfis estruturais tubulares circulares. MsC Thesis (in Portuguese), UERJ - State University of Rio de Janeiro – PGECIV.
Silva, R.S., Lima, L., Vellasco, P., Silva, J., Neves, L., (2012). Numerical evaluation of CHS K joints. International Journal of Modeling and Simulation for Petroleum Industry 6(1), June.
van der Vegte, G.J., Makino, Y., (2006). The ultimate strength of axially loaded CHS uniplanar T joints subjected to axial chord loading. 11th International Symposium on Tubular Structures, Québec, Canada, Packer & Willibald, eds. CRC Press, 115-123.
2207 R.M.M.P. de Matos et al. / Resistance and elastic stiffness of RHS “T” joints: part II – combined axial brace and chord loading
Latin American Journal of Solids and Structures 12 (2015) 2180-2207
Wardenier, J., Packer, J.A., Zhao, X-L., van der Vegte, G.J., (2010). Hollow sections in structural applications. 2nd Edition, CIDECT.
Wardenier, J., van der Vegte, G.J., Liu, D.K., (2007). Chord stress function for rectangular hollow section X and T joints. Proceedings of the 17th International Offshore and Polar Engineering Conference, Lisbon, Portugal, 3363-3371.
Wardenier, J., van der Vegte, G.J., Packer, J.A., Zhao, X.-L., (2010). Background of the new RHS joint strength equations in the new IIW (2009) recommendations. 13th International Symposium on Tubular Structures, Hong Kong, China, CRC Press, 403-411.


![[CIDECT DG2] -- Structural Stability of Hollow Sections](https://img.dokumen.tips/doc/110x75/543f8ecdb1af9f4e0a8b4807/cidect-dg2-structural-stability-of-hollow-sections.jpg)