Embed Size (px)
Citation preview
1
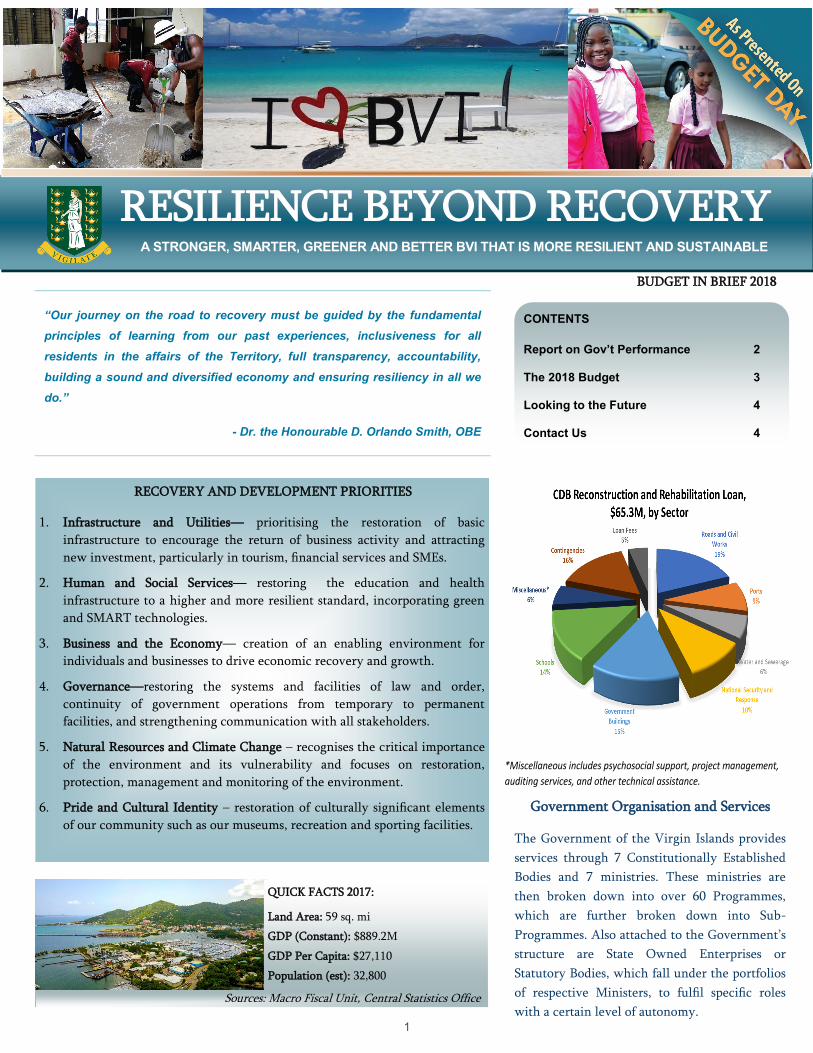
RESILIENCE BEYOND RECOVERY A STRONGER, SMARTER, GREENER AND BETTER BVI THAT IS MORE RESILIENT AND SUSTAINABLE
Sources: Macro Fiscal Unit, Central Statistics Office
Government Organisation and Services
The Government of the Virgin Islands provides
services through 7 Constitutionally Established
Bodies and 7 ministries. These ministries are
then broken down into over 60 Programmes,
which are further broken down into Sub-
Programmes. Also attached to the Government’s
structure are State Owned Enterprises or
Statutory Bodies, which fall under the portfolios
of respective Ministers, to fulfil specific roles
with a certain level of autonomy.
RECOVERY AND DEVELOPMENT PRIORITIES
1. Infrastructure and Utilities— prioritising the restoration of basic
infrastructure to encourage the return of business activity and attracting
new investment, particularly in tourism, financial services and SMEs.
2. Human and Social Services— restoring the education and health
infrastructure to a higher and more resilient standard, incorporating green
and SMART technologies.
3. Business and the Economy— creation of an enabling environment for
individuals and businesses to drive economic recovery and growth.
4. Governance—restoring the systems and facilities of law and order,
continuity of government operations from temporary to permanent
facilities, and strengthening communication with all stakeholders.
5. Natural Resources and Climate Change – recognises the critical importance
of the environment and its vulnerability and focuses on restoration,
protection, management and monitoring of the environment.
6. Pride and Cultural Identity – restoration of culturally significant elements
of our community such as our museums, recreation and sporting facilities.
BUDGET IN BRIEF 2018
CONTENTS
Report on Gov’t Performance 2
The 2018 Budget 3
Looking to the Future 4
Contact Us 4
“Our journey on the road to recovery must be guided by the fundamental
principles of learning from our past experiences, inclusiveness for all
residents in the affairs of the Territory, full transparency, accountability,
building a sound and diversified economy and ensuring resiliency in all we
do.”
- Dr. the Honourable D. Orlando Smith, OBE
QUICK FACTS 2017:
Land Area: 59 sq. mi
GDP (Constant): $889.2M
GDP Per Capita: $27,110
Population (est): 32,800
*Miscellaneous includes psychosocial support, project management,
auditing services, and other technical assistance.
2
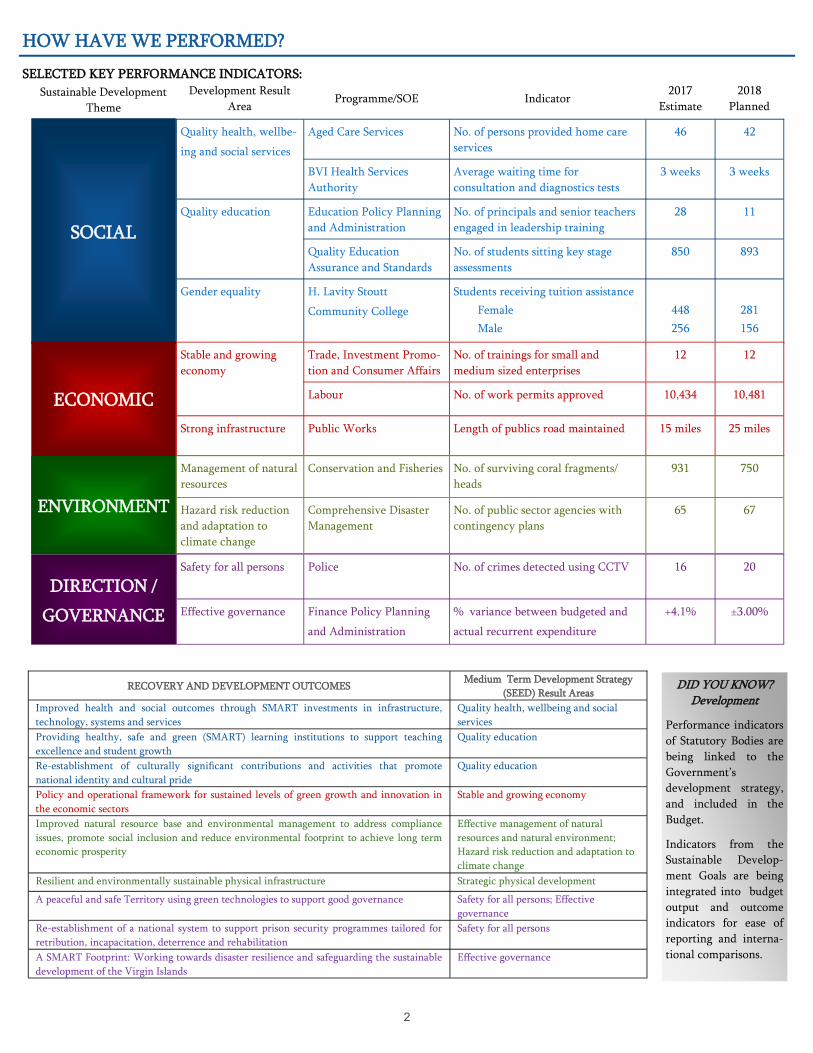
HOW HAVE WE PERFORMED?
SOCIAL
ECONOMIC
ENVIRONMENT
DIRECTION /
GOVERNANCE
Quality health, wellbe-
ing and social services
Aged Care Services No. of persons provided home care
services
46 42
BVI Health Services
Authority
Average waiting time for
consultation and diagnostics tests
3 weeks 3 weeks
Quality education
Education Policy Planning
and Administration
No. of principals and senior teachers
engaged in leadership training
28 11
Quality Education
Assurance and Standards
No. of students sitting key stage
assessments
850 893
Gender equality H. Lavity Stoutt
Community College
Students receiving tuition assistance
Female
Male
448
256
281
156
Trade, Investment Promo-
tion and Consumer Affairs
No. of trainings for small and
medium sized enterprises
12 12 Stable and growing
economy
Labour No. of work permits approved 10,434 10,481
Strong infrastructure Public Works Length of publics road maintained 15 miles 25 miles
Management of natural
resources
Conservation and Fisheries No. of surviving coral fragments/
heads
931 750
Hazard risk reduction
and adaptation to
climate change
Comprehensive Disaster
Management
No. of public sector agencies with
contingency plans
65 67
Safety for all persons Police No. of crimes detected using CCTV 16 20
Effective governance Finance Policy Planning
and Administration
% variance between budgeted and
actual recurrent expenditure
+4.1% ±3.00%
RECOVERY AND DEVELOPMENT OUTCOMES Medium Term Development Strategy
(SEED) Result Areas
Improved health and social outcomes through SMART investments in infrastructure,
technology, systems and services
Quality health, wellbeing and social
services
Providing healthy, safe and green (SMART) learning institutions to support teaching
excellence and student growth
Quality education
Re-establishment of culturally significant contributions and activities that promote
national identity and cultural pride
Quality education
Policy and operational framework for sustained levels of green growth and innovation in
the economic sectors
Stable and growing economy
Improved natural resource base and environmental management to address compliance
issues, promote social inclusion and reduce environmental footprint to achieve long term
economic prosperity
Effective management of natural
resources and natural environment;
Hazard risk reduction and adaptation to
climate change
Resilient and environmentally sustainable physical infrastructure Strategic physical development
A peaceful and safe Territory using green technologies to support good governance Safety for all persons; Effective
governance
Re-establishment of a national system to support prison security programmes tailored for
retribution, incapacitation, deterrence and rehabilitation
Safety for all persons
A SMART Footprint: Working towards disaster resilience and safeguarding the sustainable
development of the Virgin Islands
Effective governance
Development Result
Area Programme/SOE Indicator
2017
Estimate
2018
Planned Sustainable Development
Theme
SELECTED KEY PERFORMANCE INDICATORS:
DID YOU KNOW? Development
Performance indicators
of Statutory Bodies are
being linked to the
Government’s
development strategy,
and included in the
Budget.
Indicators from the
Sustainable Develop-
ment Goals are being
integrated into budget
output and outcome
indicators for ease of
reporting and interna-
tional comparisons.

3
EXAMPLES OF REVENUE:
Taxes on goods and services: Revenue from
Financial Services
Taxes on international trade: Import duties
Other Taxes: Stamp duty
Other Current Revenue: Insurance proceeds
EXAMPLES OF EXPENDITURE:
Employee compensation: Personnel (staff) salaries
Goods and services: Water purchase
Subsidies & transfers: Grant to National Bank for Housing
Programme
Other expenses: Assistance grants
REVENUE
Revenue mn$
2017
Budget
2017
Prelim.
Actual
2018
Budget
Income/Payroll Taxes 51.62 46.12 36.69
Property Tax 2.76 1.91 1.38
Taxes on Goods and Services 194.70 190.68 206.19
Taxes on International Trade 47.71 31.18 27.29
Other Taxes 5.22 7.65 7.38
Other Current Revenue 21.10 15.37 20.60
Total 323.11 292.91 299.53
EXPENDITURE
Expenditure mn$
2017
Budget
2017
Prelim.
Actual
2018
Budget
Employee Compensation 120.11 119.64 123.57
Goods and Services 58.00 73.78 74.84
Interest 5.49 5.14 7.85
Subsidies and Transfers 83.42 80.78 106.25
Property and Other Expense 10.35 13.05 16.33
Capital Expenditure 44.83 13.29 60.49
Total 322.20 305.68 389.33 DID YOU KNOW ? Fiscal
Our fiscal strategy for the
medium term aims to:
1. Increase the recurrent
surplus through revenue
generating and
expenditure efficiency
measures;
2. Preserve the Reserve
Fund balance;
3. Manage our pension
liability; and
4. Demonstrate progress
toward achieving and
maintaining the
borrowing ratios.

4
PERFORMANCE OF TOP SECTORS
PERFORMANCE OF ECONOMY
FUTURE BEYOND RECOVERY
Over the last two years, the Virgin Islands economy has not been immune to economic
challenges, with several shocks observed. In 2016, public relations and regulatory pres-
sures affected our financial services industry, while growth in tourism helped to cush-
ion any negative impacts on the overall recovery. In quite the reversal of roles, the nat-
ural disasters of 2017 wreaked significant havoc which impacted the tourism industry
in particular, with business continuity in the financial services industry assisting in
buoying the economy and Government finances as recovery efforts unfold and take
hold.
The resilience of our economy has been tested. Global politicoeconomic dynamics and
climate change have gone beyond our doorstep and have driven right into the center of
our living rooms, obliterating our front doors in the process and destroying much of
what made us feel safe and secure. We must rebuild, conscious of our new reality. As
we move forward in rebuilding “stronger, smarter, greener and better,” it is clear that
the open and vulnerable nature of our economy demands diversification in a global
context of uncertainty and ever-shifting dynamics. As we shore up and buttress our
two main economic pillars of tourism and financial services, we will also look towards
future diversification and innovation in traversing this new global reality.
CONTACT INFORMATION
Published by: Ministry of Finance
Government of the Virgin Islands
Telephone: (284) 494-3701 (ext. 2144)
Email: [email protected]
Website: www.bvi.vg/ministry/ministry-
of-finance
Premier and Minister of Finance
Dr. the Honourable D. Orlando Smith, OBE _______________________________________
TOURISM FINANCIAL SERVICES
GROSS DOMESTIC PRODUCT EMPLOYMENT
DID YOU KNOW?
Budget Framework
The Medium-Term Fiscal Plan sets the frame-
work for the 2018-2020 Budget, and provides a
narrative for the figures contained in the Medi-
um Term Fiscal Frame. The Frame sets the up-
per limit and broad parameters for the Budget.
From To From To From To
Low $0 $13,198 $0 $13,200 $0 $13,439
Middle $13,198 $27,648 $13,200 $28,514 $13,439 $28,260
High $27,648 $1,363,482 $28,514 $1,149,996 $28,260 $1,149,996
2016Ranges for Earnings Categories
2014 2015
Gini coefficient 2014 2015
Men 0.3509 0.3422
Women 0.3526 0.3490
Total 0.3532 0.3470