Embed Size (px)
Citation preview

June 2004
Research and Training Center on Community LivingInstitute on Community Integration/UCEDD
Residential Services for Personswith Developmental Disabilities:Status and Trends Through 2003

Residential Services for Persons withDevelopmental Disabilities:
Status and Trends Through 2003
Contributions by: Tristan Breedlove, Robert Bruininks, Kathryn Coucouvanis, CharlieLakin, Sheryl Larson, Barbara Polister and Robert W. Prouty
Edited by: Robert W. Prouty, Gary Smith and K. Charlie Lakin
Research and Training Center on Community LivingInstitute on Community Integration/UCEDD
College of Education and Human DevelopmentUniversity of Minnesota
214 Pattee Hall, 150 Pillsbury Drive SEMinneapolis, MN 55455
June 2004
This report is also available at http://rtc.umn.edu/risp03
Preparation of this report was supported by a grant from the Administration on Developmental Disabilities(Grant No. 90DN0064) with supplemental support from the Center on Medicare and Medicaid Services of theU.S. Department of Health and Human Services. The Research and Training Center on Community Livingreceives core support from the National Institute on Disabilities and Rehabilitation Research, U.S. Departmentof Education (Agreement No. H133B031116 Act #1). The contents of this report do not necessarily reflect anofficial position of any sponsoring agency.

Additional copies of this report may be obtained postage-paid for $15.00 per copy from the Publications Office,Institute on Community Integration, 109 Pattee Hall, 150 Pillsbury Drive SE, Minneapolis, MN 55455, (612)624-4512. Minnesota residents please add 6.5% sales tax (does not apply to tax exempt organizations).Minnesota tax exempt organizations must enclose a copy of their tax exemption certificate. Please makechecks payable to the University of Minnesota.
The recommended citation for statistics in this report is: [Chapter authors] (2004). [Chapter title]. In R.W.Prouty, Gary Smith & K.C. Lakin (Eds.), Residential services for persons with developmental disabilities:Status and trends through 2003. Minneapolis: University of Minnesota, Research and Training Center onCommunity Living, Institute on Community Integration.
A Special Acknowledgement
This is the last Residential Services study and report in which Barbara Polister will have been anactive participant. After 21 years as a researcher in the Institute on Community Integration, including the past11 years with the National Residential Information Systems Project (RISP), Barb is retiring.
Barb’s personal and professional contributions to our field have been significant and varied. She wasthe co-founder of the Twin Cities Autism Society. She has served as a board member of service-providing andadvocacy organizations. She has coordinated complex longitudinal studies and, of course, has played acentral role in the data collection, editing and analysis of RISP.
We at the University of Minnesota will miss Barb as a colleague, but look forward to many more yearsof her friendship. We and many other of her colleagues around the country offer her our thanks and bestwishes.

Table of Contents Acknowledgments...............……………...................................................................................................................................... i Executive Summary................................……………................................................................................................................ iii State Residential Services.........................................……………………................................................................................... iii Number and Size of Residential Settings...............................………........................…………................................ iii Number of Residents............................................................................………….......................………….................. iv
Admissions, Discharges, Deaths......................................................……....................................….......... iv Expenditures..................................................................................................………….......................…...... iv Facility Closures..........................................................................................................………….................. iv
All State and Nonstate Residential Services...................................................................................….………......... iv Number and Size of Residential Settings.....................................................................…….........……….. iv
Number of Residents............................................................................................................…………......... v Interstate Variability................................................................................................................…………...... v State and Nonstate Residential Settings by Type...............................................................…..……........ v Patterns of Change in Residential Service Systems: 1977-2003....................................…........……...... vi
Medicaid Funded Services......................................................................................................................…………..... vi Intermediate Care Facilities for Persons with Mental Retardation (ICFs-MR).................…........….... vi Medicaid Home and Community Based Services (HCBS) ..................................................……....….. viii ICF-MR and HCBS Combined............................................................................................…………...…. viii
Nursing Home Residents.......................................................................................................……….....…. ix Introduction and Methodology................................................................................................................................…………... xi
Introduction......................................................................................................................................……………........ xiii Methodology...........................................................................................................................................…………..... xiv
State Survey Data Collection...............................................................................................…………....... xiv Individual State Residential Facility Survey...........................................................................……....….. xv Historical Statistics on State Residential Facilities..................................................................……….... xv
Section 1: Status and Change in State Residential Services...........................................................……..... 1 Chapter 1.................................................................................................................................................................……………... 3
Current Populations and Longitudinal Trends of State Residential Settings (1950-2003).....................……...... 3 Number of State Residential Settings........................................................................................………....... 3 Residents with ID/DD of State Settings.....................................................................................………..... 3 Change in Average Daily Population: 1980 - 2003......................................................................………... 6 Average Daily Residents with ID/DD in Large State ID/DD and Psychiatric Facilities...............................................................................................................………….. 6 Residents with ID/DD of Large State ID/DD and Psychiatric Facilities per 100,000 of the General Population........................................................................................…………... 8 U.S. Trends in Average Residents with ID/DD in Large State Facilities per 100,0000 of the General Population.....................................................................................………….... 9 Slowing Rates of Large State Facility Depopulation..................…............................................……...... 9 Movement of Residents in Large State ID/DD Facilities in FY 2003…......................................……. 11 Longitudinal Movement Patterns in Large State ID/DD Residential Facilities…........................….. 13 Annual Per Resident Expenditures...........................................................................................……….... 15
Chapter 2.............................................................................................................................................................……………... 19 Large State ID/DD Residential Facilities, 1960-2003, Individual Facility Populations, Per Diem Costs, and Closures in 2003 and Projected in 2004..........................................................………..... 19
Large State ID/DD Residential Facilities Operating and Closing, 1960-2004.....................…….....… 19 Total Large State ID/DD Facility Closures.............................................................................……….…. 19 Individual Large State ID/DD Facility Populations and Per Diem Rates.................................…….... 20 Changes in Populations of Large State ID/DD Facilities.....…….......................................................... 20

Section 2: Status and Changes in Total State Residential Services Systems.................................. 31 Chapter 3...........................................................................................................................……………...................................... 33
Services Provided by State and Nonstate Agencies in 2003........................................……...........................….. 33 Number of Residential Settings................................................................................………...................... 33 Number of Persons Receiving Residential Services.........................................................…….......….... 33 Relative Size of Residential Settings.........................................................................................………..... 36 Number of Residential Service Recipients per 100,000 of General Population....................……….... 37 Persons Presently Not Receiving Residential Services on Waiting Lists for Residential Services........................................................................................…..………....... 39
Chapter 4...........................................................................................................................................................……………...... 41 Number of Residential Settings and Residents by Type of Living Arrangement..............................….....….... 41
Congregate Care Settings and Residents.............................................................................….……........ 41 Host Family/Foster Care Settings and Residents..................................................................…...……... 41 Own Home Settings and Residents......................................................................................…………..... 44 Family Home Settings and Residents.....................................................................................………....... 44
Chapter 5.....................................................................................................................................................……………............ 47 Changing Patterns in Residential Service Systems, 1977-2003..............................................................……….... 47
Changing Patterns in Residential Settings..........................................................................……........…. 47 Changes in Number of Residential Service Recipients............................................................……….... 48 Residential Settings, by Size, of Persons with ID/DD in 1982 and 2003...............................……….... 50
Section 3: Status and Changes in Medicaid Funded Residential and Related Services............ 51 Chapter 6............................................................................................................................................................……………..... 53
Background and Summary of Medicaid Long-Term Care Programs...................................................…..…….... 53 Establishment of ICF-MR Program.............................................................….............................………... 53 Community ICF-MR Group Homes...........................................................…........................………......... 54 Home and Community Based Services (HCBS)...........................................…............................…….... 54 Medicaid Nursing Facilities..............................................................................…………........................... 55
Chapter 7 .........................................................................................................................................................……………....... 57 Utilization of and Expenditures for Medicaid Institutional and Home and Community Based Services...........................................................................................................……………..... 57
ICF-MR Program Utilization on June 30, 2003.................................................................…..………....... 57 Nonstate ICFs-MR..........................................................................................................…………............. 59 State ICF-MR Utilization......................................................................................................…………....... 59 Large and Community ICFs-MR......................................................................................….....………..... 62 Expenditures for ICF-MR Services....................................................................................….………....... 65 Interstate Variations in ICF-MR Expenditures....................................................................………........ 67 Medicaid HCBS Recipients..............................................................................................……….......…... 67 Expenditures for HCBS Recipients.......................................................................................….……….... 70 HCBS Recipients and Residents of Community ICFs-MR......................................................……….. 70 ICF-MR and HCBS Recipients and Expenditures...................................................................….……... 75 Variations in State Financial Benefit for Combined ICF-MR and HCBS Programs...............….….... 75 Indexed Utilization Rates....................................................................................................…………......... 79 Residential Arrangements for HCBS Recipients........................................................................………. 82 Persons with ID/DD in Medicaid Nursing Facilities........................................................…….........…. 82 ICF-MR and HCBS for Persons with ID/DD as a Proportion of All Federal Medicaid Expenditures..........................................................................................................…………. 85 Medicaid ID/DD Expenditures Within the Larger State Medicaid Program.............................…….. 86 HCBS and ICF-MR Expenditures, by State, Between 1994 and 2003........................................…….. 86
Section 4: State Profiles of Selected Service Indicators, 1977-2003..............................................….... 91 Chapter 8............................................................................................................................................................…………….... 93
Profiles and Trends in Residential Services by State.......................................................................…….........…. 93 Alabama.....................................................................................................................................…………... 94

Alaska..............................................................................................................................…............ 95 Arizona..............................................................................................................................….......... 96 Arkansas...........................................................................................................................….......... 97 California..............................................................................................................................…....... 98 Colorado.......................................................................................................................................... 99 Connecticut................................................................................................................................... 100 Delaware................................................................................................................................….... 101 District of Columbia..................................................................................................................... 102 Florida........................................................................................................................................… 103 Georgia...................................................................................................................................….... 104 Hawaii.................................................................................................................................…........ 105 Idaho......................................................................................................................................….... 106 Illinois...................................................................................................................................…...... 107 Indiana.....................................................................................................................................….. 108 Iowa........................................................................................................................................….... 109 Kansas.....................................................................................................................................….. 110 Kentucky...............................................................................................................................….... 111 Louisiana.................................................................................................................................….. 112 Maine.....................................................................................................................................….... 113 Maryland.............................................................................................................................…...... 114 Massachusetts............................................................................................................................. 115 Michigan..........................................................................................................................….......... 116 Minnesota.........................................................................................................................…......... 117 Mississippi.........................................................................................................................…........ 118 Missouri...............................................................................................................................…...... 119 Montana................................................................................................................................…..... 120 Nebraska.................................................................................................................................…... 121 Nevada......................................................................................................................................…. 122 New Hampshire.....................................................................................................….................... 123 New Jersey..........................................................................................................…...................... 124 New Mexico..........................................................................................................…..................... 125 New York................................................................................................................…................... 126 North Carolina.........................................................................................................….................. 127 North Dakota.............................................................................................................…................ 128 Ohio..............................................................................................................................….............. 129 Oklahoma...............................................................................….................................................... 130 Oregon......................................................................................…................................................. 131 Pennsylvania................................................................................................................................ 132 Rhode Island................................................................................................................................. 133
South Carolina...........................................................................................…………................................... 134 South Dakota............................................................................................…................................ 135 Tennessee..................................................................................................................................... 136 Texas..............................................................................................................…............................ 137 Utah..................................................................................................................….......................... 138 Vermont..............................................................................................................…........................ 139 Virginia..................................................................................................................…..................... 140 Washington................................................................................................................................... 141
West Virginia.......................................................…….................................................................. 142 Wisconsin......................................…............................................................................................ 143 Wyoming.........................................….......................................................................................... 144 United States....................................…......................................................................................... 145
References and Data Sources .......................................…....................................................................................... 147 LIST OF TABLES Table 1.1 Number of State Residential Settings on June 30, 2003 by State...........…..............................…..................... 4 Table 1.2 Persons with ID/DD Living in State Residential Settings on June 30, 2003 by State..........…....................... 5 Table 1.3 Average Daily Population of Persons with ID/DD Living in Large State ID/DD

Facilities and Percentage Changes, Between 1980-2003, by State........................….........................….................... 7 Table 1.4 Average Daily Population of Persons with ID/DD in Large State ID/DD and Psychiatric Facilities, 1950-2003...................................................................................………........................................ 8 Table 1.5 Persons with ID/DD Living in State Residential Settings Per 100,000 of the General Population on June 30, 2003 by State.....................................................................……................................. 10 Table 1.6 Average Daily Population of Persons with ID/DD in Large State ID/DD and Psychiatric Facilities per 100,000 of the General Population, 1950-2003.................................…….......................... 11 Table 1.7 Movement of Persons with ID/DD In and Out of Large State ID/DD Facilities in Fiscal Year 2003 by State................................................................................................…..……............... 12 Table 1.8 Movement Patterns in Large State ID/DD Residential Facilities, 1950-2003…..................…...................... 14 Table 1.9 Average per Resident Daily Expenditures in State ID/DD Settings in Fiscal Year 2003 by State.........................................................................................................................………............. 16 Table 1.10 Average Annual per Resident Expenditures in Large State ID/DD Residential Facilities, 1950-2003.......................................................................................………................................... 17 Table 1.11 Number of Large State ID/DD Residential Facilities Operating, Closed, and Projected to Close (1960-2004)....................................................................................................………........................ 20 Table 1.12 Large State ID/DD Facilities, 1960-2003, Including Facility Populations, Per Diem Expenditures, Closures and Resident Movement by Facility ...................................…...................…...................... 21 Table 1.13 Residents of Large Public Residential Facilities by State on June 30, 2002 and June 30, 2003....................................................................…………........................................................................... 30 Table 2.1 Residential Settings for Persons with ID/DD Served by State and Nonstate Agencies on June 30, 2003..................................................................………................................................................. 34 Table 2.2 Persons with ID/DD Served by State and Nonstate Agencies on June 30, 2003….................................... 35 Table 2.3 Summary Statistics on the Size of Residential Settings for Persons with ID/DD on June 30, 2003...........................................................................................................................……….......................... 36 Table 2.4 Persons with ID/DD Receiving Residential Services per 100,000 of State General Population by Size of Residential Setting, June 30, 2003....................................................................……................. 37 Table 2.5 Persons with ID/DD on a Waiting List for, But Not Receiving, Residential Services on June 30, 2003...............................................................................................................................………...... 39 Table 2.6 Congregate Care Settings (including ICFs-MR) and Residents by State on June 30, 2003.........................................................................................................…………........................................ 42 Table 2.7 Host Family/Foster Care Settings and Residents by State on June 30, 2003...…......................................... 43 Table 2.8 Homes Owned or Leased by Persons with ID/DD and the Number of People Living in Them by State on June 30, 2003........................................................................................……….............................. 44 Table 2.9 Number of People with ID/DD Receiving Services While Living in the Home of a Family Member on June 30, 2003....................................................................................................……….................... 45 Table 2.10 State and Nonstate Residential Settings for Persons with ID/DD on June 30 of 1977, 1982, 1987, 1997, 2002 and 2003.......................................................................................................…………...... 47 Table 2.11 Persons with ID/DD in State and Nonstate Residential Settings on June 30 of 1977, 1982, 1987, 1992, 1997, 2002 and 2003.............................................................................…………...................... 49 Table 3.1 ICF-MR Certified Settings by State and Size on June 30, 2003.........................….................….................... 58 Table 3.2 Persons with ID/DD Living in ICF-MR Certified Settings by State and Size on June 30, 2003....................................................................................................................................…………............. 60 Table 3.3 Number and Percentage of Residents in ICF-MR Settings by State and Size on June 30, 2003...............................................................................................................................………….................. 63 Table 3.4 Summary Statistics on ICF-MR Expenditures for Persons with ID/DD by State for Fiscal Year 2003.............................................................................................................................………......... 66 Table 3.5a Summary Statistics on HCBS Recipients by State on June 30 of Years 1982 through 1992...........................................................................................................................…………............................ 68 Table 3.5b Summary Statistics on HCBS Recipients by State on June 30 of Years 1993 through 2003.................................................................................................................................…………....................... 69 Table 3.6a HCBS Expenditures in Thousands of Dollars by State for Years 1987 through 1995..….…...................... 71 Table 3.6b HCBS Expenditures in Thousands of Dollars by State for Years 1996 through 2003...….…..................... 72 Table 3.7 Summary Statistics on HCBS Expenditures by State for Fiscal Year 2003.......................…....…................... 73 Table 3.8 HCBS Recipients and Community ICF-MR Residents by State on June 30, 2003.............…......….............. 74 Table 3.9 ICF-MR Residents and HCBS Recipients and ICF-MR and HCBS Expenditures by State on June 30, 2003.......................................................................................................................…………............ 77 Table 3.10 Summary of Combined ICF-MR and HCBS Contributions and State Benefit Ratios by State for Fiscal Year 2003......................................................................................................................…………........ 78

Table 3.11 Utilization Rates per 100,000 of State Population for ICF-MR, HCBS and All Residential Service Recipients by State on June 30, 2003..................................………................................................ 80 Table 3.12 HCBS Recipients with ID/DD by Reported Type of Residential Setting on June 30, 2003..................................................................................................................………….................................. 83 Table 3.13 Persons with ID/DD in Nursing Facilities by State on June 30, 2003..................................……................... 84 Table 3.14 Federal Medicaid Expenditures for ICF-MR and HCBS Programs for Persons with ID/DD as a Proportion of All Federal Medicaid Expenditures...........................................................……........... 86 Table 3.15 Medicaid HCBS and ICF-MR Expenditures Within Total Medicaid Program in Fiscal Year 2003....................................................................................................................................……………........ 87 Table 3.16a Annual Expenditures in Thousands of Dollars for HCBS and ICF-MR, by State in the Years 1994 - 2003......................................................................................…………................................. 88 Table 3.16b Annual Expenditures in Thousands of Dollars for HCBS and ICF-MR, by State in the Years 1994 - 2003.......................................................................................................…………................ 89 LIST OF FIGURES Figure 1.1 U.S. Trends in Average Daily Population with ID/DD in Large State ID/DD and Psychiatric Facilities, 1950 - 2003....................................................................................................................…………...... 9 Figure 1.2 U.S. Trends in Average Daily Residents with ID/DD in Large State ID/DD and Psychiatric Facilities per 100,000 of the General Population, 1950 - 2003.....................................………........…......... 11 Figure 1.3 Decreases in State Institution Average Daily Populations in Three-Year Periods, 1968-2003..........…....... 13 Figure 1.4 Movement Patterns in Large State ID/DD Facilities, 1950 - 2003..................................................……....….... 15 Figure 1.5 Average Annual Per Resident Expenditures in Large State ID/DD Residential Facilities, 1950-2003.........................................................................................................................…………….................. 17 Figure 1.6 Average Annual Closures of Large State ID/DD Facilities, 1960 - 2003......................................…….......…. 19 Figure 2.1 Average Number of Persons with ID/DD per Residential Setting on June 30 1977, 1982, 1987, 1992, 1997 and 2003.................................................................................................……………............ 36 Figure 2.2 Percentage of All Residential Service Recipients in Settings with Six or Fewer Residents on June 30, 2003...........................................................................................................................…………....... 38 Figure 2.3 Residential Service Recipients per 100,000 of State General Population on June 30, 2003..…...........…...... 38 Figure 2.4 Persons with ID/DD in State and Nonstate Residential Settings on June 30 of 1977, 1982, 1987, 1992, 1997, 2002 and 2003........................................................................……………........................... 49 Figure 2.5 Persons with ID/DD in Residential Settings of Different Sizes and Types on June 30, 1982 and June 30, 2003............................................................................................................................…………….......... 50 Figure 3.1 ICF-MR Residents as a Proportion of all Residents of State and Nonstate Settings by Size on June 30, 2003...............................................................................................................................…………........ 61 Figure 3.2 Residents of ICFs-MR by Size and State/Nonstate Operation on June 30 1977, 1982, 1987, 1992, 1997 and 2003......................................................................................……………....................... 62 Figure 3.3 Percentage of All Residential Service Recipients in ICFs-MR on June 30, 2003...................…...….............. 64 Figure 3.4 Number of Residents in ICF-MR and Non ICF-MR Residential Settings with 1-15 and 16 or More Total Residents on June 30, 1977, 1982, 1987, 1992, 1997, 2002 and 2003............………......... 65 Figure 3.5 Community ICF-MR & HCBS Recipients as a Percentage of All ICF-MR & HCBS Recipients by State on June 30, 2003.........................................................................................................…………......... 76 Figure 3.6 Service Recipients in Community Settings and Institutions (16 or More Residents) among Medicaid ICF-MR and HCBS Recipients on June 30, 1977, 1982, 1987, 1992 and 2003...........….....……..... 76 Figure 3.7 Total ICF-MR Residents and HCBS Recipients per 100,000 of State Population by State on June 30, 2003..............................................................................................................................……………......... 81 Figure 3.8 Total Community ICF-MR and HCBS Recipients per 100,000 of State Population by State on June 30, 2003..................................................................................……….................... 81 Figure 3.9 ICF-MR and Non ICF-MR Residential Service Recipients per 100,000 of the U.S. Population, 1962 to 2003........................................................................................................................…………...... 82

i
This report is based on statistics gathered and analyzedas part of the National Residential Information SystemsProject on Residential Services (RISP). The authorswish to thank the Administration on DevelopmentalDisabilities (ADD), its Commissioner Pat Morrissey,and our Project Officer, Gretchen Menn, for ongoingsupport of this project and its various activities. Wealso appreciate the supplemental support received fromthe Center on Medicare and Medicaid Services. Thisand other projects of the Research and Training Centeron Community Living are greatly assisted by the coresupport of the National Institute on Disability andRehabilitation Research, and our Project Officer, DawnCarlson.
AcknowledgmentsMany people other than the chapter authors played
important roles in acquiring, analyzing, and describ-ing the data summarized in this report. Brian Burwellof the MEDSTAT Group generously provided ICF-MRpayments from CMS 64 forms that are summarized inChapter 7.
As always, we are totally indebted to the more than300 state and individual facility respondents who pro-vided the statistics used in this report. Clearly thisreport would not be possible without their knowledge,expertise and generous assistance. Some of thesetalented individuals are listed below. A special thanksalso to the CEOs and staff of all the 184 large publicresidential facilities surveyed.
Key State Contacts
AlabamaJoey KreauterAlaskaBarbara KnappArizonaKim SimmonsAimee BayseArkansasDennis BongeRegina DavenportSharon JordanJudy RoutonCaliforniaJames KnightMajorie Mar LuiLyman LumPhyllis MarquezMark StaytonColoradoLynne StruxnessConnecticutBarbara PankoskyDistrict of ColumbiaAlice AndersonDelawareScott PhillipsFloridaJulie GriffithGeorgiaAnne TriaHawaiiDavid KannoMichael Tamanaha
IowaLin NibbelinkIdahoPamela FalenDiane HeltonIllinoisMarie HavensIndianaScott LawsonKansasBecky RossKentuckyRaymond AndersonPeggy FosterLouisianaTimothy BoyleJosie CriscoeClaudette HillLinda McGeeChristine ReevesMaineDavid GodduMarylandFreda CrumpMassachusettsRon SanfieldMichiganMargie BriggsTom RenwickMinnesotaRoger DeneenMaheshwar GorregattuMississippiLisa Romine
MissouriGary SchanzmeyerMontanaJanice FrischNebraskaKim CollinsKate MathiasNew HampshireJude SchultzNew JerseyBill HollowayNew MexicoGinny JohnsonNevadaPeter SteinmanNew YorkPaul AudinoKeith CaldwellAnne DonnellyJohn FlynnAlan MetaviaNorth CarolinaRodney RealonNorth DakotaRobbin HendricksonCheryl SchrankOhioMatthew CurrenDebbie HoffineLeah HoldenOklahomaJane CardOregonGary Goldsmith
PennsylvaniaMichael TothRhode IslandBrenda ChamberlainJoe GouldBrendan MahoneySouth CarolinaJanet PriestSouth DakotaEdward CampbellTennesseeTerry PoffTexasChris AdamsF. Ross McDonaldUtahJennifer LeaverCindy RuckmanVermontJune BascomVirginiaSherri StiererWashingtonHector GarciaWest VirginiaCindy BeaneWisconsinKristi PomereningTom SwantWyomingElizabeth PfistererRosie Stringer

ii

iii
Executive SummaryState Residential ServicesNumber and Size of ResidentialSettingsThe number of state residential settings increasedin Fiscal Year 2003. On June 30, 2003 states weredirectly operating 2,744 residential settings housingpersons with intellectual disabilities and relateddevelopmental disabilities (ID/DD), 391 more than inthe previous year. Of these 2,712 were facilities,special units or other settings primarily servingpersons with ID/DD and 32 were facilities primarilyserving persons with psychiatric disabilities. Nine-tenths (91.4%) of the state ID/DD settings had 15 orfewer residents, a proportion that increased slightlyfrom June 2002 (90.0%).
On June 30, 2003 every state except Alaska,District of Columbia, Hawaii, Maine, New Hamp-shire, New Mexico, Rhode Island, Vermont, andWest Virginia was operating at least one largestate ID/DD facility. New Hampshire closed its onlylarge (16 or more residents) state ID/DD facility inJanuary 1991. In Fiscal Year 1994 Vermont, RhodeIsland and the District of Columbia closed the last oftheir large state ID/DD facilities. New Mexico followedin Fiscal Year 1995 and Alaska did the same in 1997.In 1999, Maine’s last large facility dropped below 16residents and West Virginia and Hawaii closed thelast of their large state ID/DD facilities.
The number of state community residentialsettings continues to grow and New York remainsby far the largest operator of state communityresidences. State community settings (15 or fewerresidents) increased by 18.7% (391 settings) to a to-tal of 2,478 in Fiscal Year 2003. At the end of FiscalYear 2003, New York had 1,000 state community set-tings or 40.4% of the national total.
Number of ResidentsThe population of large state ID/DD facilitiescontinues to fall. The population of large state ID/DD facilities on June 30, 2003 was 42,835, a decreaseof 2.9% from June 30, 2002, continuing a trend firstevident in Fiscal Year 1968. Between Fiscal Years1980 and 2003 large state ID/DD facilities’ average
daily populations decreased by 87,799 (67.0%) to43,289 individuals. More than eighty percent (41) ofall states reduced the average daily populations oftheir large state ID/DD facilities by 50% or more duringthe period.
The population of state community residen-tial settings increased in Fiscal Year 2003. DuringFiscal Year 2003 the number of persons residing instate community settings (15 or fewer residents) in-creased 3.0%, to an end of year total of 12,939 per-sons. The average number of residents per statecommunity setting decreased to 5.2 from the 2002level of 6.0 residents. New York accounted for nearlythree-fifths (57.9%) of all residents of state commu-nity settings.
Nationally, the population of large state ID/DDfacilities per 100,000 of the general populationcontinues to fall. On June 30, 2003 there were 15.2persons in large state ID/DD facilities per 100,000 ofthe general U.S. population. This compares with 15.3persons in 2002, 16.1 persons in 2001; 16.8 in 2000;18.0 in 1999; 19.0 in 1998; 20.0 in 1997; 21.9 in 1996;23.5 in June 1995; and 99.7 in June 1967. Place-ment rates in 8 states were 150% or more of the na-tional average, while in 18 states they were half orless of the national average (including 0 in 9 states).
Most states made very substantial reductionsin their large state ID/DD facility average dailypopulations between 1990 and 2003. The averagedaily number of persons with ID/DD living in large stateID/DD facilities decreased by 48.7% between FiscalYear 1990 and Fiscal Year 2003. The largest propor-tional decreases in large state ID/DD facility averagedaily populations were, of course, in Alaska, the Dis-trict of Columbia, Hawaii, Maine, New Hampshire,New Mexico, Rhode Island, Vermont, and West Vir-ginia which closed all their large state ID/DD facili-ties. In addition, 23 other states reduced their largestate ID/DD facility populations by more than 50% overthe thirteen-year period.
Rates of large state facility depopulation haveslowed in the last three years. The average dailypopulation of large state facilities decreased by 9.6%

iv
from the beginning to the end of the Fiscal Year 2001-2003 period. This was the slowest decrease of anythree year period in more than 30 years.
Admissions, Discharges, and Deaths
Admissions to large state ID/DD facilitiesdecreased very slightly in 2003. In Fiscal Year 2003an estimated total of 2,117 persons with ID/DD wereadmitted to large state ID/DD facilities, a decrease of1.5% from the previous year. Admissions were equalto 4.9% of the average daily population of thesefacilities during the year. Three states reported noadmissions to their large state ID/DD facilities. Eightstates reported admissions exceeding 10% of theiraverage daily population.
Discharge rates of large state ID/DD facilitiesdecreased in 2003. In 2003 an estimated total of2,679 persons with ID/DD were discharged from largestate ID/DD facilities, a decrease of 3.8% from 2,785in 2002. Discharges were equal to 6.2% of the year’saverage daily population of those facilities (as com-pared with 6.3% in 2002). In 2003, 5 states reporteddischarges that equaled 20% or more of the averagedaily population of their large state ID/DD facilities.Fourteen states with large state ID/DD facilities haddischarges less than 5% of their average daily popu-lation.
The death rate among residents of large stateID/DD facilities in 2003 (2.0%) was within the rangeevident throughout the past decade. In 2003 atotal of 873 persons with ID/DD died while residing inlarge state ID/DD facilities. The 2.0% death rate of2003 is above the 1.8% death rate of 2002, but thesame as the 2.0% rates in 2001. Death rates were1.9% in 1999 and 2000, 1.7% in 1998, 1.4% in 1997,1.7% in 1996, 1.7% in 1995, 1.5% in 1994, 1.6% in1993, 1.4% in 1992, 1.3% in 1991, and 1.4% in 1990.The small but steady increases in institutional deathrates in recent years may be attributed to the aging oflarge state ID/DD facility populations.
Expenditures
In 2003 expenditures for care in large state ID/DDfacilities continued to increase and reached anational annual average of $131,123 per person.Between 2002 and 2003 the average annualexpenditures per resident in large state ID/DD facilitiesincreased 4.3% from $125,746 to $131,122 (or anaverage of $359 per day). The increase controlled
for inflation was 2.0%. Twenty-three states reportedannual expenditures per resident exceeding thenational average. The increase between 2002 and2003 (4.3%) was more than the 3.6% increase from2001 to 2002. The average annual increase for theperiod 1990-2003 (6.4%) remained well below the15.0% average annual increase between 1970 and1989.
Facility ClosuresThe closure of large state ID/DD facilitiescontinues. Three large ID/DD facilities were closedin Calender Year 2003; two in Alabama and one inMontana. Between 1996 and 2003, 48 large stateID/DD facilities were closed, an average of 6.0closures per year. This compares with an average of1.25 per year between 1976 and 1979, 3.5 per yearbetween 1980 and 1983, 2.75 per year between 1984and 1987, 8.75 per year between 1988 and 1991, and12.5 per year between 1992 and 1995. Alabama,Massachusetts and Missouri project that each willclose another large state ID/DD facility in 2004.
All State and Non-StateResidential ServicesNumber and Size of ResidentialSettings
The number of residential settings for personswith ID/DD is growing very rapidly. On June 30,2003 there were an estimated 145,581 residentialsettings in which persons with ID/DD receivedresidential services from state operated or statelicensed residential service providers (excludingpsychiatric facilities, nursing homes and peoplereceiving services while living with family members).Since 1977 the number of settings in which peoplereceive residential services has grown more thanthirteen-fold. In comparison, on June 30, 1977 therewere 11,008 state licensed or state operatedresidential service settings; on June 30, 1987 therewere 33,477; on June 30, 1992 there were 49,479;on June 30, 1995 there were 84,532; and on June30, 1998 there were 104,765. Of all residential servicesettings on June 30, 2003, 2,712 were operated bystates, with the remaining 142,869 residential settingsserved by nonstate agencies.
Most residences licensed or operated by statesfor persons with ID/DD were small and almost allpeople living in small residences were served bynonstate agencies. Of the 145,581 total residential

v
settings on June 30, 2003, an estimated 144,498(99.3%) had 15 or fewer residents and 137,407(94.4%) had 6 or fewer residents. The estimated142,020 nonstate settings with 15 or fewer residentsmade up 98.3% of all settings with 15 or fewer resi-dents. The 135,700 nonstate settings with 6 or fewerresidents made up virtually all (98.8%) of the settingswith 6 or fewer residents.
Most large residences were also operated bynonstate agencies. Nonstate agencies operated 849(78.4%) of the total 1,083 facilities with 16 or moreresidents. This compares to 80.8% in 1977, 82.7%in 1987 and 85.6% in 1999.
Number of ResidentsBetween 1977 and 2003, there was a steadyincrease in the total number of persons with ID/DD receiving residential services. Between 1977and 2003 the total number of residential servicerecipients grew 62.4%, from 247,780 to a reported402,281. Total population increases (both nonstateand state settings) were limited to places with 15 orfewer residents, the populations of which increasedby an estimated 289,372 between 1977 and 2003.Total populations of facilities with 16 or more residentsdecreased by 134,882 persons between 1977 and2003. Between 2002 and 2003 residents of settingswith 15 or fewer residents increased by an estimated11,809 persons, while residents of facilities with 16 ormore residents decreased by 2,268.
The national average rate of placement in resi-dential settings for persons with ID/DD in 2003was 142.9 persons per 100,000 of the generalpopulation. Twenty-nine states reported residentialplacement rates at or above the national average, withthe highest rate (301.0 per 100,000 state residents)in North Dakota. The lowest placement rate (60.3per 100,000) was reported by Georgia. Eight statesreported placement rates 150% or more of the na-tional average and four states reported placementrates 50% or less of the national average. The na-tional average placement rate of 142.9 in 2003 washigher than the 2002 rate of 136.2 and the 1977 rateof 118.8.
In 2003 about 82.0% of the persons with ID/DDreceiving residential services lived in places with15 or fewer residents, 68.5% lived in places with6 or fewer residents, and 44.1% lived in placeswith 3 or fewer residents. On June 30, 2003, resi-
dences of 15 or fewer persons housed an estimated329,807 people (82.0% of all residents). Settings with6 or fewer residents housed 275,461 residents (68.5%of all residents) and settings with 3 or fewer residents177,260 (44.1% of all residents). Of the 329,807 per-sons living in places with 15 or fewer residents,316,868 (96.1%) lived in settings operated by nonstateagencies. The 269,907 persons living in nonstate set-tings with 6 or fewer residents made up almost all(98.0%) of the 275,461 people living in places with 6or fewer residents.
A substantial majority of persons with ID/DDwho received residential services from nonstateagencies lived in smaller settings, while a sub-stantial majority of persons who lived in state resi-dences lived in large facilities. On June 30, 2003nine-tenths (91.4%) of the 346,507 persons receiv-ing residential services from nonstate agencies livedin settings of 15 or fewer residents, and more thanthree-fourths (77.9%) lived in settings with 6 or fewerresidents. More than three-fourths (76.8%) of the55,774 persons living in state operated settings werein facilities with 16 or more residents. Of the 72,474residents of residential settings with 16 or more resi-dents, 42,835 (59.1%) lived in state facilities. In 1977,74.6% of the 207,356 residents of facilities with 16 ormore residents lived in state facilities.
Interstate Variability
Only one state reported a majority of persons withID/DD receiving residential services lived infacilities of 16 or more residents. On June 30, 2003almost three-fifths (58.1%) of the residents of allsettings in Mississippi lived in facilities with 16 or moreresidents. Nationally, 18.0% of all residential servicerecipients lived in settings of 16 or more residents.
In 47 states a majority of persons with ID/DDreceived residential services in settings with 6 orfewer residents. On June 30, 2003 more than halfof the residents of settings for persons with ID/DD inall but 4 states lived in settings with 6 or fewer resi-dents. In most states one-half or more of the resi-dents lived in settings of 3 or fewer.
State and Nonstate ResidentialSettings by TypeMost people receiving residential services receiveit in places that provide “congregate caresettings.” Congregate care is provided in settings

vi
owned, rented or managed by the residential servicesprovider, or the provider’s agents in which paid staffcome to the settings to provide care, supervision,instruction and other support and include, but are notlimited to ICFs-MR. An estimated 260,490 personswith ID/DD lived in congregate care settings on June30, 2003 (64.8% of all residential service recipients).A majority of these persons (189,894 or 72.9%) livedin settings with 15 or fewer residents and over one-half of those 135,569 (52.0%) lived in settings with 6or fewer residents.
The number of people living in host family/fos-ter care is slowly increasing. An estimated nationaltotal of 45,759 persons with ID/DD lived in host fam-ily/foster care settings on June 30, 2003. This repre-sents a 8.2% increase from one year earlier. Virtuallyall (99.95%) host family/foster care residents lived inhomes with 6 or fewer residents. Between June 30,1982 and June 30, 2003 the estimated number ofpeople in host family settings increased from approxi-mately 17,150 to 45,759 (166.8%).
About 22.5% of persons receiving ID/DD resi-dential services live in their “own homes” that theyown or lease. An estimated national total of 90,597persons with ID/DD receiving residential services andsupports lived in homes that they owned or leased forthemselves. The number of persons living in homesof their own increased 4.5% between June 30, 2002and June 30, 2003. Between 1993 and 2003 the es-timated number of people living in homes of their ownnationally increased by 167.3% as the movement to-ward consumer controlled housing and supported liv-ing continued.
The number of people with ID/DD receiving resi-dential services living in settings of 3 or fewerpersons continues to increase. An estimated177,260 (44.1%) were living in homes of 3 or fewerresidents in 2003, more than 11 times as many as the15,705 people in settings of 3 or fewer in 1982. Among46 states for which these data were available, per-sons with ID/DD living in settings of 3 or fewer per-sons ranged from 12.8% to 94.4% of all persons withID/DD receiving residential services.
Patterns of Change in ResidentialService Systems: 1977-2003The number of residential settings in which peoplereceived services increased much faster than thetotal number of service recipients. Between 1977
and 2003, the total number of residential settings inwhich people with ID/DD received residential servicesgrew from 11,008 to an estimated 145,581 (1,222.5%),while total service recipients increased by 62.4%, fromabout 247,780 to an estimated 402,281 individuals.
The nation moved from large facility-centeredto community residential services. In 1977, anestimated 83.7% of the persons with ID/DD receivingresidential services lived in residences of 16 or morepeople. By 2003, an estimated 82.0% lived in com-munity settings of 15 or fewer people, and 68.5% livedin residential settings with 6 or fewer people.
The role of the state as a residential serviceprovider dramatically declined. In 1977, 62.9% ofall residential service recipients lived in state residen-tial settings. By 2003, 13.9% of all residential servicerecipients lived in state residential settings.
States reported a large number of service re-cipients living in their family homes. In 2003, anestimated 500,004 persons received services in theirfamily homes. This equals 55.4% of all persons re-ceiving ID/DD residential services in or out of theirfamily homes. States reported that recipients of ID/DD family-based services in states ranged from 5.1%to 84.0% of all service recipients.
On June 30, 2003, there were an estimated75,288 persons waiting for residential services.Based on reports of 36 states it was estimated that75,288 persons not presently receiving ID/DD ser-vices outside their family homes are waiting for suchservices. It would require an estimated 18.7% growthin available residential service capacity to provide resi-dential services to all of the persons currently wait-ing. The range of growth required to meet presentneeds in reporting states ranged from 0.0% to 164.6%.
Medicaid Funded ServicesIntermediate Care Facilities forPersons with Mental Retardation(ICFs-MR)The total number of ICFs-MR from 2002 to 2003increased by 22 facilities. On June 30, 2003 therewere 6,645 ICFs-MR nationwide, as compared to6,623 in 2002. Average ICF-MR size in 2003 was16.1 residents; this compares with 186 residents in1977; 74.5 residents in 1982; 37 residents in 1987;22.5 residents in 1992; 17.5 residents in 1997 and

vii
16.7 residents in 2002.
In 2003, the population of ICFs-MR continuedto decrease. From 1982 to 1994 the ICF-MR pro-gram was notable for its stability in the number of per-sons served. On June 30, 1994 there were 142,118persons living in all ICFs-MR. This compares with140,684 on June 30, 1982. By June 1999 the totalICF-MR population had decreased to 117,917. TheJune 2003 population of ICFs-MR was 107,065, adecrease of 3,507 (3.2%) from the previous year.
Populations of large ICFs-MR have continuedto decrease steadily. On June 30, 2003 there were66,286 persons in ICFs-MR of 16 or more residents(61.9% of all ICF-MR residents). This represented a43.2% decrease from the 117,147 persons in largeICFs-MR in 1988 and a 49.3% decrease from 130,767large ICF-MR residents in 1982. The 2003 popula-tion of large ICFs-MR included 42,226 residents ofstate ICFs-MR and 24,060 residents in nonstate ICFs-MR. Between June 30, 1988 and June 30, 2003, largestate ICF-MR populations decreased 50.3% (from85,064), while large nonstate ICF-MR populations de-creased by 25.0% (from 32,083).
Almost all residents of large state and nonstateresidential facilities live in ICFs-MR. In 2003,91.5% of persons living in all large state and nonstatefacilities lived in ICF-MR units, and 98.6% of peopleliving in state facilities of 16 or more residents lived inICF-MR units.
In 2003, only 4 of 10 ICF-MR residents wereliving in state facilities. On June 30, 2003, 40.3%of all ICF-MR residents were living in state facilities.This compares with 63.2% on June 30, 1987; 77.2%on June 30, 1982 and 87.5% on June 30, 1977. Thedecreased concentration of ICF-MR residents in statefacilities is associated with the general depopulationof large state ID/DD facilities and the increase in thenumber of community ICFs-MR. On June 30, 2003there were 42,226 persons in ICF-MR units of largestate ID/DD facilities (39.4% of all ICF-MR residents).This compares with 88,424 persons on June 30, 1987(61.2% of all ICF-MR residents), and 107,081 per-sons on June 30, 1982 (76.3% of all ICF-MR resi-dents).
The number of residents of community ICFs-MR decreased slightly in 2003. On June 30, 2003
there were 40,779 persons with ID/DD living in com-munity ICFs-MR with 15 or fewer residents. This rep-resents a slight decrease of 2.4% from June 30, 2002.Community ICFs-MR continued to house many morethan the 25,328 persons on June 30, 1987, and the9,985 persons on June 30, 1982. On June 30, 2003,46.8% of residents of community ICFs-MR lived infacilities with 6 or fewer residents. Between June 30,1982 and June 30, 2003 the total number of personswith ID/DD living in ICFs-MR of six or fewer residentsincreased from 2,572 to 19,092. The number ofpeople living in ICFs-MR of 6 or fewer residents de-creased between June 30, 2002 and June 30, 2003by 405 residents (2.1%).
A relatively small proportion of persons withID/DD in community settings live in ICF-MR certi-fied residences. Nationally, on June 30, 2003 only12.4% of the persons in settings with 15 or fewer resi-dents lived in ICFs-MR. Persons living in settingswith 7 to 15 residents were far more likely to live inICFs-MR than persons living in settings of 6 or fewerresidents; 21,687 (39.9%) of the 54,346 persons liv-ing in settings with 7 to 15 residents lived in ICFs-MR, while only 19,092 (6.9%) of the 275,461 living insettings with 6 or fewer residents lived in ICFs-MR.
In 2003 total ICF-MR expenditures were morethan in 2002. In Fiscal Year 2003 total federal andstate expenditures for ICF-MR services were 11.5 bil-lion dollars. This was an increase from the 10.7 bil-lion dollars expended in FY 2002. Comparable ex-penditures were 10.0 billion in 1997, $8.8 billion in1992, $5.6 billion in 1987, $3.6 billion in 1982 and$1.1 billion in 1977.
Per resident ICF-MR expenditures in 2003 con-tinued to increase. In 2003 the average expendi-ture for end of year ICF-MR residents was $107,161.This compares with the average 2002 per residentexpenditure of $97,190. The average 2003 expendi-ture for average daily residents in ICFs-MR was$104,633, or 154.2%, more than the average per resi-dent expenditure of 14 years earlier. States variedsubstantially in expenditures per end-of-year ICF-MRresident, from more than $120,000 per year in twentystates to less than $60,000 per year in one state. To-tal ICF-MR expenditures per person in the generalpopulation averaged $40.77 per year nationally. Threestates spent over twice the national average.

viii
Medicaid Home and CommunityBased Services (HCBS)
Growth in HCBS recipients continues. On June30, 2003 there were 402,438 persons with ID/DDreceiving HCBS, an increase of 6.3% over the 378,566recipients on June 30, 2002. In the thirteen yearsbetween June 30, 1990 and 2003, the number ofHCBS recipients grew by 362,600 persons (910.2%)from 39,838 HCBS recipients. The number of stateswith approved applications to provide HCBS increasedfrom 42 to 51. Forty-six states increased their numberof HCBS recipients by 1,000 or more between 1990and 2003.
The number of people receiving HCBS is ap-proaching four times the number living in ICFs-MR. On June 30, 2003 the number of HCBS recipi-ents (402,438) was 375.9% of the number of personsliving in ICFs-MR (107,065). Only nine years earlieron June 30, 1994 the number of ICF-MR residents(142,118) was greater than the number of HCBS re-cipients (122,075).
The number of people receiving residentialservices outside the family home with HCBS fi-nancing is more than twice the number living inICFs-MR. Of the 51 states with HCBS programs, 45were able to report, in whole or part, the residentialarrangements of their HCBS recipients on June 30,2003. These states reported residential arrangementsfor 267,775 individuals, 66.5% of 402,438 HCBS re-cipients on June 30, 2003. Close to three-fifths(57.5%) of these HCBS recipients were receiving resi-dential services outside their family home. Applyingthis statistic to all HCBS recipients on June 30, 2003yields an estimated 231,401 persons receiving resi-dential services funded by HCBS while living awayfrom the home of their parents or other relatives. Thisestimated number of HCBS residential service recipi-ents was more than twice the number of ICF-MR resi-dents.
Expenditures for Medicaid HCBS recipientscontinue to grow and show substantial interstatevariability. In Fiscal Year 2003 expenditures for Med-icaid HCBS recipients were 14.1 billion dollars for402,438 recipients, a per end of year recipient aver-age of $35,093 per year. Expenditures adjusted foraverage daily HCBS recipients were $36,363 per per-son. This represents a 71.2% total or 5.5% averageannual increase in per recipient average expenditures
between Fiscal Year 1990 ($21,246) and Fiscal Year2003. The states with the highest per recipient ex-penditures in Fiscal Year 2003 were Delaware($78,250), Maine ($71,458) and Rhode Island($71,768). The states with the lowest per recipientexpenditures in Fiscal Year 2003 were District of Co-lumbia ($15,553) and Mississippi ($15,833).
ICF-MR and HCBS CombinedGrowth in the total number of ICF-MR and HCBSrecipients has continued at a steady rate. Thecombined total of 509,503 ICF-MR and HCBSrecipients on June 30, 2003 represented a 13.1%average annual increase between June 30, 1992 andJune 30, 2003. Between 1992 and 2003 the combinedtotal of ICF-MR and HCBS recipients grew by anaverage 27,344 persons per year. In comparison,between 1982 and 1987 the combined totals of ICF-MR and HCBS recipients increased at an annualaverage of about 4,995 persons. Between 1987 and1992 the combined average annual increase of ICF-MR and HCBS recipients was approximately 8,000persons. On June 30, 2003, HCBS recipients madeup 79.0% of the combined total of 509,503 ICF-MRand HCBS recipients. This compares with just 16.4%sixteen years earlier on June 30, 1987.
On June 30, 2003 community ICF-MR residentsand HCBS recipients made up more than four-fifths of the combined total of ICF-MR and HCBSrecipients. On June 30, 2003 residents of commu-nity ICFs-MR (15 or fewer residents) and HCBS re-cipients made up 87.0% of all ICF-MR and HCBSrecipients. That compares with 85.9% on June 30,2002, 83.8% on June 30, 2001, 81.9% on June 30,2000, 80.2% on June 30, 1999; 78.3% on June 30,1998; 68.6% on June 30, 1995; and 33.0% fifteenyears earlier on June 30, 1988. In all states most ofthe combined ICF-MR and HCBS recipients were re-ceiving community services.
There remains remarkable variation amongstates in ICF-MR and HCBS utilization rates. OnJune 30, 2003 there was a national ICF-MR utiliza-tion rate of 38.0 ICF-MR residents per 100,000 per-sons in the United States. The highest individual stateICF-MR utilization rates were 140.8 in District of Co-lumbia and 123.6 in Louisiana. The highest utiliza-tion of large ICFs-MR were in Arkansas (48.1), Illi-nois (54.7), Iowa (54.4), Louisiana (58.9), Mississippi(70.7), and Oklahoma (59.1). State HCBS utilization

ix
rates varied from more than twice the national aver-age of 143.0 in four states to less than half of thenational average in six states. On June 30, 2003 na-tionally there was an average of combined ICF-MRand HCBS recipients of 181.0 per 100,000 of thepopulation. Individual state utilization rates for thecombined programs varied from the highest rates inIowa (324.1), Minnesota (352.9), New York (320.7),North Dakota (419.7), South Dakota (317.8) and Ver-mont (305.2) to the lowest rates in Kentucky (71.0)and Nevada (62.7).
Medicaid expenditures are disproportionatelygreater for persons in ICFs/MR than HCBS recipi-ents. The annual Medicaid expenditures per aver-age daily recipient of ICF-MR services was $104,633as compared to $36,363 per each HCBS recipient.As a result, nationally in Fiscal Year 2003, HCBS re-cipients made up 79.0% of the total HCBS and ICF-MR recipient population but used only 55.2% of thetotal Medicaid HCBS and ICF-MR expenditures. InFY 2003 total HCBS expenditures were greater thantotal ICF-MR expenditures in 35 states.
Differences in state benefits from Medicaidspending continues. Almost any measure of eachstate’s relative benefits from Medicaid funding yields
significant interstate differences. Indexing Fiscal Year2003 federal reimbursements for ICF-MR and HCBSprograms in each state by federal income tax paid byresidents of each state, 7 states received over twicetheir relative federal income contributions tax back inbenefits, Iowa ($2.20 in benefits per $1.00 contrib-uted), Louisiana ($2.26), Maine ($3.16), New Mexico($2.18), North Dakota ($3.32), Rhode Island ($2.14)and West Virginia ($2.61). By the same measuretwo states received back less than half their relativecontributions (California and Nevada).
Nursing Home ResidentsThe number of persons with ID/DD in NursingFacilities continues to remain relatively stablenationally but with major variations across states.On June 30, 2003 there were and estimated 35,005persons with ID/DD in Medicaid Nursing Facilities.This compares with an estimated 34,820 in June 2002and 38,799 on June 30, 1992. Nationwide, in 2003,8.0% of all persons with ID/DD receiving residentialservices and 6.4% of all with ID/DD receiving servicesthrough Medicaid ICF-MR, HCBS or Nursing Facilityprograms were in Medicaid Nursing Facilities. Thepercentage of residential service recipients in nursingfacilities varied from less than 5% in 18 states to morethan 20% in 4 states.

x

xi
Introduction and Methodology

xii

xiii
IntroductionThe National Residential Information Systems Project(RISP) on Residential Services of the Research andTraining Center on Community Living began in 1977.It has operated on a nearly continuous basis sincethen. This project gathers and reports statistics onpersons with intellectual disabilities and relateddevelopmental disabilities (ID/DD) receivingresidential services, both state and nonstate,Medicaid-funded and non-Medicaid funded programsin the United States, including residential servicesoperated specifically for persons with ID/DD, as wellas persons with ID/DD who are living in statepsychiatric facilities. This particular report providessuch statistics for the year ending June 30, 2003, aswell as comparative statistics from earlier years.
Section 1 of this report presents statistics on stateresidential services for Fiscal Year 2003, with com-parative trend data from earlier years. Chapter 1 pre-sents statistics that were compiled and reported byvarious state agencies. The data collection in Chap-ter 1 represents a continuation of a statistical pro-gram originated by the Office of Mental RetardationCoordination (now the Administration on Developmen-tal Disabilities) in 1968 which gathered statistics onstate ID/DD residential facilities with 16 or more resi-dents. It has since been expanded to include statis-tics on smaller state ID/DD residential settings (thosewith fewer than 15 residents) and on state psychiatricfacilities which house persons with intellectual dis-abilities and related conditions. The addition of statepsychiatric facilities was begun for Fiscal Year 1978,and the smaller state residential settings were addedin Fiscal Year 1986. As indicated at various pointsthroughout this report the statistics gathered as partof the National Residential Information SystemsProject since Fiscal Year 1977 have also been linkedto a longitudinal data base developed by the projectincluding statistics on residents and expenditures ofindividual large (16 or more residents) state ID/DDresidential facilities on June 30, 2003. That data basebegins with the first census of state ID/DD residentialfacilities carried out as part of the U.S. Census of1880.
Section I, Chapter 1 also presents the Fiscal Year2003 statistics as part of the longitudinal trends instate residential facility populations, resident move-ment, and expenditures for state residential facility
care since 1950. A brief historical review of theseand other preceding surveys since 1950 can be foundin Lakin, Hill, Street, and Bruininks (1986). For a moredetailed review, including surveys and statistics since1880, see Lakin (1979).
Section I, Chapter 2 presents information on av-erage and end of Fiscal Year 2003 populations of stateresidential facilities for persons with ID/DD, averageper diem expenditures during Fiscal Year 2003 bylarge state residential facilities and patterns of largestate residential facility closure. It provides a listingof all large state residential facilities that have oper-ated since 1960, including those that closed in orbefore 2003, and those that are scheduled to close inFiscal Year 2004. These statistics were gatheredthrough the survey of individual state facilities includ-ing traditional state ID/DD residential facilities and ID/DD units contained within state psychiatric or other“mixed use” residential facilities.
Section II of this report presents combined statis-tics on the total numbers of persons with intellectualdisabilities and related developmental disabilities inboth state and nonstate residential settings. Statis-tics in this section have been compiled and reportedby individual state ID/DD agencies. This data set wasdesigned in cooperation with state agencies to per-mit the most comprehensive possible data collectionwhile maintaining congruence with administrative datasets maintained in each of the states. It should benoted that in certain states a significant amount ofstate effort is required to compile the requested sta-tistics, sometimes including separate surveys ofsubstate regions. Occasionally the demands of suchdata collection activities preclude a state’s reportingcompletely for a particular year. In such states statis-tics from the most recent data collection point havebeen substituted for Fiscal Year 2003 data. Whenearlier data are substituted, they are so indicated inthe tables presented.
Section II provides longitudinal trend statistics ontotal (i.e., state and nonstate) ID/DD residential ser-vice systems on the individual state and national lev-els. Section II, Chapter 3 provides data on total stateresidential services systems (i.e., services providedby both state and nonstate agencies). These statis-tics are reported by state/nonstate operation and bysize of residential settings on June 30, 2003. State

xiv
services include those described in Chapter 1 withthe exception of the psychiatric residential facilities,which are excluded in Section II’s focus on the indi-vidual state and national ID/DD residential servicessystems. Although nonstate settings are almost en-tirely privately operated, in a few states local govern-ment agencies also operate residential programs.These local government programs are included withprivate programs in a nonstate category because typi-cally their relationship with the state with respect tolicensing, monitoring and funding is more like that ofa private agency than that of a state program. In ad-dition to state/nonstate operation, four residential set-ting size distinctions are provided: 1 to 3 residents, 4to 6 residents, 7 to 15 residents and 16 or more resi-dents. These size categories were established be-cause they were most congruent with the data thatthe individual states were able to report.
Chapter 4, presents statistics reported by the vari-ous states on residents living in different types of resi-dential settings of state and nonstate operation. Fourseparate categories of residential settings are identi-fied. These were developed after consultation withstate respondents during a 1986 feasibility study ofstates’ abilities to report residents by setting type.Without question this area presents states with thegreatest reporting challenge. States have in total lit-erally hundreds of different names for residential pro-grams and many of these programs have aspectswhich make them subtly different from similarly namedprograms in other states. Even in using just the fourbroad residential setting categories identified below,a few state data systems do not permit the breakdownsrequested. Therefore in some states some residen-tial settings and their residents must be subsumed inthe statistics of another setting type.
Chapter 5 presents Fiscal Year 2003 statisticsalong with longitudinal statistics from earlier years toshow the changing patterns of residential services forpersons with ID/DD from 1977 to 2003. This presen-tation of statistics focuses on overall residential ser-vice utilization as well as the utilization of residentialsettings of different state/nonstate operation, size andtype.
Section III focuses on the utilization of the Medic-aid program to sponsor long-term care services forpersons with intellectual disabilities and related de-
velopmental disabilities. Chapter 6 describes the evo-lution of Medicaid involvement in services for personswith intellectual disabilities and related conditions andthe specific programs funding residential services forpersons with ID/DD. Chapter 7 provides statistics onJune 30, 2003 utilization of these Medicaid programs.It also presents Fiscal Year 2003 statistics within thelongitudinal context of changing Medicaid utilization.This presentation also includes Medicaid residentialservices program utilization within the entire systemof residential services for persons with intellectualdisabilities and related conditions.
Section IV provides state-by-state trends in resi-dential services. Chapter 8 in this section providesindividual state summaries from 1977 to 2003 ofchanges in residential services by facility size, ser-vice recipients per 100,000 of state population andother descriptors for use in monitoring trends andcomparing states.
MethodologyThe contents of this report primarily derive from twodata collection activities. The first is a four-part surveyof designated state agencies and key respondents togather aggregated state statistics. The second is asurvey of administrators of all large (16 or moreresidents) state ID/DD facilities.
State Survey Data CollectionA four-part survey questionnaire for state agencystatistics for Fiscal Year 2003, was mailed with a coverletter to each state’s intellectual disabilities/developmental disabilities program director and thestate’s designated “key data informant” in July 2003.Part 1 of the questionnaire was on state residentialservices including state ICFs-MR. Part 2 gatheredstatistics on nonstate residential settings and residentswith intellectual disabilities and related developmentaldisabilities including nonstate ICFs-MR. Part 3contained questions on Medicaid Home andCommunity Based Services. Part 4 requested thenumber of persons with ID/DD on waiting lists forresidential services. Telephone follow-up began twoweeks after the questionnaires were mailed to confirmthe individual(s) in each state agency who hadaccepted responsibility for compiling the statistics foreach part of the survey. Direct contacts were thenmade with each key data manager to answerquestions about the data requested.

xv
Data on nursing facility residents was reportedbased on Minimum Data Set files, December-July2000 updated by 30 states as of June 30, 2002 andagain by 45 states as of June 30, 2003.
Additional follow-up telephone calls to promoteinitial response and to clarify and edit the statistics onreturned questionnaires continued and summaries ofthe data from each state were returned to each statefor verification. Reporting and special notes on statedata were completed by the end of May 2004. Com-piling statistics from states on the four-part surveytook an average of four telephone conversations in-volving up to four different people in each state. Inseveral states contacts were made with two or moreof the intellectual disabilities/developmental disabili-ties, mental health and Medicaid agencies to gatherthe required statistics.
Limitations are encountered when gathering sta-tistics at the state level. Most notable among theseare the variations that sometimes exist in the types ofstatistics maintained by the various states and thespecific operational definitions governing certain dataelements. For example, in a few states data on firstadmissions, discharges, and deaths were not avail-able according to the specific survey definitions. In afew other states the state statistical systems were notwholly compatible with the uniform data collegectionof this project. General problems in the collection ofthat data are presented in the discussion accompa-nying each table in the body of the report and/or innotes at the foot of tables.
Individual State Residential FacilitySurveyData in Chapter 2 of this report presents results froma survey of each large (16 or more) state ID/DDresidential facility or unit operating on June 30, 2003.
The survey used was a “short form” of large statefacility populations, of persons moving in and out ofthe facilities, and of per diems of the facilities. The“short form” of the annual survey was used for FY2003 to gather data on number of residents, averagedaily cost per resident, resident admissions, releasesand deaths, and planned closures and downsizing.
As in the past, this survey was conducted in coop-eration with the Association of Public DevelopmentalDisabilities Administrators (formerly the National As-sociation of Superintendents of Public Residential Fa-cilities for the Mentally Retarded).
Historical Statistics on StateResidential FacilitiesThe longitudinal data presented here are derived fromthe following sources: 1) state ID/DD and psychiatricfacilities for the years 1950 to 1968 come from theNational Institute of Mental Health’s surveys of“Patients in Institutions;” 2) state ID/DD facilities forFYs 1969 and 1970 come from surveys conductedby the Office on Mental Retardation Coordination, nowthe Administration on Developmental Disabilities; 3)large state ID/DD facilities for 1971 through 1977come from the surveys of the National Association ofSuperintendents of Public Residential Facilities forPersons with Mental Retardation, now the Associationof Public Developmental Disabilities Administrators;4) psychiatric facilities for 1969 to 1977 come fromthe National Institute of Mental Health’s surveys of“Patients in State and County Mental Hospitals;” and,5) large state ID/DD and psychiatric facilities for theyears 1978 through 2003 come from the ongoing datacollection of this project.

xvi

Section 1Status and Changes in
State Residential Services

3
Chapter 1
Current Populations and Longitudinal Trends of StateResidential Settings (1950-2003)
Kathryn Coucouvanis, Barbara Polister, Robert W. Prouty, Robert H. Bruininks, and K.Charlie Lakin
states except Alaska, District of Columbia, Hawaii,Maine, New Hampshire, New Mexico, Rhode Island,Vermont, and West Virginia operated at least onelarge (16 or more residents) state ID/DD facility onJune 30, 2003. Ten states reported at least one psy-chiatric facility housing persons with a primary diag-nosis of ID/DD in units other than special ID/DD units(the latter being counted among the ID/DD facilities).States (excluding New Jersey, New York and Virginia)reported a total of 32 psychiatric facilities with resi-dents with ID/DD as compared with 33 on June 30,2002.
On June 30, 2003, 20 states were serving per-sons with ID/DD in state ID/DD settings with 15 orfewer total residents. There were 2,478 communityresidential settings staffed by state employees onJune 30, 2003, including, 771 (31.1%) housing 7-15residents, 853 (34.4%) housing 4-6 residents and 854(34.5%) housing 3 or fewer residents.
The greatest number of state community residen-tial settings was in New York (1,000 settings). NewYork operated 40.4% of all such settings in the UnitedStates on June 30, 2003. More than one-half (52.8%)of New York‘s state community residential facilitieshad between 7 and 15 residents. In June 2003, ofthe 1,478 state community ID/DD residential settingsoutside of New York more than four-fifths (83.6%)had 6 or fewer residents.
Residents with ID/DD of State Settings
Table 1.2 presents the number of persons with ID/DD living in state ID/DD residential settings andpsychiatric facilities on June 30, 2003. On June 30,2003 there were 56,160 persons with ID/DD living instate residential settings. This represented adecrease of 734 (-1.3%) from the 56,894 residentson June 30, 2002. Of this population, 55,774 (99.3%)persons were residents of settings specificallydesignated for persons with ID/DD and 386 (0.7%)
This chapter presents statistics by state and size ofstate residential settings serving persons withintellectual disabilities and related developmentaldisabilities (ID/DD). Data on resident populations,resident movement, and costs are presented forFiscal Year (FY) 2003 and national longitudinal trendsare provided for FYs 1950 through 2003. FY 2003’ssize of residence statistics are provided in detail forstate residential settings with 3 or fewer residents, 4to 6 residents, 7 to 15 residents and 16 or moreresidents and for persons with ID/DD residing in largestate psychiatric facilities. Longitudinal populationstatistics are provided for large (16 or more residents)state ID/DD facilities and psychiatric facilities.
FY 2003 data for all ID/DD community settingsand large state facilities, and psychiatric facilitiescome from the annual survey of all states conductedby this project. The longitudinal data presented hereare derived from the list of “References and DataSources,” which includes specific citations for the sur-veys and statistical summaries used to complete thislongitudinal data set. A description of these sourcesis in the “Introduction and Methodology.” A detaileddescription of these surveys can be found in Lakin(1979).
Number of State Residential Settings
Table 1.1 presents statistics by state on the numberof state residential settings serving persons with ID/DD in the United States on June 30, 2003. Thestatistics are broken down for state ID/DD settingswith 1-3 residents, 4-6 residents, 7-15 residents, and16 or more residents, for state psychiatric facilities,and total large state facilities and all state settings.
On June 30, 2003, states reported a total of 2,744state residential settings serving persons with ID/DD,an increase of 391 from the previous year. Of these,2,712 were settings primarily for persons with ID/DD.Of the 2,712 state ID/DD settings, 2,478 had 15 orfewer residents; 234 had 16 or more residents. All
* a state setting is a residence in which the persons providing direct support to the residents are state employees

4
Table 1.1 Number of State Residential Settings on June 30, 2003 by State
StateA L 0 0 0 0 0 4 4 0 4 4AK 0 0 0 0 0 0 0 0 0 0AZ 12 9 21 4 25 1 26 0 1 26A R 0 0 0 0 0 6 6 0 6 6CA 0 0 0 0 0 7 7 0 7 7CO 2 10 12 30 42 2 44 0 2 44CT 267 51 318 93 411 7 418 3 1 10 421DE 0 0 0 0 0 1 1 1 2 2DC 0 0 0 0 0 0 0 0 0 0FL 0 0 0 0 0 8 8 0 1 8 8GA 10 1 11 0 11 8 19 0 0 19HI 0 0 0 0 0 0 0 0 0 0ID 0 0 0 0 0 1 1 0 1 1IL 0 0 0 0 0 9 9 0 9 9IN 0 0 0 0 0 6 6 2 1 8 8IA 27 0 27 0 27 2 29 4
26 33
K S 0 0 0 0 0 2 2 0 2 2K Y 0 0 0 5 5 3 8 0 3 8LA 0 12 12 0 12 10
322 0 10 22
M E 0 0 0 3 3 0 3 0 0 3M D 0 0 0 0 0 4 4 0 4 4M A 20 170 190 34 224 7 231 0 7 231M I 0 0 0 0 0 1 1 0 1 1M N 6 97 103 0 103 1 104 0 1 104M S 150 18 168 61 229 6 235 0
16 235
M O 104 8 112 9 121 10 131 9 19 140M T 0 0 0 0 0 2 2 0 2 2NE 0 0 0 0 0 1 1 0 1 1NV 0 0 0 0 0 2 2 0 2 2NH 0 1 1 0 1 0 1 0 0 1NJ 0 0 0 0 0 7 7 DNF 7 7NM 101 2 103 0 103 0 103 0 0 103NY 82 390 472 528 1,000 52 1,052 DNF 52 1,052NC 0 0 0 1 1 5 6 4 9 10ND 0 0 0 0 0 1 1 0 1 1OH 0 0 0 0 0 12 12 0 12 12OK 0 0 0 0 0 2 2 0 2 2OR 8 e 25 e 33 e 0 33 e 1 34 0 1 34P A 0 0 0 0 0 6 6 0 6 6RI 54 36 90 3 93 0 93 0 0 93S C 0 0 0 0 0 5 5 0 5 5S D 0 0 0 0 0 1 1 1 2 2TN 0 0 0 0 0 3 3 5 8 8TX 0 2 2 0 2 13 15 0 13 15UT 0 0 0 0 0 1 1 0 1 1VT 0 0 0 0 0 0 0 1 1 1V A 0 0 0 0 0 5 5 DNF 5 5W A 11 21 32 0 32 5 37 0 5 37W V 0 0 0 0 0 0 0 2 2 2W I 0 0 0 0 0 3 3 0 3 3W Y 0 0 0 0 0 1 1 0 1 1
US Total 854 e 853 e 1,707 e 771 e 2,478 e 234 2,712 e 3 24
2664
2,7444
1 FY02 data
2 FY01 data
4 does not include NJ, NY, VA psychiatric facilities
State ID/DD Settings Total Large Facilities
(16+)All State Settings
Psychiatric FacilitiesTotal16+4-6 1-6
3 includes one residential school (ICF/MR) with 75 residents
7-15 1-151-3

5
Table 1.2 Persons with ID/DD Living in State Residential Settings on June 30, 2003by State
StateAL 0 0 0 0 0 337 337 0 337 337AK 0 0 0 0 0 0 0 0 0 0AZ 25 43 68 41 109 145 254 0 145 254AR 0 0 0 0 0 1,101 1,101 0 1,101 1,101CA 0 0 0 0 0 3,560 3,560 0 3,560 3,560CO 6 55 61 225 286 99 385 0 99 385CT 561 282 843 751 1,594 862 2,456 9 1 869 2,463DE 0 0 0 0 0 159 159 14 173 173DC 0 0 0 0 0 0 0 0 0 0FL 0 0 0 0 0 1,481 1,481 0 1,481 1,481GA 30 4 34 0 34 1,331 1,365 0 1 1,331 1,365HI 0 0 0 0 0 0 0 0 0 0ID 0 0 0 0 0 103 103 0 103 103IL 0 0 0 0 0 2,934 2,934 0 2,934 2,934IN 0 0 0 0 0 566 566 34 1 600 600IA 27 0 27 0 27 664 691 65 2 729 756KS 0 0 0 0 0 369 369 0 369 369KY 0 0 0 40 40 572 612 0 572 612LA 0 68 68 0 68 1,693 3 1,761 0 1,693 1,761ME 0 0 0 33 33 0 33 0 0 33MD 0 0 0 0 0 396 396 0 396 396MA 45 679 724 268 992 1,164 2,156 0 1,164 2,156MI 0 0 0 0 0 173 173 0 173 173MN 14 408 422 0 422 25 447 0 25 447MS 188 92 280 588 868 1,389 2,257 0 1 1,389 2,257MO 104 48 152 60 212 1,227 1,439 63 1,290 1,502MT 0 0 0 0 0 108 108 0 108 108NE 0 0 0 0 0 379 379 0 379 379NV 0 0 0 0 0 108 108 0 108 108NH 0 6 6 0 6 0 6 0 0 6NJ 0 0 0 0 0 3,169 3,169 DNF 3,169 3,169NM 142 7 149 0 149 0 149 0 0 149NY 218 1,956 2,174 5,324 7,498 2,267 9,765 DNF 2,267 9,765NC 0 0 0 10 10 1,837 1,847 90 1,927 1,937ND 0 0 0 0 0 149 149 0 149 149OH 0 0 0 0 0 1,854 1,854 0 1,854 1,854OK 0 0 0 0 0 376 376 0 376 376OR 24 e 117 e 141 e 0 141 50 191 0 50 191PA 0 0 0 0 0 1,545 1,545 0 1,545 1,545RI 78 204 282 45 327 0 327 0 0 327SC 0 0 0 0 0 986 986 0 986 986SD 0 0 0 0 0 170 170 10 180 180TN 0 0 0 0 0 739 739 82 821 821TX 0 10 10 0 10 5,000 5,010 0 5,000 5,010UT 0 0 0 0 0 231 231 0 231 231VT 0 0 0 0 0 0 0 1 1 1VA 0 0 0 0 0 1,613 1,613 DNF 1,613 1,613WA 27 86 113 0 113 1,021 1,134 0 1,021 1,134WV 0 0 0 0 0 0 0 18 18 18WI 0 0 0 0 0 788 788 0 788 788WY 0 0 0 0 0 95 95 0 95 95US Total 1,489 4,065 5,554 7,385 12,939 42,835 55,774 386 4 43,221 4 56,160 4
1 FY02 data 3 includes one residential school (ICF/MR) with 75 residents2 FY 01 data 4 does not include NJ, NY, VA psychiatric facilities
16+ TotalState ID/DD Settings Psychiatric
FacilitiesTotal Large
Settings (16+)All State Settings1-3 4-6 1-6 7-15 1-15

6
persons were residents of psychiatric facilities.Of the 55,774 persons living in state ID/DD set-
tings, 5,554 (10.0%) were in settings of 6 or fewerresidents in only seventeen states, with 4,163 (75.0%)of those concentrated in four states (Connecticut,Massachusetts, Minnesota and New York). Of the7,385 (13.2%) persons in settings with 7 to 15 resi-dents, 5,324 (72.1%) were in New York. There were42,835 persons in state facilities of 16 or more resi-dents, with more than one-third (34.2%) in four states(California, Illinois, New Jersey and Texas), each withmore than 2,900 residents of such facilities.
The decrease in the number of residents of largestate ID/DD facilities continued a trend first evident inFY 1968. The 2.8% rate of decrease between June30, 2002 and June 30, 2003 compares with decreasesof 4.1% in FY2002; 3.0% in FY2001; 3.6% in FY 2000;4.6% in FY 1999; 6.1% in FY 1998; 6.0 % in FY 1997;6.0% in FY 1996; 5.6% in FY 1995; 5.8% in FY 1994;and 6.4% in FY 1993. A factor in the slowing rate ofdeinstitutionalization is the number of states (9) thathave no one left in large state ID/DD facilities andcannot, therefore, continue to contribute to furtherpopulation reductions.
Change in Average Daily Population:1980-2003
Table 1.3 presents summaries of the average dailypopulation of large state ID/DD facilities by state forFYs 1980, 1985, 1990, 1995, 2000, 2002 and 2003and the percentage of change in average dailypopulation between 1980, 1985, 1990, 1995, 2000,and 2003, respectively. The average daily populationis the sum of the number of people living in a facilityon each of the days of the year divided by the numberof days of the year. In FY 2003, the average dailypopulation of large state ID/DD residential facilitieswas 43,289 people, a reduction of 1,309 (-2.9%) fromthe 44,598 average daily population in FY 2002.
Average daily populations of large state ID/DDfacilities decreased by 87,799 (-67.0%) between 1980and 2003. More than four-fifths (80.4%) of the statesreduced their populations in large state ID/DD facili-ties by more than 50% during the period. In 16 states,Alaska, Colorado, District of Columbia, Hawaii, Maine,Maryland, Michigan, Minnesota, New Hampshire, NewMexico, New York, North Dakota, Oregon, Rhode Is-land, Vermont, and West Virginia decreases were80% or more.
In the first five years of this period (1980-1985)
average daily population of large state ID/DD facili-ties decreased by 21,474 (16.4%) or an annual aver-age decrease of 4,295 residents (3.3% per year). Inthe next five years (1985-1990) large state ID/DD fa-cilities’ average daily populations decreased by 25,225(23.0%) or an annual average decrease of 5,045 resi-dents (4.6%). Between 1990 and 1995 average dailypopulations of large state ID/DD facilities decreasedby 20,684 (24.5%) or an average of 4,139 (4.9%) resi-dents per year. Between 1995 and 2000 the averagedaily populations decreased by 15,833 (24.9%) or anannual average decrease of 3,167 (4.9%). In the lastthree years, the annual average decrease of 1,528was less than half the annual decrease of five yearsbefore.
All states reduced their average daily populationof large ID/DD facilities between 1990 and 2003. In32 states the average daily population decreased bymore than 50% over the 13 year period. Thirteenstates reduced their average daily populations by morethan 75% between 1990 and 2003 (Alaska, Colorado,District of Columbia, Hawaii, Maine, Michigan, Min-nesota, New Hampshire, New Mexico, Oregon, RhodeIsland, Vermont, and West Virginia).
Average Daily Residents with ID/DD inLarge State ID/DD and PsychiatricFacilities
Table 1.4 reports average daily population of residentswith ID/DD in large state ID/DD facilities andpsychiatric facilities in selected years, 1950-2003. Thegradual depopulation of large state residential facilitiesfor persons with ID/DD has been occurring on anational basis since 1967. Nationally, there has beena decreasing total residential population of large stateresidential facilities for all types of mental disability(i.e., psychiatric and ID/DD) since 1956. Althoughthe total population in state psychiatric facilities peakedin 1955, the number of persons with a primarydiagnosis of intellectual disability in state psychiatricfacilities continued to increase until 1961. In 1961,there were nearly 42,000 persons with a primarydiagnosis of intellectual disability in such facilities. Thecombined total of persons with ID/DD in both largestate ID/DD and psychiatric facilities in 1961 was209,114. By 1967, the number of persons with ID/DD in state psychiatric facilities had decreased to33,850, but the total number of persons with ID/DD inall large state facilities had increased to 228,500(194,650 of whom were in large state ID/DD facilities.)This was the highest total ever.

7
Table 1.3 Average Daily Population of Persons with ID/DD Living in LargeState ID/DD Facilities and Percentage Changes, Between 1980-2003, by State
State 1980 1985 1990 1995 2000 2002 2003AL 1,651 1,422 1,305 985 642 506 377 -77.2 -73.5 -71.1 -61.7 -41.3AK 86 e 76 58 33 0 0 0 -100.0 -100.0 -100.0 -100.0 NAAZ 672 538 360 e 126 166 156 149 -77.8 -72.3 -58.6 18.3 -10.2AR 1,550 1,254 1,260 1,262 1,229 1,192 1,123 -27.5 -10.4 -10.9 -11.0 -8.6CA 8,812 7,524 6,768 5,494 3,879 3,726 3,606 -59.1 -52.1 -46.7 -34.4 -7.0CO 1,353 1,125 466 e 241 129 102e 104e -92.3 -90.8 -77.7 -56.8 -19.4CT 2,944 2,905 1,799 1,316 992 885 887 -69.9 -69.5 -50.7 -32.6 -10.6DE 518 433 345 e 308 256 198 170 -67.2 -60.7 -50.7 -44.8 -33.6DC 775 351 309 e 0 0 0 0 -100.0 -100.0 -100.0 NA NAFL 3,750 2,268 1,992 1,502 1,508 1,351 1,521 -59.4 -32.9 -23.6 1.3 0.9GA 2,535 2,097 2,069 1,979 1,510 1,400 1,333 -47.4 -36.4 -35.6 -32.6 -11.7HI 432 354 162 83 0 0 0 -100.0 -100.0 -100.0 -100.0 NAID 379 317 210 139 110 110 104 -72.6 -67.2 -50.5 -25.2 -5.5IL 6,067 4,763 4,493 3,775 3,237 3,160 2,952 -51.3 -38.0 -34.3 -21.8 -8.8IN 2,592 2,248 1,940 e 1,389 854 686 612 -76.4 -72.8 -68.5 -55.9 -28.3IA 1,225 1,227 986 719 674 676 672 -45.1 -45.2 -31.8 -6.5 -0.3KS 1,327 1,309 1,017 e 756 379 376 368 -72.3 -71.9 -63.8 -51.3 -2.9KY 907 671 709 679 e 628 607 543 -40.1 -19.1 -23.4 -20.0 -13.5LA 2,914 3,375 2,622 2,167 1,749 1,680 1,682 -42.3 -50.2 -35.9 -22.4 -3.8ME 460 340 283 150 0 0 0 -100.0 -100.0 -100.0 -100.0 NAMD 2,527 1,925 1,289 817 548 434 421 -83.3 -78.1 -67.3 -48.5 -23.2MA 4,531 3,580 3,000 2,110 1,306 1,194 1,155 -74.5 -67.7 -61.5 -45.3 -11.6MI 4,888 e 2,191 1,137 e 392 271 179 164 -96.6 -92.5 -85.6 -58.2 -39.5MN 2,692 2,065 1,392 610 42 36 33 -98.8 -98.4 -97.6 -94.6 -21.4MS 1,660 1,828 1,498 1,439 1,383 1,360 1,378 -17.0 -24.6 -8.0 -4.2 -0.4MO 2,257 1,856 1,860 e 1,492 1,286 1,189e 1,247 -44.7 -32.8 -33.0 -16.4 -3.0MT 316 258 235 163 131 120 115 -63.6 -55.4 -51.1 -29.4 -12.2NE 707 488 466 414 401 394 386 -45.4 -20.9 -17.2 -6.8 -3.7NV 148 172 170 160 157 131 116 -21.6 -32.6 -31.8 -27.5 -26.1NH 578 267 87 0 0 0 0 -100.0 -100.0 -100.0 NA NANJ 7,262 5,705 5,069 4,325 3,555 3,365 3,218 -55.7 -43.6 -36.5 -25.6 -9.5NM 500 471 500 221 0 0 0 -100.0 -100.0 -100.0 -100.0 NANY 15,140 13,932 7,694 4,552 2,466 2,293 2,261 -85.1 -83.8 -70.6 -50.3 -8.3NC 3,102 2,947 2,654 2,288 1,939 1,885 1,863 -39.9 -36.8 -29.8 -18.6 -3.9ND 1,056 763 232 156 144 144 147 -86.1 -80.7 -36.6 -5.8 2.1OH 5,045 3,198 2,665 e 2,150 1,996 1,954 1,893 -62.5 -40.8 -29.0 -12.0 -5.2OK 1,818 1,505 935 618 391 350 366 -79.9 -75.7 -60.9 -40.8 -6.4OR 1,724 1,488 838 462 62 52 50 -97.1 -96.6 -94.0 -89.2 -19.4PA 7,290 5,980 3,986 3,460 2,127 1,652 1,577 -78.4 -73.6 -60.4 -54.4 -25.9RI 681 415 201 0 0 0 0 -100.0 -100.0 -100.0 NA NASC 3,043 2,893 e 2,286 1,788 1,129 1,040 1,002e -67.1 -65.4 -56.2 -44.0 -11.2SD 678 557 391 345 196 189 183 -73.0 -67.1 -53.2 -47.0 -6.6TN 2,074 2,107 1,932 1,669 948 820 758 -63.5 -64.0 -60.8 -54.6 -20.0TX 10,320 9,638 7,320 e 5,459 5,431 5,150 5,011 -51.4 -48.0 -31.5 -8.2 -7.7UT 778 706 462 357 240 231 230 -70.4 -67.4 -50.2 -35.6 -4.2VT 331 200 180 0 0 0 0 -100.0 -100.0 -100.0 NA NAVA 3,575 3,069 2,650 2,249 1,625 1,609 1,581 -55.8 -48.5 -40.3 -29.7 -2.7WA 2,231 1,844 1,758 1,320 1,143 1,093 1,043 -53.2 -43.4 -40.7 -21.0 -8.7WV 563 498 304 e 94 0 0 0 -100.0 -100.0 -100.0 -100.0 NAWI 2,151 2,058 e 1,678 e 1,341 900 815 791 -63.2 -61.6 -52.9 -41.0 -12.1WY 473 413 367 151 113 108 97 -79.5 -76.5 -73.6 -35.8 -14.2US Total 131,088 109,614 84,389 63,705 47,872 44,598 43,289 -67.0 -60.5 -48.7 -32.0 -9.6e = estimate NA = not applicable
% Change 2000-2003
% Change 1980-2003
% Change 1985-2003
% Change 1990-2003
% Change 1995-2003
Average Daily Population

8
Table 1.4 Average Daily Populationof Persons with ID/DD in Large StateID/DD and Psychiatric Facilities,1950-2003
Since 1967, the number of persons with ID/DD inall large state residential facilities has decreased verysignificantly. During this period the number of per-sons with ID/DD in state psychiatric facilities de-creased much more rapidly than did the number ofpersons in large state ID/DD facilities. The differentrates of depopulation reflect a number of factors. Forone, the depopulation of state psychiatric facilitiesoccurred earlier and more rapidly than the depopula-tion of state ID/DD facilities. Between 1960 and 1980the total populations of state psychiatric facilities de-creased by about 75% (Zappolo, Lakin & Hill, 1990).This rapid depopulation and frequent closing of facili-ties has contributed to major reductions in residentswith all types of disability, including ID/DD. Relatedlyover the years, many large state residential facilitiesbecame primarily dedicated to populations with ID/
DD or developed independent ID/DD units on thegrounds of what were historically public psychiatricfacilities.
These changes were prompted by Medicaid leg-islation in the late 1960s and early 1970s that allowedstates to obtain federal cost-sharing of institutionalservices to persons with ID/DD in Intermediate CareFacilities-Mental Retardation (ICFs-MR) and in nurs-ing homes, but excluded residents of facilities for“mental diseases” from participation in Medicaid, ex-cept for children and elderly residents. Distinct unitsfor persons with ID/DD within psychiatric facilitiescould become ICF-MR certified. Many were and thoseunits within the definitions employed in this study arenow classified among the large state ID/DD residen-tial facilities.
The average daily number of persons with ID/DDin large state ID/DD facilities in FY 2003 (43,289) wasonly 22.2% of the average in large state ID/DD facili-ties in 1967, and the average of persons with ID/DDin all large state residential facilities (43,675) was only19.1% of the 1967 average. Figure 1.1 shows therelative contribution of state ID/DD and state psychi-atric facilities to the total average daily population ofresidents with ID/DD in all large state residential fa-cilities.
Residents with ID/DD of Large State ID/DD and Psychiatric Facilities per 100,000of the General Population
Indexing the population of large state facilities by thegeneral population of states or the U.S. at a giventime permits a better picture of the relative use of thesesettings for persons with ID/DD. This statistic isreferred to here as the “placement rate.” Placementrate is reported for the end-of-year population in Table1.5 and is shown as a trend based on the annualaverage resident populations in Table 1.6 and Figure1.2.
Residents with ID/DD of state residential settingsper 100,000 of the general population on June 30,2003. Table 1.5 indexes the population of personswith ID/DD living in state residential settings June 30,2003 by 100,000 of each state’s general population.The national placement rate for all state residentialsettings was 20.0 residents per 100,000 members ofthe general population. This represented a reductionfrom 27.9 on June 30, 1995; 26.4 on June 30, 1996;
Year1950 124,304 23,905 148,2091955 138,831 34,999 173,8301960 163,730 37,641 201,3711965 187,305 36,285 223,5901967 194,650 33,850 228,5001970 186,743 31,884 218,6271973 173,775 30,237 204,0121977 151,532 15,524 167,0561980 131,088 9,405 140,4931982 117,160 7,865 125,0251984 111,333 5,096 116,4291986 100,190 3,106 103,2961988 91,582 1,933 93,5151989 88,691 1,605 90,2961990 84,389 1,487 85,8761991 80,269 1,594 81,8631992 75,151 1,561 76,7121993 71,477 1,741 73,2181994 67,673 1,613 69,2861995 63,705 1,381 e 65,0861996 59,936 1,075 e 61,0111997 56,161 1,075 e 57,2361998 52,469 1,003 e 53,4721999 50,094 962 e1 51,056
1
2000 47,872 4881
48,3601
2001 46,236 5652
46,8012
2002 44,598 2672
44,8652
2003 43,289 3863
43,6753
1 does not include NY psychiatric facilities2 does not include NJ and NY psychiatric facilites3 does not include NJ, NY and VA psychiatric facilities
e = estimate
Psychiatric TotalID/DD

9
Figure 1.1 U.S. Trends in Average Daily Population with ID/DD in Large StateID/DD and Psychiatric Facilities, 1950-2003.
24.4 on June 30, 1997; 23.6 on June 30, 1998; 22.7on June 30, 1999; 21.4 on June 30, 2000, 20.8 onJune 30, 2001. It was a slight increase from 19.7 onJune 30, 2002. The increase in the national placementrate for all state residential services was the result ofan increase in the placement rate in ID/DD settingsof 15 or fewer residents. The placement rate for stateID/DD residential settings of 15 or fewer residentsincreased to 4.6 in 2003 from 4.4 per 100,000 of thetotal population in 2002.
Four states had more than twice the national av-erage placement rate for large state ID/DD facilitieson June 30, 2003 (Arkansas, Louisiana, Mississippi,and New Jersey). Among the 42 states still operatinglarge state ID/DD facilities, five states had less thanone-third the average placement rate for such facili-ties on June 30, 2003 (Arizona, Colorado, Michigan,Minnesota, and Oregon). Connecticut, Mississippi,New York and Rhode Island had the highest place-ment rates in state community settings of 15 or fewerresidents (each six or more times the national aver-age). Connecticut and Rhode Island had the highestplacement rates in small state settings of 6 or fewerresidents (25.6 and 28.3 per 100,000 of the statepopulation, respectively).
U.S. Trends in Average Residents with ID/DD in Large State Facilities per 100,000of the General Population.
Table 1.6 and Figure 1.2 present trends in the averageannual placement rates per 100,000 of the total U.S.population for large state ID/DD and psychiatricfacilities. Since 1967, there has been a substantialdecrease in the number of people with ID/DD in large
state residential facilities, especially when it is adjustedfor the growing total U.S. population. The placementrate of persons with ID/DD in all large state facilities(ID/DD and psychiatric) peaked in 1965 at 115.8 per100,000 of the general population. This compareswith 15.5 in FY 2003, only 13.4% of the 1965 rate.The highest placement rate in large state ID/DDfacilities was in 1967. That year’s placement rate of98.6 was more than six times the 2003 rate of 15.4.
The decrease in the placement rate in large statepsychiatric facilities between 1973 and 2003 partlyreflects changing definitions. During that period somesettings historically serving psychiatric populations,either through official or operational designation, be-came facilities primarily serving persons with ID/DD.Others developed specific administratively distinct ID/DD units within traditional psychiatric facilities. Themost important factors in the decreasing numbers ofpersons with ID/DD in psychiatric facilities have beenthe major changes in philosophy about appropriateplacements for people with ID/DD and federal cost-sharing services provided in facilities certified to par-ticipate in the Intermediate Care Facility for Personswith Mental Retardation (ICF-MR) program. The sta-tistics in Figure 1.2 show clearly a substantial de-crease in the rate of placement of persons with ID/DD in state residential psychiatric facilities.
Slowing Rates of Large State FacilityDepopulation
Despite continuing reductions in large state facil-ity populations, it was notable that the period of Fis-cal Years 2001-2003, experienced the smallest re-ductions in large state facility residents with ID/DD in30 years. This was both in terms of numerical reduc-
0
5 0 , 0 0 0
1 0 0 , 0 0 0
1 5 0 , 0 0 0
2 0 0 , 0 0 0
2 5 0 , 0 0 0
1950
1955
1960
1965
1970
1975
1980
1985
1990
1995
2000
2002
2003
Y e a r
Ave
rag
e D
aily
Po
pu
lati
on
in 1
,000
s
ID /DD Psychiatric

10
Table 1.5 Persons with ID/DD Living in State Residential Settings Per 100,000of the General Population on June 30, 2003 by State
StateID/DD Settings
State 1-6 7-15 1-15 16+ TotalAL 45.52 0.0 0.0 0.0 7.4 7.4 0.0 7.4 7.4AK 6.65 0.0 0.0 0.0 0.0 0.0 0.0 0.0 0.0AZ 51.26 1.3 0.8 2.1 2.8 5.0 0.0 2.8 5.0AR 27.03 0.0 0.0 0.0 40.7 40.7 0.0 40.7 40.7CA 333.74 0.0 0.0 0.0 10.7 10.7 0.0 10.7 10.7CO 43.58 1.4 5.2 6.6 2.3 8.8 0.0 2.3 8.8CT 32.96 25.6 22.8 48.4 26.1 74.5 0.3 26.4 74.7DE 7.83 0.0 0.0 0.0 20.3 20.3 1.8 22.1 22.1DC 5.32 0.0 0.0 0.0 0.0 0.0 0.0 0.0 0.0FL 158.62 0.0 0.0 0.0 9.3 9.3 0.0 9.3 9.3GA 82.40 0.4 0.0 0.4 16.2 16.6 0.0 16.2 16.6HI 12.91 0.0 0.0 0.0 0.0 0.0 0.0 0.0 0.0ID 14.27 0.0 0.0 0.0 7.2 7.2 0.0 7.2 7.2IL* 121.98 0.0 0.0 0.0 24.1 24.1 0.0 24.1 24.1IN 61.76 0.0 0.0 0.0 9.2 9.2 0.6 9.7 9.7IA 29.22 0.9 0.0 0.9 22.7 23.6 2.2 24.9 25.9KS 27.33 0.0 0.0 0.0 13.5 13.5 0.0 13.5 13.5KY 40.59 0.0 1.0 1.0 14.1 15.1 0.0 14.1 15.1LA 45.02 1.5 0.0 1.5 37.6 39.1 0.0 37.6 39.1ME 12.65 0.0 2.6 2.6 0.0 2.6 0.0 0.0 2.6MD 53.75 0.0 0.0 0.0 7.4 7.4 0.0 7.4 7.4MA 62.86 11.5 4.3 15.8 18.5 34.3 0.0 18.5 34.3MI 97.57 0.0 0.0 0.0 1.8 1.8 0.0 1.8 1.8MN 49.36 8.5 0.0 8.5 0.5 9.1 0.0 0.5 9.1MS 28.86 9.7 20.4 30.1 48.1 78.2 0.0 48.1 78.2MO 56.58 2.7 1.1 3.7 21.7 25.4 1.1 22.8 26.5MT 9.79 0.0 0.0 0.0 11.0 11.0 0.0 11.0 11.0NE 17.39 0.0 0.0 0.0 21.8 21.8 0.0 21.8 21.8NV 20.07 0.0 0.0 0.0 5.4 5.4 0.0 5.4 5.4NH 12.53 0.5 0.0 0.5 0.0 0.5 0.0 0.0 0.5NJ 83.06 0.0 0.0 0.0 38.2 38.2 DNF DNF DNFNM 19.59 7.6 0.0 7.6 0.0 7.6 0.0 0.0 7.6NY 182.07 11.9 29.2 41.2 12.5 53.6 DNF DNF DNFNC 80.75 0.0 0.1 0.1 22.7 22.9 1.1 23.9 24.0ND 6.70 0.0 0.0 0.0 22.2 22.2 0.0 22.2 22.2OH 114.23 0.0 0.0 0.0 16.2 16.2 0.0 16.2 16.2OK 34.37 0.0 0.0 0.0 10.9 10.9 0.0 10.9 10.9OR 35.30 4.0 0.0 4.0 1.4 5.4 0.0 1.4 5.4PA 122.67 0.0 0.0 0.0 12.6 12.6 0.0 12.6 12.6RI 9.97 28.3 4.5 32.8 0.0 32.8 0.0 0.0 32.8SC 39.56 0.0 0.0 0.0 24.9 24.9 0.0 24.9 24.9SD 7.96 0.0 0.0 0.0 21.4 21.4 1.3 22.6 22.6TN 58.67 0.0 0.0 0.0 12.6 12.6 1.4 14.0 14.0TX 209.96 0.0 0.0 0.0 23.8 23.9 0.0 23.8 23.9UT 23.51 0.0 0.0 0.0 9.8 9.8 0.0 9.8 9.8VT 6.23 0.0 0.0 0.0 0.0 0.0 0.2 0.2 0.2VA 71.60 0.0 0.0 0.0 22.5 22.5 DNF DNF DNFWA 60.70 1.9 0.0 1.9 16.8 18.7 0.0 16.8 18.7WV 18.42 0.0 0.0 0.0 0.0 0.0 1.0 1.0 1.0WI 54.24 0.0 0.0 0.0 14.5 14.5 0.0 14.5 14.5WY 5.47 0.0 0.0 0.0 17.4 17.4 0.0 17.4 17.4
US Total 2,814.41 2.0 2.6 4.6 15.2 19.8 0.1 15.4 20.0
DNF = did not furnish
Population (100,000)
Psychiatric Facilities
Total Large (16+)
FacilitiesAll State Settings

11
Table 1.6 Average Daily Populationof Persons with ID/DD in Large StateID/DD and Psychiatric Facilities per100,000 of the General Population,1950-2003
Figure 1.2 U.S. Trends in Average Daily Residents with ID/DD in Large StateID/DD and Psychiatric Facilities per 100,000 of the General Population, 1950-
2003
tions and in percentage rates of decline. Figure 1.3shows the total size of reductions in average dailypopulations (ADP) in 3-year periods beginning in stateFiscal Year (FY) 1968, the first year in which U.S.state institution populations decreased, through FY2003. It also shows the decreases in ADP duringeach 3-year period as a percentage of the populationon the immediately preceding year. As shown thetotal reduction in state institution ADP in the FY 2001-2003 period (4,583 people) was by far the smallest ofany 3-year period since state institution populationsbegan to decrease in FY 1968; barely one-half(58.0%) of the next smallest total for a 3-year period(7,907 in FY 1968-1970). As a proportional decrease,the FY 2001-2003 decrease (9.6%) was smaller thanany period since FY 1971-1973 (6.9%), 30 years ear-lier. Of the individual years in the FY 2001-2003 pe-riod, FY 2003 had the smallest decrease in institutionresidents. The FY 2003 decrease in ADP of stateinstitutions (1,054) was the smallest since 1968 (960)and the smallest proportional decrease (2.4%) of anyyear since FY 1972 (1.6%).
Movement of Residents in Large State ID/DD Facilities in FY 2003
Table 1.7 presents statistics on the admissionsdischarges, and deaths among residents of large stateID/DD facilities during FY 2003. Admissions,discharges, and deaths are also indexed as a
Year
US Population (100,000) ID/DD
1950 1,518.68 81.85 15.75 97.601955 1,650.69 84.10 21.20 105.301960 1,799.79 90.97 20.91 111.881965 1,935.26 96.79 19.03 115.821967 1,974.57 98.58 17.14 115.721970 2,039.84 91.55 15.63 107.181973 2,113.57 82.22 14.31 96.531980 2,272.36 57.69 4.14 61.831984 2,361.58 47.14 2.16 49.301986 2,387.70 41.96 1.30 43.261989 2,482.43 35.73 0.65 36.381990 2,487.09 33.93 0.58 34.511991 2,521.77 31.83 0.63 32.461992 2,540.02 29.58 0.61 30.191993 2,559.50 27.93 0.68 28.611994 2,579.04 26.24 0.63 26.871995 2,634.37 24.18 0.52 e 24.701996 2,659.99 22.53 0.40 e 22.931997 2,711.21 20.71 0.33 e 21.041998 2,708.09 19.37 0.37 e 19.741999 2,726.91 18.37 0.35 e
118.72
1
2000 2,746.34 17.01 0.17 e1 17.181
2001 2,769.03 16.23 0.20 e2
16.432
2002 2,791.72 15.47 0.09 e2 15.562
2003 2,814.41 15.38 0.14 3 15.523
1 does not include NY psychiatric facilities2
does not include NY or NJ psychiatric facilities3
does not include NJ, NY, VA psychiatric facilities
Psychiatric Total
0
20
40
60
80
100
120
140
1950
1955
1960
1965
1970
1975
1980
1985
1990
1995
2000
2001
2002
2003
Year
Pop
ulat
ion
per
100,
000
ID/DD Psychiatric

12
Table 1.7 Movement of Persons with ID/DD In and Out of Large State ID/DDFacilities in Fiscal Year 2003 by State
State Total Total TotalAL 377 18 4.8 115 30.5 9 2.4 443 337 -23.9AK NA 0 NA NA NA NA NA NA NA NAAZ 149 0 0.0 1 0.7 8 5.4 154 145 -5.8AR 1,123 18 1.6 69 6.1 13 1.2 1,165 1,101 -5.5CA 3,606 167 4.6 203 5.6 77 2.1 3,673 3,560 -3.1CO 104 17 16.3 16 15.4 2 1.9 95 99 4.2CT 887 9 1 1.0 6 1 0.7 18 1 2.0 883 862 -2.4DE 170 1 0.6 13 7.6 11 6.5 182 159 -12.6DC NA 0 NA NA NA NA NA NA NA NAFL 1,521 48 2 3.2 97 2 6.4 26 2 1.7 1,514 1,481 -2.2GA 1,333 86 6.5 135 10.1 11 0.8 1,365 1,331 -2.5HI NA 0 NA NA NA NA NA NA NA NAID 104 19 18.3 22 21.2 2 1.9 106 103 -2.8IL 2,952 339 11.5 193 6.5 42 1.4 2,804 2,934 4.6IN 612 23 e 3.8 86 e 14.1 7 e 1.1 640 566 -11.6IA 672 55 8.2 63 9.4 16 2.4 672 664 -1.2KS 368 20 5.4 18 4.9 9 2.4 376 369 -1.9KY 543 32 5.9 82 15.1 7 1.3 601 572 -4.8LA 1,682 44 2.6 87 5.2 22 1.3 1,753 1,693 -3.4ME NA 0 NA NA NA NA NA NA NA NAMD 421 21 5.0 52 12.4 7 1.7 434 396 -8.8MA 1,155 26 2.3 24 2.1 38 3.3 1,200 1,164 -3.0MI 164 51 31.1 54 32.9 3 1.8 173 173 0.0MN 33 14 42.4 30 90.9 0 0.0 41 25 -39.0MS 1,378 82 6.0 55 4.0 25 1.8 1,388 1,389 0.1MO 1,247 67 5.4 86 6.9 21 1.7 1,267 1,227 -3.2MT 115 9 7.8 21 18.3 2 1.7 122 108 -11.5NE 386 19 4.9 21 5.4 11 2.8 392 379 -3.3NV 116 0 0.0 23 19.8 0 0.0 131 108 -17.6NH NA 0 NA NA NA NA NA NA NA NANJ 3,218 58 1.8 107 3.3 78 2.4 3,296 3,169 -3.9NM NA 0 NA NA NA NA NA NA NA NANY 2,261 165 7.3 145 6.4 32 1.4 2,255 2,267 0.5NC 1,863 18 1.0 30 1.6 43 2.3 1,888 1,837 -2.7ND 147 19 12.9 11 7.5 5 3.4 146 149 2.1OH 1,893 93 4.9 132 7.0 45 2.4 1,934 1,854 -4.1OK 366 31 8.5 10 2.7 4 1.1 359 376 4.7OR 50 5 10.0 4 8.0 0 0.0 49 50 0.0PA 1,577 5 0.3 87 5.5 42 2.7 1,666 1,545 -7.3RI NA 0 NA NA NA NA NA NA NA NASC 1,002 27 2.7 17 1.7 42 4.2 1,018 986 -3.1SD 183 36 19.7 55 30.1 0 0.0 189 170 -10.1TN 758 3 0.4 35 4.6 21 2.8 792 739 -6.7TX 5,011 214 4.3 162 3.2 114 2.3 5,062 5,000 -1.2UT 230 9 3.9 6 2.6 5 2.2 233 231 -0.9VT NA 0 NA NA NA NA NA NA NA NAVA 1,581 95 6.0 107 6.8 25 1.6 1,657 1,613 -2.7WA 1,043 153 14.7 184 17.6 20 1.9 1,072 1,021 -4.8WV NA 0 NA NA NA NA NA NA NA NAWI 791 0 0.0 11 1.4 8 1.0 802 788 -1.7WY 97 1 1.0 4 4.1 2 2.1 100 95 -5.0
US Total 43,289 2,117 4.9 2,679 6.2 873 2.0 44,092 42,835 -2.91 6 of 7 settings with 91.6% of large ID/DD facilities' residents2 5 of 7 settings with 89.5% of large ID/DD facilities' residents
% Average Daily
Population
Discharges
% Average Daily
Population
Deaths
7/1/02 6/30/03 % Change
Residents
Average Daily
Population
% Average Daily
Population
Admissions

13
Figure 1.3 Decreases in State Institution Average Daily Populations in Three-Year Periods 1968-2003
7,907
18,791
13,973
12,596 11,932
8,149
4,583
12,968 13,089
15,519
11,313
20,821
4.1%
6.9%
10.8%
13.4%
10.4%
12.9%
15.7%
17.6%
14.6%
9.6%12.5%
12.4%
01,0002,0003,0004,0005,0006,0007,0008,0009,000
10,00011,00012,00013,00014,00015,00016,00017,00018,00019,00020,00021,00022,000
1968-1970
1971-1973
1974-1976
1977-1979
1980-1982
1983-1985
1986-1988
1989-1991
1992-1994
1995-1997
1998-2000
2001-2003
Year
Pop
ulat
ion
Dec
reas
es
0.0%1.0%2.0%3.0%4.0%5.0%6.0%7.0%8.0%
9.0%10.0%11.0%12.0%13.0%14.0%15.0%16.0%17.0%18.0%19.0%20.0%21.0%22.0%23.0%24.0%
Percentage Decrease
percentage of the average daily residents of thosefacilities.
Admissions. During FY 2003, a total of 2,117persons with ID/DD were reported admitted to largestate ID/DD residential facilities. This number wasequal to 4.9% of the year’s average daily populationof those same facilities. In addition to the nine statesnot operating large state ID/DD residential facilitiesin FY 2003, three states (Arizona, Nevada andWisconsin) reported no admissions during FY 2003.Nine states reported admissions equaling orexceeding 10% of the year’s average daily population(Colorado, Idaho, Illinois, Michigan, Minnesota, NorthDakota, Oregon, South Dakota and Washington).
Discharges. During FY 2003, a total of 2,679 personswith ID/DD were reported discharged from large stateID/DD residential facilities. Discharges equaled 6.2%of the average daily population of large state ID/DDresidential facilities during the year. Of the 42 statesstill operating large state ID/DD residential facilities,five states (Alabama, Idaho, Michigan, Minnesota, and
South Dakota) reported discharges equal to 20% ormore of their average daily residents.
Deaths. During FY 2003, a total of 873 people withID/DD died while residing in large state ID/DDresidential facilities. Deaths equaled 2.0% of theaverage daily population of the large state ID/DDresidential facilities. The 2003 death rate of 2.0%was within the general range of recent years. Four ofthe 42 states with large state ID/DD facilities reportedno deaths during the year (Minnesota, Nevada,Oregon and South Dakota). Total FY 2003 deaths inlarge state ID/DD residential facilities were 70 morethan in FY 2002.
Longitudinal Movement Patterns in LargeState ID/DD Residential Facilities
From the beginning of this century until the mid-1960s,resident movement statistics of large state ID/DDresidential facilities indicated relatively stablemovement patterns. During that period firstadmissions and discharges both steadily increased,

14
but populations of large state ID/DD facilities grew asfirst admissions substantially outnumbereddischarges. During this same period readmissionsremained relatively low because once placed in a statefacility, people tended to remain there. From 1903 to1967 the annual number of deaths in large state ID/DD facilities increased substantially, but death rates(deaths as a percentage of average daily population)decreased steadily from 4.1% to 1.9%. Table 1.8presents movement patterns over the period 1950-2003.
By the mid-1960s these historical patterns beganto change. In 1965 the number of first admissions tolarge state ID/DD facilities began to decrease, drop-ping below the increasing number of discharges by1968. The number of readmissions increased sub-stantially throughout the 1970s as return to the facilitywas a frequently used solution to problems in com-munity placements. From 1980 to 2002, readmissionswere reduced fairly steadily, but have remained a sub-
stantial, although recently decreasing, proportion oftotal admissions (35.7% in 1991, 30.7% in 1994,28.4% in 1998, 26.7% in 2000 and 27.1% in 2002).From 1980 through 1998, total admissions (first ad-missions and readmissions) remained fairly consis-tently between 2,000 and 3,000 fewer than the num-ber of discharges. In 1999 the difference decreasedto 1,000 and since 2000 has fallen in the range of489 to 636. Between FY2000 and 2003 about one-quarter of all people leaving large public facilities didso through death. In FY2003 deaths constituted24.6% of the combined deaths and discharges.
Distinctions are no longer being made in the an-nual state survey between new admissions and re-admissions because the increasing rates of largestate ID/DD facility closures, consolidations, and resi-dent transfers have made such distinctions less eas-ily obtained from state reporting systems. Table 1.8and Figure 1.4 show that between FY 2002 and FY2003 overall admissions to large state ID/DD facili-ties decreased from 2,149 to 2,117 persons, respec-tively.
In the past 20 years, the number of dischargeshas decreased greatly and by 2003 they were farfewer than the numbers of the 1970s when dischargeswere consistently between 14,000 and 17,000 peryear. In the last 4 years, including FYs 2000 through2003, discharges have remained in a range of about2,400 to 2,800. In 2003 there were 2,679 total dis-charges, 106 fewer than in 2002.
Deinstitutionalization literally connotes a processof discharging people from large residential facilities,but Figure 1.4 shows clearly that it has also encom-passed important successes in reducing placementsinto such facilities. The resident movement patternsshown in Figure 1.4 indicate that this latter “preven-tative” policy (i.e., reducing admissions to large stateID/DD facilities) has actually accounted for relativelymore of the reduction in large state ID/DD facilitypopulations over the past two decades than has thenumber of discharges, although both clearly haveplayed important roles. Figure 1.4 also shows over-all decrease in both admissions and discharges overthe past two decades. Total deaths reported for 2003increased (8.7%) from 2002, with the rate of deaths(deaths during the year as a percentage of averagedaily residents) about the same as the rate of 2002.In 2003, the number of deaths as a percentage ofaverage daily residents was 2.0% as compared with
Table 1.8 Movement Patterns inLarge State ID/DD Residential
Facilities, 1950-2003
Annual
Year Admissions Discharges Deaths
1950 124,304 12,197 6,672 2,7611955 138,831 13,906 5,845 2,6981960 163,730 14,182 6,451 3,1331965 187,305 17,225 9,358 3,5851967 194,650 14,904 11,665 3,6351970 186,743 14,979 14,702 3,4961974 168,214 e 18,075 16,807 2,9131978 143,707 e 10,508 15,412 2,1541980 128,058 11,141 13,622 2,0191984 111,333 6,123 8,484 1,5551986 100,190 6,535 9,399 1,3221989 88,691 5,337 6,122 1,1801990 84,732 5,034 6,877 1,2071991 80,269 3,654 5,541 1,0771992 75,151 4,349 6,316 1,0751993 71,477 2,947 5,536 1,1671994 67,673 2,243 5,490 9951995 63,697 2,338 5,337 1,0681996 59,936 2,537 4,652 9961997 56,161 2,467 4,495 7771998 52,469 2,414 4,761 9081999 50,094 2,317 3,305 9272000 47,872 1,936 2,425 9152001 46,236 1,927 2,433 8972002 44,598 2,149 2,785 8032003 43,289 2,117 2,679 873e = estimate
Average Daily
Population

15
Figure 1.4 Movement Patterns in Large State ID/DD Facilities, 1950-2003
1.8% in 2002, 2.0% in 2001, 1.9% in 2000, 1.9% in1999, 1.7% in 1998, 1.4% in 1997, 1.7% in 1996, and1.7% in 1995.
Annual Per Resident Expenditures
Fiscal Year 2003 per resident expenditures for allresidential settings. Table 1.9 summarizes theexpenditures for state ID/DD residential settings with1-6, 7-15, and 16 or more residents. Data on theaverage daily expenditures for large state ID/DDresidential facilities were reported by all states. Allstates with state community ID/DD settings exceptConnecticut reported an average daily expenditureper resident for those settings.
Average per resident daily expenditures in largestate ID/DD residential facilities varied considerablyacross the United States with a national average of$359.24. Nineteen states reported costs in large stateID/DD residential facilities that exceeded $400.00 perday in FY 2003 (Alabama, California, Colorado, Con-necticut, Idaho, Indiana, Massachusetts, Michigan,Minnesota, Montana, New Jersey, New York, Okla-homa, Oregon, Pennsylvania, Tennessee, Washing-ton, Wisconsin, and Wyoming). Among the 42 statesoperating large state ID/DD residential facilities in FY2003, 23 reported annual expenditures per residentabove the national annual average of $131,122.88per person per year. Mississippi reported the lowestaverage daily expenditure per resident for large stateID/DD residential facilities ($218.31 per day or $79,683per year) and Minnesota the highest ($799.00 per dayor $291,635 per year).
Between FYs 2002 and 2003 the average dailyexpenditure per resident of large state ID/DD resi-dential facilities increased by about $14.73 (4.3%).
This increase in per person expenditures was muchless than the average of just less than 6% per yearsince FY 1990. Adjusted for changes in the Com-mon Price Index the FY2003 increase was 2.0%.Increases in expenditures in recent years contrast withthe 1980s in which expenditure increases for largestate ID/DD residential facilities averaged about 11.6%per year, in part because fewer and fewer residentswere sharing the fixed costs of a stable number offacilities. Closure of some 137 large state ID/DD resi-dential facilities and special ID/DD units between 1988and 2003 and consolidation of other facilities contrib-uted to reducing the effects of these fixed costs inaverage per resident expenditures. (These closuresand consolidations are described in Chapter 2.)
National average expenditures for state commu-nity ID/DD residential settings were $346.99 per resi-dent per day in settings of 6 or fewer residents, and$374.56 in settings with 7-15 residents. Nationally,the average per diem of state ID/DD residential set-tings with 1-6 residents was less, and that of settingswith 7-15 residents was more, than that of large statefacilities with 16 or more residents. Of the fourteenstates reporting both small and large state ID/DD set-ting expenditures, the average per diem expendituresin large state ID/DD facilities were higher than theaverage per diem expenditures in the state commu-nity settings in eleven states. North Carolina, Oregonand Texas reported higher per diem costs in commu-nity settings.
Longitudinal trends of large state facility ex-penditures. The per person expenditures for resi-dents with ID/DD of large state ID/DD facilities haveincreased dramatically since 1950, when the aver-
0
5,000
10,000
15,000
20,000
25,000
30,000
35,000
40,000
'50 '55 '60 '65 '70 '75 '80 '85 '90 '95 '00 '01 '02 '03Year
Res
iden
ts
Deaths
Discharges
Admissions

16
Table 1.9 Average per Resident DailyExpenditures in State ID/DD Settingsin Fiscal Year 2003 by State
age per person annual expenditure for care was$745.60. As shown in Table 1.10, even in dollarsadjusted to 2003 dollars to control for changes in theConsumer Price Index over this period, average ex-penditures for care in 2003 ($131,122.88 per year)were 22 times as great as in 1950.
Figure 1.5 shows the trends in large state ID/DDfacility expenditures in both actual and adjusted dol-lars ($1=2003) between 1950 and 2003. In terms of2003 “real dollar” equivalents, the average annual perresident expenditures in large state ID/DD facilitiesincreased from about $5,962 to $131,123 during the53 year period. That rate of increase represents anannual, after inflation, compounded growth of 5.8%per person per year. However, in the 1990s and be-yond the rate increases have slowed substantially. Be-tween FYs 1990 and 2003 states reported a 30.1%real dollar increase in large state ID/DD facility ex-penditures, an average of 2.3% annually. This com-pares to an average real dollar increase of 8.1% peryear during the 1980’s.
Major factors in reducing the rate of growth of largestate ID/DD facility expenditures have been the largenumber of facility closures (see Chapter 2 of this re-port), greater control of expenditures for public insti-tutions in state human service budgeting, and a re-duction of the effects of other factors that had beencontributing to the steady cost increases such as thegrowing proportion of persons with severe impair-ments. For example, between 1977 and 1991 theproportion of residents with profound mental retarda-tion increased from 45.6% to 64.8%, but from 1991to 2002 it actually decreased slightly to 62.3%.
In addition, the upward pressure on expendituresof the Intermediate Care Facility for Persons with Men-tal Retardation (ICF-MR) program has largely abatedas virtually all state facility units have been certified.The ICF-MR program (described in Section III) offersfederal cost-sharing through Medicaid of 50-80% ofstate facility expenditures under the condition that fa-cilities meet specific program, staffing, and physicalplant standards. The ICF-MR program has signifi-cantly contributed to and cushioned the impact of rap-idly increasing large state facility costs. For example,in 1970, one year before enactment of the ICF-MRprogram, the average annual per resident real dollar($1=2003) expenditure in large state ID/DD facilitieswas about $21,966. By 1977, more than 70% of alllarge state facilities were certified as ICFs-MR and
StateAL NA NA 467.02AK NA NA NAAZ 177.00 e 204.00 e 297.00 e
AR NA NA 225.32CA NA NA 489.00C O 348.33 348.33 510.69CT DNF DNF 481.54DE NA NA 400.00DC NA NA NAFL NA NA 315.77GA 211.36 NA 322.92HI NA NA NAID NA NA 525.35IL 1 NA NA 332.39IN NA NA 483.07IA DNF NA 355.20KS NA NA 339.00KY NA 357.66 369.34LA 171.00 NA 261.00ME NA 300.58 NAMD NA NA 349.22MA 365.86 275.86 526.88MI NA NA 499.30MN 295.73 NA 799.00MS 61.94 e 212.97 e 218.31 e
MO 192.02 180.57 280.98MT NA NA 424.00NE NA NA 270.00NV NA NA 375.00NH 516.00 NA NAN J NA NA 400.54NM 209.89 NA NANY 401.86 401.91 559.46NC NA 695.00 332.00ND NA NA 362.55OH NA NA 293.91OK NA NA 405.00OR 678.00 NA 629.50PA NA NA 450.39RI 390.92 381.24 NASC NA NA 299.83SD NA NA 276.86TN NA NA 641.72TX 265.77 NA 252.83UT NA NA 350.00VT NA NA NAVA NA NA 320.00W A 260.63 NA 426.11W V NA NA NAW I NA NA 477.00 e
W Y NA NA 536.00 e
US Weighted Average 346.99 2 374.56 3 359.24 e
DNF = did not furnish e = estimate1
FY 2001 data2 does not include 843 in CT and 27 in IA
3 does not include 323 in CT
NA = not applicable
1-6 Residents
7-15 Residents
16+ Residents
State ID/DD Facilities ($)

17
Figure 1.5 Average Annual Per Resident Expenditures in Large State ID/DDResidential Facilities, 1950-2003
Table 1.10 Average Annual PerResident Expenditures in Large StateID/DD Residential Facilities, 1950-2003
average annual real dollar costs had more thandoubled to $48,921, a 123% increase in 7 years. Be-tween 1970 and 2003, large state ID/DD residentialfacilities’ real dollar expenditures grew by 496.9%, butthe states’ share of the increased real dollar expendi-tures for large state facilities was less than one-thirdof the total as the ICF-MR program paid an averageof 57% of large state facility costs that in 1970 werepaid exclusively by the states. Court decisions andsettlement agreements also had significant impact onlarge state facility expenditures with their frequent re-quirements for upgrading staffing levels, adding pro-grams, improving physical environments, and, fre-quently, reducing resident populations.
Year Cost ($) Cost ($1=2003)1950 745.60 5,961.601955 1,285.50 8,804.791960 1,867.70 11,600.621965 2,361.08 13,807.491967 2,965.33 16,293.021970 4,634.85 21,966.111974 9,937.50 37,080.221977 16,143.95 48,921.061980 24,944.10 55,678.791982 32,758.75 62,397.621984 40,821.60 72,250.621986 47,555.85 79,791.691988 57,221.05 88,990.751989 67,200.15 99,703.491990 71,660.45 100,788.261991 75,051.30 101,283.811992 76,945.65 100,846.201993 81,453.40 103,630.281994 82,256.40 102,055.091995 85,760.40 103,450.421996 92,345.46 108,259.621997 98,560.95 112,899.141998 104,098.00 117,492.101999 107,536.02 118,693.182000 113,863.28 121,648.802001 121,406.09 126,070.712002 125,746.15 128,574.802003 131,122.88 131,122.88
0
20,000
40,000
60,000
80,000
100,000
120,000
140,000
'50 '55 '60 '65 '70 '75 '80 '85 '90 '95 '00 '01 '02 '03
Year
Do
llars
Cost ($) Cost ($1 = 2003)

18

19
This chapter summarizes information on each of thelarge (i.e., 16 or more residents) state ID/DD facilitiesand special ID/DD units in psychiatric facilities thathave operated since 1960. It includes their presentand projected operational status, populations, andcosts. Responses were obtained from 188 of 189surveyed facilities.
Large State ID/DD Residential FacilitiesOperating and Closing, 1960-2004
Table 1.11 presents a state-by-state breakdown ofthe total number of large state ID/DD facilities andID/DD units operated since 1960, and the numberclosed and projected to be closed between 1960 andDecember 2004. Since 1960, 38 states have closedone or more facilities to a total of 168 closures. Ninestates (Alaska, Hawaii, Maine, New Hampshire, NewMexico, Rhode Island, Vermont, and West Virgina)with a total of 22 large state ID/DD residential facilitieshave closed all of them. Twelve states with a total of38 large state ID/DD residential facilities have neitherclosed a facility since 1960 nor have plans to do so.More than two-thirds (26) of the facilities operated inthese 12 states are located in Arkansas, Louisiana,Mississippi, and South Carolina.
Chapter 2
Large State ID/DD Residential Facilities, 1960-2003,Individual Facility Populations, Per Diem Costs, and Closuresin 2003 and Projected in 2004
Kathryn Coucouvanis, Robert W. Prouty, K. Charlie Lakin
Total Large State ID/DD Facility Closures
Figure 1.6 shows the number of large state ID/DDfacilities and ID/DD units in large state facilitiesprimarily serving other populations that have closedsince 1960, including projected closures by the endof 2004. As shown, between 1960 and 1971 onlytwo large state ID/DD facilities were closed in theUnited States, an average of 0.18 per year. Between1972-1975 there were a total of five closures, anaverage of 1.25 per year. There were five closures inthe period between 1976-1979, an average of 1.25per year. There were 14 closures between 1980-1983, an annual average of 3.5 per year. Between1984-1987, there were 11 closures, an average of2.75 per year. In the years 1988-1991, closuresincreased rapidly to a total of 35, an average of 8.75per year. Closures averaged 12.5 per year between1992-1995 (50 total). There were 31 closures in theyears 1996-1999, an average of 7.75 per year.Between 2000 and 2003, a total of 17 closuresaveraged 4.25 per year. In 2003 three facilities wereclosed (two facilities in Alabama and one in Montana)after June 30, 2003. Three facilities (one each inAlabama, Massachusetts, and Missouri) are currentlyprojected to be closed by the end of 2004.
Figure 1.6 Average Annual Closures and Planned Closures of Large State ID/DD Facilities, 1960-2004
3
0.181.25 1.25
3.52.75
8.75
12.5
7.75
4.25
0
2
4
6
8
10
12
14
'60-'71 '72-'75 '76-'79 '80-'83 '84-'87 '88-'91 '92-'95 '96-'99 '00-'03 '04
Year
Fac
ilitie
s/U
nits
*
*Planned Closures
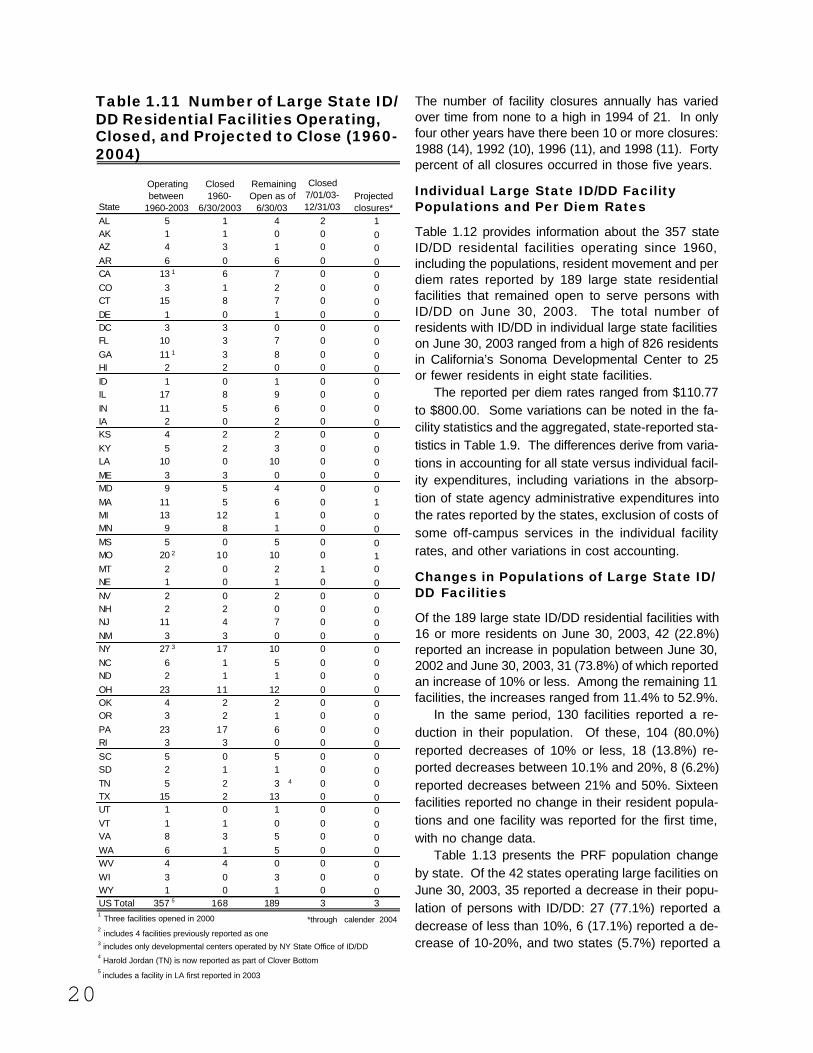
20
Table 1.11 Number of Large State ID/DD Residential Facilities Operating,Closed, and Projected to Close (1960-2004)
State
Closed 7/01/03-12/31/03
AL 5 1 4 2 1AK 1 1 0 0 0AZ 4 3 1 0 0AR 6 0 6 0 0CA 13 1 6 7 0 0CO 3 1 2 0 0CT 15 8 7 0 0DE 1 0 1 0 0DC 3 3 0 0 0FL 10 3 7 0 0GA 11 1 3 8 0 0HI 2 2 0 0 0ID 1 0 1 0 0IL 17 8 9 0 0IN 11 5 6 0 0IA 2 0 2 0 0KS 4 2 2 0 0KY 5 2 3 0 0LA 10 0 10 0 0ME 3 3 0 0 0MD 9 5 4 0 0MA 11 5 6 0 1MI 13 12 1 0 0MN 9 8 1 0 0MS 5 0 5 0 0MO 20 2 10 10 0 1MT 2 0 2 1 0NE 1 0 1 0 0NV 2 0 2 0 0NH 2 2 0 0 0NJ 11 4 7 0 0NM 3 3 0 0 0NY 27 3 17 10 0 0NC 6 1 5 0 0ND 2 1 1 0 0OH 23 11 12 0 0OK 4 2 2 0 0OR 3 2 1 0 0PA 23 17 6 0 0RI 3 3 0 0 0SC 5 0 5 0 0SD 2 1 1 0 0TN 5 2 3 4 0 0TX 15 2 13 0 0UT 1 0 1 0 0VT 1 1 0 0 0VA 8 3 5 0 0WA 6 1 5 0 0WV 4 4 0 0 0WI 3 0 3 0 0WY 1 0 1 0 0US Total 357 5 168 189 3 31
Three facilities opened in 2000
4 Harold Jordan (TN) is now reported as part of Clover Bottom
5 includes a facility in LA first reported in 2003
3 includes only developmental centers operated by NY State Office of ID/DD
2 includes 4 facilities previously reported as one
*through calender 2004
Projected closures*
Closed 1960-
6/30/2003
Remaining Open as of
6/30/03
Operating between
1960-2003
The number of facility closures annually has variedover time from none to a high in 1994 of 21. In onlyfour other years have there been 10 or more closures:1988 (14), 1992 (10), 1996 (11), and 1998 (11). Fortypercent of all closures occurred in those five years.
Individual Large State ID/DD FacilityPopulations and Per Diem Rates
Table 1.12 provides information about the 357 stateID/DD residental facilities operating since 1960,including the populations, resident movement and perdiem rates reported by 189 large state residentialfacilities that remained open to serve persons withID/DD on June 30, 2003. The total number ofresidents with ID/DD in individual large state facilitieson June 30, 2003 ranged from a high of 826 residentsin California’s Sonoma Developmental Center to 25or fewer residents in eight state facilities.
The reported per diem rates ranged from $110.77to $800.00. Some variations can be noted in the fa-cility statistics and the aggregated, state-reported sta-tistics in Table 1.9. The differences derive from varia-tions in accounting for all state versus individual facil-ity expenditures, including variations in the absorp-tion of state agency administrative expenditures intothe rates reported by the states, exclusion of costs ofsome off-campus services in the individual facilityrates, and other variations in cost accounting.
Changes in Populations of Large State ID/DD Facilities
Of the 189 large state ID/DD residential facilities with16 or more residents on June 30, 2003, 42 (22.8%)reported an increase in population between June 30,2002 and June 30, 2003, 31 (73.8%) of which reportedan increase of 10% or less. Among the remaining 11facilities, the increases ranged from 11.4% to 52.9%.
In the same period, 130 facilities reported a re-duction in their population. Of these, 104 (80.0%)reported decreases of 10% or less, 18 (13.8%) re-ported decreases between 10.1% and 20%, 8 (6.2%)reported decreases between 21% and 50%. Sixteenfacilities reported no change in their resident popula-tions and one facility was reported for the first time,with no change data.
Table 1.13 presents the PRF population changeby state. Of the 42 states operating large facilities onJune 30, 2003, 35 reported a decrease in their popu-lation of persons with ID/DD: 27 (77.1%) reported adecrease of less than 10%, 6 (17.1%) reported a de-crease of 10-20%, and two states (5.7%) reported a

Stat
eL
arge
Sta
te I
D/D
D F
acil
itie
s or
Uni
ts O
pera
ting
196
0-20
03
Yea
r Fa
cilit
y O
pene
dY
ear
Clo
sed
Res
iden
ts
wit
h ID
/DD
on
6/
30/0
3
All
R
esid
ents
on
6/
30/0
3
Ave
rage
D
aily
ID
/DD
R
esid
ents
FY
03
Res
iden
ts
wit
h ID
/DD
on
6/
30/0
2
% +
/-
Cha
nge
6/30
/02-
6/30
/03
Ave
rage
per
D
iem
E
xpen
ditu
res
FY 0
3 ($
)
FY 2
003
Adm
issi
ons/
Rea
dmis
sion
sF
Y 2
003
Dis
char
ges
FY
20
03
Dea
ths
AL
Alb
ert P
. Bre
wer
Dev
. Ctr
. (D
aphn
e)19
7320
0461
616
674
-17.
650
9.11
616
1A
LG
len
Irel
and
II C
tr. (
Tar
rant
Cit
y)19
8619
96A
LW
m. D
. Par
tlow
Dev
. Ctr
. (T
usca
loos
a)19
2315
915
916
919
0-1
6.3
393.
722
344
AL
J.S.
Tar
wat
er D
ev. C
tr. (
Wet
umpk
a)19
7620
0368
687
478
-12.
844
7.24
718
0A
LL
urle
en B
. Wal
lace
Dev
. Ctr
. (D
ecat
ur)
1971
2003
6161
76
108
-43.
561
5.60
347
4A
KH
arbo
rvie
w C
tr. (
Val
dez)
1967
1997
AZ
Ari
zona
Sta
te H
ospi
tal (
Pho
enix
)19
78e
1994
AZ
Ari
zona
Trn
g. P
rogr
am (C
ooli
dge)
1952
145
145
148
154
-5.8
270.
230
08
AZ
Ari
zona
Trn
g. P
rogr
am (
Pho
enix
)19
7319
88A
ZA
rizo
na T
rng.
Pro
gram
(
Tuc
son)
1970
1995
AR
Ale
xand
er H
uman
Dev
. Ctr
. (A
lexa
nder
)19
6811
511
511
411
7-1
.721
5.66
67
2A
RA
rkad
elph
ia H
uman
Dev
. Ctr
. (A
rkad
elph
ia)
1968
130
130
132
134
-3.0
190.
002
101
AR
Boo
nevi
lle H
DC
(B
oone
ville
)19
7313
913
914
115
7-1
1.5
218.
731
026
1A
RC
onw
ay H
DC
(C
onw
ay)
1959
553
553
560
573
-3.5
215.
610
129
AR
Jone
sbor
o H
DC
(Jon
esbo
ro)
1970
113
113
116
121
-6.6
198.
002
82
AR
Sout
heas
t A
rkan
sas
HD
C (
War
ren)
1978
6565
65
641.
622
5.00
33
0C
AA
gnew
s D
ev. C
tr. (
San
Jose
)19
6643
043
045
047
3-9
.161
6.50
733
15C
AC
amar
illo
Ctr
. (C
amar
illo
)19
6819
97C
AC
anyo
n Sp
ring
s (C
athe
dral
Cit
y)20
0039
393
635
11.4
799.
001
110
CA
DeW
itt
Stat
e H
ospi
tal (
Aub
urn)
1946
1972
CA
Fair
view
Dev
. Ctr
. (C
osta
Mes
a)19
5976
376
376
580
5-5
.220
3.00
27
3014
CA
Lan
term
an D
ev. C
tr. (
Pom
ona)
1927
638
638
641
654
-2.4
438.
001
612
CA
Mod
esto
Sta
te H
ospi
tal (
Mod
esto
)19
4719
62C
AN
apa
Stat
e H
ospi
tal F
oren
sic
Uni
t (N
apa)
1995
2000
CA
Pat
ton
Stat
e H
ospi
tal (
Pat
ton)
1963
1982
CA
Port
ervi
lle
Dev
. Ctr
. (Po
rter
vill
e)19
5379
979
981
581
3-1
.741
5.00
78
6622
CA
Sier
ra V
ista
(Y
uba
Cit
y)20
0052
524
034
52.9
630.
002
48
0C
ASo
nom
a D
ev. C
tr. (
Eld
ridg
e)18
9182
682
682
985
2-3
.122
2.00
14
2415
CA
Stoc
kton
Ctr
. (St
ockt
on)
1972
1996
CO
Gra
nd J
unct
ion
Reg
iona
l C
tr. (
Gra
nd J
unct
ion)
1919
6363
62
64-1
.657
5.45
13
101
CO
Pue
blo
Stat
e R
egio
nal
Ctr
. (P
uebl
o)19
3519
88C
OW
heat
Rid
ge R
egio
nal C
tr. (
Whe
atri
dge)
1912
2929
28
290.
033
2.10
46
1C
TB
ridg
epor
t C
tr. (
Bri
dgep
ort)
1965
1981
CT
Cli
ffor
d St
reet
Gro
up H
ome
(Har
tfor
d)19
8219
95C
TJo
hn D
emps
ey C
tr. (
Put
nam
)19
6419
97C
TE
lla
Gra
sso
Ctr
. (St
ratf
ord)
1981
4848
47
464.
345
0.00
20
2C
TL
ower
Fai
rfie
ld C
ount
y C
tr. (
Nor
wal
k)19
7672
727
272
0.0
513.
00D
NF
DN
FD
NF
CT
Har
tfor
d C
tr. (
New
ingt
on)
1965
6365
63
630.
056
5.00
20
0C
TM
ansf
ield
Trn
g. S
choo
l (M
ansf
ield
)19
1719
93C
TM
arti
n H
ouse
Gro
up H
ome
(Nor
wal
k)19
7120
00C
TM
erid
an C
tr. (
Wal
ling
ford
)19
7912
212
223
-47.
871
5.00
10
1e
= es
tim
ate
DN
F=
did
not
furn
ish
Tabl
e 1.
12 L
arge
Sta
te ID
/DD
Fac
ilitie
s, 1
960-
2003
, Inc
ludi
ng F
acili
ty P
opul
atio
ns, P
er D
iem
Exp
endi
ture
s,C
losu
res
and
Res
iden
t Mo
vem
ent b
y F
acili
ty
21

CT
Mys
tic C
tr. (
Gro
ton)
1979
1616
18
22-2
7.3
800.
001
31
CT
New
Hav
en C
tr. (
New
Hav
en)
1962
1994
CT
DM
R N
orth
wes
t C
tr. (
Tor
ring
ton)
1984
4141
41
410.
054
0.00
33
0C
TSe
asid
e C
tr. (
Wat
erfo
rd)
1961
1996
CT
Sout
hbur
y T
rng.
Sch
ool (
Sout
hbur
y)19
4060
560
561
261
9-2
.345
0.00
00
14C
TW
ater
bury
Ctr
. (C
hesh
ire)
1971
1989
DE
Stoc
kley
Ctr
. (G
eorg
etow
n)19
2115
915
917
218
1-1
2.2
411.
951
1311
DC
Bur
eau
of F
ores
t H
aven
(L
aure
l, M
D)
1925
1990
DC
D.C
. Vil
lage
(W
ashi
ngto
n, D
C)
1975
1994
DC
St. E
liza
beth
's H
opit
al (
Was
hing
ton,
DC
)19
8719
94FL
Flor
ida
Stat
e H
ospi
tal (
Cha
ttah
ooch
ee):
1) U
nit 2
9 (M
R D
efen
dant
Pro
gram
)19
7712
41,
104
124
124
0.0
211.
00D
NF
DN
FD
NF
2) U
nit 2
7 (D
uall
y D
iagn
osed
) 19
7630
1,10
43
030
0.0
211.
00D
NF
DN
FD
NF
FLG
ulf
Coa
st C
tr. (
Fort
Mey
ers)
119
6030
330
330
730
7-1
.329
1.01
10
85
FLC
omm
unit
y of
Lan
dmar
k (M
iam
i)19
6620
0512
812
816
219
0-3
2.6
383.
914
660
FL
N.E
. Flo
rida
Sta
te H
ospi
tal
(Mac
Cle
nny)
1981
2000
FLSe
guin
Uni
t-A
lach
ua R
etar
ded
Def
enda
nt C
tr. (
Gai
nesv
ille
)19
8941
414
242
-2.4
238.
001
20
FLSu
nlan
d C
tr. (
Mar
iann
a)19
6133
133
133
233
2-0
.332
1.00
20
813
FL
Sunl
and
Trn
g. C
tr. (
Orl
ando
)19
6019
84F
LSu
nlan
d T
rng.
Ctr
. (T
alla
hass
ee)
1968
1983
FLT
acac
hale
Com
mun
ity
of E
xcel
lenc
e (F
orm
erly
Sun
land
at
Gai
nesv
ille
)19
2151
251
251
247
77.
334
1.98
13
138
GA
Bro
ok R
un (
Atl
anta
)19
6919
97G
AC
entr
al S
tate
Hos
pita
l (M
ille
dgev
ille
)19
6540
640
640
426
851
.326
8.26
21
218
GA
Eas
t Cen
tral
Reg
iona
l Hos
pita
l (A
ugus
ta)
2000
9025
19
099
-9.1
251.
960
01
GA
Geo
rgia
Reg
iona
l Hos
pita
l of
Atla
nta
(Dec
atur
)19
6891
366
91
910.
036
3.00
00
2G
AG
eorg
ia R
egio
nal H
ospi
tal (
Sava
nnah
)20
0040
404
142
-4.8
322.
000
10
GA
Eas
t Cen
tral
Reg
iona
l Hos
pita
l (G
race
woo
d)19
2141
041
042
543
7-6
.230
8.00
116
12G
AN
orth
wes
t Reg
iona
l Hos
pita
l (R
ome)
1971
106
265
106
111
-4.5
321.
000
11
GA
Riv
er's
Cro
ssin
g (A
then
s)D
NF
1996
GA
Ros
e H
aven
1968
2000
GA
Sout
hwes
tern
Sta
te H
ospi
tal (
Tho
mas
vill
e)2
1967
166
240
159
151
9.9
300.
007
105
GA
Wes
t Cen
tral
Geo
rgia
Reg
iona
l Hos
pita
l (C
olum
bus)
2000
3220
53
333
-3.0
366.
000
10
HI
Kul
a H
ospi
tal (
Kul
a)19
8419
94H
IW
aim
ano
Trn
g. S
choo
l an
d H
ospi
tal
(Pea
rl C
ity)
1921
1999
IDId
aho
Stat
e Sc
hool
and
Hos
pita
l (N
ampa
)19
1810
310
310
410
6-2
.852
5.35
19
222
ILA
lton
Men
tal H
ealt
h &
Dev
. Ctr
. (A
lton
)19
1419
94IL
Bow
en C
tr. (
Har
risb
urg)
1966
1982
ILC
hoat
e D
ev. C
tr. (
Ann
a)18
7320
620
621
020
31.
540
1.00
48
43
2IL
Dix
on C
tr. (
Dix
on)
1918
1987
1 incl
udes
16
resi
dent
for
ensi
c un
it
DN
F =
did
not f
urni
sh
2 now
incl
udes
Ros
e H
aven
whi
ch h
as m
oved
on
cam
pus
Stat
eL
arge
Sta
te ID
/DD
Fac
ilitie
s or
Uni
ts O
pera
ting
1960
-200
3
Yea
r Fa
cilit
y O
pene
dY
ear
Clo
sed
Res
iden
ts
with
ID
/DD
on
6/
30/0
3
All
R
esid
ents
on
6/
30/0
3
Ave
rage
D
aily
ID
/DD
R
esid
ents
FY
03
Res
iden
ts
with
ID
/DD
on
6/
30/0
2
% +
/-
Cha
nge
6/30
/02-
6/30
/03
Ave
rage
per
D
iem
E
xpen
ditu
res
FY 0
3 ($
)
FY 2
003
Adm
issi
ons/
Rea
dmis
sion
sFY
200
3 D
isch
arge
s
FY
2003
D
eath
s
22

ILE
lgin
Men
tal
Hea
lth
& D
ev. C
tr. (
Elg
in)
1872
1994
ILFo
x D
ev. C
tr. (
Dw
ight
)19
6516
616
61
69
159
4.4
374.
002
411
5IL
Gal
esbu
rg C
tr.
(Gal
esbu
rg)
1959
1985
ILH
owe
Dev
. Ctr
. (T
inle
y Pa
rk)
1973
459
460
46
440
812
.540
1.00
10
038
10IL
Jack
sonv
ille
Dev
. Ctr
. (Ja
ckso
nvil
le)
1851
262
262
26
024
18.
729
7.84
15
125
ILK
iley
Dev
. Ctr
. (W
auke
gan)
1975
271
271
28
027
8-2
.525
8.00
15
202
ILL
inco
ln D
ev. C
tr. (
Lin
coln
)18
6620
02IL
Lud
eman
Dev
. Ctr
. (Pa
rk F
ores
t)19
7243
643
64
40
428
1.9
309.
012
317
4IL
Mab
ley
Dev
. Ctr
. (D
ixon
)19
8711
511
51
12
9718
.640
1.00
31
120
ILM
eyer
Men
tal H
ealt
h C
tr. (
Dec
atur
)19
6719
93IL
Mur
ray
Dev
. Ctr
. (C
entr
alia
)19
6435
235
23
46
329
7.0
401.
004
214
5IL
Shap
iro
Dev
. Ctr
. (K
anka
kee)
1879
667
667
67
166
10.
926
4.69
41
2610
ILSi
nger
Men
tal
Hea
lth
& D
ev. C
tr. (
Roc
kfor
d)19
6620
02IN
Cen
tral
Sta
te H
ospi
tal (
Indi
anap
olis
)18
4819
95IN
Eva
nsvi
lle
Stat
e H
ospi
tal (
Eva
nsvi
lle)
1890
2817
03
134
0.0
395.
00D
NF
DN
FD
NF
INFo
rt W
ayne
Dev
. Ctr
. (Fo
rt W
ayne
)18
9028
828
82
90
302
-4.6
472.
909
221
INL
ogan
spor
t Sta
te H
ospi
tal (
Log
ansp
ort)
1888
5050
50
476.
437
5.99
66
0IN
Mad
ison
Sta
te H
ospi
tal (
Mad
ison
)19
1028
134
29
37-2
4.3
411.
051
133
INM
usca
tatu
ck D
ev. C
tr. (
But
lerv
ille
)19
2020
0514
714
71
87
196
-25.
059
8.00
340
3IN
New
Cas
tle
Ctr
. (N
ew C
astl
e)19
0719
98IN
Nor
man
Bea
tty
Mem
oria
l Hos
pita
l (W
estv
ille
)19
5119
79IN
Nor
ther
n I
nd
ian
a C
tr. (
Sou
th B
end
)19
6119
98IN
Ric
hmon
d St
ate
Hos
pita
l (R
ichm
ond)
1890
2530
22
530
-16.
731
8.00
55
0IN
Silv
ercr
est
Stat
e H
ospi
tal (
New
Alb
any)
1974
1995
IAG
lenw
ood
Res
ourc
e C
tr. (
Gle
nwoo
d)18
7639
039
03
90
397
-1.8
341.
333
429
12IA
Woo
dwar
d R
esou
rce
Ctr
. (W
oodw
ard)
1917
283
283
28
128
5-0
.737
4.45
21
234
KS
Kan
sas
Neu
rolo
gica
l Ins
titu
te (
Top
eka)
1960
176
176
17
718
3-3
.837
2.00
07
6K
SN
orto
n St
ate
Hos
pita
l (N
orto
n)19
6319
88K
SPa
rson
s St
ate
Hos
pita
l (Pa
rson
s)19
5219
519
51
92
199
-2.0
309.
001
711
4K
SW
infi
eld
Stat
e H
ospi
tal
(Win
fiel
d)18
8419
98K
YC
entr
al S
tate
Hos
pita
l IC
F/M
R (
Lou
isvi
lle)
1873
4040
41
45-1
1.1
490.
001
08
0K
YF
rank
fort
Sta
te H
ospi
tal a
nd S
choo
l (F
rank
fort
)18
6019
73K
YH
azel
woo
d C
tr. (
Lou
isvi
lle)
1971
156
156
16
116
9-7
.746
0.00
820
7K
YO
akw
ood
ICF/
MR
(So
mer
set)3
1972
347
347
36
738
7-1
0.3
298.
101
454
0K
YO
utw
ood
ICF
/MR
(D
awso
n Sp
ring
s)4
1962
1994
LAC
olum
bia
Dev
. Ctr
. (C
olum
bia)
1970
2323
23
24-4
.221
8.18
12
0LA
Ham
mon
d D
ev. C
tr. (
Ham
mon
d)19
6431
731
73
19
322
-1.6
309.
823
53
LAL
eesv
ille
Dev
. Ctr
. (L
eesv
ille)
1964
1919
20
20-5
.022
4.48
67
0LA
Lou
isia
na S
peci
al E
duca
tion
Cen
ter
(Ale
xand
ria)
DN
F75
757
575
NA
174.
252
20
LAM
etro
poli
tan
Dev
. Ctr
. (B
elle
Cha
se)
1967
250
250
25
926
1-4
.226
0.33
38
6LA
Nor
thw
est L
ouis
iana
Dev
. Ctr
. (B
ossi
er C
ity)
1973
170
170
17
818
5-8
.123
9.56
713
3D
NF
= di
d no
t fur
nish
3 incl
udes
4 u
nits
: Sto
necr
eek,
Wil
low
Run
, Rol
ling
Hil
ls, O
ak K
noll
4 Out
woo
d (K
Y)
cont
inue
s to
ope
rate
, but
is
no l
onge
r a
stat
e fa
cili
ty
Stat
eL
arge
Sta
te ID
/DD
Fac
ilitie
s or
Uni
ts O
pera
ting
1960
-200
3
Yea
r Fa
cilit
y O
pene
dY
ear
Clo
sed
Res
iden
ts
with
ID
/DD
on
6/
30/0
3
All
R
esid
ents
on
6/
30/0
3
Ave
rage
D
aily
ID
/DD
R
esid
ents
FY
03
Res
iden
ts
with
ID
/DD
on
6/
30/0
2
% +
/-
Cha
nge
6/30
/02-
6/30
/03
Ave
rage
per
D
iem
E
xpen
ditu
res
FY 0
3 ($
)
FY 2
003
Adm
issi
ons/
Rea
dmis
sion
sFY
200
3 D
isch
arge
s
FY
2003
D
eath
s
23

Stat
eL
arge
Sta
te ID
/DD
Fac
ilitie
s or
Uni
ts O
pera
ting
1960
-200
3
Yea
r Fa
cilit
y O
pene
dY
ear
Clo
sed
Res
iden
ts
with
ID
/DD
on
6/
30/0
3
All
R
esid
ents
on
6/
30/0
3
Ave
rage
D
aily
ID
/DD
R
esid
ents
FY
03
Res
iden
ts
with
ID
/DD
on
6/
30/0
2
% +
/-
Cha
nge
6/30
/02-
6/30
/03
Ave
rage
per
D
iem
E
xpen
ditu
res
FY 0
3 ($
)
FY 2
003
Adm
issi
ons/
Rea
dmis
sion
sFY
200
3 D
isch
arge
s
FY
2003
D
eath
sLA
Pelti
er-L
awle
ss D
ev. C
tr. (
Thi
boda
ux)
1982
4242
434
3-2
.329
2.91
02
0LA
Pine
cres
t Dev
. Ctr
. (Pi
nevi
lle)
1918
613
615
624
635
-3.5
339.
0610
229
LAR
usto
n D
ev. C
tr. (
Rus
ton)
1959
8888
899
2-4
.323
6.26
1115
0LA
Sout
hwes
t Lou
isia
na D
ev. C
tr. (
Iota
)19
7292
9292
99
-7.1
259.
461
81
ME
Aro
osto
ok R
esid
enti
al C
tr. (
Pre
sque
Isl
e)19
7219
95M
EE
lizab
eth
Lev
inso
n C
tr. (
Ban
gor)
1971
1998
ME
Pin
elan
d C
tr. (
Pow
nal)
1908
1995
MD
Jose
ph B
rand
enbu
rg C
tr. (
Cum
berl
and)
1978
2323
252
6-1
1.5
*268
.49
08
0M
DV
icto
r C
ulle
n C
tr. (
Sabi
llasv
ille)
1974
1992
MD
Gre
at O
aks
Ctr
. (Si
lver
Spr
ings
)19
7019
96M
DH
enry
ton
Ctr
. (H
enry
ton)
1962
1985
MD
Hig
hlan
d H
ealt
h F
acil
ity
(Bal
tim
ore)
1972
1989
MD
Hol
ly C
tr. (
Salis
bury
)19
7511
111
111
712
3-9
.842
5.00
010
2M
DPo
tom
ac C
tr. (
Hag
erst
own)
1978
6161
667
0-1
2.9
356.
160
70
MD
Ros
ewoo
d C
tr. (
Ow
ings
Mill
s)18
8721
021
021
321
8-3
.731
6.00
2124
5M
DW
alte
r P
. Car
ter
Ctr
. (B
alti
mor
e)19
7819
90M
AB
elch
erto
wn
Stat
e Sc
hool
(B
elch
erto
wn)
1922
1992
MA
Ber
ry R
egio
nal C
tr. (
Haw
thor
ne)
1967
1994
MA
Pau
l A. D
ever
Dev
. Ctr
. (T
aunt
on)
1946
2001
MA
The
Fer
nald
Ctr
. (W
alth
am)
1848
2004
274
274
280
286
-4.2
572.
490
75
MA
Gla
vin
Reg
iona
l Ctr
. (Sh
rew
sbur
y)19
7462
6262
63
-1.6
459.
382
21
MA
Hog
an R
egio
nal C
tr. (
Haw
thor
ne)
1967
148
148
151
149
-0.7
548.
006
52
MA
Med
fiel
d St
ate
Hos
pita
l (M
edfi
eld)
DN
F19
94M
AM
onso
n D
ev. C
tr. (
Palm
er)
1898
184
184
187
195
-5.6
584.
895
510
MA
Tem
plet
on D
ev. C
tr. (
Bal
dwin
svill
e)D
NF
143
143
145
146
-2.1
390.
681
04
MA
Wor
cest
er S
tate
Hos
pita
l (W
orce
ster
)D
NF
1994
MA
Wre
ntha
m D
ev. C
tr. (
Wre
ntha
m)
1907
324
324
329
335
-3.3
530.
173
212
MI
Alp
ine
Reg
iona
l Ctr
. for
DD
(Gay
lord
)19
6019
81M
IC
aro
Reg
iona
l Men
tal H
ealt
h C
tr. (
Car
o)19
1419
97M
IC
oldw
ater
Reg
iona
l Ctr
. for
DD
(Col
dwat
er)
1935
1987
MI
For
t C
uste
r St
ate
Hom
e (A
ugus
ta)
1956
1972
MI
Hill
cres
t R
egio
nal C
tr. f
or D
D (
How
ell)
1959
1982
MI
Mac
omb-
Oak
land
Reg
iona
l Ctr
. for
DD
(Mt.
Cle
men
s)19
6719
89M
IM
ount
Ple
asan
t Ctr
. (M
ount
Ple
asan
t)19
3717
319
916
417
30.
049
9.30
5154
3M
IM
uske
gon
Reg
iona
l Ctr
. for
DD
(Mus
kego
n)19
6919
92M
IN
orth
ville
Res
iden
tial
Trn
g. C
tr. (
Nor
thvi
lle)
1972
1983
MI
New
berr
y R
egio
nal M
enta
l Hea
lth
Ctr
. (N
ewbe
rry)
1895
1992
MI
Oak
dale
Reg
iona
l Ctr
. for
DD
(L
apee
r)18
9519
92M
IP
lym
outh
Ctr
. for
Hum
an D
evel
opm
ent
(Nor
thvi
lle)
1960
1984
MI
Sout
hgat
e R
egio
nal C
tr. (
Sout
hgat
e)19
7720
02D
NF
= di
d no
t fur
nish
*FY
2002
24

Stat
eL
arge
Sta
te ID
/DD
Fac
ilitie
s or
Uni
ts O
pera
ting
1960
-200
3
Yea
r Fa
cilit
y O
pene
dY
ear
Clo
sed
Res
iden
ts
with
ID
/DD
on
6/
30/0
3
All
R
esid
ents
on
6/
30/0
3
Ave
rage
D
aily
ID
/DD
R
esid
ents
FY
03
Res
iden
ts
with
ID
/DD
on
6/
30/0
2
% +
/-
Cha
nge
6/30
/02-
6/30
/03
Ave
rage
per
D
iem
E
xpen
ditu
res
FY 0
3 ($
)
FY 2
003
Adm
issi
ons/
Rea
dmis
sion
sFY
200
3 D
isch
arge
s
FY
2003
D
eath
sM
NB
rain
erd
Reg
iona
l Hum
an S
ervi
ces
Ctr
. (B
rain
erd)
1958
1999
MN
Far
ibau
lt R
egio
nal
Ctr
. (F
arib
ault
)18
7919
98M
NF
ergu
s F
alls
Reg
iona
l Tre
atm
ent
Ctr
. (F
ergu
s F
alls
)19
6920
00M
NM
N E
xt. T
reat
men
t Opt
ions
Pro
gram
(C
ambr
idge
)19
2525
2533
41
-39.
079
9.00
1430
0M
NM
oose
Lak
e R
egio
nal T
reat
men
t C
tr. (
Moo
se L
ake)
1970
1994
MN
Ow
aton
na S
tate
Hos
pita
l (O
wat
onna
)19
4519
72M
NR
oche
ster
Sta
te H
ospi
tal (
Roc
hest
er)
1968
1982
MN
St. P
eter
Reg
iona
l Tre
atm
ent
Ctr
. (St
. Pet
er)
1968
1996
MN
Wil
lmar
Reg
iona
l Tre
atm
ent
Ctr
. (W
illm
ar)
1973
1996
MS
Bos
wel
l Reg
iona
l Ctr
. (Sa
nato
rium
)19
7615
615
615
513
713
.924
4.25
99
0M
SE
llisv
ille
Stat
e Sc
hool
(E
llisv
ille)
1920
520
520
519
520
0.0
200.
0038
2315
MS
Hud
spet
h R
egio
nal C
tr. (
Whi
tfie
ld)
1974
310
289
287
285
8.8
208.
0025
165
MS
Nor
th M
issi
ssip
pi R
egio
nal C
tr. (
Oxf
ord)
1973
265
265
256
267
-0.7
198.
0014
133
MS
Sout
h M
issi
ssip
pi R
egio
nal C
tr. (
Lon
g B
each
)19
7816
016
015
915
90.
624
1.87
42
2M
OA
lban
y R
egio
nal C
tr. (
Alb
any)
1967
1989
MO
Bel
lefo
ntai
ne H
abili
tatio
n C
tr. (
St. L
ouis
)19
2435
335
336
637
9-6
.926
0.11
1135
2M
OH
anni
bal R
egio
nal C
tr. (
Han
niba
l)19
6719
91M
OH
iggi
nsvi
lle
Hab
ilit
atio
n C
tr. (
Hig
gins
vill
e)19
5613
013
013
013
1-0
.831
9.00
67
5M
OJo
plin
Reg
iona
l C
tr. (
Jopl
in)
1967
1992
MO
Kan
sas
Cit
y R
egio
nal C
tr. (
Kan
sas
Cit
y)19
7019
93M
OK
irks
vill
e R
egio
nal C
tr. (
Kir
ksvi
lle)
1968
1988
MO
Mar
shal
l H
abil
itat
ion
Ctr
. (M
arsh
all)
1901
338
338
340
347
-2.6
283.
7421
266
MO
Mar
shal
l Reg
iona
l Ctr
. (M
arsh
all)
1975
1982
MO
Mid
tow
n H
abil
itat
ion
Ctr
. (St
. Lou
is)*
*31
3131
31
0.0
342.
001
01
MO
Nev
ada
Hab
ilit
atio
n C
tr. (
Nev
ada)
1973
138
138
138
160
-13.
828
3.00
177
3M
ON
orth
wes
t Hab
ilit
atio
n C
tr. (
St. L
ouis
)**
DN
F20
0480
8080
80
0.0
264.
091
10
MO
Pop
lar
Blu
ff R
egio
nal
Ctr
. (P
opla
r B
luff
)19
6819
92M
OR
olla
Reg
iona
l C
tr. (
Rol
la)
1968
1984
MO
Sike
ston
Reg
iona
l C
tr. (
Sike
ston
)19
6919
92M
OSo
uthe
ast M
isso
uri R
esid
enti
al S
ervi
ces
(Pop
lar
Blu
ff)
1992
4646
463
917
.924
6.63
45
0M
OSo
uthe
ast M
isso
uri R
esid
enti
al S
ervi
ces
(Sik
esto
n)19
9239
3939
39
0.0
267.
157
80
MO
Spri
ngfi
eld
Reg
iona
l Ctr
. (Sp
ring
fiel
d)19
6719
90M
OSt
. Cha
rles
Hab
ilit
atio
n C
tr. (
St. L
ouis
)**
5555
555
41.
930
7.79
65
1M
OSo
uth
Cou
nty
Hab
ilit
atio
n C
tr.*
*67
6770
71
-5.6
276.
001
32
MT
Eas
tmon
t Hum
an S
ervi
ces
Ctr
. (G
lend
ive)
1969
2003
2929
313
2-9
.432
1.67
02
1M
TM
onta
na D
evel
opm
enta
l C
tr. (
Bou
lder
)19
0575
7586
90
-16.
740
6.71
616
1N
HL
acon
ia S
tate
Sch
ool a
nd T
rng.
Ctr
. (L
acon
ia)
1903
1991
NH
New
Ham
pshi
re H
ospi
tal,
Bro
wn
Bui
ldin
g (C
onco
rd)
1842
1990
NE
Bea
tric
e St
ate
Dev
. Ctr
. (B
eatr
ice)
1875
379
379
386
392
-3.3
270.
0019
2111
NV
Des
ert
Reg
iona
l C
tr. (
Las
Veg
as)
1975
6969
758
2-1
5.9
351.
8518
241
NV
Sier
ra R
egio
nal
Ctr
. (Sp
arks
)19
7738
3842
49
-22.
443
5.00
718
0
DN
F =
did
not f
urni
sh**
Adm
inis
tere
d by
St.
Lou
is D
D T
reat
men
t Cen
ter
25

Stat
eL
arge
Sta
te ID
/DD
Fac
ilitie
s or
Uni
ts O
pera
ting
1960
-200
3
Yea
r Fa
cilit
y O
pene
dY
ear
Clo
sed
Res
iden
ts
with
ID
/DD
on
6/
30/0
3
All
R
esid
ents
on
6/
30/0
3
Ave
rage
D
aily
ID
/DD
R
esid
ents
FY
03
Res
iden
ts
with
ID
/DD
on
6/
30/0
2
% +
/-
Cha
nge
6/30
/02-
6/30
/03
Ave
rage
per
D
iem
E
xpen
ditu
res
FY 0
3 ($
)
FY 2
003
Adm
issi
ons/
Rea
dmis
sion
sFY
200
3 D
isch
arge
s
FY
2003
D
eath
sN
JC
tr. a
t A
ncor
a (H
amm
onto
n)D
NF
1992
NJ
Gre
en B
rook
Reg
iona
l C
tr. (
Gre
en B
rook
)19
8199
9910
510
7-7
.540
5.00
76
8N
JE
diso
n H
abil
itat
ion
Ctr
. (P
rinc
eton
)19
7519
88N
JH
unte
rdon
Dev
. Ctr
. (C
lint
on)
1969
594
607
600
610
-2.6
383.
008
98
NJ
E.R
. Joh
nsto
ne T
rng.
& R
esea
rch
Ctr
. (B
orde
ntow
n)19
5519
92N
JN
ew L
isbo
n D
ev. C
tr. (
New
Lis
bon)
1914
544
550
561
590
-7.8
431.
0020
4611
NJ
Nor
th J
erse
y D
ev. C
tr. (
Tot
owa)
1928
390
394
394
400
-2.5
435.
0011
614
NJ
Nor
th P
rinc
eton
Ctr
. (P
rinc
eton
)19
7519
98N
JV
inel
and
Dev
. Ctr
. (V
inel
and)
1888
501
501
507
514
-2.5
416.
0017
920
NJ
Woo
dbin
e D
ev. C
tr. (
Woo
dbin
e)19
2151
451
453
454
8-6
.236
6.00
2023
13N
JW
oodb
ridg
e C
tr. (
Woo
dbri
dge)
1965
504
504
517
537
-6.1
381.
002
266
NM
For
t St
anto
n H
ospi
tal a
nd T
rng.
Ctr
. (F
ort
Stan
ton)
1964
1995
NM
Los
Lun
as H
ospi
tal a
nd T
rng.
Ctr
. (L
os L
unas
)19
2919
97N
MV
illa
Sol
ano-
Hag
erm
an R
esid
enti
al S
choo
l (R
osw
ell)
1964
1982
NY
5J.
N. A
dam
s (P
erry
sbur
g)19
6019
93N
YB
ronx
DD
SO (
Bro
nx)
1971
1992
NY
Bro
okly
n D
DSO
(B
rook
lyn)
1972
298
298
300
300
-0.7
600.
4617
181
NY
Bro
ome
DD
SO (
Bin
gham
ton)
1970
281
281
292
295
-4.7
600.
4647
317
NY
Cap
ital
Dis
tric
t DD
SO (
Sche
nect
ady)
619
7348
4848
48
0.0
600.
466
70
NY
Cen
tral
New
Yor
k D
DSO
(Sy
racu
se)7
1851
1998
NY
Cra
ig D
DSO
(So
nyea
)19
3519
88N
YB
erna
rd M
. Fin
eson
Dev
. Ctr
. (H
ills
ide
Cam
pus)
1970
220
220
223
223
-1.3
600.
4616
144
NY
Ber
nard
M. F
ines
on D
ev. C
tr. (
How
ard
Park
Uni
t)19
7020
0562
6265
71
-12.
760
0.46
19
1N
YFi
nger
Lak
es D
DSO
(R
oche
ster
)819
6910
010
089
88
13.6
600.
4653
400
NY
Gou
vern
eur
(New
Yor
k)
1962
1978
NY
Hud
son
Val
ley
DD
SO (
Thi
ells
)19
1120
00N
YL
ong
Isla
nd D
DSO
(C
omm
ack)
1965
1993
NY
Lon
g Is
land
DD
SO (
Mel
vill
e)19
6519
92N
YM
anha
ttan
Ctr
. (N
ew Y
ork)
1972
1992
NY
New
ark
Ctr
. (N
ewar
k)18
7819
91N
YR
ome
Ctr
. (R
ome)
1894
1989
NY
Sam
pson
Sta
te S
choo
l (W
illa
rd)
1961
1971
NY
Stat
en I
slan
d D
DSO
(St
aten
Isl
and)
1987
2424
242
34.
360
0.46
11
0N
YSt
aten
Isl
and
DD
SO (
Stat
en I
slan
d)19
4719
88N
YSu
nmou
nt D
DSO
(Tup
per L
ake)
1965
202
202
202
191
5.8
600.
4654
251
NY
Tac
onic
DD
SO
(Was
saic
)19
3018
318
319
220
0-8
.560
0.46
1423
9N
YV
alat
ie (
Val
atie
)19
7119
74N
YW
estc
hest
er N
Y D
DSO
(T
arry
tow
n)19
7919
88N
YW
este
rn N
Y D
DSO
(W
est S
enec
a)9
1962
115
116
121
124
-7.3
600.
4626
332
8 Fin
ger
Lak
es D
DSO
(N
Y)
was
for
mer
ly M
onro
e D
DSO
9 Wes
tern
New
Yor
k D
DSO
was
for
mer
ly W
est S
enec
a D
DSO
7 Cen
tral
New
Yor
k D
DSO
was
for
mer
ly S
yrac
use
DD
SO
5 The
sta
te o
f N
ew Y
ork
calc
ulat
es a
nd r
epor
ts a
sin
gle
aver
age
per
diem
for
its
larg
e, s
tate
fac
ilit
ies
6 Cap
ital
Dis
tric
t DD
SO (
NY
) w
as f
orm
erly
O.D
. Hec
k D
DSO
26

Stat
eL
arge
Sta
te ID
/DD
Fac
ilitie
s or
Uni
ts O
pera
ting
1960
-200
3
Yea
r Fa
cilit
y O
pene
dY
ear
Clo
sed
Res
iden
ts
with
ID
/DD
on
6/
30/0
3
All
R
esid
ents
on
6/
30/0
3
Ave
rage
D
aily
ID
/DD
R
esid
ents
FY
03
Res
iden
ts
with
ID
/DD
on
6/
30/0
2
% +
/-
Cha
nge
6/30
/02-
6/30
/03
Ave
rage
per
D
iem
E
xpen
ditu
res
FY 0
3 ($
)
FY 2
003
Adm
issi
ons/
Rea
dmis
sion
sFY
200
3 D
isch
arge
s
FY
2003
D
eath
sN
YW
illo
wbr
ook
Stat
e Sc
hool
(St
aten
Isl
and)
1947
1988
NY
Wil
ton
DD
SO (
Wil
ton)
1960
1995
NC
Bla
ck M
ount
ain
Ctr
. (B
lack
Mou
ntai
n)19
8274
136
737
40.
037
8.00
2219
2N
CB
roug
hton
Ctr
. (M
orga
nton
)18
8319
94N
CC
asw
ell
Ctr
. (K
inst
on)
1914
512
512
514
539
-5.0
359.
001
524
NC
Mur
doch
Ctr
. (B
utne
r)19
5757
957
957
659
2-2
.230
6.00
1213
7N
CO
'Ber
ry C
tr. (
Gol
dsbo
ro)
1957
314
314
317
327
-4.0
350.
007
146
NC
Wes
tern
Car
olin
a C
tr. (
Mor
gant
on)
1963
349
349
352
347
0.6
328.
0019
174
ND
Gra
fton
Dev
elop
men
tal
Ctr
. (G
raft
on)
1904
149
149
147
146
2.1
362.
5119
115
ND
San
Hav
en S
tate
Hos
pita
l (D
unse
ith)
1973
1987
OH
App
le C
reek
Dev
. Ctr
. (A
pple
Cre
ek)
1931
172
172
179
183
-6.0
320.
008
73
OH
Ath
ens
Men
tal H
ealt
h &
Dev
. Ctr
. (A
then
s)19
7519
94O
HB
road
view
Ctr
. (B
road
view
Hgh
ts.)
1967
1992
OH
Cam
brid
ge D
ev. C
tr. (
Cam
brid
ge)
1965
107
107
108
114
-6.1
281.
332
62
OH
Cam
brid
ge M
enta
l Hea
lth
Ctr
. (C
ambr
idge
)19
7819
90O
HC
entr
al O
hio
Psy
chia
tric
Hos
pita
l (C
leve
land
)19
78e
1994
OH
Cle
vela
nd C
tr. (
Cle
vela
nd)
1976
1988
OH
Col
umbu
s D
ev. C
tr. (
Col
umbu
s)18
5714
514
514
714
8-2
.031
0.15
54
4O
HD
ayto
n C
tr. (
Day
ton)
1979
1983
OH
Day
ton
Men
tal H
ealt
h C
tr. (
Day
ton)
1978
e19
94O
HG
allip
olis
Dev
. Ctr
. (G
allip
olis
)18
9323
623
622
424
9-5
.232
8.23
1216
9O
HM
assi
llon
Sta
te H
ospi
tal (
Mas
sill
on)
1978
e19
94O
HM
ontg
omer
y D
ev. C
tr. (
Hub
er H
eigh
ts)
1977
102
102
100
99
3.0
279.
3210
61
OH
Mou
nt V
erno
n D
ev. C
tr. (
Mou
nt V
erno
n)19
4822
222
222
422
5-1
.325
3.07
75
5O
HN
orth
wes
t Ohi
o D
ev. C
tr. (
Tol
edo)
1977
156
156
157
162
-3.7
331.
244
73
OH
Ori
ent
Ctr
. (O
rien
t)18
9819
84O
HSo
uthw
est O
hio
Dev
. Ctr
. (B
atav
ia)
1981
107
107
107
110
-2.7
250.
009
93
OH
Spri
ngvi
ew D
evel
opm
enta
l C
tr. (
Spri
ngfi
eld)
1975
8686
838
42.
426
5.96
33
3O
HT
iffi
n D
ev. C
tr. (
Tif
fin)
1975
177
177
185
190
-6.8
315.
0413
272
OH
Tol
edo
Men
tal H
ealt
h C
tr. (
Tol
edo)
1978
e19
94O
HW
arre
nsvi
lle
Dev
. Ctr
. (W
arre
nsvi
lle)
1975
235
235
242
246
-4.5
267.
2212
167
OH
Wes
tern
Res
erve
Psy
chia
tric
Hab
. Ctr
. (N
orth
fiel
d)19
7819
90O
HY
oung
stow
n C
tr. (
Min
eral
Rid
ge)
1980
115
115
117
119
-3.4
301.
866
54
OK
Rob
ert M
. Gre
er M
emor
ial C
tr. (
Eni
d)10
1992
2000
OK
His
son
Mem
oria
l Ctr
. (Sa
nd S
prin
gs)
1964
1994
OK
Nor
ther
n O
klah
oma
Res
ourc
e C
tr. (
Eni
d)1
119
0916
816
815
914
416
.740
5.00
185
3O
KSo
uthe
rn O
klah
oma
Res
ourc
e C
tr. (
Paul
s V
alle
y)19
5220
720
720
820
51.
040
5.00
115
3O
RC
olum
bia
Par
k H
ospi
tal &
Trn
g. C
tr. (
The
Dal
les)
1963
1977
OR
Eas
tern
Ore
gon
Trn
g. C
tr. (
Pend
leto
n)19
6450
5050
49
2.0
629.
505
40
OR
Fai
rvie
w T
rng.
Ctr
. (Sa
lem
)19
0820
00e
= es
tim
ate
10 R
ober
t M. G
reer
(O
K)
cont
inue
s to
ope
rate
but
is n
o lo
nger
a s
tate
fac
ility
11 N
ame
chan
ge.
The
Cen
ter
is s
till
loca
ted
on th
e gr
ound
s of
the
form
er E
nid
Stat
e Sc
hool
(O
K)
27
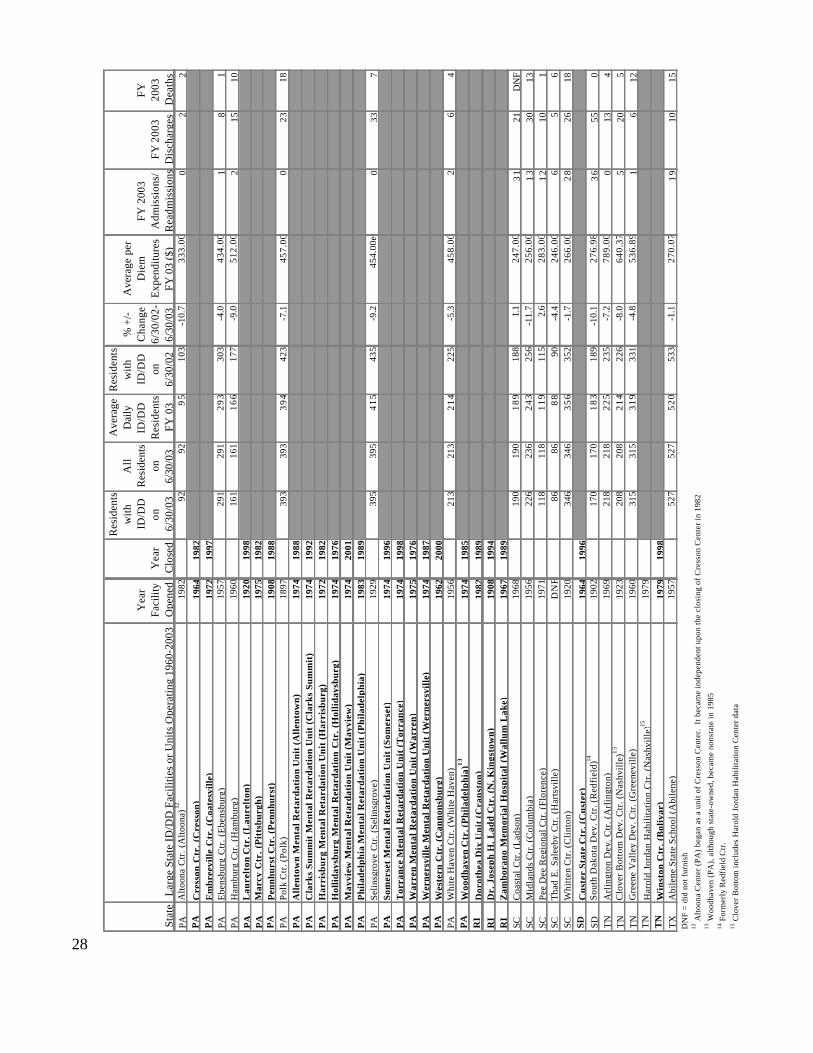
Stat
eL
arge
Sta
te ID
/DD
Fac
ilitie
s or
Uni
ts O
pera
ting
1960
-200
3
Yea
r Fa
cilit
y O
pene
dY
ear
Clo
sed
Res
iden
ts
with
ID
/DD
on
6/
30/0
3
All
R
esid
ents
on
6/
30/0
3
Ave
rage
D
aily
ID
/DD
R
esid
ents
FY
03
Res
iden
ts
with
ID
/DD
on
6/
30/0
2
% +
/-
Cha
nge
6/30
/02-
6/30
/03
Ave
rage
per
D
iem
E
xpen
ditu
res
FY 0
3 ($
)
FY 2
003
Adm
issi
ons/
Rea
dmis
sion
sFY
200
3 D
isch
arge
s
FY
2003
D
eath
sPA
Alto
ona
Ctr
. (A
ltoon
a)12
1982
9292
95
103
-10.
733
3.00
02
2P
AC
ress
on C
tr. (
Cre
sson
)19
6419
82P
AE
mbr
eevi
lle C
tr. (
Coa
tesv
ille)
1972
1997
PAE
bens
burg
Ctr
. (E
bens
burg
)19
5729
129
129
330
3-4
.043
4.00
18
1PA
Ham
burg
Ctr
. (H
ambu
rg)
1960
161
161
166
177
-9.0
512.
002
1510
PA
Lau
relt
on C
tr. (
Lau
relt
on)
1920
1998
PA
Mar
cy C
tr. (
Pit
tsbu
rgh)
1975
1982
PA
Pen
nhur
st C
tr. (
Pen
nhur
st)
1908
1988
PAPo
lk C
tr. (
Polk
)18
9739
339
339
442
3-7
.145
7.00
023
18P
AA
llen
tow
n M
enta
l Ret
arda
tion
Uni
t (A
llen
tow
n)19
7419
88P
AC
lark
s Su
mm
it M
enta
l Ret
arda
tion
Uni
t (C
lark
s Su
mm
it)
1974
1992
PA
Har
risb
urg
Men
tal R
etar
dati
on U
nit
(Har
risb
urg)
1972
1982
PA
Hol
liday
sbur
g M
enta
l R
etar
dati
on C
tr. (
Hol
liday
sbur
g)19
7419
76P
AM
ayvi
ew M
enta
l Ret
arda
tion
Uni
t (M
ayvi
ew)
1974
2001
PA
Phi
lade
lphi
a M
enta
l Ret
arda
tion
Uni
t (P
hila
delp
hia)
1983
1989
PASe
linsg
rove
Ctr
. (Se
linsg
rove
)19
2939
539
541
543
5-9
.245
4.00
e0
337
PA
Som
erse
t M
enta
l Ret
arda
tion
Uni
t (S
omer
set)
1974
1996
PA
Tor
ranc
e M
enta
l Ret
arda
tion
Uni
t (T
orra
nce)
1974
1998
PA
War
ren
Men
tal R
etar
dati
on U
nit
(War
ren)
1975
1976
PA
Wer
ners
vill
e M
enta
l Ret
arda
tion
Uni
t (W
erne
rsvi
lle)
1974
1987
PA
Wes
tern
Ctr
. (C
anno
nsbu
rg)
1962
2000
PAW
hite
Hav
en C
tr. (
Whi
te H
aven
)19
5621
321
321
422
5-5
.345
8.00
26
4P
AW
oodh
aven
Ctr
. (P
hila
delp
hia)
13
1974
1985
RI
Dor
othe
a D
ix U
nit
(Cra
nsto
n)19
8219
89R
ID
r. J
osep
h H
. Lad
d C
tr. (
N. K
ings
tow
n)19
0819
94R
IZ
ambo
rano
Mem
oria
l H
ospi
tal
(Wal
lum
Lak
e)19
6719
89SC
Coa
stal
Ctr
. (L
adso
n)19
6819
019
018
918
81.
124
7.00
31
21D
NF
SCM
idla
nds
Ctr
. (C
olum
bia)
1956
226
236
243
256
-11.
725
6.00
13
3013
SCPe
e D
ee R
egio
nal C
tr. (
Flor
ence
)19
7111
811
811
911
52.
628
3.00
12
101
SCT
had
E. S
alee
by C
tr. (
Har
tsvi
lle)
DN
F86
868
890
-4.4
246.
006
56
SCW
hitt
en C
tr. (
Cli
nton
)19
2034
634
635
635
2-1
.726
6.00
28
2618
SDC
uste
r St
ate
Ctr
. (C
uste
r)19
6419
96SD
Sout
h D
akot
a D
ev. C
tr. (
Red
fiel
d)14
1902
170
170
183
189
-10.
127
6.98
36
550
TN
Arl
ingt
on D
ev. C
tr. (
Arl
ingt
on)
1969
218
218
225
235
-7.2
789.
000
134
TN
Clo
ver
Bot
tom
Dev
. Ctr
. (N
ashv
ille)
15
1923
208
208
214
226
-8.0
640.
375
205
TN
Gre
ene
Val
ley
Dev
. Ctr
. (G
reen
evill
e)19
6031
531
531
933
1-4
.853
6.89
16
12T
NH
arol
d Jo
rdan
Hab
ilita
tion
Ctr
. (N
ashv
ille)
1519
79T
NW
inst
on C
tr. (
Bol
ivar
)19
7919
98T
XA
bile
ne S
tate
Sch
ool (
Abi
lene
)19
5752
752
752
053
3-1
.127
0.07
19
1015
13 W
oodh
aven
(PA
), a
lthou
gh s
tate
-ow
ned,
bec
ame
nons
tate
in 1
985
14 F
orm
erly
Red
fiel
d C
tr.
15 C
love
r B
otto
m in
clud
es H
arol
d Jo
rdan
Hab
ilita
tion
Cen
ter
data
12 A
ltoon
a C
ente
r (P
A)
bega
n as
a u
nit o
f C
ress
on C
ente
r. I
t bec
ame
inde
pend
ent u
pon
the
clos
ing
of C
ress
on C
ente
r in
198
2
DN
F =
did
not f
urni
sh
28

Stat
eL
arge
Sta
te ID
/DD
Fac
ilitie
s or
Uni
ts O
pera
ting
1960
-200
3
Yea
r Fa
cilit
y O
pene
dY
ear
Clo
sed
Res
iden
ts
with
ID
/DD
on
6/
30/0
3
All
R
esid
ents
on
6/
30/0
3
Ave
rage
D
aily
ID
/DD
R
esid
ents
FY
03
Res
iden
ts
with
ID
/DD
on
6/
30/0
2
% +
/-
Cha
nge
6/30
/02-
6/30
/03
Ave
rage
per
D
iem
E
xpen
ditu
res
FY 0
3 ($
)
FY 2
003
Adm
issi
ons/
Rea
dmis
sion
sFY
200
3 D
isch
arge
s
FY
2003
D
eath
sTX
Aus
tin S
tate
Sch
ool (
Aus
tin)
1917
436
436
432
434
0.5
269.
2518
106
TXB
renh
am S
tate
Sch
ool (
Bre
nham
)19
7439
439
439
440
4-2
.527
1.00
1720
9TX
Cor
pus C
hris
ti St
ate
Scho
ol (C
orpu
s Chr
isti)
1970
383
383
378
364
5.2
161.
8325
288
TXD
ento
n St
ate S
choo
l (D
ento
n)19
6065
365
364
966
2-1
.424
0.59
63
10TX
El P
aso
Stat
e C
tr. (E
l Pas
o)19
7314
314
314
514
7-2
.727
1.87
65
4TX
Ft. W
orth
Sta
te S
choo
l (Ft
. Wor
th)
1976
1996
TXLu
bboc
k St
ate
Scho
ol (L
ubbo
ck)
1969
346
346
343
349
-0.9
265.
7725
1612
TXLu
fkin
Sta
te S
choo
l (Lu
fkin
)19
6242
942
941
543
0-0
.224
4.10
2316
7TX
Mex
ia S
tate
Sch
ool (
Mex
ia)
1946
519
519
521
540
-3.9
285.
0028
3017
TXR
ichm
ond
Stat
e Sc
hool
(Ric
hmon
d)19
6852
752
752
853
8-2
.026
9.08
1719
8TX
Rio
Gra
nde
Stat
e C
tr. (H
arlin
gen)
1973
7777
7982
-6.1
110.
777
70
TXSa
n A
ngel
o St
ate
Scho
ol (C
arlsb
ad)
1969
291
291
284
285
2.1
223.
0832
1911
TXSa
n A
nton
io S
tate
Sch
ool (
San
Ant
onio
)19
7829
629
629
029
50.
335
0.86
149
4TX
Tra
vis S
tate
Sch
ool (
Aus
tin)
1961
1996
UT
Uta
h St
ate
Dev
. Ctr.
(Am
eric
an F
ork)
1931
231
231
230
234
-1.3
350.
009
65
VT
Bra
ndon
Trn
g. S
choo
l (B
rand
on)
1915
1993
VA
Cen
tral V
irgin
ia T
rng.
Ctr.
(Lyn
chbu
rg)
1911
598
598
607
615
-2.8
312.
9116
1712
VA
Eas
tern
Sta
te H
ospi
tal (
Will
iam
sbur
g)D
NF
1990
VA
Nor
ther
n V
irgin
ia T
rng.
Ctr.
(Fai
rfax
)19
7319
019
019
119
00.
043
1.00
42
4V
ASo
uthe
aste
rn V
irgin
ia T
rng.
Ctr.
(Che
sape
ake)
1975
198
198
198
192
3.1
273.
4010
92
VA
Sout
hsid
e V
irgin
ia T
rng.
Ctr.
(Pet
ersb
urg)
1939
391
391
387
405
-3.5
414.
259
206
VA
Sout
hwes
tern
Sta
te H
ospi
tal (
Mar
ion)
1887
1988
VA
Sout
hwes
tern
Virg
inia
Trn
g. C
tr. (H
illsv
ille)
1976
217
217
215
216
0.5
234.
0010
64
VA
Wes
tern
Sta
te H
ospi
tal (
Stan
ton)
1828
1990
WA
Firc
rest
(Sea
ttle)
1959
257
262
267
268
-4.1
419.
753
95
WA
Inte
rlak
e Sc
hool
(Med
ical
Lak
e)19
6719
94W
ALa
kela
nd V
illag
e Sc
hool
(Med
ical
Lak
e)19
1525
125
124
824
71.
641
2.37
20
1W
AFr
ance
s H
addo
n M
orga
n C
tr. (B
rem
erto
n)19
7250
5049
484.
239
4.26
22
0W
AR
aini
er S
choo
l (B
uckl
ey)
1939
380
380
410
410
-7.3
389.
000
2112
WA
Yak
ima
Val
ley
Scho
ol (S
elah
)19
5811
111
111
097
14.4
396.
431
05
WV
Col
in A
nder
son
Ctr
. (St
. Mar
y's)
1932
1998
WV
Gre
enbr
ier
Ctr
. (L
ewisb
urg)
1619
7419
90W
VSp
ence
r St
ate
Hos
pita
l (Sp
ence
r)18
9319
89W
VW
esto
n St
ate
Hos
pita
l (W
esto
n)19
8519
88W
IC
entra
l Wis
cons
in C
tr. (M
adis
on)
1959
353
353
353
357
-1.1
465.
000
53
WI
Nor
ther
n W
isco
nsin
Ctr.
(Chi
ppew
a Fa
lls)
1897
172
172
176
180
-4.4
522.
000
53
WI
Sout
hern
Wis
cons
in C
tr. (
Uni
on G
rove
)19
1926
426
426
626
7-1
.144
4.00
01
2W
YW
yom
ing
Stat
e Tr
ng. S
choo
l (La
nder
)19
1295
103
9710
6-1
0.4
536.
00e
14
2
16 G
reen
bria
r Cen
ter (
WV
) bec
ame
priv
ate
in 1
990.
Clo
sed
Mar
ch 1
5, 1
994
DN
F =
did
not f
urni
sh
29

30
decrease of more than 20%. Six states reported in-creases in the populations of their large state facili-ties, ranging from 0.5% in Louisiana to 7.4% in Okla-homa. One state, Michigan, reported no change.
Nationally, annual decline in population of largestate residential facilities for persons with ID/DD av-eraged from 2,316 from 1996 to 2003, from a total of58,320 in 1996 to 42,111 in 2003.
AL 4 450 349 -22.4 463.10
AK 0 0 0 0.0 0.00
AZ 1 154 145 -5.8 270.23AR 6 1,166 1,115 -4.4 211.78
CA 7 3,666 3,547 -3.2 360.39
CO 2 93 92 -1.1 498.74CT 7 886 857 -3.3 478.30
DE 1 181 159 -12.2 411.95
DC 0 0 0 0.0 0.00FL 7 1,502 1,469 -2.2 313.76
GA 8 1,377 1,341 -2.6 397.98HI 0 0 0 0.0 0.00
ID 1 106 103 -2.8 525.35
IL 9 2,804 2,934 4.6 332.39IN 6 640 566 -11.6 483.07
IA 2 682 673 -1.3 355.26
KS 2 382 371 -2.9 338.89KY 3 601 543 -9.7 358.75
LA 10 1,681 1,689 0.5 290.81
ME 0 0 0 0.0 0.00MD 4 437 405 -7.3 349.22
MA 6 1,174 1,135 -3.3 350.14
MI 1 173 173 0.0 499.30MN 1 41 25 -39.0 799.00
MS 5 1,368 1,411 3.1 211.02MO 10 1,331 1,277 -4.1 279.69
MT 2 122 104 -14.8 383.00
NE 1 392 379 -3.3 270.00NV 2 131 107 -18.3 381.37
NH 0 0 0 0.0 0.00
NJ 7 3,306 3,146 -4.8 400.60NM 0 0 0 0.0 0.00
NY 10 1,563 1,533 -1.9 600.46
NC 5 1,879 1,828 -2.7 335.52ND 1 146 149 2.1 362.51
OH 12 1,929 1,860 -3.6 293.99
OK 2 349 375 7.4 405.00OR 1 49 50 2.0 629.50
PA 6 1,666 1,545 -7.3 453.39RI 0 0 0 0.0 0.00
SC 5 1,001 966 -3.5 260.22
SD 1 189 170 -10.1 276.98TN 3 792 741 -6.4 640.11
TX 13 5,063 5,021 -0.8 256.55
UT 1 234 231 -1.3 350.00VT 0 0 0 0.0 0.00
VA 5 1,618 1,594 -1.5 336.19
WA 5 1,070 1,049 -2.0 403.16WV 0 0 0 0.0 0.00
WI 3 804 789 -1.9 470.40
WY 1 106 95 -10.4 536.00US total 189 43,304 42,111 -2.8 349.26
FY 2003 Average
Weighted Per Diem
Residents with ID/DD on 6/30/02
Residents with ID/DD on 6/30/03
% change
FY02-FY03
StatePRFs on
6/30/03
Table 1.13 Residents of Large PublicResidential Facilities by State onJune 30, 2002 and June 30, 2003

Section 2Status and Changes in
Total State Residential ServiceSystems

32
33
Chapter 3Services Provided by State and Nonstate Agencies in 2003
Kathryn Coucouvanis, Barbara Polister, Robert W. Prouty, and K. Charlie Lakin
This chapter provides statistics on all residentialservices that were directly provided or licensed bystates for persons with intellectual disabilities andrelated developmental disabilities (ID/DD). Thesestatistics are reported by state, operator (state ornonstate agency), and residential setting size as ofJune 30, 2003. Residential services data for 2003are compared with similar statistics from June 30,1977, 1982, 1987, 1992, 1997 and 2002. Thestatistics in this chapter do not include psychiatricfacilities or nursing facilities, but do include residentialservices financed under the federal Medicaidprogram, most notably the Intermediate Care Facilitiesfor Persons with Mental Retardation (ICFs-MR) andHome and Community Based Services (HCBS)programs. Statistics on psychiatric facility residentswith ID/DD are reported in Chapter 1 and statisticson nursing facility residents with ID/DD are reportedin Chapter 7. They are excluded here because ofthis chapter’s focus on services provided within thedesignated ID/DD service systems of each state.
Number of Residential Settings
Table 2.1 presents statistics by state, operator, andsize on the number of individual residential settingsin which people received state licensed or stateprovided residential services for persons with ID/DDon June 30, 2003. It excludes services provided topeople living with their natural or adoptive families.Statistics on persons with ID/DD receiving servicesin their family home are provided in Chapter 4.
There were an estimated 145,581 distinct residen-tial settings in which persons with ID/DD were receiv-ing residential services on June 30, 2003. Of the to-tal 145,581 residential settings, an estimated 142,869(98.1%) were operated or supported by employeesof nonstate agencies and 2,712 (1.9%) were oper-ated or supported by state agencies. In all, an esti-mated 137,407 (94.4%) settings had 6 or fewer resi-dents, 7,091 (4.9%) settings had 7 to 15 residentsand 1,083 (0.7%) settings had 16 or more residents.Virtually all residential settings with 6 or fewer resi-
dents were operated or supported by nonstate agen-cies (98.8%), as were most of those with 7 to 15 per-sons (89.1%) and with 16 or more residents (78.4%).
Number of Persons Receiving ResidentialServices
Table 2.2 presents statistics by state, operator, andsetting size on the number of people with ID/DDreceiving residential services on June 30, 2003. Itexcludes services provided to persons with ID/DDliving with their natural or adoptive families (seeChapter 4).
On June 30, 2003 a total of 402,281 persons withID/DD were receiving residential services sponsoredby state ID/DD agencies. Of these, 346,507 (86.1%)were served by nonstate agencies. Virtually all of theestimated 275,461 persons in settings with 6 or fewerresidents (98.0%) and an overwhelming majority ofthose in settings with 7 to 15 residents (86.4%) re-ceived services from nonstate agencies. In contrast,59.1% of all persons in facilities with 16 or more resi-dents were served by state agencies, even though78.4% of facilities with 16 or more residents were op-erated by nonstate agencies.
California and New York had by far the largestnumbers of persons receiving residential services(50,900 and 44,892, respectively). California, Illinois,and Texas reported the largest number of personsliving in facilities of 16 or more residents (6,407, 7,419and 6,926, respectively). Illinois had the largest num-ber of persons living in large nonstate facilities (4,485or 15.1% of the national large nonstate facilities to-tal). California and New York reported the largestnumber of persons living in nonstate residential set-tings of 15 or fewer persons (44,493 and 33,923, re-spectively). California, New York, and Pennsylvaniahad the largest number of persons living in nonstateresidential settings of 6 or fewer persons (42,802,20,417, and 18,625, respectively).
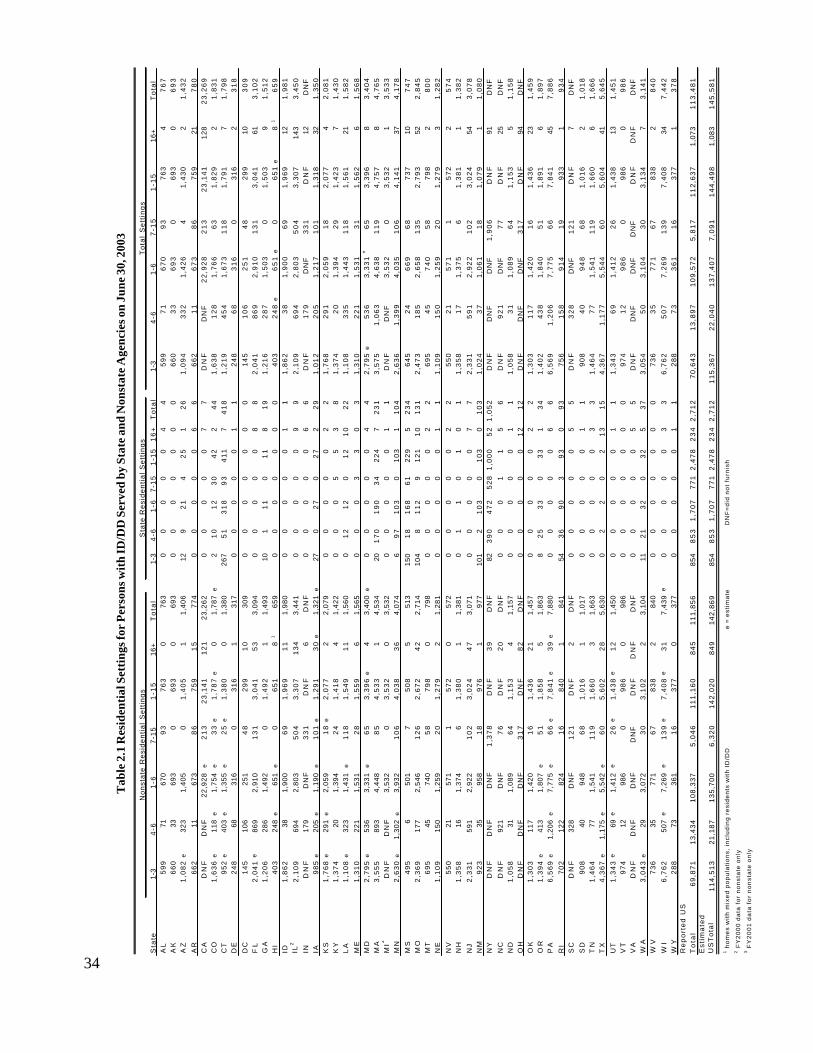
Sta
teT
ota
l1-
34
-61
-67
-15
1-1
51
6+
To
tal
AL
59
971
670
93
76
30
763
00
00
04
45
99
71
67
09
37
63
47
67
AK
66
033
693
06
93
069
30
00
00
00
66
03
36
93
06
93
06
93
AZ
1,0
82
e32
31
,40
50
1,4
05
11
,40
612
92
14
25
12
61
,09
43
32
1,4
26
41
,43
02
1,4
32
AR
66
211
673
86
75
91
577
40
00
00
66
66
21
16
73
86
75
921
78
0C
AD
NF
DN
F2
2,9
28
e2
13
23
,14
11
21
23
,26
20
00
00
77
DN
FD
NF
22
,92
82
13
23
,14
112
82
3,2
69
CO
1,6
36
e11
8e
1,7
54
e3
3e
1,7
87
e0
1,7
87
e2
10
12
30
42
24
41
,63
81
28
1,7
66
63
1,8
29
21
,83
1C
T9
52
e40
3e
1,3
55
e2
5e
1,3
80
01
,38
026
75
13
18
93
41
17
41
81
,21
94
54
1,6
73
11
81
,79
17
1,7
98
DE
24
868
316
03
16
131
70
00
00
11
24
86
83
16
03
16
23
18
DC
14
510
625
14
82
99
10
309
00
00
00
01
45
10
62
51
48
29
910
30
9F
L2
,04
1e
869
2,9
10
13
13
,04
15
33
,09
40
00
00
88
2,0
41
86
92
,91
01
31
3,0
41
613
,10
2G
A1
,20
628
61
,49
20
1,4
92
11
,49
310
11
10
11
81
91
,21
62
87
1,5
03
01
,50
39
1,5
12
HI
40
324
8e
651
e0
65
18
165
90
00
00
00
40
32
48
e6
51
e0
65
1e
81
65
9ID
1,8
62
381
,90
06
91
,96
91
11
,98
00
00
00
11
1,8
62
38
1,9
00
69
1,9
69
121
,98
1IL
22
,10
969
42
,80
35
04
3,3
07
13
43
,44
10
00
00
99
2,1
09
69
42
,80
35
04
3,3
07
143
3,4
50
IN
DN
F17
9D
NF
33
1D
NF
6D
NF
00
00
06
6D
NF
17
9D
NF
33
1D
NF
12D
NF
IA9
85
e20
5e
1,1
90
e1
01
e1
,29
13
0e
1,3
21
e27
02
70
27
22
91
,01
22
05
1,2
17
10
11
,31
832
1,3
50
KS
1,7
68
e29
1e
2,0
59
18
e2
,07
72
2,0
79
00
00
02
21
,76
82
91
2,0
59
18
2,0
77
42
,08
1K
Y1
,37
420
1,3
94
24
1,4
18
41
,42
20
00
55
38
1,3
74
20
1,3
94
29
1,4
23
71
,43
0L
A1
,10
8e
323
1,4
31
e1
18
1,5
49
11
1,5
60
01
21
20
12
10
22
1,1
08
33
51
,44
31
18
1,5
61
211
,58
2
ME
1,3
10
221
1,5
31
28
1,5
59
61
,56
50
00
33
03
1,3
10
22
11
,53
13
11
,56
26
1,5
68
MD
2,7
95
e53
63
,33
1e
65
3,3
96
e4
3,4
00
e0
00
00
44
2,7
95
e5
36
3,3
31
e6
53
,39
68
3,4
04
MA
3,5
55
893
4,4
48
85
4,5
33
14
,53
420
17
01
90
34
22
47
23
13
,57
51
,06
34
,63
81
19
4,7
57
84
,76
5M
I3D
NF
DN
F3
,53
20
3,5
32
03
,53
20
00
00
11
DN
FD
NF
3,5
32
03
,53
21
3,5
33
MN
2,6
30
e1
,30
2e
3,9
32
10
64
,03
83
64
,07
46
97
10
30
10
31
10
42
,63
61
,39
94
,03
51
06
4,1
41
374
,17
8
MS
49
56
501
75
08
551
315
01
81
68
61
22
95
23
46
45
24
66
96
87
37
107
47
MO
2,3
69
177
2,5
46
12
62
,67
24
22
,71
410
48
11
29
12
11
01
31
2,4
73
18
52
,65
81
35
2,7
93
522
,84
5M
T6
95
4574
05
87
98
079
80
00
00
22
69
54
57
40
58
79
82
80
0N
E1
,10
915
01
,25
92
01
,27
92
1,2
81
00
00
01
11
,10
91
50
1,2
59
20
1,2
79
31
,28
2
NV
55
021
571
15
72
057
20
00
00
22
55
02
15
71
15
72
25
74
NH
1,3
58
161
,37
46
1,3
80
11
,38
10
11
01
01
1,3
58
17
1,3
75
61
,38
11
1,3
82
NJ
2,3
31
591
2,9
22
10
23
,02
44
73
,07
10
00
00
77
2,3
31
59
12
,92
21
02
3,0
24
543
,07
8N
M9
23
3595
81
89
76
197
710
12
10
30
10
30
10
31
,02
43
71
,06
11
81
,07
91
1,0
80
NY
DN
FD
NF
DN
F1
,37
8D
NF
39
DN
F82
39
04
72
52
81
,00
05
21
,05
2D
NF
DN
FD
NF
1,9
06
DN
F91
DN
F
NC
DN
F92
1D
NF
76
DN
F2
0D
NF
00
01
15
6D
NF
92
1D
NF
77
DN
F25
DN
FN
D1
,05
831
1,0
89
64
1,1
53
41
,15
70
00
00
11
1,0
58
31
1,0
89
64
1,1
53
51
,15
8O
H
DN
FD
NF
DN
F3
17
DN
F8
2D
NF
00
00
01
21
2D
NF
DN
FD
NF
31
7D
NF
94D
NF
OK
1,3
03
117
1,4
20
16
1,4
36
21
1,4
57
00
00
02
21
,30
31
17
1,4
20
16
1,4
36
231
,45
9O
R1
,39
4e
413
1,8
07
e5
11
,85
85
1,8
63
82
53
30
33
13
41
,40
24
38
1,8
40
51
1,8
91
61
,89
7P
A6
,56
9e
1,2
06
e7
,77
5e
66
e7
,84
1e
39
e7
,88
00
00
00
66
6,5
69
1,2
06
7,7
75
66
7,8
41
457
,88
6
RI
70
212
282
41
68
40
184
154
36
90
39
30
93
75
61
58
91
41
99
33
19
34
SC
DN
F32
8D
NF
12
1D
NF
2D
NF
00
00
05
5D
NF
32
8D
NF
12
1D
NF
7D
NF
SD
90
840
948
68
1,0
16
11
,01
70
00
00
11
90
84
09
48
68
1,0
16
21
,01
8T
N1
,46
477
1,5
41
11
91
,66
03
1,6
63
00
00
03
31
,46
47
71
,54
11
19
1,6
60
61
,66
6T
X4
,36
7e
1,1
75
e5
,54
2e
60
5,6
02
28
5,6
30
02
20
21
31
54
,36
71
,17
75
,54
46
05
,60
441
5,6
45
UT
1,3
43
e69
e1
,41
2e
26
e1
,43
8e
12
1,4
50
00
00
01
11
,34
36
91
,41
22
61
,43
813
1,4
51
VT
97
412
986
09
86
098
60
00
00
00
97
41
29
86
09
86
09
86
VA
DN
FD
NF
DN
FD
NF
DN
FD
NF
DN
F0
00
00
55
DN
FD
NF
DN
FD
NF
DN
FD
NF
DN
FW
A3
,04
3e
293
,07
23
03
,10
22
3,1
04
112
13
20
32
53
73
,05
45
03
,10
43
03
,13
47
3,1
41
WV
73
635
771
67
83
82
840
00
00
00
07
36
35
77
16
78
38
28
40
WI
6,7
62
507
e7
,26
9e
13
9e
7,4
08
e3
17
,43
9e
00
00
03
36
,76
25
07
7,2
69
13
97
,40
834
7,4
42
WY
28
873
361
16
37
70
377
00
00
01
12
88
73
36
11
63
77
13
78
Re
po
rte
d U
S
To
tal
69
,87
11
3,4
34
10
8,3
37
5,0
46
11
1,1
60
84
51
11
,85
685
48
53
1,7
07
77
12
,47
82
34
2,7
12
70
,64
31
3,8
97
10
9,5
72
5,8
17
11
2,6
37
1,0
73
11
3,4
81
Es
tim
ate
d
US
To
tal
11
4,5
13
21
,18
71
35
,70
06
,32
01
42
,02
08
49
14
2,8
69
854
85
31
,70
77
71
2,4
78
23
42
,71
21
15
,36
72
2,0
40
13
7,4
07
7,0
91
14
4,4
98
1,0
83
14
5,5
81
DN
F=
did
no
t fu
rnis
h
3 F
Y2
00
1 d
ata
fo
r n
on
sta
te o
nly
2 F
Y2
00
0 d
ata
fo
r n
on
sta
te o
nly
1-6
1-1
516
+7
-15
4-6
1-3
16+
1 h
om
es
wit
h m
ixe
d p
op
ula
tio
ns,
in
clu
din
g r
esi
de
nts
wit
h I
D/D
De
= e
stim
ate
To
tal
1-1
5
To
tal
Se
ttin
gs
Sta
te R
esi
de
nti
al
Se
ttin
gs
No
nst
ate
Re
sid
en
tia
l S
ett
ing
s
4-6
1-3
7-1
51
-6
Tab
le 2
.1 R
esid
enti
al S
etti
ngs f
or P
erso
ns w
ith
ID/D
D S
erve
d by
Sta
te a
nd N
onst
ate
Age
ncie
s on
June
30,
200
3
34

Sta
te1-
34-
61-
67-
151-
151
6+
To
tal
1-3
4-6
1-6
7-15
1-1
516
+T
ota
l1
-34
-61
-67
-15
1-15
16
+T
ota
lA
L1,
402
44
31,
845
927
2,77
20
2,77
20
00
00
33
73
37
1,40
24
43
1,8
45
92
72,
772
33
73,
109
AK
852
19
81,
050
01,
050
01,
050
00
00
00
08
52
19
81
,05
00
1,05
00
1,05
0A
Z1,
845
e1,
379
e3,
224
03,
224
43
e3,
267
25
436
841
10
91
45
25
41,
870
1,42
23
,29
24
13,
333
18
83,
521
AR
831
65
896
813
1,70
94
68
2,17
70
00
00
1,1
01
1,10
18
31
65
89
68
13
1,70
91,
569
3,27
8C
AD
NF
DN
F42
,802
1,69
144
,493
2,84
74
7,3
40
00
00
03
,56
03,
560
DN
FD
NF
42
,80
21
,69
144
,493
6,40
75
0,9
00
CO
3,60
9e1
58
7e
4,19
6e1
248
e4,
444
e10
4,44
4e1
655
61
225
28
69
93
85
3,61
51
64
24
,25
71
47
34,
730
19
94,
829
1
CT
1,92
9e
2,05
2e
3,98
1e
173
4,15
40
4,15
45
61
282
84
375
11,
594
86
22,
456
2,49
02,
334
4,8
24
92
45,
748
86
26,
610
e
DE
412
29
270
40
704
59
76
30
00
00
15
91
59
41
22
92
70
40
704
21
89
22
DC
236
54
077
636
91,
145
35
1,18
00
00
00
00
23
65
40
77
63
69
1,14
53
51,
180
FL
4,00
04,
968
8,96
81,
752
10,7
202,
077
12
,79
70
00
00
1,4
81
1,48
14,
000
4,96
88
,96
81
,75
210
,720
3,55
81
4,2
78
GA
2,33
21,
163
3,49
50
3,49
51
10
3,60
53
04
34
03
41
,33
11,
365
2,36
21,
167
3,5
29
03,
529
1,44
14,
970
HI
583
50
81,
091
01,
091
82
1,09
90
00
00
00
58
35
08
1,0
91
01,
091
82
1,09
9ID
1,95
42
05
2,15
950
92,
668
14
12,
809
00
00
01
03
10
31,
954
20
52
,15
95
09
2,66
82
44
2,91
2IL
32,
331
3,01
85,
349
5,39
510
,744
4,48
51
5,2
29
00
00
02
,93
42,
934
2,33
13,
018
5,3
49
5,3
95
10,7
447,
419
18
,16
3IN
4 5,
368
e9
49
6,31
7e
2,67
78,
994
53
79,
531
00
00
05
66
56
65,
368
94
96
,31
72
,67
78,
994
1,10
31
0,0
97
IA2,
964
e9
08
e3,
872
812
e4,
684
1,16
2e
5,84
62
70
27
02
76
64
69
12,
991
90
83
,89
98
12
4,71
11,
826
6,53
7K
S2,
784
1,56
44,
348
172
4,52
07
44,
594
00
00
03
69
36
92,
784
1,56
44
,34
81
72
4,52
04
43
4,96
3K
Y3,
005
80
3,08
516
43,
249
25
23,
501
00
040
40
57
26
12
3,00
58
03
,08
52
04
3,28
98
24
4,11
3L
A1,
696
1,92
33,
619
936
4,55
51,
016
5,57
10
686
80
68
1,6
93
1,76
11,
696
1,99
13
,68
79
36
4,62
32,
709
7,33
2M
E1,
908
89
72,
805
266
3,07
14
23,
113
00
033
33
03
31,
908
89
72
,80
52
99
3,10
44
23,
146
MD
4,48
52,
105
6,59
046
07,
050
10
37,
153
00
00
03
96
39
64,
485
2,10
56
,59
04
60
7,05
04
99
7,54
9M
A4,
235
3,75
57,
990
605
8,59
51
78,
612
45
679
72
426
89
92
1,1
64
2,15
64,
280
4,43
48
,71
48
73
9,58
71,
181
10
,76
8M
I5D
NF
DN
F10
,373
e0
10,3
73e
01
0,3
73
e0
00
00
17
31
73
DN
FD
NF
10
,37
30
10,3
731
73
10
,54
6M
N4,
832
e5,
842
e10
,674
1,12
411
,798
94
41
3,1
85
61
440
84
22
04
22
25
44
74,
846
6,25
01
1,0
96
1,1
24
12,2
209
69
13
,63
2M
S50
03
653
678
614
66
77
1,28
11
88
922
80
588
86
81
,38
92,
257
68
81
28
81
66
66
1,48
22,
056
73,
538
MO
2,
492
1,01
13,
503
1,14
04,
643
38
48
5,02
78
10
448
15
260
21
21
,22
71,
439
2,59
61,
059
3,6
55
1,2
00
4,85
51,
611
6,46
68
MT
833
23
21,
065
459
1,52
40
1,52
40
00
00
10
81
08
83
32
32
1,0
65
45
91,
524
10
81,
632
NE
1,75
56
73
2,42
813
32,
561
22
92,
790
00
00
03
79
37
91,
755
67
32
,42
81
33
2,56
16
08
3,16
9N
V1,
000
12
21,
122
151,
137
01,
137
00
00
01
08
10
81,
000
12
21
,12
21
51,
137
10
81,
245
NH
1,64
1e
63
e1,
704
32e
1,73
62
51,
761
06
60
60
61,
641
69
1,7
10
32
1,74
22
51,
767
NJ
3,69
72,
623
6,32
083
77,
157
66
77,
824
00
00
03
,16
93,
169
3,69
72,
623
6,3
20
83
77,
157
3,83
61
0,9
93
NM
1,44
31
47
1,59
016
51,
755
16
1,77
11
42
71
49
01
49
01
49
1,58
51
54
1,7
39
16
51,
904
16
1,92
0N
Y13
,389
7,02
820
,417
13,5
0633
,923
1,20
43
5,1
27
21
81,
956
2,17
45,
324
7,49
82
,26
79,
765
13
,60
78,
984
22
,59
11
8,8
30
41,4
213,
471
44
,89
2N
CD
NF
DN
F8,
857
971
9,82
87
91
10
,61
90
00
101
01
,83
71,
847
DN
FD
NF
8,8
57
98
19,
838
2,62
81
2,4
66
ND
1,05
81
76
1,23
451
21,
746
12
21,
868
00
00
01
49
14
91,
058
17
61
,23
45
12
1,74
62
71
2,01
7O
HD
NF
DN
F9,
042
2,59
611
,638
3,14
21
4,7
80
00
00
01
,85
41,
854
DN
FD
NF
9,0
42
2,5
96
11,6
384,
996
16
,63
4O
K2,
500
63
53,
135
216
3,35
11,
656
5,00
70
00
00
37
63
76
2,50
06
35
3,1
35
21
63,
351
2,03
25,
383
OR
2,68
21,
791
4,47
342
94,
902
80
4,98
22
411
71
41
01
41
50
19
12,
706
1,90
84
,61
44
29
5,04
31
30
5,17
3P
A9
12,3
96e
6,22
9e
18,6
25e
457
e19
,082
e1,
483
e2
0,5
65
00
00
01
,54
51,
545
12
,39
66,
229
18
,62
54
57
19,0
823,
028
22
,11
0R
I94
35
72
1,51
512
81,
643
22
1,66
57
820
42
82
453
27
03
27
1,02
17
76
1,7
97
17
31,
970
22
1,99
2S
C1,
284
1,31
02,
594
992
3,58
64
83,
634
00
00
09
86
98
61,
284
1,31
02
,59
49
92
3,58
61,
034
4,62
0S
D
1,15
61
95
1,35
169
72,
048
16
2,06
40
00
00
17
01
70
1,15
61
95
1,3
51
69
72,
048
18
62,
234
TN
2,45
13
64
2,81
596
43,
779
14
23,
921
00
00
07
39
73
92,
451
36
42
,81
59
64
3,77
98
81
4,66
0T
X5,
813
e6,
246
e12
,059
713
12,7
721,
926
14
,69
80
101
00
10
5,0
00
5,01
05,
813
6,25
61
2,0
69
71
312
,782
6,92
61
9,7
08
UT
1,66
6e
20
8e
1,87
4e
182
e2,
056
54
52,
601
00
00
02
31
23
11,
666
20
81
,87
41
82
2,05
67
76
2,83
2V
T1,
107
66
1,17
30
1,17
30
1,17
30
00
00
00
1,10
76
61
,17
30
1,17
30
1,17
3V
A
DN
FD
NF
DN
FD
NF
DN
FD
NF
4,94
40
00
00
1,6
13
1,61
3D
NF
DN
FD
NF
DN
FD
NF
DN
F6,
557
WA
6,42
51
59
6,58
426
66,
850
36
6,88
62
786
11
30
11
31
,02
11,
134
6,45
22
45
6,6
97
26
66,
963
1,05
78,
020
WV
1,11
71
73
1,29
053
51,
825
59
1,88
40
00
00
00
1,11
71
73
1,2
90
53
51,
825
59
1,88
4W
I107,
488
2,02
8e
9,51
6e
985
e10
,501
e1,
498
11
,99
9e
00
00
07
88
78
87,
488
2,02
89
,51
69
85
10,5
012,
286
12
,78
7W
Y32
63
54
680
130
810
08
10
00
00
09
59
53
26
35
46
80
13
081
09
59
05
Rep
orte
d U
S
To
tal
128,
755
65
,88
226
5,71
146
,231
311,
942
29
,17
83
46
,50
71,
489
4,06
55,
554
7,38
51
2,9
39
42
,83
55
5,7
74
13
0,2
44
69
,94
72
71
,26
55
3,6
16
324,
881
70
,40
040
2,28
1E
stim
ate
d
US
To
tal
175,
771
89,9
4026
9,90
746
,961
316,
868
29
,63
93
46
,50
71,
489
4,06
55,
554
7,38
51
2,9
39
42
,83
55
5,7
74
17
7,2
60
94
,00
52
75
,46
15
4,3
46
329,
807
72
,47
440
2,28
14
unab
le t
o se
para
te "
own
hom
e" a
nd "
fam
ily h
ome"
dat
a; e
st.
50%
7 as
of 1
2/31
/02
10 a
s of
4/2
0/04
2 r
esid
ents
with
ID
/DD
in h
omes
with
mix
ed p
opul
atio
ns5
FY
200
1 da
ta f
or n
onst
ate
only
8 incl
udes
122
res
iden
ts o
f un
know
n se
ttin
gs6 in
clud
es 4
43 p
erso
n in
unk
now
n se
ttin
gs9
FY
200
2 da
ta f
or "
own
hom
e"e
= e
stim
ate
DN
F =
did
not
fur
nish
3 F
Y 2
000
data
for
non
stat
e on
ly
1 I
nclu
des
2,76
3 in
divi
dual
ized
res
iden
tial s
ervi
ces
in g
roup
hom
es o
r ho
st f
amili
es
Res
iden
ts o
f A
ll N
onst
ate
Set
tings
by
Siz
eR
esid
ents
of
All
Set
tings
by
Siz
eR
esid
ents
of
All
Sta
te S
ettin
gs b
y S
ize
Tab
le 2
.2 P
erso
ns w
ith
ID/D
D S
erve
d by
Sta
te a
nd N
onst
ate
Age
ncie
s on
June
30,
200
3
35

36
Relative Size of Residential Settings
Table 2.3 presents statistics summarizing the relativesize of the residential settings for persons with ID/DDacross the states. It shows the extreme variabilityamong states on three measures of relative size ofresidential settings.
Average residential settings size. On June 30, 2003an estimated average of 2.8 persons with ID/DD livedin each “non-family” setting in which residentialservices were provided in the United States. Theaverage number of persons with ID/DD per residentialsetting ranged from five or more in one state to two orfewer in ten states. Nineteen states were at or overthe national average. Figure 2.1 shows changes inthe average number of residents with ID/DD perresidential setting between 1977 and 2003.
Percentage living in small residential settings.Table 2.3 shows the percentage of all personsreported to be receiving residential services in eachstate on June 30, 2003 who were living in residentialsettings with 15 or fewer residents and with 6 or fewerresidents, and with 3 or fewer residents. Nationally,an estimated 82.0% of reported residents lived insettings with 15 or fewer residents. In 39 states,75.0% or more of all residential service recipientslived in places with 15 or fewer residents, while inonly one state (Mississippi) did less than 50% ofresidential service recipients live in places with 15 orfewer residents. Nationally, on June 30, 2003, anestimated 68.5% of reported residents lived in settingswith 6 or fewer residents, and an estimated 44.1%
Table 2.3 Summary Statistics on the Sizeof Residential Settings for Persons withID/DD on June 30, 2003
Figure 2.1 Average Number of Personswith ID/DD per Residential Setting onJune 30, 1977, 1982, 1987, 1992, 1997,and 2003
2.83.5
5.9
7.5
15.6
22.5
0
5
10
15
20
25
1977 1982 1987 1992 1997 2003Year
Res
iden
ts
Average Number of Residents with ID/DD
State All SettingsAll Resi-dents
AL 767 3,109 4.1 89.2 59.3 45.1AK 693 1,050 1.5 100.0 100.0 81.1AZ 1,432 3,521 2.5 94.7 93.5 53.1AR 780 3,278 4.2 52.1 27.3 25.4CA 23,269 50,900 2.2 87.4 84.1 DNFCO 1,831 4,829 2.6 97.9 88.2 74.9CT 1,798 6,610 3.7 87.0 73.0 37.7DE 318 922 2.9 76.4 76.4 44.7DC 309 1,180 3.8 97.0 65.8 20.0FL 3,102 14,278 4.6 75.1 62.8 28.0GA 1,512 4,970 3.3 71.0 71.0 47.5HI 659 1,099 DNF 99.3 99.3 53.0ID 1,981 2,912 1.5 91.6 74.1 67.1IL1 3,450 18,163 5.3 59.2 29.4 12.8IN DNF 10,097 DNF 89.1 62.6 53.2IA 1,350 6,537 4.8 72.1 59.6 45.8KS 2,081 4,963 2.4 91.1 87.6 56.1KY 1,430 4,113 2.9 80.0 75.0 73.1LA 1,582 7,332 4.6 63.1 50.3 23.1ME 1,568 3,146 2.0 98.7 89.2 60.6MD 3,404 7,549 2.2 93.4 87.3 59.4MA 4,765 10,768 2.3 89.0 80.9 39.7MI 2 3,533 10,546 3.0 98.4 98.4 DNFMN 4,178 13,632 3.3 89.6 81.4 35.5MS 747 3,538 4.7 41.9 23.1 19.4MO 2,845 6,466 2.3 75.1 56.5 40.1MT 800 1,632 2.0 93.4 65.3 51.0NE 1,282 3,169 2.5 80.8 76.6 55.4NV 574 1,245 2.2 91.3 90.1 80.3NH 1,382 1,767 1.3 98.6 96.8 92.9NJ 3,078 10,993 3.6 65.1 57.5 33.6NM 1,080 1,920 1.8 99.2 90.6 82.6NY DNF 44,892 DNF 92.3 50.3 30.3NC DNF 12,466 DNF 78.9 71.0 DNFND 1,158 2,017 1.7 86.6 61.2 52.5OH DNF 16,634 DNF 70.0 54.4 DNFOK 1,459 5,383 3.7 62.3 58.2 46.4OR 1,897 5,173 2.7 97.5 89.2 52.3PA 7,886 22,110 2.8 86.3 84.2 56.1RI 934 1,992 2.1 98.9 90.2 51.3SC DNF 4,620 DNF 77.6 56.1 27.8SD 1,018 2,234 2.2 91.7 60.5 51.7TN 1,666 4,660 2.8 81.1 60.4 52.6TX 5,645 19,708 3.5 64.9 61.2 29.5UT 1,451 2,832 2.0 72.6 66.2 58.8VT 986 1,173 1.2 100.0 100.0 94.4VA DNF 6,557 DNF DNF DNF DNFWA 3,141 8,020 2.6 86.8 83.5 80.4WV 840 1,884 2.2 96.9 68.5 59.3WI 7,442 12,787 1.7 82.1 74.4 58.6WY 378 905 2.4 89.5 75.1 36.0
Estimated US Total 145,581 402,281 2.8 82.0 3 68.5 3 44.1 4
1 FY2000 data for nonstate only 3 does not include VA2 FY 2001 data for nonstate only
4 does not include CA, MI, NC, OH or VA
DNF = did not furnish
% in Settings with 1-15
% in Settings with 1-6
% in Settings with 1-3
Average Residents/ Settings

37
lived in settings with 1-3 residents. In 22 states morethan 75.0% of all persons receiving residentialservices lived in settings with 6 or fewer residents. Inthree states, less than 50% of all residential servicerecipients lived in settings of 6 or fewer residents.(Figure 2.2 shows these variations on a state-by-statebasis.)
Number of Residential Service RecipientsPer 100,000 of General Population
Table 2.4 and Figure 2.3 present statistics on thenumber of persons with ID/DD receiving residentialservices per 100,000 of each state’s generalpopulation on June 30, 2003. On June 30, 2003 therewere a reported 142.9 persons with ID/DD receivingresidential services per 100,000 of the U.S.population. Georgia had the lowest overall residentialplacement rate per 100,000 state citizens (60.3).North Dakota had the highest overall placement rate,with 301.0 persons receiving residential services per100,000 of the state population. In all, 24 statesreported placement rates below the national average,with four states (Alabama, Arizona, Georgia, andNevada) reporting rates less than 50% of the nationalaverage. Of the 27 states at or above the nationalaverage, eight states (District of Columbia, Iowa,Maine, Minnesota, New York, North Dakota, SouthDakota, and Wisconsin) reported rates greater than150% of the national average. North Dakota had arate of more than 200% of the national average. Whilestates varied substantially in the number of personswith ID/DD receiving residential services per 100,000of the state’s population, most states (32) fell withinthe range of the national average plus or minusone-third.
On June 30, 2003 there were an estimated 115.4persons per 100,000 of the U.S. population receivingresidential services in settings with 15 or fewer resi-dents. A total of 11 states had placement rates thatwere more than 150% of this national average. Fourstates reported rates more than twice the nationalaverage (Maine, Minnesota, North Dakota, and SouthDakota). The estimated national average placementrate for settings with 6 or fewer residents was 96.4residents per 100,000 of the general population. Twostates reported rates more than twice the nationalaverage (Maine and Minnesota).
The national placement rate for facilities of 16 ormore residents was 25.0 residents per 100,000 of thenational population. Six states (Arkansas, Illinois,Iowa, Louisiana, Mississippi, and Oklahoma) reporteda rate more than twice the national average. Figure
Table 2.4 Persons with ID/DD ReceivingResidential Services per 100,000 of StateGeneral Population by Size of ResidentialSetting, June 30, 2003
Number of Residents per 100,000 of State Population in Residential Setting
1-6 7-15 1-15 16+ TotalAL 45.52 40.5 20.4 60.9 7.4 68.3AK 6.65 158.0 0.0 158.0 0.0 158.0AZ 51.26 64.2 0.8 65.0 3.7 68.7AR 27.03 33.1 30.1 63.2 58.0 121.3CA 333.74 128.2 5.1 133.3 19.2 152.5CO 43.58 97.7 10.9 108.5 2.3 110.8CT 32.96 146.3 28.0 174.4 26.1 200.5DE 7.83 89.9 0.0 89.9 27.8 117.7DC 5.32 145.9 69.4 215.3 6.6 221.8FL 158.62 56.5 11.0 67.6 22.4 90.0GA 82.40 42.8 0.0 42.8 17.5 60.3HI 12.91 84.5 0.0 84.5 0.6 85.1ID 14.27 151.3 35.7 187.0 17.1 204.1IL1
121.98 43.9 44.2 88.1 60.8 148.9IN 61.76 102.3 43.3 145.6 17.9 163.5IA 29.22 133.4 27.8 161.2 62.5 223.7KS 27.33 159.1 6.3 165.4 16.2 181.6KY 40.59 76.0 5.0 81.0 20.3 101.3LA 45.02 81.9 20.8 102.7 60.2 162.9ME 12.65 221.7 23.6 245.4 3.3 248.7MD 53.75 122.6 8.6 131.2 9.3 140.4MA 62.86 138.6 13.9 152.5 18.8 171.3MI2 97.57 106.3 0.0 106.3 1.8 108.1MN 49.36 224.8 22.8 247.6 19.6 276.2MS 28.86 28.3 23.1 51.4 71.3 122.6MO 56.58 64.6 21.2 85.8 28.5 114.3MT 9.79 108.8 46.9 155.7 11.0 166.8NE 17.39 139.6 7.6 147.3 35.0 182.2NV 20.07 55.9 0.7 56.7 5.4 62.0NH 12.53 136.5 2.6 139.1 2.0 141.1NJ 83.06 76.1 10.1 86.2 46.2 132.3NM 19.59 88.8 8.4 97.2 0.8 98.0NY 182.07 124.1 103.4 227.5 19.1 246.6NC 80.75 109.7 12.1 121.8 32.5 154.4ND 6.70 184.2 76.4 260.6 40.4 301.0OH 114.23 79.2 22.7 101.9 43.7 145.6OK 34.37 91.2 6.3 97.5 59.1 156.6OR 35.30 130.7 12.2 142.9 3.7 146.5PA 122.67 151.8 3.7 155.6 24.7 180.2RI 9.97 180.3 17.4 197.6 2.2 199.8SC 39.56 65.6 25.1 90.6 26.1 116.8SD 7.96 169.8 87.6 257.4 23.4 280.8TN 58.67 48.0 16.4 64.4 15.0 79.4TX 209.96 57.5 3.4 60.9 33.0 93.9UT 23.51 79.7 7.7 87.5 33.0 120.5VT 6.23 188.3 0.0 188.3 0.0 188.3VA 71.60 DNF DNF DNF DNF 91.6WA 60.70 110.3 4.4 114.7 17.4 132.1WV 18.42 70.0 29.0 99.1 3.2 102.3WI 54.24 175.4 18.2 193.6 42.1 235.7WY 5.47 124.3 23.8 148.1 17.4 165.5US Total 2,814.41 96.4 3 19.1 3 115.4 3 25.0 3 142.91 FY2000 data for nonstate only
3 does not include VA
2 FY2001 data for nonstate only DNF = did not furnish
State
State Population (100,000)

38
Figure 2.2 Percentage of All Residential Service Recipients in Settings with Six orFewer Residents on June 30, 2003
Figure 2.3 Residential Service Recipients per 100,000 of State General Population onJune 30, 2003
National Average = 68.5
National Average = 142.9
DNF = did not furnish
90.1 to 100 (9)76.6 to 90.1 (11)66.2 to 76.6 (9)59.3 to 66.2 (11)23 to 59.3 (10)
201 to 302 (9)163 to 201 (10)132 to 163 (11)101 to 132 (10)60 to 101 (10)
DNF = did not furnish
DNF
DNF

39
2.3 shows the geographic variation among states inthe number of persons receiving residential servicesper 100,000 of the general population.
Persons Presently Not ReceivingResidential Services on Waiting Lists forResidential Services
Table 2.5 summarizes statistics reported by stateson the actual or estimated number of people withintellectual disabilities and related developmentaldisabilities (ID/DD) not receiving residential serviceswho were on waiting lists for such services on June30, 2003. These statistics are presented as rawnumbers and as percentages of the total number ofall persons receiving and waiting for services. Asshown, 36 states provided statistics on the numberof persons waiting for residential services on June30, 2003. Among these states a total of 51,131persons were reported to be waiting for services.Assuming the same ratio of persons waiting forresidential services to persons receiving residentialservices in the 15 states not reporting waiting list dataas in reporting states, on June 30, 2003, an estimatednational total of 75,288 persons with ID/DD werewaiting for residential services.
Statistics from reporting states indicated that theywould need to expand their current residential ser-vices capacity by an estimated 18.7% to create resi-dential services for all the people presently on wait-ing lists for them. This does not include growth inspecific types of services needed to serve personswishing to move from one type of residential settingto another (e.g., a large facility to a community resi-dence).
Six states (California, Hawaii, Idaho, North Dakota,Rhode Island and Vermont) reported having no per-sons with ID/DD who were not presently receiving ser-vices who were known to be waiting for residentialservices. In contrast, eleven states reported waitinglists of such length that their residential services pro-grams would need to be expanded by more than one-quarter to accommodate presently identified needs.
Table 2.5 Persons with ID/DD on a WaitingList for, But Not Receiving, ResidentialServices on June 30, 2003
Sta te
% Grow th Requi red to
Ma tch NeedsA L D N F 3,109 DNFA K 1,400 1 ,050 133.3AZ 105 e 3 ,521 3.0A R D N F 3,278 DNFC A 0 50 ,900 0.0C O 671 4 ,829 13.9C T 583 2 6 ,610 8.8D E 13 9 2 2 1.4D C D N F 1,180 DNFFL D N F 14 ,278 DNFG A 2,064 4 ,970 41.5H I 0 1 ,099 0.0ID 0 2 ,912 0.0IL D N F 18 ,163 3
DNFIN 7,000 e 10 ,097 69.3IA D N F 6,537 DNFK S 872 4 ,963 17.6K Y 2,367 4 ,113 57.5L A D N F 7,332 DNFM E 120 3 ,146 3.8M D 6,875 7 ,549 91.1M A 1,139 10 ,768 10.6M I D N F 10 ,546 DNFM N D N F 13 ,632 4
DNFM S D N F 3,538 DNFM O 626 6 ,466 9.7M T 544 1 ,632 33.3N E 709 3 ,169 22.4N V 246 1 ,245 19.8N H 173 1 ,767 9.8N J 2,670 10 ,993 24.3N M 3,161 1 ,920 164.6N Y 5,041 5 44 ,892 11.2N C 1,041 12 ,466 DNFN D 0 2,017 0.0OH D N F 16 ,634 DNFO K D N F 5,383 DNFOR 3,155 5 ,173 61.0P A 917 22 ,110 4.1R I 0 1 ,992 0.0S C 1,728 e 4 ,620 37.4S D 9 2 ,234 0.4TN D N F 4,660 DNFTX 4,224 19 ,708 21.4U T 254 2 ,832 9.0VT 0 1 ,173 0.0V A 2,921 6 6 ,557 44.5W A D N F 8,020 DNFW V 481 1 ,884 25.5W I D N F 12 ,787 DNFW Y 22 9 0 5 2.4Repor ted US To ta l 51,131 273,204 1 18.7
Est imated US To ta l
75,288 402,281 18.7
e = est imate DNF = d id not fu rn ish
4 FY2001 nonstate data inc luded5
within 24 months as of 3/31/036 w i th in 30 days
3 FY 2000 nonstate data included
2 in past years wai t ing l is t data inc ludes last 12 months + long range planning (this year's data does not)
Total Persons on
Wai t ing L is t
1 only states with corresponding wait ing l ist data included in reported
total
Total 1
Resident ia l Serv ice
Recipients

40

41
Chapter 4Number of Residential Settings and Residents by Type ofLiving Arrangement
Kathryn Coucouvanis, Barbara Polister, Robert W. Prouty, and K. Charlie Lakin
This chapter describes residential settings for personswith intellectual diasbilities and related developmentaldisabilities (ID/DD) by setting type. Three separatetypes of residential settings have been developed toconform to state ID/DD reporting systems. Theseinclude:
Congregate Care: A residence owned, rented,or managed by the residential services provider, orthe provider’s agent, to provide housing for personswith ID/DD in which staff provide care, instruction, su-pervision, and other support for residents with ID/DD(includes ICF-MR certified facilities).
Host Family/Foster Care: A home owned orrented by an individual or family in which they liveand in which they provide care and support for one ormore unrelated persons with ID/DD.
Own Home: A home owned or rented by one ormore persons with ID/DD as their personal home inwhich personal assistance, instruction, supervision,and other support is provided to them as needed.
Family Home: A home owned or rented by a fam-ily member of a person with ID/DD in which the indi-vidual with ID/DD resides and in which the individualreceives care, instruction, supervision and other sup-port from persons other than family members and/orfrom family members who are paid.
Congregate Care Settings and Residents
Table 2.6 presents statistics on congregate careresidential settings and persons with ID/DD living inthese settings on June 30, 2003, by size and state,for all 50 states and the District of Columbia. Of theestimated total 44,360 congregate care residentialsettings, 43,369 (97.8%) had 15 or fewer residentsand 37,299 (84.1%) had six or fewer residents.California (5,659), New York (5,245), andPennsylvania (3,447) accounted for almost one-third(32.4%) of the total congregate care residences, whilethree states reported fewer than 100 such settings.
Of the estimated 260,490 residents of congregatecare settings 189,894 (72.9%) lived in settings with15 or fewer residents and 135,569 (52.0%) lived insettings with six or fewer residents. Seven of the re-porting states, California (30,604), Florida (10,508),Illinois (16,491), New York (33,406), Ohio (10,240),Pennsylvania (13,147), and Texas (15,104) accountedfor 129,500 (49.7%) of the estimated total congre-gate care residents.
Host Family/Foster Care Settings andResidents
Table 2.7 presents statistics on host family/foster care(“host family”) settings and persons with ID/DD livingin such settings on June 30, 2003, by size and state.one state had no host family settings. Forty-six statesreported the number of host family settings by eachsize and fifty reported the resident populations of eachsize. There were a reported U.S. total 22,512 hostfamily settings and 45,759 residents. Based on thereporting states, it was estimated that there were atotal of 24,987 host family settings in the United States.
Of the states reporting host family settings, allstates had settings with six or fewer residents andtwo states (Maine and New York) each had a settingwith seven to fifteen residents. California (1,343), Mas-sachusetts (1,556), New York (1,985), Pennsylvania(2,894), Texas (1,299), Washington (1,732) and Wis-consin (1,686) accounted for one-half of the estimatedtotal host family settings. Sixteen states reported 100or fewer host family settings.
Of the 45,759 persons with ID/DD reported in hostfamily settings, all but 22 lived in settings with six orfewer residents. Thirteen states (California, Massa-chusetts, Michigan, Minnesota, New Jersey, NewYork, North Carolina, Ohio, Oregon, Pennsylvania,Texas, Washington, and Wisconsin) accounted foralmost three-fourths (73.3%) of the estimated national

42
Table 2.6 Congregate Care Settings (including ICFs-MR) and Residents by State onJune 30, 2003
Number of ResidentsState 1-3 4-6 1-6 Total 1-3 4-6 1-6 7-15 16+ TotalAL 348 68 416 93 4 513 965 434 1,399 927 337 2,663AK 185 33 218 0 0 218 277 198 475 0 0 475AZ 422 332 754 4 2 760 881 e 1,422 e 2,303 41 188 2,532AR 93 11 104 86 21 211 183 65 248 813 1,569 2,630CA DNF DNF 5,318 213 128 5,659 DNF DNF 22,506 1,691 6,407 30,604CO 20 e 128 e 148 63 e 2 213 50 e 642 e 692 473 e 99 1,264CT 456 e 454 e 910 e 118 e 7 1,035 1,067 e 2,334 e 3,401 e 924 862 5,187DE 88 68 156 0 2 158 196 292 488 0 218 706DC 93 106 199 48 0 247 168 540 708 369 0 1,077FL 156 869 1,025 131 61 1,217 230 4,968 5,198 1,752 3,558 10,508GA 310 101 411 0 9 420 701 416 1,117 0 1,441 2,558HI 1 39 40 0 0 40 3 165 168 0 0 168ID 18 38 56 69 12 137 36 205 241 509 244 994IL1 454 694 1,148 504 143 1,795 659 3,018 3,677 5,395 7,419 16,491IN 0 179 179 331 12 522 0 949 949 2,677 1,103 4,729IA 116 e 86 e 202 101 e 32 e 335 294 e 435 e 729 812 e 1,826 e 3,367KS 450 e 291 e 741 18 4 763 1,326 1,564 2,890 172 443 3,505KY 709 20 729 29 7 765 1,795 80 1,875 204 824 2,903LA 0 335 335 118 21 474 0 1,991 1,991 936 2,709 5,636ME 494 179 673 30 6 709 935 724 1,659 284 42 1,985MD 1,359 536 1,895 65 8 1,968 2,918 2,105 5,023 460 499 5,982MA 451 1,063 1,514 119 8 1,641 1,156 4,434 5,590 873 1,181 7,644MI2 DNF DNF DNF 0 1 DNF DNF DNF 7,484 e 0 173 7,657 e
MN 310 e 1,399 e 1,709 106 37 1,852 774 e 6,250 e 7,024 1,124 969 9,117MS 301 24 325 68 11 404 344 128 472 666 2,056 3,194MO 182 185 367 135 15 517 282 1,059 1,341 1,200 1,489 4,030MT 112 45 157 58 2 217 203 232 435 459 108 1,002NE 308 141 449 17 3 469 733 658 1,391 130 608 2,129NV 0 21 21 1 2 24 0 122 122 15 108 245NH 184 16 200 6 1 207 312 e 64 e 376 32 e 25 433NJ 717 591 1,308 102 9 1,419 1,286 2,623 3,909 837 3,243 7,989NM 397 35 432 18 1 451 807 146 953 165 16 1,134NY 1,704 1,569 3,273 1,905 67 5,245 3,175 7,937 11,112 18,823 3,471 33,406NC 530 921 1,451 77 25 1,553 DNF DNF 5,679 981 2,628 9,288ND 0 31 31 64 5 100 0 176 176 512 271 959OH DNF DNF 662 316 94 1,072 DNF DNF 2,648 2,596 4,996 10,240OK 8 117 125 16 23 164 15 635 650 216 2,032 2,898OR 110 e 438 e 548 e 51 6 605 e 251 e 1,908 e 2,159 e 429 130 2,718PA 2,299 e 1,037 e 3,336 e 66 e 45 e 3,447 4,331 e 5,331 e 9,662 e 457 e 3,028 e 13,147RI 124 158 282 19 1 302 288 776 1,064 173 22 1,259SC 201 328 529 121 7 657 543 1,310 1,853 992 1,034 3,879SD 323 39 362 68 2 432 488 191 679 697 186 1,562TN 171 76 247 119 6 372 373 360 733 964 881 2,578TX 403 e 1,177 e 1,580 60 41 1,681 1,209 e 6,256 e 7,465 713 6,926 15,104UT 556 e 69 e 625 e 26 e 13 664 832 e 208 1,040 182 e 776 1,998VT 23 12 35 0 0 35 33 66 99 0 0 99VA DNF DNF DNF DNF DNF DNF DNF DNF DNF DNF DNF 3,520WA 13 50 63 30 7 100 31 245 276 266 1,057 1,599WV 17 34 51 67 2 120 45 169 214 535 59 808WI 0 239 e 239 e 139 e 34 412 e 0 956 e 956 e 985 e 2,286 4,227 e
WY 53 73 126 16 1 143 84 354 438 130 95 663
Reported US Total 15,269 14,455 35,704 5,811 950 42,464 30,279 65,141 133,737 53,591 69,642 260,490
Estimated US Total 19,160 18,139 37,299 6,070 991 44,360 43,019 92,550 135,569 54,325 70,596 260,490
e = estimate1 FY2000 data for nonstate only
2 FY 2001 data for nonstate only DNF = did not furnish
Number of Congregate Care Settings16+7-15

43
Table 2.7 Host Family/Foster Care Settings and Residents by State on June 30, 2003
Number of Residents
State 1-3 4-6 1-6 7-15 Total 1-3 4-6 1-6 7-15 TotalAL 79 1 80 0 80 236 1 237 0 237AK 125 0 125 0 125 225 0 225 0 225AZ 415 e 0 415 e 0 415 e 624 0 624 0 624AR 216 0 216 0 216 232 0 232 0 232CA 1,343 e 0 1,343 0 1,343 e 4,029 0 4,029 0 4,029CO DNF DNF DNF DNF DNF DNF DNF DNF DNF DNFCT 335 e 0 335 e 0 335 e 566 0 566 0 566DE 148 0 148 0 148 193 0 193 0 193DC 31 0 31 0 31 47 0 47 0 47FL 0 0 0 0 0 0 0 0 0 0GA 87 6 93 0 93 469 20 489 0 489HI 257 209 e 466 0 466 e 425 343 768 0 768ID 916 0 916 0 916 990 0 990 0 990IL 1 76 0 76 0 76 93 0 93 0 93IN 319 e 0 319 e 0 319 e 782 e 0 782 e 0 782 e
IA 16 0 16 0 16 16 0 16 0 16KS 140 e 0 140 e 0 140 280 0 280 0 280KY 364 0 364 0 364 857 0 857 0 857LA 41 e 0 41 e 0 41 e 59 0 59 0 59ME 346 42 388 1 389 489 173 662 15 677MD 333 e 0 333 e 0 333 e 428 0 428 0 428MA 1,556 0 1,556 0 1,556 1,556 0 1,556 0 1,556MI 2 DNF DNF DNF DNF DNF DNF DNF 1,163 e 0 1,163 e
MN 583 e 0 583 e 0 583 e 1,457 e 0 1,457 e 0 1,457 e
MS 21 0 21 0 21 21 0 21 0 21MO 39 0 39 0 39 62 0 62 0 62MT 173 0 173 0 173 189 0 189 0 189NE 100 0 100 0 100 189 0 189 0 189NV 8 0 8 0 8 24 0 24 0 24NH 771 1 772 0 772 926 e 5 931 e 0 931 e
NJ 802 0 802 0 802 1,599 0 1,599 0 1,599NM 248 0 248 0 248 274 0 274 0 274NY 1,684 300 1,984 1 1,985 2,703 1,047 3,750 7 3,757NC DNF 0 DNF 0 DNF 1,043 0 1,043 0 1,043ND 29 0 29 0 29 29 0 29 0 29OH DNF 0 DNF 0 DNF DNF DNF 1,864 0 1,864OK 490 0 490 0 490 512 0 512 0 512OR 582 e 0 582 e 0 582 e 1,745 0 1,745 0 1,745PA 2,743 e 151 e 2,894 e 0 2,894 6,274 e 810 e 7,084 e 0 7,084RI 51 0 51 0 51 63 0 63 0 63SC 98 0 98 0 98 134 0 134 0 134SD 5 1 6 0 6 7 4 11 0 11TN 77 0 77 0 77 217 0 217 0 217TX 1,299 e 0 1,299 e 0 1,299 e 1,939 e 0 1,939 e 0 1,939 e
UT 213 0 213 0 213 213 0 213 0 213VT 794 0 794 0 794 909 0 909 0 909VA DNF 0 DNF 0 DNF 464 0 464 0 464W A 1,732 0 1,732 0 1,732 3,069 0 3,069 0 3,069W V 329 0 329 0 329 329 0 329 0 329W I 1,418 268 1,686 e 0 1,686 e 2,144 1,072 3,216 0 3,216W Y 99 0 99 0 99 104 0 104 0 104Reported US Total
21,531 979 22,510 2 22,512 39,235 3,475 45,737 22 45,759
Estimated US Total
23,809 3 1,087 3 24,986 3 2 3 24,987 3 42,016 3 3,631 3 45,737 3 22 3 45,759 3
1 FY2000 data 2 FY 2001 data 3 does not include CO
Number of Family Foster Care Settings
e = estimate DNF = did not furnish

44
total of 45,759 recipients of host family care. Ten ofthe states with host families reported fewer than 100persons in host family settings.
Own Home Settings and Residents
Table 2.8 presents statistics on the number of homesowned or leased by persons with ID/DD who werereceiving residential services and the number ofpersons with ID/DD living in their own homes on June30, 2003 by size and state. Forty-four states reportedon June 30, 2003 that 55,383 houses and apartmentswere owned or rented by persons with ID/DD whoreceived residential supports. From the reportednumbers it was estimated that nationally a total of73,623 homes were owned or rented by residentialservice recipients with ID/DD.
States reported that a total of 90,957 persons livedin their own homes. The greatest number of homesowned or leased by persons with ID/DD were reportedby California (16,267), and Wisconsin (5,344). Thesestates together accounted for 29.4% (21,611) of theestimated national total of 73,623 homes. California(16,267), New York (7,729), Ohio (4,530), and Wis-consin (5,344) reported more than one-third (37.4%)of the reported national total of 90,597 people livingin their own homes. Two states (Delaware and Dis-trict of Columbia) reported fewer than 25 own-homesettings and fewer than 25 people living in their ownhome.
Family Home Settings and Residents
Table 2.9 presents statistics on persons with ID/DDreceiving services while living in the home of a familymember on June 30, 2003. States had an estimatedtotal of 500,004 persons with ID/DD receiving servicesin their family home.
California and New York accounted for 43.2% ofall recipients with 134,476 recipients and 81,456 re-cipients, respectively. In 24 states the number ofpeople receiving services while living in their familyhome was equal to or greater than one-half of thecombined total number of people served in both fam-ily and non-family settings. In five states (Alaska, Ari-zona, California, Idaho, and South Carolina) 70% ormore of all the recipients received services while liv-ing in a family home.
Table 2.8 Homes Owned or Leased byPersons with ID/DD and the Number ofPeople Living in Them by State on June30, 2003
StateAll
Residents AL 174 209 3,109 7%AK 350 350 1,050 33%AZ 257 e 365 3,521 10%AR 353 416 3,278 13%CA 16,267 e 16,267 50,900 32%CO 697 e 802 e 4,829 17%CT 428 e 857 6,610 13%DE 12 23 922 2%DC 21 21 1,180 2%FL 1,885 e 3,770 14,278 26%GA 999 1,923 4,970 39%HI 145 155 1,099 14%ID 928 928 2,912 32%IL
11,579 1,579 18,163 9%
IN2
DNF 4,586 10,097 45%IA 999 e 3,154 e 6,537 48%KS 1,178 1,178 4,963 24%KY 301 353 4,113 9%LA 1,067 e 1,637 7,332 22%ME 457 471 3,146 15%MD 1,103 e 1,139 7,549 15%MA 1,568 1,568 10,768 15%MI3 DNF 1,726 10,546 16%MN 1,743 e 2,615 e 13,632 19%MS 323 323 3,538 9%MO 2,252 2,252 6,466 35%MT 410 441 1,632 27%NE 702 840 3,169 27%NV 542 976 1,245 78%NH 403 403 1,767 23%NJ 812 812 10,993 7%NM 381 512 1,920 27%NY DNF 7,729 44,892 17%NC DNF 2,135 12,466 17%ND 1,029 1,029 2,017 51%OH DNF 4,530 16,634 27%OK 805 1,973 5,383 37%OR 710 710 5,173 14%PA 1,554 1,879 22,110 8%RI 581 670 1,992 34%SC DNF 607 4,620 13%SD 575 655 2,234 29%TN 1,217 1,865 4,660 40%TX 2,665 e 2,665 e 19,708 14%UT 574 e 621 2,832 22%VT 157 165 1,173 14%VA DNF 1,132 6,557 17%WA 1,309 e 3,352 8,020 42%WV 391 747 1,884 40%WI 5,344 5,344 12,787 42%WY 136 138 905 15%Reported US Total
55,383 90,597 402,281 23%
Estimated US Total
73,623 90,597 402,281 23%
e = estimate1 FY 2000 data
3 FY 2001 data
2 unable to separate "own home" and "family home" data; using 50% of total of 9,173
DNF = did not furnish
Number of Homes
People in Their Own
Homes% In Own
Home

45
Table 2.9 Number of People with ID/DD Receiving Services WhileLiving in the Home of a Family Member on June 30, 2003
StateAL 3,200 6,309 51%AK 3,700 4,750 78%AZ 18,474 e 21,995 84%AR 1,031 4,309 24%CA 134,476 185,376 73%CO 6,683 e 11,512 e 58%CT 7,224 e 13,834 52%DE 1,415 2,337 61%DC 514 1,694 30%FL 27,240 41,518 66%GA 4,138 9,108 45%HI 1,926 3,025 64%ID 7,989 10,901 73%IL
111,864 30,027 40%
IN24,587 14,684 31%
IA 2,706 e 9,243 29%KS 6,237 11,200 56%KY 5,013 9,126 55%LA 4,120 11,452 36%ME 657 3,803 17%MD 2,128 9,677 22%MA 20,106 30,874 65%MI3 7,268 17,814 41%MN 13,410 27,042 50%MS 1,904 5,442 35%MO 9,171 15,637 59%MT 2,330 3,962 59%NE 195 3,364 6%NV 1,927 3,172 61%NH 192 1,959 10%NJ 20,150 31,143 65%NM 1,153 3,073 38%NY 81,456 126,348 64%NC 16,820 29,286 57%ND 523 2,540 21%OH 12,535 29,169 43%OK 3,848 9,231 42%OR 3,901 9,074 43%PA 1,187 23,297 5%RI 714 2,706 26%SC 14,320 18,940 76%SD 822 3,056 27%TN 3,367 8,027 42%TX 3,504 e 23,212 15%UT 1,602 4,434 36%VT 1,179 2,352 50%VA 3,157 9,714 32%WA 9,656 17,676 55%WV 1,935 e 3,819 51%W I 5,638 18,425 31%WY 712 1,617 44%Total Reported 500,004 902,285 55%1 FY2000 data e = estimate2 unable to separate "own home" and "family home" data; using 50% of total of 9,173
3 FY 2001 data
Service Recipients in Family Homes
Total Service Recipients in Family Homes &
Residential Settings
Service Recipients in Family Homes as a % of
All Service Recipients

4646

47
Chapter 5Changing Patterns in Residential Service Systems: 1977-2003
Robert W. Prouty, K. Charlie Lakin, and Robert Bruininks
Changing Patterns in Residential Settings
Table 2.10 presents summary statistics on the numberof residential settings in which services were providedto persons with intellectual disabilities and relateddevelopmental disabilities (ID/DD) by state licensednonstate agencies on June 30th of 1977, 1982, 1987,1992, 1997, 2002 and 2003. Totals are reported bytype of operator (state or nonstate) and size ofresidential setting (6 or fewer residents, 7-15residents, and 16 or more residents).
Between 1977 and 2003 the estimated total num-ber of residential settings in which services to per-sons with ID/DD were provided increased from 11,008to 145,581 (1,223%). All of this growth occurred insettings with 15 or fewer residents, with settings of 7-15 residents increasing by an estimated 195% (4,686settings) and settings with 6 or fewer residents in-creasing by an estimated 1,892% (130,509 settings).
Of the estimated increase of 130,509 in residen-tial settings with 6 or fewer residents between 1977and 2003, 128,845 of these settings (98.7%) weresupported by employees of nonstate agencies. Thenumber of residential settings with 16 or more resi-dents decreased by 662 (36.5%) between 1977 and2003, with the number of large nonstate facilities de-clining by an estimated 529 (38.4%). The net in-
crease in all nonstate residential settings (132,326)accounted for 98.3% of the overall increase in all resi-dential settings. There was a decrease of 93 large(16 or more residents) state residential settings(28.4%), and an increase of 2,340 state communityresidential settings (15 or fewer residents) during thesame period (1,695.7%).
Community settings of 15 or fewer residents in-creased by 1,453.2% to 144,498 total settings. Virtu-ally all (96.5%) of the increase in the number of com-munity settings (15 or fewer residents) occurred insettings with six or fewer residents.
Between 1977 and 2003 there was considerablestability in the proportions of residential settings op-erated by state and nonstate agencies. Between 1977and 2003 the nonstate share of all community resi-dential settings of 15 or fewer residents decreasedslightly from 98.5% to 98.3%. During the same pe-riod the nonstate share of all large residential facili-ties decreased slightly from 80.8% to 78.4%. OnJune 30, 1977, 95.8% of all residential settings werenonstate operated; on June 30, 2003, 98.1% werenonstate operated.
The period between 1992 and 2003 brought thegreatest annual growth in number of community resi-dential settings ever recorded. Between 1992 and
Table 2.10 State and Nonstate Residential Settings for Persons with ID/DD on June30 of 1977, 1982, 1987, 1992, 1997, 2002 and 2003
Nonstate State TotalYear 1-6 7-15 16+ Total 1-6 7-15 16+ Total 1-6 7-15 16+ Total1977 6,855 2,310 1,378 10,543 43 95 327 465 6,898 2,405 1,705 11,0081982 10,073 3,181 1,370 14,624 182 426 349 957 10,255 3,607 1,719 15,5811987 26,475 4,713 1,370 32,558 189 443 287 919 26,664 5,156 1,657 33,4771992 41,444 5,158 1,320 47,922 382 852 323 1,557 41,826 6,010 1,643 49,4791997 87,917 5,578 1,040 94,535 1,047 702 246 1,995 88,964 6,280 1,286 96,5302002 116,189 5,880 1,026 123,095 1,634 453 233 2,320 117,823 6,333 1,259 125,415
2003 135,700 6,320 849 142,869 1,707 771 234 2,712 137,407 7,091 1,083 145,581
Residential Settings

48
2003 the number of community residential settingsincreased by 96,662 (202.1%) or an estimated aver-age of about 8,787 new settings per year. This in-cluded an annual average increase of 113 additionalstate community settings. As a point of comparison,between 1982 and 1992 total community settings in-creased at an annual average of 3,397 new settingsper year and state community settings had an aver-age increase of 63 facilities per year.
Changes in Number of ResidentialService Recipients
Table 2.11 presents summary statistics on the numberof residents with ID/DD in residential settings servedby state or nonstate agencies on June 30th of 1977,1982, 1987, 1992, 1997, 2002 and 2003. Totals arereported by type of operator (state or nonstate) andsize of residential setting (“community” settings with1-6 and 7-15 residents; and “large” facilities with 16or more residents).
Between 1977 and 2003 the total number of resi-dents of state and nonstate settings in which residen-tial services were provided to persons with ID/DD in-creased from 247,780 to an estimated 402,281, anincrease of 154,501 (62.4%) residents over the 26year period. All of this growth occurred in settingswith 15 or fewer residents. Of the estimated 289,383increase in residents of community residential set-tings between 1977 and 2003, 277,610 (95.9%) oc-curred in nonstate settings, 249,723 (90.0%) of whichoccurred in settings with 6 or fewer residents. Thenumber of residents of large nonstate residentialsettings (16 or more residents) decreased by 23,079(43.8%) between 1977 and 2003. There was, ofcourse, a dramatic decrease in the number of peoplereceiving residential services directly from state agen-cies, with a large decrease of 111,803 (72.3%) in thepopulation of large state residential facilities and amuch smaller increase of 11,773 residents of statecommunity residential settings.
Between 1977 and 1982 the resident populationof nonstate community settings increased at an av-erage annual rate of 4,377 persons; between 1982 to1992 the rate of population increase in nonstate com-munity settings more than doubled to an average an-nual rate of 10,318 persons. Between 1992 and 2003the average annual increase in nonstate communitysettings was 13,867 persons.
Between 1977 and 2003 the total population oflarge nonstate residential settings fluctuated consid-
erably. Between 1977 and 1982 it increased by 4,678persons, followed by a decrease of 15,315 between1982 and 1987. Between 1987 and 1992 there wasan increase of 3,724 large nonstate residential facil-ity residents as the OBRA 1987 nursing facility legis-lation (described in Chapter 6) caused many largeprivate settings once operated outside the ID/DD sys-tem as nursing facilities to be converted to ICFs-MRwithin the ID/DD system. Between 1992 and 2003the decrease of large nonstate facility residents wasagain evident with 16,166 fewer residents in 2003 thanin 1992. Between 1977 and 2003 the proportion ofall large facility residents living in nonstate facilitiesincreased from 25.4% to 40.9%.
In summary, while the total population of all resi-dential settings for persons with ID/DD increased by62.4% between 1977 and 2003, the number of resi-dents of large nonstate and large state residential fa-cilities declined significantly (43.8% in nonstate facili-ties; 72.3% in state facilities; 65.0% in all large facili-ties). The total population of state and nonstate com-munity residential settings increased dramatically(707% in nonstate settings; 1,009% in state settings;716% in all settings). Small settings with 6 or fewerresidents were most prominent in these increases.Residents of such settings increased more than thir-teen-fold (about 255,061 individuals) between 1977and 2003. During the most recent 6-year period,1997-2003, these trends have continued with an in-crease of 80,493 (41.3%) people living in residentialsettings of 6 or fewer residents.
Figure 2.4 depicts graphically the residential ser-vice trends from 1977 to 2003 summarized in Table2.10, with one change. In Figure 2.4 the categories ofresidents of state and nonstate community residen-tial settings are combined in two additional catego-ries, all residential settings with 1-6 residents and allresidential settings with 7-15 residents. This break-down shows that the rapid growth from June 30, 1977to June 30, 2003 in the number of people living incommunity residential settings of 15 or fewer resi-dents came primarily from growth in number of per-sons in residential settings with 1-6 residents. Thisbreakdown also clearly shows the significant decreasein the total population of large state and combinedlarge state and nonstate residential facilities.

49
Table 2.11 Persons with ID/DD in State and Nonstate Residential Settings on June 30of 1977, 1982, 1987, 1992, 1997, 2002 and 2003
Figure 2.4 Persons with ID/DD in State and Nonstate Residential Settings on June 30of 1977, 1982, 1987, 1992, 1997, 2002 and 2003
Data Points for Figure 2.4 Persons with ID/DD in State and Nonstate ResidentialSettings on June 30, 1977-2003
Nonstate Services State ServicesYear 1-6 7-15 16+ Total 1-6 7-15 16+ Total 1-6 7-15 16+ Total
1977 20,184 19,074 52,718 91,976 216 950 154,638 155,804 20,400 20,024 207,356 247,780
1982 32,335 28,810 57,396 118,541 853 1,705 122,750 125,308 33,188 30,515 180,146 243,849
1987 68,631 45,223 42,081 155,935 1,302 3,414 95,022 99,738 69,933 48,637 137,103 255,673
1992 118,304 46,023 45,805 210,132 1,371 7,985 74,538 83,894 119,675 54,008 120,343 294,026
1997 190,715 46,988 38,696 276,399 4,253 6,926 54,666 65,845 194,968 53,914 93,362 342,244
2002 258,709 46,728 30,676 336,113 5,532 7,029 44,066 56,627 264,241 53,757 74,742 392,740
2003 269,907 46,961 29,639 346,507 5,554 7,385 42,835 55,774 275,461 54,346 72,474 402,281
ResidentsTotal
050,000
100,000150,000200,000250,000300,000350,000400,000450,000
1977 1982 1987 1992 1997 2002 2003
Year
Res
iden
ts
All, 1-6 ResidentsAll, 7-15 ResidentsNonstate, 16+ ResidentsState, 16+ Residents
YearState, 16+ Residents
Nonstate, 16+ Residents
All, 7-15 Residents
All, 1-6 Residents
1977 154,638 52,718 20,026 20,4091982 122,750 57,396 30,515 33,1881987 95,022 42,081 51,637 66,9331992 74,538 45,805 54,008 119,6751997 51,485 36,599 53,942 202,2662002 44,066 30,676 53,757 264,2412003 42,835 29,639 54,346 275,461

50
Residential Settings, by Size, of Personswith ID/DD in 1982 and 2003
Figure 2.5 presents statistics on the number ofpersons with ID/DD receiving residential services,including nursing facility residents, by setting size in1982 and 2003. Residential services for the 437,286persons reported on June 30, 2003 provide a verydifferent profile than those of the 284,387 personswith ID/DD reported on June 30, 1982.
In 1982, more than three-fifths (63.3%) of all resi-dents lived in ID/DD settings of 16 or more persons,68% of whom were in state facilities. An additional14.3% were in generic nursing facilities. In total, in1982 more than three-quarters (77.6%) of personswith ID/DD receiving long-term services and support
Figure 2.5 Persons with ID/DD in Residential Settings of Different Sizes and Types onJune 30, 1982 and June 30, 2003
Data Points for Figure 2.5 Persons with ID/DD in Residential Settings of Different Sizes and Types on June 30, 1982 and June 30, 2003
Year1-3
Residents4-6
Residents7-15
Residents16+ Residents
/Nonstate16+ Residents
/StateNursing
Facilities1982 15,702 17,486 30,515 57,396 122,750 40,5382003 177,260 e 94,005 e 54,346 29,639 42,835 35,005
received them in residential settings. 11.7% lived insettings of 6 or fewer residents, with an additional10.7% in settings of 7 to 15 residents.
By 2003, three-fifths (63.0%) of all residents livedin ID/DD settings of 6 or fewer persons, with an addi-tional 12.4% living in settings of 7 to 15 persons. Onlyan estimated 72,474 (16.6%) were in ID/DD settingsof 16 or more residents, 59.1% of whom were in statefacilities. Generic nursing facility residents with ID/DD were 8.0% of the estimated total population inJune 2003. In total, in 2003 less than one-quarter(24.6%) of persons with ID/DD receiving long-termservices and support received them in institutionalsettings. Nevertheless this constituted about 107,500institutionalized individuals.
0 20,000 40,000 60,000 80,000 100,000 120,000 140,000 160,000 180,000 200,000
1-3 Residents
4-6 Residents
7-15 Residents
16+ Residents/Nonstate
16+ Residents/State
Nursing Facilities
Set
tin
gs
Residents
1982
2003

Section 3Status and Changes in
Medicaid Funded Residential andRelated Services

53
Chapter 6Background and Summary of Medicaid Long-Term CareProgramsThis chapter provides a brief overview of Medicaidprograms for persons with intellectual disabilities andrelated developmental disabilities (ID/DD) on whichstatistics are presented in Chapter 7.
Establishment of the ICF-MR Program
Before 1965 there was no federal participation in long-term care for persons with intellectual disabilities andrelated developmental disabilities. In 1965, Medicaidwas enacted as Medical Assistance, Title XIX of theSocial Security Act. It provided federal matching fundsfrom 50% to 83%, depending on each state’s percapita income, for medical assistance, includingSkilled Nursing Facilities (SNFs), for people in thecategories of elderly, blind, disabled, and dependentchildren and their families.
It was only shortly after the introduction of federalreimbursement for skilled nursing care in 1965 thatgovernment officials noted rapid growth in the num-ber of patients in SNFs. It was further documentedthat many of these individuals were receiving far moremedical care than they actually needed, at a greatercost than was needed, largely because of the incen-tives of placing people in facilities for which half ormore of the costs were reimbursed through the fed-eral Title XIX program. Therefore, in 1967, a lessmedically oriented and less expensive “IntermediateCare Facility” (ICF) program for elderly and disabledadults was authorized under Title XI of the SocialSecurity Act.
In 1971 the SNF and ICF programs were com-bined under Title XIX. Within the legislation combin-ing the two programs was a little noticed, scarcelydebated amendment that for the first time authorizedfederal financial participation (FFP) for “intermediatecare” provided in facilities specifically for people withID/DD. Three primary outcomes of the new ICF-MRlegislation appear to have been intended by propo-nents of this legislation: 1) to provide substantial fed-eral incentives for upgrading the physical environmentand the quality of care and habilitation being providedin large public ID/DD facilities; 2) to neutralize incen-tives for states to place persons with ID/DD in nonstate
nursing homes and/or to certify their large state facili-ties as SNFs; and 3) to provide a program for careand habilitation (“active treatment”) specifically fo-cused on the needs of persons with ID/DD rather thanupon medical care. It was also a way to enlist thefederal government in assisting states with their rap-idly increasing large state facility costs, which wereaveraging real dollar increases of 14% per year inthe five years prior to the passage of the ICF-MR leg-islation (Greenberg, Lakin, Hill, Bruininks, & Hauber,1985).
The ICF-MR program was initiated in a period ofrapid change in residential care for persons with ID/DD. By Fiscal Year 1973 state facility populationshad already decreased to 173,775 from their high of194,650 in Fiscal Year 1967 (Lakin, 1979). Never-theless, states overwhelmingly opted to certify theirpublic institutions to participate in the ICF-MR pro-gram, with two notable outcomes: 1) nearly every statetook steps to secure federal participation in payingfor large state facility services, and 2) in order to main-tain federal participation, most states were compelledto invest substantial amounts of state dollars in bring-ing large state facilities into conformity with ICF-MRstandards. Forty states had at least one ICF-MR cer-tified state facility by June 30, 1977. Nearly a billionstate dollars were invested in facility improvementefforts in Fiscal Years 1978-1980 alone, primarily tomeet ICF-MR standards (Gettings & Mitchell, 1980).
In the context of growing support for communityresidential services, such statistics were used by agrowing number of critics to charge that the ICF-MRprogram 1) had created direct incentives for main-taining people in large state facilities by providing fed-eral contributions to the costs of those facilities; 2)had diverted funds that could otherwise have beenspent on community program development into facil-ity renovations solely to obtain FFP; 3) had promotedthe development of large private ICF-MR facilities forpeople leaving large state facilities through availableFFP (11,943 people were living in large private ICFs-MR by June 1977); and 4) had promoted organiza-

54
tional inefficiency and individual dependency by pro-moting a single uniform standard for care and over-sight of ICF-MR residents irrespective of the natureand degree of their disabilities and/or their relativecapacity for independence. These criticisms, and thegrowing desire to increase residential opportunitiesin community settings, along with the continued de-sire of states to avail themselves of the favorableMedicaid cost-share, helped stimulate the develop-ment of community ICFs-MR and the eventual clarifi-cation by the Health Care Financing Administration(HCFA) of how the ICF-MR level of care could bedelivered in 4-15 person group homes.
Community ICF-MR Group Homes
Expansion of ICF-MR services to privately-operatedprograms in the late 1970s and the 1980s was a majordevelopment in the evolution of the program. Privateresidential facilities were not an issue at the time oforiginal ICF-MR enactment in 1971, probably be-cause: 1) most private facilities were already techni-cally covered under the 1967 amendments to theSocial Security Act authorizing private ICF programs,and 2) in 1971 large state facilities were by far thepredominant model of residential care. Indeed, the1969 Master Facility Inventory indicated a total popu-lation in nonstate ID/DD facilities of about 25,000,compared with a large state ID/DD facility populationof 190,000 (Lakin, Bruininks, Doth, Hill, & Hauber,1982).
Although Congressional debate about the ICF-MRprogram had focused on large public facilities, thestatute did not specifically limit ICF-MR coverage ei-ther to large public facilities, or to “institutions” in thecommon meaning of the term. The definition of “in-stitution” which served as the basis for participationin the ICF-MR program was (and remains) the onethat also covered the general ICF institution: “four ormore people in single or multiple units” (45 CFR Sec.448.60 (6) (1)). Although it cannot be determinedwhether Congress, in authorizing a “four or more bed”facility, purposely intended the ICF-MR benefit to beavailable in small settings, it does seem reasonableto suppose, in the absence of specific limitations, thatCongress was more interested in improving the gen-eral quality of residential care than it was in targetingspecific types of residential settings. ICF-MR regula-tions, first published in January 1974, also supportedthe option of developing relatively small settings, de-lineating two categories of ICFs-MR, those housing
16 or more people (“large”) and those housing 15 orfewer people (“community”) and providing severalspecifications that allowed greater flexibility in meet-ing ICF-MR standards in the smaller settings.
Despite the regulatory recognition of communityICFs-MR, the numbers of such ICFs-MR actuallydeveloped varied enormously among states and re-gions. In some DHHS regions (e.g., Region V) hun-dreds of community ICFs-MR were developed whileother regions (e.g., II and X) had none. By mid-1977three-quarters (74.5%) of the 188 community ICFs-MR were located in just two states (Minnesota andTexas), and by mid-1982 nearly half (46.4%) of the1,202 community ICFs-MR were located in Minne-sota and New York and nearly two-thirds (65.1%) werelocated in Minnesota, New York, Michigan and Texas.These variations reflected what some states and na-tional organizations considered a failure of HCFA todelineate clear and consistent policy guidelines forcertifying community settings for ICF-MR participa-tion and/or reluctance on the part of some regionalHCFA agencies to promote the option.
In response to continued complaints from thestates that there was a need to clarify policy regard-ing the certification of community ICFs-MR, in 1981HCFA issued “Interpretive Guidelines” for certifyingcommunity ICFs-MR. These guidelines did notchange the existing standards for the ICF-MR pro-gram, but clarified how the existing standards couldbe applied to delivering the ICF-MR level of care incommunity settings with 4 to 15 residents. The pub-lication of the 1981 guidelines was followed by sub-stantially greater numbers of states exercising the op-tion to develop community ICFs-MR. Ironically, theseguidelines were published in the same year (1981)that Congress enacted legislation that would give evengreater opportunity and flexibility to states to useMedicaid funding for community services through theMedicaid Home and Community Based Serviceswaiver authority (Section 2176 of P.L. 97-35).
Home and Community Based Services(HCBS)
Section 2176 of the Omnibus Budget ReconciliationAct of 1981 (P.L. 97-35), passed on August 13, 1981,granted the Secretary of Health and Human Servicesthe authority to waive certain existing Medicaid re-quirements and allow states to finance “noninstitu-tional” services for Medicaid-eligible individuals. The

55
Medicaid Home and Community-Based Services(HCBS) waiver program was designed to providenoninstitutional, community services to people whoare aged, blind, disabled, or who have ID/DD and who,in the absence of alternative noninstitutional services,would remain in or would be at a risk of being placedin a Medicaid facility (i.e., a Nursing Facility or an ICF-MR). Final regulations were published in March 1985and since then a number of new regulations and in-terpretations have been developed, although nonehave changed the fundamental premise of the pro-gram, that of using community services to reduce theneed for institutional services.
A wide variety of noninstitutional services are pro-vided in state HCBS programs, most frequently theseinclude service coordination/case management; in-home supports; vocational and day habilitation ser-vices; and respite care. Although not allowed to useHCBS reimbursements to pay for room and board,all states provide residential support services undercategories such as personal care, residential habili-tation, and in-home supports. HCBS recipients withID/DD use their own resources, usually cash assis-tance from other Social Security Act programs andstate supplements to cover room and board costs. InJune 2003 about 57.5% of HCBS recipients in thestates reporting such data received services in set-tings other than the home of natural or adoptive fam-ily members.
Given both its flexibility and its potential for pro-moting individualization of services, the HCBS pro-gram is recognized in all states as a significant re-source in the provision of community services as analternative to institutional care. Beginning in the early1990s, stringent standards that previously requiredstates to demonstrate reductions in projected ICF-MR residents and expenditures roughly equal to theincreases in HCBS participants and expenditureswere considerably relaxed and then dropped in the
1994 revision of the HCBS regulations. As a result,from 1992 to 2003 there was dramatic growth (545%)in the number of HCBS participants, even as the num-ber of ICF-MR residents declined by 27.5%. All statesnow provide HCBS and more than three times asmany persons with ID/DD (402,438) participate in theHCBS program as live in ICFs-MR (107,065).
Medicaid Nursing Facilities
Almost from the inception of Medicaid, states notedincentives for placing persons with ID/DD in Medic-aid certified nursing facilities. Almost as soon as thisbegan to happen, there was a sense among the ad-vocacy community that many more people with ID/DD were living in nursing homes than were appropri-ately served in them (National Association for Re-tarded Citizens, 1975). In 1987 Congress respondedto these and other criticisms of nursing facility care inthe Omnibus Budget Reconciliation Act (OBRA) of1987 (P.L. 100-203). Provisions of this legislationrestricted criteria for admissions to Medicaid reim-bursed nursing facilities, so that only those personsrequiring the medical/nursing services offered wouldbe admitted. Current residents not in need of nurs-ing services were required to be moved to “more ap-propriate” residential settings, with the exception ofindividuals living in a specific nursing home for morethan 30 months should they choose to stay. In eithercase nursing facilities were required to assure thateach person’s needs for “active treatment” (latertermed “specialized services”) were met. The esti-mated number of people with ID/DD in Medicaid-cer-tified nursing facilities in June 2003 (35,005), wasbased on direct reports from 47 states and Decem-ber 2000 data from the Minimum Data Set on nursingfacilities for non-reporting states. The estimated num-ber of nursing facility residents with ID/DD in June2003 was slightly less than the number in 1970(38,000), the year before the ICF-MR program be-gan and the number in 1986 (39,528), the year be-fore OBRA 1987 reform was enacted.

56

57
Chapter 7Utilization of and Expenditures for Medicaid Institutionaland Home and Community Based Services
K. Charlie Lakin, Barbara Polister, Kathryn Coucouvanis, and Robert W.ProutyThis chapter provides statistics on the utilization ofthe three primary Medicaid long-term care programsfor persons with intellectual disabilities and relateddevelopmental disabilities (ID/DD): Intermediate CareFacilities for (persons with) Mental Retardation (ICF-MR), Home and Community Based Services (HCBS),and Nursing Facilities (NF). These statistics are re-ported on a state-by-state basis, reflecting the inde-pendent state administration and the substantial vari-ability among states in the use of these programs.
ICF-MR Program Utilization on June 30,2003
Number of facilities. Table 3.1 presents state-by-state statistics on the number of ICFs-MR in the UnitedStates by size and state/nonstate operation on June30, 2003. The total of 6,645 ICFs-MR on June 30,2003 compares with 574 ICFs-MR reported on June30, 1977; 1,889 on June 30, 1982; 3,913 on June 30,1987; 6,512 on June 30, 1992; 7,249 on June 30,1997; 6,671 on June 30, 2000; 6,615 on June 30,2001 and 6,623 on June 30, 2002.
The period between June 1993 and June 1995provided the first ever decrease in the total numberof ICFs-MR. Between June 1993 and June 1995 therewas a substantial reduction of 664 from the 1993 to-tal of 7,611. The major contributor to this reductionwas New York which was operating 526 fewer ICFs-MR in 1994 than 1993, and 515 fewer in June 1995than in 1994, due to the conversion of communityICFs-MR (with 15 or fewer residents) to settings fi-nanced by the Medicaid Home and Community BasedServices (HCBS) waiver. Between 1995 and 2003,the total number of ICFs-MR has been somewhat vari-able: increasing by 136 settings between 1995 and1996 (112 of which served 6 or fewer residents), andby 166 settings between 1996 and 1997 (again mostlysettings with 6 or fewer residents). Between 1997and 1998 ICFs-MR decreased by 133 settings, andthen by another 363 settings between 1998 and 1999due to Michigan’s conversion of 436 nonstate ICFs-
MR of 6 or fewer residents to HCBS sites. Between2001 and 2002 the number of ICFs-MR increased by8 settings and by 22 between 2002 and 2003.
Over five-sixths (86.2%) of the 6,645 ICFs-MR onJune 30, 2003 were in the 13 states with 100 or moreICFs-MR each. Of these, over one-half (57.9%) wereconcentrated in four states (California, Indiana, NewYork, and Texas) with more than 500 ICFs-MR each.In contrast, 17 states with ICFs-MR had fewer than10 each and their combined total of 66 was just 1% ofall ICFs-MR. Alaska had no ICFs-MR.
The vast majority of all ICFs-MR (89.5%) on June30, 2003 were community settings (15 or fewer resi-dents), of which more than three-fifths (62.2%) hadsix or fewer residents. Most (82.6%) of all ICFs-MRwith six or fewer residents were in seven states (Cali-fornia, Indiana, Louisiana, Minnesota, North Carolina,Pennsylvania, and Texas) with more than 100 ICFs-MR each. Nineteen states reported no ICFs-MR withsix or fewer residents and twelve states reported nocommunity ICFs-MR of any size.
Four states (Alaska, District of Columbia, Hawaii,and Vermont) reported having no large ICFs-MR onJune 30, 2003. Twenty-one other states reported hav-ing five or fewer large ICFs-MR. Two-fifths (41.8%)of all large ICFs-MR were located in four states with50 or more large ICFs-MR each (Florida, Illinois, NewYork, and Ohio) and almost two-thirds (57.8%) werein the seven states with 30 or more large ICFs-MReach.
Most large ICFs-MR (67.6%) were operated bynonstate agencies. Almost all ICFs-MR (98.9%) withsix or fewer residents were nonstate operated, as werealmost all ICFs-MR (96.8%) of 7 to 15 residents. Ofthe total 6,645 ICFs-MR reported on June 30, 2003,6,303 (94.9%) were operated by nonstate agencies.
Number of residents. Table 3.2 presents state-by-state statistics on the number of people residing in

58
Table 3.1 ICF-MR Certified Settings by State and Size on June 30, 2003
State 1-6 7-15 1-15 16+ Total 1-6 7-15 1-15 16+ Total 1-6 7-15 1-15 16+ TotalAL 0 0 0 4 4 0 3 3 0 3 0 3 3 4 7AK 0 0 0 0 0 0 0 0 0 0 0 0 0 0 0AZ 0 4 4 1 5 0 0 0 1 1 0 4 4 2 6AR 0 0 0 6 6 0 31 31 4 35 0 31 31 10 41CA 0 0 0 7 7 1,158 0 1,158 12 1,170 1,158 0 1,158 19 1,177CO 0 0 0 2 2 4 0 4 0 4 4 0 4 2 6CT 0 0 0 7 7 61 2 63 0 63 61 2 63 7 70DE 0 0 0 1 1 0 0 0 1 1 0 0 0 2 2DC 0 0 0 0 0 80 43 123 0 123 80 43 123 0 123FL 0 0 0 4 4 38 0 38 49 87 38 0 38 53 91GA 0 0 0 8 8 0 0 0 1 1 0 0 0 9 9HI 0 0 0 0 0 16 0 16 0 16 16 0 16 0 16ID 0 0 0 1 1 25 40 65 0 65 25 40 65 1 66IL 0 0 0 9 9 43 a 216 a 259a 51a 310 a 43 a 216 a 259a 60 319IN 0 0 0 6 6 179 331 510 6 516 179 331 510 12 522IA 0 0 0 2 2 65 e 37 e 102 25e 127 65 e 37 e 102 27 e 129 e
KS 0 0 0 2 2 14 15 29 2 31 14 15 29 4 33KY 0 3 3 3 6 0 0 0 4 4 0 3 3 7 10LA 12 0 12 10 22 323 118 441 10 451 335 118 453 20 473ME 0 3 3 0 3 6 13 19 2 21 6 16 22 2 24MD 0 0 0 4 4 0 0 0 0 0 0 0 0 4 4MA 0 0 0 6 6 0 0 0 0 0 0 0 0 6 6MI 0 0 0 1 1 0 0 0 0 0 0 0 0 1 1MN 15 0 15 1 16 123 106 229 36 265 138 106 244 37 281MS 1 59 60 5 65 0 0 0 5 5 1 59 60 10 70MO 0 0 0 10 10 1 6 7 1 8 1 6 7 11 18MT 0 0 0 2 2 0 0 0 0 0 0 0 0 2 2NE 0 0 0 1 1 0 1 1 2 3 0 1 1 3 4NV 0 0 0 2 2 16 1 17 0 17 16 1 17 2 19NH 0 0 0 0 0 0 0 0 1 1 0 0 0 1 1NJ 0 0 0 7 7 0 0 0 2 2 0 0 0 9 9NM 1 0 1 0 1 24 18 42 1 43 25 18 43 1 44NY 7 4 11 52 63 57 551 608 36 644 64 555 619 88 707NC 0 0 0 5 5 260 39 299 16 315 260 39 299 21 320ND 0 0 0 1 1 22 39 61 1 62 22 39 61 2 63OH 0 0 0 12 12 74 229 303 80 383 74 229 303 92 395OK 0 0 0 2 2 28 8 36 21 57 28 8 36 23 59OR 0 0 0 1 1 0 0 0 0 0 0 0 0 1 1PA 0 0 0 6 6 177 e 47 e 224e 22e 246 177 e 47 e 224e 28 e 252 e
RI 4 0 4 0 4 0 0 0 1 1 4 0 4 1 5SC 0 0 0 5 5 5 109 114 2 116 5 109 114 7 121SD 0 0 0 1 1 0 0 0 0 0 0 0 0 1 1TN 0 0 0 3 3 28 49 77 3 80 28 49 77 6 83TX 2 0 2 13 15 803 60 863 28 891 805 60 865 41 906UT 0 0 0 1 1 0 1 1 12 13 0 1 1 13 14VT 0 0 0 0 0 1 0 1 0 1 1 0 1 0 1VA 0 0 0 5 5 7 9 16 2 18 7 9 16 7 23WA 0 0 0 4 4 6 1 7 1 8 6 1 7 5 12WV 0 0 0 0 0 11 49 60 2 62 11 49 60 2 62WI 0 0 0 3 3 0 2 2 31 33 0 2 2 34 36WY 0 0 0 1 1 0 0 0 0 0 0 0 0 1 1US Total 42 73 115 227 342 3,655 2,174 5,829 474 6,303 3,697 2,247 5,944 701 6,645% of all ICFs-MR 0.6% 1.1% 1.7% 3.4% 5.1% 55.0% 32.7% 87.7% 7.1% 94.9% 55.6% 33.8% 89.5% 10.5% 100.0%a = FY2000 data e = estimate
All SettingsState Settings Nonstate Settings

59
ICFs-MR of different sizes and state/nonstate opera-tion on June 30, 2003. There was a total of 107,065ICF-MR residents on June 30, 2003. This representedthe tenth consecutive year of decrease in ICF-MRpopulations. The decrease of 3,507 residents in ICF-MR populations between June 2002 and June 2003exceeded annual decreases over the same calendarperiod between 2001 and 2002 (3,335), 2000 and2001 (2,534), 1999 and 2000 (1,476), 1997 and 1998(2,449), and 1996 and 1997 (2,752), but fell well shortof the decreases June-to-June in 1998-1999 (6,341),1995-1996 (5,406), 1994-1995 (7,263) and 1993-1994(6,611). Thirty-four states reported some reductionin their total population of ICF-MR residents betweenJune 30, 2002 and June 30, 2003. The largest re-duction was in California in which there were 1,026fewer ICF-MR residents on June 30, 2003 than onJune 30, 2002. In June 2003 the largest numbers ofICF-MR residents were in Texas (12,406), Illinois(10,053) and California (9,813), Alaska had none, andNew Hampshire, Rhode Island and Vermont each hadless than 50.
Nonstate ICFs-MR
Throughout the period from 1977 to 2003, there hasbeen a steady and substantial shift toward nonstateoperation of ICFs-MR, although significantly less thanthe shift toward nonstate residential services gener-ally. In 1977 there were 13,312 nonstate ICF-MR resi-dents. They made up only 12.5% of all ICF-MR resi-dents. In 1987, the 53,052 nonstate ICF-MR resi-dents were 36.8% of all ICF-MR residents and byJune 30, 1995, a majority (73,437 or 54.6%) of allICF-MR residents were in nonstate ICFs-MR. OnJune 30, 2003, there were 63,910 residents ofnonstate ICFs-MR and they made up 59.7% of allICF-MR residents, the same percentage as in June2002.
Large nonstate ICFs-MR. Most of the growth in thenumber of residents in large nonstate ICFs- MR tookplace in the decade between program inception and1982. There were 23,686 residents of large nonstateICF-MR facilities on June 30, 1982, 11,728 more thanon June 30, 1977. The ICF-MR certification of largenonstate facilities continued at a generally high rateuntil 1987, when there were 32,398 residents. Be-tween 1987 and 2003, large nonstate ICF-MR popu-lations decreased by 8,338 residents (an average of521 per year) to 24,060 persons with ID/DD on June30, 2003.
Nonstate community ICFs-MR. On June 30, 2003nonstate community ICFs-MR (15 or fewer residents)
made up 87.7% of all ICFs-MR, although only 37.2%of all ICF-MR residents lived in them. These num-bers compare with 26.0% of ICF-MR certified settingsand 1.3% of residents in 1977; 56.0% of settings and6.0% of residents in 1982; 70.3% of settings and14.3% of residents in 1987; 73.5% of settings and23.9% of residents in 1992; 87.3% of settings and34.6% of residents in 1997 and 87.0% of settings and36.9% of residents in 2002. Between 1982 and 2003,nonstate community ICFs-MR grew by 31,492 resi-dents as compared with 374 residents in largenonstate ICFs-MR.
Further broken down, on June 30, 2003 of the39,850 people living in nonstate community ICFs-MR,47.3% (18,865) were living in ICFs-MR of six or fewerresidents. In comparison, on June 30, 1982, 28.3%(2,364) of the 8,358 community nonstate ICF-MR resi-dents, were living in ICFs-MR of six or fewer resi-dents.
On June 30, 2003 the ten states with the greatestnumber of nonstate community ICF-MR residents(California, Illinois, Indiana, Louisiana, Minnesota,New York, North Carolina, Ohio, Pennsylvania andTexas) had 83.9% of all nonstate community ICF-MRresidents. California, New York and Texas each hadmore than 5,000 residents in nonstate communityICFs-MR. In contrast, the 10 states with the smallestresident populations had a total of only 0.9% of allresidents on June 30, 2003. Sixteen states had nononstate community ICFs-MR.
State ICF-MR Utilization
The proportion of ICF-MR residents living in state fa-cilities has been decreasing steadily since 1982. FY2003 was the eleventh year that fewer ICF-MR resi-dents lived in state settings than in nonstate settings(40.3% of all ICF-MR residents on June 30, 2003).
Large state ICFs-MR. Nationally on June 30, 2003,the population of large state ICFs-MR was 42,226(out of a total residential population of all large stateinstitutions of 43,155). Although the percentage oflarge state ID/DD facility residents living in ICF-MRcertified units increased from 88% to 98.6% between1982 and 2003, there was a large overall reduction inthe population of large state ICFs-MR. From June30, 1982 to June 30, 2003 there was a national netdecrease of 64,855 residents of large state ICFs-MR,as compared with a net increase of 14,583 residentsbetween June 30, 1977 and June 30, 1982.
Two major factors affected the rather notablechange from an average increase of about 2,917 per
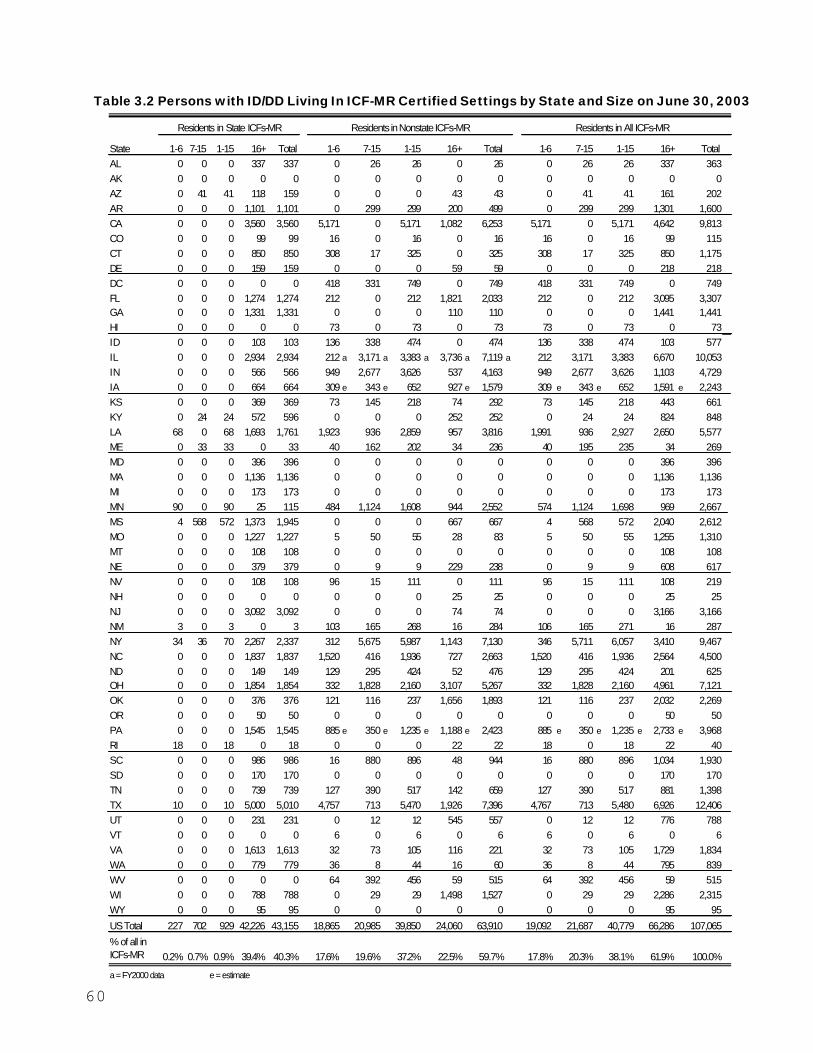
60
Table 3.2 Persons with ID/DD Living In ICF-MR Certified Settings by State and Size on June 30, 2003
Residents in All ICFs-MR
State 1-6 7-15 1-15 16+ Total 1-6 7-15 1-15 16+ Total 1-6 7-15 1-15 16+ TotalAL 0 0 0 337 337 0 26 26 0 26 0 26 26 337 363AK 0 0 0 0 0 0 0 0 0 0 0 0 0 0 0AZ 0 41 41 118 159 0 0 0 43 43 0 41 41 161 202AR 0 0 0 1,101 1,101 0 299 299 200 499 0 299 299 1,301 1,600CA 0 0 0 3,560 3,560 5,171 0 5,171 1,082 6,253 5,171 0 5,171 4,642 9,813CO 0 0 0 99 99 16 0 16 0 16 16 0 16 99 115CT 0 0 0 850 850 308 17 325 0 325 308 17 325 850 1,175DE 0 0 0 159 159 0 0 0 59 59 0 0 0 218 218DC 0 0 0 0 0 418 331 749 0 749 418 331 749 0 749FL 0 0 0 1,274 1,274 212 0 212 1,821 2,033 212 0 212 3,095 3,307GA 0 0 0 1,331 1,331 0 0 0 110 110 0 0 0 1,441 1,441HI 0 0 0 0 0 73 0 73 0 73 73 0 73 0 73ID 0 0 0 103 103 136 338 474 0 474 136 338 474 103 577IL 0 0 0 2,934 2,934 212 a 3,171 a 3,383 a 3,736 a 7,119 a 212 3,171 3,383 6,670 10,053IN 0 0 0 566 566 949 2,677 3,626 537 4,163 949 2,677 3,626 1,103 4,729IA 0 0 0 664 664 309 e 343 e 652 927 e 1,579 309 e 343 e 652 1,591 e 2,243KS 0 0 0 369 369 73 145 218 74 292 73 145 218 443 661KY 0 24 24 572 596 0 0 0 252 252 0 24 24 824 848LA 68 0 68 1,693 1,761 1,923 936 2,859 957 3,816 1,991 936 2,927 2,650 5,577ME 0 33 33 0 33 40 162 202 34 236 40 195 235 34 269MD 0 0 0 396 396 0 0 0 0 0 0 0 0 396 396MA 0 0 0 1,136 1,136 0 0 0 0 0 0 0 0 1,136 1,136MI 0 0 0 173 173 0 0 0 0 0 0 0 0 173 173MN 90 0 90 25 115 484 1,124 1,608 944 2,552 574 1,124 1,698 969 2,667MS 4 568 572 1,373 1,945 0 0 0 667 667 4 568 572 2,040 2,612MO 0 0 0 1,227 1,227 5 50 55 28 83 5 50 55 1,255 1,310MT 0 0 0 108 108 0 0 0 0 0 0 0 0 108 108NE 0 0 0 379 379 0 9 9 229 238 0 9 9 608 617NV 0 0 0 108 108 96 15 111 0 111 96 15 111 108 219NH 0 0 0 0 0 0 0 0 25 25 0 0 0 25 25NJ 0 0 0 3,092 3,092 0 0 0 74 74 0 0 0 3,166 3,166NM 3 0 3 0 3 103 165 268 16 284 106 165 271 16 287NY 34 36 70 2,267 2,337 312 5,675 5,987 1,143 7,130 346 5,711 6,057 3,410 9,467NC 0 0 0 1,837 1,837 1,520 416 1,936 727 2,663 1,520 416 1,936 2,564 4,500ND 0 0 0 149 149 129 295 424 52 476 129 295 424 201 625OH 0 0 0 1,854 1,854 332 1,828 2,160 3,107 5,267 332 1,828 2,160 4,961 7,121OK 0 0 0 376 376 121 116 237 1,656 1,893 121 116 237 2,032 2,269OR 0 0 0 50 50 0 0 0 0 0 0 0 0 50 50PA 0 0 0 1,545 1,545 885 e 350 e 1,235 e 1,188 e 2,423 885 e 350 e 1,235 e 2,733 e 3,968RI 18 0 18 0 18 0 0 0 22 22 18 0 18 22 40SC 0 0 0 986 986 16 880 896 48 944 16 880 896 1,034 1,930SD 0 0 0 170 170 0 0 0 0 0 0 0 0 170 170TN 0 0 0 739 739 127 390 517 142 659 127 390 517 881 1,398TX 10 0 10 5,000 5,010 4,757 713 5,470 1,926 7,396 4,767 713 5,480 6,926 12,406UT 0 0 0 231 231 0 12 12 545 557 0 12 12 776 788VT 0 0 0 0 0 6 0 6 0 6 6 0 6 0 6VA 0 0 0 1,613 1,613 32 73 105 116 221 32 73 105 1,729 1,834WA 0 0 0 779 779 36 8 44 16 60 36 8 44 795 839WV 0 0 0 0 0 64 392 456 59 515 64 392 456 59 515WI 0 0 0 788 788 0 29 29 1,498 1,527 0 29 29 2,286 2,315WY 0 0 0 95 95 0 0 0 0 0 0 0 0 95 95
US Total 227 702 929 42,226 43,155 18,865 20,985 39,850 24,060 63,910 19,092 21,687 40,779 66,286 107,065
% of all in ICFs-MR 0.2% 0.7% 0.9% 39.4% 40.3% 17.6% 19.6% 37.2% 22.5% 59.7% 17.8% 20.3% 38.1% 61.9% 100.0%
a = FY2000 data e = estimate
Residents in Nonstate ICFs-MRResidents in State ICFs-MR

61
year in the number of ICF-MR recipients living in largestate facilities between 1977 and 1982 to an averagedecrease of about 3,088 per year between 1982 and2003. Between June 30, 1977 and June 30, 1982states were increasing the proportion of their largestate ID/DD facility capacity certified to participate inthe ICF-MR program from about 60% of the nationaltotal to about 88%. Therefore, although states weredecreasing large state ID/DD facility populations overthe period by about a quarter, the number of newlycertified facilities led to an overall increase in personsliving in ICF-MR certified units.
By 1982, with 88% of large state ID/DD facility resi-dents already living in units with ICF-MR certification,the ongoing depopulation of these facilities causedsubstantial decreases in the number of residents inICF-MR units. The decreasing populations in largestate ID/DD facilities continues to reduce the extentto which the ICF-MR program is essentially a largestate ID/DD facility-centered program. In 2003, 39.4%of ICF-MR residents lived in large state ID/DD facili-ties. This compares with 87.1% in 1977; 76.3% in1982; 61.3% in 1987; 48.7% in 1992; and 42.1% in1997, and 39.4% in 2002.
State community ICFs-MR. On June 30, 2003 therewere only 115 state community ICFs-MR still operat-ing in the United States and only 929 (0.9%) of allICF-MR residents lived in these settings. This com-pares with 742 state community ICFs-MR and 6,526residents in June 1993. The dramatic decrease inthe number of people living in state community ICFs-MR began in FYs 1994 and 1995 as New York re-duced the number of persons living in state commu-nity ICFs-MR from 5,227 in June 1993 to 136. Thesechanges reflected little change in place of residence,but simple conversion of state community ICFs-MRto group homes financed through the Medicaid Homeand Community Based Services waiver. In FY 2003,more than three-fifths of the dwindling population ofstate community ICFs-MR lived in one state. Of thetotal 929 residents of state community ICFs-MR inJune 2003, 572 (61.6%) lived in Mississippi.
Figure 3.1 shows ICF-MR residents as a propor-tion of all persons receiving residential services instate and nonstate settings of different sizes on June30, 2003. As shown, 98.6% of large state ID/DD fa-cility residents lived in ICF-MR units, as did 81.2% oflarge nonstate facility residents (a combined total of91.5%). Nationally, 44.7% of the people living in
Figure 3.1 ICF-MR Residents as a Proportion of all Residents ofState and Nonstate Settings by Size on June 30, 2003
Data Points for Figure 3.1: ICF-MR Residents as a Proportion of All Residents of Stateand Nonstate Settings by Size on June 30, 2003
1-6 7-15 16+ Total 1-6 7-15 16+ TotalState 227 702 42,226 43,155 5,327 6,683 609 12,619Nonstate 18,865 20,985 24,060 63,910 251,042 25,976 5,579 282,597
ICF -MR Residents Non ICF-MR Residents
0
50,000
100,000
150,000
200,000
250,000
300,000
350,000
1-6 7-15 16+ Total 1-6 7-15 16+ Total
Res
iden
ts
ICF -MR Residents Non ICF-MR Residents
State Settings Nonstate Settings

62
Figure 3.2 Residents of ICFs-MR by Size and State/Nonstate Operation onJune 30, 1977, 1982, 1987, 1992, 1997 and 2003
Data Points for Figure 3.2: Residents of ICFs-MR by Size and State/NonstateOperation on June 30, 1977, 1982, 1987, 1992, 1997 and 2003
nonstate settings of 7 to 15 residents, and 7.0% ofthe people living in nonstate settings of six or fewerresidents resided in ICFs-MR. About 7.0% of statecommunity setting residents lived in ICFs-MR.
Figure 3.2 shows the proportion of all ICF-MR resi-dents living in each of the four types of ICFs-MR de-scribed above from 1977 to 2003. It shows the sub-stantial proportional growth in the number of residentsin ICFs-MR other than large residential facilities, butalso that large state residential facilities remain thesingle most frequently used setting for ICF-MR ser-vices.
Large and Community ICFs-MR
Table 3.3 reports the total number of persons with ID/DD who live in large (16 or more residents) and com-munity (15 or fewer residents) ICFs-MR, the numberwho live in all ICF/MR and non-ICF-MR residentialsettings for persons with ID/DD (402,281 residents),and the percentages of all residents of large and com-munity residential settings who were living in placeswith ICF-MR certification on June 30, 2003.
A total of 40,779 persons were reported living incommunity ICFs-MR nationwide on June 30, 2003
(38.1% of all ICF-MR residents). However, states var-ied greatly in their particular use of large and commu-nity ICFs-MR. Use of community ICFs-MR on June30, 2003 was dominated by seven states (California,Illinois, Indiana, Louisiana, New York, Ohio andTexas), each having more than 2,000 residents. To-gether they served 70.6% of all community ICF-MRresidents. Fourteen states had at least 50% of theirtotal ICF-MR population in community settings, whileeleven other states participating in the ICF-MR pro-gram had no residents in community ICFs-MR.
The “All Residents” columns of Table 3.3 presentstatistics on combined ICF-MR and non-ICF-MR(state and nonstate) residential services. It showsthat nationally on June 30, 2003, more than four-fifths(82.0%) of persons in all state and nonstate ICF-MRand non-ICF-MR residential programs were in set-tings with 15 or fewer residents.
The “Percentage in ICF-MR” columns of Table 3.3indicate the percentage of all ID/DD residential ser-vice recipients who were living in ICFs-MR by size ofresidential setting. It shows that 26.6% of all residen-tial service recipients nationally were in ICFs-MR, but
Year 1-15 Residents 16+ Residents Total 1-15 Residents 16+ Residents Total1977 356 92,498 92,854 1,354 11,958 13,3121982 1,627 107,081 108,708 8,358 23,686 32,0441987 2,874 88,424 91,298 20,654 32,398 53,0521992 6,366 71,279 77,645 34,908 33,707 68,6151997 1,264 54,636 54,636 43,880 28,181 72,0612003 929 42,226 43,155 39,850 24,060 63,910
State Settings Nonstate Settings
0
20,000
40,000
60,000
80,000
100,000
120,000
140,000
160,000
1977 1982 1987 1992 1997 2003Year
Res
iden
tsState 16+ Nonstate 16+ State 1-15 Nonstate 1-15
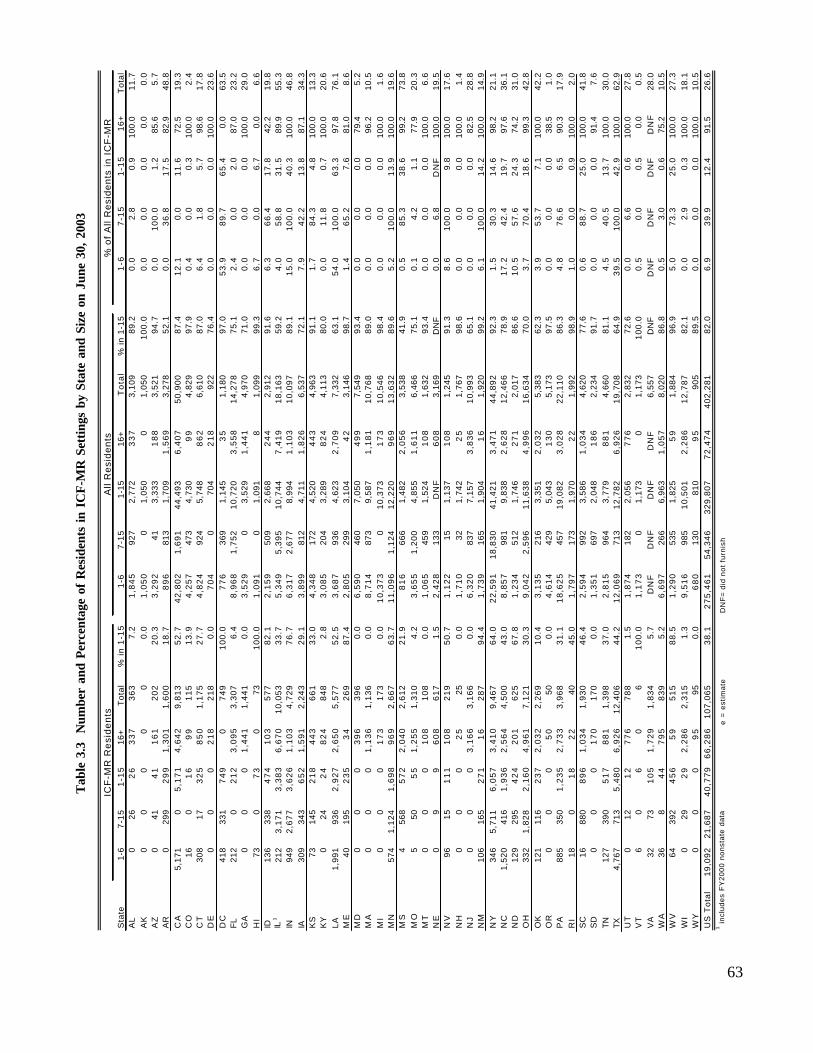
Sta
te1-
67
-15
1-1
516
+T
otal
% i
n 1
-15
1-6
7-1
51-
1516
+T
ota
l%
in
1-15
1-6
7-1
51
-15
16
+T
otal
AL
026
26
33
73
63
7.2
1,8
45
927
2,77
23
37
3,10
989
.20
.02.
80.
910
0.0
11.7
AK
00
00
00.
01
,05
00
1,05
00
1,05
01
00
.00
.00.
00.
00.
00.
0A
Z0
414
11
61
20
22
0.3
3,2
92
413,
333
18
83,
521
94.7
0.0
10
0.0
1.2
85.6
5.7
AR
029
92
99
1,3
01
1,6
00
18
.78
96
813
1,70
91
,56
93,
278
52.1
0.0
36
.81
7.5
82.9
48.8
CA
5,17
10
5,1
71
4,6
42
9,8
13
52
.74
2,8
02
1,6
91
44
,49
36
,40
75
0,9
00
87.4
12
.10.
01
1.6
72.5
19.3
CO
160
16
99
11
51
3.9
4,2
57
473
4,73
09
94,
829
97.9
0.4
0.0
0.3
100.
02.
4C
T30
817
32
58
50
1,1
75
27
.74
,82
492
45,
748
86
26,
610
87.0
6.4
1.8
5.7
98.6
17.8
DE
00
02
18
21
80.
07
04
070
42
18
922
76.4
0.0
0.0
0.0
100.
023
.6D
C41
833
17
49
07
49
10
0.0
77
636
91,
145
35
1,18
097
.05
3.9
89
.76
5.4
0.0
63.5
FL
212
02
12
3,0
95
3,3
07
6.4
8,9
68
1,7
52
10
,72
03
,55
81
4,2
78
75.1
2.4
0.0
2.0
87.0
23.2
GA
00
01
,44
11
,44
10.
03
,52
90
3,52
91
,44
14,
970
71.0
0.0
0.0
0.0
100.
029
.0H
I73
07
30
731
00
.01
,09
10
1,09
18
1,09
999
.36
.70.
06.
70.
06.
6ID
136
338
47
41
03
57
78
2.1
2,1
59
509
2,66
82
44
2,91
291
.66
.36
6.4
17
.842
.219
.8IL
121
23
,17
13
,38
36
,67
01
0,0
53
33
.75
,34
95
,39
51
0,7
44
7,4
19
18
,16
359
.24
.05
8.8
31
.589
.955
.3IN
949
2,6
77
3,6
26
1,1
03
4,7
29
76
.76
,31
72
,67
78,
994
1,1
03
10
,09
789
.11
5.0
10
0.0
40
.310
0.0
46.8
IA30
934
36
52
1,5
91
2,2
43
29
.13
,89
981
24,
711
1,8
26
6,53
772
.17
.94
2.2
13
.887
.134
.3K
S73
145
21
84
43
66
13
3.0
4,3
48
172
4,52
04
43
4,96
391
.11
.78
4.3
4.8
100.
013
.3K
Y0
242
48
24
84
82.
83
,08
520
43,
289
82
44,
113
80.0
0.0
11
.80.
710
0.0
20.6
LA1,
991
936
2,9
27
2,6
50
5,5
77
52
.53
,68
793
64,
623
2,7
09
7,33
263
.15
4.0
10
0.0
63
.397
.876
.1M
E40
195
23
53
42
69
87
.42
,80
529
93,
104
42
3,14
698
.71
.46
5.2
7.6
81.0
8.6
MD
00
03
96
39
60.
06
,59
046
07,
050
49
97,
549
93.4
0.0
0.0
0.0
79.4
5.2
MA
00
01
,13
61
,13
60.
08
,71
487
39,
587
1,1
81
10
,76
889
.00
.00.
00.
096
.210
.5M
I0
00
17
31
73
0.0
10
,37
30
10
,37
31
73
10
,54
698
.40
.00.
00.
010
0.0
1.6
MN
574
1,1
24
1,6
98
96
92
,66
76
3.7
11
,09
61
,12
41
2,2
20
96
91
3,6
32
89.6
5.2
10
0.0
13
.910
0.0
19.6
MS
456
85
72
2,0
40
2,6
12
21
.98
16
666
1,48
22
,05
63,
538
41.9
0.5
85
.33
8.6
99.2
73.8
MO
550
55
1,2
55
1,3
10
4.2
3,6
55
1,2
00
4,85
51
,61
16,
466
75.1
0.1
4.2
1.1
77.9
20.3
MT
00
01
08
10
80.
01
,06
545
91,
524
10
81,
632
93.4
0.0
0.0
0.0
100.
06.
6N
E0
99
60
86
17
1.5
2,4
28
133
DN
F6
08
3,16
9D
NF
0.0
6.8
DN
F10
0.0
19.5
NV
9615
11
11
08
21
95
0.7
1,1
22
151,
137
10
81,
245
91.3
8.6
10
0.0
9.8
100.
017
.6N
H0
00
25
250.
01
,71
032
1,74
22
51,
767
98.6
0.0
0.0
0.0
100.
01.
4N
J0
00
3,1
66
3,1
66
0.0
6,3
20
837
7,15
73
,83
61
0,9
93
65.1
0.0
0.0
0.0
82.5
28.8
NM
106
165
27
11
62
87
94
.41
,73
916
51,
904
16
1,92
099
.26
.11
00
.01
4.2
100.
014
.9N
Y34
65
,71
16
,05
73
,41
09
,46
76
4.0
22
,59
11
8,8
30
41
,42
13
,47
14
4,8
92
92.3
1.5
30
.31
4.6
98.2
21.1
NC
1,52
041
61
,93
62
,56
44
,50
04
3.0
8,8
57
981
9,83
82
,62
81
2,4
66
78.9
17
.24
2.4
19
.797
.636
.1N
D12
929
54
24
20
16
25
67
.81
,23
451
21,
746
27
12,
017
86.6
10
.55
7.6
24
.374
.231
.0O
H33
21
,82
82
,16
04
,96
17
,12
13
0.3
9,0
42
2,5
96
11
,63
84
,99
61
6,6
34
70.0
3.7
70
.41
8.6
99.3
42.8
OK
121
116
23
72
,03
22
,26
91
0.4
3,1
35
216
3,35
12
,03
25,
383
62.3
3.9
53
.77.
110
0.0
42.2
OR
00
05
050
0.0
4,6
14
429
5,04
31
30
5,17
397
.50
.00.
00.
038
.51.
0P
A88
535
01
,23
52
,73
33
,96
83
1.1
18
,62
545
71
9,0
82
3,0
28
22
,11
086
.34
.87
6.6
6.5
90.3
17.9
RI
180
18
22
404
5.0
1,7
97
173
1,97
02
21,
992
98.9
1.0
0.0
0.9
100.
02.
0S
C16
880
89
61
,03
41
,93
04
6.4
2,5
94
992
3,58
61
,03
44,
620
77.6
0.6
88
.72
5.0
100.
041
.8S
D0
00
17
01
70
0.0
1,3
51
697
2,04
81
86
2,23
491
.70
.00.
00.
091
.47.
6TN
127
390
51
78
81
1,3
98
37
.02
,81
596
43,
779
88
14,
660
81.1
4.5
40
.51
3.7
100.
030
.0TX
4,76
771
35
,48
06
,92
61
2,4
06
44
.21
2,0
69
713
12
,78
26
,92
61
9,7
08
64.9
39
.51
00
.04
2.9
100.
062
.9U
T0
121
27
76
78
81.
51
,87
418
22,
056
77
62,
832
72.6
0.0
6.6
0.6
100.
027
.8V
T6
06
06
10
0.0
1,1
73
01,
173
01,
173
10
0.0
0.5
0.0
0.5
0.0
0.5
VA
3273
10
51
,72
91
,83
45.
7D
NF
DN
FD
NF
DN
F6,
557
DN
FD
NF
DN
FD
NF
DN
F28
.0W
A36
84
47
95
83
95.
26
,69
726
66,
963
1,0
57
8,02
086
.80
.53.
00.
675
.210
.5W
V64
392
45
65
95
15
88
.51
,29
053
51,
825
59
1,88
496
.95
.07
3.3
25
.010
0.0
27.3
WI
029
29
2,2
86
2,3
15
1.3
9,5
16
985
10
,50
12
,28
61
2,7
87
82.1
0.0
2.9
0.3
100.
018
.1W
Y0
00
95
950.
06
80
130
810
95
905
89.5
0.0
0.0
0.0
100.
010
.5U
S T
ota
l1
9,0
92
21
,68
74
0,7
79
66
,28
61
07
,06
53
8.1
27
5,4
61
54
,34
63
29
,80
77
2,4
74
40
2,2
81
82.0
6.9
39
.91
2.4
91.5
26.6
1 i
ncl
ud
es
FY
20
00
no
nst
ate
da
tae
= e
stim
ate
DN
F=
did
no
t fu
rnis
h
ICF
-MR
Re
sid
en
tsA
ll R
esi
de
nts
% o
f A
ll R
esi
de
nts
in I
CF
-MR
Tab
le 3
.3
Num
ber
and
Perc
enta
ge o
f R
esid
ents
in I
CF-
MR
Set
tings
by
Stat
e an
d Si
ze o
n Ju
ne 3
0, 2
003
63

64
Figure 3.3 Percentage of All Residential Service Recipients in ICFs-MRon June 30, 2003
National Average= 26.6
that only 12.4% of all people living in community resi-dential settings were ICF-MR residents. In contrast,91.5% of residents of large residential facilities livedin ICF-MR certified units.
Figure 3.3 shows variations in utilization of ICF-MR services on a state-by-state basis. A total of fourstates reported more than 60% of their total residen-tial populations living in ICFs-MR on June 30, 2003.Twenty-seven states reported less than 20% of theirresidents in ICF-MR certified settings.
Figure 3.4 shows the number of people living inICF-MR and non-ICF-MR residential settings of 1-15and 16 or more total residents on June 30, 1977, 1982,1987, 1992, 1997, 2002 and 2003. It shows the de-creasing role of ICFs-MR in residential services andthe overall growth in the number of people living incommunity residential settings, both ICF-MR and non-ICF-MR.
In 1977, only 4.2% (1,710) of the total 40,400 per-sons in community residential settings were inICFs-MR; in 1982, 15.7% (9,985) of 63,700 personsin community residential settings; in 1987, 19.8%(23,528) of 118,570 residents; and at the highest pointever, in 1992, a quarter (25.1%), or 48,669 of 193,747total community setting residents, were living in ICFs-
MR. Since then, with greatly accelerated use of theMedicaid HCBS option, ICF-MR certification of com-munity residential settings decreased substantially. In2003 the 40,779 community ICF-MR residents wereonly 12.4% of all community residents, a decreasefrom 18.1% in 1997.
The expanded use of the HCBS option is reflectedin the rapid growth in the non-ICF-MR residential ser-vices since 1992. From the 103,000 persons in resi-dential settings without ICF-MR certification in 1982,at the end of the first year of the HCBS program, per-sons living in non-certified settings grew to 111,353in 1987 and to 147,655 in 1992, before increasingdramatically to 248,882 in 1997 and to 295,216 per-sons in 2003.
Between 1992 and 2003 total HCBS participantswith ID/DD grew by 545%. On June 30, 2003 an es-timated 231,427 individuals with ID/DD were receiv-ing HCBS financed residential services outside theirnatural or adoptive family home (see Table 3.12). InJune 2003, therefore, an estimated 68.4% of the338,492 persons with ID/DD who were living outsidetheir family home and who were receiving residentialservices financed by either ICF-MR or HCBS pro-grams, had those services financed through HCBS.
41.8 to 76.1 (9)23.6 to 41.8 (11)17.9 to 23.6 (10)
7.6 to 17.9 (10)0 to 7.6 (11)

65
Since 1982, the number of people receiving servicesoutside their family home financed by neither the ICF-MR program nor its HCBS alternative actually de-creased by about 37,997 to an estimated 63,789 per-sons (or about 15.9% of residential service recipients).
Expenditures for ICF-MR Services
Table 3.4 shows national totals and interstate varia-tions in ICF-MR program recipients and expendituresfor FY 2003. Since 1993, national expenditures forICFs-MR have increased from $9.2 billion in FY 1993to $11.5 billion dollars in FY 2003. In 2003, reportedICF-MR expenditures increased from the previousyear by 6.8%. It is notable, however, that while totalICF-MR expenditures increased by 25.0% betweenFY 1993 and FY 2003, the number of ICF-MR resi-dents decreased by 28.0% between June 30, 1993and June 30, 2003 (from 148,729 to 107,065). As aresult average ICF-MR expenditures per average dailyICF-MR resident increased between June 30, 1993and June 30, 2003 from $62,491 to $104,633 or anaverage increase of 6.7% per person per year.
Total ICF-MR expenditures of $11.5 billion dollarsin FY 2003 compare with $1.1 billion in FY 1977, $3.6
billion in FY 1982, $5.6 billion in FY 1987, $8.8 billionin FY 1992, $10.0 billion in FY 1997 and $10.7 billionin 2002. Before 1982 ICF-MR program expenditureswere pushed upward by both increased numbers ofrecipients and increased expenditures per recipient.Since 1982 growing expenditures per recipient havebeen the only significant factor in the increasing ex-penditures for providing ICF-MR services. BetweenJune 30, 1982 and June 30, 2003, average per per-son ICF-MR expenditures have increased by a com-pounded average of 6.7% per year.
In addition to the changing patterns in overall ex-penditures, there has also been a substantial reduc-tion in the past decade in the per resident rate of in-crease in expenditures for ICF-MR care. While perrecipient expenditures in the 12 years between 1975and 1987 increased from $5,530 to $38,150 per year,overall ICF-MR expenditures remain relatively stableand average per resident cost inflation of ICFs-MR inthe past ten years (6.8% on average per year) is lesscompared to other periods. For the most part, atten-tion now given to Medicaid services by federal andstate policy makers is directed toward issues of
Figure 3.4 Number of Residents in ICF-MR and Non ICF-MR Residential Settings with1-15 and 16 or More Total Residents on June 30, 1977, 1982, 1987, 1992, 1997, 2002
and 2003
0 50,000 100,000 150,000 200,000 250,000 300,000 350,000
ICF-MR 2003
Non ICF-MR 2003
ICF-MR 2002
Non ICF-MR 2002
ICF-MR 1997
Non ICF-MR 1997
ICF-MR 1992
Non ICF-MR 1992
ICF-MR 1987
Non ICF-MR 1987
ICF-MR 1982
Non ICF-MR 1982
ICF-MR 1977
Non ICF-MR 1977
Residents
Settings with 16+ residents Settings with 1-15 residents

66
Table 3.4 Summary Statistics on ICF-MR Expenditures for Persons with ID/DDby State for Fiscal Year 2003
State
Federal Cost
Share (%)
Total Federal ICF-MR
Payments ($)
State % of Federal ICF-
MR
End of Year
ICF-MR Residents
ICF-MR Expenditures per
End of Year Resident ($)
Average Daily
Residents in ICFs-MR
ICF-MR Expenditures
per Daily Resident ($)
State Population (100,000)
Annual Expenditure
per State Resident ($)
AL 54,566,007 70.60 38,523,601 0.59% 363 150,320 442 123,522 45.52 11.99
AK 0 58.27 NA NA 0 NA 0 NA 6.65 NA
AZ 13,936,642 67.25 9,372,392 0.14% 202 68,993 194 71,838 51.26 2.72
AR 120,675,042 74.28 89,637,421 1.50% 1,600 75,422 1,658 72,773 27.03 44.65
CA 653,090,087 50.00 326,545,044 5.46% 9,813 66,554 10,331 63,215 333.74 19.57
CO 20,545,000 50.00 10,272,500 0.17% 115 178,652 117 176,352 43.58 4.71
CT 246,911,096 50.00 123,455,548 2.07% 1,175 210,137 1,191 207,314 32.96 74.90
DE 28,514,265 50.00 14,257,133 0.24% 218 130,799 238 119,934 7.83 36.41
DC 78,838,985 70.00 55,187,290 0.92% 749 105,259 755 104,457 5.32 148.22FL 316,110,930 58.83 185,968,060 3.11% 3,307 95,588 3,316 95,343 158.62 19.93
GA 109,347,104 59.60 65,170,874 1.09% 1,441 75,883 1,487 73,560 82.40 13.27
HI 7,563,221 58.77 4,444,905 0.07% 73 103,606 84 90,038 12.91 5.86
ID 54,266,274 70.96 38,507,348 0.64% 577 94,049 579 93,805 14.27 38.04ILa
681,494,560 50.00 340,747,280 5.70% 10,053 67,790 10,074 67,649 121.98 55.87
IN 331,913,426 61.97 205,686,750 3.44% 4,729 70,187 4,934 67,277 61.76 53.74
IA 233,812,431 63.50 148,470,894 2.48% 2,243 104,241 2,415 96,827 29.22 80.01
KS 64,035,527 60.15 38,517,369 0.64% 661 96,877 710 90,191 27.33 23.43
KY 113,264,181 69.89 79,160,336 1.32% 848 133,566 865 130,979 40.59 27.90
LA 368,831,056 71.28 262,902,777 4.40% 5,577 66,134 5,562 66,319 45.02 81.93
ME 60,571,420 66.22 40,110,394 0.67% 269 225,173 265 228,787 12.65 47.88MD 57,640,951 50.00 28,820,476 0.48% 396 145,558 444 129,822 53.75 10.72
MA 220,310,836 50.00 110,155,418 1.84% 1,136 193,936 1,152 191,284 62.86 35.05
MI 23,541,186 56.42 13,281,937 0.22% 173 136,076 183 128,816 97.57 2.41
MN 195,215,567 50.00 97,607,784 1.63% 2,667 73,197 2,730 71,521 49.36 39.55
MS 184,000,113 76.62 140,980,887 2.36% 2,612 70,444 2,569 71,616 28.86 63.77
MO 227,025,574 61.23 139,007,759 2.33% 1,310 173,302 1,340 169,454 56.58 40.13
MT 11,480,253 72.96 8,375,993 0.14% 108 106,299 114 100,704 9.79 11.73
NE 49,170,975 59.52 29,266,564 0.49% 617 79,694 626 78,548 17.39 28.27
NV 24,825,043 52.39 13,005,840 0.22% 219 113,356 232 107,236 20.07 12.37
NH 1,865,866 50.00 932,933 0.02% 25 74,635 25 75,389 12.53 1.49
NJ 426,296,020 50.00 213,148,010 3.57% 3,166 134,648 3,285 129,790 83.06 51.32
NM 19,693,560 74.56 14,683,518 0.25% 287 68,619 286 68,979 19.59 10.05NY 2,439,086,391 50.00 1,219,543,196 20.40% 9,467 257,641 9,668 252,284 182.07 133.96
NC 418,466,631 62.56 261,792,724 4.38% 4,500 92,993 4,535 92,285 80.75 51.82
ND 51,650,764 68.36 35,308,462 0.59% 625 82,641 625 82,608 6.70 77.09
OH 991,909,033 58.83 583,540,084 9.76% 7,121 139,294 7,280 136,251 114.23 86.84
OK 111,600,170 70.56 78,745,080 1.32% 2,269 49,185 2,172 51,381 34.37 32.47
OR 8,151,250 60.16 4,903,792 0.08% 50 163,025 54 151,651 35.30 2.31
PA 509,008,044 54.69 278,376,499 4.66% 3,968 128,278 4,184 121,649 122.67 41.49
RI 6,979,980 55.40 3,866,909 0.06% 40 174,500 35 202,318 9.97 7.00
SC 167,696,107 69.81 117,068,652 1.96% 1,930 86,889 1,982 84,599 39.56 42.39
SD 18,508,657 65.29 12,084,302 0.20% 170 108,874 182 101,556 7.96 23.26
TN 255,674,647 64.59 165,140,254 2.76% 1,398 182,886 1,428 179,044 58.67 43.58TX 818,269,755 59.99 490,880,026 8.21% 12,406 65,958 12,688 64,490 209.96 38.97
UT 54,664,369 71.24 38,942,896 0.65% 788 69,371 782 69,948 23.51 23.25
VT 1,528,774 62.41 954,108 0.02% 6 254,796 9 169,864 6.23 2.45
VA 215,350,786 50.53 108,816,752 1.82% 1,834 117,421 1,863 115,594 71.60 30.08
WA 112,399,005 50.00 56,199,503 0.94% 839 133,968 866 129,866 60.70 18.52
WV 53,018,568 75.04 39,785,133 0.67% 515 102,949 515 102,999 18.42 28.78
WI 224,092,115 58.43 130,937,023 2.19% 2,315 96,800 2,490 90,015 54.24 41.31
WY 15,807,889 61.32 9,693,398 0.16% 95 166,399 100 158,475 5.47 28.90US Total 11,473,216,133 56.85 6,522,783,827 100.00% 107,065 107,161 109,652 104,633 2,814.41 40.77
NA = not applicablea includes FY2000 data
ICF-MR Expenditures ($)
67
systemwide expenditures, quality, and equity of ac-cess. States have much more attended to the rapidlygrowing HCBS alternative as the program focus ofthese considerations. However, cost managementin ICF-MR services remains a major concern in a num-ber of states, and opportunities to reallocate ICF-MRexpenditures to more flexible and less costly HCBSand similar services have been of growing interest tostates. Between 1992 and 2003 that interest wasexpressed in efforts to depopulate and close ICFs-MR, in efforts to simply “decertify” community ICFs-MR to finance them under HCBS, and in the explo-sive growth in HCBS enrollments (545% increase)as ICF-MR populations decreased by 27.5%.
Interstate Variations in ICF-MRExpenditures
There are major differences between states in theirexpenditures for ICF-MR services. The variability instate ICF-MR expenditures, and federal contributionsto those expenditures, is by no means predictablesolely by general factors such as total ICF-MR resi-dents or state size. Table 3.4 presents FY 2003 sta-tistics for ICF-MR expenditures across the states. Itshows total expenditures, federal expenditures, perrecipient average annual expenditures, per capitaannual ICF-MR expenditures (ICF-MR expendituresper resident of the state), and each state’s proportionof the total federal ICF-MR expenditures.
Per capita cost variations. One indicator of thevariation among states in ICF-MR expenditures is theaverage expenditure for ICF-MR services per resi-dent of the state. Table 3.4 shows the great variationin these expenditures among the states. While na-tionally in FY 2003 the average daily expenditure forICF-MR services was $40.77 per U.S. resident, theaverage varied from well over three times the nationalaverage in the District of Columbia and New York toless than one-third the national average in thirteenstates (Alabama, Arizona, Colorado, Georgia, Hawaii,Maryland, Michigan, Montana, Nevada, New Hamp-shire, New Mexico, Oregon, Rhode Island and Ver-mont). The variability in total and per resident expen-ditures among states is affected by two major fac-tors: the number of people living in ICFs-MR and theamount spent per resident.
Variations due to disproportionate placements.Variations in ICF-MR utilization rates across stateshave a direct effect on interstate differences in totalexpenditures and federal contributions. As an ex-
ample of the variability, on June 30, 2003, four stateshoused more than 60% of their total residential carepopulation in ICF-MR certified settings, and 27 stateshoused 20% or less of their residents in ICFs-MR.Obviously states with disproportionately high place-ment rates tended to account for disproportionateamounts of total ICF-MR expenditures.
Variations in per resident costs. Average cost ex-pended per ICF-MR resident is also a key factor intotal expenditures. Table 3.4 shows the enormousvariations among states in the average per residentexpenditures for ICFs-MR. The national average ex-penditures for ICF-MR services per recipient in FY2003 (total ICF-MR expenditures in the year dividedby the number of average daily recipients in 2003)was $104,633 per year. Among the states with thehighest per recipient expenditures in 2003 were Con-necticut ($207,314), Maine ($228,787), Massachu-setts ($191,284), New York ($252,284), Oregon($151,651), Rhode Island ($202,318) and Tennessee($179,044). Among the states with the lowest perrecipient expenditures were California ($63,215), In-diana ($67,277), Louisiana ($66,319), New Mexico($68,979), Oklahoma ($51,381) and Texas ($64,490).The effects of relatively high per resident expendi-tures are straightforward. Connecticut, Maine, Mas-sachusetts and New York had 11.2% of all ICF-MRaverage daily residents in FY03, but accounted for25.9% of total FY 2003 ICF-MR expenditures.
Medicaid HCBS Recipients
The Medicaid Home and Community Based Services(HCBS) program is associated with the ICF-MR pro-gram through its dedication to persons who but forthe services available through the Medicaid HCBSprogram would be at risk of placement in an ICF-MR.Between enactment of the Medicaid HCBS programin 1981 and June 30, 2003, all states have receivedauthorization to provide Home and Community BasedServices as an alternative to ICF-MR services. Thisgrowth in state participation is shown in Table 3.5.
At the end of the HCBS program’s first year onJune 30, 1982, there were 1,381 HCBS program par-ticipants. By June 30, 1987 there were 22,689 HCBSrecipients. On June 30, 1992 there were 62,429 per-sons with ID/DD receiving Medicaid Home and Com-munity Based Services. In just two years betweenJune 30, 1992 and June 30, 1994, states nearlydoubled again the number of HCBS recipients, withan increase of 95.5% to 122,075 residents. BetweenJune 1994 and June 1996 HCBS recipients increasedby 55.8% to 190,230 persons. Between June 30, 1996

68
Table 3.5a Summary Statistics on HCBS Recipients by State on June 30 ofYears 1982 through 1992
HCBS Recipients
State 1982 1983 1984 1985 1986 1987 1988 1989 1990 1991 1992AL 0 808 1,564 1,524 1,568 1,570 1,730 1,830 1,839 2,021 2,184AK 0 0 0 0 0 0 0 0 0 0 0AZ 0 0 0 0 0 0 0 0 0 3,794 4,832AR 0 0 0 0 0 0 0 0 91 196 415CA 0 433 619 2,500 2,962 3,027 2,493 3,355 3,628 3,360 3,360CO 0 0 600 920 1,280 1,389 1,621 1,679 1,841 1,993 2,204CT 0 0 0 0 0 0 644 1,127 1,555 1,655 1,693DE 0 0 0 50 78 81 144 100 196 245 290DC 0 0 0 0 0 0 0 0 0 0 0FL 0 0 7,003 7,003 1,003 2,631 2,631 2,542 2,615 2,631 2,637GA 0 0 0 0 0 0 0 25 160 353 359HI 0 0 10 24 44 56 78 70 123 189 452ID 0 0 18 51 25 55 201 270 346 165 225IL 0 0 40 543 543 664 637 680 724 1,338 2,006IN 0 0 0 0 0 0 0 0 0 0 0IA 0 0 0 0 0 4 12 14 5 19 137KS 0 0 23 186 173 135 185 314 361 497 555KY 0 0 475 516 516 609 652 728 743 762 819LA 0 2,006 2,046 2,087 0 0 0 0 0 56 939ME 0 0 75 165 353 400 450 453 454 509 509MD 0 0 28 356 464 685 716 813 858 1,082 1,972MA 0 0 0 235 525 593 593 1,210 1,539 1,700 3,288MI 0 0 0 0 2 3 580 1,292 1,658 2,122 2,741MN 0 0 0 239 570 1,423 1,896 2,068 2,184 2,551 2,890MS 0 0 0 0 0 0 0 0 0 0 0MO 0 0 0 0 0 0 0 338 989 1,452 2,241MT 21 44 69 78 192 210 286 274 276 355 444NE 0 0 0 0 0 0 553 540 658 683 710NV 0 34 80 90 108 129 117 136 133 135 136NH 0 0 303 409 504 541 634 762 822 955 1,059NJ 0 0 1,317 2,025 1,993 2,596 2,873 3,170 3,270 3,655 3,971NM 0 0 0 53 244 220 134 135 160 160 334NY 0 0 0 0 0 0 0 0 0 0 379NC 0 0 17 120 331 328 405 553 731 780 939ND 0 0 68 439 463 724 824 1,063 1,055 1,163 1,334OH 0 0 56 62 86 100 134 240 245 246 397OK 0 0 0 0 36 70 178 500 621 844 949OR 1,360 1,886 1,992 973 572 832 968 1,218 1,282 2,177 1,458PA 0 0 141 269 542 1,203 1,759 1,930 2,221 2,333 2,705RI 0 0 11 25 117 136 250 449 277 793 993SC 0 0 0 0 0 0 0 0 0 0 471SD 0 382 457 523 498 596 610 683 721 788 852TN 0 0 0 0 0 213 351 474 581 579 704TX 0 0 0 0 70 70 412 417 485 973 968UT 0 0 0 0 0 0 1,022 1,124 1,200 1,234 1,367VT 0 11 74 116 234 196 248 280 323 485 413VA 0 0 0 0 0 0 0 0 0 326 537WA 0 0 844 998 905 886 946 1,084 1,250 1,736 1,918WV 0 0 22 55 55 124 124 224 316 413 513WI 0 0 20 56 124 190 598 913 1,302 1,643 1,812WY 0 0 0 0 0 0 0 0 0 125 318
US Total 1,381 5,604 17,972 22,690 17,180 22,689 28,689 35,077 39,838 51,271 62,429States with HCBS 2 8 27 31 32 35 38 40 42 45 48
Note: Data source for 1982-85 is from Smith & Gettings, 1992

69
Table 3.5b Summary Statistics on HCBS Recipients by State on June 30 ofYears 1993 through 2003
State 1993 1994 1995 1996 1997 1998 1999 2000 2001 2002 2003AL 2,184 e 2,900 e 2,949 3,415 3,713 e 3,713 e 3,891 4,100 e 4,395 4,764 e 4,444 2,605AK 0 32 127 190 353 424 466 665 844 e 884 931 931AZ 6,071 6,773 7,117 7,727 8,508 9,248 10,180 11,259 12,317 13,471 14,494 14,494AR 453 429 469 472 496 646 1,647 2,084 2,423 2,494 e 2,644 2,553CA 11,085 13,266 19,101 29,133 37,478 33,202 30,386 28,233 29,044 44,205 53,775 50,147CO 2,407 2,684 3,316 3,976 4,276 4,928 6,043 6,330 e 6,444 e 6,516 e 6,779 e 4,938CT 2,069 2,361 2,542 2,999 3,371 3,380 4,493 5,076 5,508 5,972 5,825 1 4,270DE 290 310 356 352 379 382 455 481 518 547 614 418DC 0 0 0 0 0 0 0 67 224 225 226 226FL 6,009 6,430 7,988 10,000 e 11,399 12,728 13,809 21,126 24,910 25,921 24,301 21,686GA 359 e 556 848 1,619 e 2,332 2,400 2,847 2,468 4,051 8,190 8,902 8,742HI 450 513 491 517 560 759 975 1,089 1,335 1,560 1,772 1,649ID 174 333 362 415 434 441 509 801 1,031 1,139 1,302 956IL 2,850 4,590 3,761 5,267 5,400 6,037 6,500 6,787 6,787 2 6,787 2 9,785 9,061IN 447 529 594e 816 e 1,067 e 1,405 e 1,554 e 2,081 2,646 3,802 7,983 3 7,983IA 170 879 1,669 e 2,575 e 3,932 e 4,058 e 4,118 4,603 5,503 6,228 e 7,229 e 7,224KS 1,066 1,339 1,613 3,146 3,872 4,891 5,120 5,442 5,835 6,239 6,340 5,979KY 855 e 887e 879e 924 e 1,040 e 1,035 e 1,039 e 1,279 1,542 1,807 2,033 1,290LA 1,134 1,543 1,926 2,100 2,048 2,407 2,973 3,629 4,008 4,232 4,809 4,809ME 509 742 742 1,000 1,078 1,345 1,610 1,834 2,052 2,440 2,458 2,004MD 2,437 2,787 2,898 3,306 3,392 3,353 3,660 4,959 6,013 6,768 7,593 6,735MA 3,288 5,130 7,800 8,027 8,027 10,317 10,678 10,375 11,196 11,315 11,764 10,225MI 2,885 3,367 3,842 5,207 6,199 5,708 8,024 8,287 e 8,550 8,550 8,688 1 7,030MN 3,408 4,385 4,740 5,422 6,097 6,710 7,102 7,948 14,470 14,735 14,754 12,570MS 0 0 0 65 231 413 550 850 1,720 1,673 1,908 1,908MO 2,622 3,057 3,511 5,685 6,282 7,238 7,926 8,238 8,419 8,143 7,861 6,872MT 504 546 646 807 891 931 929 1,206 1,235 1,452 1,685 1,409NE 991 1,257 1,169 1,834 2,010 2,124 2,252 2,307 2,398 2,419 2,769 2,111NV 186 172 278 361 374 392 800 795 e 1,090 1,083 1,040 907NH 1,032 1,303 1,570 1,906 2,063 2,262 2,276 2,475 e 2,750 2,779 2,835 2,013NJ 4,191 4,729 5,033 5,242 5,705 6,199 6,635 6,894 6,978 7,486 8,122 4,852NM 612 402 1,243 1,553 1,603 1,617 1,765 2,104 2,426 2,794 3,073 2,913NY 3,398 18,877 23,199 27,272 29,019 30,610 33,699 36,100 40,165 48,165 * 48,921 48,921NC 1,190 1,318 1,818 3,098 3,726 3,986 4,974 5,364 6,141 6,013 5,692 4,961ND 1,362 1,509 e 1,637 1,770 e 1,792 1,819 1,875 1,936 e 1,990 2,011 ** 2,187 1,132OH 1,120 2,399 2,593 2,593 2,646 3,968 5,325 5,624 5,661 7,858 10,093 9,848OK 1,287 1,693 1,955 2,260 2,497 2,586 2,795 2,983 3,605 4,100 4,253 3,632OR 2,023 2,136 2,500 e 2,523 2,586 3,704 5,500 e 5,824 7,225 8,017 7,214 5,932PA 3,795 4,303 5,525 6,076 8,931 e 10,149 10,119 16,830 19,513 24,969 25,550 e 23,329RI 1,192 1,333 1,304 1,914 2,178 2,296 2,393 2,471 2,567 2,674 2,790 2,513SC 586 966 1,475 2,074 3,412 3,701 4,073 4,370 4,563 4,793 5,005 5,005SD 923 1,004 1,157 1,295 1,457 1,619 1,971 1,991 2,168 2,295 2,359 1,638TN 587 964 1,399 3,021 3,293 3,823 4,315 4,311 4,537 4,340 4,430 3,849TX 968 1,564 2,728 3,658 4,753 5,666 6,058 e 6,406 7,304 7,873 8,471 7,986UT 1,476 1,590 1,693 e 2,128 2,315 2,647 2,857 3,1524 3,370 3,589 3,661 2,461VT 598 722 913 1,107 1,372 1,485 1,540 1,684 1,796 1,844 1,896 1,573VA 537 e 715 1,126 1,453 1,764 3,138 3,579 4,635 5,043 5,491 5,737 5,737WA 1,711 3,068 3,361 4,666 6,643 7,125 8,165 e 8,9845 9,413 9,900 10,165 8,915WV 637 803 1,121 1,337 1,441 1,679 1,851 1,945 2,396 2,796 3,139 2,823WI 2,017 2,315 3,382 5,063 6,558 7,273 8,375 9,547 10,686 9,474 10,615 6 9,313WY 459 565 719 864 916 1,054 1,112 1,226 1,354 1,507 1,522 1,522
US Total 86,604 122,075 149,185 190,230 221,909 239,021 261,788 291,255 328,159 374,329 402,438 362,600
States with HCBS 48 49 49 50 50 50 50 51 51 51 51 511 Federal FY2003 4 includes 427 recipients receiving day services only * Federal FY 2002 e=estimate2 FY2000 data
5 includes 1,288 clients receiving county day programs only ** 3/31/02
3 includes new support services waiver
6 as of 12/31/02; does not include Family Care Pilot Project
Net Change 1990/2003
HCBS Recipients

70
and June 30, 1999 HCBS recipients increased an-other 37.6% to a total of 261,788 persons. BetweenJune 30, 1999 and June 30, 2003 HCBS recipientsincreased by 140,650 (53.7%) to 402,438 individu-als.
States with the greatest increase in total recipi-ents between June 1990 to June 2003 were Califor-nia (50,147), Florida (21,686), New York (48,921), andPennsylvania (23,329). Between June 1990 and June2003, all states more than doubled HCBS recipients.
Expenditures for HCBS Recipients
Table 3.6 shows the total annual Medicaid expendi-tures for HCBS by state and national totals in each ofthe FYs 1987 through 2003. In the sixteen years be-tween June 30, 1987 and June 30, 2003, the numberof states providing HCBS increased from 35 to 51.During the same period, HCBS expenditures in-creased from $293,938,668 to $14,122,912,497(4,704.7%) as the number of HCBS recipients rosefrom 22,689 to 402,438 recipients (1,673.7%). NewYork’s HCBS expenditures of $2,120,120,221 (15.0%of the U.S. total) were the highest among all the statesin 2003. By contrast, in 1987, California led all stateswith HCBS expenditures of $42,499,500 (14.5% ofthe U.S. total).
Table 3.7 presents FY 2003 statistics for HCBSexpenditures across states including total expendi-tures, federal expenditures, per participant averageannual expenditures, per capita annual HCBS expen-ditures (HCBS expenditures per resident of the state),and each state’s proportion of the federal HCBS ex-penditures. FY 2003 HCBS expenditures were$14,122,917,497 for 402,438 end-of-year HCBS re-cipients. FY 2003 expenditures divided by end of yearHCBS recipients yielded an “average” cost per re-cipient of $35,093 Because large numbers of per-sons were being added to the HCBS program duringFY 2003, this statistic underestimates the annualizedaverage cost. Assuming persons were being addedto the HCBS program at an even rate all through theyear, the estimated average number of HCBS partici-pants during the year was 388,384. This yields anannualized average expenditure of $36,363. The un-adjusted “average” HCBS expenditure of $35,093 rep-resents a 65.3% increase over June 30, 1990, whenHCBS expenditures were 846 million dollars for39,838 recipients or $21,236 per recipient.
Per capita cost variations. Table 3.7 shows thevariation among states in HCBS expenditures per citi-
zen of the state. Nationally, in FY 2003, the averagedaily expenditure for HCBS per citizen was $50.18.The average varied from more than twice the nationalaverage in seven states (Connecticut, Maine, Minne-sota, New York, Rhode Island, Vermont and Wyoming)to one-third or less of the national average in fourstates (District of Columbia, Mississippi, Nevada, andTexas). The variability in total and per citizen expen-ditures among states is affected by both the numberof persons who received HCBS and the amount ofmoney spent per recipient.
Variations due to differences in per recipient ex-penditures. The average expenditures per HCBSparticipant is also a key factor in interstate differencesin total expenditures. Table 3.7 shows the substan-tial variations among the states in the average perparticipant expenditures. The national average ex-penditures for HCBS per recipient in FY 2003 (totalHCBS expenditures divided by total recipients onJune 30, 2003) was $35,093. Among the states withthe highest per recipient expenditures in 2003 wereAlaska ($61,889), Connecticut ($67,607), Delaware($73,981), Maine ($71,196), Minnesota ($54,008),New Mexico ($55,551), Rhode Island ($70,276) andTennessee ($62,571). The states with the lowest perrecipient expenditures were District of Columbia($15,518) and Mississippi ($14,858).
Variations due to disproportionate HCBS use .Variations in HCBS utilization rates across states havean important direct effect on interstate differences intotal and per capita expenditures. Nationally, on June30, 2003, HCBS recipients were 79.0% of the totalHCBS and ICF-MR recipient population. In threestates HCBS recipients made up less than 45% ofcombined HCBS and ICF-MR recipients, while in 19states HCBS recipients were more than 90% of thetotal HCBS and ICF-MR populations.
HCBS Recipients and Residents ofCommunity ICFs-MR
Table 3.8 summarizes the combined use of the Med-icaid HCBS and ICF-MR to provide community ser-vices within the individual states. On June 30, 2003there were 402,438 people receiving Medicaid HCBSservices and 40,779 persons living in communityICFs-MR. This combined total of community Medi-caid service recipients (443,217) was 87.0% of the509,503 total of all HCBS and ICF-MR recipients. Inall of the 51 states the majority of recipients of theMedicaid-financed long-term care for persons with ID/DD were served in HCBS or ICF-MR funded commu-nity programs. Forty states were serving three-quar-

71
Table 3.6a HCBS Expenditures in Thousands of Dollars by State for Years 1987 through 1995
State 1987 ($) 1988 ($) 1989 ($) 1990 ($) 1991 ($) 1992 ($) 1993 ($) 1994 ($) 1995 ($)AL 6,422.1 8,186.7 9,430.9 10,503.6 12,400.0 12,400.0 22,182.0 30,500.0 38,000.0AK 0.0 0.0 0.0 0.0 0.0 0.0 0.0 666.6 2,963.6AZ 0.0 0.0 0.0 0.0 80,100.0 98,716.4 114,161.8 109,357.8 164,160.5AR 0.0 0.0 0.0 425.0 1,802.5 11,250.0 10,391.1 14,057.1 10,471.8CA 42,499.5 38,458.1 47,932.8 50,496.6 54,048.9 54,048.9 92,414.7 133,839.1 254,508.0CO 18,015.8 31,399.3 34,871.9 38,720.3 52,713.6 60,191.5 63,488.3 77,602.3 107,034.2CT 0.0 5,417.6 26,677.0 59,179.8 61,575.0 83,575.0 139,890.6 135,134.0 152,291.2DE 851.3 1,766.1 3,391.9 3,585.1 4,704.8 5,105.1 9,667.5 9,074.4 12,352.9DC 0.0 0.0 0.0 0.0 0.0 0.0 0.0 0.0 0.0FL 11,636.2 13,904.8 18,900.0 17,766.0 18,000.0 20,246.0 38,674.5 67,760.4 99,540.1GA 0.0 0.0 500.0 1,939.0 5,065.3 10,250.0 15,068.1 17,300.0 17,300.0HI 541.5 645.3 1,187.9 1,915.4 3,051.9 4,385.2 8,620.3 12,000.0 13,405.5ID 0.0 726.6 1,067.6 1,648.0 2,148.0 1,188.0 2,700.0 2,035.0 2,245.4IL 11,732.1 13,356.6 14,500.0 19,100.0 16,900.0 79,600.0 34,478.0 57,553.8 51,957.0IN 0.0 0.0 0.0 0.0 0.0 0.0 483.5 4,016.2 16,863.3IA 0.0 42.3 53.7 42.0 53.7 773.5 2,477.3 4,025.3 16,702.0KS 637.7 845.2 759.5 4,373.0 11,670.0 13,737.3 36,813.1 32,031.9 40,720.0KY 12,011.7 13,201.4 13,500.0 13,818.0 16,257.0 19,821.0 24,505.7 25,165.3 27,820.2LA 0.0 0.0 0.0 0.0 203.8 1,785.0 13,085.5 25,000.0 37,958.4ME 6,545.3 7,751.6 11,681.1 12,315.6 12,500.0 13,250.0 23,607.0 23,738.0 15,290.9MD 25,265.4 23,661.7 34,346.8 34,346.8 42,978.8 72,326.5 64,502.0 119,236.5 125,131.1MA 3,819.9 15,800.0 26,200.0 43,779.5 57,028.6 90,000.0 74,222.4 204,300.0 231,500.0MI 79.8 22,353.0 34,812.6 41,500.0 58,635.3 81,039.0 78,234.7 90,300.0 182,400.0MN 13,382.5 24,370.7 46,944.4 55,185.0 79,344.1 95,380.7 107,234.6 127,711.2 137,928.0MS 0.0 0.0 0.0 0.0 0.0 0.0 0.0 0.0 0.0MO 0.0 0.0 9,085.0 13,818.0 28,372.8 65,792.0 75,838.4 80,547.5 80,122.0MT 4,131.5 4,300.8 4,723.5 5,235.6 7,692.6 10,826.7 13,515.9 15,564.4 17,105.2NE 0.0 5,897.4 11,086.0 1,338.7 19,569.0 25,521.6 24,169.4 32,271.4 22,276.8NV 1,541.6 1,688.0 1,665.2 1,587.5 2,235.9 2,400.0 2,295.4 2,060.4 3,180.4NH 13,129.1 18,981.1 25,505.9 31,564.8 39,200.0 44,400.0 53,026.3 64,005.4 70,389.7NJ 27,220.7 36,092.0 70,152.4 77,102.5 91,502.5 108,600.7 113,719.7 130,063.5 141,104.2NM 1,043.7 2,100.6 2,384.0 2,400.0 3,190.5 8,829.0 7,552.2 10,178.7 43,590.5NY 0.0 0.0 0.0 0.0 0.0 34,496.2 163,595.4 403,370.9 403,957.0NC 3,129.6 4,489.3 5,676.7 6,826.3 12,831.4 13,833.4 16,223.3 19,846.2 30,503.7ND 6,543.0 6,110.9 11,755.4 13,360.8 16,335.7 18,974.9 20,585.7 23,270.0 26,589.3OH 661.0 1,961.1 3,015.8 4,070.5 4,090.5 12,824.0 26,512.4 49,739.5 92,920.0OK 516.3 1,324.8 3,506.4 5,499.2 11,818.0 39,375.3 73,728.0 57,848.6 73,677.3OR 8,782.6 15,231.1 22,794.2 34,838.4 40,982.9 58,604.3 86,646.0 78,199.6 86,714.2PA 35,639.6 70,645.4 81,969.0 107,984.2 120,100.0 133,681.0 169,500.7 247,511.0 294,264.4RI 5,627.0 5,211.4 9,416.8 14,336.8 14,336.8 14,366.8 74,432.9 58,725.0 67,465.6SC 0.0 0.0 0.0 0.0 0.0 4,961.0 14,702.8 18,000.0 22,700.0SD 6,380.7 7,581.4 9,100.9 10,388.2 13,333.9 16,256.6 20,474.2 22,526.6 27,577.4TN 1,824.0 5,832.4 6,411.9 7,909.0 11,390.0 14,431.1 10,134.0 16,031.0 23,777.0TX 1,750.0 4,176.4 6,993.7 12,139.2 14,368.0 39,754.6 10,741.9 47,384.3 72,623.6UT 0.0 6,416.3 7,809.0 13,308.8 20,000.0 23,000.0 29,537.1 31,114.3 35,170.0VT 4,785.7 5,303.8 7,045.6 8,954.0 10,255.0 14,154.2 28,628.0 33,139.6 39,888.2VA 0.0 0.0 0.0 0.0 264.3 15,974.6 12,350.2 26,129.7 31,216.6WA 13,503.4 16,973.7 13,748.1 18,464.9 30,253.6 39,973.5 79,960.5 77,223.3 102,643.0WV 863.0 1,817.8 2,850.0 7,197.2 10,040.3 13,200.0 38,188.8 19,923.4 29,410.4WI 3,424.4 9,410.1 14,837.3 18,566.5 30,132.0 39,078.2 50,139.8 60,559.1 87,519.0WY 0.0 0.0 0.0 0.0 846.1 12,508.0 17,308.6 23,986.8 26,694.5US Total 293,938.7 453,432.8 658,290.9 827,529.9 1,144,323.0 1,654,856.8 2,180,368.7 2,971,625.1 3,711,624.2

72
Table 3.6b HCBS Expenditures in Thousands of Dollars by State for Years 1996 through 2003
State 1996 ($) 1997 ($) 1998 ($) 1999 ($) 2000 ($) 2001 ($) 2002 ($) 2003($)AL 45,690.0 72,327.4 77,000.0 77,810.0 96,422.2 98,004.8 120,395.5 e 148,744.6 e
AK 7,071.2 17,668.5 19,234.1 23,071.0 30,618.7 53,139.8 e 51,865.8 57,618.9AZ 189,920.6 203,897.5 211,970.6 252,771.0 287,561.7 322,608.0 386,529.1 332,106.3AR 13,238.1 12,063.3 16,814.7 25,213.1 34,048.5 43,009.0 53,076.9 55,975.6CA 314,614.0 355,246.0 436,829.4 461,810.0 478,275.3 532,303.6 853,788.1 e 928,760.0 e
CO 125,499.1 133,282.5 148,628.4 176,383.3 191,257.0 e 217,913.8 e 205,028.1 237,440.2CT 103,750.1 222,364.1 230,357.6 294,791.3 344,991.3 350,105.3 e 386,546.5 393,811.4DE 22,911.1 16,279.2 17,678.8 18,451.8 27,432.6 32,131.6 34,181.4 45,424.2DC 0.0 0.0 0.0 0.0 277.4 970.2 1,647.8 1 3,507.1FL 113,853.0 131,804.8 108,524.5 122,002.1 251,835.1 403,110.1 496,921.3 551,082.1GA 56,393.7 63,126.6 83,000.0 98,200.0 92,058.1 149,447.3 286,389.8 227,611.6HI 11,981.6 11,720.9 17,100.0 19,700.0 23,000.0 27,227.0 34,727.5 43,995.9 e
ID 7,814.9 9,996.5 9,076.9 10,804.4 16,279.3 23,180.5 27,804.3 36,035.7IL 58,434.7 116,000.0 151,000.0 149,300.0 140,200.0 140,200.02 140,200.02 285,368.2IN 23,461.3 33,300.6 34,323.8 73,133.6 73,046.1 107,430.9 198,630.0 267,608.2IA 32,212.5 48,271.5 51,737.0 74,235.2 88,572.7 106,033.6 127,081.3 142,647.2 e
KS 71,569.0 93,518.7 120,931.4 156,893.2 169,351.0 176,570.4 189,358.1 194,212.2KY 25,722.0 29,429.6 40,639.8 42,191.8 60,431.9 76,424.1 91,755.9 92,622.6LA 42,365.0 44,291.4 57,032.9 74,549.0 95,374.5 121,145.4 129,015.1 157,447.9ME 15,600.0 60,066.6 69,044.0 93,074.0 108,340.8 124,372.0 136,460.6 175,000.0MD 130,701.6 140,673.4 154,174.0 169,663.2 181,153.0 200,724.5 251,357.0 e 297,236.6MA 248,400.0 280,000.0 377,346.7 408,875.2 423,921.9 454,624.8 483,391.2 540,113.6MI 3 163,000.0 162,808.5 237,665.6 310,750.7 424,429.6 e 538,108.5 538,108.5 420,689.8 4
MN 215,225.0 260,223.2 311,247.6 355,967.5 408,223.7 508,066.4 699,687.0 796,837.6MS 25.8 631.0 1,526.4 2,640.9 4,421.9 10,414.4 20,699.3 28,348.3MO 137,227.7 155,017.9 168,970.0 186,560.5 198,881.7 219,298.7 235,897.0 230,180.8MT 20,399.9 22,500.0 26,300.0 27,315.1 33,561.6 36,886.2 42,005.4 59,850.9NE 45,063.0 58,901.0 67,147.9 77,806.9 84,257.5 89,063.0 108,402.2 109,030.3NV 4,640.2 4,877.3 8,353.3 9,182.0 12,245.0 e 20,046.6 24,367.3 27,432.1NH 80,460.1 89,427.2 97,407.3 102,433.8 99,742.7 113,414.4 117,921.6 118,532.8NJ 154,968.0 180,066.0 199,366.0 284,536.0 296,254.0 360,838.0 402,988.0 363,752.0NM 71,840.1 46,295.3 91,603.1 100,117.4 109,600.0 132,070.0 157,256.0 183,000.0NY 728,613.8 1,114,422.8 1,343,414.4 1,561,068.4 1,694,409.8 1,701,780.25 2,125,806.3 2,120,120.2NC 56,651.0 106,199.2 134,166.8 136,043.3 182,951.6 217,112.0 254,336.7 259,000.0 e
ND 28,924.5 30,176.0 33,850.1 37,634.4 41,961.9 44,856.2 47,531.2 49,235.2OH 91,365.2 90,058.2 108,500.0 179,811.8 178,002.9 195,088.8 245,009.4 392,420.4OK 104,988.4 93,593.0 119,327.7 134,251.3 147,633.0 177,065.3 222,356.1 205,536.7OR 99,133.7 105,178.1 127,803.0 161,500.0 232,255.3 292,334.0 361,704.8 285,540.3PA 340,698.9 415,399.5 446,453.6 532,018.0 677,863.1 789,398.9 977,487.2 1,044,794.1RI 80,600.0 107,961.8 125,265.5 97,626.8 145,629.0 149,671.0 160,859.5 196,070.6SC 32,600.0 51,300.0 70,200.0 92,203.0 111,100.0 132,300.0 142,500.0 146,580.0SD 33,903.1 38,738.7 40,462.0 47,366.8 49,960.4 53,865.2 58,935.2 62,745.4TN 71,431.4 72,738.5 96,592.9 135,111.0 159,937.1 201,248.8 205,313.6 277,187.6TX 82,982.5 159,896.1 210,371.2 261,474.0 269,268.0 305,889.9 321,670.6 346,975.0UT 40,827.0 50,793.7 58,316.4 65,767.7 74,301.9 82,351.4 88,991.0 94,610.1VT 45,137.8 47,980.3 51,557.6 54,437.8 60,014.2 68,534.5 74,856.2 77,823.5VA 50,479.1 67,429.9 88,557.3 113,354.5 144,547.9 174,353.9 198,911.2 228,194.2WA 97,771.9 105,005.6 115,511.4 128,863.3 183,834.6 203,064.3 214,490.5 236,271.8WV 36,075.3 43,659.5 57,750.7 66,636.0 87,636.0 97,574.5 120,217.7 141,395.8WI 103,000.0 155,238.0 193,666.2 237,380.2 273,005.5 300,057.9 312,784.9 344,729.1 6
WY 29,157.6 33,428.0 38,222.2 40,983.4 44,143.5 46,598.1 56,956.5 61,657.6US Total 4,714,394.1 5,965,273.4 7,133,408.6 8,363,765.7 9,644,522.5 10,922,984.5 e 13,224,202.0 14,122,912.5
5 data as of 03/31/01 e = estimate2 FY 2000 data 4 does not include lag report for FY03 6 as of 12/31/02; does not include Family Care Pilot Project
1 10/01/01 - 09/30/02 3 Federal Fiscal Year

73
Table 3.7 Summary Statistics on HCBS Expenditures by State for Fiscal Year 2003
State
State % of Federal HCBS
Payments
End of Year HCBS Recipients
Average Daily HCBS Recipients
*State Population (100,000)
Annual HCBS
Expenditure per State
Resident ($)
AL 148,744,647 70.60 105,013,721 1.32% 4,444 33,471 4,604 32,308 45.52 32.68
AK 57,618,903 58.27 33,574,535 0.42% 931 61,889 908 63,492 6.65 86.68AZ 332,106,304 67.25 223,341,489 2.81% 14,494 22,913 13,983 23,752 51.26 64.79
AR 55,975,593 74.28 41,578,670 0.52% 2,644 21,171 2,569 21,789 27.03 20.71CA 928,760,000 50.00 464,380,000 5.84% 53,775 17,271 48,990 18,958 333.74 27.83
CO 237,440,237 50.00 118,720,119 1.49% 6,779 35,026 6,648 35,719 43.58 54.49CT 393,811,368 50.00 196,905,684 2.48% 5,825 67,607 5,899 66,765 32.96 119.47DE 45,424,185 50.00 22,712,093 0.29% 614 73,981 581 78,250 7.83 58.01
DC 3,507,094 70.00 2,454,966 0.03% 226 15,518 226 15,553 5.32 6.59FL 551,082,052 58.83 324,201,571 4.08% 24,301 22,677 25,111 21,946 158.62 34.74
GA 227,611,569 59.60 135,656,495 1.71% 8,902 25,569 8,546 26,634 82.40 27.62HI 43,995,923 58.77 25,856,404 0.33% 1,772 24,828 1,666 26,408 12.91 34.09
ID 36,035,709 70.96 25,570,939 0.32% 1,302 27,677 1,221 29,525 14.27 25.26IL 285,368,202 50.00 142,684,101 1.79% 9,785 29,164 8,286 34,440 121.98 23.39
IN 267,608,232 61.97 165,836,821 2.08% 7,983 33,522 5,893 45,415 61.76 43.33IA 142,647,169 63.50 90,580,952 1.14% 7,229 19,733 6,729 21,200 29.22 48.81
KS 194,212,222 60.15 116,818,652 1.47% 6,340 30,633 6,290 30,879 27.33 71.05KY 92,622,607 69.89 64,733,940 0.81% 2,033 45,560 1,920 48,241 40.59 22.82LA 157,447,917 71.28 112,228,875 1.41% 4,809 32,740 4,521 34,830 45.02 34.97
ME 175,000,000 66.22 115,885,000 1.46% 2,458 71,196 2,449 71,458 12.65 138.34MD 297,236,634 50.00 148,618,317 1.87% 7,593 39,146 7,181 41,395 53.75 55.30
MA 540,113,642 50.00 270,056,821 3.39% 11,764 45,912 11,540 46,806 62.86 85.92MI 420,689,817 56.42 237,353,195 2.98% 8,688 48,422 8,619 48,810 97.57 43.11
MN 796,837,595 50.00 398,418,798 5.01% 14,754 54,008 14,745 54,043 49.36 161.43MS 28,348,250 76.62 21,720,429 0.27% 1,908 14,858 1,791 15,833 28.86 9.82
MO 230,180,844 61.23 140,939,731 1.77% 7,861 29,281 8,002 28,765 56.58 40.68MT 59,850,931 72.96 43,667,239 0.55% 1,685 35,520 1,569 38,158 9.79 61.16
NE 109,030,299 59.52 64,894,834 0.82% 2,769 39,375 2,594 42,032 17.39 62.69NV 27,432,108 52.39 14,371,681 0.18% 1,040 26,377 1,062 25,843 20.07 13.67NH 118,532,796 50.00 59,266,398 0.74% 2,835 41,811 2,807 42,228 12.53 94.63
NJ 363,752,000 50.00 181,876,000 2.29% 8,122 44,786 7,804 46,611 83.06 43.79NM 183,000,000 74.56 136,444,800 1.72% 3,073 59,551 2,934 62,383 19.59 93.42
NY 2,120,120,221 50.00 1,060,060,110 13.32% 48,921 43,338 48,543 43,675 182.07 116.44NC 259,000,000 62.56 162,030,400 2.04% 5,692 45,502 5,853 44,255 80.75 32.07
ND 49,235,223 68.36 33,657,198 0.42% 2,187 22,513 2,099 23,457 6.70 73.49OH 392,420,418 58.83 230,860,932 2.90% 10,093 38,880 8,976 43,721 114.23 34.35
OK 205,536,735 70.56 145,026,720 1.82% 4,253 48,327 4,177 49,213 34.37 59.80OR 285,540,299 60.16 171,781,044 2.16% 7,214 39,581 7,616 37,495 35.30 80.89
PA 1,044,794,054 54.69 571,397,868 7.18% 25,550 40,892 25,260 41,362 122.67 85.17RI 196,070,593 55.40 108,623,109 1.37% 2,790 70,276 2,732 71,768 9.97 196.70SC 146,580,000 69.81 102,327,498 1.29% 5,005 29,287 4,899 29,920 39.56 37.05
SD 62,745,447 65.29 40,966,502 0.51% 2,359 26,598 2,327 26,964 7.96 78.86TN 277,187,621 64.59 179,035,484 2.25% 4,430 62,571 4,385 63,213 58.67 47.25
TX 346,975,027 59.99 208,150,319 2.62% 8,471 40,960 8,172 42,459 209.96 16.53UT 94,610,074 71.24 67,400,217 0.85% 3,661 25,843 3,625 26,099 23.51 40.24
VT 77,823,489 62.41 48,569,639 0.61% 1,896 41,046 1,870 41,617 6.23 124.90VA 228,194,157 50.53 115,306,508 1.45% 5,737 39,776 5,614 40,647 71.60 31.87
WA 236,271,793 50.00 118,135,897 1.48% 10,165 23,244 10,033 23,551 60.70 38.92WV 141,395,773 75.04 106,103,388 1.33% 3,139 45,045 2,968 47,648 18.42 76.76
WI 344,729,117 58.43 201,425,223 2.53% 10,615 32,476 10,045 34,320 54.24 63.55WY 61,657,608 61.32 37,808,445 0.48% 1,522 40,511 1,515 40,712 5.47 112.74US Total 14,122,912,497 56.33 7,955,436,610 100.00% 402,438 35,093 388,384 36,363 2,814.41 50.18
*Source: US Census Bureau, Population Estimates Program, July 1, 2003.
Federal Cost Share
(%)
Total Federal HCBS Payments
($)HCBS
Expenditures ($)
HCBS Expenditures per Average
Daily Recipient ($)
HCBS Expenditures per End of
Year Recipient ($)

74
Table 3.8 HCBS Recipients and Community ICF-MR Residents by State on June 30, 2003
StateTotal HCBS
Recipients
Residents of Community
ICFs-MR
Residents of HCBS &
Community ICFs-MR
Residents of all ICFs-MR
ICF-MR & HCBS
Recipients
Community ICF-MR & HCBS as % of all
ICF-MR & HCBS Recipients
AL 4,444 26 4,470 363 4,807 93.0%AK 931 0 931 0 931 100.0%AZ 14,494 41 14,535 202 14,696 98.9%AR 2,644 299 2,943 1,600 4,244 69.3%CA 53,775 5,171 58,946 9,813 63,588 92.7%CO 6,779 16 6,795 115 6,894 98.6%CT 5,825 325 6,150 1,175 7,000 87.9%DE 614 0 614 218 832 73.8%DC 226 749 975 749 975 100.0%FL 24,301 212 24,513 3,307 27,608 88.8%GA 8,902 0 8,902 1,441 10,343 86.1%HI 1,772 73 1,845 73 1,845 100.0%ID 1,302 474 1,776 577 1,879 94.5%IL1 9,785 3,383 13,168 10,053 19,838 66.4%IN 7,983 3,626 11,609 4,729 12,712 91.3%IA 7,229 652 7,881 2,243 9,472 83.2%KS 6,340 218 6,558 661 7,001 93.7%KY 2,033 24 2,057 848 2,881 71.4%LA 4,809 2,927 7,736 5,577 10,386 74.5%ME 2,458 235 2,693 269 2,727 98.8%MD 7,593 0 7,593 396 7,989 95.0%MA 11,764 0 11,764 1,136 12,900 91.2%MI 8,688 0 8,688 173 8,861 98.0%MN 14,754 1,698 16,452 2,667 17,421 94.4%MS 1,908 572 2,480 2,612 4,520 54.9%MO 7,861 55 7,916 1,310 9,171 86.3%MT 1,685 0 1,685 108 1,793 94.0%NE 2,769 9 2,778 617 3,386 82.0%NV 1,040 111 1,151 219 1,259 91.4%NH 2,835 0 2,835 25 2,860 99.1%NJ 8,122 0 8,122 3,166 11,288 72.0%NM 3,073 271 3,344 287 3,360 99.5%NY 48,921 6,057 54,978 9,467 58,388 94.2%NC 5,692 1,936 7,628 4,500 10,192 74.8%ND 2,187 424 2,611 625 2,812 92.9%OH 10,093 2,160 12,253 7,121 17,214 71.2%OK 4,253 237 4,490 2,269 6,522 68.8%OR 7,214 0 7,214 50 7,264 99.3%PA 25,550 1,235 26,785 3,968 29,518 90.7%RI 2,790 18 2,808 40 2,830 99.2%SC 5,005 896 5,901 1,930 6,935 85.1%SD 2,359 0 2,359 170 2,529 93.3%TN 4,430 517 4,947 1,398 5,828 84.9%TX 8,471 5,480 13,951 12,406 20,877 66.8%UT 3,661 12 3,673 788 4,449 82.6%VT 1,896 6 1,902 6 1,902 100.0%VA 5,737 105 5,842 1,834 7,571 77.2%WA 10,165 44 10,209 839 11,004 92.8%WV 3,139 456 3,595 515 3,654 98.4%WI 10,615 29 10,644 2,315 12,930 82.3%WY 1,522 0 1,522 95 1,617 94.1%US Total 402,438 40,779 443,217 107,065 509,503 87.0%1 FY 2001 data

75
ters or more of their Medicaid-financed long-term carerecipients with ID/DD in community settings. Figure3.5 shows this variation on a state-by-state basis.
Figure 3.6 shows the total of large (16 or moreresidents) state and nonstate ICF-MR residents, com-munity state and nonstate ICF-MR residents, andHCBS recipients for 1977, 1982, 1987, 1992, 1997,2002 and 2003. It shows the dramatic increase inMedicaid community service recipients from 1977 to2003, from 1,710 to 443,217. It also shows the sub-stantial decrease of the population of large ICFs-MRfrom 1982 to 2003, from 130,767 to an estimated66,286.
ICF-MR and HCBS Recipients andExpenditures
Medicaid Intermediate Care Facilities (ICFs-MR) andHome and Community Based Services (HCBS) sharecommon eligibility criteria and are intended to servethe same general population. Yet, as reported in Table3.9, expenditures for ICF-MR and HCBS services tendto be disproportionately higher in the former. In 2003,nationally, HCBS recipients made up 79.0% of thetotal HCBS and ICF-MR recipient population but usedonly 55.2% of total HCBS and ICF-MR expenditures.FY 2001 was a milestone in that for the first time ever,HCBS expenditures were greater than for ICFs-MR.
HCBS and ICF-MR recipients and expendituresvaried among individual states but in most states theHCBS share of total expenditures was disproportion-ately low when measured against the HCBS share oftotal recipient population. In three states (District ofColumbia, Mississippi, and Ohio), HCBS recipientsas a proportion of all recipients exceeded HCBS ex-penditures as a proportion of all expenditures by afactor of 2 or greater.
Direct comparisons of the costs of ICF-MR andHCBS approaches to financing residential servicesare complicated by a number of factors. In somestates, disproportionately higher expenditures for ICF-MR recipients may be explained by artificially inflatedinstitutional costs resulting from deinstitutionalization.The consistent pattern of relatively lower expendituresfor HCBS recipients in some states is an intendedand controlled program goal. In almost all states sub-stantial numbers of HCBS recipients live in their familyhomes (an estimated 42.5% nationally), reducinglong-term care costs by the relative value of the sup-ports provided by family members and other non-paidsupport providers. Somewhat related, children and
youth are more likely to be served under HCBS thanICF-MR and as a result “day program” costs are morelikely to be covered by educational agencies. In ad-dition, although federal regulations require that bothHCBS and ICF-MR recipients meet the same eligibil-ity criteria and level of care needs, in actual practicesome state HCBS tend to be a less intensive servicethan ICF-MR, making HCBS in some states, almostby definition, less costly than ICF-MR. Finally, be-cause Medicaid law specifically prohibits HCBS fi-nancing of room and board costs, HCBS recipientspay for such costs through their own funds, typicallyfrom Social Security Act cash benefit programs.These individual “contributions” to room and boardrepresent approximately $6,500 per HCBS recipientper year, and can be even higher because of statesupplements.
Variations in State Financial Benefit forCombined ICF-MR and HCBS Programs
As in all Medicaid programs, the federal governmentshares the costs of the ICF-MR and HCBS programswith the states as a function of the state per capitaincome relative to national per capita income (seeTable 3.7 for 2003 federal contributions or “match”rates). Relatively rich states share total expenditureson an equal basis with the federal government; rela-tively poor states may have federal involvement infinancing Medicaid services up to 83% (Mississippi’s77% was the highest federal share in 2003). It isoften presumed, therefore, that the extent to whichstates benefit from ICF-MR and HCBS program par-ticipation is directly related to their general need forassistance as reflected in the federal Medicaid costshare ratio. Because states vary considerably in theirICF-MR and HCBS utilization rates, proportions ofICF-MR and HCBS recipients, and expenditures perrecipient, some variation is expected among statesin relative benefit from federal matching funds be-yond that built into the actual cost-share rate for Med-icaid. To assess the differences among states in theirrelative “return” on current contributions to Medicaid,a “state benefit ratio” was computed. The state Med-icaid benefit ratio in Table 3.10 represents a ratio ofall federal ICF-MR and HCBS reimbursements paidto each state divided by the proportion of all dollarscontributed to the program through personal incometax paid by citizens of the state. Obviously not allfederal revenues for the Medicaid program come ex-clusively through personal income tax, but, despitethe oversimplification, the index provides a way of as-sessing the balance between state contributions to

76
Figure 3.5 Community ICF-MR & HCBS Recipients as a Percentage of All lCF-MR& HCBS Recipients on June 30, 2003
National Average = 87.0%
Figure 3.6 Service Recipients in Community and Institutions (16 or More Residents) AmongMedicaid ICF-MR and HCBS Recipients on June 30, 1977, 1982, 1987, 1992 and 2003
98.8 to 100 (9)93.7 to 98.8 (10)88.8 to 93.7 (10)77.2 to 88.8 (10)54.8 to 77.2 (12)
0 100,000 200,000 300,000 400,000 500,000 600,000
Total Recipients
2003 Institution Recipients
2003 Community Recipients
Total Recipients
1992 Institution Recipients
1992 Community Recipients
Total Residents
1987 Institution Recipients
1987 Community Recipients
Total Recipients
1982 Institution Recipients
1982 Community Recipients
Total Recipients
1977 Institution Recipients
1977 Community Recipients
Number of Residents
State ICF-MR Nonstate ICF-MR HCBS

77
Table 3.9 ICF-MR Residents and HCBS Recipients and ICF-MR and HCBSExpenditures by State on June 30, 2003
% of Recipients % of Expenditures
HCBS ICF-MR HCBS ICF-MRAL 4,807 203,310,654 92.4 7.6 73.2 26.8AK 931 57,618,903 100.0 0.0 100.0 0.0AZ 14,696 346,042,946 98.6 1.4 96.0 4.0AR 4,244 176,650,635 62.3 37.7 31.7 68.3CA 63,588 1,581,850,087 84.6 15.4 58.7 41.3CO 6,894 257,985,237 98.3 1.7 92.0 8.0CT 7,000 640,722,464 83.2 16.8 61.5 38.5DE 832 73,938,450 73.8 26.2 61.4 38.6DC 975 82,346,079 23.2 76.8 4.3 95.7FL 27,608 867,192,982 88.0 12.0 63.5 36.5GA 10,343 336,958,673 86.1 13.9 67.5 32.5HI 1,845 51,559,144 96.0 4.0 85.3 14.7ID 1,879 90,301,983 69.3 30.7 39.9 60.1IL1 19,838 966,862,762 49.3 50.7 29.5 70.5IN 12,712 599,521,658 62.8 37.2 44.6 55.4IA 9,472 376,459,600 76.3 23.7 37.9 62.1KS 7,001 258,247,749 90.6 9.4 75.2 24.8KY 2,881 205,886,788 70.6 29.4 45.0 55.0LA 10,386 526,278,973 46.3 53.7 29.9 70.1ME 2,727 235,571,420 90.1 9.9 74.3 25.7MD 7,989 354,877,585 95.0 5.0 83.8 16.2MA 12,900 760,424,478 91.2 8.8 71.0 29.0MI 8,861 444,231,003 98.0 2.0 94.7 5.3MN 17,421 992,053,162 84.7 15.3 80.3 19.7MS 4,520 212,348,363 42.2 57.8 13.3 86.7MO 9,171 457,206,418 85.7 14.3 50.3 49.7MT 1,793 71,331,184 94.0 6.0 83.9 16.1NE 3,386 158,201,274 81.8 18.2 68.9 31.1NV 1,259 52,257,151 82.6 17.4 52.5 47.5NH 2,860 120,398,662 99.1 0.9 98.5 1.5NJ 11,288 790,048,020 72.0 28.0 46.0 54.0NM 3,360 202,693,560 91.5 8.5 90.3 9.7NY 58,388 4,559,206,612 83.8 16.2 46.5 53.5NC 10,192 677,466,631 55.8 44.2 38.2 61.8ND 2,812 100,885,987 77.8 22.2 48.8 51.2OH 17,214 1,384,329,451 58.6 41.4 28.3 71.7OK 6,522 317,136,905 65.2 34.8 64.8 35.2OR 7,264 293,691,549 99.3 0.7 97.2 2.8PA 29,518 1,553,802,098 86.6 13.4 67.2 32.8RI 2,830 203,050,573 98.6 1.4 96.6 3.4SC 6,935 314,276,107 72.2 27.8 46.6 53.4SD 2,529 81,254,104 93.3 6.7 77.2 22.8TN 5,828 532,862,268 76.0 24.0 52.0 48.0TX 20,877 1,165,244,782 40.6 59.4 29.8 70.2UT 4,449 149,274,443 82.3 17.7 63.4 36.6VT 1,902 79,352,263 99.7 0.3 98.1 1.9VA 7,571 443,544,943 75.8 24.2 51.4 48.6WA 11,004 348,670,798 92.4 7.6 67.8 32.2WV 3,654 194,414,341 85.9 14.1 72.7 27.3WI 12,930 568,821,232 82.1 17.9 60.6 39.4WY 1,617 77,465,497 94.1 5.9 79.6 20.4US Total 509,503 25,596,128,630 79.0 21.0 55.2 44.81 FY 2001 data
StateTotal ICF-MR &
HCBS RecipientsICF-MR & HCBS Expenditures ($)

78
Table 3.10 Summary of Combined ICF-MR and HCBS Contributions and StateBenefit Ratios by State for Fiscal Year 2003
State
Federal Cost Share
(%)AL 70.60 38,523,601 105,013,721 0.99 11,688 1.10 0.90AK 58.27 NA 33,574,535 NA 2,340 0.22 NAAZ 67.25 9,372,392 223,341,489 1.61 15,849 1.50 1.07AR 74.28 89,637,421 41,578,670 0.91 6,255 0.59 1.53CA 50.00 326,545,044 464,380,000 5.46 142,280 13.44 0.41CO 50.00 10,272,500 118,720,119 0.89 18,555 1.75 0.51CT 50.00 123,455,548 196,905,684 2.21 24,038 2.27 0.97DE 50.00 14,257,133 22,712,093 0.26 3,132 0.30 0.86DC 70.00 55,187,290 2,454,966 0.40 3,240 0.31 1.30FL 58.83 185,968,060 324,201,571 3.52 62,353 5.89 0.60GA 59.60 65,170,874 135,656,495 1.39 27,794 2.63 0.53HI 58.77 4,444,905 25,856,404 0.21 3,660 0.35 0.61ID 70.96 38,507,348 25,570,939 0.44 3,091 0.29 1.52IL 50.00 340,747,280 142,684,101 3.34 54,114 5.11 0.65IN 61.97 205,686,750 165,836,821 2.57 19,257 1.82 1.41IA 63.50 148,470,894 90,580,952 1.65 7,959 0.75 2.20KS 60.15 38,517,369 116,818,652 1.07 8,340 0.79 1.36KY 69.89 79,160,336 64,733,940 0.99 10,609 1.00 0.99LA 71.28 262,902,777 112,228,875 2.59 11,811 1.12 2.32ME 66.22 40,110,394 115,885,000 1.08 3,609 0.34 3.16MD 50.00 28,820,476 148,618,317 1.23 23,736 2.24 0.55MA 50.00 110,155,418 270,056,821 2.63 35,023 3.31 0.79MI 56.42 13,281,937 237,353,195 1.73 35,599 3.36 0.51MN 50.00 97,607,784 398,418,798 3.43 18,821 1.78 1.93MS 76.62 140,980,887 21,720,429 1.12 6,194 0.59 1.92MO 61.23 139,007,759 140,939,731 1.93 17,386 1.64 1.18MT 72.96 8,375,993 43,667,239 0.36 2,136 0.20 1.78NE 59.52 29,266,564 64,894,834 0.65 4,964 0.47 1.39NV 52.39 13,005,840 14,371,681 0.19 8,443 0.80 0.24NH 50.00 932,933 59,266,398 0.42 5,710 0.54 0.77NJ 50.00 213,148,010 181,876,000 2.73 47,714 4.51 0.61NM 74.56 14,683,518 136,444,800 1.04 5,069 0.48 2.18NY 50.00 1,219,543,196 1,060,060,110 15.75 97,670 9.23 1.71NC 62.56 261,792,724 162,030,400 2.93 24,566 2.32 1.26ND 68.36 35,308,462 33,657,198 0.48 1,519 0.14 3.32OH 58.83 583,540,084 230,860,932 5.63 37,092 3.51 1.60OK 70.56 78,745,080 145,026,720 1.55 8,848 0.84 1.85OR 60.16 4,903,792 171,781,044 1.22 10,248 0.97 1.26PA 54.69 278,376,499 571,397,868 5.87 44,174 4.17 1.41RI 55.40 3,866,909 108,623,109 0.78 3,847 0.36 2.14SC 69.81 117,068,652 102,327,498 1.52 10,658 1.01 1.50SD 65.29 12,084,302 40,966,502 0.37 2,041 0.19 1.90TN 64.59 165,140,254 179,035,484 2.38 17,385 1.64 1.45TX 59.99 490,880,026 208,150,319 4.83 76,108 7.19 0.67UT 71.24 38,942,896 67,400,217 0.73 5,645 0.53 1.38VT 62.41 954,108 48,569,639 0.34 1,961 0.19 1.85VA 50.53 108,816,752 115,306,508 1.55 29,141 2.75 0.56WA 50.00 56,199,503 118,135,897 1.20 24,434 2.31 0.52WV 75.04 39,785,133 106,103,388 1.01 4,081 0.39 2.61WI 58.43 130,937,023 201,425,223 2.30 17,825 1.68 1.36WY 61.32 9,693,398 37,808,445 0.33 1,918 0.18 1.81US Total 56.85 6,522,783,827 7,955,436,610 100.00 1,058,242 100.00 1.00
* Most recent data available is from: "Tax Year 2001: Expanded Unpublished Version from IRS Tax Statistics"
State % Total
Income Tax
State Medicaid Benefit Ratio
Federal ICF-MR Expenditures
Federal HCBS
Expenditures
State % of Federal
ICF-MR & HCBS
Federal Income Tax (Millions $)*

79
the federal government for ICF-MR and HCBS pro-grams and federal reimbursements back to the states.
Table 3.10 shows that in FY 2003, seven statesgot back over two dollars in federal reimbursementsfor every dollar contributed. Two states got back lessthan $.50 in reimbursements for every dollar contrib-uted. Among the 31 states showing a favorable “StateBenefit Ratio” (state’s percentage of total federalICF-MR reimbursements divided by state’s percent-age of total federal income tax payments being greaterthan 1.00), were all but one (Alabama) of the 11 poor-est states (with federal Medicaid matching rates of70% or greater). Only two of the eleven “richest” stateswith federal Medicaid matching rates of 50% had afavorable “state benefit ratio” (Minnesota and NewYork). Therefore, while differential ICF-MR and HCBSutilization and average costs may still allow that a poorstate like Alabama (with a federal cost share of 71%and a benefit ratio of .90) subsidizes the combinedICF-MR and HCBS expenditures of a relativelywealthy state like New York (with a federal cost shareof 50% and a benefit ratio 1.71), the highly favorableMedicaid federal/state cost share for the poorer stateshas been effective in establishing a general tendencyfor them to receive more federal funds for long-termcare for persons with ID/DD than they contributethrough federal income tax.
Indexed Utilization Rates
Table 3.11 presents the number of ICF-MR residentsand HCBS recipients in each state per 100,000 ofthat state’s population, along with national totals. OnJune 30, 2003 there were 38.0 ICF-MR residents per100,000 of the national population. That included 14.5persons per 100,000 in community ICFs-MR (6.8 inplaces with 6 or fewer residents and 7.7 in placeswith 7-15 residents) and 23.6 persons per 100,000 inlarge ICFs-MR. There was rather remarkable varia-tion in utilization among the states. The District ofColumbia had the highest utilization rate nationally,with 140.8 ICF-MR residents per 100,000 population,followed by Louisiana with 123.9 residents per100,000 population. Eleven states had more than150% of the national rate. In contrast, 18 states wereless than 50% of the national rate.
On June 30, 2003 there were 143.0 HCBS recipi-ents per 100,000 of the national population. Varia-tions among states were very large. There were 13states with more than 200 HCBS recipients per100,000 of the state’s population. There were twostates with fewer than 50 HCBS recipients per 100,000
of the state’s population.Combined ICF-MR and HCBS utilization for per-
sons with ID/DD also showed high interstate variabil-ity. Nationally on June 30, 2003 there were 181.0ICF-MR and HCBS recipients per 100,000 of thenation’s population. One state (North Dakota) had arate more than twice the national utilization rate. Ken-tucky and Nevada had combined ICF-MR and HCBSrates that were less than half the national rate. Fig-ure 3.7 shows the variation among states in the num-ber of combined ICF-MR and HCBS recipients per100,000 of their state population.
Utilization rates for Medicaid community services(both HCBS and community ICFs-MR) were 157.5per 100,000. Delaware, Kentucky, Nevada, and Texashad rates that were less than half the national aver-age; two states had rates that were more than twicethe national average: Minnesota (333.3) and NorthDakota (389.7). Figure 3.8 shows this variation on astate-by-state basis.
It is important to recognize that some of the vari-ability among states in the utilization of Medicaid ICF-MR and HCBS services is a reflection of the size ofstate residential systems in general. On June 30,2003 states had an average total utilization rate forall residential services (both Medicaid and non-Med-icaid) of 142.9 per 100,000. States varied from 60.3residential service recipients per 100,000 in Georgiato 301.0 in North Dakota. While states vary mark-edly in their total utilization of residential placementsfor persons with ID/DD, state policy decisions createeven greater variability in their relative utilization ofMedicaid ICF-MR and HCBS programs to financethose services.
Figure 3.9 shows patterns of overall U.S. residen-tial services and ICF-MR services utilization from 1962to 2003. It shows the decreasing ICF-MR utilizationrates since 1982. It also shows the steadily increas-ing overall residential services utilization rate since1987, when residential services utilization reached105.1 service recipients per 100,00 of the general U.S.population. It is notable that while the residential uti-lization rate was increasing by 38 residents per100,000 in the U.S. population in the sixteen yearsbetween 1987 and 2003, the ICF-MR utilization ratedecreased by 21.3 residents per 100,000 in the gen-eral population.
The aging of the “baby boom” generation into adult-hood has been a primary driving force of increasing

80
Table 3.11 Utilization Rates per 100,000 of State Population for ICF-MR, HCBS and AllResidential Service Recipients by State on June 30, 2003
1-6 7-15 1-15 16+ Total HCBS
HCBS & Community
ICFs-MR
All HCBS &
ICFs-MR 1-6 7-15 1-15 16+ TotalAL 45.52 0.0 0.6 0.6 7.4 8.0 97.6 98.2 105.6 40.5 20.4 60.9 7.4 68.3AK 6.65 0.0 0.0 0.0 0.0 0.0 140.1 140.1 140.1 158.0 0.0 158.0 0.0 158.0AZ 51.26 0.0 0.8 0.8 3.1 3.9 282.8 283.6 286.7 64.2 0.8 65.0 3.7 68.7AR 27.03 0.0 11.1 11.1 48.1 59.2 97.8 108.9 157.0 33.1 30.1 63.2 58.0 121.3CA 333.74 15.5 0.0 15.5 13.9 29.4 161.1 176.6 190.5 128.2 5.1 133.3 19.2 152.5CO 43.58 0.4 0.0 0.4 2.3 2.6 155.6 155.9 158.2 97.7 10.9 108.5 2.3 110.8CT 32.96 9.3 0.5 9.9 25.8 35.6 176.7 186.6 212.4 146.3 28.0 174.4 26.1 200.5DE 7.83 0.0 0.0 0.0 27.8 27.8 78.4 78.4 106.2 89.9 0.0 89.9 27.8 117.7DC 5.32 78.6 62.2 140.8 0.0 140.8 42.5 183.3 183.3 145.9 69.4 215.3 6.6 221.8FL 158.62 1.3 0.0 1.3 19.5 20.8 153.2 154.5 174.0 56.5 11.0 67.6 22.4 90.0GA 82.40 0.0 0.0 0.0 17.5 17.5 108.0 108.0 125.5 42.8 0.0 42.8 17.5 60.3HI 12.91 5.7 0.0 5.7 0.0 5.7 137.3 142.9 142.9 84.5 0.0 84.5 0.6 85.1ID 14.27 9.5 23.7 33.2 7.2 40.4 91.3 124.5 131.7 151.3 35.7 187.0 17.1 204.1IL1 121.98 1.7 26.0 27.7 54.7 82.4 80.2 108.0 162.6 43.9 44.2 88.1 60.8 148.9IN 61.76 15.4 43.3 58.7 17.9 76.6 129.3 188.0 205.8 102.3 43.3 145.6 17.9 163.5IA 29.22 10.6 11.7 22.3 54.4 76.8 247.4 269.7 324.1 133.4 27.8 161.2 62.5 223.7KS 27.33 2.7 5.3 8.0 16.2 24.2 232.0 239.9 256.1 159.1 6.3 165.4 16.2 181.6KY 40.59 0.0 0.6 0.6 20.3 20.9 50.1 50.7 71.0 76.0 5.0 81.0 20.3 101.3LA 45.02 44.2 20.8 65.0 58.9 123.9 106.8 171.8 230.7 81.9 20.8 102.7 60.2 162.9ME 12.65 3.2 15.4 18.6 2.7 21.3 194.3 212.9 215.6 221.7 23.6 245.4 3.3 248.7MD 53.75 0.0 0.0 0.0 7.4 7.4 141.3 141.3 148.6 122.6 8.6 131.2 9.3 140.4MA 62.86 0.0 0.0 0.0 18.1 18.1 187.1 187.1 205.2 138.6 13.9 152.5 18.8 171.3MI 97.57 0.0 0.0 0.0 1.8 1.8 89.0 89.0 90.8 106.3 0.0 106.3 1.8 108.1MN 49.36 11.6 22.8 34.4 19.6 54.0 298.9 333.3 352.9 224.8 22.8 247.6 19.6 276.2MS 28.86 0.1 19.7 19.8 70.7 90.5 66.1 85.9 156.6 28.3 23.1 51.4 71.3 122.6MO 56.58 0.1 0.9 1.0 22.2 23.2 138.9 139.9 162.1 64.6 21.2 85.8 28.5 114.3MT 9.79 0.0 0.0 0.0 11.0 11.0 172.2 172.2 183.2 108.8 46.9 155.7 11.0 166.8NE 17.39 0.0 0.5 0.5 35.0 35.5 159.2 159.7 194.7 DNF DNF DNF 35.0 182.2NV 20.07 4.8 0.7 5.5 5.4 10.9 51.8 57.4 62.7 55.9 0.7 56.7 5.4 62.0NH 12.53 0.0 0.0 0.0 2.0 2.0 226.3 226.3 228.3 136.5 2.6 139.1 2.0 141.1NJ 83.06 0.0 0.0 0.0 38.1 38.1 97.8 97.8 135.9 76.1 10.1 86.2 46.2 132.3NM 19.59 5.4 8.4 13.8 0.8 14.7 156.9 170.7 171.5 88.8 8.4 97.2 0.8 98.0NY 182.07 1.9 31.4 33.3 18.7 52.0 268.7 302.0 320.7 124.1 103.4 227.5 19.1 246.6NC 80.75 18.8 5.2 24.0 31.8 55.7 70.5 94.5 126.2 109.7 12.1 121.8 32.5 154.4ND 6.70 19.3 44.0 63.3 30.0 93.3 326.4 389.7 419.7 184.2 76.4 260.6 40.4 301.0OH 114.23 2.9 16.0 18.9 43.4 62.3 88.4 107.3 150.7 79.2 22.7 101.9 43.7 145.6OK 34.37 3.5 3.4 6.9 59.1 66.0 123.7 130.6 189.7 91.2 6.3 97.5 59.1 156.6OR 35.30 0.0 0.0 0.0 1.4 1.4 204.4 204.4 205.8 130.7 12.2 142.9 3.7 146.5PA 122.67 7.2 2.9 10.1 22.3 32.3 208.3 218.3 240.6 151.8 3.7 155.6 24.7 180.2RI 9.97 1.8 0.0 1.8 2.2 4.0 279.9 281.7 283.9 180.3 17.4 197.6 2.2 199.8SC 39.56 0.4 22.2 22.6 26.1 48.8 126.5 149.2 175.3 65.6 25.1 90.6 26.1 116.8SD 7.96 0.0 0.0 0.0 21.4 21.4 296.5 296.5 317.8 169.8 87.6 257.4 23.4 280.8TN 58.67 2.2 6.6 8.8 15.0 23.8 75.5 84.3 99.3 48.0 16.4 64.4 15.0 79.4TX 209.96 22.7 3.4 26.1 33.0 59.1 40.3 66.4 99.4 57.5 3.4 60.9 33.0 93.9UT 23.51 0.0 0.5 0.5 33.0 33.5 155.7 156.2 189.2 79.7 7.7 87.5 33.0 120.5VT 6.23 1.0 0.0 1.0 0.0 1.0 304.3 305.2 305.2 188.3 0.0 188.3 0.0 188.3VA 71.60 0.4 1.0 1.5 24.1 25.6 80.1 81.6 105.7 DNF DNF DNF DNF 91.6WA 60.70 0.6 0.1 0.7 13.1 13.8 167.5 168.2 181.3 110.3 4.4 114.7 17.4 132.1WV 18.42 3.5 21.3 24.8 3.2 28.0 170.4 195.2 198.4 70.0 29.0 99.1 3.2 102.3WI 54.24 0.0 0.5 0.5 42.1 42.7 195.7 196.2 238.4 175.4 18.2 193.6 42.1 235.7WY 5.47 0.0 0.0 0.0 17.4 17.4 278.3 278.3 295.7 124.3 23.8 148.1 17.4 165.5US Total 2,814.41 6.8 7.7 14.5 23.6 38.0 143.0 157.5 181.0 97.9 19.3 117.2 25.8 142.9* excludes service recipients living in their family homes DNF = did not furnish
** Source: US Census Bureau, Population Estimates Program, July 1, 2003.1 FY 2001 data
All Residential Service Recipients (Medicaid and non-Medicaid funded)*ICF-MR Residents HCBS & ICF-MR Recipients
State Populations (100,000)**State

81
Figure 3.7 Total ICF-MR and HCBS Recipients per 100,000 of State Population byState on June 30, 2003
Figure 3.8 Total Community ICF-MR and HCBS Recipients per 100,000 of StatePopulation by State on June 30, 2003
National Average = 181.0
National Average = 157.5
256 to 420 (10)198 to 256 (10)172 to 198 (9)136 to 172 (10)
62 to 136 (12)
226 to 390 (11)177 to 226 (9)143 to 177 (10)107 to 143 (9)
50 to 107 (11)

82
Figure 3.9 ICF-MR and Non ICF-MR Residential Service Recipients per 100,000of the U.S. Population, 1962 to 2003
overall placement rates and is contributing to the grow-ing number of people waiting for services. As shownbelow, the HCBS program played a major role in fund-ing the residential services of persons not living inICFs-MR, with an estimated 57.5% of HCBS recipi-ents receiving residential services outside of a homeshared with relatives (see Table 3.12). Applying thatstatistic to all 402,438 HCBS recipients on June 30,2003 would yield an estimated 231,401 persons or82.2 persons per 100,000 of the U.S. population, re-ceiving residential services outside their family homefinanced by Medicaid Home and Community BasedServices. This means that an estimated 84.1% ofresidential services placements are financed by ICF-MR or HCBS.
Residential Arrangements of HCBSRecipients
Forty-five states (with 75.1% of HCBS recipients) wereable to provide in whole or part, the type of residentialsituation in which most HCBS service recipients lived.These reports are summarized in Table 3.12 by stateand residential arrangement. A reported 31.3% ofHCBS recipients lived in a residence owned, rented,or managed by an agency, in which agency staff pro-vide care, instruction, supervision, and support to resi-dents with ID/DD. The estimated national total ofHCBS recipients living in such arrangements was125,962. The most frequently utilized residential ar-rangement of HCBS recipients was living in a homethat was also the home of other family member(s).An estimated 171,037 HCBS recipients (42.5% of the
total) lived with other family members.The third largest group of HCBS recipients (17.8%)
on June 30, 2003 lived in their own homes (i.e., homesrented or owned by them to which persons come toprovide personal assistance, supervision and sup-port). An estimated 71,634 persons lived in their ownhomes.
The fourth largest group of HCBS recipients, anestimated 28,171 persons (or 7.0% of HCBS recipi-ents), lived in family foster or host family homes (i.e.,homes rented or owned by a family or individual inwhich they live and provide care to one or more unre-lated persons with ID/DD). A small proportion of HCBSrecipients (1.4%) were reported to be served in “other”types of residential arrangements.
Between 1994 and 2003 there was a notable in-crease in the proportion of HCBS recipients reportedto be living in their family home or in their own homes.The estimated proportion of HCBS recipients livingwith parents or other relatives increased from 23.8%to 42.5% over the nine years. Between 1994 and2003 the proportion of HCBS recipients living in homesthat they themselves rented or owned increased from11.1% to 17.8%.
Persons with ID/DD in Medicaid NursingFacilities
Table 3.13 presents statistics on people with ID/DDreported in “Medicaid certified nursing facilities (NFs)not primarily for persons with ID/DD.” The ability ofstates to report an actual or estimated count of Med-icaid NF residents was established primarily in re-
0
20
40
60
80
100
120
140
160
'62 '67 '72 '77 '82 '87 '88 '89 '90 '91 '92 '93 '94 '95 '96 '97 '98 '99 '00 '01 '02 '03
Year
Rec
ipie
nts
per
100
,000
of U
.S.
Pop
ulat
ion
ICF-MR Non ICF-MR

83
Table 3.12 HCBS Recipients with ID/DD by Reported Type of ResidentialSetting on June 30, 2003
StateResidential
Facility
a Family Foster Home
b Person's Own Home
c Family Home
d Other Residence
Reported Total
Actual Total
AL 2,230 206 181 1,827 0 4,444 4,444AK 401 225 36 300 0 962 931AZ 1,946 553 300 11,405 e 0 14,204 14,494AR 965 232 416 1,031 0 2,644 2,644CA 18,009 431 7,482 27,046 0 52,968 53,775CO 863 e 0 622 e 2,335 e 2,666 e 6,486 6,779CT 2,227 433 610 e 1,466 0 4,736 5,825DE 442 170 0 2 0 614 614DC DNF DNF DNF 0 DNF DNF 226FL 6,452 0 3,162 14,670 0 24,284 24,301GA 1,028 464 1,634 DNF 0 3,126 8,902HI 86 634 57 689 DNF 1,466 1,772ID 0 642 323 337 0 1,302 1,302IL* 4,731 0 518 1,538 0 6,787 9,785IN** DNF DNF 1,498 e 1,499 e NA 2,997 7,983IA 0 0 3,154 e 2,706 e 0 5,860 7,229KS DNF DNF DNF DNF DNF DNF 6,340KY 1,186 361 0 486 0 2,033 2,033LA 0 59 1,462 3,288 0 4,809 4,809ME 1,389 411 270 384 13 2,467 2,458MD DNF DNF DNF DNF DNF DNF 7,593MA DNF DNF DNF DNF DNF DNF 11,764MI 5,133 881 841 1,053 780 8,688 8,688MN 6,118 610 553 3,858 DNF 11,139 14,754MS 133 0 172 1,603 0 1,908 1,908MO 2,306 0 2,252 3,097 0 7,655 7,861MT 794 31 e 218 e 642 e 0 1,685 1,685NE 1,250 e 153 670 e 108 0 2,181 2,769NV 26 24 976 14 0 1,040 1,040NH 370 931 320 192 0 1,813 2,835NJ 4,117 1,307 311 2,294 93 8,122 8,122NM 692 274 479 1,151 0 2,596 3,073NY DNF DNF DNF DNF DNF DNF 48,921NC 1,360 91 119 3,607 0 5,177 5,692ND 334 29 941 523 0 1,827 2,187OH 3,020 445 2,539 517 DNF 6,521 10,093OK 239 512 1,998 1,654 0 4,403 4,253OR 2,500 1,700 600 2,305 0 7,105 7,214PA DNF DNF DNF DNF DNF DNF 25,550RI 910 63 640 697 0 2,310 2,790SC 1,902 130 463 2,510 0 5,005 5,005SD 1,349 10 415 585 0 2,359 2,359TN 1,034 186 1,468 1,742 0 4,430 4,430TX 2,698 e 1,939 e 330 e 3,504 e 0 8,471 8,471UT 1,197 213 490 1,503 0 3,403 3,661VT 93 909 122 e 490 0 1,614 e 1,896VA 1,454 230 168 343 DNF 2,195 5,737WA 388 656 3,352 4,350 0 8,746 10,165WV 293 164 747 1,935 e 0 3,139 3,139WI 1,575 2,373 4,718 1,866 0 10,532 10,615WY 568 104 138 712 0 1,522 1,522Reported Total 83,808 18,786 47,765 113,864 3,552 267,775 402,438% by Category 31.3% 7.0% 17.8% 42.5% 1.3% 100.0%Est. US Total 125,962 28,171 71,634 171,037 5,634 402,438
b Home owned or rented by families or individuals in which they live and provide care to unrelated persons with ID/DD
c Home owned or rented by person(s) with ID/DD into which persons come to provide personal assistance, instruction, monitoring and/or other support
d Home of persons with ID/DD which is also the primary residence of parents or other relatives e = estimate
* FY 2001 data ** unable to separate "own home" and "family home" data; using 50% of total in each category DNF = did not furnish
a Place of residence owned, rented or managed by an agency, in which staff provide care, instruction, supervision and support to residents with ID/DD

84
Table 3.13 Persons with ID/DD in Nursing Facilities by State on June 30, 2003
StateAL 1,007 4,807 5,814 17.3 3,109 4,116 24.5AK 8 931 939 0.9 1,050 1,058 0.8AZ 50 14,696 14,746 0.3 3,521 3,571 1.4AR 852 4,244 5,096 16.7 3,278 4,130 20.6CA 6,926 63,588 70,514 9.8 50,900 57,826 12.0CO 274 6,894 7,168 3.8 4,829 5,103 5.4CT 351 7,000 7,351 4.8 6,610 6,961 5.0DE 58 832 890 6.5 922 980 5.9DC 15 975 990 1.5 1,180 1,195 1.3FL 273 27,608 27,881 1.0 14,278 14,551 1.9GA 1,310 1 10,343 11,653 11.2 4,970 6,280 20.9HI 100 e 1,845 1,945 5.1 1,099 1,199 8.3ID 133 1,879 2,012 6.6 2,912 3,045 4.4IL 727 2 19,838 20,565 3.5 18,163 18,890 3.8IN 1,844 12,712 14,556 12.7 10,097 11,941 15.4IA 808 9,472 10,280 7.9 6,537 7,345 11.0KS 421 7,001 7,422 5.7 4,963 5,384 7.8KY 741 * 2,881 3,622 20.5 4,113 4,854 15.3LA 765 * 10,386 11,151 6.9 7,332 8,097 9.4ME 132 ** 2,727 2,859 4.6 3,146 3,278 4.0MD 130 e 7,989 8,119 1.6 7,549 7,679 1.7MA 1,264 12,900 14,164 8.9 10,768 12,032 10.5MI 664 8,861 9,525 7.0 10,546 11,210 5.9MN 345 17,421 17,766 1.9 13,632 13,977 2.5MS 344 4,520 4,864 7.1 3,538 3,882 8.9MO 878 3 9,171 10,049 8.7 6,466 7,344 12.0MT 140 1,793 1,933 7.2 1,632 1,772 7.9NE 93 3,386 3,479 2.7 3,169 3,262 2.9NV 14 1,259 1,273 1.1 1,245 1,259 1.1NH 100 2,860 2,960 3.4 1,767 1,867 5.4NJ 672 11,288 11,960 5.6 10,993 11,665 5.8NM 134 3,360 3,494 3.8 1,920 2,054 6.5NY 1,309 58,388 59,697 2.2 44,892 46,201 2.8NC 606 4 10,192 10,798 5.6 12,466 13,072 4.6ND 108 5 2,812 2,920 3.7 2,017 2,125 5.1OH 2,160 ** 17,214 19,374 11.1 16,634 18,794 11.5OK 728 6,522 7,250 10.0 5,383 6,111 11.9OR 110 7,264 7,374 1.5 5,173 5,283 2.1PA 1,604 29,518 31,122 5.2 22,110 23,714 6.8RI 105 2,830 2,935 3.6 1,992 2,097 5.0SC 141 6,935 7,076 2.0 4,620 4,761 3.0SD 176 2,529 2,705 6.5 2,234 2,410 7.3TN 1,989 5,828 7,817 25.4 4,660 6,649 29.9TX 2,415 * 20,877 23,292 10.4 19,708 22,123 10.9UT 231 4,449 4,680 4.9 2,832 3,063 7.5VT 33 1,902 1,935 1.7 1,173 1,206 2.7VA 691 7,571 8,262 8.4 6,557 7,248 9.5WA 414 11,004 11,418 3.6 8,020 8,434 4.9WV 362 * 3,654 4,016 9.0 1,884 2,246 16.1WI 201 3 12,930 13,131 1.5 12,787 12,988 1.5WY 49 1,617 1,666 2.9 905 954 5.1Est. US Total 35,005 509,503 544,508 6.4 402,281 437,286 8.0
3 includes only recipients of MR/DD "specialized" services e = estimate1 as of January 2004
4 does not include "Adult Care Homes" residents
5 as of 4/12/04
Persons with ID/DD in NFs, as % of All Residents in ID/DD Residences & NFs
2 as of May 2004
**2002 data from state DD agency
Note: NF data with an (*) from analysis of Minimum Data Set files, July-December 2000, using most recent assessment for each person. The data set includes all NFs in the US that are required to file reports with CMS. Each person in those settings is required to have an assessment at least quarterly (more often if there are major changes or if they meet certain conditions related to funding of their services). Analyses were conducted by the RISP Project.
Persons with ID/DD in Non-
Specialized NFs
Total ID/DD Recipients of ICF-MR and
HCBS
Persons with ID/DD in NFs, ICFs-MR, and
Receiving HCBS
Persons with ID/DD in NFs, as % of Persons
with ID/DD in NFs, ICFs-MR, and
Receiving HCBS
Total Residents in ID/DD
Residential Settings
Total Residents with ID/DD in Residential
Settings and NFs

85
sponse to the requirement under the Omnibus Bud-get Reconciliation Act of 1987 (OBRA-87) that statesscreen NF residents with ID/DD for the appropriate-ness of their placement. However, only 45 stateswere able to respond to the request for informationon the number of NF residents with ID/DD in FY 2003.Information on the number of nursing home residentswith ID/DD in these states is derived from an analysisof Minimum Data Set (MDS) files from July throughDecember 2000 and is indicated by an asterisk (*).The estimated national total of 35,005 nursing facilityresidents in June 30, 2003 is a slight increase (0.53%)from the 34,820 residents reported in FY 2002.
Persons with ID/DD in NFs were 6.4% of the com-bined total of all persons with ID/DD in NFs, ICFs/MRand Medicaid Home and Community Based Servicesprograms and 8.0% of all persons with ID/DD in resi-dences for persons with ID/DD and NFs. For FY 2003,fourteen states reported persons with ID/DD living inNFs as more than 10% of the total of their combinedID/DD residential program residents and NF residentswith ID/DD.
ICF-MR and HCBS for Persons with ID/DDas a Proportion of All Federal MedicaidExpenditures
Between 1992 and 2003 most of the growth in fed-eral Medicaid expenditures for ICF-MR and HCBSfor persons with ID/DD was due to growth in expen-ditures for HCBS. In FY 1992, states received$888,900,000 in federal reimbursements for Medic-aid HCBS services for persons with ID/DD. By FY1994 federal reimbursements for Medicaid HCBSservices had more than doubled to $1,665,390,500.In the nine years between FYs 1994 and 2003 fed-eral reimbursements for Medicaid HCBS more thanquadrupled to $7,955,436,610. Although ICF-MRpopulations decreased between June 1992 and June2003 from 146,260 to 107,065 residents, there wasan increase in federal ICF-MR reimbursements from$5.08 to $6.52 billion. This increase of $1.44 billionover the eleven years compared with a $6.29 billionincrease in federal HCBS reimbursements over thesame period.
Because Medicaid long-term care services arebeing steadily transformed from ICF-MR to HCBS pro-grams, by rapid growth in new HCBS recipients, bymoving people out of ICFs-MR, and by convertingcommunity ICFs-MR into HCBS financed communitysettings, it is instructive to examine federal alloca-tions to the combined ICF-MR and HCBS programsfor persons with ID/DD. Doing so stimulates two ob-
servations. First, long-term care payments for per-sons with ID/DD make up a substantial and dispro-portionately large amount of total federal Medicaid ex-penditures (i.e., per recipient costs for persons withID/DD receiving long-term care are much greater thanthe per recipient Medicaid costs for the general Med-icaid population). Second, the proportion of total fed-eral Medicaid expenditures going to the ICF-MR andHCBS programs for persons with ID/DD has remainedin a fairly stable range over the past two decades (be-tween about 9% and 12% of federal Medicaid expen-ditures).
As shown in Table 3.14, federal expenditures forMedicaid ICF-MR and HCBS programs for personswith ID/DD increased by 296.9% between 1988 and2003 (increased by $10.83 billion dollars from $3.65billion dollars). These increases contributed signifi-cantly to the overall growth in total federal Medicaidexpenditures. Still, the annual average growth rateof federal ICF-MR and HCBS expenditures for per-sons with ID/DD between 1988 and 2003 (19.8%) wassubstantially less than the overall Medicaid growthrate. As a result, federal reimbursements for the ICF-MR and HCBS programs for persons with ID/DD de-creased from 12.0% to 9.8% of all federal Medicaidexpenditures.
Between 1998 and 2003 there was a decrease inthe proportion of federal ICF-MR and HCBS expen-ditures within the total Medicaid program (from 10.2%to 9.8%). This was primarily attributable to the rela-tively large growth in total Medicaid expenditures dur-ing the five-year period (54.0%), as compared withthe 48.3% increase in combined ICF-MR and HCBSexpenditures. Between 2000 and 2003 federal pay-ments for ICF-MR and HCBS programs for personswith ID/DD increased by 31.1%, more than the 27.7%increase in all Medicaid expenditures between 2000and 2003.
Despite their generally stable proportion of all fed-eral Medicaid expenditures, it is hard to overlook thedisproportionately high expenditures for ICF-MR andHCBS recipients with ID/DD in comparison with theaverage for all Medicaid recipients. In 2003 the aver-age federal contribution for each Medicaid beneficiarywas an estimated $3,700 (based on Report of 39.9million to total Medicaid beneficiaries in 2002 reportedin “2003 Medicaid Statistics” at www.cms.hhs.gov/researchers/pub/03cmsstats.pdf). This is comparedto an average federal expenditure of $28,416 for each

86
Table 3.14 Federal Medicaid Expenditures for ICF-MR and HCBS Programs for Personswith ID/DD as a Proportion of All Federal Medicaid Expenditures
ICF-MR and HCBS recipient with ID/DD (excludingmedical services).
Medicaid ID/DD Expenditures Within theLarger State Medicaid Programs
Table 3.15 presents a summary of Medicaid ICF-MRand HCBS expenditures by state as a portion of allMedicaid long-term care and all Medicaid expendi-tures. The statistics on all Medicaid expenditureswere provided by Brian Burwell of the Medstat Groupfrom CMS Form 64 reports and are presented herewith permission.
States varied considerably in FY 2003 in the pro-portion of all Medicaid long-term care expendituresthat went to HCBS and ICF-MR services for personswith ID/DD. On average, 30.7% of states’ Medicaidtotal long-term care expenditures were for HCBS andICFs-MR for persons with ID/DD. In five states lessthan 20%, and in eleven states more than 40% of allMedicaid long-term care expenditures were for per-sons with ID/DD who received ICF-MR or HCBS ser-vices.
State and federal ICF-MR and HCBS expendituresfor persons with ID/DD equalled 9.9% of all state andfederal Medicaid expenditures. States varied frommore than 20% in five states to 4.4% in two states.
HCBS and ICF-MR Expenditures, by State,between 1994 and 2003
Table 3.16 shows the annual expenditures in thou-sands of dollars for HCBS, ICF-MR and combinedtotals, by state, in the years 1994 to 2003. Nationally,HCBS expenditures increased by $11,151,287,400(an average annual increase of ($1,239,031,933) overthe nine year period. ICF-MR expenditures increasedby $2,250,958,600 (an average annual increase of$250,106,511). Combined expenditures more thandoubled from 1994 to 2003 from $12,193,882,600 to$25,596,128,600 (an average annual increase of$1,489,138,444). Alaska had the highest percentageincrease in HCBS expenditures (8,544%) and NewHampshire had the lowest increase (85%). West Vir-ginia had the highest ICF-MR expenditure increase(271%) and Alaska has had no ICF-MR expendituressince 1999. Combined expenditures increased by thegreatest percentage in West Virginia (468%) and theleast percentage in Washington DC (29%).
Year
Total Federal Medicaid
Expenditures
Total Federal ICF-MR and HCBS Expenditures for
Persons with ID/DD
Federal ICF-MR and HCBS Expenditures for Persons with
ID/DD as % of All Medicaid Expenditures
1980 $14.550 billion $1.738 billion 11.9%1988 $30.462 billion $3.648 billion 12.0%1992 $64.003 billion $5.779 billion 9.0%1993 $73.504 billion $6.509 billion 8.9%1994 $78.261 billion $6.943 billion 8.9%1995 $86.684 billion $7.506 billion 8.7%1996 $88.294 billion $8.171 billion 9.3%1997 $91.826 billion $8.880 billion 9.7%1998 $96.049 billion $9.762 billion 10.2%1999 $102.949 billion $10.130 billion 9.8%2000 $115.783 billion $11.043 billion 9.5%2001 $130.441 billion $11.974 billion 9.2%2002 $137.795 billion $13.595 billion 9.9%2003 $147.874 billion $14.478 billion 9.8%
Note: Federal Medicaid expenditures were provided by Brian Burwell of the Medstat Group and reported with permission

87
Table 3.15 Medicaid HCBS and ICF-MR Within Total Medicaid Program in Fiscal Year 2003
AL 148,744,647 54,566,007 203,310,654 1,073,190,715 3,505,020,016 18.9 5.8AK 57,618,903 0 57,618,903 254,483,074 835,508,315 22.6 6.9AZ 332,106,304 13,936,642 346,042,946 DNF 4,175,088,533 DNF 8.3AR 55,975,593 120,675,042 176,650,635 748,112,979 2,369,809,209 23.6 7.5CA 928,760,000 653,090,087 1,581,850,087 5,644,794,699 25,306,948,648 28.0 6.3CO 237,440,237 20,545,000 257,985,237 879,255,407 2,531,617,167 29.3 10.2CT 393,811,368 246,911,096 640,722,464 1,869,249,964 3,658,071,858 34.3 17.5DE 45,424,185 28,514,265 73,938,450 249,737,917 719,330,767 29.6 10.3DC 3,507,094 78,838,985 82,346,079 299,762,072 1,881,191,207 27.5 4.4FL 551,082,052 316,110,930 867,192,982 3,299,251,154 11,055,296,709 26.3 7.8GA 227,611,569 109,347,104 336,958,673 1,273,410,652 7,585,899,689 26.5 4.4HI 43,995,923 7,563,221 51,559,144 261,424,592 660,942,669 19.7 7.8ID 36,035,709 54,266,274 90,301,983 306,138,938 837,686,711 29.5 10.8IL 285,368,202 681,494,560 966,862,762 2,687,248,843 9,663,906,357 36.0 10.0IN 267,608,232 331,913,426 599,521,658 1,444,228,526 4,439,123,706 41.5 13.5IA 142,647,169 233,812,431 376,459,600 978,175,289 2,285,319,551 38.5 16.5KS 194,212,222 64,035,527 258,247,749 776,134,891 1,787,319,551 33.3 6.8KY 92,622,607 113,264,181 205,886,788 1,022,428,275 3,810,832,328 20.1 4.6LA 157,447,917 368,831,056 526,278,973 1,186,352,757 4,496,315,020 44.4 29.3ME 175,000,000 60,571,420 235,571,420 549,675,189 1,796,359,904 42.9 13.1MD 297,236,634 57,640,951 354,877,585 1,483,024,573 4,411,838,199 23.9 8.0MA 540,113,642 220,310,836 760,424,478 2,720,379,344 8,540,005,883 28.0 8.9MI 420,689,817 23,541,186 444,231,003 1,654,547,873 7,918,989,104 26.8 5.6MN 796,837,595 195,215,567 992,053,162 2,383,084,609 4,921,224,484 41.6 20.2MS 28,348,250 184,000,113 212,348,363 788,988,120 2,895,958,893 26.9 7.3MO 230,180,844 227,025,574 457,206,418 1,520,548,001 5,463,671,987 30.1 8.4MT 59,850,931 11,480,253 71,331,184 257,510,803 571,276,251 27.7 12.5NE 109,030,299 49,170,975 158,201,274 585,041,120 1,359,027,019 27.0 11.6NV 27,432,108 24,825,043 52,257,151 202,968,391 1,034,208,789 25.7 5.1NH 118,532,796 1,865,866 120,398,662 365,576,342 810,288,614 32.9 14.9NJ 363,752,000 426,296,020 790,048,020 3,311,072,413 7,983,988,078 23.9 9.9NM 183,000,000 19,693,560 202,693,560 531,240,756 2,008,041,198 38.2 10.1NY 2,120,120,221 2,439,086,391 4,559,206,612 15,645,168,535 38,479,679,950 29.1 11.8NC 259,000,000 418,466,631 677,466,631 2,171,627,425 7,215,865,635 31.2 9.4ND 49,235,223 51,650,764 100,885,987 281,619,721 476,447,995 35.8 21.2OH 392,420,418 991,909,033 1,384,329,451 4,522,034,846 10,253,435,622 30.6 13.5OK 205,536,735 111,600,170 317,136,905 877,616,431 2,349,364,171 36.1 13.5OR 285,540,299 8,151,250 293,691,549 877,575,075 2,689,676,502 33.5 10.9PA 1,044,794,054 509,008,044 1,553,802,098 5,729,942,492 13,101,387,210 27.1 11.9RI 196,070,593 6,979,980 203,050,573 477,963,518 1,464,246,409 42.5 13.9SC 146,580,000 167,696,107 314,276,107 883,779,220 3,536,161,296 35.6 8.9SD 62,745,447 18,508,657 81,254,104 223,694,715 546,568,370 36.3 14.9TN 277,187,621 255,674,647 532,862,268 1,348,456,331 6,468,103,197 39.5 8.2TX 346,975,027 818,269,755 1,165,244,782 3,908,961,973 15,160,842,776 29.8 7.7UT 94,610,074 54,664,369 149,274,443 279,708,958 1,111,227,080 53.4 13.4VT 77,823,489 1,528,774 79,352,263 223,278,093 634,933,146 35.5 12.5VA 228,194,157 215,350,786 443,544,943 1,187,360,325 3,606,039,012 37.4 12.3WA 236,271,793 112,399,005 348,670,798 1,553,297,964 5,053,403,005 22.4 6.9WV 141,395,773 53,018,568 194,414,341 633,209,162 1,881,191,207 30.7 10.3WI 344,729,117 224,092,115 568,821,232 2,232,037,944 1,675,447,000 25.5 34.0WY 61,657,608 15,807,889 77,465,497 156,574,342 335,152,794 49.5 23.1US Total 14,122,912,497 11,473,216,133 25,596,128,630 83,820,945,348 257,359,278,791 30.5 9.9
StateTotal ICF-MR
Expenditures ($)
Combined HCBS+ICF-MR Expenditures ($)
Total Medicaid Long-Term Care Expenditures ($)
Total (All) Medicaid Expenditures ($)
Total HCBS Expenditures ($)
HCBS+ICF-MR as % Medicaid
Long-Term Care Expenditures
HCBS + ICF-MR as % of All
Medicaid Expenditures
Note: Sources for Medicaid long-term care and all Medicaid expenditures are HCFA Form 64 reports as aggregated and reported by Brian Burwell of the Medstat Group and printed here with permission

88
Table 3.16a Annual Expenditures in Thousands of Dollars for HCBS and ICF-MR, byState, in the Years 1994 - 2003
State Program 1994 1996 1997 1998 1999 2000 2001 2002 2003AL HCBS 30,500.0 45,690.0 72,327.4 77,000.0 77,810.0 96,422.2 98,004.8 120,395.5 148,744.6
ICF-MR 79,259.1 68,011.0 58,305.6 56,663.8 59,125.1 63,946.2 61,714.4 60,308.9 54,566.0Total 109,759.1 113,701.0 130,633.0 133,663.8 136,935.1 160,368.4 159,719.2 180,704.4 203,310.6
AK HCBS 666.6 7,071.2 17,668.5 19,234.1 23,071.0 30,618.7 53,139.8 51,865.8 57,618.9ICF-MR 11,589.3 6,891.3 2,032.5 267.5 0.0 0.0 0.0 0.0 0.0Total 12,255.9 13,962.5 19,701.0 19,501.6 23,071.0 30,618.7 53,139.8 51,865.8 57,618.9
AZ* HCBS 109,357.8 189,920.6 203,897.5 211,970.6 252,771.0 287,561.7 322,608.0 327,357.0 332,106.3ICF-MR 16,911.2 17,791.6 18,732.2 16,189.5 17,787.8 12,457.2 12,794.4 14,164.6 13,936.6Total 126,269.0 207,712.2 222,629.7 228,160.1 270,558.8 300,018.9 335,402.4 341,521.6 346,042.9
AR HCBS 14,057.1 13,238.1 12,063.3 16,814.7 25,213.1 34,048.5 43,009.0 53,076.9 55,975.6ICF-MR 94,186.9 105,334.8 105,949.5 109,175.1 116,542.3 121,239.6 96,255.4 119,491.1 120,675.0Total 108,244.0 118,572.9 118,012.8 125,989.8 141,755.4 155,288.1 139,264.4 172,568.0 176,650.6
CA HCBS 133,839.1 314,614.0 355,246.0 436,829.4 461,810.0 478,275.3 532,303.6 853,788.1 928,760.0ICF-MR 365,970.5 471,048.6 380,655.5 391,151.9 413,635.2 387,213.3 419,725.2 420,000.0 653,090.1Total 499,809.6 785,662.6 735,901.5 827,981.3 875,445.2 865,488.6 952,028.7 1,273,788.1 1,581,850.1
CO HCBS 77,602.3 125,499.1 133,282.5 148,628.4 176,383.3 191,257.0 217,913.8 205,028.1 237,440.2ICF-MR 38,872.9 24,164.7 23,574.8 22,251.7 22,247.6 17,985.7 16,034.1 19,202.4 20,545.0Total 116,475.2 149,663.8 156,857.3 170,880.1 198,630.9 209,242.7 233,947.9 224,230.5 257,985.2
CT HCBS 135,134.0 103,750.1 222,364.1 230,357.6 294,791.3 344,991.3 350,105.3 386,546.5 393,811.4ICF-MR 179,704.1 180,935.6 188,190.3 204,211.2 206,448.9 230,624.6 230,489.2 238,700.1 246,911.1Total 314,838.1 284,685.7 410,554.4 434,568.8 501,240.2 575,615.9 580,594.4 625,246.6 640,722.5
DE HCBS 9,074.4 22,911.1 16,279.2 17,678.8 18,451.8 27,432.6 32,131.6 34,181.4 45,424.2ICF-MR 27,269.9 30,886.2 31,232.6 32,558.0 32,794.1 32,545.0 30,869.8 31,219.3 28,514.3Total 36,344.3 53,797.3 47,511.8 50,236.8 51,245.9 59,977.5 63,001.4 65,400.7 73,938.5
DC HCBS 0.0 0.0 0.0 0.0 0.0 277.4 970.2 1,647.8 3,507.1ICF-MR 64,030.2 60,969.2 74,258.0 69,176.5 67,571.5 70,280.1 77,914.5 79,480.0 78,839.0Total 64,030.2 60,969.2 74,258.0 69,176.5 67,571.5 70,557.5 78,884.7 81,127.8 82,346.1
FL HCBS 67,760.4 113,853.0 131,804.8 108,524.5 122,002.1 251,835.1 403,110.1 496,921.3 551,082.1ICF-MR 212,266.7 226,117.7 248,208.0 255,994.2 267,534.5 281,143.2 290,508.4 310,393.2 316,110.9Total 280,027.1 339,970.7 380,012.8 364,518.7 389,536.6 532,978.3 693,618.5 807,314.5 867,193.0
GA HCBS 17,300.0 56,393.7 63,126.6 83,000.0 98,200.0 92,058.1 149,447.3 223,566.2 227,611.6ICF-MR 119,694.2 125,847.8 127,303.1 106,845.0 108,958.3 110,219.3 111,980.2 110,659.3 109,347.1Total 136,994.2 182,241.5 190,429.7 189,845.0 207,158.3 202,277.4 261,427.5 334,225.5 336,958.7
HI HCBS 12,000.0 11,981.6 11,720.9 17,100.0 19,700.0 23,000.0 27.227.0 34,727.5 43,995.9ICF-MR 10,540.6 11,237.8 11,628.0 10,026.7 9,557.8 7,975.5 8,000.4 8,589.1 7,563.2Total 22,540.6 23,219.4 23,348.9 27,126.7 29,257.8 30,975.5 35,227.4 43,316.6 51,559.1
ID HCBS 2,035.0 7,814.9 9,996.5 9,076.9 10,804.4 16,279.3 23,180.5 27,804.3 36,035.7ICF-MR 40,364.4 40,571.8 43,453.8 46,796.0 48,928.0 53,210.5 61,011.5 55,250.9 54,266.3Total 42,399.4 48,386.7 53,450.3 55,872.9 59,732.4 69,489.9 84,192.1 83,055.2 90,302.0
IL HCBS* 57,553.8 58,434.7 116,000.0 151,000.0 149,300.0 140,200.0 188,590.0 236,978.3 285,368.2ICF-MR 489,074.6 591,718.9 580,152.2 610,073.4 627,992.1 649,195.5 668,984.3 695,913.3 681,494.6Total 546,628.4 650,153.6 696,152.2 761,073.4 777,292.1 789,395.5 857,574.3 932,891.6 966,862.8
IN HCBS 4,016.2 23,461.3 33,300.6 34,323.8 73,133.6 73,046.1 107,430.9 198,630.0 267,608.2ICF-MR 309,133.4 308,112.6 304,187.1 300,946.4 274,513.8 258,454.6 296,849.8 343,222.9 331,913.4Total 313,149.6 331,573.9 337,487.7 335,270.2 347,647.4 331,500.7 404,280.8 541,852.9 599,521.6
IA HCBS 4,025.3 32,212.5 48,271.5 51,737.0 74,235.2 88,572.7 106,033.6 127,081.3 142,647.2ICF-MR 161,161.4 178,843.9 178,213.3 177,479.8 184,609.6 191,252.4 202,856.3 208,167.5 233,812.4Total 165,186.7 211,056.4 226,484.8 229,216.8 258,844.8 279,825.1 308,889.9 335,248.8 376,459.6
KS HCBS 32,031.9 71,569.0 93,518.7 120,931.4 156,893.2 169,351.0 176,570.4 189,358.1 194,212.2ICF-MR 105,435.8 98,690.0 94,468.0 84,830.8 65,802.4 66,924.4 68,926.1 65,927.8 64,035.5Total 137,467.7 170,259.0 187,986.7 205,762.2 222,695.6 236,275.4 245,496.6 255,285.9 258,247.7
KY HCBS 25,165.3 25,722.0 29,429.6 40,639.8 42,191.8 60,431.9 76,424.1 91,755.9 92,622.6ICF-MR 71,528.6 58,064.8 75,690.6 79,354.7 85,576.5 83,523.7 94,311.9 97,888.5 113,264.2Total 96,693.9 83,786.8 105,120.2 119,994.5 127,768.3 143,955.6 170,736.0 189,644.4 205,886.8
LA HCBS 25,000.0 42,365.0 44,291.4 57,032.9 74,549.0 95,374.5 121,145.4 129,015.1 157,447.9ICF-MR 299,878.7 312,379.8 422,009.4 323,914.8 342,418.1 347,438.5 355,268.2 359,384.8 368,831.1Total 324,878.7 354,744.8 466,300.8 380,947.7 416,967.1 442,813.0 476,413.7 488,399.9 526,279.0
ME HCBS 23,738.0 15,600.0 60,066.6 69,044.0 93,074.0 108,340.8 124,372.0 155,499.7 175,000.0ICF-MR 54,806.5 49,475.9 45,548.2 38,824.4 40,722.9 35,306.1 44,841.1 50,370.1 60,571.4Total 78,544.5 65,075.9 105,614.8 107,868.4 133,796.9 143,646.9 169,213.1 205,869.8 235,571.4
MD HCBS 119,236.5 130,701.6 140,673.4 154,174.0 169,663.2 181,153.0 200,724.5 251,357.0 297,236.6ICF-MR 59,588.9 63,594.0 63,699.3 55,636.3 53,701.0 58,820.1 58,419.3 54,062.5 57,641.0Total 178,825.4 194,295.6 204,372.7 209,810.3 223,364.2 239,973.1 259,143.8 305,419.5 354,877.6
MA HCBS 204,300.0 248,400.0 280,000.0 377,346.7 408,875.2 423,921.9 454,624.8 483,391.2 540,113.6ICF-MR 295,029.0 276,184.6 254,061.8 252,869.4 224,951.6 210,037.5 211,838.8 198,048.9 220,310.8Total 499,329.0 524,584.6 534,061.8 630,216.1 633,826.8 633,959.3 666,463.6 681,440.1 760,424.4
MI HCBS 90,300.0 163,000.0 162,808.5 237,665.6 310,750.7 330,193.6 354,435.0 393,285.0 420,689.8ICF-MR 157,233.5 192,726.0 268,275.1 242,896.2 55,437.0 27,883.6 31,213.7 26,913.1 23,541.2Total 247,533.5 355,726.0 431,083.6 480,561.8 366,187.7 358,077.2 385,648.7 420,198.1 444,231.0
MN HCBS 127,711.2 215,225.0 260,223.2 311,247.6 355,967.5 408,223.7 508,066.4 699,687.0 796,837.6ICF-MR 245,807.0 183,855.0 238,628.4 223,835.4 187,921.8 208,714.0 217,662.5 207,899.6 195,215.6Total 373,518.2 399,080.0 498,851.6 535,083.0 543,889.3 616,937.7 725,728.9 907,586.6 992,053.2
MS HCBS 0.0 25.8 631.0 1,526.4 2,640.9 4,421.9 10,414.4 20,699.3 28,348.3ICF-MR 84,960.6 101,925.1 119,386.0 131,470.6 144,188.7 158,201.5 170,211.7 178,043.0 184,000.1Total 84,960.6 101,950.9 120,017.0 132,997.0 146,829.6 162,623.3 180,626.1 198,742.3 212,348.4
MO HCBS 80,547.5 137,227.7 155,017.9 168,970.0 186,560.5 198,881.7 219,298.7 235,897.0 230,180.8ICF-MR** 144,138.8 156,510.3 104,771.1 110,152.0 158,139.8 164,291.9 184,291.1 213,814.4 227,025.6Total 224,686.3 293,738.0 259,789.0 279,122.0 344,700.3 363,173.6 403,589.8 449,711.4 457,206.4
*estimated for 2001 and 2002 **revised for 1999, 2000, 2001 and 2002

89
Table 3.16b Annual Expenditures in Thousands of Dollars for HCBS and ICF-MR, byState, in the Years 1994 - 2003
State Program 1994 1996 1997 1998 1999 2000 2001 2002 2003MT HCBS 15,564.4 20,399.9 22,500.0 26,300.0 27,315.1 33,561.6 36,886.2 42,005.4 59,850.9
ICF-MR 14,221.8 14,747.4 15,809.4 12,132.4 16,374.8 17,425.1 21,363.4 14,061.1 11,480.3Total 29,786.2 35,147.3 38,309.4 38,432.4 43,689.9 50,986.6 58,249.5 56,066.5 71,331.2
NE HCBS 32,271.4 45,063.0 58,901.0 67,147.9 75,600.5 82,541.5 87,763.0 108,402.2 109,030.3ICF-MR 34,234.1 36,497.9 36,895.8 42,975.9 45,105.3 48,861.9 47,765.8 47,952.6 49,171.0Total 66,505.5 81,560.9 95,796.8 110,123.8 120,705.8 131,403.3 135,528.8 156,354.8 158,201.3
NV HCBS 2,060.4 4,640.2 4,877.3 8,353.3 9,182.0 12,245.0 20,046.6 24,367.3 27,432.1ICF-MR 20,334.9 23,737.0 22,844.6 25,448.6 26,715.8 28,496.2 28,912.5 30,468.3 24,825.0Total 22,395.3 28,377.2 27,721.9 33,801.9 35,897.8 40,741.2 48,959.0 54,835.6 52,257.1
NH HCBS 64,005.4 80,460.1 89,427.2 97,407.3 102,433.8 99,742.7 113,414.4 117,921.6 118,532.8ICF-MR 5,979.8 3,290.8 1,299.2 1,502.3 1,593.0 1,660.4 2,146.9 1,952.8 1,865.9Total 69,985.2 83,750.9 90,726.4 98,909.6 104,026.8 101,403.1 115,561.4 119,874.4 120,398.7
NJ HCBS 130,063.5 154,968.0 180,066.0 199,366.0 284,536.0 296,254.0 360,838.0 402,988.0 363,752.0ICF-MR 357,321.4 359,085.3 373,077.5 347,216.5 377,878.9 380,579.7 421,459.4 462,968.8 426,296.0Total 487,384.9 514,053.3 553,143.5 546,582.5 662,414.9 676,833.7 782,297.4 865,956.8 790,048.0
NM HCBS 10,178.7 71,840.1 46,295.3 91,603.1 100,117.4 109,600.0 132,070.0 157,256.0 183,000.0ICF-MR 38,311.0 31,852.6 21,728.7 16,315.8 15,331.9 27,815.2 18,412.4 18,993.1 19,693.6Total 48,489.7 103,692.7 68,024.0 107,918.9 115,449.3 137,415.2 150,482.4 176,249.1 202,693.6
NY HCBS 403,370.9 728,613.8 1,114,422.8 1,343,414.4 1,561,068.4 1,694,409.8 1,701,780.2 2,125,806.3 2,120,120.2ICF-MR 2,011,018.2 2,112,557.2 2,010,005.6 2,047,529.2 2,126,786.3 2,129,387.5 2,159,385.1 2,201,916.5 2,439,086.4Total 2,414,389.1 2,841,171.0 3,124,428.4 3,390,943.6 3,687,854.7 3,823,797.3 3,861,165.3 4,327,722.8 4,559,206.6
NC HCBS 19,846.2 56,651.0 106,199.2 134,166.8 136,043.3 182,951.6 217,112.0 254,336.7 259,000.0ICF-MR 331,537.7 347,958.3 363,153.0 380,157.1 393,413.3 396,863.4 400,129.5 416,422.6 418,466.7Total 351,383.9 404,609.3 469,352.2 514,323.9 529,456.6 579,814.9 617,241.5 670,759.3 677,466.7
ND HCBS 23,270.0 28,924.5 30,176.0 33,850.1 37,634.4 41,961.9 44,856.2 47,531.2 49,235.2ICF-MR 38,746.8 41,528.3 43,652.9 44,306.1 45,057.3 49,980.5 48,135.0 53,136.7 51,650.8Total 62,016.8 70,452.8 73,828.9 78,156.2 82,691.7 91,942.4 92,991.2 100,667.9 100,886.0
OH HCBS 49,739.5 91,365.2 90,058.2 108,500.0 179,811.8 178,002.9 195,088.8 245,009.4 392,420.4ICF-MR 453,032.9 473,811.9 391,631.0 534,896.1 511,978.9 558,612.2 737,436.1 926,944.1 991,909.0Total 502,772.4 565,177.1 481,689.2 643,396.1 691,790.7 736,615.2 932,524.9 1,171,953.5 1,384,329.4
OK HCBS 57,848.6 104,988.4 93,593.0 119,327.7 134,251.3 147,633.0 177,065.3 222,356.1 205,536.7ICF-MR 91,297.6 92,345.1 100,899.6 106,414.2 101,701.8 103,178.3 114,124.0 108,821.8 111,600.2Total 149,146.2 197,333.5 194,492.6 225,741.9 235,953.1 250,811.4 291,189.3 331,177.9 317,136.9
OR HCBS 78,199.6 99,133.7 105,178.1 127,803.0 161,500.0 232,255.3 292,334.0 283,161.0 285,540.3ICF-MR 78,885.5 77,571.2 75,273.3 76,396.0 66,732.2 24,519.8 11,216.8 9,895.3 8,151.3Total 157,085.1 176,704.9 180,451.4 204,199.0 228,232.2 256,775.1 303,550.8 293,056.3 293,691.6
PA HCBS 247,511.0 340,698.9 415,399.5 446,453.6 532,018.0 677,863.1 789,398.9 977,487.2 1,044,794.1ICF-MR 501,094.4 554,620.6 544,000.0 554,600.9 518,343.0 496,918.6 486,148.8 497,866.5 509,008.0Total 748,605.4 895,319.5 959,399.5 1,001,054.5 1,050,361.0 1,174,781.7 1,275,547.7 1,475,353.7 1,553,802.1
RI HCBS 58,725.0 80,600.0 107,961.8 125,265.5 97,626.8 145,629.0 149,671.0 160,859.5 196,070.6ICF-MR 42,164.5 34,010.5 10,401.5 5,893.1 5,270.2 6,292.1 7,094.5 7,244.4 6,980.0Total 100,889.5 114,610.5 118,363.3 131,158.6 102,897.0 151,921.1 156,765.6 168,103.9 203,050.6
SC HCBS 18,000.0 32,600.0 51,300.0 70,200.0 92,203.0 111,100.0 132,300.0 142,500.0 146,580.0ICF-MR 172,312.3 184,919.2 174,750.1 172,453.5 167,756.4 171,931.8 169,106.5 174,843.2 167,696.1Total 190,312.3 217,519.2 226,050.1 242,653.5 259,959.4 283,031.8 301,406.5 317,343.2 314,276.1
SD HCBS 22,526.6 33,903.1 38,738.7 40,462.0 47,366.8 49,960.4 53,865.2 58,935.2 62,745.4ICF-MR 31,815.5 28,309.1 20,194.1 20,468.6 18,483.5 17,999.2 18,503.2 18,447.7 18,508.7Total 54,342.1 62,212.2 58,932.8 60,930.6 65,850.3 67,959.6 72,368.4 77,382.9 81,254.1
TN HCBS 16,031.0 71,431.4 72,738.5 96,592.9 135,111.0 159,937.1 201,248.8 205,313.6 277,187.6ICF-MR 135,559.6 201,502.7 212,774.0 243,620.0 237,723.1 234,719.4 232,818.1 253,862.7 255,674.6Total 151,590.6 272,934.1 285,512.5 340,212.9 372,834.1 394,656.5 434,066.9 459,176.3 532,862.2
TX HCBS 47,384.3 82,982.5 159,896.1 210,371.2 261,474.0 269,268.0 305,889.9 321,670.6 346,975.0ICF-MR 552,768.7 580,187.8 640,849.0 646,617.5 587,317.7 728,986.8 724,585.0 771,325.8 818,269.8Total 600,153.0 663,170.3 800,745.1 856,988.7 848,791.8 998,254.8 1,030,474.8 1,092,996.4 1,165,244.8
UT HCBS 31,114.3 40,827.0 50,793.7 58,316.4 65,767.7 74,301.9 82,351.4 88,991.0 94,610.1ICF-MR 38,094.7 46,127.9 45,047.1 43,954.8 51,317.7 53,199.5 54,230.2 54,883.1 54,664.4Total 69,209.0 86,954.9 95,840.8 102,271.2 117,085.4 127,501.4 136,581.5 143,874.1 149,274.5
V T HCBS 33,139.6 45,137.8 47,980.3 51,557.6 54,437.8 60,014.2 68,534.5 74,856.2 77,823.5ICF-MR 5,525.3 3,091.1 1,478.7 1,566.6 1,559.2 1,661.4 1,628.4 1,630.7 1,528.8Total 38,664.9 48,228.9 49,459.0 53,124.2 55,997.0 61,675.5 70,162.9 76,486.9 79,352.3
VA HCBS 26,129.7 50,479.1 67,429.9 88,557.3 113,354.5 144,547.9 174,353.9 198,911.2 228,194.2ICF-MR 153,543.5 153,656.3 159,667.0 160,216.7 169,784.4 183,139.8 187,412.0 211,837.7 215,350.8Total 179,673.2 204,135.4 227,096.9 248,774.0 283,138.9 327,687.7 361,765.9 410,748.9 443,545.0
WA HCBS 77,223.3 97,771.9 105,005.6 115,511.4 128,863.3 183,834.6 203,064.3 214,490.5 236,271.8ICF-MR 166,587.7 121,523.0 128,968.2 127,047.3 129,584.1 133,127.0 130,662.5 129,321.2 112,399.0Total 243,811.0 219,294.9 233,973.8 242,558.7 258,447.4 316,961.7 333,726.8 343,811.7 348,670.8
WV HCBS 19,923.4 36,075.3 43,659.5 57,750.7 66,636.0 87,636.0 97,574.5 120,217.7 141,395.8ICF-MR 14,288.2 53,704.3 52,705.2 48,655.6 45,810.8 47,088.5 47,763.2 47,513.2 53,018.6Total 34,211.6 89,779.6 96,364.7 106,406.3 112,446.8 134,724.5 145,337.7 167,730.9 194,414.4
WI HCBS 60,559.1 103,000.0 155,238.0 193,666.2 237,380.2 273,005.5 300,057.9 297,750.6 344,729.1ICF-MR 188,315.6 204,564.5 201,998.5 202,485.8 159,078.2 254,700.3 205,681.1 226,316.8 224,092.1Total 248,874.7 307,564.5 357,236.5 396,152.0 396,458.4 527,705.8 505,739.0 524,067.4 568,821.2
WY HCBS 23,986.8 29,157.6 33,428.0 38,222.2 40,983.4 44,143.5 46,598.1 56,956.5 61,657.6ICF-MR 6,829.1 10,483.6 17,777.8 16,630.2 14,385.5 16,054.3 14,856.4 11,662.1 15,807.9Total 30,815.9 39,641.2 51,205.8 54,852.4 55,368.9 60,197.8 61,454.5 68,618.6 77,465.5
US HCBS 2,971,625.1 4,714,394.1 5,965,273.4 7,133,408.6 8,364,718.5 9,663,900.7 11,277,419.5 12,979,622.3 14,122,912.5ICF-MR 9,222,257.5 9,733,572.7 9,996,224.0 9,833,092.1 9,594,717.6 9,902,142.7 10,235,442.1 10,867,404.1 11,473,216.1Total 12,193,882.6 14,447,966.8 15,961,497.4 16,966,500.7 17,959,436.2 19,566,043.4 21,512,861.6 23,847,026.4 25,596,128.6

Section 4State Profiles of Selected Service
Indicators, 1977-2003

92

93
Chapter 8Profiles of Trends in State Residential Services by State
Kathryn Coucouvanis, Jerra Smith, K. Charlie Lakin, and Robert W. Prouty
Each year the Residential Information System Project(RISP) receives requests from more than half of allstates for trend data on specific aspects of their state’sresidential services system. These requests comefrom state agencies, advocacy and consumerorganizations, service provider groups and others.Responses to these requests utilize statistics thathave been collected by the Research and TrainingCenter on Community Living since 1977. In thischapter, some of the statistics that are frequentlyrequested have been used to create a “profile” foreach state and for the United States as a whole. Thedata points are for June 30 of each year shown onthe profiles unless otherwise noted. On occasionstates have not been able to provide an updated reportfor each year of the RISP survey. In such instancesstatistics from the previous year have been repeatedand the year has been marked with an asterisk (*).The statistics included in each state profile include:a) the number of persons with intellectual disabilitiesand developmental disabilities (ID/DD) living inresidential settings of different sizes; b) the numberof persons with ID/DD receiving residential servicesper 100,000 of the state’s population; c) state ID/DDlarge facility populations; d) average daily state ID/DD large facility per diem rates; e) percentage of stateID/DD large facility residents who are children andyouth (0-21 years old); f) the number of residents of
Intermediate Care Facilities (for people with) MentalRetardation (ICF-MR); g) the number of persons withID/DD receiving Medicaid Home and CommunityBased Services (HCBS); and h) the number ofpersons with ID/DD living in Medicaid-certified genericnursing homes.
The statistics presented in the state profiles for1977 and 1982 come from national surveys of indi-vidual residential facilities in those years. The sitessurveyed included all residential settings that wereidentifiable as being state-licensed or state-operatedto serve persons with intellectual disabilities and otherdevelopmental disabilities. Data for 1987 to 2003come from annual surveys of state ID/DD, Medicaidand other relevant program agencies. The formerstudies’ outcomes were shaped by state licensing databases, while the latter studies relied on state infor-mation systems. In most states these two approachesincluded the same settings. But a few states’ resi-dential programs that serve significant numbers ofpersons with ID/DD are operated as generic programswithout involvement of and information to the stateagency that has general program responsibility forpersons with ID/DD. In these few states the 1977and 1982 data were inclusive of a wider range of resi-dential settings than were the data for 1987 and later.

94
Ala
bam
a
Per
sons
by
Hom
e S
ize
in Y
ears
198
2 an
d 20
03A
vera
ge P
er D
iem
of
Sta
te I
nsti
tuti
ons
Sta
te I
nsti
tuti
on R
esid
ents
ICF/
MR
+ H
CB
S R
ecip
ient
sP
ropo
rtio
n of
You
th A
mon
gS
tate
Ins
titu
tion
Pop
ulat
ion
20
03
1982
1-6
7-1
5
16+
0%2%4%6%8%10%
12%
14%
16%
18%
% of Youths in State Institutions
77
87
91
9496
980
00
2
Yea
r
0
1,00
0
2,00
0
3,00
0
4,00
0
5,00
0
6,00
0
7787
9194
9698
0002
Yea
r
Number of Persons
HC
BS
ICF-
MR
020
040
060
080
01,
000
1,20
01,
400
1,60
01,
800
2,00
0
Number of Residents
7787
9194
9698
0002
Yea
r
$0
$100
$200
$300
$400
$500
7782
8789
9193
9495
9697
9899
0001
0203
Yea
r
Per Diem Costs
Sta
teY
ea
r1-
67-
151
-15
16
+T
ota
l
AL
77
496
11
10
1,9
95
2,1
05
57
1,8
36
48
17
%0
0A
L8
212
11
83
30
41
,63
91
,94
34
91
,47
09
51
1%
1,4
70
0A
L8
727
32
56
52
91
,44
71
,97
64
81
,30
813
09
%1
,33
91
,57
0A
L8
928
24
95
77
71
,40
52
,18
25
31
,29
514
39
%1
,32
61
,83
01
,65
0A
L9
129
55
85
88
01
,25
82
,13
85
21
,25
816
98
%1
,28
82
,02
11
,32
1A
L9
336
16
79
1,0
40
1,2
63
2,3
03
54
1,2
34
187
1,2
66
2,1
84
1,3
00
AL
94
591
71
11
,30
21
,14
22
,44
45
81
,11
320
46
%1
,14
52
,90
0A
L9
582
17
43
1,5
64
940
2,5
04
59
94
021
797
22
,94
9A
L9
685
27
12
1,5
64
831
2,3
95
56
80
025
22
%82
53
,41
5A
L9
71
,43
69
41
2,3
77
833
3,2
10
73
72
025
274
53
,71
3A
L9
81
,44
49
41
2,3
85
709
3,0
94
74
70
923
82
%73
43
,71
3A
L9
91
,43
37
98
2,2
31
705
2,9
36
67
66
125
167
83
,89
1A
L0
01
,34
880
32
,15
166
52
,81
66
36
33
27
62
%63
34
,10
0A
L0
11
,52
579
72
,32
257
92
,90
16
55
47
29
256
94
,39
58
77
AL
02
1,6
64
887
2,5
51
468
3,0
19
67
44
63
75
1%
472
4,7
64
92
3A
L0
31
,84
592
72
,77
233
73
,10
96
83
37
46
736
34
,44
41
,00
7
Pe
rso
ns
wit
h I
D/D
D b
y H
om
e S
ize
Uti
liza
tio
n
Ra
te p
er
10
0,0
00
of
Po
pu
lati
on
Pe
rso
ns
wit
h
ID/D
D
Re
ceiv
ing
H
CB
S
Pe
rso
ns
wit
h
ID/D
D L
ivin
g i
n
Nu
rsin
g
Ho
me
s
Sta
te
Inst
itu
tio
n
Po
pu
lati
on
Pe
r D
iem
of
Sta
te
Inst
itu
tio
ns
(in
$)
0-2
1 Y
r. O
lds
as
% o
f S
tate
In
stit
uti
on
R
esi
de
nts
Pe
rso
ns
wit
h
ID/D
D L
ivin
g
in I
CF
s-M
R

95
Ala
ska
Per
sons
by
Hom
e S
ize
in Y
ears
198
2 an
d 20
03A
vera
ge P
er D
iem
of
Sta
te I
nsti
tuti
ons
Sta
te I
nsti
tuti
on R
esid
ents
ICF/
MR
+ H
CB
S R
ecip
ient
s
Pro
port
ion
of Y
outh
Am
ong
Sta
teIn
stit
utio
n P
opul
atio
n
0
20
40
60
80
10
0
12
0
Number of Residents
77
87
91
94
96
98
00
02
Ye
ar
c
0%10%
20%
30%
40%
50%
60%
70%
% of Youths in State Institutions
7787
9194
9698
0002
Year
0
200
400
600
800
1,00
0
7782
87
89
9193
94
95
9697
989
900
0102
03
Yea
r
Number of Persons
HC
BS
ICF-
MR
Sta
teY
ea
r1-
67-
151-
1516
+T
otal
AK
77
531
77
017
32
43
60
10
511
665
%13
50
AK
82
122
38
160
882
48
57
88
197
36%
118
0A
K8
720
24
524
783
33
06
16
030
11
%93
0A
K8
924
44
528
957
34
66
65
732
12
%97
050
AK
91
291
37
328
513
79
66
51
321
0%
910
48A
K9
343
25
448
645
53
19
64
535
50
%85
037
AK
94
458
70
528
385
66
94
38
397
0%
783
235
AK
95
468
70
538
285
66
90
28
466
6812
732
AK
96
492
73
565
195
84
90
19
453
0%
5919
028
AK
97
442
64
506
115
17
77
10
577
1035
320
AK
98
404
741
11
41
26
70
NA
NA
042
40
AK
99
455
846
30
46
37
50
NA
046
60
AK
00
660
866
80
66
81
08
0N
AN
A0
66
50
AK
01
866
086
60
86
61
36
0N
A0
84
42
4A
K0
294
00
940
09
40
14
60
NA
NA
08
84
24
AK
03
1,05
00
1,0
50
01
,05
01
58
0N
A0
93
18
Per
sons
with
ID
/DD
by
Hom
e S
ize
Util
izat
ion
Rat
e pe
r 10
0,00
0 of
P
opul
atio
n
Per
sons
with
ID
/DD
R
ecei
ving
H
CB
S
Per
sons
with
ID
/DD
Liv
ing
in
Nur
sing
H
om
es
Sta
te
Inst
itutio
n P
opul
atio
n
Pe
r D
iem
of
Sta
te
Inst
itutio
ns
(in
$)
0-21
Yr.
Old
s as
%
of
Sta
te
Inst
itutio
n R
esid
ents
Per
sons
with
ID
/DD
Liv
ing
in I
CF
s-M
R
$0
$200
$400
$600
$800
778
28
789
91
93
94
95
96
97
989
90
001
02
03
Yea
r
Per Diem Costs
2002
1982
1-6
7-15
16+

96
Ari
zona
Per
sons
by
Hom
e S
ize
in Y
ears
198
2 an
d 20
03A
vera
ge P
er D
iem
of
Sta
te I
nsti
tuti
ons
Sta
te I
nsti
tuti
on R
esid
ents
ICF/
MR
+ H
CB
S R
ecip
ient
sP
ropo
rtio
n of
You
th A
mon
gS
tate
Ins
titu
tion
Pop
ulat
ion
20
03
1982
1-6
7-15
16+
0%10%
20%
30%
40%
50%
% of Youths in State Institutions
7787
9194
9698
0002
Year
0
200
400
600
800
1,00
01,
200
Number of Residents
7787
9194
9698
0002
Year
0
2,00
0
4,00
0
6,00
0
8,00
0
10,0
00
12,0
00
14,0
00
16,0
00
77
82
8789
9193
9495
969
79
89
900
0102
03
Yea
r
Number of Persons
HC
BS
ICF-
MR
$0
$100
$200
$300
$400
778
28
789
91
93
94
95
96
97
989
90
001
02
03
Ye
ar
Per Diem Costs
Sta
teY
ea
r1-
67-
151
-15
16
+T
ota
l
AZ
77
120
11
62
36
1,2
16
1,4
52
63
1,0
13
34
46%
00
AZ
82
689
13
78
26
907
1,7
33
61
57
212
417
%0
0A
Z8
71
,57
12
25
1,7
96
423
2,2
19
65
42
317
56
%0
0A
Z8
91
,93
06
51
,99
538
02
,37
56
73
40
209
1%
690
33A
Z9
12
,26
39
12
,35
423
82
,59
26
91
93
213
1%
145
3,7
94
89A
Z9
32
,37
39
52
,46
817
02
,63
86
61
25
210
298
6,0
71
85A
Z9
42
,45
98
52
,54
416
82
,71
26
81
23
222
1%
339
6,7
73
83A
Z9
52
,49
68
12
,57
723
02
,80
76
91
23
220
200
7,1
17
49A
Z9
62
,40
31
08
2,5
11
186
2,6
97
65
10
323
119
37
,72
767
AZ
97
2,7
21
84
2,8
05
211
3,0
16
70
17
524
421
48
,50
848
AZ
98
2,7
06
83
2,7
89
211
3,0
00
64
17
325
321
59
,24
857
AZ
99
2,9
56
10
53
,06
121
13
,27
26
91
69
278
219
10
,18
01
18
AZ
00
3,3
99
703
,46
922
53
,69
47
21
66
27
00
%17
31
1,2
59
57
AZ
01
2,7
63
412
,80
419
83
,00
25
71
58
27
016
51
2,3
17
20
8A
Z0
22
,81
140
2,8
51
197
3,8
48
60
15
42
97
0%
207
13
,47
19
6A
Z0
33
,29
241
3,3
33
188
3,5
21
69
14
52
97
202
14
,49
45
0
Pe
rso
ns
wit
h I
D/D
D b
y H
om
e S
ize
Uti
liza
tio
n
Ra
te p
er
10
0,0
00
of
Po
pu
lati
on
Pe
rso
ns
wit
h
ID/D
D
Re
ceiv
ing
H
CB
S
Pe
rso
ns
wit
h
ID/D
D L
ivin
g i
n
Nu
rsin
g
Ho
me
s
Sta
te
Inst
itu
tio
n
Po
pu
lati
on
Pe
r D
iem
of
Sta
te
Inst
itu
tio
ns
(in
$)
0-2
1 Y
r. O
lds
as
% o
f S
tate
In
stit
uti
on
R
esi
de
nts
Pe
rso
ns
wit
h
ID/D
D L
ivin
g
in I
CF
s-M
R

97
Ark
ansa
s
Per
sons
by
Hom
e S
ize
in Y
ears
198
2 an
d 20
03A
vera
ge P
er D
iem
of
Sta
te I
nsti
tuti
ons
Sta
te I
nsti
tuti
on R
esid
ents
ICF/
MR
+ H
CB
S R
ecip
ient
s
Pro
port
ion
of Y
outh
Am
ong
Sta
te I
nsti
tuti
on P
opul
atio
n
20
03
1982
1-6
7-15
16+
020
040
060
080
01,
000
1,20
01,
400
1,60
01,
800
Number of Residents
7787
9194
9698
0002
Yea
r
0%10%
20%
30%
40%
50%
60%
70%
% of Youths in State Institutions
7787
9194
9698
0002
Year
0
500
1,00
0
1,50
02,
000
2,50
03,
000
3,50
04,
000
4,50
0
7782
8789
9193
9495
9697
9899
0001
0203
Yea
r
Number of Persons
HCBS
ICF-
MR
$0
$5
0
$1
00
$1
50
$2
00
$2
50
77
82
87
89
91
93
949
59
69
79
89
90
00
10
20
3
Ye
ar
Per Diem Costs
Sta
teY
ea
r1-
67
-15
1-1
516
+T
ota
l
AR
77
12
13
414
61
,76
71
,91
389
1,6
82
26
62
%1
,38
50
AR
82
42
14
819
01
,50
51
,69
574
1,3
54
73
39
%1
,42
00
AR
87
11
73
38
455
1,4
71
1,9
26
811
,33
71
00
25
%1
,46
10
AR
89
20
24
32
634
1,4
41
2,0
75
861
,30
21
19
21
%1
,44
10
600
AR
91
22
87
73
1,0
01
1,4
03
2,4
04
10
11
,26
51
45
19
%1
,56
51
96
1,1
00
AR
93
35
37
91
1,1
44
1,5
91
2,7
35
11
11
,24
41
56
1,7
24
45
31
,29
0A
R9
43
69
83
41
,20
31
,44
32
,64
61
09
1,2
58
15
41
3%
1,7
43
42
9A
R9
53
83
82
31
,20
61
,48
72
,69
31
09
1,2
63
15
71
,56
34
69
AR
96
50
38
23
1,3
26
1,4
96
2,8
22
11
31
,27
21
67
12
%1
,57
24
72
AR
97
32
88
94
1,2
22
1,5
58
3,2
76
12
91
,25
81
83
1,5
58
49
6A
R9
89
93
86
61
,85
91
,74
94
,10
41
62
1,2
45
18
81
1%
1,7
49
64
6A
R9
91
,04
88
79
1,9
27
1,7
59
3,6
86
14
51
,23
42
00
1,7
64
1,6
47
AR
00
1,2
32
87
32
,10
51
,75
13
,85
61
44
1,2
28
21
01
0%
1,7
66
2,0
84
86
7A
R0
192
38
82
1,8
05
1,7
20
3,5
25
13
11
,21
92
03
1,7
49
2,4
23
56
1A
R0
21
,19
67
88
1,9
84
1,6
32
3,6
16
13
31
,16
52
07
7%
1,6
84
2,4
94
56
1A
R0
389
68
13
1,7
09
1,5
69
3,2
78
12
11
,10
12
25
1,6
00
2,6
44
85
2
Pe
rso
ns
wit
h I
D/D
D b
y H
om
e S
ize
Uti
liza
tio
n
Ra
te p
er
10
0,0
00
of
Po
pu
lati
on
Pe
rso
ns
wit
h
ID/D
D
Re
ceiv
ing
H
CB
S
Pe
rso
ns
wit
h
ID/D
D L
ivin
g i
n
Nu
rsin
g
Ho
me
s
Sta
te
Inst
itu
tio
n
Po
pu
lati
on
Pe
r D
iem
of
Sta
te
Inst
itu
tio
ns
(in
$)
0-2
1 Y
r. O
lds
as
% o
f S
tate
In
stit
uti
on
R
esi
de
nts
Pe
rso
ns
wit
h
ID/D
D L
ivin
g
in I
CF
s-M
R

98
Cal
ifor
nia
Per
sons
by
Hom
e S
ize
in Y
ears
198
2 an
d 20
03A
vera
ge P
er D
iem
of
Sta
te I
nsti
tuti
ons
Sta
te I
nsti
tuti
on R
esid
ents
ICF/
MR
+ H
CB
S R
ecip
ient
sP
ropo
rtio
n of
You
th A
mon
gS
tate
Ins
titu
tion
Pop
ulat
ion
2003
1982
1-6
7-15
16+
0%5%10%
15%
20%
25%
30%
35%
40%
% of Youths in State Institutions
7787
9194
9698
0002
Yea
r
0
10,0
00
20,0
00
30,0
00
40,0
00
50,0
00
60,0
00
70,0
00
7782
8789
9193
9495
9697
9899
0001
0203
Yea
r
Number of Persons
HCBS
ICF-
MR
$0
$1
00
$2
00
$3
00
$4
00
$5
00
$6
00
7782
8789
9193
9495
9697
9899
0001
0203
Ye
ar
Per Diem Costs
Sta
teY
ea
r1-
67-
151
-15
16
+T
ota
l
CA
77
6,94
21
,94
78
,88
917
,291
26
,18
012
09
,73
75
539
%0
0C
A8
28,
759
2,5
92
11
,35
115
,715
27
,06
610
97
,92
411
019
%1
0,3
74
0C
A8
714
,502
3,3
47
17
,84
911
,054
28
,90
310
56
,88
018
417
%1
1,4
57
3,0
27
CA
89
15,3
393
,05
21
8,3
91
13,1
433
1,5
34
109
6,7
96
213
15%
10
,97
83
,35
58
80
CA
91
17,0
463
,07
42
0,1
20
12,3
313
2,4
51
107
6,6
92
219
13%
11
,37
63
,36
01,
075
CA
93
23,3
733
,13
42
6,5
07
11,6
833
8,1
90
124
6,3
36
219
11
,02
51
1,0
85
1,98
4C
A9
427
,822
3,3
28
31
,15
011
,551
42
,70
113
76
,34
321
910
%1
2,7
81
13
,26
61,
620
CA
95
30,0
053
,09
83
3,1
03
10,1
134
3,2
16
133
5,1
06
240
12
,12
51
9,1
01
1,24
8C
A9
631
,804
2,9
27
34
,73
19,
147
43
,87
813
34
,58
130
27
%1
0,2
33
29
,13
31,
248
CA
97
31,8
515
26
32
,37
79,
215
41
,59
212
34
,14
230
51
0,6
81
37
,47
81,
352
CA
98
33,8
642
,42
03
6,2
84
7,64
74
3,9
31
135
3,9
51
324
7%
10
,83
53
3,2
02
1,36
3C
A9
935
,916
2,5
20
38
,43
67,
360
45
,79
613
83
,89
733
61
1,2
65
30
,38
61,
416
CA
00
39,7
572,
433
42
,19
07,
087
49
,27
71
45
3,8
50
39
26
%11
,158
28
,23
31
,40
9C
A0
140
,608
2,34
44
2,9
52
6,89
24
9,8
44
14
43
,73
34
42
10,8
602
9,0
44
2,9
02
CA
02
42,0
531,
775
43
,82
86,
678
50
,50
61
44
3,6
71
44
66
%10
,839
44
,20
52
,90
2C
A0
342
,802
1,69
14
4,4
93
6,40
75
0,9
00
15
33
,56
04
89
9,81
35
3,7
75
6,9
26
Pe
rso
ns
wit
h I
D/D
D b
y H
om
e S
ize
Util
izat
ion
Rat
e pe
r 1
00
,00
0 o
f P
op
ula
tio
n
Pe
rso
ns
wit
h
ID/D
D
Re
ceiv
ing
H
CB
S
Pe
rso
ns
wit
h
ID/D
D L
ivin
g i
n
Nu
rsin
g
Ho
me
s
Sta
te
Inst
itutio
n
Pop
ulat
ion
Pe
r D
iem
of
Sta
te
Inst
itutio
ns
(in
$)
0-2
1 Y
r. O
lds
as
% o
f S
tate
In
stitu
tion
R
esi
de
nts
Pe
rso
ns
wit
h
ID/D
D L
ivin
g in
IC
Fs-
MR
0
2,00
0
4,00
0
6,00
0
8,00
0
10,0
00
Number of Residents
7787
9194
9698
0002
Year

99
Col
orad
o
Per
sons
by
Hom
e S
ize
in Y
ears
198
2 an
d 20
03A
vera
ge P
er D
iem
of
Sta
te I
nsti
tuti
ons
Sta
te I
nsti
tuti
on R
esid
ents
ICF/
MR
+ H
CB
S R
ecip
ient
s
Pro
port
ion
of Y
outh
Am
ong
Sta
te I
nsti
tuti
on P
opul
atio
n
2003
1982
1-6
7-15
16+
020
040
060
080
0
1,00
01,
200
1,40
01,
600
Number of Residents
7787
9194
9698
0002
Yea
r
0%5%10%
15%
20%
25%
30%
35%
40%
45%
% of Youths in State Institutions
7787
9194
9698
0002
Year
0
1,0
00
2,0
00
3,0
00
4,0
00
5,0
00
6,0
00
7,0
00
8,0
00
77
82
87
89
9193
94
95
9697
98
99
00
01
020
3
Ye
ar
Number of Persons
HC
BS
ICF
-MR
$0
$1
00
$2
00
$3
00
$4
00
$5
00
$6
00
77
8287
899
19
39
49
596
9798
990
00
10
20
3
Yea
r
Per Diem Costs
Sta
teY
ear
1-6
7-1
51
-15
16
+T
otal
CO
77
11
94
21
540
2,11
12,
651
101
1,53
93
34
5%
4,53
70
CO
82
19
96
70
869
1,96
02,
829
93
1,26
47
83
8%
2,01
70
CO
87
35
41
,34
51
,69
91,
247
2,94
68
990
11
30
17
%1,
247
1,3
89
CO
89
66
41
,58
12
,24
583
93,
084
93
493
14
11
3%
1,11
51
,67
945
9C
O9
11
,81
99
10
2,7
29
666
3,39
59
938
61
94
9%
927
1,9
93
428
CO
93
2,4
79
75
43
,23
346
83,
701
109
264
22
373
72
,40
733
3C
O9
42
,81
46
42
3,4
56
420
3,87
610
924
82
35
420
2,6
84
339
CO
95
3,0
64
76
53
,82
929
44,
123
111
241
23
530
73
,31
633
1C
O9
62
,92
95
93
3,5
22
233
3,75
59
919
72
90
8%
245
3,9
76
258
CO
97
3,1
56
53
73
,69
321
73,
910
100
179
29
122
94
,27
628
8C
O9
83
,35
94
83
3,8
42
169
4,01
110
116
93
04
5%
185
4,9
28
278
CO
99
3,5
03
44
03
,94
315
24,
095
101
152
33
016
86
,04
326
9C
O0
03
,61
64
56
4,0
72
12
24
,19
49
812
23
87
6%
138
6,33
027
0C
O0
13
,96
54
33
4,3
98
10
94
,50
710
210
93
62
125
6,44
432
0C
O0
23
,98
45
10
4,4
94
95
4,5
89
102
95
39
89
%11
16,
516
277
CO
03
4,2
57
47
34
,73
09
94
,82
911
19
95
11
115
6,77
927
4
Per
sons
with
ID
/DD
by
Hom
e S
ize
Util
izat
ion
Rat
e pe
r 10
0,00
0 of
P
opul
atio
n
Per
sons
with
ID
/DD
R
ecei
ving
H
CB
S
Per
sons
with
ID
/DD
Liv
ing
in
Nur
sing
H
om
es
Sta
te
Inst
itutio
n P
opul
atio
n
Per
Die
m o
f S
tate
In
stitu
tions
(i
n $
)
0-21
Yr.
Old
s as
%
of S
tate
In
stitu
tion
Res
iden
ts
Per
sons
with
ID
/DD
Liv
ing
in IC
Fs-
MR

100
Con
nect
icut
Per
sons
by
Hom
e S
ize
in Y
ears
198
2 an
d 20
03A
vera
ge P
er D
iem
of
Sta
te I
nsti
tuti
ons
Sta
te I
nsti
tuti
on R
esid
ents
ICF/
MR
+ H
CB
S R
ecip
ient
sP
ropo
rtio
n of
You
th A
mon
gS
tate
Ins
titu
tion
Pop
ulat
ion
2003
1982
1-6
7-15
16+
0%5%10%
15%
20%
25%
30%
% of Youths in State Institutions
7787
9194
9698
0002
Yea
r
0
500
1,00
0
1,50
0
2,00
0
2,50
0
3,00
0
3,50
0
Number of Residents
7787
9194
9698
0002
Yea
r
0
1,00
0
2,00
0
3,00
0
4,00
0
5,00
0
6,00
0
7,00
0
8,00
0
7782
8789
9193
9495
9697
9899
0001
0203
Yea
r
Number of Persons
HC
BSIC
F-M
R
$0
$1
00
$2
00
$3
00
$4
00
$5
00
$6
00
77
82
87
89
919
39
49
596
97
98
99
00
01
02
03
Ye
ar
Per Diem Costs
Sta
teY
ea
r1-
67
-15
1-1
51
6+
To
tal
CT
77
25
13
64
61
53
,88
14
,49
61
45
3,3
74
33
28%
68
70
CT
82
35
35
40
89
33
,66
04
,55
31
44
3,2
16
74
17%
1,5
98
0C
T8
71
,63
08
06
2,4
36
2,3
84
4,8
20
15
02
,29
81
91
12%
1,3
63
0C
T8
92
,68
05
57
3,2
37
1,9
00
5,1
37
15
91
,84
53
23
11%
2,3
35
1,1
27
43
6C
T9
13
,11
35
70
3,6
83
1,6
52
5,3
35
16
21
,65
23
33
6%
1,5
50
1,6
55
48
2C
T9
33
,56
95
48
4,1
17
1,4
14
5,5
31
16
71
,41
43
43
1,2
72
2,0
69
45
4C
T9
43
,68
95
40
4,2
29
1,3
42
5,5
71
17
01
,34
23
53
1%
1,2
76
2,3
61
41
9C
T9
54
,12
34
35
4,5
58
1,2
90
5,8
48
17
91
,29
0N
A1
,26
52
,54
24
03
CT
96
4,1
54
40
04
,55
41
,20
95
,76
31
76
1,2
09
35
71
,29
82
,99
93
94
CT
97
4,4
73
41
84
,89
11
,10
65
,99
71
83
1,1
06
47
01
,37
73
,37
13
55
CT
98
4,0
86
38
34
,46
91
,07
05
,53
91
69
1,0
70
47
01
%1
,38
23
,38
03
36
CT
99
4,6
45
43
05
,07
59
95
6,0
70
18
59
99
50
51
,31
14
,49
33
43
CT
00
4,6
85
45
25
,13
79
88
6,1
25
18
09
88
54
00
%1
,27
65
,07
63
58
CT
01
4,7
72
45
95
,23
19
27
6,1
58
18
09
27
53
51
,22
25
,50
87
01
CT
02
4,8
46
49
65
,34
28
83
6,2
25
18
08
83
54
41
%1
,19
25
,97
27
01
CT
03
4,8
24
92
45
,74
88
62
6,6
10
20
18
62
48
21
,17
55
,82
53
51
Pe
rso
ns
wit
h I
D/D
D b
y H
om
e S
ize
Uti
liza
tio
n
Ra
te p
er
10
0,0
00
of
Po
pu
lati
on
Pe
rso
ns
wit
h
ID/D
D
Re
ceiv
ing
H
CB
S
Pe
rso
ns
wit
h
ID/D
D L
ivin
g i
n
Nu
rsin
g
Ho
me
s
Sta
te
Inst
itu
tio
n
Po
pu
lati
on
Pe
r D
iem
of
Sta
te
Inst
itu
tio
ns
(in
$)
0-2
1 Y
r. O
lds
as
% o
f S
tate
In
stit
uti
on
R
esi
de
nts
Pe
rso
ns
wit
h
ID/D
D L
ivin
g
in I
CF
s-M
R

101
Del
awar
e
Per
sons
by
Hom
e S
ize
in Y
ears
198
2 an
d 20
03A
vera
ge P
er D
iem
of
Sta
te I
nsti
tuti
ons
Sta
te I
nsti
tuti
on R
esid
ents
ICF/
MR
+ H
CB
S R
ecip
ient
s
Pro
port
ion
of Y
outh
Am
ong
Sta
te I
nsti
tuti
on P
opul
atio
n
20
03
1982
1-6
7-15
16+
0%5%10%
15%
20%
25%
30%
35%
% of Youths in State Institutions
7787
9194
9698
0002
Yea
r
0
100
200
300
400
500
600
Number of Residents
7787
9194
9698
0002
Yea
r
0
100
200
300
400
500
600
700
800
900
77
8287
89
91
9394
9596
9798
99
00
0102
03
Yea
r
Number of Persons
HC
BS
ICF
-MR
Sta
teY
ea
r1-
67
-15
1-15
16
+T
otal
DE
77
179
91
88
622
81
01
39
54
628
35%
477
0D
E8
214
81
01
58
606
76
41
27
51
364
16%
513
0D
E8
724
84
92
97
383
68
01
06
38
31
07
6%
444
81D
E8
923
98
63
25
356
68
11
01
35
61
60
9%
442
100
89
DE
91
278
89
36
733
26
99
10
33
32
17
78
%42
124
56
0D
E9
332
75
33
80
370
75
01
05
32
42
01
370
290
0D
E9
435
05
54
05
320
72
51
01
32
02
19
356
310
0D
E9
536
16
14
22
307
72
91
02
30
72
32
313
356
0D
E9
642
13
14
52
291
74
31
02
28
42
63
2%
300
352
0D
E9
746
01
54
75
277
75
21
01
27
72
91
292
379
0D
E9
850
28
51
027
17
81
10
52
71
30
62
%28
538
20
DE
99
501
05
01
264
76
51
02
26
43
19
264
455
0D
E00
550
055
025
38
03
10
22
53
33
22
%25
348
13
4D
E01
585
058
527
48
59
10
82
14
34
727
451
87
8D
E02
659
065
924
19
00
11
21
81
37
7D
NF
241
547
78
DE
0370
40
704
218
92
21
18
15
94
00
218
614
58
Per
sons
with
ID
/DD
by
Hom
e S
ize
Util
izat
ion
Ra
te p
er
10
0,0
00
of
Po
pu
lati
on
Pe
rso
ns
wit
h
ID/D
D
Re
ceiv
ing
H
CB
S
Per
sons
with
ID
/DD
Liv
ing
in
Nu
rsin
g
Ho
me
s
Sta
te
Inst
itutio
n P
op
ula
tio
n
Pe
r D
iem
of
Sta
te
Inst
itutio
ns
(in $
)
0-2
1 Y
r. O
lds
as
% o
f S
tate
In
stitu
tion
Res
iden
ts
Pe
rso
ns
with
ID
/DD
Liv
ing
in
IC
Fs-
MR
$0
$1
00
$2
00
$3
00
$4
00
$5
00
77
82
87
89
91
93
94
95
96
97
98
99
00
01
02
03
Ye
ar
Per Diem Costs

102
Dis
tric
t of
Col
umbi
a
Per
sons
by
Hom
e S
ize
in Y
ears
198
2 an
d 20
03A
vera
ge P
er D
iem
of
Sta
te I
nsti
tuti
ons
Sta
te I
nsti
tuti
on R
esid
ents
ICF/
MR
+ H
CB
S R
ecip
ient
s
Pro
port
ion
of Y
outh
Am
ong
Sta
te I
nsti
tuti
on P
opul
atio
n
2003
1982
1-6
7-15
16+
$0
$100
$200
$300
77
82
87
89
91
93
94
959
697
98
99
00
01
02
03
Yea
r
Per Diem Costs
010
020
030
040
050
060
070
080
090
01,
000
Number of Residents
7787
9194
9698
0002
Year
0%2%4%6%8%10%
12%
14%
16%
18%
% of Youths in State Institutions
7787
9194
9698
0002
Year
0
200
400
600
800
1,00
0
1,20
0
77
8287
8991
9394
9596
9798
9900
0102
03
Yea
r
Number of Persons
HC
BS
ICF-
MR
Sta
teY
ea
r1-
67-
151-
1516
+T
otal
DC
77
280
28
960
98
814
39
23
NA
18%
00
DC
82
139
76
215
671
88
614
06
11
90
14%
436
0D
C8
749
62
35
731
258
98
915
92
58
165
9%
633
0D
C8
953
32
98
831
235
1,0
66
176
23
524
51
%64
10
55D
C9
164
63
04
950
137
1,0
87
182
77
260
0%
1,02
70
34D
C9
369
33
57
1,05
076
1,1
26
189
76
260
804
00
DC
94
721
36
31,
084
01
,08
418
80
NA
NA
722
00
DC
95
706
36
91,
075
01
,07
519
20
NA
754
00
DC
96
691
37
41,
065
01
,06
519
20
NA
NA
754
028
DC
97
955
23
978
09
78
179
0N
A75
40
0D
C9
895
52
397
80
97
818
70
NA
NA
754
00
DC
99
955
23
978
09
78
188
0N
A75
40
0D
C0
067
534
01
,01
50
1,0
15
17
70
NA
NA
840
67
0D
C0
164
336
21
,00
50
1,0
05
17
60
NA
787
22
44
0D
C0
281
229
81
,11
048
1,1
58
20
30
NA
NA
734
22
52
1D
C0
377
636
91
,14
535
1,1
80
22
20
NA
749
22
61
5
Per
sons
with
ID
/DD
by
Hom
e S
ize
Util
izat
ion
Rat
e pe
r 10
0,00
0 of
P
opul
atio
n
Per
sons
with
ID
/DD
R
ecei
ving
H
CB
S
Per
sons
with
ID
/DD
Liv
ing
in
Nur
sing
H
om
es
Sta
te
Inst
itutio
n P
opul
atio
n
Per
Die
m o
f S
tate
In
stitu
tions
(i
n $
)
0-21
Yr.
Old
s as
%
of
Sta
te
Inst
itutio
n R
esid
ents
Per
sons
with
ID
/DD
Liv
ing
in I
CF
s-M
R

103
Flor
ida
Per
sons
by
Hom
e S
ize
in Y
ears
198
2 an
d 20
03A
vera
ge P
er D
iem
of
Sta
te I
nsti
tuti
ons
Sta
te I
nsti
tuti
on R
esid
ents
ICF/
MR
+ H
CB
S R
ecip
ient
sP
ropo
rtio
n of
You
th A
mon
gS
tate
Ins
titu
tion
Pop
ulat
ion
2003
1982
1-6
7-15
16+
0
1,00
0
2,00
0
3,00
0
4,00
0
5,00
0
Number of Residents
7787
9194
9698
0002
Year
0%10%
20%
30%
40%
50%
60%
% of Youths in State Institutions
7787
9194
9698
0002
Year
0
5,00
0
10,0
00
15,0
00
20,0
00
25,0
00
30,0
00
35,0
00
7782
8789
9193
9495
9697
9899
0001
0203
Yea
r
Number of Persons
HC
BS
ICF-
MR
$0
$100
$200
$300
$400
7782
8789
9193
9495
9697
9899
0001
0203
Yea
r
Per Diem Costs
Sta
teY
ea
r1-
67
-15
1-15
16+
Tot
al
FL
77
79
11
,00
81,
799
6,3
04
8,1
03
964,
660
37
53
%37
00
FL
82
93
71
,47
42,
411
5,6
49
8,0
60
773,
334
76
21
%2,
128
0F
L8
75
93
2,6
54
3,24
74
,95
28
,19
969
2,06
11
17
17
%3,
152
2,6
31
FL
89
1,4
91
2,2
30
3,72
14
,77
58
,49
667
1,99
91
42
11
%3,
180
2,5
42
126
FL
91
1,9
87
2,2
44
4,23
14
,62
88
,85
967
1,97
71
64
4%
3,18
72
,63
121
2F
L9
32
,63
42
,00
74,
641
4,4
18
9,0
59
651,
744
17
53,
207
6,0
09
212
FL
94
3,2
92
1,8
34
5,12
64
,28
19
,40
769
1,73
51
87
2%
3,40
76
,43
021
2F
L9
54
,07
21
,67
05,
742
4,2
65
10
,00
770
1,73
32
03
3,53
07
,98
821
2F
L9
64
,53
91
,57
26,
111
3,8
77
9,9
88
691,
459
21
76
%3,
442
10
,00
0F
L9
75
,04
21
,43
76,
479
3,9
84
10
,46
370
1,56
22
20
3,47
61
1,3
99
226
FL
98
5,4
93
1,3
05
6,79
83
,82
21
0,6
20
711,
533
21
52
%3,
379
12
,72
819
6F
L9
96
,78
51
,34
67,
151
3,6
61
11
,79
278
1,51
22
65
3,39
11
3,8
09
192
FL
00
6,60
91
,35
97,
968
4,6
62
12
,63
07
91,
502
27
22
%3,
440
21
,12
61
91
FL
01
7,14
91
,29
28,
441
3,6
48
12
,08
97
41,
494
27
73,
310
24
,91
02
20
FL
02
7,77
11
,31
59,
086
3,6
01
12
,68
77
61,
504
26
31
%3,
338
25
,92
12
49
FL
03
8,96
81
,75
210
,720
3,5
58
14
,27
89
01,
481
31
63,
307
24
,30
12
73
Pe
rso
ns
wit
h I
D/D
D b
y H
om
e S
ize
Util
izat
ion
Ra
te p
er
10
0,0
00
of
Pop
ulat
ion
Pe
rso
ns
with
ID
/DD
R
ecei
ving
H
CB
S
Pe
rso
ns
with
ID
/DD
Liv
ing
in
Nur
sing
H
om
es
Sta
te
Inst
itutio
n P
opul
atio
n
Pe
r D
iem
of
Sta
te
Inst
itutio
ns
(in $
)
0-21
Yr.
Old
s as
%
of
Sta
te
Inst
itutio
n R
esid
ents
Pe
rso
ns
with
ID
/DD
Liv
ing
in
IC
Fs-
MR

104
Geo
rgia
Per
sons
by
Hom
e S
ize
in Y
ears
198
2 an
d 20
03A
vera
ge P
er D
iem
of
Sta
te I
nsti
tuti
ons
Sta
te I
nsti
tuti
on R
esid
ents
Pro
port
ion
of Y
outh
Am
ong
Sta
te I
nsti
tuti
on P
opul
atio
n
0%5%10%
15%
20%
25%
30%
35%
40%
% of Youths in State Institutions
7787
9194
9698
0002
Year
ICF/
MR
+ H
CB
S R
ecip
ient
s
0
2,00
0
4,00
0
6,00
0
8,00
0
10,0
00
12,0
00
7782
8789
9193
9495
9697
9899
0001
0203
Yea
r
Number of Persons
HC
BSIC
F-M
R
0
500
1,00
0
1,50
0
2,00
0
2,50
0
3,00
0
Number of Residents
7787
9194
9698
0002
Yea
r
2003
1982
1-6
7-15
16+
$0
$5
0$
10
0$
15
0$
20
0$
25
0$
30
0$
35
0
77
82
87
89
91
93
94
95
969
79
89
90
00
10
203
Yea
r
Per Diem Costs
Sta
teY
ea
r1-
67-
151-
1516
+T
otal
GA
77
962
36
332
2,99
43
,32
66
62
,80
75
539
%2,
369
0G
A8
270
91
38
847
2,71
03
,55
76
32
,46
09
820
%2,
491
0G
A8
71,
181
61
1,24
22,
227
3,4
69
56
2,0
89
155
10%
1,94
90
GA
89
1,36
24
21,
404
2,31
93
,72
35
82
,07
920
115
%1,
944
25
2,00
0G
A9
11,
608
11
1,61
92,
292
3,9
11
59
2,0
54
204
13%
1,94
235
31,
941
GA
93
1,48
21
41,
496
2,14
63
,64
25
22
,03
619
71,
933
359
1,94
1G
A9
41,
538
01,
538
2,10
13
,63
95
31
,99
119
710
%1,
897
556
2,20
0G
A9
51,
537
01,
537
2,08
53
,62
25
11
,97
521
31,
880
848
2,20
0G
A9
61,
538
01,
538
2,01
93
,55
74
91
,90
922
210
%2,
019
1,61
92,
200
GA
97
3,9
24
53
1,8
89
230
1,77
02,
332
1,05
9G
A9
83,
063
03,
063
1,73
24
,79
56
31
,62
223
35
%1,
732
2,40
01,
528
GA
99
3,13
30
3,13
31,
687
4,8
20
62
1,5
77
242
1,46
82,
847
1,70
1G
A0
03,
151
03
,15
11,
645
4,7
96
59
1,5
35
28
06
%1,
645
2,4
68
1,80
0G
A0
13,
241
03
,24
11,
589
4,8
03
57
1,4
79
28
01,
589
4,0
51
1,01
5G
A0
23,
331
03
,33
11,
475
4,8
06
56
1,3
65
29
86
%1,
475
8,1
90
1,63
6G
A0
33,
529
03
,52
91,
441
4,9
70
60
1,3
31
32
31,
441
8,9
02
1,31
0
Per
sons
with
ID
/DD
by
Hom
e S
ize
Util
izat
ion
Rat
e pe
r 10
0,00
0 of
P
opul
atio
n
Per
sons
with
ID
/DD
R
ecei
ving
H
CB
S
Per
sons
with
ID
/DD
Liv
ing
in
Nur
sing
H
om
es
Sta
te
Inst
itutio
n P
opul
atio
n
Per
Die
m o
f S
tate
In
stitu
tions
(i
n $
)
0-21
Yr.
Old
s as
%
of
Sta
te
Inst
itutio
n R
esid
ents
Per
sons
with
ID
/DD
Liv
ing
in I
CF
s-M
R

105
Haw
aii
Per
sons
by
Hom
e S
ize
in Y
ears
198
2 an
d 20
03A
vera
ge P
er D
iem
of
Sta
te I
nsti
tuti
ons
Sta
te I
nsti
tuti
on R
esid
ents
ICF/
MR
+ H
CB
S R
ecip
ient
s
Pro
port
ion
of Y
outh
Am
ong
Sta
te I
nsti
tuti
on P
opul
atio
n
20
03
19
82
1-6
7-15
16+
$0
$100
$2
00
$3
00
$4
00
$5
00
$6
00
$7
00
$8
00
7782
8789
9193
9495
9697
98
9900
0102
Ye
ar
Per Diem Costs
0%5%10%
15%
20%
25%
30%
35%
% of Youths in State Institutions
7787
9194
9698
0002
Yea
r
0
500
1,00
0
1,50
0
2,00
0
7782
8789
9193
9495
9697
9899
0001
0203
Yea
r
Number of Persons
HC
BS
ICF-
MR
0
100
200
300
400
500
600
Number of Residents
7787
9194
9698
0002
Yea
r
Sta
teY
ear
1-6
7-15
1-15
16+
Tot
al
HI
7736
618
384
543
927
101
524
4452
40
HI
8244
512
457
400
857
8637
991
33%
387
0H
I87
576
558
126
084
178
260
150
13%
297
56H
I89
917
892
517
31,
098
9917
319
913
%24
670
39H
I91
948
795
514
61,
101
9713
733
517
%38
618
913
8H
I93
913
792
010
61,
026
8586
365
117
450
135
HI
9491
57
922
961,
018
8484
365
9%
142
513
95H
I95
924
793
197
1,02
884
8237
113
249
169
HI
961,
070
71,
077
631,
140
9249
388
0%
127
517
87H
I97
1,02
97
1,03
647
1,08
384
3539
412
256
078
HI
981,
216
71,
223
341,
257
105
2446
70
%12
075
955
HI
991,
293
71,
300
111,
311
111
073
395
975
55H
I00
1,17
50
1,17
513
1,18
898
0N
AN
A96
1,08
997
HI
011,
150
71,
157
101,
325
108
0N
A96
1,33
510
0H
I02
1,06
87
1,07
510
1,11
189
0N
AN
A94
1,56
031
HI
031,
091
01,
091
81,
099
850
NA
731,
772
100
Per
sons
with
ID/D
D b
y H
ome
Siz
eU
tiliz
atio
n R
ate
per
100,
000
of
Pop
ulat
ion
Per
sons
with
ID
/DD
R
ecei
ving
H
CB
S
Per
sons
with
ID
/DD
Liv
ing
in
Nur
sing
H
omes
Sta
te
Inst
itutio
n P
opul
atio
n
Per
Die
m o
f S
tate
In
stitu
tions
(i
n $)
0-21
Yr.
Old
s as
%
of
Sta
te
Inst
itutio
n R
esid
ents
Per
sons
with
ID
/DD
Liv
ing
in I
CF
s-M
R

106
Idah
o
Per
sons
by
Hom
e S
ize
in Y
ears
198
2 an
d 20
03A
vera
ge P
er D
iem
of
Sta
te I
nsti
tuti
ons
Sta
te I
nsti
tuti
on R
esid
ents
ICF/
MR
+ H
CB
S R
ecip
ient
s
Pro
port
ion
of Y
outh
Am
ong
Sta
te I
nsti
tuti
on P
opul
atio
n
Sta
teY
ear
1-6
7-15
1-15
16+
Tot
al
ID77
4276
118
698
816
9545
338
35%
583
0ID
8241
180
221
639
860
8935
091
29%
482
0ID
8724
253
177
352
11,
294
129
263
124
11%
445
55ID
8930
049
479
434
51,
339
132
221
220
9%52
027
048
ID91
342
475
817
469
1,28
612
517
230
213
%53
516
583
ID93
668
534
1,20
232
01,
522
149
148
358
494
174
89ID
9477
950
51,
284
336
1,62
014
714
335
19%
527
333
73ID
9578
257
01,
352
284
1,63
614
213
337
854
036
232
ID96
1,20
852
11,
729
442
2,17
118
412
339
212
%53
841
539
ID97
1,37
258
41,
956
461
2,41
719
611
241
657
943
444
ID98
1,61
846
92,
087
381
2,46
820
110
842
817
%56
044
136
ID99
1,82
248
72,
309
383
2,69
221
511
243
857
750
932
ID00
2,19
248
12,
673
436
3,10
924
011
049
225
%59
280
128
ID01
2,32
249
52,
817
324
3,14
123
811
049
558
41,
031
90ID
022,
161
535
2,69
622
72,
923
218
106
544
25%
576
1,13
925
ID03
2,15
950
92,
668
244
2,91
220
410
352
557
71,
302
133
Per
sons
with
ID/D
D b
y H
ome
Siz
eU
tiliz
atio
n R
ate
per
100,
000
of
Pop
ulat
ion
Per
sons
with
ID
/DD
R
ecei
ving
H
CB
S
Per
sons
with
ID
/DD
Liv
ing
in
Nur
sing
H
omes
Sta
te
Inst
itutio
n P
opul
atio
n
Per
Die
m o
f S
tate
In
stitu
tions
(in
$)
0-21
Yr.
Old
s as
%
of S
tate
In
stitu
tion
Res
iden
ts
Per
sons
with
ID
/DD
Liv
ing
in I
CF
s-M
R
20
03
19
82
1-6
7-1
5
16+
$0
$100
$200
$300
$400
$500
$600
7782
8789
9193
9495
9697
9899
0001
0203
Yea
r
Per Diem Costs
0%5%10%
15%
20%
25%
30%
35%
% of Youths in State Institutions
7787
9194
9698
0002
Yea
r
0
500
1,00
0
1,50
0
2,00
0
7782
8789
9193
9495
9697
9899
0001
0203
Yea
r
Number of Persons
HC
BS
ICF-
MR
050100
150
200
250
300
350
400
450
500
Number of Residents
7787
9194
9698
0002
Yea
r

107
Illin
ois
Per
sons
by
Hom
e S
ize
in Y
ears
198
2 an
d 20
03A
vera
ge P
er D
iem
of
Sta
te I
nsti
tuti
ons
Sta
te I
nsti
tuti
on R
esid
ents
ICF/
MR
+ H
CB
S R
ecip
ient
s
Pro
port
ion
of Y
outh
Am
ong
Sta
te I
nsti
tuti
on P
opul
atio
n
20
03
1982
1-6
7-15
16+
$0
$5
0$
10
0$
15
0$
20
0$
25
0$
30
0$
35
0$
40
0
77
82
87
89
91
93
94
95
96
97
98
99
00
01
02
03
Ye
ar
Per Diem Costs
0%5%10%
15%
20%
25%
30%
35%
40%
% of Youths in State Institutions
7787
9194
9698
0002
Yea
r
0
5,00
0
10,0
00
15,0
00
20,0
00
25,0
00
7782
8789
9193
9495
9697
9899
0001
0203
Year
Number of Persons
HCBS
ICF-
MR
0
1,00
0
2,00
0
3,00
0
4,00
0
5,00
0
6,00
0
7,00
0
Number of Residents
7787
9194
9698
0002
Yea
r
Sta
teY
ea
r1-
67-
151-
151
6+
Tot
al
IL77
69
101
170
13,2
2813
,398
11
96,
394
54
39%
5,35
30
IL82
331
387
718
12,1
7012
,888
11
35,
250
96
30%
8,14
40
IL87
713
1,70
72,
420
10,4
2512
,845
11
14,
436
134
10%
9,40
066
4IL
8992
73,
024
3,95
111
,215
15,1
661
30
4,49
714
511
%10
,864
680
3,20
0IL
9189
73,
824
4,72
111
,824
16,5
451
43
4,34
017
46
%11
,943
1,33
82,
183
IL93
783
2,82
73,
610
12,4
1916
,029
13
64,
006
186
12,1
602,
850
1,65
9IL
941,
738
3,83
65,
574
10,1
9415
,768
13
53,
726
196
5%
10,9
793,
690
1,75
0IL
953,
843
3,84
77,
690
7,63
615
,326
12
93,
716
206
10,9
353,
761
2,93
9IL
962,
416
3,44
25,
858
7,21
913
,077
11
03,
718
221
5%
10,4
165,
267
2,87
2IL
973,
559
4,90
28,
461
8,55
317
,014
14
13,
482
262
10,5
005,
400
1,76
4IL
984,
063
4,19
38,
256
8,32
416
,580
13
83,
358
262
10,7
896,
037
1,54
3IL
994,
286
5,24
19,
527
7,33
616
,863
13
93,
298
277
10,6
786,
500
1,34
1IL
005,
349
5,39
510
,744
7,67
618
,420
14
83,
191
281
3%
10,3
106,
787
1,26
7IL
015,
349
5,39
510
,744
7,63
318
,377
14
73,
148
334
10,2
676,
787
1,68
9IL
025,
349
5,39
510
,744
7,28
918
,033
14
32,
804
324
2%
9,9
23
6,78
71,
689
IL03
5,34
95,
395
10,7
447,
419
18,1
631
49
2,93
433
310
,053
9,78
572
7
Per
sons
with
ID
/DD
by
Hom
e S
ize
Per
sons
with
ID
/DD
R
ecei
ving
H
CB
S
Per
sons
with
ID
/DD
Liv
ing
in
Nur
sing
H
omes
Sta
te
Inst
itutio
n P
opul
atio
n
Per
Die
m o
f S
tate
In
stitu
tions
(i
n $
)
0-21
Yr.
Old
s as
%
of
Sta
te
Inst
itutio
n R
esid
ents
Per
sons
with
ID
/DD
Liv
ing
in I
CF
s-M
R
Util
izat
ion
Rat
e pe
r 10
0,00
0 of
P
opul
atio
n

108
Indi
ana
Per
sons
by
Hom
e S
ize
in Y
ears
198
2 an
d 20
03A
vera
ge P
er D
iem
of
Sta
te I
nsti
tuti
ons
Sta
te I
nsti
tuti
on R
esid
ents
ICF/
MR
+ H
CB
S R
ecip
ient
s
Pro
port
ion
of Y
outh
Am
ong
Sta
te I
nsti
tuti
on P
opul
atio
n
Sta
teY
ea
r1-
67-
151-
1516
+T
otal
IN7
746
61
72
638
4,21
84
,85
69
13
,43
84
031
%1,
026
0IN
82
487
24
373
03,
231
3,9
61
72
2,3
88
65
17%
2,79
80
IN8
791
41
,60
92,
523
2,86
35
,38
69
82
,27
011
410
%4,
068
0IN
89
1,68
72
,02
23,
709
3,10
16
,81
012
22
,12
213
810
%5,
512
02,
200
IN9
12,
015
2,4
24
4,43
92,
648
7,0
87
126
1,7
56
175
4%
6,04
80
2,58
7IN
93
2,35
02
,79
95,
149
2,46
27
,61
113
41
,49
121
76,
213
447
2,04
7IN
94
2,50
62
,79
15,
297
2,32
97
,62
613
31
,38
421
95
%6,
224
529
2,04
7IN
95
2,58
92
,81
75,
406
2,47
87
,88
413
71
,32
722
06,
176
594
2,05
7IN
96
2,55
62
,82
05,
376
2,22
87
,60
413
01
,24
423
81
%5,
986
816
2,05
7IN
97
2,67
22
,78
75,
459
2,14
17
,60
012
81
,24
823
85,
938
1,06
72,
346
IN9
83,
931
2,7
62
6,69
32,
057
8,7
50
148
1,1
39
226
1%
5,85
51,
405
1,30
0IN
99
4,85
22
,75
47,
606
2,16
79
,77
316
41
,00
425
15,
964
1,55
41,
262
IN0
04,
332
2,75
47
,08
61,
632
8,7
18
14
37
97
35
71
%5,
423
2,0
81
1,93
3IN
0
13,
992
2,74
96
,74
11,
542
8,2
83
13
58
11
36
05,
295
2,6
46
1,24
1IN
0
23,
957
2,67
76
,63
41,
355
7,9
89
13
06
40
43
84
%4,
981
3,8
02
1,82
7IN
0
36,
317
2,67
78
,99
41,
103
10
,09
71
64
56
64
83
4,72
97
,98
31,
844
Per
sons
with
ID
/DD
by
Hom
e S
ize
Util
izat
ion
Rat
e pe
r 10
0,00
0 of
P
opul
atio
n
Per
sons
with
ID
/DD
R
ecei
ving
H
CB
S
Per
sons
with
ID
/DD
Liv
ing
in
Nur
sing
H
omes
Sta
te
Inst
itutio
n P
opul
atio
n
Per
Die
m o
f S
tate
In
stitu
tions
(i
n $
)
0-21
Yr.
Old
s as
%
of
Sta
te
Inst
itutio
n R
esid
ents
Per
sons
with
ID
/DD
Liv
ing
in I
CF
s-M
R
20
03
1982
1-6
7-1
5
16+
0
500
1,00
0
1,50
0
2,00
0
2,50
0
3,00
0
3,50
0
Number of Residents
7787
9194
9698
0002
Yea
r
$0$1
00$2
00$3
00$4
00$5
00$6
00
7782
8789
9193
9495
9697
9899
0001
0203
Yea
r
Per Diem Costs
0%5%10%
15%
20%
25%
30%
35%
% of Youths in State Institutions
7787
9194
9698
0002
Yea
r
0
2,00
04,
000
6,00
0
8,00
010
,000
12,0
0014
,000
7782
8789
9193
9495
9697
9899
0001
0203
Yea
r
Number of Persons
HC
BS
ICF-
MR
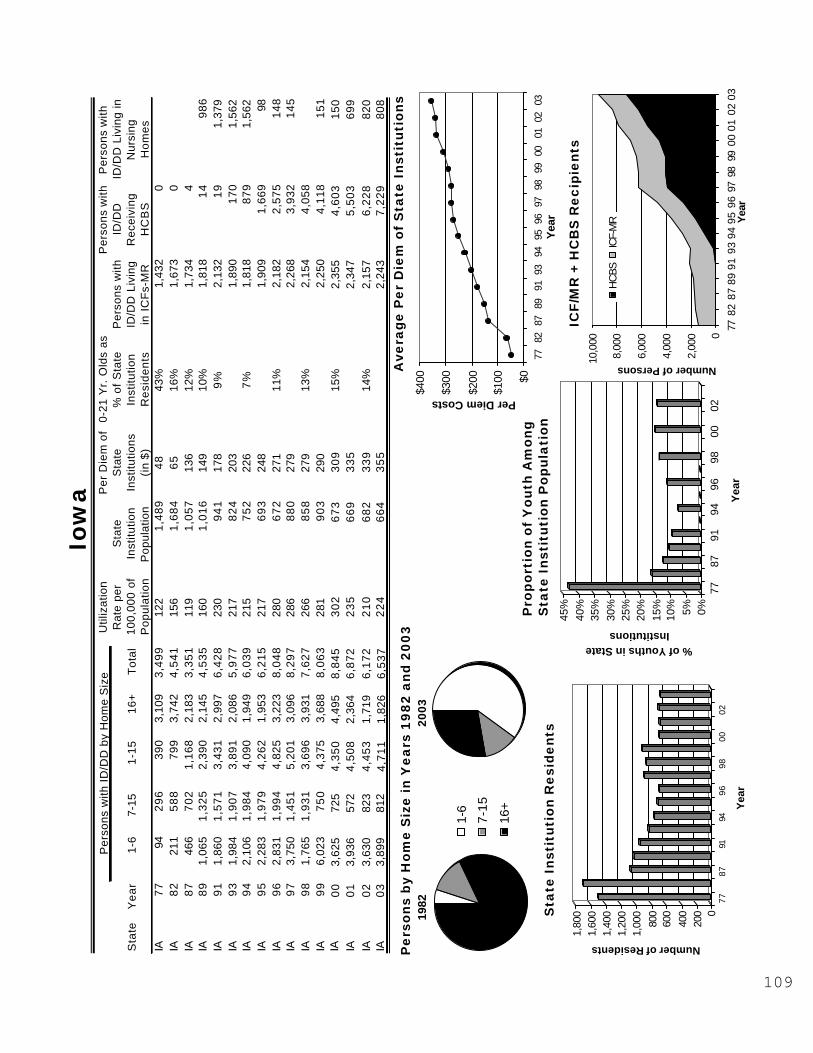
109
Iow
a
Per
sons
by
Hom
e S
ize
in Y
ears
198
2 an
d 20
03A
vera
ge P
er D
iem
of
Sta
te I
nsti
tuti
ons
Sta
te I
nsti
tuti
on R
esid
ents
ICF/
MR
+ H
CB
S R
ecip
ient
s
Pro
port
ion
of Y
outh
Am
ong
Sta
te I
nsti
tuti
on P
opul
atio
n$0
$100
$200
$300
$400
7782
8789
9193
9495
9697
9899
0001
0203
Yea
r
Per Diem Costs
0%5%10%
15%
20%
25%
30%
35%
40%
45%
% of Youths in State Institutions
7787
9194
9698
0002
Yea
r
0
2,00
0
4,00
0
6,00
0
8,00
0
10,0
00
7782
8789
9193
9495
9697
9899
0001
0203
Yea
r
Number of Persons
HC
BSIC
F-M
R
020
040
060
080
01,
000
1,20
01,
400
1,60
01,
800
Number of Residents
7787
9194
9698
0002
Yea
r
20
03
1982
1-6
7-15
16+
Sta
teY
ear
1-6
7-15
1-15
16+
Tot
al
IA7
794
29
639
03,
109
3,49
912
21,
489
48
43%
1,43
20
IA8
221
15
88
799
3,74
24,
541
156
1,68
46
516
%1,
673
0IA
87
466
70
21,
168
2,18
33,
351
119
1,05
713
612
%1,
734
4IA
89
1,06
51,
325
2,39
02,
145
4,53
516
01,
016
149
10%
1,81
81
498
6IA
91
1,86
01,
571
3,43
12,
997
6,42
823
09
41
178
9%
2,13
21
91,
379
IA9
31,
984
1,90
73,
891
2,08
65,
977
217
82
420
31,
890
170
1,56
2IA
94
2,10
61,
984
4,09
01,
949
6,03
921
57
52
226
7%
1,81
887
91,
562
IA9
52,
283
1,97
94,
262
1,95
36,
215
217
69
324
81,
909
1,66
998
IA9
62,
831
1,99
44,
825
3,22
38,
048
280
67
227
111
%2,
182
2,57
514
8IA
97
3,75
01,
451
5,20
13,
096
8,29
728
68
80
279
2,26
83,
932
145
IA9
81,
765
1,93
13,
696
3,93
17,
627
266
85
827
913
%2,
154
4,05
8IA
99
6,02
37
50
4,37
53,
688
8,06
328
19
03
290
2,25
04,
118
151
IA0
03,
625
725
4,35
04,
495
8,84
53
02
67
33
09
15%
2,35
54,
603
150
IA0
13,
936
572
4,50
82,
364
6,87
22
35
66
93
35
2,34
75,
503
699
IA0
23,
630
823
4,45
31,
719
6,17
22
10
68
23
39
14%
2,15
76,
228
820
IA0
33,
899
812
4,71
11,
826
6,53
72
24
66
43
55
2,24
37,
229
808
Per
sons
with
ID
/DD
by
Hom
e S
ize
Util
izat
ion
Rat
e pe
r 10
0,00
0 of
P
opul
atio
n
Per
sons
with
ID
/DD
R
ecei
ving
H
CB
S
Per
sons
with
ID
/DD
Liv
ing
in
Nur
sing
H
omes
Sta
te
Inst
itutio
n P
opul
atio
n
Per
Die
m o
f S
tate
In
stitu
tions
(i
n $)
0-21
Yr.
Old
s as
%
of
Sta
te
Inst
itutio
n R
esid
ents
Per
sons
with
ID
/DD
Liv
ing
in I
CF
s-M
R

110
Kan
sas
Per
sons
by
Hom
e S
ize
in Y
ears
198
2 an
d 20
03A
vera
ge P
er D
iem
of
Sta
te I
nsti
tuti
ons
Sta
te I
nsti
tuti
on R
esid
ents
ICF/
MR
+ H
CB
S R
ecip
ient
s
Pro
port
ion
of Y
outh
Am
ong
Sta
te I
nsti
tuti
on P
opul
atio
n
20
03
1982
1-6
7-15
16+
0%10%
20%
30%
40%
50%
60%
% of Youths in State Institutions
7787
9194
9698
0002
Yea
r
01,
000
2,00
03,
000
4,00
05,
000
6,00
07,
000
8,00
0
7782
8789
9193
9495
9697
9899
0001
0203
Yea
r
Number of Persons
HC
BS
ICF-
MR
$0
$100
$200
$300
$400
7782
8789
9193
9495
9697
9899
0001
0203
Yea
r
Per Diem Costs
Sta
teY
ear
1-6
7-15
1-15
16+
Tot
al
KS
77
220
40
662
62,
080
2,70
611
61,
460
49
52%
1,81
00
KS
82
184
48
266
62,
209
2,87
511
91,
371
78
46%
2,07
80
KS
87
613
55
51,
168
1,97
43,
142
127
1,29
812
331
%2,
161
135
KS
89
885
1,01
91,
904
1,71
02,
974
118
1,07
014
825
%1,
955
314
35K
S9
176
45
33
1,29
71,
698
2,99
512
01,
021
200
23%
2,01
549
731
KS
93
660
90
01,
560
1,54
73,
007
119
87
621
91,
837
1,06
60
KS
94
584
94
11,
525
1,47
73,
002
119
80
623
217
%1,
767
1,33
90
KS
95
584
94
11,
525
1,35
22,
877
113
73
225
41,
642
1,61
30
KS
96
546
83
11,
377
1,40
62,
783
106
67
627
71,
586
3,14
60
KS
97
3,12
22
94
3,41
61,
097
4,51
316
95
48
275
1,39
53,
872
0K
S9
83,
375
26
83,
643
850
4,49
317
14
15
275
11%
1,09
84,
891
0K
S9
93,
700
18
83,
888
647
4,53
517
13
84
294
843
5,12
00
KS
00
3,79
822
94,
027
590
4,67
41
74
38
93
20
9%
853
5,44
23
8K
S0
14,
051
193
4,24
458
84,
902
18
23
79
31
983
05,
835
511
KS
02
4,21
020
14,
411
467
4,87
81
80
38
33
27
7%
688
6,23
951
1K
S0
34,
348
172
4,52
044
34,
963
18
23
69
33
966
16,
340
421
Per
sons
with
ID/D
D b
y H
ome
Siz
eU
tiliz
atio
n R
ate
per
100,
000
of
Pop
ulat
ion
Per
sons
with
ID
/DD
R
ecei
ving
H
CB
S
Per
sons
with
ID
/DD
Liv
ing
in
Nur
sing
H
omes
Sta
te
Inst
itutio
n P
opul
atio
n
Per
Die
m o
f S
tate
In
stitu
tions
(i
n $)
0-21
Yr.
Old
s as
%
of
Sta
te
Inst
itutio
n R
esid
ents
Per
sons
with
ID
/DD
Liv
ing
in I
CF
s-M
R
0
200
400
600
800
1,00
01,
200
1,40
01,
600
Number of Residents
7787
9194
9698
0002
Yea
r

111
Ken
tuck
y
Per
sons
by
Hom
e S
ize
in Y
ears
198
2 an
d 20
03A
vera
ge P
er D
iem
of
Sta
te I
nsti
tuti
ons
Sta
te I
nsti
tuti
on R
esid
ents
ICF/
MR
+ H
CB
S R
ecip
ient
s
Pro
port
ion
of Y
outh
Am
ong
Sta
te I
nsti
tuti
on P
opul
atio
n
20
03
1982
1-6
7-1
5
16+
0%10%
20%
30%
40%
50%
60%
% of Youths in State Institutions
7787
9194
9698
0002
Yea
r
0
500
1,00
0
1,50
0
2,00
0
2,50
0
3,00
0
3,50
0
77
82
87
89
919
39
495
96
97
98
99
000
10
20
3Y
ea
r
Number of Persons
HC
BS
ICF
-MR
010
020
030
040
050
060
070
080
090
0
Number of Residents
7787
9194
9698
0002
Yea
r
Sta
teY
ear
1-6
7-15
1-15
16+
Tot
al
KY
7744
2973
1,58
51,
658
4878
969
56%
999
0K
Y82
112
6317
51,
685
1,86
051
811
8940
%1,
250
0K
Y87
327
103
430
1,19
91,
629
4478
613
124
%1,
199
609
KY
8948
313
762
01,
245
1,86
550
732
142
14%
1,17
972
840
0K
Y91
747
150
897
1,24
42,
141
5873
120
011
%1,
191
762
217
KY
9374
715
289
91,
133
2,03
254
620
205
1,05
385
5K
Y94
738
189
927
1,16
32,
090
5562
020
58%
1,13
388
7K
Y95
837
189
1,02
61,
257
2,28
359
688
217
1,20
187
9K
Y96
1,00
223
41,
236
1,17
32,
409
6264
422
75%
1,15
792
4K
Y97
1,12
523
41,
359
1,18
22,
541
6564
324
11,
180
1,04
0K
Y98
1,09
225
81,
350
1,16
92,
519
6464
026
21,
177
1,03
5K
Y99
1,22
627
41,
500
1,16
42,
664
6763
527
71,
172
1,03
9K
Y00
1,26
727
41,
541
1,13
32,
674
6662
029
12%
1,12
01,
279
KY
011,
290
204
1,49
486
32,
357
5861
228
788
71,
542
741
KY
022,
462
204
2,66
685
23,
518
8660
138
42%
876
1,80
774
1K
Y03
3,08
520
43,
289
824
4,11
310
157
236
984
82,
033
741
Per
sons
with
ID/D
D b
y H
ome
Siz
eU
tiliz
atio
n R
ate
per
100,
000
of
Pop
ulat
ion
Per
sons
with
ID
/DD
R
ecei
ving
H
CB
S
Per
sons
with
ID
/DD
Liv
ing
in
Nur
sing
H
omes
Sta
te
Inst
itutio
n P
opul
atio
n
Per
Die
m o
f S
tate
In
stitu
tions
(in
$)
0-21
Yr.
Old
s as
%
of S
tate
In
stitu
tion
Res
iden
ts
Per
sons
with
ID
/DD
Liv
ing
in I
CF
s-M
R
$0
$100
$200
$300
$400
$500
778
287
899
193
94
9596
97
989
900
01
02
03
Yea
r
Per Diem Costs

112
Per
sons
by
Hom
e S
ize
in Y
ears
198
2 an
d 20
03A
vera
ge P
er D
iem
of
Sta
te I
nsti
tuti
ons
Sta
te I
nsti
tuti
on R
esid
ents
ICF/
MR
+ H
CB
S R
ecip
ient
s
Pro
port
ion
of Y
outh
Am
ong
Sta
te I
nsti
tuti
on P
opul
atio
n
Loui
sian
a
20
03
1982
1-6
7-15
16+
0%5%10%
15%
20%
25%
30%
35%
40%
45%
50%
% of Youths in State Institutions
7787
9194
9698
0002
Yea
r
0
2,00
0
4,00
0
6,00
0
8,00
0
10,0
00
12,0
00
7782
8789
9193
9495
9697
9899
0001
0203
Yea
r
Number of Persons
HC
BSIC
F-M
R
$0$50
$100
$150
$200
$250
$300
7782
8789
9193
9495
9697
9899
0001
0203
Yea
r
Per Diem Costs
Sta
teY
ea
r1-
67-
151-
1516
+T
otal
LA
77
391
12
151
4,29
84
,44
911
33
,24
63
047
%3,
682
0L
A8
285
18
527
04,
785
5,0
55
116
3,5
14
68
35%
4,84
90
LA
87
914
29
11,
205
4,43
65
,64
112
52
,88
910
024
%5,
274
0L
A8
91,
889
12
32,
012
4,39
06
,40
214
62
,73
89
321
%6,
067
01,
200
LA
91
2,22
42
22
2,44
64,
418
6,8
64
185
2,4
08
147
17%
5,95
15
61,
252
LA
93
2,34
03
87
2,72
74,
226
6,9
53
184
2,2
86
170
5,67
81,
134
1,24
4L
A9
42,
609
88
23,
491
4,21
17
,70
217
92
,12
616
412
%6,
029
1,54
31,
243
LA
95
2,89
21
,03
43,
926
3,92
97
,85
518
12
,11
617
26,
044
1,92
61,
243
LA
96
3,17
61
,18
74,
363
3,64
88
,01
118
32
,03
119
110
%6,
102
2,10
01,
267
LA
97
3,17
61
,18
74,
363
3,56
07
,92
317
91
,94
320
36,
014
2,04
81,
267
LA
98
2,90
58
42
3,74
72,
966
6,7
13
154
1,8
97
183
16%
5,84
32,
407
LA
99
2,30
47
79
3,08
32,
753
5,8
36
134
1,7
51
207
5,62
72,
973
1,26
7L
A0
03,
595
779
4,3
74
2,74
57
,11
91
59
1,7
43
23
55
%5,
620
3,6
29
1,10
9L
A0
13,
585
795
4,3
80
2,68
77
,06
71
58
1,6
99
23
45,
553
4,0
08
765
LA
02
3,70
579
54
,50
02,
673
7,1
73
16
01
,66
52
69
3%
5,53
94
,23
276
5L
A0
33,
687
936
4,6
23
2,70
97
,33
21
63
1,6
93
26
15,
577
4,8
09
765
Per
sons
with
ID
/DD
by
Hom
e S
ize
Util
izat
ion
Rat
e pe
r 10
0,00
0 of
P
opul
atio
n
Per
sons
with
ID
/DD
R
ecei
ving
H
CB
S
Per
sons
with
ID
/DD
Liv
ing
in
Nur
sing
H
omes
Sta
te
Inst
itutio
n P
opul
atio
n
Per
Die
m o
f S
tate
In
stitu
tions
(i
n $
)
0-21
Yr.
Old
s as
%
of
Sta
te
Inst
itutio
n R
esid
ents
Per
sons
with
ID
/DD
Liv
ing
in I
CF
s-M
R
050
0
1,00
01,
500
2,00
0
2,50
0
3,00
03,
500
4,00
0
Number of Residents
7787
9194
9698
0002
Yea
r
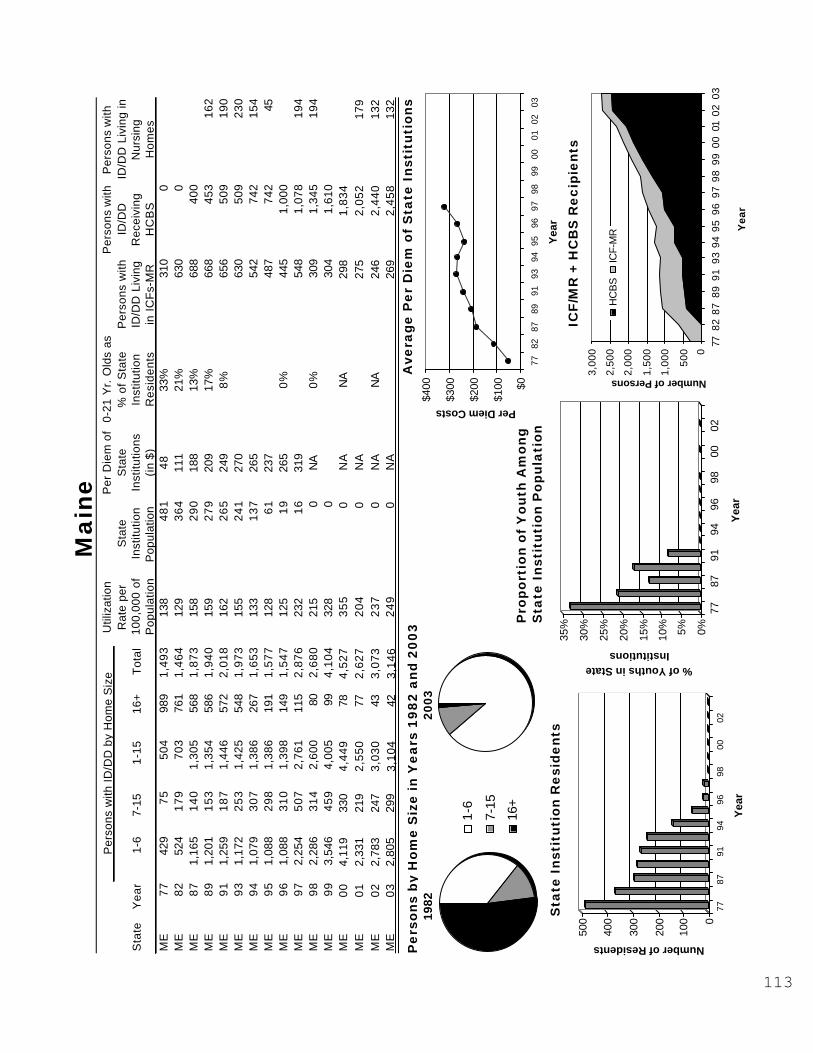
113
Mai
ne
Per
sons
by
Hom
e S
ize
in Y
ears
198
2 an
d 20
03A
vera
ge P
er D
iem
of
Sta
te I
nsti
tuti
ons
Sta
te I
nsti
tuti
on R
esid
ents
ICF/
MR
+ H
CB
S R
ecip
ient
s
Pro
port
ion
of Y
outh
Am
ong
Sta
te I
nsti
tuti
on P
opul
atio
n
20
03
1982
1-6
7-15
16+
$0
$100
$200
$300
$400
7782
8789
9193
9495
9697
9899
0001
0203
Yea
r
Per Diem Costs
0
100
200
300
400
500
Number of Residents
7787
9194
9698
0002
Yea
r
0%5%10%
15%
20%
25%
30%
35%
% of Youths in State Institutions
7787
9194
9698
0002
Yea
r
0
500
1,00
0
1,50
0
2,00
0
2,50
0
3,00
0
7782
8789
9193
9495
9697
9899
0001
0203
Yea
r
Number of Persons
HC
BS
ICF-
MR
Sta
teY
ear
1-6
7-15
1-15
16+
Tot
al
ME
7742
975
504
989
1,49
313
848
148
33%
310
0M
E82
524
179
703
761
1,46
412
936
411
121
%63
00
ME
871,
165
140
1,30
556
81,
873
158
290
188
13%
688
400
ME
891,
201
153
1,35
458
61,
940
159
279
209
17%
668
453
162
ME
911,
259
187
1,44
657
22,
018
162
265
249
8%
656
509
190
ME
931,
172
253
1,42
554
81,
973
155
241
270
630
509
230
ME
941,
079
307
1,38
626
71,
653
133
137
265
542
742
154
ME
951,
088
298
1,38
619
11,
577
128
6123
748
774
245
ME
961,
088
310
1,39
814
91,
547
125
1926
50
%44
51,
000
ME
972,
254
507
2,76
111
52,
876
232
1631
954
81,
078
194
ME
982,
286
314
2,60
080
2,68
021
50
NA
0%
309
1,34
519
4M
E99
3,54
645
94,
005
994,
104
328
030
41,
610
ME
004,
119
330
4,44
978
4,52
735
50
NA
NA
298
1,83
4M
E01
2,33
121
92,
550
772,
627
204
0N
A27
52,
052
179
ME
022,
783
247
3,03
043
3,07
323
70
NA
NA
246
2,44
013
2M
E03
2,80
529
93,
104
423,
146
249
0N
A26
92,
458
132
Per
sons
with
ID/D
D b
y H
ome
Siz
eU
tiliz
atio
n R
ate
per
100,
000
of
Pop
ulat
ion
Per
sons
with
ID
/DD
R
ecei
ving
H
CB
S
Per
sons
with
ID
/DD
Liv
ing
in
Nur
sing
H
omes
Sta
te
Inst
itutio
n P
opul
atio
n
Per
Die
m o
f S
tate
In
stitu
tions
(i
n $)
0-21
Yr.
Old
s as
%
of
Sta
te
Inst
itutio
n R
esid
ents
Per
sons
with
ID
/DD
Liv
ing
in I
CF
s-M
R

114
Mar
ylan
d
Per
sons
by
Hom
e S
ize
in Y
ears
198
2 an
d 20
03A
vera
ge P
er D
iem
of
Sta
te I
nsti
tuti
ons
Sta
te I
nsti
tuti
on R
esid
ents
ICF/
MR
+ H
CB
S R
ecip
ient
s
Pro
port
ion
of Y
outh
Am
ong
Sta
te I
nsti
tuti
on P
opul
atio
n
20
03
1982
1-6
7-15
16+
$0
$100
$200
$300
$400
$500
7782
8789
9193
9495
9697
9899
0001
0203
Yea
r
Per Diem Costs
0
500
1,00
0
1,50
0
2,00
0
2,50
0
3,00
0
Number of Residents
7787
9194
9698
0002
Yea
r
0%5%10%
15%
20%
25%
30%
35%
40%
% of Youths in State Institutions
7787
9194
9698
0002
Yea
r0
1,00
02,
000
3,00
04,
000
5,00
06,
000
7,00
08,
000
9,00
0
82
87
89
91
93
94
95
96
97
98
99
00
01
02
03
Yea
r
Number of Persons
HC
BS
ICF-
MR
Sta
teY
ear
1-6
7-15
1-15
16+
Tot
al
MD
77
627
113
33,
238
3,37
18
12,
926
36
37%
1,36
70
MD
82
352
16
351
52,
731
3,24
67
62,
421
65
23%
1,85
10
MD
87
2,36
82
56
2,62
41,
532
4,15
69
21,
452
148
15%
1,46
468
5M
D8
92,
919
12
2,93
11,
442
4,37
39
31,
362
166
11%
1,37
481
330
0M
D9
13,
325
03,
325
1,15
94,
484
92
1,07
920
08
%1,
079
1,08
253
7M
D9
33,
806
03,
806
1,06
94,
875
97
89
423
789
42,
437
690
MD
94
3,97
00
3,97
01,
013
4,98
310
08
22
250
822
2,78
773
8M
D9
54,
289
36
34,
652
846
5,49
810
87
75
267
775
2,89
855
8M
D9
63,
848
35
34,
201
726
4,92
79
66
52
288
5%
652
3,30
633
6M
D9
73,
914
32
74,
241
685
4,92
69
46
24
275
624
3,39
233
6M
D9
83,
908
36
14,
269
660
4,92
99
65
93
268
4%
593
3,35
333
6M
D9
94,
059
35
64,
415
664
5,07
99
85
62
288
562
3,66
033
6M
D0
04,
144
385
4,52
959
95,
128
97
52
53
16
0%
525
4,95
912
1M
D0
14,
069
388
4,45
755
25,
009
93
48
23
20
482
6,01
352
7M
D0
26,
188
442
6,63
085
97,
489
13
75
02
38
64
%50
26,
768
527
MD
03
6,59
046
07,
050
499
7,54
91
40
39
63
49
396
7,59
313
0
Per
sons
with
ID/D
D b
y H
ome
Siz
eU
tiliz
atio
n R
ate
per
100,
000
of
Pop
ulat
ion
Per
sons
with
ID
/DD
R
ecei
ving
H
CB
S
Per
sons
with
ID
/DD
Liv
ing
in
Nur
sing
H
omes
Sta
te
Inst
itutio
n P
opul
atio
n
Per
Die
m o
f S
tate
In
stitu
tions
(i
n $)
0-21
Yr.
Old
s as
%
of
Sta
te
Inst
itutio
n R
esid
ents
Per
sons
with
ID
/DD
Liv
ing
in I
CF
s-M
R

115
Mas
sach
uett
s
Per
sons
by
Hom
e S
ize
in Y
ears
198
2 an
d 20
03A
vera
ge P
er D
iem
of
Sta
te I
nsti
tuti
ons
Sta
te I
nsti
tuti
on R
esid
ents
ICF/
MR
+ H
CB
S R
ecip
ient
s
Pro
port
ion
of Y
outh
Am
ong
Sta
te I
nsti
tuti
on P
opul
atio
n
2003
1982
1-6
7-15
16+
0%5%10%
15%
20%
25%
% of Youths in State Institutions
7787
9194
9698
0002
Yea
r
0
2,00
0
4,00
0
6,00
0
8,00
0
10,0
00
12,0
00
14,0
00
7782
8789
9193
9495
9697
9899
0001
0203
Yea
r
Number of Persons
HC
BSIC
F-M
R
$0
$100
$200
$300
$400
$500
$600
77
828
78
991
93
949
596
97
9899
00
010
203
Yea
r
Per Diem Costs
Sta
teY
ear
1-6
7-15
1-15
16+
Tot
al
MA
77
282
1,01
21,
294
6,42
97,
723
134
5,61
63
721
%4,
242
0M
A8
291
11,
129
2,04
04,
682
6,72
211
63,
931
138
9%
3,97
10
MA
87
1,10
42,
658
3,76
23,
430
7,19
212
33,
367
251
2%
3,69
859
3M
A8
92,
224
2,78
05,
004
3,27
78,
281
140
3,02
632
51
%3,
548
1,21
01,
279
MA
91
3,44
01,
661
5,10
12,
694
7,79
513
02,
694
344
1%
3,27
21,
700
1,60
0M
A9
33,
611
1,93
65,
547
2,69
48,
241
138
2,61
443
53,
520
3,28
81,
735
MA
94
4,69
11,
874
6,56
52,
419
8,98
414
92,
119
407
0%
2,11
95,
130
1,82
3M
A9
55,
183
1,83
77,
020
2,40
79,
427
158
2,01
940
21,
990
7,80
01,
769
MA
96
6,09
31,
364
7,45
71,
824
9,28
015
51,
824
424
0%
1,79
58,
027
1,82
8M
A9
76,
663
1,43
38,
096
1,62
59,
721
163
1,62
542
71,
598
8,02
71,
465
MA
98
7,02
81,
362
8,39
01,
445
9,83
516
01,
445
467
0%
1,44
510
,317
1,61
7M
A9
97,
177
1,10
88,
285
1,37
49,
659
156
1,37
444
41,
346
10,6
781,
559
MA
00
8,63
474
09,
374
1,29
310
,667
16
81,
293
44
40
%1,
266
10,3
751,
499
MA
01
9,05
177
59,
826
1,23
611
,062
17
31,
236
46
71,
210
11,1
961,
475
MA
02
9,96
587
410
,839
1,15
011
,989
18
71,
150
44
70
%1,
125
11,3
151,
274
MA
03
8,71
487
39,
587
1,18
110
,768
17
11,
164
52
71,
136
11,7
641,
264
Per
sons
with
ID
/DD
by
Hom
e S
ize
Util
izat
ion
Rat
e pe
r 10
0,00
0 of
P
opul
atio
n
Per
sons
with
ID
/DD
R
ecei
ving
H
CB
S
Per
sons
with
ID
/DD
Liv
ing
in
Nur
sing
H
omes
Sta
te
Inst
itutio
n P
opul
atio
n
Per
Die
m o
f S
tate
In
stitu
tions
(i
n $)
0-21
Yr.
Old
s as
%
of
Sta
te
Inst
itutio
n R
esid
ents
Per
sons
with
ID
/DD
Liv
ing
in I
CF
s-M
R
0
1,00
0
2,00
0
3,00
0
4,00
0
5,00
0
6,00
0
Number of Residents
7787
9194
9698
0002
Yea
r

116
Mic
higa
n
Per
sons
by
Hom
e S
ize
in Y
ears
198
2 an
d 20
03A
vera
ge P
er D
iem
of
Sta
te I
nsti
tuti
ons
Sta
te I
nsti
tuti
on R
esid
ents
ICF/
MR
+ H
CB
S R
ecip
ient
s
Pro
port
ion
of Y
outh
Am
ong
Sta
te I
nsti
tuti
on P
opul
atio
n
Sta
teY
ear
1-6
7-15
1-15
16+
Tot
al
MI
77
1,30
62
,34
13,
647
9,00
21
2,6
49
139
6,1
00
47
35%
5,76
00
MI
82
3,52
91
,86
85,
397
5,70
51
1,1
02
122
3,1
73
132
16%
4,00
20
MI
87
4,93
45
72
5,50
62,
333
7,8
39
85
1,6
58
199
9%
3,42
53
MI
89
6,01
20
6,01
21,
780
7,7
92
84
1,2
37
238
7%
2,95
91,
292
1,90
0M
I9
17,
513
07,
513
1,01
38
,52
69
17
60
276
6%
2,85
02,
122
1,80
0M
I9
38,
444
08,
444
514
8,9
58
96
51
429
73,
342
2,88
51,
550
MI
94
8,71
90
8,71
941
19
,13
09
64
11
304
7%
3,36
63,
367
MI
95
10,4
440
10,4
4439
21
0,8
36
113
39
231
13,
375
3,84
274
8M
I9
611
,557
011
,557
346
11
,90
312
43
46
383
12%
3,18
55,
207
748
MI
97
11,5
990
11,5
9929
11
1,8
90
123
29
133
72,
899
6,19
981
2M
I9
89,
425
09,
425
283
9,7
08
99
28
337
59
%2,
830
5,70
883
8M
I9
99,
425
09,
425
272
9,6
97
98
27
231
227
28,
024
838
MI
00
9,42
50
9,4
25
269
9,6
94
98
26
93
84
9%
269
8,0
24
902
MI
01
10,3
730
10,3
7321
21
0,5
85
10
62
12
37
121
28
,13
21,
087
MI
02
10,3
730
10,3
7317
31
0,5
46
10
51
73
40
510
%17
38
,55
01,
087
MI
03
10,3
730
10,3
7317
31
0,5
46
10
81
73
49
917
38
,68
866
4
Per
sons
with
ID
/DD
by
Hom
e S
ize
Util
izat
ion
Rat
e pe
r 10
0,00
0 of
P
opul
atio
n
Per
sons
with
ID
/DD
R
ecei
ving
H
CB
S
Per
sons
with
ID
/DD
Liv
ing
in
Nur
sing
H
omes
Sta
te
Inst
itutio
n P
opul
atio
n
Per
Die
m o
f S
tate
In
stitu
tions
(i
n $)
0-21
Yr.
Old
s as
%
of
Sta
te
Inst
itutio
n R
esid
ents
Per
sons
with
ID
/DD
Liv
ing
in I
CF
s-M
R
2003
1982
1-6
7-15
16+
$0$1
00$2
00$3
00
$400
$500
$600
7782
8789
9193
9495
9697
9899
0001
0203
Yea
r
Per Diem Costs
0%5%10%
15%
20%
25%
30%
35%
% of Youths in State Institutions
7787
9194
9698
0002
Yea
r
0
2,00
0
4,00
0
6,00
0
8,00
0
10,0
00
7782
8789
9193
9495
9697
9899
0001
0203
Yea
r
Number of Persons
HC
BS
ICF-
MR
01,
000
2,00
03,
000
4,00
05,
000
6,00
07,
000
Number of Residents
7787
9194
9698
0002
Yea
r

117
Min
neso
ta
Per
sons
by
Hom
e S
ize
in Y
ears
198
2 an
d 20
03A
vera
ge P
er D
iem
of
Sta
te I
nsti
tuti
ons
Sta
te I
nsti
tuti
on R
esid
ents
ICF/
MR
+ H
CB
S R
ecip
ient
s
Pro
port
ion
of Y
outh
Am
ong
Sta
te I
nsti
tuti
on P
opul
atio
n
20
03
1982
1-6
7-15
16+
$0
$200
$400
$600
$800
$1,0
00
7782
8789
9193
9495
9697
9899
0001
0203
Yea
r
Per Diem Costs
0%5%10%
15%
20%
25%
30%
35%
40%
% of Youths in State Institutions
7787
9194
9698
0002
Yea
r
0
5,00
0
10,0
00
15,0
00
20,0
00
7782
8789
9193
9495
9697
9899
0001
0203
Yea
r
Number of Persons
HC
BS
ICF-
MR
0
500
1,00
0
1,50
0
2,00
0
2,50
0
3,00
0
3,50
0
Number of Residents
7787
9194
9698
0002
Yea
r
Sta
teY
ea
r1-
67-
151-
1516
+T
otal
MN
77
286
91
11,
197
4,98
56
,18
215
63
,03
24
437
%5,
303
0M
N8
265
21
,80
52,
457
4,61
27
,06
917
12
,41
78
917
%6,
899
0M
N8
72,
627
2,3
90
5,01
73,
772
8,7
89
207
1,6
53
158
4%
6,54
91,
423
MN
89
3,54
31
,94
95,
492
3,32
98
,82
120
31
,41
019
12
%5,
769
2,06
896
1M
N9
14,
310
1,8
53
6,16
33,
027
9,1
90
208
1,1
48
233
2%
5,31
62,
551
827
MN
93
5,89
81
,85
87,
756
2,54
41
0,3
00
232
87
528
85,
072
3,40
875
0M
N9
46,
615
1,9
11
8,52
62,
163
10
,68
923
77
51
310
3%
4,83
84,
385
750
MN
95
7,34
41
,91
09,
254
1,79
31
1,0
47
239
52
432
44,
455
4,89
71,
008
MN
96
7,89
61
,67
49,
570
1,42
01
0,9
90
236
34
535
53
%3,
826
5,42
21,
144
MN
97
9,14
01
,43
610
,576
1,33
11
1,9
07
251
24
454
13,
604
6,09
781
7M
N9
89,
501
1,3
44
10,8
451,
256
12
,10
125
61
38
541
12%
3,41
96,
710
553
MN
99
9,60
71
,25
610
,863
1,05
61
1,9
19
250
72
615
3,10
17,
102
521
MN
00
9,98
41,
225
11,2
0977
01
1,9
79
24
44
87
31
22%
2,77
57
,94
849
1M
N0
110
,194
1,18
311
,377
841
12
,21
82
46
36
77
82,
828
14,4
7055
1M
N0
210
,930
1,11
312
,043
1,02
31
3,0
66
26
04
37
78
24%
2,75
614
,735
1,01
0M
N0
311
,096
1,12
412
,220
969
13
,63
22
76
25
79
92,
667
14,7
5434
5
Per
sons
with
ID
/DD
by
Hom
e S
ize
Util
izat
ion
Rat
e pe
r 10
0,00
0 of
P
opul
atio
n
Per
sons
with
ID
/DD
R
ecei
ving
H
CB
S
Per
sons
with
ID
/DD
Liv
ing
in
Nur
sing
H
om
es
Sta
te
Inst
itutio
n P
opul
atio
n
Per
Die
m o
f S
tate
In
stitu
tions
(i
n $
)
0-21
Yr.
Old
s as
%
of
Sta
te
Inst
itutio
n R
esid
ents
Per
sons
with
ID
/DD
Liv
ing
in I
CF
s-M
R

118
Mis
siss
ippi
Per
sons
by
Hom
e S
ize
in Y
ears
198
2 an
d 20
03A
vera
ge P
er D
iem
of
Sta
te I
nsti
tuti
ons
Sta
te I
nsti
tuti
on R
esid
ents
ICF/
MR
+ H
CB
S R
ecip
ient
s
Pro
port
ion
of Y
outh
Am
ong
Sta
te I
nsti
tuti
on P
opul
atio
n
20
03
1982
1-6
7-15
16+
0%5%10%
15%
20%
25%
30%
35%
% of Youths in State Institutions
7787
9194
9698
0002
Yea
r
0
1,00
0
2,00
0
3,00
0
4,00
0
5,00
0
7782
8789
9193
9495
9697
9899
0001
0203
Yea
r
Number of Persons
HC
BS
ICF-
MR
$0$50
$100
$150
$200
$250
7782
8789
9193
9495
9697
9899
0001
0203
Yea
r
Per Diem Costs
Sta
teY
ea
r1-
67-
151-
1516
+T
otal
MS
77
171
02
119
2,05
52
,17
49
11
,66
62
332
%49
10
MS
82
672
10
277
2,20
12
,47
89
71
,75
65
329
%1,
614
0M
S8
720
51
12
317
2,12
72
,44
49
21
,52
26
022
%1,
603
0M
S8
926
27
433
62,
078
2,4
14
92
1,4
83
75
18%
1,58
80
280
MS
91
310
11
542
52,
081
2,5
06
97
1,4
96
94
16%
1,82
00
300
MS
93
395
21
460
92,
155
2,7
64
103
1,4
70
118
2,03
80
840
MS
94
409
30
371
22,
124
2,8
36
107
1,4
39
127
15%
2,07
70
975
MS
95
433
29
272
52,
027
2,7
52
103
1,4
67
136
2,05
90
MS
96
467
29
275
92,
049
2,8
08
105
1,4
24
144
20%
2,12
66
50
MS
97
660
34
21,
002
2,08
93
,09
111
41
,45
916
02,
256
231
0M
S9
846
74
41
908
2,05
12
,95
910
81
,39
917
42,
351
413
0M
S9
944
85
02
950
2,07
43
,02
410
91
,42
418
12,
432
550
0M
S0
040
061
71
,01
72,
039
3,0
56
10
71
,40
91
91
14%
2,48
78
50
321
MS
01
609
646
1,2
55
2021
3,2
76
11
51
,39
12
19
2,51
91
,72
031
7M
S0
257
265
01
,22
220
183
,24
01
13
1,3
88
22
213
%2,
534
1,6
73
317
MS
03
816
666
1,4
82
2056
3,5
38
12
31
,38
92
18
2,61
21
,90
834
4
Per
sons
with
ID
/DD
by
Hom
e S
ize
Util
izat
ion
Rat
e pe
r 10
0,00
0 of
P
opul
atio
n
Per
sons
with
ID
/DD
R
ecei
ving
H
CB
S
Per
sons
with
ID
/DD
Liv
ing
in
Nur
sing
H
omes
Sta
te
Inst
itutio
n P
opul
atio
n
Per
Die
m o
f S
tate
In
stitu
tions
(i
n $
)
0-21
Yr.
Old
s as
%
of
Sta
te
Inst
itutio
n R
esid
ents
Per
sons
with
ID
/DD
Liv
ing
in I
CF
s-M
R
020
040
060
080
01,
000
1,20
01,
400
1,60
01,
800
Number of Residents
7787
9194
9698
0002
Yea
r

119
Mis
sour
i
Per
sons
by
Hom
e S
ize
in Y
ears
198
2 an
d 20
03A
vera
ge P
er D
iem
of
Sta
te I
nsti
tuti
ons
Sta
te I
nsti
tuti
on R
esid
ents
ICF/
MR
+ H
CB
S R
ecip
ient
s
Pro
port
ion
of Y
outh
Am
ong
Sta
te I
nsti
tuti
on P
opul
atio
n
20
03
1982
1-6
7-1
5
16+
0%5%10%
15%
20%
25%
30%
35%
% of Youths in State Institutions
7787
9194
9698
0002
Yea
r
0
2,00
0
4,00
0
6,00
0
8,00
0
10,0
00
12,0
00
7782
8789
9193
9495
9697
9899
0001
0203
Ye
ar
Number of Persons
HC
BS
ICF
-MR
$0$50
$100
$150
$200
$250
$300
7782
8789
9193
9495
9697
9899
0001
0203
Yea
r
Per Diem Costs
Sta
teY
ear
1-6
7-15
1-15
16+
Tot
al
MO
7759
91,
059
1,65
84,
847
6,50
513
52,
308
4633
%2,
051
0M
O82
740
1,18
01,
920
4,33
16,
251
126
2,01
884
23%
1,87
80
MO
8784
81,
432
2,28
03,
671
5,95
111
71,
874
118
14%
2,14
80
MO
891,
058
1,77
82,
836
2,83
55,
671
110
1,88
513
014
%1,
858
338
1,44
0M
O91
1,36
81,
700
3,06
82,
804
5,87
211
41,
703
168
12%
2,00
81,
452
1,40
0M
O93
2,05
61,
862
3,91
82,
400
6,31
811
91,
492
173
1,70
92,
622
1,46
3M
O94
2,38
41,
463
3,84
72,
371
6,21
811
91,
500
184
1,70
93,
057
1,26
7M
O95
2,54
01,
441
3,98
12,
291
6,27
211
91,
484
184
1,67
83,
511
1,24
0M
O96
2,98
41,
315
4,29
92,
219
6,51
812
31,
494
200
6%
1,64
35,
685
1,12
5M
O97
3,21
91,
358
4,57
72,
062
6,63
912
41,
398
232
1,46
67,
537
1,34
8M
O98
5,94
51,
258
7,20
32,
034
9,23
715
61,
437
232
7%
1,50
18,
538
1,34
8M
O99
6,13
21,
196
7,32
81,
913
9,24
116
91,
436
232
1,48
87,
926
193
MO
003,
396
1,23
14,
627
1,74
96,
376
114
1,27
823
56
%1,
371
8,23
815
2M
O
013,
469
1,17
14,
640
1,67
86,
318
112
1,25
323
51,
341
8,41
91,
091
MO
02
3,50
01,
212
4,71
21,
436
6,14
810
81,
183
235
7%
1,39
88,
143
1,09
1M
O
033,
655
1,20
04,
855
1,61
16,
466
114
1,22
728
11,
310
7,86
187
8
Per
sons
with
ID/D
D b
y H
ome
Siz
eU
tiliz
atio
n R
ate
per
100,
000
of
Pop
ulat
ion
Per
sons
with
ID
/DD
R
ecei
ving
H
CB
S
Per
sons
with
ID
/DD
Liv
ing
in
Nur
sing
H
omes
Sta
te
Inst
itutio
n P
opul
atio
n
Per
Die
m o
f S
tate
In
stitu
tions
(i
n $)
0-21
Yr.
Old
s as
%
of
Sta
te
Inst
itutio
n R
esid
ents
Per
sons
with
ID
/DD
Liv
ing
in I
CF
s-M
R
0
500
1,00
0
1,50
0
2,00
0
2,50
0
Number of Residents
7787
9194
9698
0002
Yea
r
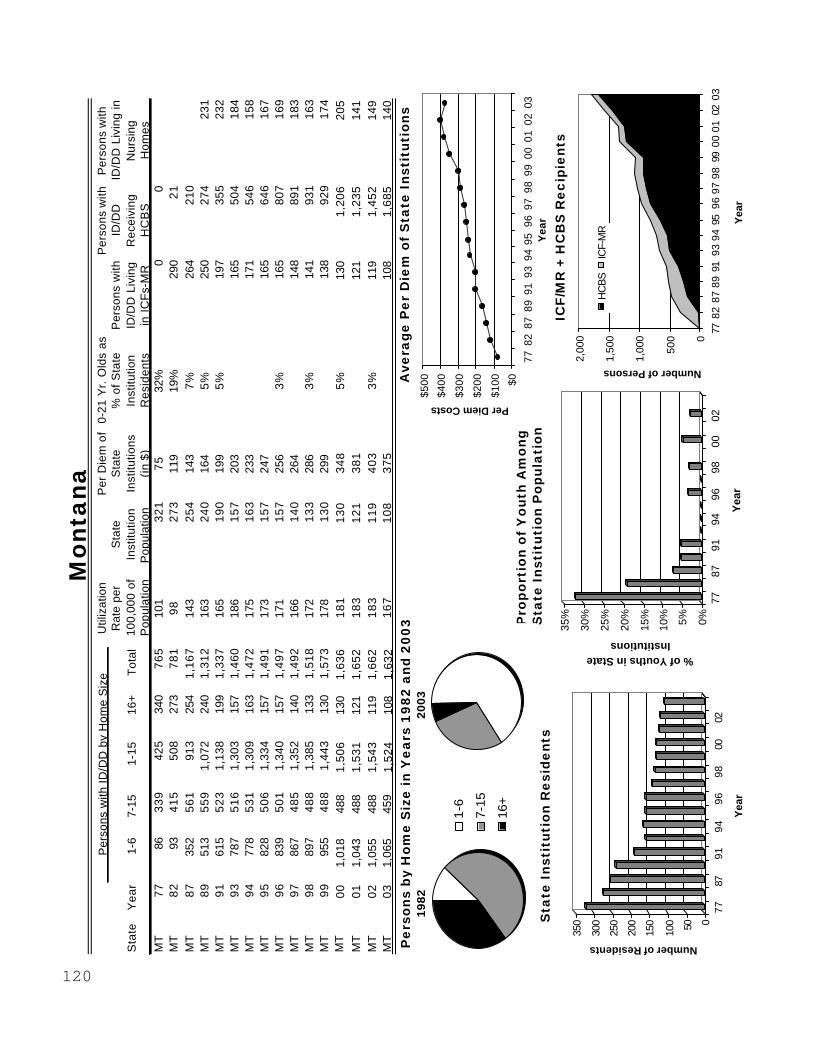
120
Mon
tana
Per
sons
by
Hom
e S
ize
in Y
ears
198
2 an
d 20
03A
vera
ge P
er D
iem
of
Sta
te I
nsti
tuti
ons
Sta
te I
nsti
tuti
on R
esid
ents
ICF/
MR
+ H
CB
S R
ecip
ient
s
Pro
port
ion
of Y
outh
Am
ong
Sta
te I
nsti
tuti
on P
opul
atio
n
20
03
19
82
1-6
7-15
16+
0%5%10%
15%
20%
25%
30%
35%
% of Youths in State Institutions
7787
9194
9698
0002
Yea
r
0
500
1,00
0
1,50
0
2,00
0
7782
8789
9193
9495
9697
9899
0001
0203
Yea
r
Number of Persons
HC
BS
ICF-
MR
$0
$100
$200
$300
$400
$500
7782
8789
9193
9495
9697
9899
0001
0203
Yea
r
Per Diem Costs
Sta
teY
ear
1-6
7-15
1-15
16+
Tot
al
MT
7786
339
425
340
765
101
321
7532
%0
0M
T82
9341
550
827
378
198
273
119
19%
290
21M
T87
352
561
913
254
1,16
714
325
414
37
%26
421
0M
T89
513
559
1,07
224
01,
312
163
240
164
5%
250
274
231
MT
9161
552
31,
138
199
1,33
716
519
019
95
%19
735
523
2M
T93
787
516
1,30
315
71,
460
186
157
203
165
504
184
MT
9477
853
11,
309
163
1,47
217
516
323
317
154
615
8M
T95
828
506
1,33
415
71,
491
173
157
247
165
646
167
MT
9683
950
11,
340
157
1,49
717
115
725
63
%16
580
716
9M
T97
867
485
1,35
214
01,
492
166
140
264
148
891
183
MT
9889
748
81,
385
133
1,51
817
213
328
63
%14
193
116
3M
T99
955
488
1,44
313
01,
573
178
130
299
138
929
174
MT
001,
018
488
1,50
613
01,
636
181
130
348
5%
130
1,20
620
5M
T01
1,04
348
81,
531
121
1,65
218
312
138
112
11,
235
141
MT
021,
055
488
1,54
311
91,
662
183
119
403
3%
119
1,45
214
9M
T03
1,06
545
91,
524
108
1,63
216
710
837
510
81,
685
140
Per
sons
with
ID/D
D b
y H
ome
Siz
eU
tiliz
atio
n R
ate
per
100,
000
of
Pop
ulat
ion
Per
sons
with
ID
/DD
R
ecei
ving
H
CB
S
Per
sons
with
ID
/DD
Liv
ing
in
Nur
sing
H
omes
Sta
te
Inst
itutio
n P
opul
atio
n
Per
Die
m o
f S
tate
In
stitu
tions
(i
n $)
0-21
Yr.
Old
s as
%
of
Sta
te
Inst
itutio
n R
esid
ents
Per
sons
with
ID
/DD
Liv
ing
in I
CF
s-M
R
050100
150
200
250
300
350
Number of Residents
7787
9194
9698
0002
Yea
r

121
Neb
rask
a
Per
sons
by
Hom
e S
ize
in Y
ears
198
2 an
d 20
03A
vera
ge P
er D
iem
of
Sta
te I
nsti
tuti
ons
Sta
te I
nsti
tuti
on R
esid
ents
ICF/
MR
+ H
CB
S R
ecip
ient
s
Pro
port
ion
of Y
outh
Am
ong
Sta
te I
nsti
tuti
on P
opul
atio
n
Sta
teY
ear
1-6
7-15
1-15
16+
Tot
al
NE
7719
555
174
61,
553
2,29
914
71,
155
4451
%1,
356
0N
E82
344
398
742
980
1,72
210
958
285
23%
980
0N
E87
950
399
1,34
981
62,
165
136
472
108
11%
816
0N
E89
1,29
830
81,
606
748
2,35
417
146
911
18
%75
654
035
3N
E91
1,39
930
81,
707
717
2,42
415
246
313
46
%71
968
361
3N
E93
900
218
1,11
871
31,
831
115
460
181
721
991
NE
9490
020
81,
108
686
1,79
411
243
917
54
%69
41,
257
NE
9584
127
51,
116
669
1,78
510
941
917
767
81,
169
0N
E96
1,45
324
01,
693
641
2,33
414
140
120
44
%65
01,
834
0N
E97
2,72
715
82,
885
634
3,51
921
039
720
864
32,
010
NE
982,
008
287
2,29
564
62,
941
177
405
217
4%
655
2,12
4N
E99
2,17
322
82,
401
641
3,04
218
340
123
265
02,
294
0N
E00
2,45
730
92,
766
639
3,40
519
939
923
44
%64
82,
318
115
NE
012,
421
309
2,73
061
93,
349
195
400
235
628
2,37
010
6N
E02
2,47
130
92,
780
633
3,41
319
739
225
34
%64
22,
419
94N
E03
2,42
813
32,
561
608
3,16
918
237
927
061
72,
769
93
Per
sons
with
ID/D
D b
y H
ome
Siz
eU
tiliz
atio
n R
ate
per
100,
000
of
Pop
ulat
ion
Per
sons
with
ID
/DD
R
ecei
ving
H
CB
S
Per
sons
with
ID
/DD
Liv
ing
in
Nur
sing
H
omes
Sta
te
Inst
itutio
n P
opul
atio
n
Per
Die
m o
f S
tate
In
stitu
tions
(i
n $)
0-21
Yr.
Old
s as
%
of
Sta
te
Inst
itutio
n R
esid
ents
Per
sons
with
ID
/DD
Liv
ing
in I
CF
s-M
R
20
03
19
82
1-6
7-15
16
+
0
200
400
600
800
1,00
0
1,20
0
Number of Residents
7787
9194
9698
0002
Yea
r
$0
$50
$100
$150
$200
$250
$300
77
828
78
991
93
9495
96
979
89
900
01
02
03Y
ear
Per Diem Costs
0%10%
20%
30%
40%
50%
60%
% of Youths in State Institutions
7787
9194
9698
0002
Yea
r
050
01,
000
1,50
0
2,00
02,
500
3,00
03,
500
4,00
0
7782
8789
9193
9495
9697
9899
0001
0203
Yea
r
Number of Persons
HC
BSIC
F-M
R

122
Nev
ada
Per
sons
by
Hom
e S
ize
in Y
ears
198
2 an
d 20
03A
vera
ge P
er D
iem
of
Sta
te I
nsti
tuti
ons
Sta
te I
nsti
tuti
on R
esid
ents
ICF/
MR
+ H
CB
S R
ecip
ient
s
Pro
port
ion
of Y
outh
Am
ong
Sta
te I
nsti
tuti
on P
opul
atio
n
2003
1982
1-6
7-15
16+
020406080100
120
140
160
180
Number of Residents
7787
9194
9698
0002
Yea
r
0%5%10%
15%
20%
25%
30%
35%
40%
45%
% of Youths in State Institutions
7787
9194
9698
0002
Yea
r
020
040
0
600
800
1,00
01,
200
1,40
0
1,60
0
7782
8789
9193
9495
9697
9899
0001
0203
Yea
r
Number of Persons
HC
BSIC
F-M
R
$0
$100
$200
$300
$400
7782
8789
9193
9495
9697
9899
0001
0203
Year
Per Diem Costs
Sta
teY
ear
1-6
7-15
1-15
16+
Tot
al
NV
77
612
08
116
62
47
39
16
66
724
%0
0N
V8
211
62
514
116
03
01
34
16
011
241
%17
50
NV
87
120
13
825
817
54
33
44
17
514
529
%19
012
9N
V8
934
01
535
517
05
25
47
17
019
026
%18
513
640
NV
91
389
15
404
173
57
74
51
73
215
26%
212
135
31N
V9
343
51
545
015
06
00
49
14
625
020
818
615
NV
94
458
045
815
06
08
44
14
526
420
517
27
NV
95
473
047
314
26
15
42
14
226
821
427
86
NV
96
476
19
495
158
65
34
31
54
275
18%
232
361
32N
V9
753
62
756
316
87
31
46
16
827
627
537
425
NV
98
656
27
683
169
85
24
91
69
276
20%
286
392
34N
V9
963
75
469
116
58
56
47
16
527
529
580
040
NV
00
874
3991
314
01,
053
53
14
03
59
23%
252
79
54
0N
V0
199
315
1,00
813
61,
144
54
13
63
44
246
1,09
07
6N
V0
21,
090
151,
105
131
1,23
65
71
31
36
220
%24
21,
083
76
NV
03
1,12
215
1,13
710
81,
245
62
10
83
75
219
1,04
01
4
Per
sons
with
ID/D
D b
y H
ome
Siz
eU
tiliz
atio
n R
ate
per
100,
000
of
Pop
ulat
ion
Per
sons
with
ID
/DD
R
ecei
ving
H
CB
S
Per
sons
with
ID
/DD
Liv
ing
in
Nur
sing
H
omes
Sta
te
Inst
itutio
n P
opul
atio
n
Per
Die
m o
f S
tate
In
stitu
tions
(i
n $)
0-21
Yr.
Old
s as
%
of
Sta
te
Inst
itutio
n R
esid
ents
Per
sons
with
ID
/DD
Liv
ing
in I
CF
s-M
R

123
New
Ham
pshi
re
Per
sons
by
Hom
e S
ize
in Y
ears
198
2 an
d 20
03A
vera
ge P
er D
iem
of
Sta
te I
nsti
tuti
ons
Sta
te I
nsti
tuti
on R
esid
ents
ICF/
MR
+ H
CB
S R
ecip
ient
s
Pro
port
ion
of Y
outh
Am
ong
Sta
te I
nsti
tuti
on P
opul
atio
n
2003
1982
1-6
7-15
16+
0
100
200
300
400
500
600
700
Number of Residents
7787
9194
9698
0002
Yea
r
0%5%10%
15%
20%
25%
30%
35%
40%
% of Youths in State Institutions
7787
9194
9698
0002
Yea
r
0
500
1,00
0
1,50
0
2,00
0
2,50
0
3,00
0
3,50
0
7782
8789
9193
9495
9697
9899
0001
0203
Yea
r
Number of Persons
HC
BS
ICF-
MR
$0$50
$100
$150
$200
$250
$300
7782
8789
9193
9495
9697
9899
0001
0203
Yea
r
Per Diem Costs
Sta
teY
ea
r1-
67-
151-
1516
+T
otal
NH
77
628
114
369
48
37
99
66
42
539
%28
80
NH
82
152
14
129
365
19
44
99
62
16
611
%33
90
NH
87
648
26
591
318
11
,09
410
31
60
215
2%
265
541
NH
89
809
19
91,
008
118
1,1
26
102
11
824
92
%15
876
211
NH
91
1,14
71
32
1,27
925
1,3
04
118
0N
AN
A91
955
26N
H9
31,
259
11
51,
874
231
,39
711
80
NA
741,
032
108
NH
94
1,34
19
21,
433
231
,45
612
40
NA
NA
731,
303
108
NH
95
1,42
57
01,
495
221
,51
713
10
NA
721,
570
107
NH
96
1,50
55
81,
563
221
,58
513
90
NA
NA
221,
906
101
NH
97
1,54
06
51,
605
231
,62
814
15
NA
232,
063
90N
H9
81,
630
73
1,70
325
1,7
28
146
2N
A0
%25
2,26
290
NH
99
1,60
74
31,
650
251
,67
514
00
NA
252,
276
90N
H0
01,
708
01
,70
824
1,7
32
14
00
NA
NA
242
,47
58
4N
H0
11,
722
01
,72
224
1,7
46
13
90
NA
242
,75
014
3N
H0
21,
726
281
,75
425
1,7
79
14
00
NA
NA
252
,77
912
6N
H0
31,
710
321
,74
225
1,7
67
14
10
NA
252
,83
510
0
Per
sons
with
ID
/DD
by
Hom
e S
ize
Util
izat
ion
Rat
e pe
r 10
0,00
0 of
P
opul
atio
n
Per
sons
with
ID
/DD
R
ecei
ving
H
CB
S
Per
sons
with
ID
/DD
Liv
ing
in
Nur
sing
H
omes
Sta
te
Inst
itutio
n P
opul
atio
n
Per
Die
m o
f S
tate
In
stitu
tions
(i
n $
)
0-21
Yr.
Old
s as
%
of
Sta
te
Inst
itutio
n R
esid
ents
Per
sons
with
ID
/DD
Liv
ing
in I
CF
s-M
R

124
New
Jer
sey
Per
sons
by
Hom
e S
ize
in Y
ears
198
2 an
d 20
03A
vera
ge P
er D
iem
of
Sta
te I
nsti
tuti
ons
Sta
te I
nsti
tuti
on R
esid
ents
ICF/
MR
+ H
CB
S R
ecip
ient
s
Pro
port
ion
of Y
outh
Am
ong
Sta
te I
nsti
tuti
on P
opul
atio
n
20
03
1982
1-6
7-15
16+
$0
$100
$200
$300
$400
$500
7782
8789
9193
9495
9697
9899
0001
0203
Yea
r
Per Diem Costs
0%5%10%
15%
20%
25%
30%
35%
40%
45%
50%
% of Youths in State Institutions
7787
9194
9698
0002
Yea
r
0
2,00
0
4,00
0
6,00
0
8,00
0
10,0
00
12,0
00
7782
8789
9193
9495
9697
9899
0001
0203
Year
Number of Persons
HCBS
ICF-
MR
Sta
teY
ea
r1-
67-
151-
1516
+T
otal
NJ
77
280
19
747
78,
836
9,3
13
127
7,9
61
25
50%
525
0N
J8
21,
076
43
91,
515
7,21
68
,73
111
76
,30
46
815
%4,
366
0N
J8
72,
556
46
23,
018
5,37
68
,39
410
95
,30
411
78
%3,
829
2,59
6N
J8
92,
747
57
33,
320
5,21
58
,53
511
05
,14
319
77
%3,
822
3,17
096
2N
J9
13,
954
03,
954
5,38
19
,33
512
04
,93
219
45
%3,
818
3,65
521
0N
J9
34,
043
04,
043
5,54
79
,59
012
04
,40
723
33,
892
4,19
128
6N
J9
44,
440
04,
440
5,49
09
,93
012
64
,36
324
91
%3,
975
4,72
937
1N
J9
54,
650
04,
650
5,19
99
,84
912
44
,28
626
44,
060
5,03
335
2N
J9
64,
505
53
35,
038
4,93
19
,96
912
54
,24
120
41
%4,
091
5,24
237
1N
J9
74,
714
58
95,
303
4,12
99
,43
211
74
,05
620
03,
948
5,70
533
4N
J9
85,
002
78
15,
783
3,74
49
,52
711
73
,85
323
22
%3,
744
6,19
9N
J9
95,
238
82
06,
058
3,67
19
,72
912
03
,66
921
43,
531
6,63
566
3N
J0
05,
729
842
6,5
71
3,58
71
0,7
03
12
73
,51
42
21
1%
3,48
76
,89
446
8N
J0
15,
871
834
6,7
05
3,50
71
0,7
65
12
73
,43
33
28
3,43
66
,97
856
0N
J0
26,
069
843
6,9
12
3,37
01
0,2
82
12
03
,29
64
15
1%
3,37
07
,48
665
2N
J0
36,
320
837
7,1
57
3,83
61
0,9
93
13
23
,16
94
01
3,16
68
,12
267
2
Per
sons
with
ID
/DD
by
Hom
e S
ize
Util
izat
ion
Rat
e pe
r 10
0,00
0 of
P
opul
atio
n
Per
sons
with
ID
/DD
R
ecei
ving
H
CB
S
Per
sons
with
ID
/DD
Liv
ing
in
Nur
sing
H
om
es
Sta
te
Inst
itutio
n P
opul
atio
n
Per
Die
m o
f S
tate
In
stitu
tions
(i
n $
)
0-21
Yr.
Old
s as
%
of
Sta
te
Inst
itutio
n R
esid
ents
Per
sons
with
ID
/DD
Liv
ing
in I
CF
s-M
R
01,
000
2,00
03,
000
4,00
05,
000
6,00
07,
000
8,00
0
Number of Residents
7787
9194
9698
0002
Yea
r

125
New
Mex
ico
Per
sons
by
Hom
e S
ize
in Y
ears
198
2 an
d 20
03A
vera
ge P
er D
iem
of
Sta
te I
nsti
tuti
ons
Sta
te I
nsti
tuti
on R
esid
ents
ICF/
MR
+ H
CB
S R
ecip
ient
s
Pro
port
ion
of Y
outh
Am
ong
Sta
te I
nsti
tuti
on P
opul
atio
n
20
03
1982
1-6
7-15
16+
$0$50
$100
$150
$200
$250
$300
$350
7782
8789
9193
9495
9697
9899
0001
0203
Yea
r
Per Diem Costs
0%5%10%
15%
20%
25%
30%
35%
% of Youths in State Institutions
7787
9194
9698
0002
Yea
r
0
100
200
300
400
500
600
Number of Residents
7787
9194
9698
0002
Yea
r
Sta
teY
ea
r1-
67-
151-
1516
+T
otal
NM
77
113
10
021
358
17
94
67
54
73
427
%42
60
NM
82
139
15
529
455
28
46
62
50
39
333
%55
30
NM
87
423
47
990
250
01
,40
29
25
00
107
22%
633
220
NM
89
318
41
473
252
81
,26
08
25
03
123
18%
751
135
88N
M9
139
63
60
756
505
1,2
61
81
47
314
817
%70
616
088
NM
93
493
27
276
546
11
,22
67
74
45
208
681
612
121
NM
94
862
24
21,
104
264
1,3
68
64
34
932
410
%58
580
212
1N
M9
51,
231
21
21,
443
226
1,6
69
59
21
028
852
51,
243
141
NM
96
1,60
21
81
1,78
325
52
,03
812
01
45
288
485
1,55
313
8N
M9
71,
223
18
11,
404
118
1,5
22
86
828
834
81,
603
138
NM
98
1,44
12
44
1,68
516
1,7
01
98
0N
AN
A30
11,
617
NM
99
1,77
22
91
2,06
316
2,0
79
120
0N
A30
11,
765
138
NM
00
1,63
927
91
,91
816
1,9
34
10
60
NA
NA
405
2,1
04
94
NM
01
1,53
720
61
,74
316
1,7
59
96
0N
A28
42
,42
611
4N
M0
21,
746
181
1,9
27
161
,94
31
05
0N
AN
A28
42
,79
414
0N
M0
31,
739
165
1,9
04
161
,92
09
80
NA
287
3,0
73
134
Per
sons
with
ID
/DD
by
Hom
e S
ize
Util
izat
ion
Rat
e pe
r 10
0,00
0 of
P
opul
atio
n
Per
sons
with
ID
/DD
R
ecei
ving
H
CB
S
Per
sons
with
ID
/DD
Liv
ing
in
Nur
sing
H
om
es
Sta
te
Inst
itutio
n P
opul
atio
n
Per
Die
m o
f S
tate
In
stitu
tions
(i
n $
)
0-21
Yr.
Old
s as
%
of
Sta
te
Inst
itutio
n R
esid
ents
Per
sons
with
ID
/DD
Liv
ing
in I
CF
s-M
R
0
500
1,00
0
1,50
0
2,00
0
2,50
0
3,00
0
3,50
04,
000
7782
8789
9193
9495
9697
9899
0001
0203
Yea
r
Number of Persons
HC
BS
ICF-
MR

126
New
Yor
k
Per
sons
by
Hom
e S
ize
in Y
ears
198
2 an
d 20
03A
vera
ge P
er D
iem
of
Sta
te I
nsti
tuti
ons
Sta
te I
nsti
tuti
on R
esid
ents
ICF/
MR
+ H
CB
S R
ecip
ient
s
Pro
port
ion
of Y
outh
Am
ong
Sta
te I
nsti
tuti
on P
opul
atio
n
2003
1982
1-6
7-15
16+
0%5%10%
15%
20%
25%
30%
35%
40%
% of Youths in State Institutions
7787
9194
9698
0002
Yea
r
0
10,0
00
20,0
00
30,0
00
40,0
00
50,0
00
60,0
00
70,0
00
7782
8789
9193
949
596
979
899
000
102
03
Ye
ar
Number of Persons
HC
BS
ICF-
MR
$0
$1
00
$2
00
$3
00
$4
00
$5
00
$6
00
$7
00
77
82
87
89
91
93
94
95
96
97
98
99
00
01
02
03
Ye
ar
Per Diem Costs
Sta
teY
ea
r1-
67
-15
1-15
16+
Tot
al
NY
77
3,4
96
1,8
17
5,31
32
1,2
39
26
,55
21
48
18,4
464
836
%18
,601
0N
Y8
24
,27
15
,60
99,
880
15
,43
72
5,3
17
14
312
,837
100
16%
15,5
770
NY
87
7,5
06
8,5
37
16,0
431
1,2
74
27
,31
71
54
10,0
2223
98
%17
,290
0N
Y8
95
,82
71
1,6
25
17,4
529
,67
92
7,1
31
15
18,
179
317
5%
17,7
740
800
NY
91
6,1
65
15
,75
121
,916
8,5
30
30
,44
61
68
6,48
933
84
%17
,812
01,
550
NY
93
7,7
76
17
,70
525
,481
5,4
57
30
,93
81
73
4,93
335
021
,850
3,3
98
1,45
4N
Y9
47
,77
61
7,7
05
25,4
815
,45
73
0,9
38
17
24,
233
350
1%
16,0
831
8,8
77
1,45
4N
Y9
59
,01
41
7,6
33
26,6
475
,47
53
2,1
22
17
84,
161
355
12,3
862
3,1
99
1,45
4N
Y9
61
1,9
46
17
,56
229
,508
4,8
08
34
,31
61
89
3,39
935
53
%11
,846
27
,27
21,
454
NY
97
12
,80
41
7,4
67
30,2
714
,51
13
4,7
82
19
13,
217
459
11,4
722
9,0
19
1,64
0N
Y9
81
3,3
32
18
,00
331
,335
4,1
53
35
,48
81
95
2,92
047
711
,083
30
,61
0N
Y9
91
3,7
63
18
,01
531
,778
3,8
18
35
,59
61
96
2,50
263
910
,230
33
,69
91,
640
NY
00
14,6
681
8,2
38
32,9
063
,69
33
6,5
99
193
2,41
159
88
%1
0,1
09
36
,10
01,
956
NY
01
20,8
061
8,2
43
39,0
493
,60
14
2,6
50
224
2,37
653
19,
923
40
,16
52,
272
NY
02
22,2
151
8,7
83
40,9
983
,43
64
4,4
34
232
2,25
556
39
%9,
815
48
,16
51,
812
NY
03
22,5
911
8,8
30
41,4
213
,47
14
4,8
92
247
2,26
756
09,
467
48
,92
11,
309
Pe
rso
ns
with
ID
/DD
by
Ho
me
Siz
eU
tiliz
atio
n R
ate
pe
r 1
00
,00
0 o
f P
opul
atio
n
Pe
rso
ns
with
ID
/DD
R
ecei
ving
H
CB
S
Pe
rso
ns
with
ID
/DD
Liv
ing
in
Nur
sing
H
om
es
Sta
te
Inst
itutio
n P
opul
atio
n
Pe
r D
iem
of
Sta
te
Inst
itutio
ns
(in $
)
0-21
Yr.
Old
s as
%
of
Sta
te
Inst
itutio
n R
esi
de
nts
Pe
rso
ns
with
ID
/DD
Liv
ing
in
ICF
s-M
R
02,
000
4,00
06,
000
8,00
010
,000
12,0
0014
,000
16,0
0018
,000
20,0
00
Number of Residents
7787
9194
9698
0002
Yea
r

127
Nor
th C
arol
ina
Per
sons
by
Hom
e S
ize
in Y
ears
198
2 an
d 20
03A
vera
ge P
er D
iem
of
Sta
te I
nsti
tuti
ons
Sta
te I
nsti
tuti
on R
esid
ents
ICF/
MR
+ H
CB
S R
ecip
ient
s
Pro
port
ion
of Y
outh
Am
ong
Sta
te I
nsti
tuti
on P
opul
atio
n
20
03
1982
1-6
7-15
16
+
0%5%10%
15%
20%
25%
% of Youths in State Institutions
7787
9194
9698
0002
Yea
r
0
2,00
0
4,00
0
6,00
0
8,00
0
10,0
00
12,0
00
77
828
789
91
939
49
596
97
989
900
01
02
03
Yea
r
Number of Persons
HC
BS
ICF-
MR
$0$50
$100
$150
$200
$250
$300
$350
7782
8789
9193
9495
9697
9899
0001
0203
Yea
r
Per Diem Costs
Sta
teY
ea
r1-
67
-15
1-15
16+
Tot
al
NC
77
23
91
53
392
4,0
32
4,42
48
03,
753
45
23%
2,07
30
NC
82
48
41
79
663
3,7
78
4,44
17
43,
451
96
23%
2,76
20
NC
87
99
22
37
1,22
93
,26
14,
490
70
2,72
015
68
%3,
227
328
NC
89
1,7
71
26
52,
036
3,3
21
5,35
78
22,
715
160
6%
3,17
355
331
6N
C9
12
,64
32
51
2,89
43
,13
46,
028
89
2,52
818
65
%4,
378
780
465
NC
93
3,1
33
60
43,
737
3,0
83
6,82
09
82,
469
199
4,66
21
,19
046
5N
C9
43
,24
57
11
3,95
62
,93
76,
893
99
2,37
822
53
%4,
732
1,3
18
300
NC
95
3,5
06
75
14,
257
2,7
88
7,04
59
92,
229
229
4,59
51
,81
885
0N
C9
63
,64
67
51
4,39
72
,78
67,
183
99
2,22
722
82
%4,
593
3,0
98
850
NC
97
4,3
44
55
74,
901
2,6
65
7,56
61
02
2,14
124
34,
777
3,7
26
860
NC
98
4,3
93
48
44,
877
2,6
08
7,48
59
92,
084
272
0%
4,70
53
,98
686
0N
C9
94
,86
93
49
5,21
82
,53
57,
753
10
11,
996
291
4,61
64
,97
498
8N
C0
08,
190
59
68,
786
2,5
43
11,3
2914
11,
936
316
1%
4,52
05
,36
489
9N
C0
18,
060
1,2
65
9,32
52
,53
211
,857
145
1,88
228
74,
493
6,1
41
810
NC
02
8,19
91
,28
69,
485
2,7
03
12,1
8814
71,
888
326
2%
4,64
56
,01
372
1N
C0
38,
857
98
19,
838
2,6
28
12,4
6615
41,
837
332
4,50
05
,69
260
6
Per
sons
with
ID/D
D b
y H
ome
Siz
eU
tiliz
atio
n R
ate
pe
r 10
0,00
0 of
P
opul
atio
n
Per
sons
with
ID
/DD
R
ecei
ving
H
CB
S
Per
sons
with
ID
/DD
Liv
ing
in
Nur
sing
H
omes
Sta
te
Inst
itutio
n P
opul
atio
n
Per
Die
m o
f S
tate
In
stitu
tions
(in
$)
0-21
Yr.
Old
s as
%
of
Sta
te
Inst
itutio
n R
esid
ents
Per
sons
with
ID
/DD
Liv
ing
in IC
Fs-
MR
050
0
1,00
01,
500
2,00
0
2,50
0
3,00
0
3,50
04,
000
Number of Residents
7787
9194
9698
0002
Yea
r

128
Nor
th D
akot
a
Per
sons
by
Hom
e S
ize
in Y
ears
198
2 an
d 20
03A
vera
ge P
er D
iem
of
Sta
te I
nsti
tuti
ons
Sta
te I
nsti
tuti
on R
esid
ents
ICF/
MR
+ H
CB
S R
ecip
ient
s
Pro
port
ion
of Y
outh
Am
ong
Sta
te I
nsti
tuti
on P
opul
atio
n
20
03
1982
1-6
7-15
16+
$0
$100
$200
$300
$400
7782
8789
9193
9495
9697
9899
0001
0203
Yea
r
Per Diem Costs
0
200
400
600
800
1,00
0
1,20
0
Number of Residents
7787
9194
9698
0002
Yea
r
0%5%10%
15%
20%
25%
% of Youths in State Institutions
7787
9194
9698
0002
Yea
r
0
500
1,00
0
1,50
0
2,00
0
2,50
0
3,00
0
7782
8789
9193
9495
9697
9899
0001
0203
Yea
r
Number of Persons
HC
BS
ICF
-MR
Sta
teY
ea
r1-
67
-15
1-15
16+
Tot
al
ND
77
23
47
701
,30
61,
376
21
11,
145
DN
F21
%0
0N
D8
21
21
46
158
1,0
76
1,23
41
84
941
66
12%
219
0N
D8
72
69
70
297
14
41
1,41
22
09
398
197
14%
892
724
ND
89
75
26
70
1,42
23
16
1,73
82
63
251
236
13%
743
1,0
63
194
ND
91
96
55
95
1,56
02
78
1,83
82
89
211
277
11%
634
1,1
63
182
ND
93
1,0
49
56
21,
611
26
51,
876
29
220
332
161
81
,36
217
0N
D9
41
,09
35
35
1,62
82
26
1,85
42
92
146
346
11%
551
1,5
09
167
ND
95
1,1
56
47
71,
633
22
41,
857
29
216
035
056
11
,63
715
1N
D9
61
,12
25
03
1,62
52
62
1,88
72
96
148
339
8%
624
1,7
70
175
ND
97
1,1
73
49
71,
670
25
21,
922
30
014
933
960
91
,79
219
0N
D9
81
,24
54
78
1,72
32
54
1,97
73
10
142
338
7%
609
1,8
19
180
ND
99
1,2
69
45
31,
722
25
21,
974
31
114
733
858
01
,87
510
7N
D0
01,
205
49
51,
700
26
71
,96
730
615
335
78
%62
51
,93
610
5N
D0
11,
207
52
31,
730
26
21
,99
231
414
632
662
21
,99
012
8N
D0
21,
225
53
31,
758
26
42
,02
231
914
733
9D
NF
629
2,0
11
119
ND
03
1,23
45
12
1,74
62
71
2,0
17
301
149
363
625
2,1
87
176
Per
sons
with
ID
/DD
by
Hom
e S
ize
Util
izat
ion
Ra
te p
er
100,
000
of
Pop
ulat
ion
Per
sons
with
ID
/DD
R
ecei
ving
H
CB
S
Per
sons
with
ID
/DD
Liv
ing
in
Nur
sing
H
om
es
Sta
te
Inst
itutio
n P
opul
atio
n
Pe
r D
iem
of
Sta
te
Inst
itutio
ns
(in $
)
0-21
Yr.
Old
s as
%
of
Sta
te
Inst
itutio
n R
esid
ents
Per
sons
with
ID
/DD
Liv
ing
in IC
Fs-
MR
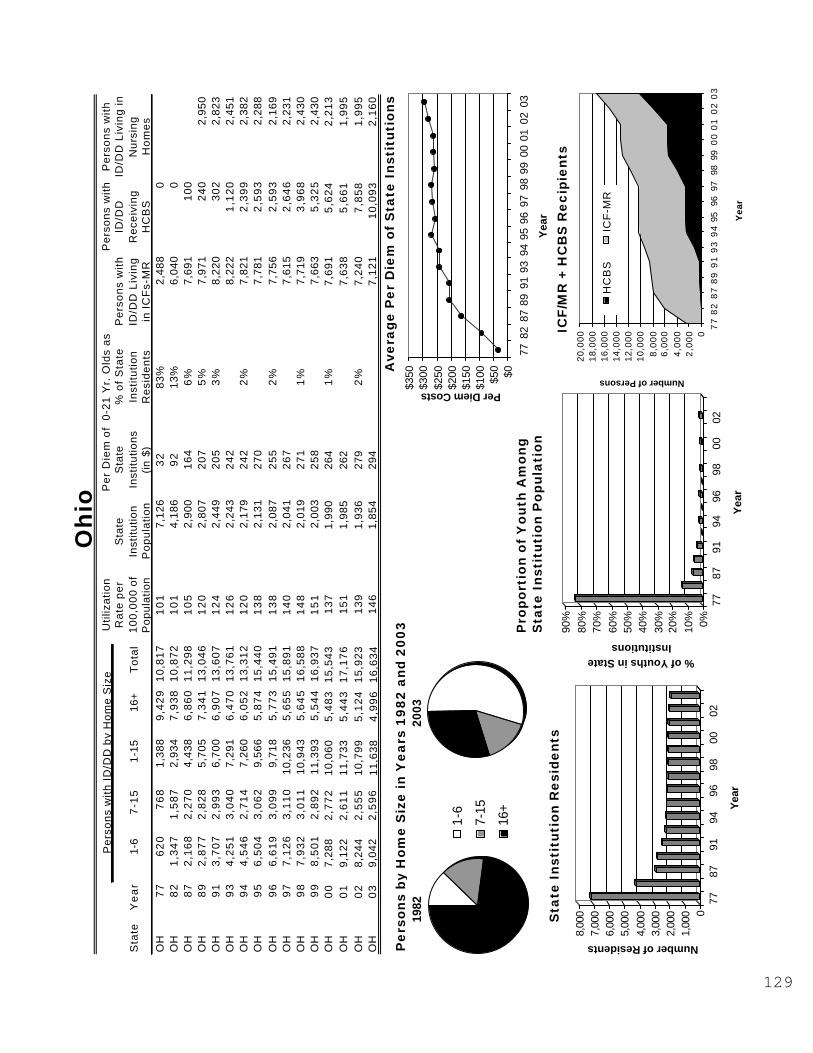
129
Ohi
o
Per
sons
by
Hom
e S
ize
in Y
ears
198
2 an
d 20
03A
vera
ge P
er D
iem
of
Sta
te I
nsti
tuti
ons
Sta
te I
nsti
tuti
on R
esid
ents
ICF/
MR
+ H
CB
S R
ecip
ient
s
Pro
port
ion
of Y
outh
Am
ong
Sta
te I
nsti
tuti
on P
opul
atio
n
2003
1982
1-6
7-15
16+
$0$50
$100
$150
$200
$250
$300
$350
7782
8789
9193
9495
9697
9899
0001
0203
Yea
r
Per Diem Costs
01,
000
2,00
03,
000
4,00
05,
000
6,00
07,
000
8,00
0
Number of Residents
7787
9194
9698
0002
Yea
r
0%10%
20%
30%
40%
50%
60%
70%
80%
90%
% of Youths in State Institutions
7787
9194
9698
0002
Yea
r
02
,00
04
,00
06
,00
08
,00
01
0,0
00
12
,00
01
4,0
00
16
,00
01
8,0
00
20
,00
0
77
82
87
89
91
93
94
9596
9798
990
00
10
20
3
Yea
r
Number of Persons
HC
BS
ICF
-MR
Sta
teY
ea
r1-
67
-15
1-15
16+
To
tal
OH
77
62
07
68
1,38
89
,42
91
0,8
17
10
17,
126
32
83%
2,48
80
OH
82
1,3
47
1,5
87
2,93
47
,93
81
0,8
72
10
14,
186
92
13%
6,04
00
OH
87
2,1
68
2,2
70
4,43
86
,86
01
1,2
98
10
52,
900
16
46
%7,
691
10
0O
H8
92
,87
72
,82
85,
705
7,3
41
13
,04
61
20
2,80
72
07
5%
7,97
12
40
2,95
0O
H9
13
,70
72
,99
36,
700
6,9
07
13
,60
71
24
2,44
92
05
3%
8,22
03
02
2,82
3O
H9
34
,25
13
,04
07,
291
6,4
70
13
,76
11
26
2,24
32
42
8,22
21
,12
02,
451
OH
94
4,5
46
2,7
14
7,26
06
,05
21
3,3
12
12
02,
179
24
22
%7,
821
2,3
99
2,38
2O
H9
56
,50
43
,06
29,
566
5,8
74
15
,44
01
38
2,13
12
70
7,78
12
,59
32,
288
OH
96
6,6
19
3,0
99
9,71
85
,77
31
5,4
91
13
82,
087
25
52
%7,
756
2,5
93
2,16
9O
H9
77
,12
63
,11
010
,236
5,6
55
15
,89
11
40
2,04
12
67
7,61
52
,64
62,
231
OH
98
7,9
32
3,0
11
10,9
435
,64
51
6,5
88
14
82,
019
27
11
%7,
719
3,9
68
2,43
0O
H9
98
,50
12
,89
211
,393
5,5
44
16
,93
71
51
2,00
32
58
7,66
35
,32
52,
430
OH
00
7,28
82
,77
210
,060
5,4
83
15
,54
31
37
1,99
026
41
%7
,69
15
,62
42
,21
3O
H0
19,
122
2,6
11
11,7
335
,44
31
7,1
76
15
11,
985
262
7,6
38
5,6
61
1,9
95
OH
02
8,24
42
,55
510
,799
5,1
24
15
,92
31
39
1,93
627
92
%7
,24
07
,85
81
,99
5O
H0
39,
042
2,5
96
11,6
384
,99
61
6,6
34
14
61,
854
294
7,1
21
10
,09
32
,16
0
Pe
rso
ns
wit
h I
D/D
D b
y H
om
e S
ize
Util
izat
ion
Ra
te p
er
10
0,0
00
of
Pop
ulat
ion
Pe
rso
ns
wit
h
ID/D
D
Re
ceiv
ing
H
CB
S
Pe
rso
ns
wit
h
ID/D
D L
ivin
g in
N
ursi
ng
Ho
me
s
Sta
te
Inst
itutio
n P
op
ula
tion
Pe
r D
iem
of
Sta
te
Inst
itutio
ns
(in $
)
0-2
1 Y
r. O
lds
as
% o
f S
tate
In
stitu
tion
Re
sid
en
ts
Pe
rso
ns
wit
h
ID/D
D L
ivin
g
in I
CF
s-M
R

130
Okl
ahom
a
Per
sons
by
Hom
e S
ize
in Y
ears
198
2 an
d 20
03A
vera
ge P
er D
iem
of
Sta
te I
nsti
tuti
ons
Sta
te I
nsti
tuti
on R
esid
ents
ICF/
MR
+ H
CB
S R
ecip
ient
s
Pro
port
ion
of Y
outh
Am
ong
Sta
te I
nsti
tuti
on P
opul
atio
n
20
03
1982
1-6
7-15
16+
$0
$100
$200
$300
$400
$500
7782
8789
9193
9495
9697
9899
0001
0203
Yea
r
Per Diem Costs
020
040
060
080
01,
000
1,20
01,
400
1,60
01,
800
2,00
0
Number of Residents
7787
9194
9698
0002
Yea
r
0%10%
20%
30%
40%
50%
60%
70%
% of Youths in State Institutions
7787
9194
9698
0002
Yea
r
0
1,00
02,
000
3,00
0
4,00
0
5,00
06,
000
7,00
0
7782
8789
9193
9495
9697
9899
0001
0203
Yea
r
Number of Persons
HC
BSIC
F-M
R
Sta
teY
ea
r1-
67
-15
1-15
16+
Tot
al
OK
77
11
19
303
,08
23,
112
11
11,
978
34
44%
1,97
80
OK
82
68
692
2,9
20
3,01
29
51,
803
60
69%
1,80
30
OK
87
39
34
24
817
3,0
14
3,83
11
16
1,27
615
049
%2,
939
70
OK
89
50
93
72
881
3,0
45
3,92
61
22
1,01
917
539
%3,
060
500
1,20
0O
K9
17
20
28
31,
003
3,3
06
4,30
91
36
937
235
28%
2,91
684
41,
850
OK
93
1,1
40
29
41,
434
2,3
88
3,82
21
22
719
279
2,41
51
,28
71,
500
OK
94
1,3
33
24
91,
582
2,2
56
3,83
81
19
658
282
20%
2,26
81
,69
31,
285
OK
95
1,5
23
26
31,
786
2,2
52
4,03
81
23
568
240
2,29
01
,95
593
0O
K9
61
,52
32
63
1,78
62
,23
74,
023
12
255
326
521
%2,
275
2,2
60
930
OK
97
1,9
68
24
82,
216
2,2
22
4,43
81
33
491
359
2,29
22
,49
71,
104
OK
98
1,8
70
24
02,
110
2,6
35
4,74
51
42
436
408
8%
2,70
52
,58
696
9O
K9
92
,23
12
65
2,49
61
,87
54,
371
13
041
340
01,
982
2,7
95
1,09
2O
K0
02,
497
22
22,
719
1,6
78
4,3
97
127
339
413
3%
1,80
12
,98
383
7O
K0
12,
806
22
13,
027
1,7
67
4,7
94
139
356
402
1,90
73
,60
558
2O
K0
22,
917
32
23,
239
2,0
44
5,2
83
151
355
444
3%
2,24
34
,10
073
2O
K0
33,
135
21
63,
351
2,0
32
5,3
83
157
376
405
2,26
94
,25
372
8
Per
sons
with
ID/D
D b
y H
ome
Siz
eU
tiliz
atio
n R
ate
pe
r 10
0,00
0 of
P
opul
atio
n
Per
sons
with
ID
/DD
R
ecei
ving
H
CB
S
Per
sons
with
ID
/DD
Liv
ing
in
Nur
sing
H
omes
Sta
te
Inst
itutio
n P
opul
atio
n
Per
Die
m o
f S
tate
In
stitu
tions
(in
$)
0-21
Yr.
Old
s as
%
of
Sta
te
Inst
itutio
n R
esid
ents
Per
sons
with
ID
/DD
Liv
ing
in IC
Fs-
MR

131
Ore
gon
Per
sons
by
Hom
e S
ize
in Y
ears
198
2 an
d 20
03A
vera
ge P
er D
iem
of
Sta
te I
nsti
tuti
ons
Sta
te I
nsti
tuti
on R
esid
ents
ICF/
MR
+ H
CB
S R
ecip
ient
s
Pro
port
ion
of Y
outh
Am
ong
Sta
te I
nsti
tuti
on P
opul
atio
n
20
03
1982
1-6
7-15
16+
0%5%10%
15%
20%
25%
30%
% of Youths in State Institutions
7787
9194
9698
0002
Yea
r
$0
$200
$400
$600
$800
7782
8789
9193
9495
9697
9899
0001
0203
Yea
r
Per Diem Costs
01,
000
2,00
03,
000
4,00
05,
000
6,00
07,
000
8,00
09,
000
77
8287
899
19
39
49
59
69
798
9900
01
02
03
Ye
ar
Number of Persons
HC
BS
ICF
-MR
Sta
teY
ear
1-6
7-1
51-
1516
+T
otal
OR
77
49
32
537
42,
233
2,60
71
10
1,78
14
022
%1,
989
0O
R8
21
14
90
501
1,97
92,
480
94
1,62
76
526
%1,
918
1,36
0O
R8
71,
098
56
81,
666
1,47
63,
142
11
61,
145
110
14%
1,38
683
2O
R8
91,
340
47
71,
817
1,07
72,
894
10
386
323
59
%1,
042
1,21
843
4O
R9
12,
344
55
52,
899
87
93,
778
12
964
037
477
02,
177
452
OR
93
2,50
25
55
3,05
76
82
3,73
91
30
527
389
468
2,02
342
0O
R9
42,
620
55
53,
175
62
83,
803
12
548
941
11
%41
72,
136
420
OR
95
2,64
65
61
3,20
76
34
3,84
11
22
442
462
442
2,50
026
0O
R9
62,
718
56
13,
279
62
13,
900
12
242
949
942
92,
523
265
OR
97
3,94
71
20
373
519
373
2,58
681
OR
98
3,95
51
21
350
583
0%
350
3,70
481
OR
99
3,39
03
90
3,78
02
69
4,04
91
22
173
722
173
5,50
083
OR
00
4,23
35
09
4,74
22
21
4,96
314
560
513
0%
60
5,82
49
6O
R0
14,
677
47
95,
156
28
95,
445
157
6454
06
47,
225
110
OR
02
4,77
94
49
5,22
81
30
5,35
815
251
536
0%
51
8,01
712
4O
R0
34,
614
42
95,
043
13
05,
173
147
5063
05
07,
214
110
Per
sons
with
ID/D
D b
y H
ome
Siz
eU
tiliz
atio
n R
ate
per
100,
000
of
Pop
ulat
ion
Per
sons
with
ID
/DD
R
ecei
ving
H
CB
S
Per
sons
with
ID
/DD
Liv
ing
in
Nur
sing
H
omes
Sta
te
Inst
itutio
n P
opul
atio
n
Per
Die
m o
f S
tate
In
stitu
tions
(in
$)
0-21
Yr.
Old
s as
%
of
Sta
te
Inst
itutio
n R
esid
ents
Per
sons
with
ID
/DD
Liv
ing
in IC
Fs-
MR
020
040
060
080
01,
000
1,20
01,
400
1,60
01,
800
Number of Residents
7787
9194
9698
0002
Yea
r

132
Pen
nsyl
vani
a
Per
sons
by
Hom
e S
ize
in Y
ears
198
2 an
d 20
03A
vera
ge P
er D
iem
of
Sta
te I
nsti
tuti
ons
Sta
te I
nsti
tuti
on R
esid
ents
ICF/
MR
+ H
CB
S R
ecip
ient
s
Pro
port
ion
of Y
outh
Am
ong
Sta
te I
nsti
tuti
on P
opul
atio
n
20
03
19
82
1-6
7-1
5
16
+
0%5%10%
15%
20%
25%
% of Youths in State Institutions
7787
9194
9698
0002
Yea
r
0
5,00
0
10,0
00
15,0
00
20,0
00
25,0
00
30,0
00
35,0
00
7782
87
8991
93
94
9596
97
9899
00
01
0203
Yea
r
Number of Persons
HC
BS
ICF
-MR
$0
$100
$200
$300
$400
$500
7782
8789
9193
9495
9697
9899
0001
0203
Yea
r
Per Diem Costs
Sta
teY
ea
r1-
67
-15
1-15
16+
Tot
al
PA
77
1,0
78
1,3
10
2,38
814
,318
16,7
061
42
9,87
06
223
%7,
355
0P
A8
22
,58
81
,07
53,
663
11,9
0415
,567
13
17,
124
110
9%
8,59
80
PA
87
4,7
74
1,8
80
6,65
48
,15
114
,805
12
55,
127
151
4%
7,53
71
,20
3P
A8
97
,01
58
73
7,88
87
,01
414
,902
12
44,
082
176
2%
7,08
51
,93
046
6P
A9
17
,80
98
13
8,62
26
,28
914
,911
12
53,
878
193
2%
7,10
02
,33
350
9P
A9
38
,28
56
42
8,92
76
,16
715
,094
12
53,
671
226
6,76
83
,79
51,
544
PA
94
8,7
60
83
49,
594
6,1
24
15,7
181
30
3,56
322
51
%6,
950
4,3
03
1,54
4P
A9
59
,38
47
59
10,1
435
,69
715
,840
13
13,
392
249
6,80
05
,52
51,
544
PA
96
9,8
27
72
810
,555
5,5
49
16,1
041
32
3,16
425
71
%6,
469
6,0
76
1,54
4P
A9
71
0,6
27
75
911
,386
5,2
27
16,6
131
36
3,29
828
06,
192
8,9
31
1,30
0P
A9
81
1,6
66
89
612
,562
4,5
78
17,1
401
43
2,90
927
50
%5,
747
10,1
491,
330
PA
99
12
,49
78
17
13,3
143
,92
617
,240
14
42,
622
317
5,09
810
,119
1,31
7P
A0
013
,807
68
914
,496
4,0
26
18,5
2215
11,
969
331
0%
4,94
416
,830
2,57
3P
A0
117
,401
47
817
,879
3,8
62
21,7
4117
71,
716
360
4,52
119
,513
1,59
1P
A0
217
,643
45
618
,099
3,7
58
21,8
5717
71,
636
431
0%
4,28
024
,969
1,59
1P
A0
318
,625
45
719
,082
3,0
28
22,1
1018
01,
545
450
3,96
825
,550
1,60
4
Per
sons
with
ID
/DD
by
Hom
e S
ize
Util
izat
ion
Ra
te p
er
100,
000
of
Pop
ulat
ion
Per
sons
with
ID
/DD
R
ecei
ving
H
CB
S
Per
sons
with
ID
/DD
Liv
ing
in
Nur
sing
H
om
es
Sta
te
Inst
itutio
n P
opul
atio
n
Pe
r D
iem
of
Sta
te
Inst
itutio
ns
(in $
)
0-21
Yr.
Old
s as
%
of
Sta
te
Inst
itutio
n R
esid
ents
Per
sons
with
ID
/DD
Liv
ing
in IC
Fs-
MR
0
2,00
0
4,00
0
6,00
0
8,00
0
10,0
00
Number of Residents
7787
9194
9698
0002
Yea
r

133
Rho
de I
slan
d
Per
sons
by
Hom
e S
ize
in Y
ears
198
2 an
d 20
03A
vera
ge P
er D
iem
of
Sta
te I
nsti
tuti
ons
Sta
te I
nsti
tuti
on R
esid
ents
ICF/
MR
+ H
CB
S R
ecip
ient
s
Pro
port
ion
of Y
outh
Am
ong
Sta
te I
nsti
tuti
on P
opul
atio
n
2003
1982
1-6
7-15
16+
$0$50
$100
$150
$200
$250
$300
$350
7782
8789
9193
9495
9697
9899
0001
0203
Yea
r
Per Diem Costs
0
200
400
600
800
1,00
0
Number of Residents
7787
9194
9698
0002
Yea
r
0%5%10%
15%
20%
25%
30%
35%
40%
% of Youths in State Institutions
7787
9194
9698
0002
Yea
r
0
500
1,00
0
1,50
0
2,00
0
2,50
0
3,00
0
7782
8789
9193
9495
9697
9899
0001
0203
Yea
r
Number of Persons
HC
BSIC
F-M
R
Sta
teY
ea
r1-
67-
151-
1516
+T
otal
RI
77
09
89
897
21
,07
011
49
04
43
40%
763
0R
I8
215
32
28
38
163
11
,01
210
66
13
113
12%
881
0R
I8
731
65
45
86
131
21
,17
311
92
80
226
3%
994
13
6R
I8
974
73
37
1,08
424
21
,32
613
32
25
246
0%
956
44
92
50
RI
91
826
34
51,
171
196
1,3
67
136
17
829
51
%76
67
93
40R
I9
391
03
54
1,26
413
11
,39
513
88
829
945
71,
192
RI
94
932
31
51,
247
431
,29
012
90
NA
NA
353
1,33
3R
I9
595
13
69
1,32
00
1,3
20
132
0N
A30
41,
304
RI
96
978
33
71,
315
01
,31
513
20
NA
NA
225
1,91
4R
I9
71,
224
32
51,
549
01
,54
915
50
NA
212,
178
RI
98
1,02
93
10
1,33
90
1,3
39
134
0N
AN
A0
2,29
6R
I9
91,
633
18
61,
819
501
,86
918
60
NA
432,
393
13
8R
I0
01,
704
180
1,8
84
01
,88
41
80
0N
AN
A18
2,4
71
16
2R
I0
11,
766
170
1,9
36
01
,93
61
83
0N
A18
2,5
67
14
5R
I0
21,
780
159
1,9
39
221
,96
11
83
0N
AN
A40
2,6
74
10
4R
I0
31,
797
173
1,9
70
221
,99
22
00
0N
A40
2,7
90
10
5
Per
sons
with
ID
/DD
by
Hom
e S
ize
Util
izat
ion
Rat
e pe
r 10
0,00
0 of
P
opul
atio
n
Pe
rso
ns
with
ID
/DD
R
ecei
ving
H
CB
S
Pe
rso
ns
with
ID
/DD
Liv
ing
in
Nur
sing
H
om
es
Sta
te
Inst
itutio
n P
opul
atio
n
Pe
r D
iem
of
Sta
te
Inst
itutio
ns
(in
$)
0-21
Yr.
Old
s as
%
of
Sta
te
Inst
itutio
n R
esi
de
nts
Pe
rso
ns
with
ID
/DD
Liv
ing
in I
CF
s-M
R

134
Sou
th C
arol
ina
Per
sons
by
Hom
e S
ize
in Y
ears
198
2 an
d 20
03A
vera
ge P
er D
iem
of
Sta
te I
nsti
tuti
ons
Sta
te I
nsti
tuti
on R
esid
ents
ICF/
MR
+ H
CB
S R
ecip
ient
s
Pro
port
ion
of Y
outh
Am
ong
Sta
te I
nsti
tuti
on P
opul
atio
n
2003
1982
1-6
7-15
16+
0%5%10%
15%
20%
25%
30%
35%
40%
% of Youths in State Institutions
7787
9194
9698
0002
Yea
r
01,
000
2,00
03,
000
4,00
0
5,00
06,
000
7,00
08,
000
7782
8789
9193
9495
9697
9899
0001
0203
Yea
r
Number of Persons
HC
BSIC
F-M
R
$0$50
$100
$150
$200
$250
$300
$350
7782
8789
9193
9495
9697
9899
0001
0203
Yea
r
Per Diem Costs
Sta
teY
ear
1-6
7-15
1-15
16+
Tot
al
SC
77
91
35
144
3,98
24,
126
143
3,82
63
237
%1,
017
0S
C8
23
19
119
43,
519
3,71
311
63,
322
56
24%
2,66
50
SC
87
263
98
81,
251
2,61
03,
861
113
2,53
48
420
%3,
139
0S
C8
958
78
33
1,42
02,
455
3,87
511
02,
363
110
17%
3,23
10
94S
C9
192
79
73
1,90
02,
291
4,19
111
82,
199
132
15%
3,22
40
98S
C9
31,
041
1,21
02,
251
2,17
44,
425
120
2,06
214
53,
232
586
98S
C9
41,
246
1,24
32,
489
1,99
74,
486
123
1,88
514
53,
111
966
SC
95
1,37
41,
153
2,52
71,
735
4,26
211
41,
703
185
2,91
71,
475
SC
96
1,65
01,
087
2,73
71,
626
4,36
311
61,
548
193
10%
2,74
02,
074
SC
97
2,09
61,
029
3,12
51,
467
4,59
211
91,
390
185
2,55
53,
412
SC
98
1,97
01,
093
3,06
31,
370
4,43
311
61,
295
194
10%
2,43
93,
701
SC
99
2,16
41,
084
3,24
81,
228
4,47
611
51,
161
229
2,25
44,
073
SC
00
2,36
81,
028
3,39
61,
193
4,58
91
14
1,10
32
26
9%
2,17
64,
370
226
SC
01
2,53
61,
012
3,54
81,
134
4,68
21
15
1,04
62
63
2,07
74,
563
271
SC
02
2,56
690
03,
466
1,06
64,
532
11
01,
018
24
810
%1,
992
4,79
313
7S
C0
32,
594
992
3,58
61,
034
4,62
01
17
98
63
00
1,93
05,
005
141
Per
sons
with
ID
/DD
by
Hom
e S
ize
Util
izat
ion
Rat
e pe
r 10
0,00
0 of
P
opul
atio
n
Per
sons
with
ID
/DD
R
ecei
ving
H
CB
S
Per
sons
with
ID
/DD
Liv
ing
in
Nur
sing
H
omes
Sta
te
Inst
itutio
n P
opul
atio
n
Per
Die
m o
f S
tate
In
stitu
tions
(i
n $)
0-21
Yr.
Old
s as
%
of
Sta
te
Inst
itutio
n R
esid
ents
Per
sons
with
ID
/DD
Liv
ing
in I
CF
s-M
R
050
0
1,00
01,
500
2,00
02,
500
3,00
03,
500
4,00
0
Number of Residents
7787
9194
9698
0002
Yea
r
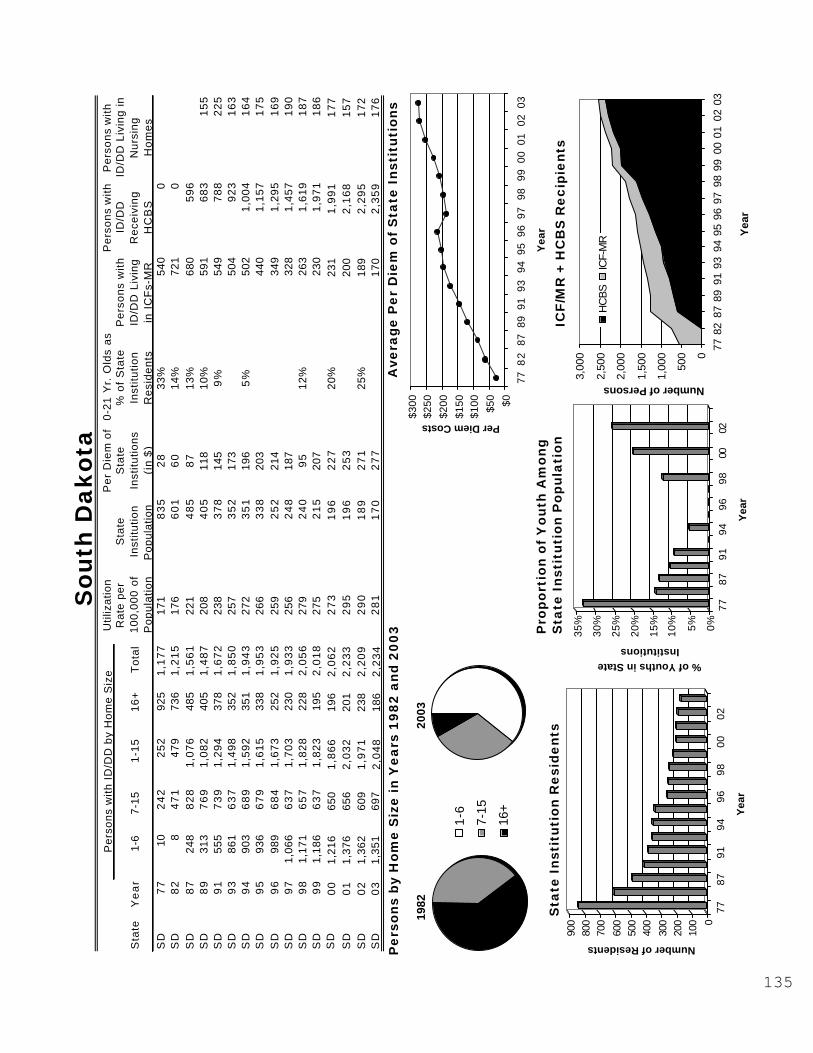
135
Sou
th D
akot
a
Per
sons
by
Hom
e S
ize
in Y
ears
198
2 an
d 20
03A
vera
ge P
er D
iem
of
Sta
te I
nsti
tuti
ons
Sta
te I
nsti
tuti
on R
esid
ents
ICF/
MR
+ H
CB
S R
ecip
ient
sP
ropo
rtio
n of
You
th A
mon
gS
tate
Ins
titu
tion
Pop
ulat
ion
2003
1982
1-6
7-15
16+
$0$50
$100
$150
$200
$250
$300
778
287
8991
9394
9596
9798
9900
0102
03
Yea
r
Per Diem Costs
0
100
200
300
400
500
600
700
800
900
Number of Residents
7787
9194
9698
0002
Yea
r
0%5%10%
15%
20%
25%
30%
35%
% of Youths in State Institutions
7787
9194
9698
0002
Yea
r
0
500
1,00
0
1,50
0
2,00
0
2,50
0
3,00
0
7782
8789
9193
9495
9697
9899
0001
0203
Yea
r
Number of Persons
HC
BS
ICF-
MR
Sta
teY
ea
r1-
67-
151-
1516
+T
otal
SD
77
102
42
25
292
51
,17
717
18
35
28
33%
540
0S
D8
28
47
14
79
736
1,2
15
176
60
16
014
%72
10
SD
87
248
82
81,
076
485
1,5
61
221
48
58
713
%68
05
96
SD
89
313
76
91,
082
405
1,4
87
208
40
511
810
%59
16
83
15
5S
D9
155
57
39
1,29
437
81
,67
223
83
78
145
9%
549
78
82
25
SD
93
861
63
71,
498
352
1,8
50
257
35
217
350
49
23
16
3S
D9
490
36
89
1,59
235
11
,94
327
23
51
196
5%
502
1,00
41
64
SD
95
936
67
91,
615
338
1,9
53
266
33
820
344
01,
157
17
5S
D9
698
96
84
1,67
325
21
,92
525
92
52
214
349
1,29
51
69
SD
97
1,06
66
37
1,70
323
01
,93
325
62
48
187
328
1,45
71
90
SD
98
1,17
16
57
1,82
822
82
,05
627
92
40
95
12%
263
1,61
91
87
SD
99
1,18
66
37
1,82
319
52
,01
827
52
15
207
230
1,97
11
86
SD
00
1,21
665
01
,86
619
62
,06
22
73
19
62
27
20%
231
1,9
91
17
7S
D0
11,
376
656
2,0
32
201
2,2
33
29
51
96
25
320
02
,16
81
57
SD
02
1,36
260
91
,97
123
82
,20
92
90
18
92
71
25%
189
2,2
95
17
2S
D0
31,
351
697
2,0
48
186
2,2
34
28
11
70
27
717
02
,35
91
76
Pe
rso
ns
with
ID
/DD
by
Ho
me
Siz
eU
tiliz
atio
n R
ate
per
100,
000
of
Pop
ulat
ion
Pe
rso
ns
with
ID
/DD
R
ecei
ving
H
CB
S
Pe
rso
ns
with
ID
/DD
Liv
ing
in
Nur
sing
H
om
es
Sta
te
Inst
itutio
n P
opul
atio
n
Pe
r D
iem
of
Sta
te
Inst
itutio
ns
(in
$)
0-21
Yr.
Old
s as
%
of
Sta
te
Inst
itutio
n R
esi
de
nts
Pe
rso
ns
with
ID
/DD
Liv
ing
in I
CF
s-M
R

136
Ten
ness
ee
Per
sons
by
Hom
e S
ize
in Y
ears
198
2 an
d 20
03A
vera
ge P
er D
iem
of
Sta
te I
nsti
tuti
ons
Sta
te I
nsti
tuti
on R
esid
ents
ICF/
MR
+ H
CB
S R
ecip
ient
s
Pro
port
ion
of Y
outh
Am
ong
Sta
te I
nsti
tuti
on P
opul
atio
n
20
03
19
82
1-6
7-15
16+
0
500
1,00
0
1,50
0
2,00
0
2,50
0
Number of Residents
7787
9194
9698
0002
Yea
r
0%5%10%
15%
20%
25%
30%
35%
40%
45%
% of Youths in State Institutions
7787
9194
9698
0002
Year
0
1,00
0
2,00
0
3,00
0
4,00
0
5,00
0
6,00
0
7,00
0
7782
8789
9193
9495
9697
9899
0001
0203
Yea
r
Number of Persons
HC
BS
ICF-
MR
Sta
teY
ea
r1-
67-
151-
1516
+T
otal
TN
77
210
49
570
52,
500
3,2
05
75
2,1
11
45
41%
2,14
90
TN
82
343
72
91,
072
2,45
63
,52
87
62
,16
37
125
%2,
377
0T
N8
770
87
78
1,48
62,
308
3,7
94
78
2,0
74
102
12%
2,28
921
3T
N8
956
91
,13
61,
705
2,18
93
,89
47
91
,96
312
814
%2,
175
474
900
TN
91
654
1,4
01
2,05
52,
167
4,2
22
85
1,9
41
133
14%
2,38
057
91,
180
TN
93
657
1,5
00
2,15
72,
032
4,1
89
81
1,8
10
140
2,32
858
71,
014
TN
94
753
1,4
97
2,25
01,
928
4,1
78
82
1,7
84
156
10%
2,35
096
490
3T
N9
593
21
,49
02,
422
1,75
44
,17
68
01
,60
219
62,
219
1,39
970
4T
N9
61,
216
1,4
61
2,67
71,
532
4,2
09
80
1,3
88
267
6%
2,02
83,
021
1,35
1T
N9
71,
621
1,3
89
3,01
01,
376
4,3
86
81
1,2
32
361
1,90
03,
293
852
TN
98
2,06
21
,15
43,
216
1,22
54
,44
18
21
,08
143
14
%1,
709
3,82
386
5T
N9
92,
204
1,1
54
3,35
81,
119
4,4
77
82
97
547
41,
603
4,31
584
6T
N0
02,
251
1,12
73
,37
81,
047
4,4
25
78
90
34
95
3%
1,51
14
,31
189
2T
N0
12,
434
1,10
03
,53
499
24
,52
67
98
48
54
31,
456
4,5
37
923
TN
02
2,46
41,
099
3,5
63
936
4,4
99
78
79
25
87
2%
1,46
04
,34
092
3T
N0
32,
815
964
3,7
79
881
4,6
60
79
73
96
42
1,39
84
,43
01,
989
Per
sons
with
ID
/DD
by
Hom
e S
ize
Util
izat
ion
Rat
e pe
r 10
0,00
0 of
P
opul
atio
n
Per
sons
with
ID
/DD
R
ecei
ving
H
CB
S
Per
sons
with
ID
/DD
Liv
ing
in
Nur
sing
H
om
es
Sta
te
Inst
itutio
n P
opul
atio
n
Per
Die
m o
f S
tate
In
stitu
tions
(i
n $
)
0-21
Yr.
Old
s as
%
of
Sta
te
Inst
itutio
n R
esid
ents
Per
sons
with
ID
/DD
Liv
ing
in I
CF
s-M
R
$0
$200
$400
$600
$800
7782
8789
9193
9495
9697
9899
0001
0203
Yea
r
Per Diem Costs

137
Texa
s
Per
sons
by
Hom
e S
ize
in Y
ears
198
2 an
d 20
03A
vera
ge P
er D
iem
of
Sta
te I
nsti
tuti
ons
Sta
te I
nsti
tuti
on R
esid
ents
ICF/
MR
+ H
CB
S R
ecip
ient
s
Pro
port
ion
of Y
outh
Am
ong
Sta
te I
nsti
tuti
on P
opul
atio
n
2003
1982
1-6
7-15
16+
0%5%10%
15%
20%
25%
30%
35%
40%
45%
% of Youths in State Institutions
7787
9194
9698
0002
Yea
r
0
5,00
0
10,0
00
15,0
00
20,0
00
25,0
00
7782
8789
9193
9495
9697
9899
0001
0203
Yea
r
Number of Persons
HC
BSIC
F-M
R
$0$50
$100
$150
$200
$250
$300
7782
8789
9193
9495
9697
9899
0001
0203
Yea
r
Per Diem Costs
Sta
teY
ea
r1-
67-
151-
1516
+T
otal
TX
77
101
43
45
35
14,3
701
4,9
05
116
12
,11
44
841
%1
0,4
86
0T
X8
276
1,0
53
1,12
914
,634
15
,76
310
31
0,7
61
59
26%
13
,95
90
TX
87
910
1,1
04
2,01
410
,894
12
,90
87
67
,93
69
816
%1
1,9
03
70
TX
89
1,18
39
67
2,15
010
,168
12
,31
87
27
,93
311
312
%1
2,0
81
41
73,
500
TX
91
1,98
77
93
2,78
09,
660
12
,44
07
26
,88
015
310
%1
0,7
71
97
33,
258
TX
93
3,56
29
39
4,50
17,
940
12
,44
17
26
,73
616
71
2,1
43
96
83,
258
TX
94
4,02
39
78
5,00
17,
841
12
,84
27
16
,12
416
84
%1
3,7
42
1,56
43,
258
TX
95
5,23
68
85
6,12
17,
815
13
,93
67
55
,85
516
21
2,7
72
2,72
83,
258
TX
96
4,26
39
04
5,16
78,
057
13
,22
47
05
,73
518
25
%1
3,2
24
3,65
83,
258
TX
97
8,86
28
53
9,71
57,
856
17
,57
19
05
,65
218
61
2,9
85
4,75
33,
045
TX
98
8,86
78
56
9,72
37,
640
17
,36
38
85
,43
620
04
%1
2,8
32
5,66
62,
832
TX
99
10,0
658
05
10
,87
07,
602
18
,47
29
25
,29
421
71
2,9
42
6,15
82,
619
TX
00
10,6
0058
21
1,1
82
7,96
11
9,1
43
92
5,4
70
21
16
%13
,453
6,4
06
2,91
9T
X0
111
,025
585
11
,61
07,
831
19
,44
19
15
,37
22
30
13,2
577
,30
42,
415
TX
02
12,1
6355
91
2,7
22
7,32
02
0,0
42
92
5,1
69
22
65
%12
,684
7,8
73
2,41
5T
X0
312
,069
713
12
,78
26,
926
19
,70
89
45
,00
02
53
12,4
068
,47
12,
415
Pe
rso
ns
with
ID
/DD
by
Ho
me
Siz
eU
tiliz
atio
n R
ate
per
100,
000
of
Pop
ulat
ion
Pe
rso
ns
with
ID
/DD
R
ecei
ving
H
CB
S
Pe
rso
ns
with
ID
/DD
Liv
ing
in
Nur
sing
H
om
es
Sta
te
Inst
itutio
n P
opul
atio
n
Pe
r D
iem
of
Sta
te
Inst
itutio
ns
(in
$)
0-21
Yr.
Old
s as
%
of
Sta
te
Inst
itutio
n R
esi
de
nts
Pe
rso
ns
with
ID
/DD
Liv
ing
in I
CF
s-M
R
0
2,00
0
4,00
0
6,00
0
8,00
0
10,0
00
12,0
00
14,0
00
Number of Residents
7787
9194
9698
0002
Yea
r

138
Uta
h
Per
sons
by
Hom
e S
ize
in Y
ears
198
2 an
d 20
03A
vera
ge P
er D
iem
of
Sta
te I
nsti
tuti
ons
Sta
te I
nsti
tuti
on R
esid
ents
ICF/
MR
+ H
CB
S R
ecip
ient
s
Pro
port
ion
of Y
outh
Am
ong
Sta
te I
nsti
tuti
on P
opul
atio
n
Sta
teY
ear
1-6
7-15
1-15
16+
Tot
al
UT
77
689
516
31,
217
1,38
011
38
49
33
45%
1,19
30
UT
82
501
45
195
1,15
51,
350
111
74
26
833
%1,
199
0U
T8
734
92
11
560
1,13
51,
695
100
55
412
022
%1,
151
0U
T8
932
55
68
893
962
1,85
510
94
70
136
20%
1,00
51,
124
360
UT
91
782
34
01,
122
948
2,07
011
74
23
174
14%
960
1,23
428
3U
T9
387
13
19
1,19
090
52,
095
118
38
017
993
81,
476
270
UT
94
939
31
21,
251
912
2,16
311
63
62
180
8%
924
1,59
024
1U
T9
51,
064
34
41,
408
843
2,25
111
63
53
195
843
1,69
324
1U
T9
61,
241
27
61,
517
854
2,37
111
93
11
230
5%
866
2,12
824
1U
T9
71,
263
29
41,
557
821
2,37
811
52
90
245
833
2,31
528
0U
T9
81,
515
50
1,56
579
92,
364
113
26
225
75
%81
12,
647
191
UT
99
1,62
54
71,
672
778
2,45
011
52
50
321
790
2,85
717
0U
T0
01,
613
160
1,77
374
82,
521
11
32
36
30
02
%75
83,
152
203
UT
01
1,87
826
02,
138
755
2,89
31
27
23
43
50
767
3,37
026
5U
T0
21,
598
209
1,80
777
12,
578
11
12
34
38
02
%78
33,
589
265
UT
03
1,87
418
22,
056
776
2,83
21
21
23
13
50
788
3,66
123
1
Per
sons
with
ID/D
D b
y H
ome
Siz
eU
tiliz
atio
n R
ate
per
100,
000
of
Pop
ulat
ion
Per
sons
with
ID
/DD
R
ecei
ving
H
CB
S
Per
sons
with
ID
/DD
Liv
ing
in
Nur
sing
H
omes
Sta
te
Inst
itutio
n P
opul
atio
n
Per
Die
m o
f S
tate
In
stitu
tions
(i
n $)
0-21
Yr.
Old
s as
%
of
Sta
te
Inst
itutio
n R
esid
ents
Per
sons
with
ID
/DD
Liv
ing
in I
CF
s-M
R
2003
1982
1-6
7-15
16+
$0
$100
$200
$300
$400
7782
8789
9193
9495
9697
9899
0001
0203
Yea
r
Per Diem Costs
37
010
020
030
040
050
060
070
080
090
0
Number of Residents
7787
9194
9698
0002
Yea
r
0%5%10%
15%
20%
25%
30%
35%
40%
45%
% of Youths in State Institutions
7787
9194
9698
0002
Yea
r
050
01,
000
1,50
02,
000
2,50
03,
000
3,50
04,
000
4,50
05,
000
778
28
78
99
193
9495
96
97
98
99
0001
02
03
Ye
ar
Number of Persons
HC
BS
ICF
-MR

139
Ver
mon
t
Per
sons
by
Hom
e S
ize
in Y
ears
198
2 an
d 20
03
Ave
rage
Per
Die
m o
f S
tate
Ins
titu
tion
s
Sta
te I
nsti
tuti
on R
esid
ents
ICF/
MR
+ H
CB
S R
ecip
ient
sP
ropo
rtio
n of
You
th A
mon
gS
tate
Ins
titu
tion
Pop
ulat
ion
20
03
1982
1-6
7-15
16+
$0$1
00$2
00$3
00$4
00$5
00$6
00$7
00
7782
8789
9193
9495
9697
9899
0001
0203
Yea
r
Per Diem Costs
050100
150
200
250
300
350
400
450
Number of Residents
7787
9194
9698
0002
Yea
r
0%5%10%
15%
20%
25%
30%
35%
40%
45%
50%
% of Youths in State Institutions
7787
9194
9698
0002
Year
020
040
060
080
01,
000
1,20
01,
400
1,60
01,
800
2,00
0
7782
8789
9193
9495
9697
9899
0001
0203
Ye
ar
Number of Persons
HC
BS
ICF
-MR
Sta
teY
ea
r1-
67-
151-
1516
+T
otal
VT
77
262
14
340
551
79
22
191
43
83
446
%35
20
VT
82
322
12
044
235
67
98
155
31
49
716
%38
50
VT
87
285
96
381
196
57
710
51
96
168
6%
250
196
VT
89
465
046
518
26
47
114
18
221
33
%23
628
010
0V
T9
150
40
504
160
66
411
71
60
266
2%
214
405
91V
T9
370
10
701
317
32
125
31
607
7959
884
VT
94
770
077
00
77
013
40
NA
NA
4272
281
VT
95
791
079
10
79
113
70
NA
4191
374
VT
96
852
085
20
85
214
60
NA
NA
151,
107
66V
T9
791
50
915
09
15
156
0N
A12
1,37
266
VT
98
1,00
70
1,00
70
1,0
07
171
0N
AN
A12
1,48
558
VT
99
1,04
10
1,04
10
1,0
41
175
0N
A12
1,54
056
VT
00
1,06
30
1,0
63
01
,06
31
75
0N
AN
A12
1,6
84
42
VT
01
1,06
20
1,0
62
01
,06
21
73
0N
A12
1,7
96
51
VT
02
1,14
00
1,1
40
01
,14
01
85
0N
AN
A12
1,8
44
38
VT
03
1,17
30
1,1
73
01
,17
31
88
0N
A6
1,8
96
33
Per
sons
with
ID
/DD
by
Hom
e S
ize
Util
izat
ion
Rat
e pe
r 10
0,00
0 of
P
opul
atio
n
Per
sons
with
ID
/DD
R
ecei
ving
H
CB
S
Per
sons
with
ID
/DD
Liv
ing
in
Nur
sing
H
om
es
Sta
te
Inst
itutio
n P
opul
atio
n
Per
Die
m o
f S
tate
In
stitu
tions
(i
n $
)
0-21
Yr.
Old
s as
%
of
Sta
te
Inst
itutio
n R
esid
ents
Per
sons
with
ID
/DD
Liv
ing
in I
CF
s-M
R

140
Vir
gini
a
Per
sons
by
Hom
e S
ize
in Y
ears
198
2 an
d 20
03A
vera
ge P
er D
iem
of
Sta
te I
nsti
tuti
ons
Sta
te I
nsti
tuti
on R
esid
ents
ICF/
MR
+ H
CB
S R
ecip
ient
s
Pro
port
ion
of Y
outh
Am
ong
Sta
te I
nsti
tuti
on P
opul
atio
n
Did
not
furn
ish
2003
1982
1-6
7-15
16+
0%5%10%
15%
20%
25%
30%
35%
% of Youths in State Institutions
7787
9194
9698
0002
Yea
r
0
1,00
0
2,00
0
3,00
0
4,00
0
5,00
0
6,00
0
7,00
0
8,00
0
7782
8789
9193
9495
9697
9899
0001
0203
Yea
r
Number of Persons
HC
BS
ICF-
MR
$0
$100
$200
$300
$400
$500
7782
8789
9193
9495
9697
9899
0001
0203
Yea
r
Per Diem Costs
Sta
teY
ea
r1-
67-
151-
1516
+T
otal
VA
77
123
15
32
76
4,44
14
,71
79
24
,19
63
532
%3,
558
0V
A8
216
12
81
44
23,
778
4,2
20
77
3,5
97
69
20%
3,61
60
VA
87
210
14
43
54
3,07
83
,43
25
82
,97
012
012
%3,
169
0V
A8
922
33
86
60
92,
765
3,3
74
55
2,6
73
144
9%
2,83
40
1,44
8V
A9
122
33
94
61
72,
667
3,2
84
52
2,5
75
182
6%
2,68
23
26
1,93
3V
A9
322
33
86
60
92,
598
3,2
07
49
2,4
13
171
2,66
95
37
VA
94
223
38
66
09
2,59
83
,20
74
92
,29
818
75
%2,
466
71
5V
A9
522
33
86
60
92,
598
3,2
07
48
2,2
98
196
2,35
61,
126
VA
96
471
71
31,
184
2,18
93
,37
35
02
,18
921
55
%2,
357
1,45
3V
A9
73
,98
95
81
,98
222
22,
225
1,76
4V
A9
82,
091
49
82,
589
2,27
44
,86
37
21
,88
824
54
%2,
109
3,13
8V
A9
92,
091
49
82,
589
2,19
04
,77
97
01
,97
226
82,
025
3,57
978
VA
00
1,90
175
1,9
76
1,78
56
,02
98
51
,65
32
90
2%
1,86
84
,63
51,
272
VA
0
1D
NF
DN
FD
NF
DN
F6
,36
78
91
,68
43
19
1,89
95
,04
31,
012
VA
0
2D
NF
DN
FD
NF
DN
F7
,12
09
81
,66
44
29
3%
1,88
55
,49
11,
012
VA
0
3D
NF
DN
FD
NF
DN
F6
,55
79
21
,61
33
20
1,83
45
,73
76
91
Per
sons
with
ID
/DD
by
Hom
e S
ize
Util
izat
ion
Rat
e pe
r 10
0,00
0 of
P
opul
atio
n
Pe
rso
ns
with
ID
/DD
R
ecei
ving
H
CB
S
Pe
rso
ns
with
ID
/DD
Liv
ing
in
Nur
sing
H
om
es
Sta
te
Inst
itutio
n P
opul
atio
n
Pe
r D
iem
of
Sta
te
Inst
itutio
ns
(in
$)
0-21
Yr.
Old
s as
%
of
Sta
te
Inst
itutio
n R
esi
de
nts
Pe
rso
ns
with
ID
/DD
Liv
ing
in I
CF
s-M
R
050
01,0
001,5
002,0
002,5
003,0
003,5
004,0
004,5
00
Number of Residents
7787
9194
9698
0002
Year

141
Was
hing
ton
Ave
rage
Per
Die
m o
f S
tate
Ins
titu
tion
s
Sta
te I
nsti
tuti
on R
esid
ents
ICF/
MR
+ H
CB
S R
ecip
ient
s
Pro
port
ion
of Y
outh
Am
ong
Sta
te I
nsti
tuti
on P
opul
atio
n
Per
sons
by
Hom
e S
ize
in Y
ears
198
2 an
d 20
03
20
03
1982
1-6
7-15
16+
0
500
1,00
0
1,50
0
2,00
0
2,50
0
Number of Residents
7787
9194
9698
0002
Year
0%5%10%
15%
20%
25%
30%
35%
40%
45%
% of Youths in State Institutions
7787
9194
9698
0002
Yea
r
0
2,00
0
4,00
0
6,00
0
8,00
0
10,0
00
12,0
00
14,0
00
7782
8789
9193
949
596
97
98
99
00
01
02
03
Ye
ar
Number of Persons
HC
BS
ICF
-MR
$0
$100
$200
$300
$400
$500
7782
8789
9193
9495
9697
9899
0001
0203
Yea
r
Per Diem Costs
Sta
teY
ea
r1-
67-
151
-15
16+
To
tal
WA
77
102
34
74
49
3,97
94
,42
812
12
,46
94
141
%44
00
WA
82
194
47
36
67
3,06
73
,73
48
81
,91
08
932
%2,
464
0W
A8
71,
881
84
52
,72
62,
823
5,5
49
123
1,8
10
157
18%
2,55
38
86
WA
89
2,64
28
34
3,4
76
2,53
66
,01
212
61
,79
416
813
%2,
405
1,0
84
56
4W
A9
13,
549
40
23
,95
12,
046
5,9
97
120
1,5
75
269
10%
1,95
11
,73
65
00
WA
93
3,96
04
75
4,4
35
1,81
56
,25
012
61
,46
430
61,
650
1,7
11
49
7W
A9
44,
266
42
34
,68
91,
636
6,3
25
120
1,3
46
303
5%
1,30
23
,06
85
16
WA
95
4,41
33
85
4,7
98
1,58
66
,38
411
61
,30
731
21,
284
3,3
61
50
7W
A9
64,
442
40
04
,84
21,
504
6,3
46
113
1,2
81
310
3%
1,18
74
,66
64
92
WA
97
4,53
26
46
5,1
78
1,44
86
,62
611
31
,24
633
31,
126
6,6
43
49
3W
A9
84,
677
59
75
,27
41,
404
6,6
78
117
1,2
22
344
3%
1,08
17
,12
54
86
WA
99
5,49
63
85
5,8
81
1,27
57
,15
612
41
,18
736
11,
280
8,1
65
46
0W
A0
06,
262
260
6,5
22
1,34
47
,86
61
33
1,1
28
39
11
%94
88
,98
44
62
WA
01
6,61
833
66
,95
41,
141
8,0
95
13
51
,10
54
06
904
9,4
13
48
8W
A0
27,
000
304
7,3
04
1,12
48
,42
81
39
1,0
72
40
32
%88
01
1,1
73
45
9W
A0
36,
697
266
6,9
63
1,05
78
,02
01
32
1,0
21
42
683
91
0,1
65
41
4
Pe
rso
ns
wit
h I
D/D
D b
y H
om
e S
ize
Util
izat
ion
Rat
e pe
r 10
0,00
0 of
P
op
ula
tion
Pe
rso
ns
wit
h
ID/D
D
Re
ceiv
ing
H
CB
S
Pe
rso
ns
wit
h
ID/D
D L
ivin
g in
N
ursi
ng
Ho
me
s
Sta
te
Inst
itutio
n P
opul
atio
n
Pe
r D
iem
of
Sta
te
Inst
itutio
ns
(in
$)
0-21
Yr.
Old
s as
%
of
Sta
te
Inst
itutio
n R
esi
de
nts
Pe
rso
ns
wit
h
ID/D
D L
ivin
g in
IC
Fs-
MR

142
Wes
t V
irgi
na
Per
sons
by
Hom
e S
ize
in Y
ears
198
2 an
d 20
03A
vera
ge P
er D
iem
of
Sta
te I
nsti
tuti
ons
Sta
te I
nsti
tuti
on R
esid
ents
ICF/
MR
+ H
CB
S R
ecip
ient
s
Pro
port
ion
of Y
outh
Am
ong
Sta
te I
nsti
tuti
on P
opul
atio
n
2003
1982
1-6
7-15
16+
$0
$100
$200
$300
$400
$500
7782
8789
9193
9495
9697
9899
0001
0203
Year
Per Diem Costs
0%5%10%
15%
20%
25%
30%
35%
40%
% of Youths in State Institutions
7787
9194
9698
0002
Yea
r
010
0
200
300
400
500
600
700
800
900
Number of Residents
7787
9194
9698
0002
Yea
r
0
500
1,00
0
1,50
0
2,00
0
2,50
0
3,00
0
3,50
0
4,00
0
7782
8789
9193
9495
9697
9899
0001
0203
Yea
r
Number of Persons
HC
BS
ICF-
MR
Sta
teY
ea
r1-
67-
151
-15
16
+T
ota
l
WV
77
243
25
695
01
,00
65
49
16
28
40%
00
WV
82
292
45
397
81
,03
15
38
94
52
33%
176
0W
V8
735
22
16
56
852
31
,09
15
74
80
106
10%
404
12
4W
V8
939
02
92
68
240
81
,09
05
93
24
145
9%
762
22
41
36
WV
91
446
40
98
55
373
1,2
28
68
13
623
03
%68
04
13
21
1W
V9
345
94
24
88
325
91
,14
26
41
09
364
640
63
72
11
WV
94
495
42
49
19
251
1,1
70
65
10
936
464
08
03
21
1W
V9
553
14
24
95
524
41
,19
96
68
537
659
81
,12
11
73
WV
96
1,12
26
66
1,7
88
174
1,9
62
107
75
368
0%
588
1,3
37
30W
V9
71,
145
66
61
,81
116
01
,97
110
89
645
057
41
,44
133
WV
98
1,22
64
11
1,6
37
01
,63
79
06
DN
F0
%45
41
,67
933
WV
99
1,22
64
28
1,6
54
01
,65
49
26
DN
F44
41
,85
133
WV
00
1,22
642
81
,65
40
1,6
54
91
0N
AN
A44
41
,94
54
0W
V0
11,
218
413
1,6
31
591
,69
09
40
NA
514
2,3
96
36
2W
V0
296
155
71
,51
881
1,5
99
89
0N
AN
A51
52
,79
63
62
WV
03
1,29
053
51
,82
559
1,8
84
10
20
NA
515
3,1
39
36
2
Pe
rso
ns
wit
h I
D/D
D b
y H
om
e S
ize
Util
izat
ion
Ra
te p
er
10
0,0
00
of
Po
pu
lati
on
Pe
rso
ns
wit
h
ID/D
D
Re
ceiv
ing
H
CB
S
Pe
rso
ns
wit
h
ID/D
D L
ivin
g i
n
Nu
rsin
g
Ho
me
s
Sta
te
Inst
itutio
n
Pop
ulat
ion
Pe
r D
iem
of
Sta
te
Inst
itutio
ns
(in
$)
0-2
1 Y
r. O
lds
as
% o
f S
tate
In
stitu
tion
R
esi
de
nts
Pe
rso
ns
wit
h
ID/D
D L
ivin
g in
IC
Fs-
MR

143
Wis
cons
in
Per
sons
by
Hom
e S
ize
in Y
ears
198
2 an
d 20
03A
vera
ge P
er D
iem
of
Sta
te I
nsti
tuti
ons
Sta
te I
nsti
tuti
on R
esid
ents
ICF/
MR
+ H
CB
S R
ecip
ient
sP
ropo
rtio
n of
You
th A
mon
gS
tate
Ins
titu
tion
Pop
ulat
ion
1982
1-6
7-15
16+
2003
0
500
1,00
0
1,50
0
2,00
0
2,50
0
Number of Residents
7787
9194
9698
0002
Year
0%10%
20%
30%
40%
50%
60%
% of Youths in State Institutions
7787
9194
9698
0002
Yea
r
0
2,00
0
4,00
0
6,00
0
8,00
0
10,0
00
12,0
00
14,0
00
16,0
00
7782
878
99
19
39
49
59
697
9899
00
01
02
03
Ye
ar
Number of Persons
HC
BS
ICF
-MR
$0$1
00$2
00$3
00$4
00$5
00$6
00
7782
8789
9193
9495
9697
9899
0001
0203
Yea
r
Per Diem Costs
Sta
teY
ea
r1-
67-
151
-15
16
+T
ota
l
WI
77
194
96
01
,15
44,
494
5,6
48
121
2,3
90
61
54%
3,69
60
WI
82
324
1,2
82
1,6
06
4,07
95
,68
511
92
,16
79
632
%3,
548
0W
I8
72,
404
1,7
86
4,1
90
3,52
87
,71
816
11
,86
812
618
%3,
568
19
0W
I8
93,
632
1,5
76
5,2
08
4,58
39
,79
120
11
,72
115
915
%4,
609
91
38
17
WI
91
4,65
51
,51
06
,16
54,
059
10
,22
420
61
,62
118
512
%4,
126
1,6
43
99
5W
I9
35,
639
1,1
41
6,7
80
3,82
31
0,6
03
216
1,4
68
221
3,88
72
,01
78
47
WI
94
6,56
79
96
7,5
63
3,68
51
1,2
48
223
1,3
84
242
8%
3,74
92
,31
57
98
WI
95
7,20
08
70
8,0
70
3,50
41
1,5
74
224
1,2
99
260
3,51
93
,38
27
03
WI
96
7,87
28
30
8,7
02
3,36
71
2,0
69
232
1,1
97
270
8%
3,38
25
,06
36
72
WI
97
7,85
27
90
8,6
42
3,16
01
1,8
02
223
1,1
11
281
3,18
76
,55
85
54
WI
98
8,47
38
84
9,3
57
3,02
91
2,3
86
237
1,0
10
296
7%
3,05
67
,27
34
96
WI
99
9,72
78
14
10
,54
12,
899
13
,44
025
69
37
333
2,89
98
,37
54
95
WI
00
8,42
080
79
,22
72,
840
12
,06
72
25
87
13
45
8%
2,86
59
,54
74
71
WI
01
DN
FD
NF
DN
FD
NF
13
,83
02
56
83
24
10
2,74
81
0,6
86
59
5W
I0
28,
073
882
8,9
55
2,55
11
1,5
06
21
28
11
42
34
%2,
580
9,4
74
59
5W
I0
39,
516
985
10
,50
12,
286
12
,78
72
36
78
84
77
2,31
51
0,6
15
20
1
Pe
rso
ns
wit
h I
D/D
D b
y H
om
e S
ize
Util
izat
ion
Ra
te p
er
10
0,0
00
of
Po
pu
lati
on
Pe
rso
ns
wit
h
ID/D
D
Re
ceiv
ing
H
CB
S
Pe
rso
ns
wit
h
ID/D
D L
ivin
g i
n
Nu
rsin
g
Ho
me
s
Sta
te
Inst
itutio
n
Pop
ulat
ion
Pe
r D
iem
of
Sta
te
Inst
itutio
ns
(in
$)
0-2
1 Y
r. O
lds
as
% o
f S
tate
In
stitu
tion
R
esi
de
nts
Pe
rso
ns
wit
h
ID/D
D L
ivin
g in
IC
Fs-
MR

144
Wyo
min
g
Per
sons
by
Hom
e S
ize
in Y
ears
198
2 an
d 20
03A
vera
ge P
er D
iem
of
Sta
te I
nsti
tuti
ons
Sta
te I
nsti
tuti
on R
esid
ents
ICF/
MR
+ H
CB
S R
ecip
ient
s
Pro
port
ion
of Y
outh
Am
ong
Sta
te I
nsti
tuti
on P
opul
atio
n
Sta
teY
ear
1-6
7-15
1-15
16+
Tot
al
WY
77
287
09
858
46
82
168
53
32
819
%0
0W
Y8
217
93
110
519
62
912
54
41
75
28%
00
WY
87
682
00
268
429
69
713
84
09
93
19%
00
WY
89
110
20
231
241
17
23
152
41
111
215
%0
060
WY
91
222
18
040
229
06
92
150
29
015
560
125
49W
Y9
341
61
11
527
188
71
515
91
88
259
9045
947
WY
94
543
64
607
156
76
316
21
56
304
3%
156
565
46W
Y9
556
26
062
214
77
69
158
14
733
014
771
946
WY
96
599
75
674
145
81
916
61
45
320
145
864
33W
Y9
778
25
583
713
99
76
192
13
936
813
991
633
WY
98
712
91
803
128
93
119
41
28
369
2%
128
1,05
442
WY
99
728
87
815
120
93
519
51
20
383
120
1,11
242
WY
00
711
6777
810
68
84
17
91
06
41
62
%10
61,
226
40
WY
01
757
7583
210
39
35
18
91
03
42
310
31,
354
53
WY
02
694
104
798
106
90
41
81
10
64
76
2%
106
1,50
74
8W
Y0
368
013
081
095
90
51
66
95
53
695
1,52
24
9
Per
sons
with
ID
/DD
by
Hom
e S
ize
Util
izat
ion
Rat
e pe
r 10
0,00
0 of
P
opul
atio
n
Per
sons
with
ID
/DD
R
ecei
ving
H
CB
S
Per
sons
with
ID
/DD
Liv
ing
in
Nur
sing
H
omes
Sta
te
Inst
itutio
n P
opul
atio
n
Per
Die
m o
f S
tate
In
stitu
tions
(i
n $)
0-21
Yr.
Old
s as
%
of
Sta
te
Inst
itutio
n R
esid
ents
Per
sons
with
ID
/DD
Liv
ing
in I
CF
s-M
R
20
03
1982
1-6
7-15
16+
$0$1
00$2
00$3
00
$400
$500
$600
7782
8789
9193
9495
9697
9899
0001
0203
Yea
r
Per Diem Costs
0
100
200
300
400
500
600
Number of Residents
7787
9194
9698
0002
Yea
r
0%5%10%
15%
20%
25%
30%
% of Youths in State Institutions
7787
9194
9698
0002
Yea
r
0
500
1,00
0
1,50
0
2,00
0
7782
8789
9193
9495
9697
9899
0001
0203
Year
Number of Persons
HC
BSIC
F-M
R
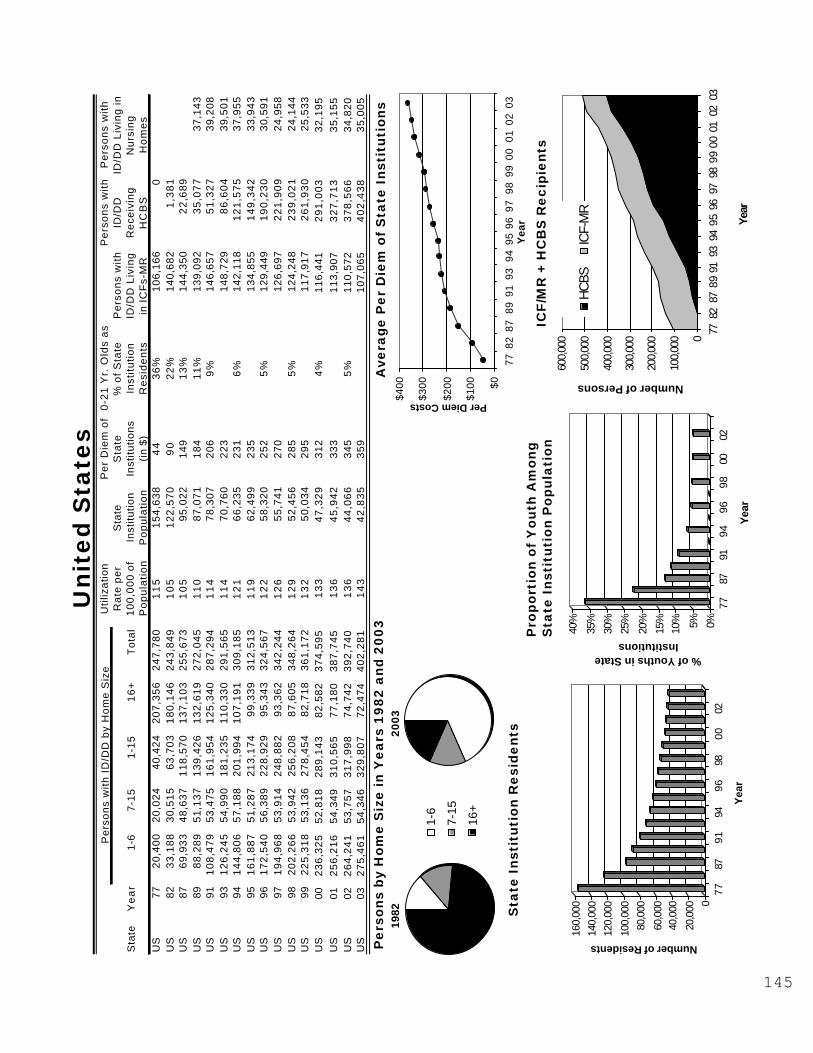
145
Uni
ted
Sta
tes
Per
sons
by
Hom
e S
ize
in Y
ears
198
2 an
d 20
03A
vera
ge P
er D
iem
of
Sta
te I
nsti
tuti
ons
Sta
te I
nsti
tuti
on R
esid
ents
ICF/
MR
+ H
CB
S R
ecip
ient
sP
ropo
rtio
n of
You
th A
mon
gS
tate
Ins
titu
tion
Pop
ulat
ion
20
03
1982
1-6
7-15
16+
0%5%10%
15%
20%
25%
30%
35%
40%
% of Youths in State Institutions
7787
9194
9698
0002
Yea
r
0
100,
000
200,
000
300,
000
400,
000
500,
000
600,
000
7782
8789
9193
9495
9697
9899
0001
0203
Year
Number of Persons
HC
BSIC
F-M
R
$0
$100
$200
$300
$400
7782
8789
9193
9495
9697
9899
0001
0203
Yea
r
Per Diem Costs
Sta
teY
ea
r1-
67-
151-
151
6+
To
tal
US
7720
,400
20,0
2440
,424
20
7,3
56
24
7,7
80
11
51
54
,63
84
43
6%
106,
166
0U
S82
33,1
8830
,515
63,7
031
80
,14
62
43
,84
91
05
12
2,5
70
90
22
%14
0,68
21
,38
1U
S87
69,9
3348
,637
11
8,5
70
13
7,1
03
25
5,6
73
10
595
,022
149
13
%14
4,35
02
2,6
89
US
8988
,289
51,1
371
39
,42
61
32
,61
92
72
,04
51
10
87,0
7118
41
1%
139,
092
35
,07
737
,143
US
911
08
,47
953
,475
16
1,9
54
12
5,3
40
28
7,2
94
11
478
,307
206
9%
146,
657
51
,32
739
,208
US
931
26
,24
554
,990
18
1,2
35
11
0,3
30
29
1,5
65
11
470
,760
223
148,
729
86
,60
439
,501
US
941
44
,80
657
,188
20
1,9
94
10
7,1
91
30
9,1
85
12
166
,235
231
6%
142,
118
12
1,5
75
37,9
55U
S95
16
1,8
87
51,2
872
13
,17
499
,339
31
2,5
13
11
962
,499
235
134,
855
14
9,3
42
33,9
43U
S96
17
2,5
40
56,3
892
28
,92
995
,343
32
4,5
67
12
258
,320
252
5%
129,
449
19
0,2
30
30,5
91U
S97
19
4,9
68
53,9
142
48
,88
293
,362
34
2,2
44
12
655
,741
270
126,
697
22
1,9
09
24,9
58U
S98
20
2,2
66
53,9
422
56
,20
887
,605
34
8,2
64
12
952
,456
285
5%
124,
248
23
9,0
21
24,1
44U
S99
22
5,3
18
53,1
362
78
,45
482
,718
36
1,1
72
13
250
,034
295
117,
917
26
1,9
30
25,5
33U
S00
23
6,3
25
52,8
182
89
,14
382
,582
37
4,5
95
13
34
7,3
29
312
4%
116,
441
29
1,0
03
32,1
95U
S01
25
6,2
16
54,3
493
10
,56
577
,180
38
7,7
45
13
64
5,9
42
333
113,
907
32
7,7
13
35,1
55U
S02
26
4,2
41
53,7
573
17
,99
874
,742
39
2,7
40
13
64
4,0
66
345
5%
110,
572
37
8,5
66
34,8
20U
S03
27
5,4
61
54,3
463
29
,80
772
,474
40
2,2
81
14
34
2,8
35
359
107,
065
40
2,4
38
35,0
05
Pe
rso
ns
wit
h I
D/D
D b
y H
om
e S
ize
Util
izat
ion
Ra
te p
er
10
0,0
00
of
Po
pu
lati
on
Pe
rso
ns
wit
h
ID/D
D
Re
ceiv
ing
H
CB
S
Pe
rso
ns
wit
h
ID/D
D L
ivin
g in
N
urs
ing
H
om
es
Sta
te
Inst
itutio
n P
op
ula
tio
n
Pe
r D
iem
of
Sta
te
Inst
itutio
ns
(in
$)
0-2
1 Y
r. O
lds
as
% o
f S
tate
In
stit
uti
on
R
esi
de
nts
Pe
rso
ns
wit
h
ID/D
D L
ivin
g
in I
CF
s-M
R
020
,000
40,0
0060
,000
80,0
0010
0,00
0
120,
000
140,
000
160,
000
Number of Residents
7787
9194
9698
0002
Yea
r

146

147
References and DataSources
Anderson, L.L., Prouty, R.W., & Lakin, K.C. (2000). Parallels in size of residential settings and use ofMedicaid-financed programs. Mental Retardation, 38(5), 468-471.
Boggs, E., Lakin, K.C., & Clauser, S. (1985). Medicaid coverage of residential service. In K.C.Lakin, B.K. Hill, & R.H. Bruininks (Eds.), An analysis of Medicaid’s Intermediate Care Facility for the MentallyRetarded (ICF/MR) Program (Report No. 20). Minneapolis: University of Minnesota, Department of EducationalPsychology.
Braddock, D., & Mitchell, D. (1992). Residential services and developmental disabilities in the UnitedStates: A national survey of staff compensation, turnover and related issues. Washington D.C.: AmericanAssociation on Mental Retardation.
Braddock, D., Hemp, R., Bacheldner, L., & Fujiura, G. (1995). The state of the states in developmentaldisabilities. Washington, D.C.: American Association on Mental Retardation.
Braddock, D., Hemp, R., Parish, S. & Westrich, J. (1998). State of the states in developmentaldisabilities. (5th ed.) Washington, DC : American Association on Mental Retardation.
Braddock, D. (2002). Disability at the Dawn of the 21st Century and the State of the States.Washington DC: American Association on Mental Retardation.
Coucouvanis, K., Polister, B., Prouty, R.W., & Lakin, K.C. (2003). Continuing reduction in populationsof large state residential facilities for persons with intellectual and developmental disabilities. MentalRetardation, 41(1), 67-70.
Davis, R., Silverstein, B., Uehara, E., & Sadden, L. (1987). Evaluation and service identification fordevelopmentally disabled residents of intermediate care and skilled nursing facilities. Chicago: Taylor Institute/UAP.
Gettings, R.M., & Mitchell, D. (1980). Trends in capital expenditures for mental retardation facilities:A state-by-state survey. Washington, DC: National Association of State Mental Retardation Program Directors.
Hauber, F.A., Bruininks, R.H., Hill, B.K., Lakin, K.C., & White, C.C. (1984). National census ofresidential facilities: Fiscal year 1982. Minneapolis: University of Minnesota, Center on Residential Servicesand Community Living, Institute on Community Integration/UAP.
Hill, B.K., & Lakin, K.C. (1984). Classification of residential facilities for mentally retarded people.Mental Retardation, 24, 107-115. Internal Revenue Service. (1992, Summer). Statistics of Income Bulletin.
Krantz, G.C., Bruininks, R.H., Clumpner, J.L. (1979). Mentally retarded people in state-operatedresidential facilities: Year ending June 30, 1978. Minneapolis: University of Minnesota, Center on ResidentialServices and Community Living, Institute on Community Integration/UAP.

148
Krantz, G.C., Bruininks, R.H., Clumpner, J.L. (1980). Mentally retarded people in state-operatedresidential facilities: Year ending June 30, 1979. Minneapolis: University of Minnesota, Center on ResidentialServices and Community Living, Institute on Community Integration/UAP.
Krantz, G.C., Bruininks, R.H., Clumpner, J.L. (1981). Mentally retarded people in state-operatedresidential facilities: Year ending June 30, 1980. Minneapolis: University of Minnesota, Center on ResidentialServices and Community Living, Institute on Community Integration/UAP.
Lakin, K.C. (1979). Demographic studies of residential facilities for mentally retarded people.Minneapolis: University of Minnesota, Center on Residential Services and Community Living, Institute onCommunity Integration/UAP.
Lakin, K.C., Anderson, L.L. & Prouty, R. (1998). Decreases continue in out-of-home residentialplacements of children and youth with mental retardation. Mental Retardation, 36(2), 165-168.
Lakin, K.C., Blake, E.M., Prouty, R.W., Mangan, T., & Bruininks, R.H. (1993). Residential servicesfor persons with developmental disabilities: Status and trends through 1991. Minneapolis: University ofMinnesota, Center on Residential Services and Community Living, Institute on Community Integration/UAP.
Lakin, K.C., Bruininks, R.H., Doth, D., Hill, B.K., & Hauber, F.A. (1982). Sourcebook on long-termcare for developmentally disabled people (Report No. 17). Minneapolis: University of Minnesota, Departmentof Educational Psychology.
Lakin, K.C., Hill, B.K., & Anderson, D.J. (1991). Persons with mental retardation in nursing homes in1977 and 1985. Mental Retardation, 29(1), 25-33.
Lakin, K.C., Hill, B.K., & Bruininks, R.H. (Eds.) (1985). An analysis of Medicaid’s Intermediate CareFacility for the Mentally Retarded (ICF-MR) program. Minneapolis: University of Minnesota, Center onResidential Services and Community Living, Institute on Community Integration/UAP.
Lakin, K.C., Hill, B.K., Chen, T. & Stephens, S.A. (1989). Persons with mental retardation and relatedconditions in mental retardation facilities: Selected findings from the 1987 National Medical ExpenditureSurvey. Minneapolis: University of Minnesota, Research and Training Center on Community Living/ Instituteon Community Integration/UAP.
Lakin, K.C., Hill, B.K., Hauber, F.A., Bruininks, R.H., & Heal, L.W. (1983). New admissions andreadmissions to a national sample of residential facilities. American Journal on Mental Deficiency, 88, 13-20.
Lakin, K.C., Hill, B.K., Street, H., & Bruininks, R.H. (1986). Persons with mental retardation in state-operated residential facilities: Years ending June 30, 1984 and June 30, 1985. Minneapolis: University ofMinnesota, Center on Residential Services and Community Living, Institute on Community Integration/UAP.
Lakin, K.C., Jaskulski, T.M., Hill, B.K., Bruininks, R.H., Menke, J.M., White, C.C., & Wright, E.A.(1989). Medicaid services for persons with mental retardation and related conditions. Minneapolis: Universityof Minnesota, Center for Residential Services and Community Living, Institute on Community Integration/UAP.
Lakin, K.C., White, C.C., Hill, B.K., Bruininks, R.H., & Wright, E.A. (1990). Longitudinal change andinterstate variability in residential services for persons with mental retardation. Mental Retardation, 28(6),343-351.
Lakin, K.C., Prouty, R.W., Polister, B., & Anderson, L.L. (2000). Over three quarters of all residentialservice recipients in community settings as of June 1999. Mental Retardation, 38(4), 378-379.

149
Lakin, K.C., Smith, J., Prouty, R.W., & Polister, B. (2001). State institutions during the 1990s: Changesin the number of facilities, average daily populations, and expenditures between fiscal years 1991 and 2000.Mental Retardation, 39(1), 72-75.
Lakin, K.C., Prouty, R.W., Coucouvanis, K. & Polister, B. (2004). States’ Initial Response to thePresident’s New Freedom Initiative: Slowest Rates of Deinstitutionalization. Mental Retardation, (in press).
Larson, S. A., Lakin, K.C., & Bruininks, R.H. (1998). Staff recruitment and retention: Study resultsand intervention strategies. Washington, DC: American Association on Mental Retardation.
Larson, S.A. & Lakin, K.C. (1995). Status and changes in Medicaid’s Intermediate Care Facility forthe Mentally Retarded (ICF-MR) program: Results from analysis of the Online Survey Certification andReporting System. Minneapolis: University of Minnesota, Center on Residential Services and CommunityLiving, Institute on Community Integration/UAP.
Larson, S.A., Lakin, K.C., Anderson, L., Kwak, N., Lee, J.H., Anderson, D. (2001). Prevalence onmental retardation and developmental disabilities: Estimates from the 1994/1995 National Health InterviewSurvey Disability Supplements. American Journal on Mental Retardation, 106(3), 231-252.
Larson, S.A., Lakin, L.C., Anderson, L.L., &Kwak, N. (2001). Age, race, gender and poverty status ofperson with MR/DD living in their own homes or with family members: NHIS-D analysis. MR/DD Data Brief,3(2). Minneapolis: University of Minnesota, Institute on Community Integration.
Mangan, T., Blake, E.M., Prouty, R.W., & Lakin, K.C. (1993). Residential services for persons withmental retardation and related conditions: Status and trends through 1992. Minneapolis: University ofMinnesota, Research and Training Center on Residential Services and Community Living, Institute onCommunity Integration/UAP.
Mangan, T., Blake, E.M., Prouty, R.W., & Lakin, K.C. (1994). Residential services for persons withmental retardation and related conditions: Status and trends through 1993. Minneapolis: University ofMinnesota, Research and Training Center on Residential Services and Community Living, Institute onCommunity Integration/UAP.
National Institute of Mental Health (1975). Changes in the age, sex, and diagnostic composition ofthe resident population of state and county mental hospitals, United States, 1964-1973. DHEW Pub. No.(ADM)75-158. Rockville, MD: Author.
National Institute of Mental Health (1979). Patients in state and county mental hospitals, 1977.Rockville, MD: Author. (microfiche)
National Institute of Mental Health. (1951). Patients in mental institutions, 1950. Washington, DC:U.S. Government Printing Office.
National Institute of Mental Health. (1956). Patients in mental institutions, 1955. Washington, DC:U.S. Government Printing Office.
National Institute of Mental Health. (1957). Patients in mental institutions, 1956. Washington, DC:U.S. Government Printing Office.
National Institute of Mental Health. (1961). Patients in mental institutions, 1960. Washington, DC:U.S. Government Printing Office.

150
National Institute of Mental Health. (1966). Patients in mental institutions, 1965. Washington, DC:U.S. Government Printing Office.
National Institute of Mental Health. (1967). Patients in mental institutions, 1966. Washington, DC:U.S. Government Printing Office.
National Institute of Mental Health. (1969). Patients in mental institutions, 1967. Washington, DC:U.S. Government Printing Office.
Office of Mental Retardation Coordination, Social and Rehabilitation Service. (1969). Residents inpublic institutions for the mentally retarded, 1968 (Current Facility Reports). Washington, DC: NationalClearinghouse for Mental Health Information.
Office of Mental Retardation Coordination, Social and Rehabilitation Service. (1970). Residents inpublic institutions for the mentally retarded, 1969 (Current Facility Reports). Washington, DC: NationalClearinghouse for Mental Health Information.
Prouty, R.W. & Lakin, K.C. (1992). A summary of states’ efforts to positively affect the quality ofMedicaid Home and Community-Based Services for persons with mental retardation and related conditions.Minneapolis: University of Minnesota, Center for Residential and Community Services/Institute on CommunityIntegration/UAP.
Prouty, R.W. & Lakin, K.C. (Eds.) (1995). Residential services for persons with developmentaldisabilities: Status and trends through 1994. Minneapolis: University of Minnesota, Research and TrainingCenter on Community Living, Institute on Community Integration/UAP.
Prouty, R.W. & Lakin, K.C. (Eds.) (1996). Residential services for persons with developmentaldisabilities: Status and trends through 1995. Minneapolis: University of Minnesota, Research and TrainingCenter on Community Living, Institute on Community Integration/UAP.
Prouty, R.W. & Lakin, K.C. (Eds.) (1997). Residential services for persons with developmentaldisabilities: Status and trends through 1996. Minneapolis: University of Minnesota, Research and TrainingCenter on Community Living, Institute on Community Integration/UAP.
Prouty, R.W. & Lakin, K.C. (Eds.) (1998). Residential services for persons with developmentaldisabilities: Status and trends through 1997. Minneapolis: University of Minnesota, Research and TrainingCenter on Community Living, Institute on Community Integration/UAP.
Prouty, R.W. & Lakin, K.C. (Eds.) (1999). Residential services for persons with developmentaldisabilities: Status and trends through 1998. Minneapolis: University of Minnesota, Research and TrainingCenter on Community Living/ Institute on Community Integration/UAP.
Prouty, R.W., Lakin, K.C., & Anderson, L.L. (2000). Five-year trends in Medicaid institutional (ICF/MR) populations, Home and Community Based Services reflect major changes. Mental Retardation, 38(3),294-296.
Prouty, R.W. & Lakin, K.C. (Eds.) (2000). Residential services for persons with developmentaldisabilities: Status and trends through 1999. Minneapolis: University of Minnesota, Research and TrainingCenter on Community Living, Institute on Community Integration/UAP.
Prouty, R.W. & Lakin, K.C. (Eds.) (2001). Residential services for persons with developmentaldisabilities: Status and trends through 2000. Minneapolis: University of Minnesota, Research and TrainingCenter on Community Living, Institute on Community Integration/UCEED.

151
Prouty, R.W. & Lakin, K.C. (Eds.) (2002). Residential services for persons with developmentaldisabilities: Status and trends through 2001. Minneapolis: University of Minnesota, Research and TrainingCenter on Community Living, Institute on Community Integration/UCEED.
Prouty, R.W. & Lakin, K.C. (Eds.) (2003). Residential services for persons with developmentaldisabilities: Status and trends through 2002. Minneapolis: University of Minnesota, Research and TrainingCenter on Community Living, Institute on Community Integration/UCEED.
Rotegard, L.L., & Bruininks, R.H. (1983). Mentally retarded people in state-operated residentialfacilities: Year ending June 30, 1981 and 1982. Minneapolis: University of Minnesota, Center on ResidentialServices and Community Living, Institute on Community Integration/UAP.
Scheerenberger, R.C. (1965). A current census (1964) of state institutions for the mentally retarded.Mental Retardation, 3, 3-4.
Scheerenberger, R.C. (1975). Current trends and status of public residential services for the mentallyretarded, 1974. Madison, WI: National Association of Superintendents of Public Residential Facilities for theMentally Retarded.
Scheerenberger, R.C. (1977). Public residential services for the mentally retarded, 1976. Madison,WI: National Association of Superintendents of Public Residential Facilities for the Mentally Retarded.
Sigford, B.B., Bruininks, R.H., Lakin, K.C., Hill, B.K., & Heal, L.W. (1982). Resident release patternsin a national sample of public residential facilities. American Journal on Mental Deficiency, 87(2), 130-140.
Smith, G., & Gettings, R. (1989). Medicaid Home and Community Based Services for persons withdevelopmental disabilities. Alexandria, VA: National Association of State Mental Retardation Program Directors.
Social Security Administration Office, Office of Disability (1998). Review of SSA’s implementation ofnew SSI childhood disability legislation (SSA Pub. No 64-070). Baltimore: Author
Soloman-Fears, C. (1996, August). Supplemental Security Income (SSI) children: Welfare reform inthe 104th Congress (CRS report for Congress 95-402 EPW). Washington, DC: Library of Congress,Congressional Research Service.
U.S. Bureau of the Census. (1990). Projections of the population of states, by age, sex, and race:1989 to 2010, Current Population Reports, Series P-25, No. 1053. U.S. Government Printing Office:Washington, DC.
White, C.C., Lakin, K.C., & Bruininks, R.H. (1989). Persons with mental retardation and relatedconditions in state-operated residential facilities: Year ending June 30, 1988. Minneapolis: University ofMinnesota, Research and Training Center on Residential Services and Community Living, Institute onCommunity Integration/UAP.
White, C.C., Lakin, K.C., Bruininks, R.H., & Li, X. (1991). Persons with mental retardation andrelated conditions in state-operated residential facilities: Year ending June 30, 1989. Minneapolis: Universityof Minnesota, Center on Residential Services and Community Living, Institute on Community Integration/UAP.
White, C.C., Lakin, K.C., Hill, B.K., Wright, E.A., Bruininks, R.H. (1987). Persons with mentalretardation in state-operated residential facilities: Year ending June 30, 1986 with longitudinal trends from1950 to 1986. Minneapolis: University of Minnesota, Department of Educational Psychology.

152
White, C.C., Lakin, K.C., Hill, B.K., Wright, E.A., & Bruininks, R.H. (1988). Persons with mentalretardation in state-operated residential facilities: Year ending June 30, 1987 with longitudinal trends from1950 to 1987. Minneapolis: University of Minnesota, Center for Residential Services and Community Living,Institute on Community Integration/UAP.
White, C.C., Prouty, R.W., Lakin, K.C., & Blake, E.M. (1992). Persons with mental retardation andrelated conditions in state-operated residential facilities: Year ending June 30, 1990. Minneapolis: Universityof Minnesota, Center on Residential Services and Community Living, Institute on Community Integration/UAP.
Zappolo, A., Lakin, K.C., & Hill, B.K. (1990). Persons in institutions and special residential settings.In I. Fitzgerald & S. Thompson-Hoffman (Eds.), Disability in the United States. New York: Springer PublishingCo.
152