Embed Size (px)
Citation preview
Residential Price Structure
For
Distributed Generation Customers

• Previously, cost of service at the individual level was
relatively unimportant
• Because distributed generation allows individual
customers to dramatically alter their load shape, cost
of service at the individual level becomes relevant
• Using Board-approved cost of service principles, it is
possible to determine cost of service at the individual
or group level and compare that to revenues based
on current or proposed price structure
• Three-part price structure better reflects the cost to
serve distributed generation customers
The Issue Price Structure Must Reflect the Cost to Serve
2

Distributed Generation Customers in Iowa
3
Net Metered
Customers
Total Electric
Customers
Portion of Total Customers
2015 Total Total Total
June 211 662,221 .032%
July 223 662,872 .034%
August 229 663,357 .035%
September 237 663,822 .036%
October 254 664,908 .038%
November 259 665,939 .039%
December 274 666,803 .041%
• Distributed generation customers are currently a small percentage of total
customers
• Distributed generation growth is happening but not at a significant pace
Now is the time to address price structure issues

Iowa Typical Residential Summer Demand
with 5 kWDC Solar DG System
4
0.00
0.50
1.00
1.50
2.00
2.50
3.00
3.50
Kil
ow
att
Customer Demand
4am 8am 12pm 4pm 8pm 12am
100% Utility-Provided
Power
DG Peak 1-3 PM Customer Demand
Peak 6-7 PM
DG customer uses grid
to export excess power
100% Utility-
Provided
Power
Utility-Provided Power
Utility-Provided Grid Services
Utility and DG System-Provided Power
23.99 hours/day utility provides all grid services
8.5 hours/day both utility and DG system provides power 8 hours/day utility provides 100% of power needed
DG System-Provided Power
7.5 hours/day DG system provides 100% of power needed
DG Generation
4
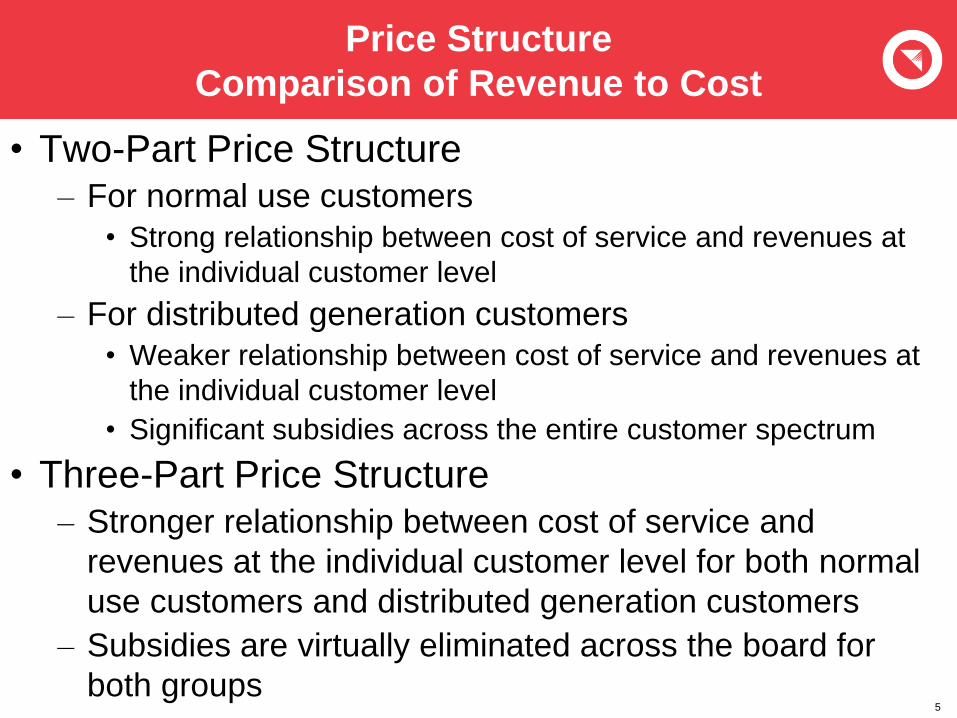
Price Structure
Comparison of Revenue to Cost
5
• Two-Part Price Structure – For normal use customers
• Strong relationship between cost of service and revenues at
the individual customer level
– For distributed generation customers
• Weaker relationship between cost of service and revenues at
the individual customer level
• Significant subsidies across the entire customer spectrum
• Three-Part Price Structure – Stronger relationship between cost of service and
revenues at the individual customer level for both normal
use customers and distributed generation customers
– Subsidies are virtually eliminated across the board for
both groups

• Efficient pricing should match each service provided
by the utility to the price for providing that service – Customer related services should be recovered through a
fixed monthly charge
• Accounting, billing, customer service systems
• Terminals, transformers, wires closest to customer’s premise
– Grid related services (transmission and distribution
functions which are demand related per cost of service)
should be recovered through demand charges
– Energy services (generation service) should be recovered
through volumetric charges
Price Signal
Three-Part Price Structure
6

There are good reasons to implement a well-designed
three-part price structure
• More sophisticated price structure for more
sophisticated load shapes (better alignment of prices
and costs)
• Reduce inter-class cross-subsidies
• Regulatory precedent (commercial and industrial
experience)
• Customer bills do not necessarily increase
• The time to implement is now
Conclusion
7


Appendix
9
Framework for Evaluating Price Structure with
Distributed Generation
• Framework is based on traditional utility cost of
service principles pushed down to the individual
customer level
• For a sample of customers – Identify cost of service using traditional accepted cost of
service principles down to the individual customer level
– Determine individual customer revenue based on current
or proposed price structure
– Analyze variances
10
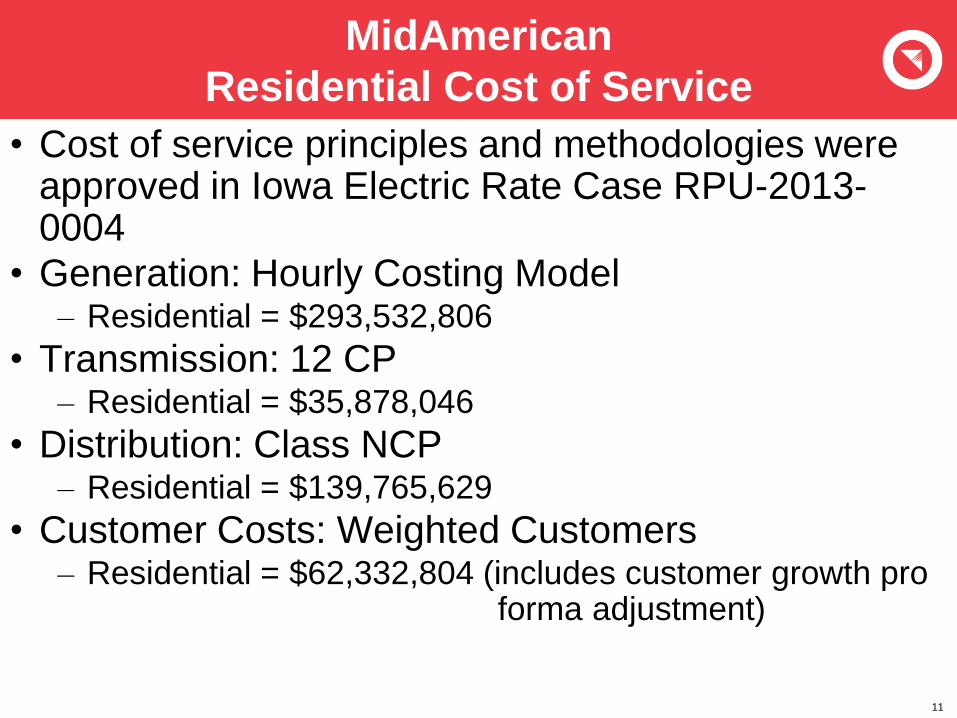
MidAmerican
Residential Cost of Service
• Cost of service principles and methodologies were approved in Iowa Electric Rate Case RPU-2013-0004
• Generation: Hourly Costing Model – Residential = $293,532,806
• Transmission: 12 CP – Residential = $35,878,046
• Distribution: Class NCP – Residential = $139,765,629
• Customer Costs: Weighted Customers – Residential = $62,332,804 (includes customer growth pro
forma adjustment)
11
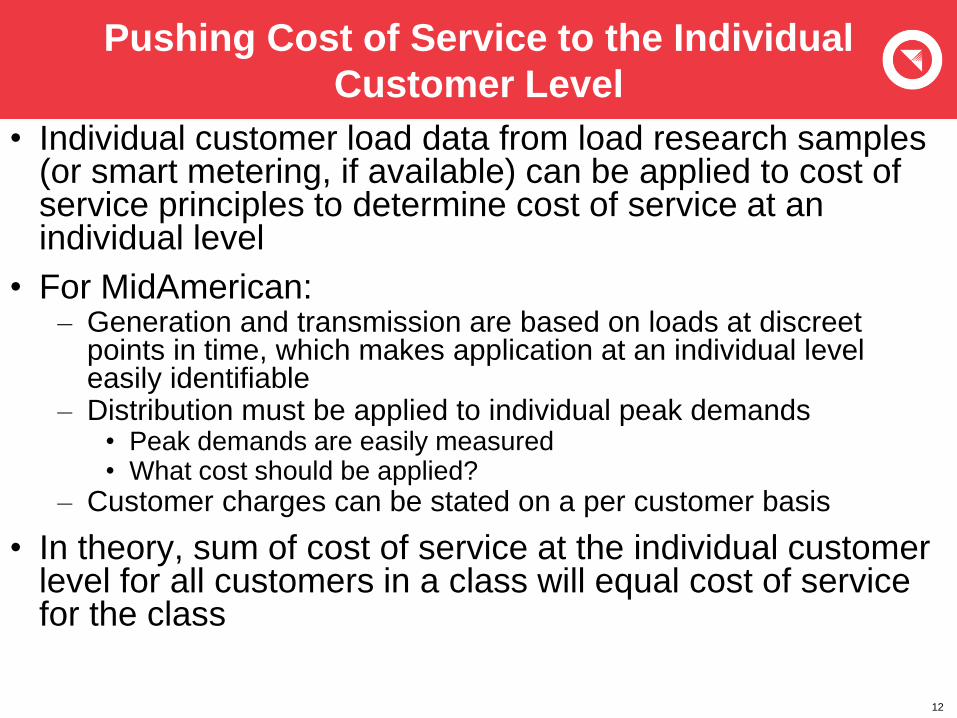
Pushing Cost of Service to the Individual
Customer Level
• Individual customer load data from load research samples (or smart metering, if available) can be applied to cost of service principles to determine cost of service at an individual level
• For MidAmerican: – Generation and transmission are based on loads at discreet
points in time, which makes application at an individual level easily identifiable
– Distribution must be applied to individual peak demands • Peak demands are easily measured • What cost should be applied?
– Customer charges can be stated on a per customer basis
• In theory, sum of cost of service at the individual customer level for all customers in a class will equal cost of service for the class
12

Individual Cost of Service Components
• The information listed below is everything that is needed to determine cost of service for an individual residential customer based on MidAmerican’s approved cost of service methodology.
• Generation: – Hourly loads multiplied by Hourly Costing Model prices
• Transmission: – Total Cost = $35,878,046 – Total residential class load at the time of monthly system peak = 13,361,000 kW
– $35,878,406 divided by 13,361,000 = $2.69/kw applied to each individual customer’s load at
the time of monthly system peak
• Distribution: – Total Cost = $139,765,629 – Average residential customer annual load factor is 16.31%
– Based on total sales, estimated class maximum diversified demand = 3,956,150 kW
– $139,765,629 divided by 3,956,150 = $35.33/kW applied to each individual customer’s
annual peak demand
• Customer Costs: – Total Cost = $62,332,804 (includes customer growth pro forma adjustment) – Total Customers = 553,442 – Average cost per customer is $112.63 per year
13
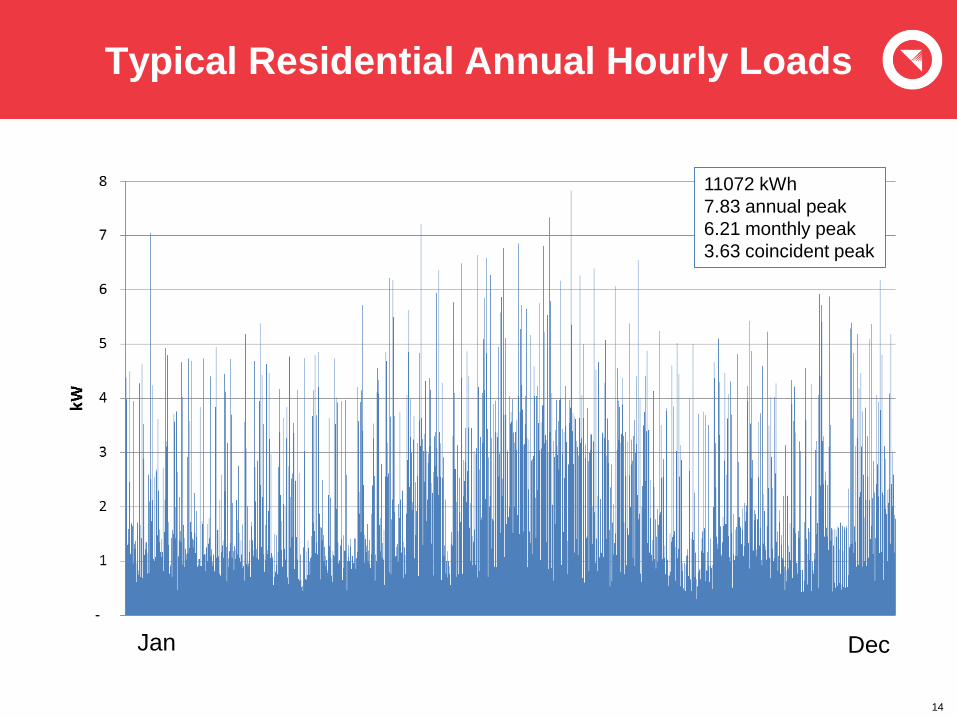
Typical Residential Annual Hourly Loads
14
Jan Dec
11072 kWh
7.83 annual peak
6.21 monthly peak
3.63 coincident peak

Typical Residential Annual Hourly Loads
100% Solar Net Metered
15
Jan Dec
0 net kWh
13140 total kWh (119%)
7.48 annual peak (96%)
5.92 monthly peak (95%)
-0.29 coincident peak (-8%)

y = 1.0642x - 54.964 R² = 0.9332
$-
$500
$1,000
$1,500
$2,000
$2,500
$- $500 $1,000 $1,500 $2,000 $2,500
An
nu
al R
eve
nu
e
Cost of Service
Normal Usage
y = 0.545x + 63.989 R² = 0.6259
$-
$200
$400
$600
$800
$1,000
$- $200 $400 $600 $800 $1,000
An
nu
al R
eve
nu
e
Cost of Service
DG/NEM
16
Standard Residential Two-Part Price Structure
Comparison of Revenue to Cost

y = 1.0161x - 21.632 R² = 0.9688
$-
$500
$1,000
$1,500
$2,000
$2,500
$- $500 $1,000 $1,500 $2,000 $2,500
An
nu
al R
eve
nu
e
Cost of Service
Normal Usage
y = 0.9262x + 29.602 R² = 0.8262
$-
$200
$400
$600
$800
$1,000
$- $200 $400 $600 $800 $1,000
An
nu
al R
eve
nu
e
Cost of Service
DG/NEM
17
Residential Three-Part Price Structure
Comparison of Revenue to Cost