Embed Size (px)
Citation preview

Prepared by:Scott R. Reeves
Advanced Resources International, Inc.Houston, TX
February 23, 2007Tokyo, Japan
Reservoir Simulation Modeling of the Yubari CO2-ECBM/Sequestration Pilot, Ishikari Basin, Japan

2
JCOAL Yubari SP022307
Presentation Outline
•• Pilot DescriptionPilot Description•• Model DevelopmentModel Development•• HistoryHistory--MatchingMatching•• Conclusions/RecommendationsConclusions/Recommendations

3
JCOAL Yubari SP022307
Location/Geology
●YUBARI●YUBARI
FaultsFaults
Test Site

4
JCOAL Yubari SP022307
Summary of Reservoir Data Provided
Parameter Value RemarksDepth: 890 m @ IW1Thickness: 5.66 mFormation Dip: 25 degreesInitial Average Reservoir Pressure 10.2 MPa @ IW1Reservoir Temperature: 29.5 oCCleat Interval 7.5 mmInitial Water Saturation: 100%Initial Absolute Permeability: 1 mdRelative Permability LinearGas Content (in-situ) 22.2 cm3/g oversaturatedDry, Ash-Free Langmuir Volume CH4 28 ml/grDry, Ash-Free Langmuir Volume CO2 44 ml/grDry, Ash-Free Langmuir Volume N2 9.3 ml/grAsh& Moisture Content 8.4%In-Situ Coal Density 1.34 g/ccLangmuir Pressure CH4 1.785 MPaLangmuir Pressure CO2 0.972 MPaLangmuir Pressure N2 6.825 MPaSorption Time Constant CH4 5.0 daysSorption Time Constant CO2 2.5 daysInitial Free Gas Composition 97.4% CH4; 2.0% CO2; 0.6% N2

5
JCOAL Yubari SP022307
Illustration of Isotherms
0.00
5.00
10.00
15.00
20.00
25.00
30.00
35.00
40.00
45.00
- 2,000 4,000 6,000 8,000 10,000 12,000 14,000 16,000
Pressure, kPa
Gas
Con
tent
, m3/
tonn
e
MethaneCarbon DioxideNitrogen

6
JCOAL Yubari SP022307
Simulation Model Description
67m
N
25˚ dip
20 x 27 x 3 (1,620 gridblocks)

7
JCOAL Yubari SP022307
Injection/Production/Pressure History
Bot
tom
hole
Pre
ssur
ePr
oduc
tion/
Inje
ctio
n
Production Well Injection WellINJECTION BHP
0
2000
4000
6000
8000
10000
12000
14000
16000
18000
0 100 200 300 400 500 600 700 800
Time (Days)
BH
P kP
a
PRODUCTION BHP
0
1000
2000
3000
4000
5000
6000
7000
8000
9000
0 100 200 300 400 500 600 700 800Time (days)
BH
P (K
pa)
Injecting Well Production/Injection History
0
500
1000
1500
2000
2500
3000
3500
4000
0 100 200 300 400 500 600 700 800Time (Days)
Rat
e, m
3/d
Water Production (converted injector)CO2 Injection RateGas Production rateN2 Injection Rate
GAS AND WATER PRODUCTION RATES
0
100
200
300
400
500
600
700
800
0 100 200 300 400 500 600 700 800
Time (Days)
Gas
pro
duct
ion
Rat
e (m
3/d)
0
1
2
3
4
5
6
7
8
9
Wat
er p
rodu
ctio
n ra
te (m
3/d)

8
JCOAL Yubari SP022307
Well Control and Match Parameters
IW-1PW-1
Bottomhole Pressure (1000)Bottomhole Pressure (1.0)
Water Production Rate (0.1)Water Production Rate (1.0)Match Parameters(weight factors)
Gas Production Rate (1000)Gas Injection Rate (1.0)
Gas Production Rate (1000)
Gas Production/Injection RateGas Production RateWell Control

9
JCOAL Yubari SP022307
Genetically Optimized History Matching (GenOHM) ProcedureWorkflow
Error Function Calculation
Case Definition • Reservoir characterization • Model construction • Ranges selected for uncertain
parameters
ClearVu1 variable selections generated.
COMET32 input file created.
COMET3 run.
Error functions computed.
Acceptable Match?
Finish
# in
tera
tions
/bat
ch
1 NuTech Solutions 2 Advanced Resources International
No
Yes

10
JCOAL Yubari SP022307
Fixed Model InputsParameter Value Units Source
Depth 890 m YubariThickness 5.4 m YubariDip 25 Degrees YubariInitial Pressure 10.3 MPa YubariReservoir Temperature 29.5 °C Yubari
Dry, Ash-Free Langmuir Volume CH4 28 ml/g YubariDry, Ash-Free Langmuir Volume CO2 44 ml/g YubariDry, Ash-Free Langmuir Volume N2 9.25 ml/g YubariLangmuir Pressure CH4 1.785 MPa YubariLangmuir Pressure CO2 0.972 MPa YubariLangmuir Pressure N2 6.825 MPa YubariSorption Time Constant CH4 5.00 Days YubariSorption Time Constant CO2 2.50 Days YubariSorption Time Constant N2 7.50 Days assumedAsh& Moisture Content 8.37 % YubariDensity 1.34 g/cc Yubari
Permeability Exponent 3 - assumed
Krw max 1 - assumedSgr 0 - assumed
Formation Properties
Sorption Properties
Relative Permeability Relationships
Permeability Relationships
11
JCOAL Yubari SP022307
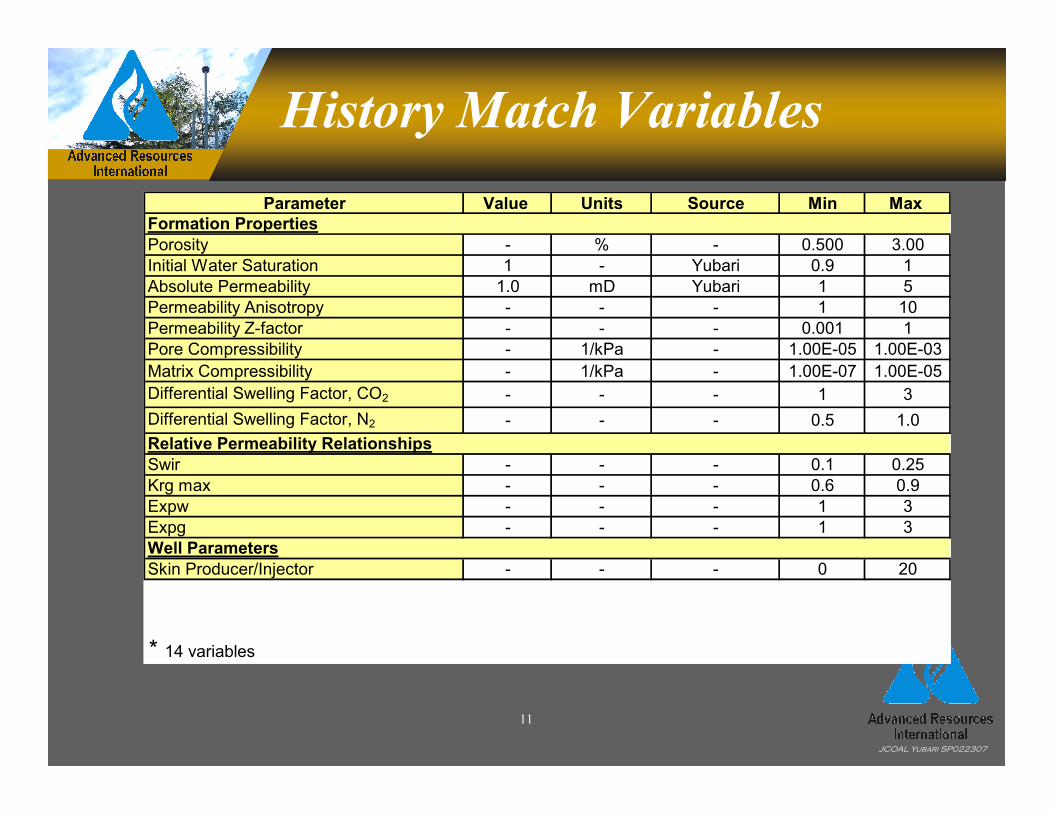
History Match VariablesParameter Value Units Source Min Max
Formation PropertiesPorosity - % - 0.500 3.00Initial Water Saturation 1 - Yubari 0.9 1Absolute Permeability 1.0 mD Yubari 1 5Permeability Anisotropy - - - 1 10Permeability Z-factor - - - 0.001 1Pore Compressibility - 1/kPa - 1.00E-05 1.00E-03Matrix Compressibility - 1/kPa - 1.00E-07 1.00E-05Differential Swelling Factor, CO2 - - - 1 3Differential Swelling Factor, N2 - - - 0.5 1.0Relative Permeability RelationshipsSwir - - - 0.1 0.25Krg max - - - 0.6 0.9Expw - - - 1 3Expg - - - 1 3Well ParametersSkin Producer/Injector - - - 0 20
* 14 variables
12
JCOAL Yubari SP022307
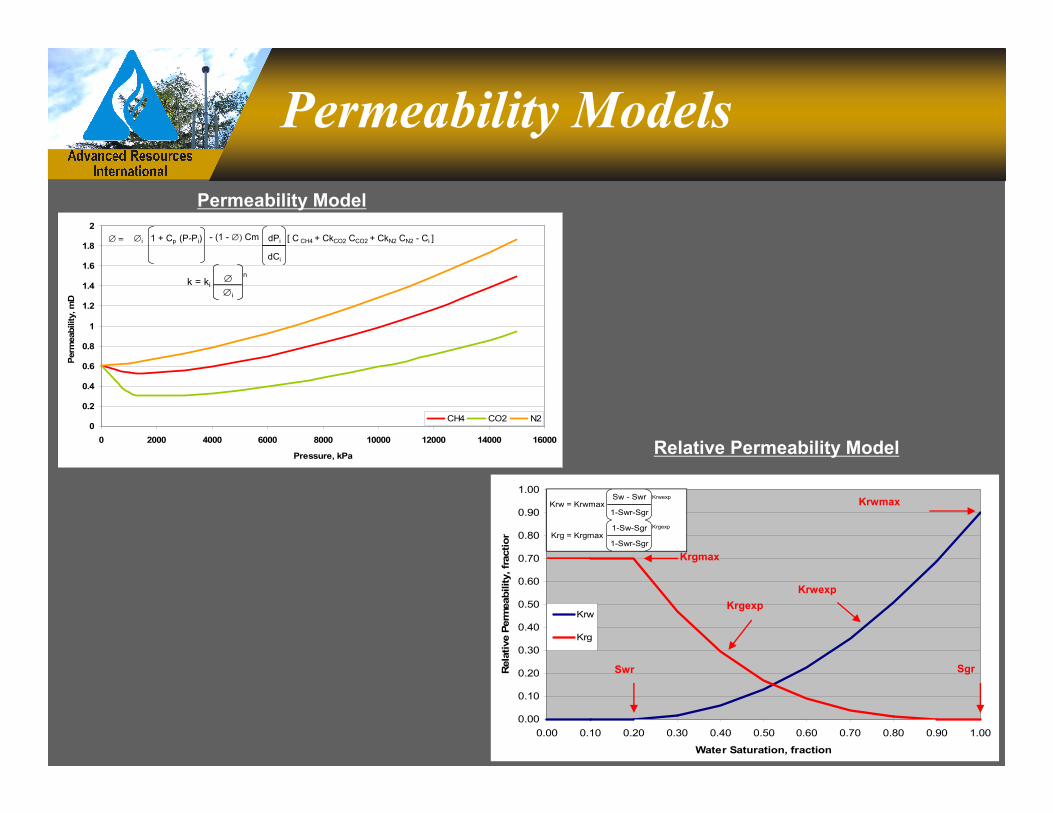
Permeability Models
Relative Permeability Model
Permeability Model
0.00
0.10
0.20
0.30
0.40
0.50
0.60
0.70
0.80
0.90
1.00
0.00 0.10 0.20 0.30 0.40 0.50 0.60 0.70 0.80 0.90 1.00
Water Saturation, fraction
Rel
ativ
e Pe
rmea
bilit
y, fr
actio
n
Krw
Krg
Sw - Swr Krwexp
1-Swr-Sgr
1-Sw-Sgr Krgexp
1-Swr-Sgr
Krw = Krwmax
Krg = Krgmax
Krgmax
Krgexp
Swr
Krwexp
Krwmax
Sgr
0
0.2
0.4
0.6
0.8
1
1.2
1.4
1.6
1.8
2
0 2000 4000 6000 8000 10000 12000 14000 16000
Pressure, kPa
Perm
eabi
lity,
mD
CH4 CO2 N2
∅ n
∅i
k = ki
∅ = ∅i 1 + Cp (P-Pi) - (1 - ∅) Cm dPi [ C CH4 + CkCO2 CCO2 + CkN2 CN2 - Ci ]
dCi

13
JCOAL Yubari SP022307
Variable Convergence*
* Not from final history-match case
Permeability Anisotropy Convergence
0
1
2
3
4
5
6
7
8
9
0 50 100 150 200 250 300 350 400 450 500
Number of Runs
Perm
eabi
lity
Ani
sotr
opy
Valu
e
Differential Swelling Factor, N2
0
0.1
0.2
0.3
0.4
0.5
0.6
0.7
0.8
0.9
1
0 50 100 150 200 250 300 350 400 450 500
Number of Runs
Diff
eren
tial S
wel
ling
Fact
or V
alue
Irreducible Water Saturation Convergence
0
0.05
0.1
0.15
0.2
0.25
0.3
0 50 100 150 200 250 300 350 400 450 500
Number of Runs
Irred
ucib
le W
ater
Sat
urat
ion
valu
e
Differential Swelling Factor, CO2
0
0.5
1
1.5
2
2.5
0 50 100 150 200 250 300 350 400 450 500
Number of Runs
Diff
eren
tial S
wel
ling
Fact
or V
alue

14
JCOAL Yubari SP022307
Error Function Reduction*PRODUCER: BOTTOMHOLE PRESSURE ERROR FUNCTION
1
10
0 50 100 150 200 250 300 350 400 450 500Number of Runs
Erro
r Fun
ctio
n Va
lue
.
TOTAL ERROR FUNCTION
1
10
100
1000
10000
100000
0 50 100 150 200 250 300 350 400 450 500Number of Runs
Erro
r Fun
ctio
n Va
lue
PRODUCER: WATER PRODUCTION RATE ERROR FUNCTION
0.1
1
0 50 100 150 200 250 300 350 400 450 500Number of Runs
Erro
r Fun
ctio
n Va
lue
.
* Not from final history-match case
INJECTOR: BOTTOMHOLE PRESSURE ERROR FUNCTION
0.1
1
10
100
0 50 100 150 200 250 300 350 400 450 500Number of Runs
Erro
r FU
nctio
n Va
lue

15
JCOAL Yubari SP022307
Final Match: PW-1
BOTTOMHOLE PRESSURE
0
2000
4000
6000
8000
10000
12000
0 100 200 300 400 500 600 700 800Simulation Days .
Pres
sure
, kPa
.
ActualSimulated
GAS PRODUCTION RATE
-100
0
100
200
300
400
500
600
700
800
0 100 200 300 400 500 600 700 800
Simulation Days .
Rat
e, m
3/d
.
ActualSimulated
WATER PRODUCTION RATE
0
1
2
3
4
5
6
7
8
9
0 100 200 300 400 500 600 700 800Simulation Days .
Rat
e, m
3/d
.
ActualSimulated
16
JCOAL Yubari SP022307
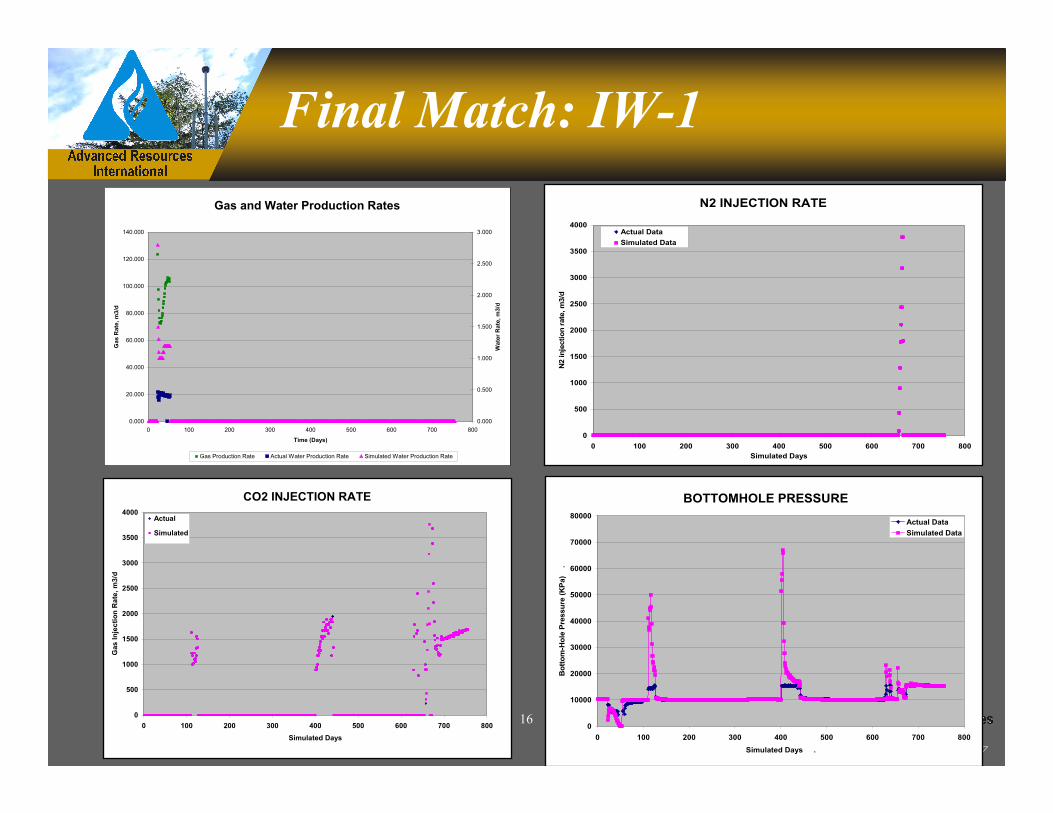
Final Match: IW-1
CO2 INJECTION RATE
0
500
1000
1500
2000
2500
3000
3500
4000
0 100 200 300 400 500 600 700 800Simulated Days
Gas
Inje
ctio
n R
ate,
m3/
d
Actual
Simulated
BOTTOMHOLE PRESSURE
0
10000
20000
30000
40000
50000
60000
70000
80000
0 100 200 300 400 500 600 700 800Simulated Days .
Bot
tom
-Hol
e Pr
essu
re (K
Pa)
.
Actual DataSimulated Data
Gas and Water Production Rates
0.000
20.000
40.000
60.000
80.000
100.000
120.000
140.000
0 100 200 300 400 500 600 700 800
Time (Days)
Gas
Rat
e, m
3/d
0.000
0.500
1.000
1.500
2.000
2.500
3.000
Wat
er R
ate,
m3/
d
Gas Production Rate Actual Water Production Rate Simulated Water Production Rate
N2 INJECTION RATE
0
500
1000
1500
2000
2500
3000
3500
4000
0 100 200 300 400 500 600 700 800Simulated Days
N2
inje
ctio
n ra
te, m
3/d
Actual DataSimulated Data

17
JCOAL Yubari SP022307
Illustration of Gas-Movement
0
100
200
300
400
500
600
700
0 100 200 300 400 500 600 700 800Simulation Days .
Rat
e, m
3/d
.
0
20
40
60
80
100
120CH4N2CO2
Detailed Gas Production
0
100
200
300
400
500
600
700
640 645 650 655 660 665 670 675 680
Time (Days)
CH
4 G
as P
rodu
ctio
n R
ate,
m3/
d
0
20
40
60
80
100
120
N2
and
CO
2 Pr
oduc
tion
Rat
e, m
3/d
ch4 n2 co2
Note: N2 observed at producer well (in field) one day after injection ceased, or 10 days after injection began.

18
JCOAL Yubari SP022307
Final History Match VariablesParameter Value Units Source Min Max Optimized
Formation PropertiesPorosity - % - 0.500 3.00 2.17Initial Water Saturation 1 - Yubari 0.9 1 0.95Absolute Permeability 1.0 mD Yubari 1 5 2.02Permeability Anisotropy - - - 1 10 8.55Permeability Z-factor - - - 0.001 1 0.087Pore Compressibility - 1/kPa - 1.00E-05 1.00E-03 2.86E-04Matrix Compressibility - 1/kPa - 1.00E-07 1.00E-05 6.39E-07Differential Swelling Factor, CO2 - - - 1 3 1.65Differential Swelling Factor, N2 - - - 0.5 1.0 0.84Relative Permeability RelationshipsSwir - - - 0.1 0.25 0.15Krg max - - - 0.6 0.9 0.62Expw - - - 1 3 1.28Expg - - - 1 3 1.6Well ParametersSkin Producer/Injector - - - 0 20 8.9

19
JCOAL Yubari SP022307
History-Match Permeability Models
Absolute PermeabilityAbsolute Permeability Relative PermeabilityRelative Permeability
0
1
2
3
4
5
6
0 2000 4000 6000 8000 10000 12000 14000 16000
Pressure, kPa .
Perm
eabi
lity,
mD
CH4 CO2 N2
0.00
0.10
0.20
0.30
0.40
0.50
0.60
0.70
0.80
0.90
1.00
0.00 0.10 0.20 0.30 0.40 0.50 0.60 0.70 0.80 0.90 1.00
Water Saturation, fractionR
elat
ive
Per
mea
bilit
y, fr
actio
n
Krw
Krg

20
JCOAL Yubari SP022307
Effect of N2 Injection on Permeability
Permeability distribution on last day of N2 injection.

21
JCOAL Yubari SP022307
Conclusions
•• Representative model of Representative model of YubariYubari reservoir reservoir conditions constructed; successful historyconditions constructed; successful history--match of match of ECBM performance achieved.ECBM performance achieved.
•• Results indicate:Results indicate:–– ~2 ~2 mdmd permeabilitypermeability–– ~2% porosity~2% porosity–– ~0.95 initial water saturation~0.95 initial water saturation–– ~9:1 permeability anisotropy~9:1 permeability anisotropy–– ~+9 skin damage~+9 skin damage
•• NN22 –– injection appears to improve permeability and injection appears to improve permeability and injectivityinjectivity..

JCOAL Yubari SP022307
Office Locations
Washington, DC4501 Fairfax Drive, Suite 910Arlington, VA 22203Phone: (703) 528-8420Fax: (703) 528-0439
Houston, Texas11490 Westheimer Rd, Suite 520Houston, TX 77077Phone: (281) 558-9200Fax: (281) 558-9202
AdvancedResources
Internationalwww.adv-res.com