Embed Size (px)
Citation preview

Master Thesis, Department of Geosciences
Reservoir quality preserving
processes in Lower Jurassic
Cook Formation of Veslefrikk
area (Rigel prospect)
A petrophysical, sedimentological and petrographical
perspective
Syed Moiz Hasnain


Reservoir quality preserving processes
in Lower Jurassic Cook Formation of
Veslefrikk area (Rigel prospect)
A petrophysical, sedimentological and petrographical perspective
Syed Moiz Hasnain
Master Thesis in Geosciences
Discipline: Sedimentology
Department of Geosciences
Faculty of Mathematics and Natural Sciences
University of Oslo
15.06.2015

© Syed Moiz Hasnain, 2015
Supervisors: Jens Jahren (UiO) and Richard Olstad (Tullow Oil)
This work is published digitally through DUO – Digitale Utgivelser ved UiO
http://www.duo.uio.no
It is also catalogued in BIBSYS (http://www.bibsys.no/english)
All rights reserved. No part of this publication may be reproduced or transmitted, in any form or by any means,
without permission.

III
Acknowledgement
Thanks to Almighty ALLAH, the most Beneficent, the most Merciful.
First of all, I would like to thank my Supervisor Associate Professor Jens Jahren for his
support, guidance and pleasant mood during this thesis. Thanks to Knut Bjørlykke and other
teachers of the Geoscience Department and all the class fellows who will always remain in
my affable memories. Thanks to Richard Olstad and Tullow Oil Norge AS for financing and
organizing this study.
Thanks to Berit Løken for patience and guidance during long, cold days in SEM lab. Thanks
to Kjemi, Beyene Girma Haile and Maarten Aerts for valuable discussions. Special thanks to
Ásta Soffía for all the motivation, proofreading of this thesis and valuable feedback.
Special thanks to Saadullah Nisar, Uzair Naqvi, Asad Khan Khattak, Tauqeer Ahmed Saadi,
and Abduljabbar for making this duration of study amazing and memorable.
Thanks to the most important people in my life and to whom I owe everything, my parents, I
thank you for everything that I have now and for everything that I will achieve in the future.
Thank you Ammi, Abbu, Yousra, Nabeel, Ebtehaj, Wahaj, and Abdullah for your love and
positive expectations.
June 2015, Oslo
Syed Moiz Hasnain

IV
Abstract
Lower Jurassic Cook Formation is an important hydrocarbon reservoir in northern North Sea
due to its anomalously high porosity at depths around 3000 meters. This study presents
information about the depositional environment, petrographic and petrophysical properties,
and reservoir quality of Cook Formation in Oseberg and Veslefrikk area.
Reservoirs of Brent and Dunlin groups have been studied by examination of cores from three
wells. Reservoir intervals are studied by electrical logs, sedimentological core description,
quantitative bulk and clay XRD analysis, optical point counting and SEM analysis. The main
goal has been to study the relation between depositional environment, diagenesis, quartz
cementation and formation of chlorite precursor.
The Cook Formation consists of several depositional settings because of its extensive lateral
distribution. In Veslefrikk area it has been interpreted as prograding delta deposit, while in
Oseberg are, it is observed as upper shoreface deposit. Sandstones in Cook Formation have
overall quartz dominant mineralogy with some carbonate cemented intervals. Kaolinite,
chlorite and illite are major clay minerals found.
Well developed and extensive chlorite grain coats were observed in Veslefrikk area causing
quartz inhibition and porosity preservation. Reservoir quality of Cook Formation is moderate
to good in Veslefrikk area. In Oseberg area, sandstones are observed to be more porous and
cleaner indicating good reservoir quality.
The formation of iron-rich clay precursor in Veslefrikk area has been suggested mainly by
mechanical infiltration of clay suspensions and by minor possible contribution from
bioturbation. Chlorite coating or precursor was not observed in Oseberg area, possibly due to
the erosion during reworking.
Prediction of chlorite coating in deeply buried reservoirs is difficult. If the relation between
depositional environment and formation of chlorite precursor is understood, then prediction
and mapping of chlorite coatings in intermediate to deeply buried reservoirs can become
possible.

V
Table of Contents
1. Introduction ..................................................................................................................... 1
1.1 Introduction ................................................................................................................. 2
1.2 Methodology and purpose ........................................................................................... 3
1.3 The Study Area............................................................................................................ 4
2. Geological setting of the area ......................................................................................... 5
2.1 Stratigraphy ................................................................................................................. 8
2.2 Cook Formation......................................................................................................... 10
2.3 Depositional environments of Cook Formation ........................................................ 10
3. Processes effecting reservoir characteristics ................................................................. 13
3.1 Introduction ............................................................................................................... 14
3.2 Near surface diagenesis ............................................................................................. 14
3.3 Mechanical compaction............................................................................................. 15
3.4 Chemical compaction ................................................................................................ 15
4. Porosity preserving processes ....................................................................................... 17
4.1 Introduction ............................................................................................................... 18
4.2 Authigenic Chlorite ................................................................................................... 18
4.3 Illite or Illite/Chlorite Coatings ................................................................................. 20
4.4 Micro-Quartz ............................................................................................................. 20
4.5 Hydrocarbon emplacement ....................................................................................... 21
5. Methodology ................................................................................................................. 23
5.1 Introduction ............................................................................................................... 24
5.2 Petrographic analysis................................................................................................. 24
5.2.1 Point counting and Grain size analysis .............................................................. 24
5.2.2 Scanning Electron Microscope (SEM) .............................................................. 24
5.2.3 XRD Analysis .................................................................................................... 25
5.2.4 Limitations of petrographic analysis .................................................................. 25
5.3 Petrophysical analysis ............................................................................................... 26
5.3.1 Well correlation and interpretation of well logs ................................................ 26
5.3.2 Cross plotting and histogram ............................................................................. 26

VI
5.3.3 Limitations of petrophysical evaluation............................................................. 26
5.4 Core description ........................................................................................................ 26
6. Petrophysical results ..................................................................................................... 27
6.1 Well correlation and producing formations .............................................................. 28
6.1.1 Well 30/3-4 ........................................................................................................ 28
6.1.2 Well 30/3-5S ...................................................................................................... 29
6.1.3 Well 30/6-17A ................................................................................................... 29
6.2 Petrophysical properties ............................................................................................ 29
7. Sedimentological analysis and results .......................................................................... 35
7.1 Introduction ............................................................................................................... 36
7.2 Facies analysis of Cook Formation ........................................................................... 36
7.3 Facies association ...................................................................................................... 40
7.3.1 Tidal channel deposits (B1/C1/C2) .................................................................... 40
7.3.2 Shoreface sandstones (A1/A2) ........................................................................... 40
7.3.3 Mouth bar deposits (B2) .................................................................................... 41
7.3.4 Tidal Sand flat (B3) ........................................................................................... 41
7.3.5 Tidal mud flat (B4) ............................................................................................ 41
8. Petrographic results ....................................................................................................... 43
8.1 Introduction ............................................................................................................... 44
8.2 Texture and composition ........................................................................................... 44
8.3 Grain size and Sorting ............................................................................................... 46
8.4 Intergranular volume ................................................................................................. 54
8.5 SEM Petrography ...................................................................................................... 58
9. Discussion ..................................................................................................................... 67
9.1 Introduction ............................................................................................................... 68
9.2 Depositional environment of Cook Formation.......................................................... 68
9.3 Petrography ............................................................................................................... 69
9.3.1 Porosity observations ......................................................................................... 70
9.3.2 Grain size ........................................................................................................... 71
9.4 Mineralogy ................................................................................................................ 72

VII
9.5 Clay mineralogy ........................................................................................................ 72
9.5.1 Chlorite .............................................................................................................. 72
9.5.2 Kaolinite ............................................................................................................. 76
9.5.3 Illite .................................................................................................................... 77
9.6 Cook Formation as a reservoir .................................................................................. 77
9.6.1 Depositional environment .................................................................................. 77
9.6.2 Mechanical compaction ..................................................................................... 78
9.6.3 Diagenetic processes .......................................................................................... 79
10. Conclusions ................................................................................................................... 81
11. References ..................................................................................................................... 83
12. Appendices .................................................................................................................... 91
Appendix A: Sedimentological logs .................................................................................... 92
Appendix B: Chlorite composition and TVD for samples from well 30/3-5S .................... 94


1
1. Introduction

1. Introduction
2
1.1 Introduction
This thesis is a part of collaboration between University of Oslo and Tullow Oil Norge
AS. The aim of this report is to improve the understanding and prediction of reservoir quality
in deep Jurassic sandstones in Veslefrikk area of northern North Sea.
Highly porous and permeable sandstones at depths between 2000 to 4000 metres below
sea floor are considered significantly important for hydrocarbon exploration. Such sandstones
have proved to be very good reservoirs worldwide. Sandstones are not always easy for
exploration until their properties as a reservoir rock are fully understood.
A subsurface rock having effective porosity and permeability to produce commercially
feasible quantities of petroleum is considered a 'Reservoir'. Reservoir characterization is a
process in which the quality of reservoir is determined by utilizing various geological
methods. For a quality reservoir, porosity and permeability are the properties of prime
importance. Porosity is interstitial void space in the rock and permeability is the property of
rock which determines the ease to fluid flow. Porosity plays its part in storing the fluid and
permeability plays its role in transmitting the fluid through the rock in response to applied
pressure. Capillary pressure is another property which can be defined as the attraction
between the surfaces of solids and liquids in a rock, resulting in the resistance to flow of fluid
(Slatt, 2013).
The amount of porosity and permeability varies significantly depending upon the
mineralogical composition of rock, grain size, depositional environment, and post deposition
conditions which includes depth of burial, compaction, and temperature. Compaction is a
porosity reducing phenomenon which takes place in two ways i.e. mechanical and chemical
(which includes quartz cementation) (Bjørlykke and Jahren, 2010). Mechanical compaction
takes place simply due to the burden of overlying rocks. In mechanical compaction brittle
grains are broken in small fragments and adjacent pore spaces are occupied by these broken
pieces. After sometime, grains find more contact points and achieve a more robust setting
making the rock harder for further mechanical compaction.

Moiz Hasnain
3
Chemical compaction resulted by quartz cementation is considered the most common
phenomenon for porosity reduction. Sandstone reservoirs located deeper than 2 kilometres in
sedimentary basins with normal geothermal gradients are affected by quartz cementation
(Bjørlykke and Jahren, 2010).
1.2 Methodology and purpose
The purpose of this study is to improve the understanding of controlling factors of
chlorite coatings in deep Jurassic sandstones in northern North Sea. This will help in
prediction of the reservoir quality of sandstone in Veslefrikk area. A total of 328 meters of
cores from two wells in Veslefrikk area (30/3-4 and 30/3-5S) and one well in Oseberg area
(30/6-17A) (Figure 1.1) were selected for study. 28 samples were selected from the study
interval and these samples were studied through point-counting, X-ray diffraction (XRD),
sedimentological core description, and Scanning Electron Microscope (SEM).
Figure 1.1 Location of Study wells in Veslefrikk and Oseberg Area.

1. Introduction
4
1.3 The Study Area
On the eastern side of North Viking graben, Veslefrikk field is situated at blocks 30/3
and 30/6 of Norwegian sector. It is located around 30 km north of Oseberg in Northern part
of North Sea (Figure 1.3).Production licence was awarded in 1979. Originally it contained
54.1 million Sm3 oil and 5.7 billion Sm
3 gas. Reservoir rocks in this area are mostly Jurassic
Sandstones from Dunlin group, Brent group, and Statfjord Formation.
Around 80% of the reserves are contained in Brent group making it the main reservoir.
The depth of reservoirs ranges between 2800 to 3200 meters. Water depth in this area is
about 185 metres. Reservoir quality is variable in places from moderate to excellent.
Production in this field is taking place by the help of pressure support from water alternating
gas injection in Dunlin and Brent reservoirs, whereas with gas injection in Statfjord
Formation (Norwegian Petroleum Directorate, 2014).
Veslefrikk field occurs in Jurassic sandstones. This area consists of normal faults.
Major faulting was ceased by the end of Jurassic. This field is located on the crest of a tilted
horst block (Lundegard, 1994). Oil production is declining from Veslefrikk but gas
production is expected to increase in future (Figure 1.2). New development wells are being
planned and drilling rig has been upgraded (Norwegian Petroleum Directorate, 2014).
Figure 1.2 Production from Veslefrikk oil field
(Norwegian Petroleum Directorate, 2014).
Figure 1.3 Location of Veslefrikk oil field
(Statoil, 2013)

5
2. Geological setting of the area
2. Geological setting of the area
6
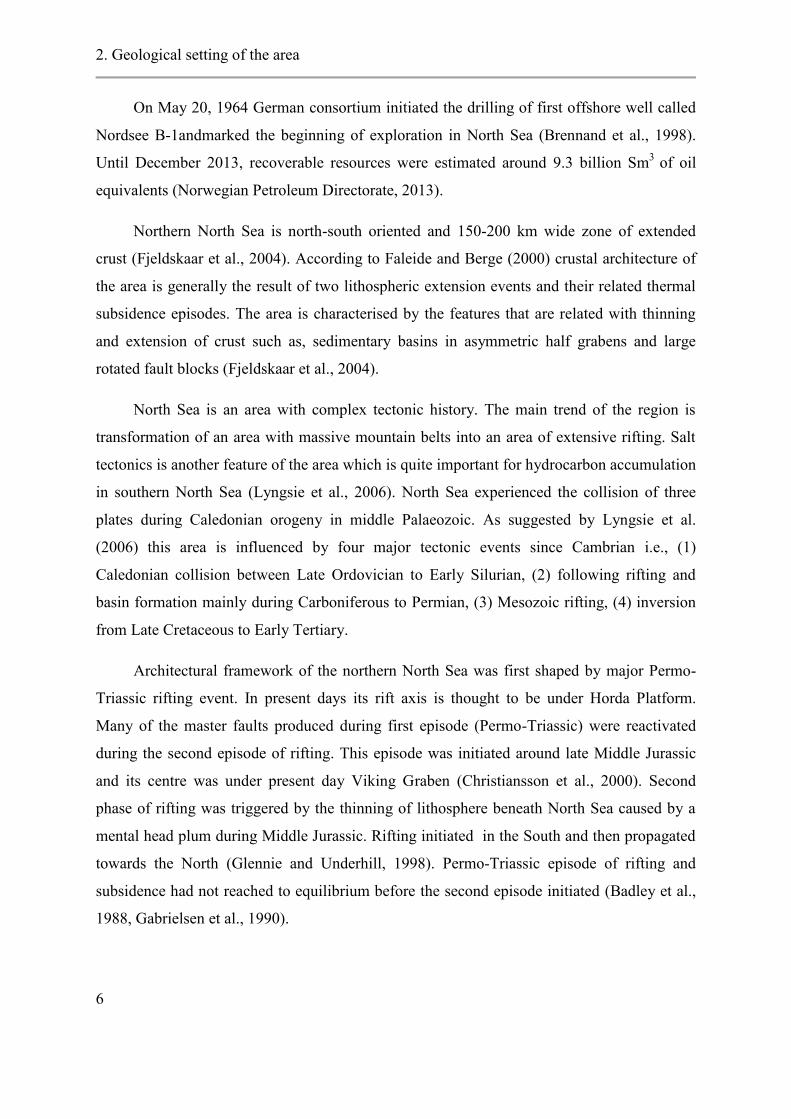
On May 20, 1964 German consortium initiated the drilling of first offshore well called
Nordsee B-1andmarked the beginning of exploration in North Sea (Brennand et al., 1998).
Until December 2013, recoverable resources were estimated around 9.3 billion Sm3
of oil
equivalents (Norwegian Petroleum Directorate, 2013).
Northern North Sea is north-south oriented and 150-200 km wide zone of extended
crust (Fjeldskaar et al., 2004). According to Faleide and Berge (2000) crustal architecture of
the area is generally the result of two lithospheric extension events and their related thermal
subsidence episodes. The area is characterised by the features that are related with thinning
and extension of crust such as, sedimentary basins in asymmetric half grabens and large
rotated fault blocks (Fjeldskaar et al., 2004).
North Sea is an area with complex tectonic history. The main trend of the region is
transformation of an area with massive mountain belts into an area of extensive rifting. Salt
tectonics is another feature of the area which is quite important for hydrocarbon accumulation
in southern North Sea (Lyngsie et al., 2006). North Sea experienced the collision of three
plates during Caledonian orogeny in middle Palaeozoic. As suggested by Lyngsie et al.
(2006) this area is influenced by four major tectonic events since Cambrian i.e., (1)
Caledonian collision between Late Ordovician to Early Silurian, (2) following rifting and
basin formation mainly during Carboniferous to Permian, (3) Mesozoic rifting, (4) inversion
from Late Cretaceous to Early Tertiary.
Architectural framework of the northern North Sea was first shaped by major Permo-
Triassic rifting event. In present days its rift axis is thought to be under Horda Platform.
Many of the master faults produced during first episode (Permo-Triassic) were reactivated
during the second episode of rifting. This episode was initiated around late Middle Jurassic
and its centre was under present day Viking Graben (Christiansson et al., 2000). Second
phase of rifting was triggered by the thinning of lithosphere beneath North Sea caused by a
mental head plum during Middle Jurassic. Rifting initiated in the South and then propagated
towards the North (Glennie and Underhill, 1998). Permo-Triassic episode of rifting and
subsidence had not reached to equilibrium before the second episode initiated (Badley et al.,
1988, Gabrielsen et al., 1990).
Moiz Hasnain
7
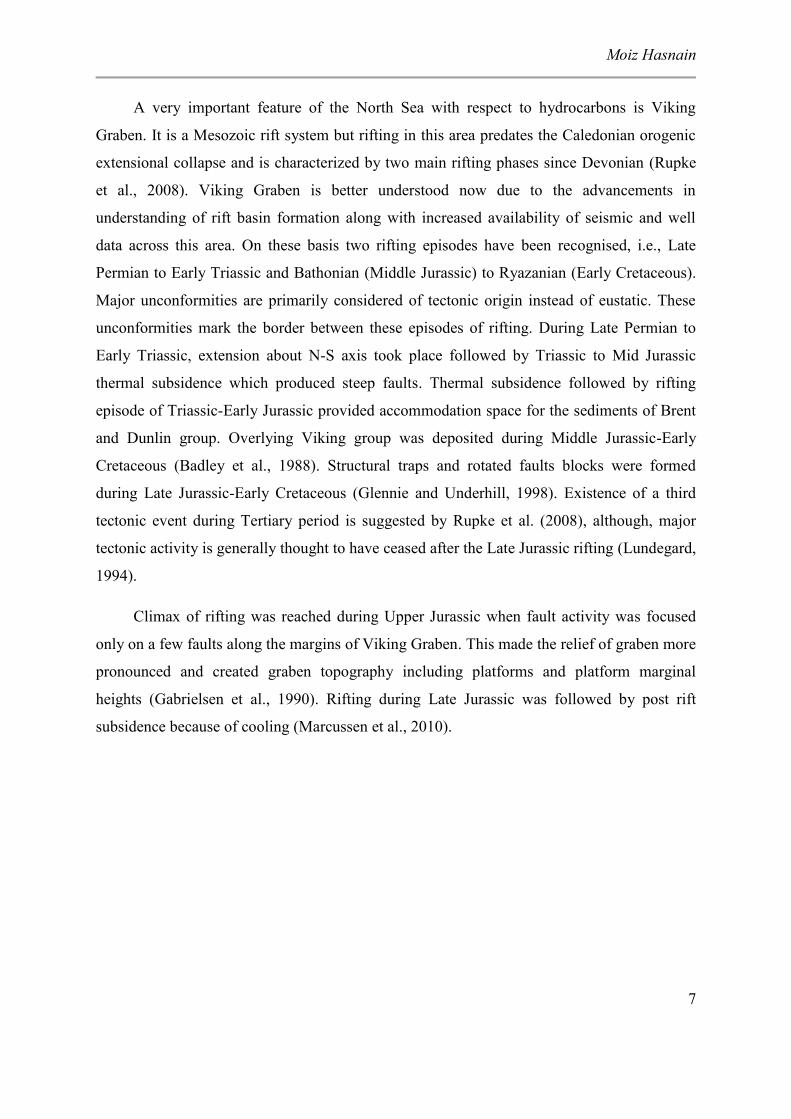
A very important feature of the North Sea with respect to hydrocarbons is Viking
Graben. It is a Mesozoic rift system but rifting in this area predates the Caledonian orogenic
extensional collapse and is characterized by two main rifting phases since Devonian (Rupke
et al., 2008). Viking Graben is better understood now due to the advancements in
understanding of rift basin formation along with increased availability of seismic and well
data across this area. On these basis two rifting episodes have been recognised, i.e., Late
Permian to Early Triassic and Bathonian (Middle Jurassic) to Ryazanian (Early Cretaceous).
Major unconformities are primarily considered of tectonic origin instead of eustatic. These
unconformities mark the border between these episodes of rifting. During Late Permian to
Early Triassic, extension about N-S axis took place followed by Triassic to Mid Jurassic
thermal subsidence which produced steep faults. Thermal subsidence followed by rifting
episode of Triassic-Early Jurassic provided accommodation space for the sediments of Brent
and Dunlin group. Overlying Viking group was deposited during Middle Jurassic-Early
Cretaceous (Badley et al., 1988). Structural traps and rotated faults blocks were formed
during Late Jurassic-Early Cretaceous (Glennie and Underhill, 1998). Existence of a third
tectonic event during Tertiary period is suggested by Rupke et al. (2008), although, major
tectonic activity is generally thought to have ceased after the Late Jurassic rifting (Lundegard,
1994).
Climax of rifting was reached during Upper Jurassic when fault activity was focused
only on a few faults along the margins of Viking Graben. This made the relief of graben more
pronounced and created graben topography including platforms and platform marginal
heights (Gabrielsen et al., 1990). Rifting during Late Jurassic was followed by post rift
subsidence because of cooling (Marcussen et al., 2010).

2. Geological setting of the area
8
Figure 2.1 Structural setting of the North Sea (Muto and Steel, 1997).
2.1 Stratigraphy
Norwegian continental shelf is rich with hydrocarbon reservoirs, around 50% of these
reserves are contained in sediments of Jurassic age. The Jurassic sediments of the North Sea
were deposited in an intraplate tectonic setting. This region was in the south of weakly linked
Greenland, Laurentia, and Fennoscandian shield areas, located in north of Tethyan Ocean.
Tethyan Ocean was going through an active extension around that time. During early
Jurassic, sediments were provided to epeiric sea from shield areas and transient or permanent

Moiz Hasnain
9
land areas. The epeiric sea consisted of complex array of shallow marine shelves separated by
deeper troughs (Underhill, 1998).
Triassic - Jurassic period faced several changes in tectonic, climatic and sea level
changes (Steel, 1993). Non marine Triassic basins transformed into a thoroughly marine
basin due to transgression during Early Jurassic (Ziegler, 1982). Facies of ephemeral fluvial
system changed to alluvial sandstones, shale and coals, related to more humid and developed
river systems. This indicates a Late Triassic - Early Jurassic climate change (from arid to
humid) in North Sea (Roe and Steel, 1985).
Vollset and Doré (1984) summarized the lithostratigraphic nomenclature for Triassic
and Jurassic of Norwegian North Sea. Lower Jurassic of Norwegian North Sea comprises
Statfjord group and Dunlin group, which is underlain by Middle Jurassic Brent group.
The distribution of Lower Jurassic sandstones is dependent upon the accommodation
space, tectonic subsidence and variation in sediment supply. Therefore, it is represented by
repeated retrogradation and progradation (Charnock et al., 2001).
Figure 2.2 Stratigraphic section of Northern North Sea. Red square represent formations
encountered in study area (modified after Norlex (2015)).

2. Geological setting of the area
10
2.2 Cook Formation
Cook Formation is a part of Dunlin group which has formations of age ranging from
Hettagian to Bajocian. In northern North Sea, Dunlin group is subdivided into five formations
i.e. Amundsen (at bottom of the group), Johansen, Burton, Cook, and Drake formations (at
the top of group). Cook Formation (Age: Pliensbachian to Toarcian) is 63.5 meters thick in
type well (UK well 211/29-3 (Shell)) where it is dominantly a marine siltstone with some
silty claystone intercalations of grey colour. These claystones and siltstones contain sandy
streaks which become more prominent in Norwegian waters. Sandstones become dominant
lithology on Horda Platform and its western margin. The sandstones are subangular to
subrounded, greyish brown to white and very fine to fine grained, with occasional thin layers
of coarse to medium grained sandstones. Cook Formation can be distinguished from Drake
(overlying) and Amundsen or Burton (underlying) formations on wireline logs by increase in
sonic velocity and decrease in gamma ray count (Vollset and Doré, 1984).
Cook Formation is only sand dominated interval that extends to Oseberg area and
which occurs in most of northern North Sea areas. Base of Cook Formation (in cores
recovered from Oseberg area) rests on a mudstone bed that covers a thin bed consisting of
calcitic, sideritic, and phosphatic peloids and cements. This calcitic bed is interpreted as
condensed sequence and it makes the top of the Burton Formation (Livbjerg and Mjøs, 1989).
2.3 Depositional environments of Cook Formation
Cook Formation is extensively distributed in northern North Sea and it has been
reported in literature with different depositional environments at different locations. Going
from north to south; in Snorre Field it has been identified as offshore mudstone by Nystuen
and Fält (1995), as well as by Underhill (1998). In Statfjord Field it is classified as marine
shoal sand deposits by Dalrymple (2001). In Gulfaks Field, lower part of Cook Formation
represents offshore to lower shoreface environment on distal parts of a wave influenced shelf,
while its upper part is interpreted as marginal to shallow marine deltaic setting, characterized
by tidal activity (Livbjerg and Mjøs, 1989, Dreyer and Wiig, 1995, Marjanac and Steel, 1997,
Folkestad et al., 2012).

Moiz Hasnain
11
In Oseberg Field, Cook Formation is subdivided into three units i.e. Cook A, Cook B
and Cook C. Cook A was characterised as prograding subtidal sand body. Cook B is
comprised of mud and siltstones with thin lenses of sandstones and it separates Cook A from
Cook C. Cook C unit was deposited as an offshore sand ridge (Livbjerg and Mjøs, 1989). At
Horda platform, Cook Formation is identified as estuarine and marine shoreface sandstone
deposited during lowstand incision, transgression and progradation (Charnock et al., 2001).


13
3. Processes effecting reservoir
characteristics

3. Processes effecting reservoir characteristics
14
3.1 Introduction
The properties of sandstone reservoirs are controlled primarily by mineralogical
composition, texture, grain size, sorting, and diagenesis. Diagenesis starts taking place after
the deposition of sediments and it continues during burial of the rock. Properties of reservoir
rock remain variable throughout the burial and uplift due to the effect of chemical and
mechanical compaction which results in the dissolution and precipitation of minerals.
Bjørlykke and Jahren (2010) suggested following main process of diagenesis:
3.2 Near surface diagenesis
Near surface diagenesis involves the reaction of minerals in sediments with ground
water (fresh or saline depending upon the dry or wet climates). Sands can be cemented by
carbonates near the seafloor. Dissolved solids can be more mobile by fluid flow close to
surface. Sediments are also more vulnerable to chemical change at shallow depths compared
to deep burial. When under saturated meteoric water seeps down into the soil, it dissolves
unstable minerals (mica and feldspar) and precipitates kaolinite (Bjørlykke and Jahren, 2010).
Equation 1
2K (Na) AlSi3O8 + 2H+ + 9H2O → Al2Si205 (OH) 4 + 4H4SiO4 + 2K
+ (2Na
+)
K-Feldspar Kaolinite Dissolved silica
Equation 2
2KAl3Si3O10 (OH)2+ 2H+ + 3H2O →3Al2Si205 (OH)4 + 2K
+
Muscovite Kaolinite cation
Meteoric water dissolves feldspar and mica, precipitates authigenic clay minerals such
as kaolinite. This dissolution produces secondary porosity, while at the same time
precipitation of clay minerals reduces porosity. As the result of this dissolution and
precipitation little gain in porosity is achieved. Kaolinite can also reduce permeability by
filling up the pores. Usually authigenic kaolinite occurs as cluster and oil can flow between
and around kaolinite cemented pores. At greater depths with temperatures around 130°C,
kaolinite can be altered to illite if K+ ions are available in the system. Authigenic illite has a

Moiz Hasnain
15
fibrous form which can damage the reservoir more severely by reducing its permeability
(Bjørlykke and Jahren, 2010).
3.3 Mechanical compaction
During mechanical compaction, close packing of grains, fracturing and grain
deformation take place. These processes increase the mechanical stability of grains. Initially
at shallow depths 0-2 kilometres, well sorted sands can still be loose if not cemented by
carbonate. This is when mechanical compaction plays a very important role. It has been
observed during experimental compaction of loose sand (porosity 40% to 42%) that
mechanical compaction can reduce the porosity from 35% to 25% at 20 to 30 MPa pressure.
This compaction also depends upon grain size and grain strength. This experimental data also
showed that coarse grain sand is more prone to lose porosity than fine grain sand (Chuhan et
al., 2002). It should also be considered that in basins with normal geothermal gradient (80-
100 °C at 2 kilometres) quartz cementation can provide stability to grain framework
preventing mechanical compaction after 2 kilometres depth. Quartz cementation can start
around 4-6 kilometres depth in cold sedimentary basins, until then mechanical compaction
can remain effective resulting in intense grain crushing at pressures around 50 MPa.
Carbonate grains are more ductile under pressure than quartz, due to which grain
contacts are enlarged and overburden stress is distributed to the larger area on each grain
(Shinn and Robbin, 1983). Biogenic carbonate is unstable under redox boundary, it dissolves
and precipitates as cement (Saigal and Bjørlykke, 1987). This cementation makes the rocks
denser and primary velocity increases in such rocks which can be observed in seismic and
electrical logs. Detrital carbonate grains can dissolve in later stages of diagenesis and produce
cement (Morad, 2009).
3.4 Chemical compaction
In basins similar to North Sea, quartz cementation can start around 2-3 kilometres depth
(80-100 °C), strengthening the grain framework of rocks. Poorly sorted and lithic sands lose
their large proportions of porosity at shallower depths (1-2 kilometres). Usually only 2%
quartz cement is sufficient to strengthen the grain framework to prevent further mechanical

3. Processes effecting reservoir characteristics
16
compaction. Once quartz cementation starts, it does not stop until it occupies all the available
pore spaces or the temperature drops down below 70-80 °C. Generally, feldspathic
sandstones and quartz arenites loses porosity by the process of quartz cementation. Amount
of quartz cement is favoured in the basins with slow subsidence rate and high geothermal
gradients (Bjørlykke and Jahren, 2010). An example of quartz cementation can be seen in
Figure 3.1.
Figure 3.1 - Quartz cement overgrowths can be seen in this SEM acquired image (Bjørlykke and Jahren, 2010).

17
4. Porosity preserving processes

4. Porosity preserving processes
18
4.1 Introduction
The history of sandstone diagenesis from shallow to deep burial determines the
reservoir quality. Quartz cementation and mechanical compaction are found to be the most
effective porosity reducing processes. Deeply buried sandstones still show effective porosity
which advocate for porosity preserving processes. There are three porosity preserving process
mentioned in literature (Bloch et al., 2002, Bjørlykke and Jahren, 2010) i.e. grain coating,
fluid over pressure and early hydrocarbon emplacement. The scope of this thesis is limited to
grain coating porosity preserving process.
Grain coating minerals like authigenic chlorite and micro-quartz have been observed
acting as porosity preserving mechanism in various sandstone reservoirs found deeper than 4
kilometres (Ehrenberg, 1993, Aase et al., 1996, Bloch et al., 2002, Chuhan et al., 2002,
Storvoll et al., 2002, Berger et al., 2009, Ajdukiewicz and Lander, 2010, Taylor et al., 2010,
Dowey et al., 2012, Sun et al., 2014).
Heald and Larese (1974) cited in Bloch et al. (2002), comprehensively enlisted
different types of coatings on detrital quartz grains. In addition to chlorite and micro-quartz,
they described the occurrences of carbonate specks rimming quartz grains and iron oxide
coats. Quartz overgrowths are forced by carbonate specks on detrital quartz gains to form
isolated crystals, which is a slower process than continuous overgrowth. On the other hand,
iron oxide coats are not effective in preventing quartz cementation.
4.2 Authigenic Chlorite
Chlorite is most widely found grain coating mineral in worldwide settings e.g., Jurassic
Tilje, Tofte, Statfjord, Garn and Dunlin Formation in North Sea and Haltenbanken area
(Ehrenberg, 1993), the Sawan gas field in Pakistan (Berger et al., 2009), Sichuan Basin in
Western China (Sun et al., 2014) are few examples. Sandstone deposited in a range of
sedimentary environments contains chlorite coatings most commonly in delta related
environments (44%) and secondly in fluvial environments (19%). Iron rich chlorite implies
coastal environment whereas, magnesium rich and iron rich mixed chlorite are found in
marine and terrestrial environments (Dowey et al., 2012).

Moiz Hasnain
19
Precipitation of chlorite requires a source of iron which can be formed in a fluvio-
deltaic setting. As the river water reaches to the mouth, increased salinity causes Fe to
flocculate and deposit in amorphous state which makes it highly reactive. It makes a clay-rich
gel like layer which can form ooids at points of high current energy. Sedimentary facies
architecture and paleo-river discharge pattern in the architecture, determines the geometry of
chlorite distribution (Ehrenberg, 1993). Burrowing organisms produce faecal material which
can form into smectite-rich clays which may further transform into chlorite coatings.
Formation of coatings on quartz grains in early diagenetic stage is essential to preserve
porosity at greater depths (Bjørlykke and Jahren, 2010).
Quartz cementation models suggest that coating is a vital factor in retardation of quartz
overgrowths. Chlorite as a grain coating mineral can reduce the available nucleation area for
overgrowths of quartz (Lander et al., 2008). Variations in porosity of clean sand are usually
correlated with abundance of chlorite grain coating and lack of quartz cementation
(Ehrenberg, 1993). The presence of authigenic chlorite coatings can restrict mechanical
compaction. Inter-crystalline pores in chlorite may contribute to the micro-porosity of
sandstone (Sun et al., 2014).
Figure 4.1 - Needle like structure is chlorite coating over quartz grains (Bjørlykke and Jahren, 2010).

4. Porosity preserving processes
20
4.3 Illite or Illite/Chlorite Coatings
Observations of Storvoll et al. (2002) showed that illite and illite/chlorite coatings can
also be effective in resisting quartz precipitation and preserving porosity. Illite coatings are
generally thick (6 to 8 μm) possibly due to its fibrous and flaky appearance. Presence of illite
can be explained by two mechanisms (1) by the replacement of smectite or (2) by
replacement of kaolinite (Bjørlykke et al., 1992). Illite coatings are expected to be found in
rocks with smectite as clay matrix and/or with high K-feldspar content at the time of
deposition.
4.4 Micro-Quartz
Occurrence of micro-quartz coating is underreported (Aase et al., 1996, Bloch et al.,
2002). These coats are not as prominent as chlorite coats under petrographic examination and
they are sometimes overlooked or mistaken by leaching of detrital quartz grains. Micro-
quartz form coatings on the surface of detrital quartz grains (like chlorite coating) and retards
the pore-filling quartz overgrowths (Bloch et al., 2002). Micro-quartz precipitates at lower
temperature (60-65 °C) than quartz cementation (80-100 °C) (Bjørlykke and Jahren, 2010).
Quartz overgrowth takes place by mergence and/or overlapping of incipient
overgrowths with same crystallographic configuration as underlying detrital quartz grain. The
random orientation of micro-quartz crystals attached to detrital quartz grains interfere with
formation of quartz cement. Micro-quartz may also resist the pressure solution by solidifying
contacts between quartz grains (Bloch et al., 2002).
The presence of siliceous sponge spicules (Rhaxella) controls the distribution of
microcrystalline quartz coatings. Amorphous silica sponge spicules are considered as the
source of cryptocrystalline and microcrystalline quartz. These quartz morphologies proposes
rapid crystallization from locally saturated silica solutions (Aase et al., 1996).
Excess of micro-quartz affects permeability more than porosity. Generally, micro-
quartz aggregates are intergrown with diagenetic, illite forming clusters with micro-porosity
and secondary porosity by dissolution of sponge spicules. Total porosity can be high but

Moiz Hasnain
21
permeability is reduced due to blockage of pore throats by micro-quartz aggregates (Aase et
al., 1996).
4.5 Hydrocarbon emplacement
The effect of hydrocarbon emplacement with quartz cementation is debatable.
Marchand et al. (2002) showed in their study of the Miller and Kingfisher fields in United
Kingdom North Sea, that oil emplacement retarded the rate of quartz cementation in Brae
Formation, due to which porosity was preserved even at the depth of 4 km and temperature
around 120°C. In most of the cases quartz grains are water wet and quartz cementation can
take place on these water wet contacts. Hydrocarbons can be effective in porosity preserving
if quartz grains are oil wet (Walderhaug, 1990).


23
5. Methodology

5. Methodology
24
5.1 Introduction
The focus of this thesis has been on reservoir characterization and processes affecting
reservoir quality. To understand the properties of reservoir, techniques like core description,
analysis of thins sections under optical and scanning electron microscope, and quantitative
mineralogical analysis through XRD was employed. These techniques helped in
understanding the reservoir quality, depositional environment and diagenetic processes.
These methods are of different resolution and measurement errors are possible.
5.2 Petrographic analysis
During this study 28 thin sections and stubs from three wells in Veslefrikk area of
northern North Sea were analyzed. Point counting and textural analysis were performed to
understand the depositional environment and estimating the bulk mineralogical composition.
5.2.1 Point counting and Grain size analysis
Grain size analysis and point counting were done by utilizing optical microscope. A
total of 300 points per thin sections were counted on 28 samples (8,400 points in total). A
Swift automatic counter was used on the turning disc stage of optical microscope and each
thin section was analyzed trough it. The credibility of this analysis depends up on the quality
and polish of thin sections, resolution of microscope and experience of operator who
performed the point count.
Visual scan of whole thin section was acquired to analyze textural features and grain
size measurements were obtained with the help of software ScopeView. Grain size analysis
was performed by measuring 50 grains from each thin section (1400 hundred grains in total).
5.2.2 Scanning Electron Microscope (SEM)
Scanning Electron Microscope (SEM) is powerful equipment which can be used to look
into the pores and identify minute mineral particles and examine their distribution in pores.
The Scanning Electron Microscope type JEOL JSM-6460L V, with LINK INCA Energy 300
(EDS) from Oxford Instruments was utilized with a standard wolfram filament of 15 kV. The

Moiz Hasnain
25
SEM is able to examine rough surfaces at a magnification range from 20X to 200,000X.
Stubs for SEM were made from core pieces by breaking and exposing fresh surfaces. These
rock pieces were then glued to aluminum stubs and then coated with gold to make the surface
electrically conducting. These stubs were analyzed in secondary electron image (SEI) mode
of SEM. Thin sections (carbon coated) were analyzed in backscattered (BEC) mode. The
analysis was performed to observe micro level features such as chlorite coatings, quartz
overgrowths, porefilling clay, dissolved feldspars, and their distribution. Different mineral
were identified by the help of peaks in spectrum obtained through SEM. The SEM petrology
atlas (Welton, 2003) was consulted frequently to match and identify spectra.
5.2.3 XRD Analysis
X-ray powder diffraction (XRD) analysis was performed on 28 rock samples taken
from cores stored at NPD head office, Stavanger. The samples were crushed and micronized
for 12 minutes by McCrone Mill in silicon carbide cylinder filled with 8 ml ethanol, 3 gm
rock powder and agate crushing micronizers. XRD diffractograms were first processed
through Diffrac Eva 4.0 and mineral phases were identified based upon their peak position.
This information was then used for further processing of data by Profex (version 3.5.0) in
BGMN software suit (4.2.22) to calculate proportion of existing mineral phases in each
sample. The results obtained through XRD can be used to compare with point count and SEM
mineralogy.
5.2.4 Limitations of petrographic analysis
Even though petrographic analysis is a powerful tool, it has some limitations:
For a good point count, 300 points are only a rough estimate of overall composition,
moreover, mistaken identity of minerals during thin section analysis and point
counting may occur.
Fine material can be washed away during thin section preparation and polishing
which ultimately may result in overestimation of porosity during point count.
Grain size can be overestimated due to quartz overgrowths and/or cementation. It can
also be underestimated due to because of dissolution of grains.
Preparation of stubs can produce artificial features which can be mistaken as natural
features.

5. Methodology
26
5.3 Petrophysical analysis
5.3.1 Well correlation and interpretation of well logs
Two of the three wells in this study were correlated with the third well 30-3/4 to
understand the vertical and lateral distribution of sand stones. The software Interactive
Petrophysics was used for correlation. Wellbore information was taken from NPD website
(www.npd.no). Formations were correlated by comparing the similar curves (in terms of
shape and magnitude) generated by wireline logs, comparing core photos and well top
information from NPD Factpages. Through the same software, lithology logs and porosity
logs were generated and compared with logs made from cores. Different wells have different
well log sets but caliper, gamma, resistivity and density are common.
5.3.2 Cross plotting and histogram
Cross plots are quite good tool in representing relations between different plotted
quantities. By this method generally, scattered plot is produced which can be used for the
interpretation of hydrocarbon zone, mineralogy, lithology etc. Generally, two types of cross
plots exist i.e. compatible logs like porosity and density to define lithology; cross plots of
incompatible logs like gamma ray and resistivity to quantify fluid content and lithology.
Cross plots used in this study were generated by softwares like Microsoft Excel and
Interactive Petrophysics.
5.3.3 Limitations of petrophysical evaluation
Even though high tech softwares are used, it is still possible to misinterpret logs. If the
information about lithology is incomplete then log interpretation can be difficult or
misleading. To address all those possible uncertainties cross plots can be used as quality
check parameter.
5.4 Core description
Cores from wells (30/3-4, 30/3-5 and 30/6-17A) were described in terms of grain size,
texture, structure and bioturbation in two days at NPD head office Stavanger. The logs were
made by the help of cores and their images at NPD website. Furthermore, wireline logs were
compared and matched with lithology logs to act as quality check and interpretation tools. It
also helped to complete lithology logs at depths where cores were not available.

27
6. Petrophysical results

6. Petrophysical results
28
6.1 Well correlation and producing formations
In Table 6.1 water depth, bottom hole temperature and average estimated temperature in
corresponding formations is mentioned. Different geothermal gradients were calculated for each
well considering 4 °C at sea floor and according bottom hole temperatures. A stratigraphic
correlation plot can be seen in Table 8.2.
Parameters/well 30/3-4 30/3-5S 30/6-17A
Water Depth (m) 164 175 110
Kelly Bushing elevation (m) 23 56 25
Total Depth (MD, mRKB) 3287 4724 2686
True Vertical Depth (TVD, mRKB) 3285 3340 2528
Maximum inclination (°) 6 69.4 2.8
Bottom hole Temp. (°C) 152 120 104
Calculated Geothermal gradient (°C/m) 0.047 0.037 0.041
Avg. Temp. in Ness (°C) 127 102 *
Avg. Temp. in Etive (°C) 129 104 *
Avg. Temp. in Oseberg (°C) ** 105 *
Avg. Temp. in Drake (°C) 133 ** *
Avg. Temp. in Cook (°C) 138.2 111 100
Avg. Temp. in Amundsen (°C) * * 101
*Not included in study interval, **Not encountered in study interval.
Table 6.1 Summary and temperature history of studied wells.
6.1.1 Well 30/3-4
Well 30/3-4 is an oil/gas appraisal well, completed in 1985. This well was drilled in
Veslefrikk Field to investigate possible oil accumulations in Ness and Etive formations and to
determine the oil/water contact. Its secondary objective was to explore the sandstones of
Dunlin Group. Hydrocarbons were encountered in Ness, Etive, and Cook Formation and
oil/water contact was determined at 2930 meters (NPD Factpages).

Moiz Hasnain
29
6.1.2 Well 30/3-5S
Well 30/3-5S was drilled in the east side of Veslefrikk Field and was completed in
1992. Its primary and secondary targets were Brent Group and Statfjord Group, respectively.
Below the depth of 4050 meters, fully developed Brent group was penetrated. The well
encountered hydrocarbons and Brent Group and Cook Formation. This well was completed in
July 1992 and was converted into development well 30/3-A-14 (NPD Factpages). This is a
deviated well and data is obtained in measured depth (mMD), due to which all the samples
and readings from this well will be kept in measured depth. True vertical depth of the
samples can be seen in Appendix B.
6.1.3 Well 30/6-17A
Well 30/6-17A was an exploration well, located on the western side of Oseberg Field.
Cook Formation acted as a gas bearing reservoir in this well and developed as a coarsening
upward sequence with average porosity around 24%. The well was completed in 1986 (NPD
Factpages).
6.2 Petrophysical properties
Primary wave or P-wave velocities (Vp) can reveal the information about the
cementation and density of subsurface rocks. Typically high density rocks exhibit high p-
wave velocities. Rocks with same type of composition can exhibit different velocities
depending upon the density of fluid content and cementation. For example, typical velocity
for dry sand ranges between 400-1200 m/s, whereas, for wet sands it is between 1500-2000
m/s. These velocity zones can also overlap e.g., saturated shales and clays can have velocity
range between 1100-2500 m/s and porous and saturated sandstones can exhibit a velocity
range of 2000-3500 m/s. Highest P-wave velocities are typically displayed by carbonates,
evaporites, igneous and metamorphic rocks which can vary from 3500 to 6500 m/s.

6. Petrophysical results
30
Figure 6.1 P-wave velocities for well 30/6-17A are plotted against depth (temperatures are approximates).
Figure 6.2 P-wave velocities for well 30/3-4 are plotted against depth (temperatures are approximates).

Moiz Hasnain
31
Primary velocity data of well 30/6-17A and 30/3-4 is plotted against depth in Figure 6.1
and Figure 6.2, respectively. An increase in velocity trend can be observed below the
mechanical compaction zone. This increase in velocity can be indicative of transition zone
where both processes like mechanical and chemical compaction are active. This interval has
already entered into chemical compaction regime (70+ °C). As the temperature keeps on
rising (80+ °C) with depth we can see a progressive increasing velocity trend in deeper
intervals. This is most likely because of quartz cementation; however, abnormally high
velocities are possibly sandstones with carbonate cements.
Figure 6.3 Cross plot between Neutron porosity (NPHI) and density (RHOB) logs.
A cross plot between density and neutron porosity (Figure 6.3) is used to separate clean
sand data points from rest of the lithologies. Clean sand line can be drawn by connecting the
quartz point at 2650 kg/m3
density and zero neutron porosity with water point at 1kg/m3
and 1
neutron porosity (Heslop and Heslop, 2003).

6. Petrophysical results
32
Figure 6.4 Cross plot between gamma ray (HGR) and density (RHOB) logs. Green line marks sand/shale boundary.
Cross plot of gamma ray and density logs of all three wells is presented in Figure 6.4.
The sand/shale boundary is created at 60 API of gamma ray value. Below 60 API all the data
is considered sand and above 60 API data is considered shale. Increasing shale content is
indicated by increasing gamma ray values and increasing density values. Equal to or higher
than 2650 kg/m3 values indicate pure sand with zero or very low porosity or quartz and/or
carbonate cementation in sandstone pores. These situations are not good for a petroleum
reservoir. However, moderate values of density (less than 2400 kg/m3) and lower than 60 API
of gamma ray are reasonable for a possible petroleum reservoir.

Moiz Hasnain
33
Neutron porosity logs provide information about the estimated porosity of rocks by
measuring apparent concentration of hydrogen atoms per unit volume. Practically, it gives
information about bound fluid and free fluid in the formation without differentiating them
(Rider, 2002). Thus porosity of water bearing shales can be overestimated. A cross plot of
gamma ray and neutron porosity logs (Figure 6.5) can be used to differentiate between shale
and sandstone. Gamma ray log considers natural radioactivity of the formation and it is not
affected by porosity. High gamma ray (shale content) and high neutron porosity (hydrogen
content) values break the general trend of the cross plot and expose the zone of hydrocarbons
(Heslop and Heslop, 2003).
Figure 6.5 Gamma ray (HGR) values of Cook Formation in three wells are plotted against Neutron porosity.

6. Petrophysical results
34
Figure 6.6 Gamma ray (HGR) values of Cook Formation in three wells are plotted against deep resistivity (RD)
values. Green line at 60API is sand/shale boundary.
Gamma ray and deep resistivity values of the study intervals are plotted in a cross plot,
shown in Figure 6.6. Most of the rock materials are insulators but fluids contained within
formation are conductors. Hydrocarbons are exceptional fluids which are infinitely resistive
to electricity. Porous and hydrocarbon bearing intervals display very high resistivity (Rider,
2002). Cross plot of resistivity and gamma ray separate hydrocarbon bearing sands due to
their significantly high resistivity.

35
7. Sedimentological analysis and results

7. Sedimentological analysis and results
36
7.1 Introduction
Core description and sedimentological interpretation was performed partially at NPD
head office Stavanger, and by utilising core images and wire line logs. Three days were
utilised to interpret grain size, texture, and sedimentary structures to understand depositional
environments. A brief description of Cook Formation and its distribution in different wells is
given in Table 7.1. Facies are characterised on the basis of texture, lithology, and sedimentary
structures. Active processes during the deposition of sediments can be understood by the
utilisation of these characteristics.
Cook Formation
Top (m)
Bottom (m)
Thickness (m)
Study interval (m)
30/3-4 3079 3128 49 2830-2972 & 3086-3130
30/3-5S 3188 3233 45 2951-3052 & 3191-3202
30/6-17A 2460 2488 28 2466-2494
Table 7.1 Distribution of Cook Formation in the study area (depths are given in TVD).
7.2 Facies analysis of Cook Formation
Gamma ray response is extremely sensitive to grain size and clay content. Fining
upward, coarsening upward sequences or other changes in grain size or clay content affect
gamma ray, which results in a change-related shape on the log. This phenomenon makes it
very useful in identifying lithology and subsequently interpreting depositional environment.
In Figure 7.1, few examples of some common facies associations and their corresponding
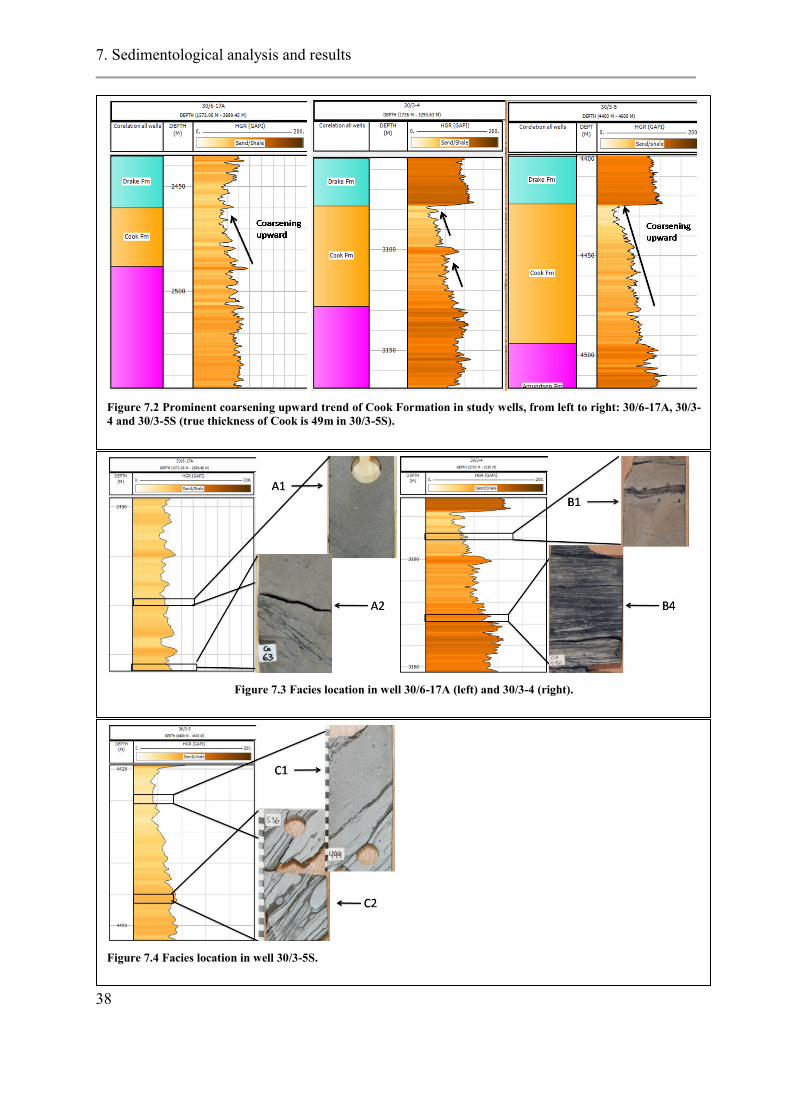
gamma ray responses can be seen. Identified facies and their location in the well can be seen
in Figure 7.3 and 7.4. It is quite obvious that high proportion of fine material caused high
gamma ray counts.

Moiz Hasnain
37
Figure 7.1 Facies associations with gamma ray response (Cant, 1992).
Depositional facies were first identified on the basis of their gamma ray response
(Figure 7.1), after that a detailed analysis of texture and grain size was performed. On the
basis of this set of information facies were classified into eight categories (Figure 7.5). In
Well 30/3-5S and 30/6-17A two facies were identified. Facies were more diverse in well
30/3-4 than others. Four depositional facies are identified in this well. Sedimentary structures
such as, lenticular, flaser and wavy beddings, ripple marks, wave ripples, mud drapes, slump
(soft sediment deformation), and bioturbation were encountered during facies analysis. In all
three wells Cook Formation maintained coarsening upward trend (Figure 7.2).
7. Sedimentological analysis and results
38
Figure 7.4 Facies location in well 30/3-5S.
Figure 7.3 Facies location in well 30/6-17A (left) and 30/3-4 (right).
Figure 7.2 Prominent coarsening upward trend of Cook Formation in study wells, from left to right: 30/6-17A, 30/3-
4 and 30/3-5S (true thickness of Cook is 49m in 30/3-5S).

Moiz Hasnain
39
Fig
ure
7.5
A1
: S
an
dst
on
e re
lati
vel
y c
lean
(w
ell
30
/6-1
7A
, 247
0m
), A
2:
San
dst
on
e (w
ell
30
/6-1
7A
, 2
48
6m
),
B1
: S
an
dst
on
e (w
ell
30
/3-4
, 3
08
7m
),
B2
: S
an
dst
on
e (w
ell
30/3
-4,
31
04m
), B
3:
Sh
aly
san
dst
on
e (w
ell
30
/3-4
, 31
22
m),
B4
: M
ud
sto
ne
(wel
l 3
0/3
-4,
31
26
m),
C1
: S
an
dst
on
e (w
ell
30
/3-5
S, 442
9m
), C
2:
San
dst
on
e (w
ell
30
/3-5
S, 4
44
4m
).

7. Sedimentological analysis and results
40
7.3 Facies association
Facies encountered in this study appear to have conformable association with
underlying shaly strata and sharp contact with overlying shale (Drake Formation) except in
well 30/6-17A of Oseberg Area, where the contact was gradational (Figure 7.2). Abundance
of mud drapes, wavy ripples in lower part and coarsening upward trend in upper part of Cook
Formation, suggest that these sediments were deposited in tidally influenced deltaic and
shoreface environment. Over all coarsening upward sequence with cyclic repetition of silty-
shaly laminae in the lower part indicates a prograding delta setting. A description of facies
association is provided in Table 7.2.
7.3.1 Tidal channel deposits (B1/C1/C2)
Channel deposits generally characterised by upward fining sandstones. Coarse material
is deposited in a channel before the deposition of suspended fine material and clays. Multiple
fining upward cycles, cross-lamination and cross stratification are commonly observed
structures in this setting (Coleman and Prior, 1982). Facies B1, C1 and C2 are considered to
be related to this environment. Facies B1 is found at the upper most part of Cook Formation
in well 30/3-4 whereas, facies C1 and C2 are parts of Cook Formation in well 30-3/-5S.
7.3.2 Shoreface sandstones (A1/A2)
Shoreface sandstones are generally clean, well sorted quartz rich sand with occasional
mud laminae occurences. Because of the constant reworking of sediments due to wave action,
plant fragments, clay and other lighter materials are sparse in these sandstones (McCubbin,
1982). Facies A1 and A2 (Figure 7.5) are characterised in this sedimentary environment due
to paralel bedding and not many apparent sedimentary structures. These facies are found in
well 30/6-17A and show a transition from mud drapes and send lense dominated grey
coloured sandstone (A2) in the lower part of Cook Formation towards a cleaner, coarser and
more porous sandstone. Gamma ray trend in this area interval is also indicative of this
transition (Figure 7.2).

Moiz Hasnain
41
7.3.3 Mouth bar deposits (B2)
In Mouth bar deposits fine grain sand with mud and slump structures at the bottom can
be seen. Mouth bar deposits are formed due to the positive feedback between deposition and
flow divergence. When channel flow diverges near ocean, it deposits sediments creating a
bar-like feature in the middle of channel, which in return reduces the speed of flowing water
and more sediments are deposited (Edmonds and Slingerland, 2007). Facies B2 was found in
30/3-4 below facies B1.
7.3.4 Tidal Sand flat (B3)
Facies B3 (Figure 7.5) can be characterised into tidal sand flat environment. This facies
consists of micaceous, very fine grains, medium to dark grey sandstone (Weimer et al.,
1982). Intense bioturbation was observed, it is considered to be deposited during high energy
marine flooding or by storm currents and later bioturbated. This facies encountered in Cook
Formation in well 30/3-4 and ranged from 1 to 3meters in thickness.
7.3.5 Tidal mud flat (B4)
Tidal mud flats can be characterised by interbedded sand and mud which result in
lenticular and flaser bedding. These are common in subtidal environments and forms due to
the fluctuation of energy. Sand is deposited during wave induced or tidal current flow,
whereas mud is deposited during slack tide periods. These alternations of sand and mud can
range from few centimetres to less than 1 millimetre (Weimer et al., 1982). Facies B4 (Figure
7.5) is closely related to this environment. However, this facies was found only in 30/3-4 at
the lower part of Cook Formation. High gamma ray readings were observed at this interval.
This facies gradually transformed into Facies B3.

7. Sedimentological analysis and results
42
Facies
association
Facies
Units
Lithology Depositional
setting
Description Reservoir
quality
TC B1,
C1, C2
Sandstone Tidal channel Deposited in intertidal to
subtidal wave dominating
environment zone
(gamma ray response:
Boxcar)
Moderate-
poor
SF A1, A2 Sandstone Shoreface
deposits
Deposited in shoreface
and transition zone
(gamma ray response:
funnel)
Good
MB B2 Sandstone Mouth bar
deposits
Deposited in tidal and
transition zone (gamma
ray response: Funnel)
Moderate-
poor
TF B3, B4 Sandstone&
mudstone
Tidal sand and
mud flat
Deposited in subtidal
zone (gamma ray
response: Irregular)
Poor
Table 7.2 Facies association with facies and depositional environment interpretation.

43
8. Petrographic results

8. Petrographic results
44
8.1 Introduction
Petrographic analysis was performed to obtain a detailed description of reservoir
intervals of the three study wells. The focus of petrographic analysis was examination of
texture, mineral composition, and distribution of porosity. Texture and composition of sand
units influences the amount of chlorite coatings and their distribution. Reasonable
understanding of controlling factors of authigenic chlorite and its formation is required to
predict high porosity and limited quartz cementation at depths falling under chemical
compaction domain.
8.2 Texture and composition
Petrographic analysis including point counting and grain size analysis was performed
on all 28 thin sections. Point counting was performed to gather information about matrix,
authigenic clays, porosity, and intergranular volume (IGV). A summary of point counting
results is given in Table 8.1. Some of the IGV values were unusually high, which could be
due to the presence of high amount of authigenic clays and carbonate cement. The average
calculated IGV value lies around 32% (Figure 8.6). Bulk mineralogical composition was
acquired through XRD analysis (Table 8.5). Point counting mineralogical estimates and XRD
estimates are more or less in agreement.
During Point counting very little or no lithic fragments were observed in sandstones.
Petrographic results plotted in QFL diagram of Folk (1980) shows that sandstones are mostly
quartzarenite and subarkosic in composition (Figure 8.1). Sandstone composition plotted on
QFL diagram of Dickinson et al. (1983) shows cratonic interior and transitional continental
provenance of sandstone (Figure 8.2).
Maturity of sandstones was calculated by textural maturity criteria developed by Folk
(1951) which is summarised as:
I. Immature stage: Angular and poorly sorted grains, with considerable amount of
clay and fine mica.
II. Submature stage: Angular and poorly sorted grains, with very little or no clay.
III. Mature stage: Subangular but well sorted grains, with no clay.

Moiz Hasnain
45
IV. Supermature stage: Rounded and well sorted grains, with no clay.
According to above mentioned criteria, most of the samples having subangular and well
sorted grains, fall in mature stage (stage III), but few samples have high amount of clays
which can be classified as immature sandstones (stage I).
Figure 8.1Classification of sandstones according to Folk (1980) shows sandstones falls in subarkose to quartzarenite
category.

8. Petrographic results
46
Figure 8.2 Sandstone composition is plotted over Sandstone provenance diagram ((Dickinson et al., 1983) suggesting
a cratonic interior and transitional continental provenance.
8.3 Grain size and Sorting
Grain size analysis was performed by using petrographic microscope and ScopeView
software (details are mentioned in section 5.2.1). The acquired grain size data was calculated
in an Excel spreadsheet called GRADISTAT by Blott and Pye (2001). This spread sheet
calculates grain size statistics in several methods but for this study Folk and Ward (1957)
method is used. Grain size results are split in two parts, in Table 8.3 results for wells 30/6-
17A and 30/3-4 is given with true vertical depths, whereas in Table 8.4 results for well 30/3-
5S are given with measured drilling depth to keep it consistent with other petrophysical data.

Table 8.1Point counting results of all 28 thin sections.

Table 8.2 Stratigraphic correlation of three wells.

49
Table 8.3 Grain size results for well 30/6/17 in Oseberg area and 30/3-4 in Veslefrikk area.

Table 8.4 Grain size results for well 30/3-5.
MEAN SORTING SKEWNESS KURTOSIS
4061.80 47.11 V.Fine Sand Moderate Fine Lepto 0.0 0.0 0.0 11.5 50.4 38.1
4086.60 272.04 Med. Sand Poor Fine Meso 0.0 27.8 37.0 14.8 14.9 5.5
4112.43 97.85 Fine Sand Moderate Coarse Meso 1.6 1.6 7.9 34.9 49.2 4.7
Etive 4137.60 97.27 Fine Sand Moderately Well Symmetrical Meso 0.0 0.0 1.6 50.8 45.9 1.6
4181.43 235.45 Fine Sand Poor Symmetrical Meso 3.3 13.3 31.7 31.7 18.3 1.7
4210.34 213.35 Fine Sand Poor Coarse Meso 2.0 13.7 27.5 33.3 23.5 0.0
4429.40 110.52 Fine Sand Moderately Well Symmetrical Meso 1.6 1.6 9.8 52.5 32.8 1.6
4435.65 122.88 Fine Sand Moderately Well Symmetrical Platy 0.0 0.0 13.0 55.6 29.6 1.9
4440.75 162.48 Fine Sand Moderately Well Fine Meso 0.0 0.0 35.1 55.4 9.5 0.0
4441.65 191.99 Med Sand Moderately Well Fine Meso 0.0 1.8 52.7 41.8 3.6 0.0
4442.35 76.70 V.Fine Sand Moderately Well Fine Meso 0.0 0.0 2.0 29.4 60.9 7.8
4444.70 106.96 Fine Sand Moderately Well Coarse Platy 0.0 1.9 5.7 41.5 49.1 1.9
FIN
E S
AN
D%
V. F
INE
SA
ND
%
TO
TA
L S
ILT
%
Dep
th (
mM
D.)
Gra
in s
izre
(avg
e)
FOLK AND WARD METHOD 1957
V.C
OA
RS
E S
AN
D %
CO
AR
SE
SA
ND
%
ME
DIU
M S
AN
D%
Well
Fo
rmati
on
s
30
/3-5
Nes
s
Oseberg
Co
ok

51
Table 8.5 Bulk mineralogical composition of samples obtain through XRD analysis.


53
Figure 8.4 Grain size distribution in three studied wells.
Figure 8.3 Grain size vs porosity cross-plot shows increasing porosity with increasing grain size.
0
50
100
150
200
250
300
0 5 10 15 20 25 30
Gra
in S
ize
(u
m)
Porosity %
Grain size vs Porosity
30/6/17A
30/3-4
30/3-5

8. Petrographic results
54
8.4 Intergranular volume
Intergranular volume (IGV) is the sum of inter granular porosity, matrix and cements.
IGV is considered as a good index of the compaction state of sandstone. It indicates the
amount of maximum possible porosity that can be expected in the absence of cement and
depositional matrix (Bloch et al., 2002, Paxton et al., 2002). Inter granular volume (IGV) is
determined after the porosity loss by mechanical compaction and prior to the start of
chemical compaction (Bjørlykke and Jahren, 2010).
Paxton et al. (2002) showed in his study that IGV of sands declines rapidly due to
mechanical compaction from about 40-42% at the surface to approximately 28% at 1500
meters depth. IGV continues to decrease slowly between 1500-2500 to 26% when framework
becomes more stable. It also showed that grain compaction is limited in rigid grain
sandstones which imply that occurrence and distribution of deep porosity is dependent upon
the availability and volume of pore filling cement. Therefore, deep, porous sandstones are
less cemented rather than being under compacted.
Figure 8.5 IGV plotted against Sorting, moderate to moderately well sorted samples are in majority.
0.0
10.0
20.0
30.0
40.0
50.0
60.0
70.0
80.0
0.0 1.0 2.0 3.0 4.0 5.0
IGV
%
Sorting: 1Poor, 2 Moderate, 3 Moderately well, 4 Well
IGV vs Sorting
30/6/17A
30/3-4
30/3-5

Moiz Hasnain
55
Figure 8.7Grain size vs. IGV cross plot does not show any significant trend.
0.0
10.0
20.0
30.0
40.0
50.0
60.0
70.0
80.0
0.0 50.0 100.0 150.0 200.0 250.0 300.0
IGV
%
Grain size (um)
Grain size vs IGV
30/6/17A
30/3-4
30/3-5
Figure 8.6 IGV vs. Depth cross plot.
2300
2800
3300
3800
4300
4800
0.0 20.0 40.0 60.0 80.0
De
pth
(m
)
IGV %
30/6/17A
30/3-4
30/3-5

8. Petrographic results
56
XRD results from well 30/6-17A (Oseberg area) are mentioned below in Figure 8.8; it
can be observed that there is very little change in mineralogical composition of samples
except one sample at depth 2475.8 meters has more siderite than others.
In Figure 8.9 and 8.10, it can be seen that quartz content is more or less constant in
samples from the same formation (marked by distinct coloured squares) except sample at
2958.60 meters depth, which has significant amount of siderite cement. This sample shows
75% of IGV due to siderite cementation. One sample at 3102.22 meters depth exhibits almost
zero porosity in thin section due to relatively high amount of calcite cement. This high
cement can be formed by the re-crystallization of bioclasts or aragonite grains during
diagenesis, which were in contact with sand grains at the time of deposition.
Figure 8.8 XRD results of well 30/6-17A from Oseberg area (coloured squares represent the formations
mentioned in Table 8.1)

Moiz Hasnain
57
Figure 8.10 XRD results of well 30/3-5 from Veslefrikk area.
Figure 8.9 XRD results of well 30/3-4 from Veslefrikk area.

8. Petrographic results
58
8.5 SEM Petrography
Authigenic clays (kaolinite, chlorite), quartz overgrowths, heavy minerals such as
rutile, apatite and pyrite were observed in almost all the samples along with other rock
forming minerals. Stacked booklets and vermiculite structure of kaolinite grains indicated
authigenic origin. In almost all the samples kaolinite acted as porefilling mineral.
Chlorite was observed at depths more than 2800 meters and it varied significantly in
morphology. Partial and complete chlorite coating was observed Cook Formation in wells
30/3-4 and 30/3-5 (Veslefrikk area). In Oseberg area, only quartz and siderite cement was
observed and chlorite coating was not found.
Fibrous illite was observed in few samples along with authigenic kaolinite and
sometimes with chlorite as well. It acted as pore filling mineral in most of the cases (Figure
8.12b). It was found in minor amounts and mostly around leaching K-feldspar grains.
Carbonate cement was also found in minor amounts in some samples but in well 30/3-
4, in Cook Formation at a depth of 3102 meters, carbonate cement found around 35% and
destroyed almost all the porosity (Figure 8.11). In optical microscope, carbonate cement was
easily identified because of its distinct cleavage planes and colour.
Figure 8.11 High amount of calcite cement occupied all the available porosity (30/3-4, 3102.2m). Left: Optical
microscope image; right: BSE image.

Moiz Hasnain
59
Heavy minerals like zircon (ZrSiO2) in Figure 8.14, barite (BaSO4), pyrite (FeS2) in
Figure 8.13, rutile (TiO2), and siderite (FeCO3) in (Figure 8.13) were found mostly attached
to clay matrix.
Figure 8.13 Pyrite grain attached to siderite (30/6-17A, 2492.55m). Authigenic pore filling clays (right) (30/3-5S, 4181.43
m)
Figure 8.12 a) and b) are both authigenic kaolinite can be observed with quartz overgrowths (30/3-5S,
4086.60m,). c) Leached out K-feldspar and adjacent illite can be seen with quartz overgrowth (30/3-5S,
4061.8m). d) Fibrous authigenic illite can be observed (30/3-5S, 4086.6m).
1. Quartz
2. Kaolinite 5. K-feldspar 7. Illite 9. Rutile

8. Petrographic results
60
Figure 8.15 a) Authigenic illite, b) Authigenic chlorite, quartz and illite, c) Albite grains are coated with
illite fibre ( a, b, c are form 30/3-5S, 4061.8m), d) Quartz overgrowth surrounded by illite fibres. (30/3-5S,
4086.6m).
1. Quartz
2. Kaolinite 4. Albite 7. Illite
Figure 8.14 Zircon in backscattered electron (BSE) image (left) and in cathodoluminescence (CL) image (right) (30/6-
17A, 2487.32m).

Moiz Hasnain
61
Figure 8.17 a) Illite attached to muscovite, (30/3-5S, 4137.60m) b) illite with quartz (in 30/3-4, 2958.6m), c)
Quartz grain is completely surrounded by carbonate cement (30/3-4, 2958.6m), d) Quartz grain covered by
muscovite and chlorite (30/3-4, 3126.9m).
1. Quartz
3. Chlorite 7. Illite
Figure 8.16 a) Quartz overgrowth is enclosing pre-existing kaolinite grains, b) Zoom up of a) (30/3-5S,
4112.43m), c) Illite fibres can be seen growing between kaolinite booklet shape grains (30/3-5S, 4112.43m),
d) Quartz overgrowth prevailing in spite of kaolinite presence (30/3-5S, 4137.6m) .
1. Quartz
2. Kaolinite 9. Rutile

8. Petrographic results
62
Figure 8.19 a) Matrix (siderite cement) supported texture explain unusually high IGV, (30/3-4, 2958.6m) b)
Quartz overgrowths cans be seen along the rims of grains shown by orange arrows, (30/3-4, 2867.55m), c)
White arrow points out towards porefilling calcite grains, (30/3-5S, 4210.4m), d) White arrows pointing
calcite grains existing more like porefilling grains (30/3-4, 2959.8m).
Figure 8.18 a) Transition between illite and smectite, (30/3-4, 3113.87m) b) Pyrite and kaolinite (30/3-4,
3113.87m), c) Quartz grain is completely coated by thick illite fibres (30/3-4, 3113.87m), d) Authigenic
kaolinite with typical prismatic quartz overgrowths (30/3-4, 3126.9m).
1. Quartz
2. Kaolinite 7. Illite 8. Pyrite

Moiz Hasnain
63
Figure 8.20 a) Secondary porosity by dissolution of a grain can be seen, b) Ankerite crystal shown by arrow
(30/3-5S, 4181.43m), c) White arrow points out towards large pore space, (30/6-17A, 4086.6m), d) White
arrows pointing towards secondary porosity (30/6-17A, 2475.8m).
Figure 8.21 a) BSE image show quartz grains and porefilling kaolinite, b) CL image of the same area
reveals the bright detrital grains (30/6-17A, 2487.32m), c) BSE image show quartz overgrowth, d) CL
image exposes the detrital bright grains and gives an idea about original IGV (30/3-4, 3113.8m).

8. Petrographic results
64
Figure 8.23 a) Quartz over growth can be seen in spite of chlorite coatings (30/3-5S, 4440.75m), b) Flaky
chlorite grains can be seen (30/3-5S, 4440.75m), c) Partial coating of quartz grains (30/3-5S, 4441.65m), d)
Sheet-like form of chlorite with albite (30/3-5S, 4442.35m).
1. Quartz
3. Chlorite 4. Albite
Figure 8.22Ankerite crystals in kaolinite and illite matrix (30/3-4, 4210.34m).

Moiz Hasnain
65
Figure 8.25 a) Mixture of kaolinite, chlorite and illite (30/3-4, 3108.55m), b) Aggregate of chlorite grains
(30/3-4, 3108.55m), c) Flaky chlorite grains (30/3-4, 3088.75m), d) Flaky chlorite is visible through grain
contact (30/3-4, 3088.75m).
Figure 8.24 a) Quartz over growth can be seen growing into chlorite (30/3-5S, 4444.70m), b) and c) Flaky
chlorite grains are covering the surface of quartz grains (30/3-5S, 4444.70m), d) Pore can be seen chlorite
coated form inside (30/3-5S, 4444.70m).
1. Quartz
3. Chlorite

8. Petrographic results
66

67
9. Discussion

9. Discussion
68
9.1 Introduction
In this chapter, results from chapters 6, 7, and 8 will be discussed to understand the
relationship between chlorite coatings and geological processes involved. Focus of this
chapter will be on Cook Formation. Chlorite coating was found in wells 30/3-4 and 30/3-5S
in Veslefrikk area. It has been observed in Section 8.5 that chlorite exist in deeper parts of
Cook Formation. Chlorite significantly coats detrital grains to preserve them from further
cementation and eventually loosing porosity. Chlorite coating was visible in SEM stub
images (Figure 8.23 and 8.24), but was not visible in petrographic microscope, possibly
because of very small size. In well 30/6-17A (Oseberg area) only quartz cementation was
observed.
9.2 Depositional environment of Cook Formation
Cook Formation consists of sand stone packages with wide range of depositional
settings in different parts of the basin as explained in section 0. Depositional environments
were interpreted on the basis of core images and wireline logs as described in section 1.1.
Cook Formation showed coarsening upward trend in both areas with slight variation. In
Oseberg area, facies analysis suggested the depositional environment as upper shoreface
deposits, whereas tidally influenced prograding deltaic environment was observed in
Veslefrikk area. In well 30/3-4 of Veslefrikk, subtidal features like wavy, lenticular and flaser
beddings (Facies B4/B3) were observed at the bottom of Cook Formation, they further
transformed into bioturbated tidal flat sandstones (Facies B3/B2). These facies transformed
into coarser and cleaner, fine to medium grain, brown sandstone units. These units show
cycles of mud drapes and wave ripples (Facies B1), indicating a relatively high energy setting
with tidal influence, possibly tidal channel deposits. This facies was also found in second
well of Veslefrikk (i.e. 30/3-5S, Facies C2), but contained slightly thinner mud drapes and
light grey colour. Mud drapes get thinner and fewer in the upper part of Cook Formation in
this well. At the top (Facies C1) sand cycles are thick and mud drapes and wave ripples are
thinner, suggesting a more or less similar setting like Facies B1 and C2 but closer to
shoreface. In both wells, Cook Formation has more or less similar thickness i.e. 45 and 49

Moiz Hasnain
69
meters in 30/3-4 and 30/3-5S, respectively. Over all, Cook Formation has a shallowing
upward depositional setting.
In Oseberg area Facies A2 was found in the lower part of Cook Formation as fine grain
porous sandstone with few thin layers of mud. In the upper part Facies A1 was fine to
medium grain, more porous and cleaner sandstone. No organic fragments, roots or plant
fragments were observed, indicating the distance from continental area and reworking of the
sediments. Cook Formation was found as 28m thick sandstone interval and interpreted as
shoreface deposits.
This interpretation is similar to Livbjerg and Mjøs (1989), they divided Cook
Formation in three units i.e. A: prograding subtidal sand body, C: offshore ridge and B: thin
mudstone bed separating A and C. However, during this study only upper shoreface
sandstone unit was found which is closely related to C unit. Thickness of Cook Formation
reduces from Veslefrikk towards Oseberg area which could indicate that progradation took
place from Veslefrikk area (north of Oseberg).
9.3 Petrography
Samples were analysed by point counting under optical microscope for porosity,
cementation, IGV calculation, mineralogical composition, determination of the degree of
cementation, and mechanical and chemical compaction effects. Only grain to grain contacts
were included for IGV and porosity calculations in point counting, while mud drapes were
ignored. IGV ranged between 19.4% - 41% with an outlier being 75.3%. Average IGV in all
three wells was calculated about 32% with one sample being abnormally high. Sample at
depth 2958.6 meters in well 30/3-4 showed very high amount (61%) of carbonate cement
leading in overestimated calculation of IGV i.e. 75% in thin section (Figure 8.a). These
results were also conformed later in XRD analysis which showed about 55% siderite in the
sample (Table 8.5). This high IGV put this sandstone in fluid state with very little grain to
grain contact. Generally, grain supported sands are deposited with an IGV range between 40-
42%. In thin section image (Figure 8.a), it can be seen that grains are not in contact with each
other they are rather in a suspended state within carbonate cement (siderite in this case). It
could be postulated that grain supporting carbonates were dissolved and replaced or
transformed into porefilling cement.
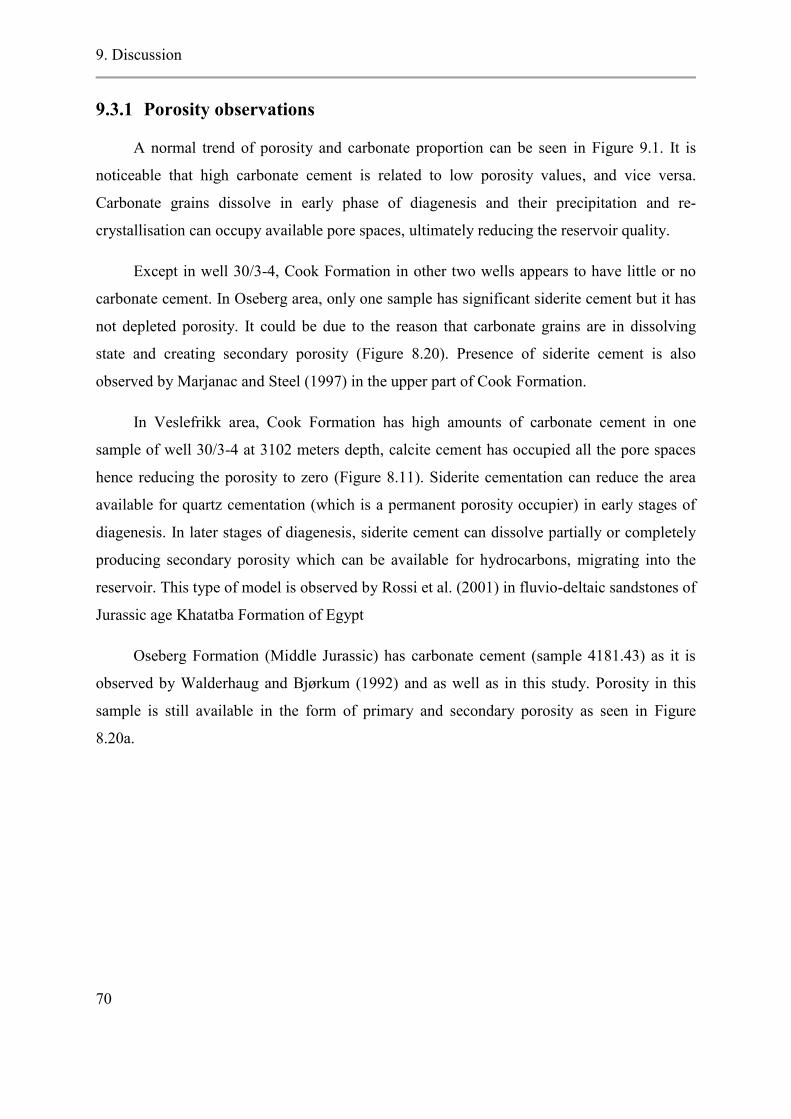
9. Discussion
70
9.3.1 Porosity observations
A normal trend of porosity and carbonate proportion can be seen in Figure 9.1. It is
noticeable that high carbonate cement is related to low porosity values, and vice versa.
Carbonate grains dissolve in early phase of diagenesis and their precipitation and re-
crystallisation can occupy available pore spaces, ultimately reducing the reservoir quality.
Except in well 30/3-4, Cook Formation in other two wells appears to have little or no
carbonate cement. In Oseberg area, only one sample has significant siderite cement but it has
not depleted porosity. It could be due to the reason that carbonate grains are in dissolving
state and creating secondary porosity (Figure 8.20). Presence of siderite cement is also
observed by Marjanac and Steel (1997) in the upper part of Cook Formation.
In Veslefrikk area, Cook Formation has high amounts of carbonate cement in one
sample of well 30/3-4 at 3102 meters depth, calcite cement has occupied all the pore spaces
hence reducing the porosity to zero (Figure 8.11). Siderite cementation can reduce the area
available for quartz cementation (which is a permanent porosity occupier) in early stages of
diagenesis. In later stages of diagenesis, siderite cement can dissolve partially or completely
producing secondary porosity which can be available for hydrocarbons, migrating into the
reservoir. This type of model is observed by Rossi et al. (2001) in fluvio-deltaic sandstones of
Jurassic age Khatatba Formation of Egypt
Oseberg Formation (Middle Jurassic) has carbonate cement (sample 4181.43) as it is
observed by Walderhaug and Bjørkum (1992) and as well as in this study. Porosity in this
sample is still available in the form of primary and secondary porosity as seen in Figure
8.20a.

Moiz Hasnain
71
Figure 9.1 Carbonate cement and porosity proportions in study wells.
9.3.2 Grain size
Grain size analyses showed most of the sandstones are fine grained. Average grain size
of Cook Formation in Veslefrikk and Oseberg area was 120 and 169 microns, respectively.
Cook Formation showed an upward coarsening trend in all the wells which is vaguely
observed in Table 8.3 and 8.4. In well 30/3-4 coarsening upward trend can be seen by looking
at the average grain size data, whereas in 30/3-5S and 30/6-30/6-17A this trend is not that
obvious. The reason could be that the grain size analysis was performed on thin sections
which represent very small part of a large scale trend. For a representative grain size analysis
more than 50 grains should have been measured for each thin section. This overall coarsening
upward trend was a collection of small coarsening upward cycles in Cook Formation. Some

9. Discussion
72
samples may be taken from a depth representative of coarser grain size on a large scale but
sample itself belong to the bottom of small coarsening upward cycle. Most important reason
could be that samples were not selected on the basis of grain size but for the possibility of the
presence of chlorite coatings.
9.4 Mineralogy
Cook Formation sandstones are classified as subarkosic to arenites (Figure 8.1) of a
cratonic interior to transitional continental provenance (Figure 8.2). Angular to sub angular
grains showed textural immaturity of sandstones. Mineralogy remained more or less similar
within formation except few exceptions of carbonate cement. Increasing porosity trend was
observed with increasing grain size (Figure 8.3). Most of the samples were moderately to
well sorted which correspond to relatively high porosity and permeability of reservoir (Beard
and Weyl, 1973).
9.5 Clay mineralogy
Most common and abundant clay mineral found in Cook Formation in both areas was
kaolinite. Illite and chlorite were found in similar proportions after kaolinite (Figure 9.2). For
Clay mineral XRD analysis, five samples (due to lack of time) were selected from Cook
Formation on the basis of high chlorite proportion. It should be considered that these clay
minerals are a fraction of total clay present in each sample, and their proportion is an
estimated value acquired form Newmod(II) after matching the experimental XRD pattern
with standards provided in software.
9.5.1 Chlorite
Chlorite mineral present in the samples could be both detrital and authigenic in origin.
In Cook Formation it found as flaky coats over the detrital grain surfaces (Figure 8.23, 8.24
and 8.25), indicating authigenic origin. In some places it also appeared as sheet-like forms
(Figure 8.17d, Figure 8.23d).

Moiz Hasnain
73
Figure 9.2 Clay mineralogy of chlorite coated samples.
9.5.1.1 Chlorite coating and precursor
Chlorite coating was found in samples of Cook Formation of the Veslefrikk area which
was interpreted as shallow deltaic depositional setting. Flaky chlorite structures were found in
the middle part of Cook Formation in patches and between kaolinite matrixes, occasionally
with illite (Figure 8.25). This chlorite proportion kept on growing with depth and transformed
into partial grain coating. Around the base of Cook Formation in Veslefrikk, chlorite coats
covered significant area on detrital grain surfaces (Figure 8.23) inhibiting quartz overgrowths
and preserving porosity.
Chlorite requires an iron-rich precursor to form grain coats. In the presence of an iron
rich clay precursor attached to the detrital grain in form of a rim, above 90-120°C, chlorite
coatings can form. Precursor is a prerequisite for chlorite coating. This precursor is actually
depositional environment dependent and it determines the amount and extent of coating.
Aagaard et al. (2000) suggested that the precursor of chlorite coating forms in early
diagenesis and chlorite starts to re-crystallise at intermediate depth.
Precursor must be covering all the surface of the grain, otherwise quartz precipitation
can start from the smallest available surface of detrital grain. Uplift of the reservoir can
destroy its preserved porosity, as soon as the reservoir enters into mechanical compaction
regime and low temperatures i.e. 70°C, the smallest fracture or uncoated surface of the grain

9. Discussion
74
can become the source of quartz cementation. Early introduction of iron-rich clay precursor
and rapid burial until 90°C temperature zone is ideal scenario for the formation of chlorite
coating.
Matlack et al. (1989) suggested that grain coatings are formed when water with clay
suspensions passes through pores of sand and deposits a significant amount of suspended clay
on sand grains. Cook Formation in Veslefrikk area is interpreted as tidal and shallow marine,
prograding delta setting, justifying the presence of clay in mineral assemblage. Sand bodies
formed in this setting could get subaerially exposed due to low tide or fluctuation in the sea
level. Freshly depositing sands are more permeable and porous making it possible for
meteoric water to percolate and deposit suspended detrital clays. These clays can stick to the
grain surfaces and later act as a precursor for chlorite coating. Cook Formation in Veslefrikk
has porefilling, disoriented clay, indicating some influence of meteoric water. Another
possible explanation could be the stormy condition, in which fine clays could become
suspension in water due to agitation and this water can transport the clay suspension into
already submerged sand bodies such as compound dunes sand bars, turbidites and low stand
fans etc. However, evidence of subaerial exposure such as, mud cracks or root marks were
not found in any of the cores of Cook Formation.
Samples were rich with mud drapes. Mud drapes are very fine clay layers deposited in a
sand body during relatively long low energy intervals (tidal times). These mud drapes can act
as a source for precursor in tidal environments. Another possibility of clay rims can be the
fecal material of organisms living in continuously depositing sediments. Needham et al.
(2005) produced biogenic clay rims from the fecal material of burrowing organisms.
Biogenic rims strongly resembled with inherited and infiltrated clay rims. This could suggest
that grain coating chlorite can be the ultimate consequence of sediment ingestion and
excretion by the sediment dwelling organisms (Needham et al., 2005).
Depositional setting of Cook Formation in Veslefrikk area appears to be favourable for
the formation of chlorite grain coats. Cook Formation has temperature above 119°C in both
wells (Table 6.1), which would have been much lower in the geological past. Since no signs
of subaerial exposure were found during core analysis, two possibilities for the introduction
of iron rich clay precursor in the system are considered: the fluvio-deltaic deposition of iron
rich clay in Cook Formation (Ehrenberg, 1993); and/or through biogenic means, as

Moiz Hasnain
75
bioturbation is observed in the lower part of Cook Formation in 30/3-4. In well 30/3-5S,
cores were not available below 4445 meters depth, but considering the similar depositional
trends of Cook Formation in both wells, possibility of biogenic source of clay rims cannot be
ruled out.
Considering the depositional environment of Cook Formation, it can be suggested that
the source of clay precursor can be biogenic activity to some extent but mainly it is by
mechanical infiltration of clay particles into sand bodies. In Veslefrikk area, precursor was
suggested to be berthierine by Ehrenberg (1993). Formation of chlorite coating possibly took
place after the conversion of precursor clay rims into berthierine between 65°C to 100°C
(Aagaard et al., 2000). Increasing temperature (between 80°C-100°C) due to further burial
caused precipitation of chlorite. Chlorite formed as a coating material where berthierine rims
were present and preserved porosity from quartz overgrowths. Effectiveness of chlorite coats
depend upon the distribution and continuity of berthierine rims on detrital grains.
In Oseberg area chlorite coating was not found which could be due to the absence of
precursor. Precursor may not be present due to reworking of the sediments, as it is interpreted
as upper shoreface depositional setting. Precursor rims might have eroded from the grain
surfaces during reworking of the sediments (Wilson, 1992) and/or reworking had been started
before precursor was attached to the grains. Extent of reworking can be estimated by
comparing the amount of porefilling kaolinite in the sample. Aagaard et al. (2000) also
noticed the absence of well-developed chlorite coatings in this area.
9.5.1.2 Chlorite coating and porosity
Samples which showed chlorite coatings in SEM were analysed through XRD clay
analysis (Figure 9.2). Chlorite proportion from total clay fractions are plotted with porosity
(Figure 9.3), indicating a relationship between the two.

9. Discussion
76
Figure 9.3 High porosity and chlorite content in Cook Formation.
In the Figure 9.3 (above), all samples have sufficient amount of chlorite to form grain
coatings and preserve porosity, but from the data it looks like chlorite was not effective in
preserving porosity in some samples. For example, sample 3113.87 and 4442.35 have similar
amount of chlorite but low porosities compared to others samples. This is possibly because
chlorite is present in sample but not in the form of coatings which could be related to the fact
that these sandstone samples are finer grained than the other samples. It can be seen in Table
8.3 and 8.4 that these two samples have smaller average grain size than the other samples and
large proportions of silts as well. Silt can act like a porefilling material in fine grain
sandstones. Water with clay suspensions would be less mobile in fine sandstones compared to
coarse grain sandstones. Mobility of clay suspensions is necessary for an even distribution of
clay as the precursor of chlorite coating; otherwise, the clay suspension may preferentially
end up as mud drapes. In coarse grain sandstones, clay suspension can flow easily due to
large pore spaces enhancing the possibility of ending up as a clay precursor on grain surfaces.
The suggested process also indicates that clay precursor was introduced after the final
deposition of the sand.
9.5.2 Kaolinite
Both detrital and authigenic kaolinite were encountered in Cook Formation, however,
amount of authigenic kaolinite was dominant on all other clay minerals. Vermicular, stacked-
booklets, and well defined sharp edges (euhedral) were observed suggesting its authigenic

Moiz Hasnain
77
origin (Wilson et al., 2014), which was most likely a product of the dissolution and leaching
of feldspar grains (Figure 8.12a and 8.13). Detrital kaolinite was observed as porefilling
aggregates of disoriented small grains. Kaolinite ranged from 4% to 13% in all the samples
but in Cook Formation it appeared to be consistently between 6-9% indicating similarities of
depositional processes. Vermicular kaolinite was observed as a source of illite. In Oseberg
area, porefilling kaolinite proportion was relatively low suggesting reworking of sediments.
9.5.3 Illite
Illite was found as fibrous mineral, mostly attached to kaolinite matrix. This
morphology of illite is regarded as the representative of earliest stages of illite formation
(Wilson et al., 2014). It was found in a constant proportion throughout samples both in bulk
and clay proportions. Illite can be formed by two mechanisms i.e. by replacement of smectite,
or by replacement of kaolinite (Bjørlykke and Aagaard, 1992). Since, no illite after smectite
was found in any of the samples, kaolinite is the possible source for illite. This is also
supported by SEM observations which show illite growing in between the vermicular book-
stack grins of kaolinite. However, illite was not observed as a coating mineral. Temperature
required to form illite from kaolinite is 130°C, which was not achieved in well 30/3-5S, but it
is very close to it in well 30/3-4. Kaolinite requires potassium to produce illite, but not much
K-feldspar was observed in the samples, most of the originally K-feldspar grains found are
albitized.
9.6 Cook Formation as a reservoir
Hydrocarbon reservoirs are influenced by various factors ranging from micro to macro
level. Most important factors include depositional environment, mechanical compaction, and
burial diagenesis. Depending upon the combined influence of these factors, porosity, and
permeability of a reservoir is developed or destroyed. A combination of these two parameters
determines the quality of a reservoir.
9.6.1 Depositional environment
Cook Formation was deposited in a range of depositional settings, however in
Veslefrikk, it was characterised as tidally influenced prograding delta setting. Identified

9. Discussion
78
facies (Table 7.2) represent poor (Facies B3 and B4), moderate (Facies B1, B2, C1, and C2)
and good (Facies A1 and A2) reservoir quality. Facies B4 was mainly mudstone with thin
layers of very fine sandstones, making it a bad or poor reservoir due to rather little expected
porosity and almost negligible permeability. Facies B3 was overlying facies B4. Facies B3
contained more sand then B4 but was intensely bioturbated. Bioturbation reduces the
permeability of the reservoir, making it a bad medium for hydrocarbon mobility. Medium to
fine grained relatively cleaner sandstones (Facies B1, B2, C1, and C3) were observed to have
good porosity, occasional thin layer and drapes of mud were found which can affect the
permeability of reservoir. Carbonate cementation was another issue with these sandstones
decreasing their reservoir quality. These sandstones were classified as moderate to poor
reservoirs.
Cook Formation of Oseberg area was observed to have medium to fine grained,
occasionally cemented, porous sandstones (Facies A1 and A2). In this area Cook, Formation
consists of well sorted grains, fewer and thinner mud layers and no bioturbation. These
properties place it in good reservoir category. High porosity in this area could be due to well
sorted grains and minor quartz cementation. Since, permeability of sandstones was not
measured during this study; reservoir quality is an estimate of observed porosity.
9.6.2 Mechanical compaction
Lander and Walderhaug (1999) suggested that reservoir quality of quartz-rich
sandstones is controlled by mechanical compaction and quartz cementation. Porosity starts to
decrease right after deposition due to mechanical compaction, making it the main porosity
destroying mechanism in most cases. Cook Formation consists on moderately to well sorted
sandstones, with angular to sub angular grains. Mechanical compaction appears to have a
high to moderate affect on Cook Formation which can be reflected by IGV values (Table 8.1)
ranging from 23% to 41%. High values of IGV indicate carbonate cementation. The effect of
mechanical compaction stops as soon as quartz cementation starts which provides stability to
grain contacts and stops re-orientation. In Cook Formation, more than 2% quartz cement was
observed in many samples, which is considered sufficient to stop mechanical compaction by
Bjørlykke and Jahren (2010).

Moiz Hasnain
79
9.6.3 Diagenetic processes
Diagenetic processes can play an important role in creating or destroying porosities in
sandstones. After mechanical compaction, cements are considered to be the most effective
porosity destroying factors in most cases.
The effect of kaolinite was considered as neutral to bad depending upon its proportion.
Porosity was observed to be low in samples where kaolinite was in high proportions. Because
of the shape and form of kaolinite, it was considered to be of authigenic origin indicating the
leaching of feldspar through meteoric water. Kaolinite can produce illite at temperatures
around 130°C if there is some potassium available in the system. Illite can also be produced
from smectite at lower temperature (70°C). Authigenic illite can destroy permeability of the
reservoir due to its fibrous form. However, illite was found only in negligible amounts in
Cook Formation indicating absence or very little quantity of smectite and potassium during
deposition.
Chlorite was formed by precursor clay at temperatures between 65°C to 100°C. It was
observed as coating and porefilling mineral. Over all, it has a good influence on reservoir
quality of Cook Formation, where it formed continuous coatings over detrital grains and
inhibited quartz cementation. In samples where it was found as porefilling mineral its affect
was observed as bad to neutral. In Figure 9.3 it can be noticed that chlorite acted as porosity
enhancing material in some samples, while in others it could not preserve porosity.
This diagenetic scenario took place in steps from deposition until the development of
reservoir. During and after the deposition of sands, mechanical infiltration of iron-rich clay
took place. At low temperatures (less than 70°C) berthierine rims around detrital grains
formed, along with mechanical compaction and grain reorientation. Leaching and dissolution
of feldspar through meteoric water produced authigenic kaolinite and secondary porosity. As
the temperature rose above 70°C, precipitation of quartz overgrowths started. Berthierine
started to precipitate as chlorite coatings with increasing burial depths and temperatures.


81
10. Conclusions

10. Conclusions
82
1. Depositional environment of Cook Formation is suggested to be tidal, prograding
delta setting in Veslefrikk and upper shoreface in Oseberg. Shallow marine
environments with fine to coarse grains sand (given that reworking of the grains is not
too vigorous) are proposed to be optimal locations of chlorite coatings such as in
Veslefrikk.
2. Chlorite proved to be more efficient in preserving the porosity in fine to medium grain
sandstones, while in fine to very fine sandstones it was not that effective. This could
be due to the restricted mobility of water and limited mechanical infiltration of clay
precursor. Mechanical infiltration mainly, and bioturbation to minor extent are
proposed clay precursor producing mechanisms in Veslefrikk.
3. Cook Formation maintained porosity feasible to act as a reservoir at depths more than
3000 metres and temperatures ranging from 118°C to 138°C in Veslefrikk area. This
is because of the presence chlorite coatings which inhibited quartz overgrowths by
covering the surface of detrital grains. Chlorite coatings were observed to be less than
10 micron thick.
4. It was observed during this study that reservoir properties of Cook Formation depend
largely upon the inhibition of quartz overgrowths and carbonate cementation.
Carbonate cement can dissolve and create secondary porosity during diagenesis, but
for the inhibition of quartz cementation, well developed chlorite coating played a vital
part.
5. Carbonate cement and porefilling kaolinite were observed as porosity destroying
elements. Quartz overgrowths were mostly found in struggle with chlorite coatings;
still it occupied some amount of porosity.
6. Samples from Oseberg area showed high porosities mostly because of well sorted
grains due to reworking. Chlorite coats or precursors were not observed. Siderite
cement was observed as porosity destroying element in this area.
7. Based on the results of this study, Cook Formation is considered as moderate to good
reservoir. However, it is reasonable to conclude that it is a heterogeneous sandstone
body in terms of reservoir qualities.

83
11. References

11. References
84
AAGAARD, P., JAHREN, J. S., HARSTAD, A. O., NILSEN, O. & RAMM, M. 2000.
Formation of grain-coating chlorite in sandstones. Laboratory synthesized vs. natural
occurrences. Clay Minerals, 35, 261-261.
AASE, N. E., BJORKUM, P. A. & NADEAU, P. H. 1996. The effect of grain-coating
microquartz on preservation of reservoir porosity. AAPG bulletin, 80, 1654-1673.
AJDUKIEWICZ, J. M. & LANDER, R. H. 2010. Sandstone reservoir quality prediction: The
state of the art. AAPG Bulletin, 94, 1083-1091.
BADLEY, M. E., PRICE, J. D., RAMBECH DAHL, C. & AGDESTEIN, T. 1988. The
structural evolution of the northern Viking Graben and its bearing upon extensional
modes of basin formation. Journal of the Geological Society, 145, 455-472.
BEARD, D. & WEYL, P. 1973. Influence of texture on porosity and permeability of
unconsolidated sand. AAPG bulletin, 57, 349-369.
BERGER, A., GIER, S. & KROIS, P. 2009. Porosity-preserving chlorite cements in shallow-
marine volcaniclastic sandstones: Evidence from Cretaceous sandstones of the Sawan
gas field, Pakistan. AAPG bulletin, 93, 595-615.
BJØRLYKKE, K. & AAGAARD, P. 1992. Clay minerals in North Sea sandstones, SEPM
Society for Sedimentary Geology.
BJØRLYKKE, K. & JAHREN, J. 2010. Sandstones and Sandstone Reservoirs. Petroleum
Geoscience. Springer Berlin Heidelberg.
BJØRLYKKE, K., NEDKVITNE, T., RAMM, M. & SAIGAL, G. C. 1992. Diagenetic
processes in the Brent Group (Middle Jurassic) reservoirs of the North Sea: an
overview. Geological Society, London, Special Publications, 61, 263-287.
BLOCH, S., LANDER, R. H. & BONNEL, L. 2002. Anomalously high porosity and
permeability in deeply buried sandstone reservoirs: Origin and predictability. AAPG
bulletin, 86, 301-328.
BLOTT, S. J. & PYE, K. 2001. GRADISTAT: a grain size distribution and statistics package
for the analysis of unconsolidated sediments. Earth Surface Processes and
Landforms, 26, 1237-1248.
BRENNAND, T. P., VAN HOORN, B., JAMES, K. H. & GLENNIE, K. W. 1998. Historical
Review of North Sea Exploration. Petroleum Geology of the North Sea. Blackwell
Science Ltd.

Moiz Hasnain
85
CANT, D. 1992. Subsurface facies analysis. Facies Models: Response to Sea level Change
(Walker, RG; James, NP, 195-218.
CHARNOCK, M. A., KRISTIANSEN, I. L., RYSETH, A. & FENTON, J. P. G. 2001.
Sequence Stratigraphy of the Lower Jurassic Dunlin Group, Northern North Sea. In:
OLE, J. M. & TOM, D. (eds.) Norwegian Petroleum Society Special Publications.
Elsevier.
CHRISTIANSSON, P., FALEIDE, J. I. & BERGE, A. M. 2000. Crustal structure in the
northern North Sea: an integrated geophysical study. Geological Society, London,
Special Publications, 167, 15-40.
CHUHAN, F. A., KJELDSTAD, A., BJØRLYKKE, K. & HØEG, K. 2002. Porosity loss in
sand by grain crushing—experimental evidence and relevance to reservoir quality.
Marine and Petroleum Geology, 19, 39-53.
COLEMAN, J. M. & PRIOR, D. B. 1982. Deltaic Environments of Deposition. Sandstone
Depositional Environments: AAPG Memoir 31, 139.
DALRYMPLE, M. 2001. Fluvial reservoir architecture in the Statfjord Formation (northern
North Sea) augmented by outcrop analogue statistics. Petroleum Geoscience, 7, 115-
122.
DICKINSON, W. R., BEARD, L. S., BRAKENRIDGE, G. R., ERJAVEC, J. L.,
FERGUSON, R. C., INMAN, K. F., KNEPP, R. A., LINDBERG, F. A. & RYBERG,
P. T. 1983. Provenance of North American Phanerozoic sandstones in relation to
tectonic setting. Geological Society of America Bulletin, 94, 222-235.
DOWEY, P. J., HODGSON, D. M. & WORDEN, R. H. 2012. Pre-requisites, processes, and
prediction of chlorite grain coatings in petroleum reservoirs: A review of subsurface
examples. Marine and Petroleum Geology, 32, 63-75.
DREYER, T. & WIIG, M. 1995. Reservoir architecture of the Cook Formation on the
Gullfaks Field based on sequence stratigraphic concepts. In: R.J. STEEL, V. L. F. E.
P. J. & MATHIEU, C. (eds.) Norwegian Petroleum Society Special Publications.
Elsevier.
EDMONDS, D. A. & SLINGERLAND, R. L. 2007. Mechanics of river mouth bar formation:
Implications for the morphodynamics of delta distributary networks. Journal of
Geophysical Research: Earth Surface, 112, n/a-n/a.

11. References
86
EHRENBERG, S. 1993. Preservation of anomalously high porosity in deeply buried
sandstones by grain-coating chlorite: examples from the Norwegian continental shelf.
AAPG Bulletin, 77, 1260-1286.
FALEIDE, J. I. & BERGE, A. M. 2000. The geometries and deep structure of the northern
North Sea rift system. Dynamics of the Norwegian Margin, 167, 41.
FJELDSKAAR, W., TER VOORDE, M., JOHANSEN, H., CHRISTIANSSON, P.,
FALEIDE, J. I. & CLOETINGH, S. A. P. L. 2004. Numerical simulation of rifting in
the northern Viking Graben: the mutual effect of modelling parameters.
Tectonophysics, 382, 189-212.
FOLK, R. L. 1951. Stages of textural maturity in sedimentary rocks. Journal of Sedimentary
Research, 21, 127-130.
FOLK, R. L. 1980. Petrology of sedimentary rocks, Hemphill Publishing Company.
FOLK, R. L. & WARD, W. C. 1957. Brazos River bar: a study in the significance of grain
size parameters. Journal of Sedimentary Research, 27.
FOLKESTAD, A., VESELOVSKY, Z. & ROBERTS, P. 2012. Utilising borehole image logs
to interpret delta to estuarine system: A case study of the subsurface Lower Jurassic
Cook Formation in the Norwegian northern North Sea. Marine and Petroleum
Geology, 29, 255-275.
GABRIELSEN, R., FÆRSETH, R., STEEL, R., IDIL, S. & KLØVJAN, O. 1990.
Architectural styles of basin fill in the northern Viking Graben. Tectonic evolution of
the North Sea rifts, 181, 158-179.
GLENNIE, K. & UNDERHILL, J. 1998. Origin, development and evolution of structural
styles. Petroleum Geology of the North Sea: Basic Concepts and Recent Advances,
Fourth Edition, 42-84.
HESLOP, K. & HESLOP, A. 2003. Interpretation of Shaly Sands. LPS DiaLog, 15, 2003.
LANDER, R. H., LARESE, R. E. & BONNELL, L. M. 2008. Toward more accurate quartz
cement models: The importance of euhedral versus noneuhedral growth rates. AAPG
Bulletin, 92, 1537-1563.
LANDER, R. H. & WALDERHAUG, O. 1999. Predicting porosity through simulating
sandstone compaction and quartz cementation. AAPG bulletin, 83, 433-449.

Moiz Hasnain
87
LIVBJERG, F. & MJØS, R. 1989. The Cook Formation, an offshore sand ridge in the
Oseberg area, northern North Sea. In: COLLINSON, J. D. (ed.) Correlation in
Hydrocarbon Exploration. Springer Netherlands.
LUNDEGARD, P. D. 1994. Mixing zone origin of 13
C-depleted calcite cement: Oseberg
Formation sandstones (Middle Jurassic), Veslefrikk Field, Norway. Geochimica et
Cosmochimica Acta, 58.
LYNGSIE, S. B., THYBO, H. & RASMUSSEN, T. M. 2006. Regional geological and
tectonic structures of the North Sea area from potential field modelling.
Tectonophysics, 413, 147-170.
MARCHAND, A. M., SMALLEY, P. C., HASZELDINE, R. S. & FALLICK, A. E. 2002.
Note on the importance of hydrocarbon fill for reservoir quality prediction in
sandstones. AAPG bulletin, 86, 1561-1572.
MARCUSSEN, Ø., MAAST, T. E., MONDOL, N. H., JAHREN, J. & BJØRLYKKE, K.
2010. Changes in physical properties of a reservoir sandstone as a function of burial
depth – The Etive Formation, northern North Sea. Marine and Petroleum Geology,
27, 1725-1735.
MARJANAC, T. & STEEL, R. J. 1997. Dunlin Group sequence stratigraphy in the northern
North sea: a model for Cook Sandstone deposition. AAPG bulletin, 81, 276-292.
MATLACK, K. S., HOUSEKNECHT, D. W. & APPLIN, K. R. 1989. Emplacement of clay
into sand by infiltration. Journal of Sedimentary Research, 59.
MCCUBBIN, D. G. 1982. Barrier-Island and Strand-Plain Facies. Sandstone Depositional
Environments: AAPG Memoir 31, 247.
MORAD, S. 2009. Carbonate Cementation in Sandstones: Distribution Patterns and
Geochemical Evolution (Special Publication 26 of the IAS), John Wiley & Sons.
MUTO, T. & STEEL, R. J. 1997. The Middle Jurassic Oseberg Delta, northern North Sea: a
sedimentological and sequence stratigraphic interpretation. AAPG bulletin, 81, 1070-
1086.
NEEDHAM, S. J., WORDEN, R. H. & MCILROY, D. 2005. Experimental Production of
Clay Rims by Macrobiotic Sediment Ingestion and Excretion Processes. Journal of
Sedimentary Research, 75, 1028-1037.
NORLEX. 2015. Norwegian Interactive Offshore Stratigraphic Lexicon [Online]. Available:
http://www.nhm2.uio.no/norlexlite/N_Viking_Graben.html [Accessed 22, May 2015].

11. References
88
NORWEGIAN PETROLEUM DIRECTORATE. 2013. Recoverable resources [Online].
Available: http://npd.no/Global/Engelsk/3-
Publications/Facts/Facts2014/Facts_2014_nett_.pdf [Accessed January 12, 2015].
NORWEGIAN PETROLEUM DIRECTORATE. 2014. Veslefrikk [Online]. Available:
http://www.npd.no/en/publications/facts/facts-2013/chapter-10/veslefrikk/ [Accessed
November 04, 2014].
NYSTUEN, J. P. & FÄLT, L.-M. 1995. Upper Triassic-Lower Jurassic reservoir rocks in the
Tampen Spur area, Norwegian North Sea. In: HANSLIEN, S. (ed.) Norwegian
Petroleum Society Special Publications. Elsevier.
PAXTON, S., SZABO, J., AJDUKIEWICZ, J. & KLIMENTIDIS, R. 2002. Construction of
an intergranular volume compaction curve for evaluating and predicting compaction
and porosity loss in rigid-grain sandstone reservoirs. AAPG bulletin, 86, 2047-2067.
RIDER, M. H. 2002. The geological interpretation of well logs, Rider-French Consulting
Ltd.
ROE, S. & STEEL, R. 1985. SEDIMENTATION, SEA-LEVEL RISE AND TECTONICS
AT THE TRIASSIC-JURASSIC BOUNDARY (STATFJORD FORMATION),
TAMPEN SPUR, NORTHERN NORTH-SEA. Journal of Petroleum Geology, 8,
163-186.
ROSSI, C., MARFIL, R., RAMSEYER, K. & PERMANYER, A. 2001. Facies-Related
Diagenesis and Multiphase Siderite Cementation and Dissolution in the Reservoir
Sandstones of the Khatatba Formation, Egypt's Western Desert. Journal of
Sedimentary Research, 71, 459-472.
RUPKE, L., SCHMALHOLZ, S., SCHMID, D. & PODLADCHIKOV, Y. 2008. Automated
thermotectonostratigraphic basin reconstruction: Viking Graben case study. Aapg
Bulletin, 92, 309-326.
SAIGAL, G. & BJØRLYKKE, K. 1987. Carbonate cements in clastic reservoir rocks from
offshore Norway—relationships between isotopic composition, textural development
and burial depth. Geological Society, London, Special Publications, 36, 313-324.
SHINN, E. A. & ROBBIN, D. M. 1983. Mechanical and chemical compaction in fine-grained
shallow-water limestones. Journal of Sedimentary Research, 53.
SLATT, R. M. 2013. Chapter 6 - Geologic Controls on Reservoir Quality. In: ROGER, M. S.
(ed.) Developments in Petroleum Science. Elsevier.

Moiz Hasnain
89
STATOIL. 2013. Veslefrikk [Online]. Available:
http://www.statoil.com/en/ouroperations/explorationprod/ncs/veslefrikk/pages/default
.aspx [Accessed November 05 2014].
STEEL, R. Triassic–Jurassic megasequence stratigraphy in the Northern North Sea: rift to
post-rift evolution. Geological Society, London, Petroleum Geology Conference
series, 1993. Geological Society of London, 299-315.
STORVOLL, V., BJØRLYKKE, K., KARLSEN, D. & SAIGAL, G. 2002. Porosity
preservation in reservoir sandstones due to grain-coating illite: a study of the Jurassic
Garn Formation from the Kristin and Lavrans fields, offshore Mid-Norway. Marine
and Petroleum Geology, 19, 767-781.
SUN, Z.-X., SUN, Z.-L., YAO, J., WU, M.-L., LIU, J.-R., DOU, Z. & PEI, C.-R. 2014.
Porosity preservation due to authigenic chlorite coatings in deeply buried Upper
Triassic Xujiahe Formation sandstones, Sichuan Basin, Western China. Journal of
Petroleum Geology, 37, 251-267.
TAYLOR, T. R., GILES, M. R., HATHON, L. A., DIGGS, T. N., BRAUNSDORF, N. R.,
BIRBIGLIA, G. V., KITTRIDGE, M. G., MACAULAY, C. I. & ESPEJO, I. S. 2010.
Sandstone diagenesis and reservoir quality prediction: Models, myths, and reality.
AAPG bulletin, 94, 1093-1132.
UNDERHILL, J. R. 1998. Jurassic. In: GLENNIE, K. W. (ed.) Petroleum Geology of the
North Sea: Basic Concepts and Recent Advances. Oxford, UK.: Blackwell Science
Ltd.
VOLLSET, J. & DORÉ, A. G. 1984. A revised Triassic and Jurassic lithostratigraphic
nomenclature for the Norwegian North Sea, Norwegian Petroleum Directorate.
WALDERHAUG, O. 1990. A fluid inclusion study of quartz-cemented sandstones from
offshore mid-Norway; possible evidence for continued quartz cementation during oil
emplacement. Journal of Sedimentary Research, 60, 203-210.
WALDERHAUG, O. & BJØRKUM, P. A. 1992. Effect of meteoric water flow on calcite
cementation in the Middle Jurassic Oseberg Formation, well 30/3-2, Veslefrikk Field,
Norwegian North Sea. Marine and Petroleum Geology, 9, 308-318.
WEIMER, R. J., HOWARD, J. D. & LINDSAY, D. R. 1982. Tidal flats and associated tidal
channels. Sandstone Depositional Environments: American Association of Petroleum
Geologists, Memoir, 31, 191-245.

11. References
90
WELTON, J. E. 2003. SEM petrology atlas, American Association of Petroleum Geologists
Tulsa^ eOklahoma Oklahoma.
WILSON, M. D. 1992. Inherited grain-rimming clays in sandstones from eolian and shelf
environments: their origin and control on reservoir properties.
WILSON, M. J., WILSON, L. & PATEY, I. 2014. The influence of individual clay minerals
on formation damage of reservoir sandstones: a critical review with some new
insights. Clay Minerals, 49, 147-164.
ZIEGLER, P. 1982. Geological Atlas of Central and Western Europe. Shell International
Petroleum, Maatschappij BV, Amsterdam.

91
12. Appendices

92
Appendix A: Sedimentological logs
Figure 12.1 Symbols legend.
Figure 12.2 Left: core description sedimentary log of Cook Formation in well 30/3-4. Facies 1,2,3,4 represent B1, B2,
B3, B4, respectively. Right: Cook Formation in well 30/3-5S, facies 1 and 2 represent C1 and C2, respectively. Below
the depth of 4445 meters, log is made on the basis of electrical logs. Core description logs of Brent Group can be seen
on the next page.

93

94
Appendix B: Chlorite composition and TVD for
samples from well 30/3-5S
Sample O Mg Al Si Fe
27.38 9.47 14.66 21.53 26.96
3126.9 30.13 17.38 15.61 19.67 17.22
29.18 15.13 16.24 19.97 19.47
27.05 11.41 13.83 19.04 28.68
3113.87 25.37 4.82 16.29 21.26 32.26
27.86 8.61 14.17 21.72 26.37
4442.35 27 9.38 14.22 21.49 27.91
25.57 6.85 13.79 20.61 33.18
4444.7 25.86 6.08 14.8 18.87 34.38
24.13 5.67 16.04 19.41 34.63
24.8 6.01 16.28 19.33 33.58
Table 12.1 Average weight percentage of Chlorite grains acquired from SEM.
Measured Depth (mMD)
True Vertical Depth (TVD)
4061.80 2952.00
4086.60 2967.00
4112.43 2986.00
4137.60 3003.00
4181.43 3031.12
4210.34 3050.00
4429.40 3191.14
4435.65 3195.00
4440.75 3198.00
4441.65 3199.66
4442.35 3200.00
4444.70 3201.00
Table 12.2 Measured depths and corresponding true vertical depths of samples in well 30/3-5S.


![other processes related to preserving word meaning rather ...iowayotoelang.nativeweb.org/pdf/ioway_updated_grammar_feb2012.pdfREF – ask Mark Swetland and Vida Stabler, or Sue Garzon?]](https://img.dokumen.tips/doc/110x75/5ff079c30ceba02bcb045d72/other-processes-related-to-preserving-word-meaning-rather-ref-a-ask-mark-swetland.jpg)

![Oil related microbiology.-Terje.ppt [Kompatibilitetsmodus] · Important microbial processes in oil production: Reservoir souringReservoir souring Microbial Influenced Corrosion (MIC)](https://img.dokumen.tips/doc/110x75/5cf82f5e88c993ea068b7135/oil-related-microbiology-terjeppt-kompatibilitetsmodus-important-microbial.jpg)


![2 Gauthier.ppt [modalità compatibilità] · – preserving access to services and software that support business processes – commercially relevant data; issues specific to industry](https://img.dokumen.tips/doc/110x75/5f5c9b30e93b11613e592567/2-modalit-compatibilit-a-preserving-access-to-services-and-software-that.jpg)


![Factor Controlling Reservoir Properties and Flow Unit …file.scirp.org/pdf/OJG_2016072816425416.pdf · 2016-07-28 · processes [5]-[10]. In fact, various diagenesis processes are](https://img.dokumen.tips/doc/110x75/5b3aefb07f8b9a895a8bf3cb/factor-controlling-reservoir-properties-and-flow-unit-filescirporgpdfojg-.jpg)