Embed Size (px)
Citation preview

Tectonophysics 690 (2016) 97–116
Contents lists available at ScienceDirect
Tectonophysics
j ourna l homepage: www.e lsev ie r .com/ locate / tecto
Reservoir leakage along concentric faults in the Southern North Sea:Implications for the deployment of CCS and EOR techniques
Nicholas I.P. Ward ⁎, Tiago M. Alves, Tom G. Blenkinsop3D Seismic Lab, School of Earth and Ocean Sciences, Cardiff University, Main Building-Park Place, Cardiff CF10 3AT, United Kingdom
⁎ Corresponding author.E-mail address: [email protected] (N.I.P. Ward).
http://dx.doi.org/10.1016/j.tecto.2016.07.0270040-1951/© 2016 The Authors. Published by Elsevier B.V
a b s t r a c t
a r t i c l e i n f oArticle history:Received 29 October 2015Received in revised form 22 July 2016Accepted 25 July 2016Available online 27 July 2016
High-quality 3D seismic and borehole data in the Broad Fourteens Basin, Southern North Sea, is used to investigatenewly recognised concentric faults formed in salt-withdrawal basins flanking reactivated salt structures. Throw-depth and throw-distance plots were used to understand the growth histories of individual faults. As a result,three families of concentric faults are identified: a) intra-seal faults within a salt-withdrawal basin, b) faultsconnecting the seal and the reservoir on the crest of an inverted anticline, c) raft-bounding faults propagating intoreservoir units. They have moved obliquely and show normal throws, even though they formed during a periodof regional compression. Faults in the salt-withdrawal basin and on the inverted anticline are highly segmented, in-creasing the chances of compartmentalisation or localised fluid flow through fault linkages. Slip tendency analysiswas carried out on thedistinct fault families to compare the likelihoodof slip along a fault at different porefluidpres-sures andwithin different lithologies. Our results show that sections of the faults are optimally orientedwith regardsto maximum horizontal stresses (σHmax), increasing the slip tendency. The identified faults cut through a variety oflithologies, allowing different values of pore fluid pressures to build up before faults reactivate. Within the VlielandSandstones, pore fluid pressures of 30MPa are not sufficient to reactivate pre-existing faults, whereas in the deeperPosidonia Shales faults might reactivate at pore fluid pressures of 25 MPa. Fluid flow features preferentially occurnear fault segments close to failure. Heterogeneity in slip tendency along concentric faults, and high degrees offault segmentation, present serious hazards when injecting CO2 into the subsurface. This study stresses the impor-tance of high-quality 3D seismic data and the need to evaluate individual fault systemswhen investigating potentialreservoirs for carbon capture and storage and enhanced oil recovery.
© 2016 The Authors. Published by Elsevier B.V. This is an open access article under the CC BY license(http://creativecommons.org/licenses/by/4.0/).
Keywords:North SeaConcentric faultsSalt-withdrawalCarbon capture and storageFluid flowSlip tendency
1. Introduction
Concentric faults are curved structural features formed in response tothe evacuation of subsurface sediment and ensuing basin subsidence(Alsop, 1996; Bertoni and Cartwright, 2005; Ge and Jackson, 1998;Maione and Pickford, 2001; Price and Cosgrove, 1990; Stewart, 1999,2006; Underhill, 2009). Concentric faults have been documented abovecollapsed salt diapirs (Bertoni and Cartwright, 2005; Cartwright et al.,2001; Stewart, 2006), but few studies have discussed them in salt-withdrawal basins (Maione and Pickford, 2001; Underhill, 2004). Inthis work, high quality 3D seismic data has unveiled some of these con-centric faults within, and proximal to, a salt-withdrawal basin generatedin the Broad Fourteens Basin, SouthernNorth Sea (Fig. 1a–c). They have anet normal separation, have reactivated obliquely and formed during aperiod of compression, demonstrating a compound history (Maioneand Pickford, 2001; Nalpas et al., 1995; Oudmayer and De Jager, 1993).Their occurrence may present an important caveat for the implementa-tion of carbon capture and storage (CCS), and enhanced oil recovery
. This is an open access article under
(EOR) techniques, in strata flanking salt structures in the North Sea andin equivalent salt-rich basins (Cawley et al., 2015).
In the Southern North Sea, the dominant control on concentric faultdistribution is themovement of Zechstein salt, which is present through-out most of the offshore region of the Netherlands (Alves and Elliott,2014; Verweij and Simmelink, 2002). The majority of hydrocarbon dis-coveries in the Dutch sector of the North Sea arewithin conventional an-ticlinal traps and fault-dip closures (Herber and De Jager, 2010; VanHulten, 2010b). However, the gradual decline in production and increas-ing costs of maintaining current infrastructure has led to a greater em-phasis on understanding oil and gas plays in more complex structures,with the ultimate aim of deploying CCS and EOR techniques in otherwisemature fields (Lokhorst and Wildenborg, 2005; Van Hulten, 2010a) andin Jurassic source intervals (Weijermars, 2013). The implementation ofthese techniques, however, may be impeded by faults and other struc-tural complexities, which can act both as conduits and barriers to fluidflow (Bentham et al., 2013; Cartwright et al., 2007). For example, activefaults that cross-cut seal units may allow fluid to escape to the surface.In parallel, tectonically ‘locked’ faults may be reactivated if fluid pressurereduces the effective stress so that faults become critically stressed(Wiprut and Zoback, 2000, 2002). Conversely, faults that are barriers to
the CC BY license (http://creativecommons.org/licenses/by/4.0/).
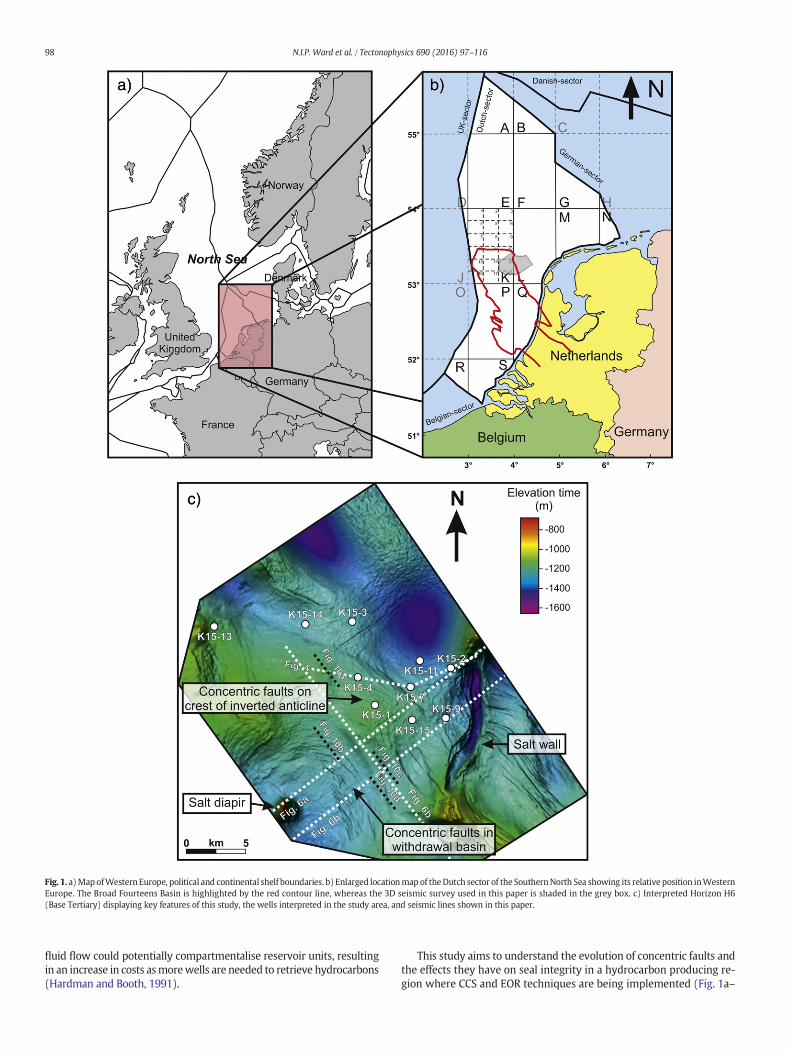
Fig. 1. a)MapofWesternEurope, political and continental shelf boundaries. b) Enlarged locationmap of theDutch sector of the SouthernNorth Sea showing its relative position inWesternEurope. The Broad Fourteens Basin is highlighted by the red contour line, whereas the 3D seismic survey used in this paper is shaded in the grey box. c) Interpreted Horizon H6(Base Tertiary) displaying key features of this study, the wells interpreted in the study area, and seismic lines shown in this paper.
98 N.I.P. Ward et al. / Tectonophysics 690 (2016) 97–116
fluid flow could potentially compartmentalise reservoir units, resultingin an increase in costs asmorewells are needed to retrieve hydrocarbons(Hardman and Booth, 1991).
This study aims to understand the evolution of concentric faults andthe effects they have on seal integrity in a hydrocarbon producing re-gion where CCS and EOR techniques are being implemented (Fig. 1a–
99N.I.P. Ward et al. / Tectonophysics 690 (2016) 97–116
b). Feasibility studies into CCS are being deployed in the Broad Four-teens Basin as of 2015, including in Block K15where the study area is lo-cated (Bentham et al., 2013; Neele et al., 2012). In this paper, faultgrowth and propagation histories are assessed using throw-depth (t-z) and throw-distance (t-x) plots. Displacement data provide informa-tion on nucleation, segmentation, linkage and reactivation along afault (Baudon and Cartwright, 2008; Omosanya and Alves, 2014). Thelikelihood for faults to slip and act as fluid-flow pathways is quantita-tively analysed in this work by calculating slip tendency for interpretedfault families (Morris et al., 1996). Themodelling of increasingporefluidpressures along concentric faults demonstrates the effects fluid injec-tion (CCS) might have on the seal integrity. In summary, the followingresearch questions are addressed in this paper:
a) What is the propagation history of the concentric faults and how didthey form?
b) How does the timing of hydrocarbon maturation and migrationrelate to concentric faults?
c) What are the implications of finding concentric faults for theimplementation of CCS and EOR techniques?
2. Data and methods
The 3D seismic volume interpreted in this work covers ~842 km2 ofthe Broad Fourteens Basin (BFB), offshore Netherlands (Fig. 1a–b). The
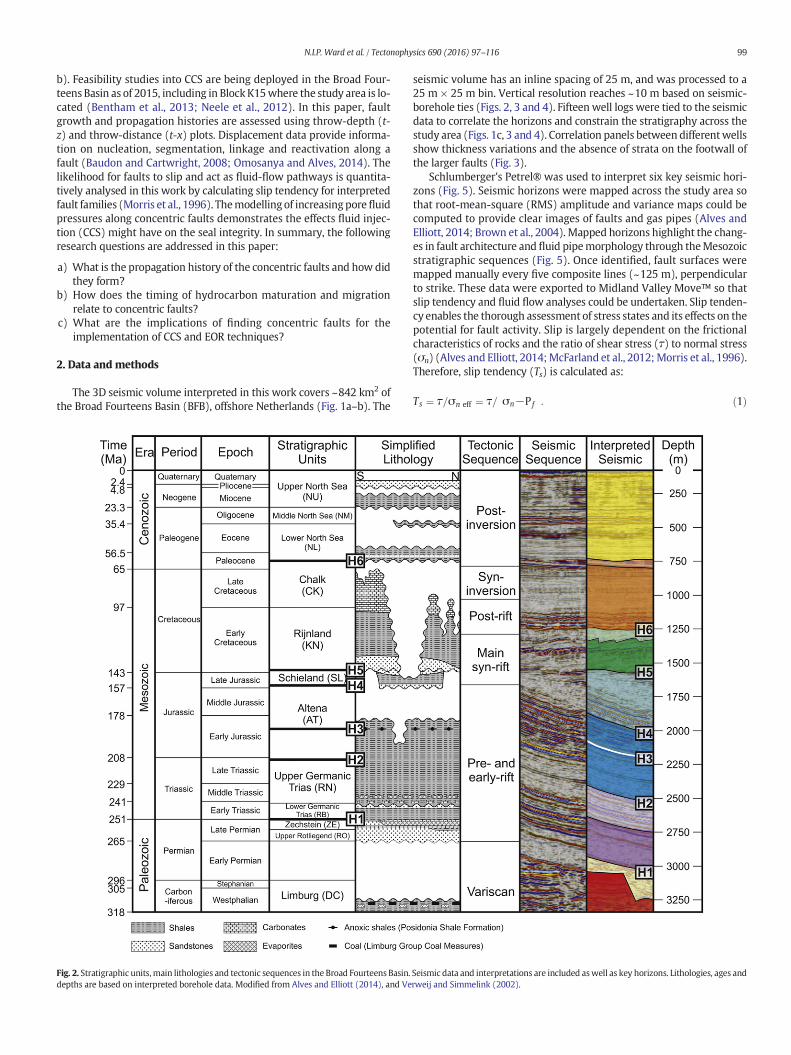
Fig. 2. Stratigraphic units,main lithologies and tectonic sequences in the Broad Fourteens Basin.depths are based on interpreted borehole data. Modified from Alves and Elliott (2014), and Ve
seismic volume has an inline spacing of 25 m, and was processed to a25 m × 25 m bin. Vertical resolution reaches ~10 m based on seismic-borehole ties (Figs. 2, 3 and 4). Fifteen well logs were tied to the seismicdata to correlate the horizons and constrain the stratigraphy across thestudy area (Figs. 1c, 3 and 4). Correlation panels between differentwellsshow thickness variations and the absence of strata on the footwall ofthe larger faults (Fig. 3).
Schlumberger's Petrel® was used to interpret six key seismic hori-zons (Fig. 5). Seismic horizons were mapped across the study area sothat root-mean-square (RMS) amplitude and variance maps could becomputed to provide clear images of faults and gas pipes (Alves andElliott, 2014; Brown et al., 2004). Mapped horizons highlight the chang-es in fault architecture and fluid pipemorphology through theMesozoicstratigraphic sequences (Fig. 5). Once identified, fault surfaces weremapped manually every five composite lines (~125 m), perpendicularto strike. These data were exported to Midland Valley Move™ so thatslip tendency and fluid flow analyses could be undertaken. Slip tenden-cy enables the thorough assessment of stress states and its effects on thepotential for fault activity. Slip is largely dependent on the frictionalcharacteristics of rocks and the ratio of shear stress (τ) to normal stress(σn) (Alves and Elliott, 2014;McFarland et al., 2012;Morris et al., 1996).Therefore, slip tendency (Ts) is calculated as:
Ts ¼ τ=σn eff ¼ τ= σn−P f� �
: ð1Þ
Seismic data and interpretations are included aswell as key horizons. Lithologies, ages andrweij and Simmelink (2002).

Fig. 3. Correlation panel between wells K15-02 and K15-07. See Fig. 1c for location. This figure highlights the thickness variations observed across the study area. K15-07 is a well drilledthrough the inversion crest, whereaswell K15-02 is located close to a salt diapir in the east of the 3D seismic volume. Gamma Ray (GR) logs aremeasured in American Petroleum Institute(API) units.
100 N.I.P. Ward et al. / Tectonophysics 690 (2016) 97–116
Present-day differential stresses found in the Broad Fourteens Basinwere estimated for use in the slip tendency model. Principal stressorientations were based on measurements proximal to the BroadFourteens Basin using the World Stress Map (Heidbach et al., 2008).Stress magnitudes were calculated using the style of deformation inthe basin and the proposed depth of injection for CCS.
At present the Broad Fourteens is experiencing oblique-dextral com-pression derived from tectonic activity in the Alps, which accommodateconvergence between the African and Eurasian Plates (Frikken, 1999;Heidbach et al., 2008; Verweij and Simmelink, 2002). As a result of
this setting, σHmax = σ1, σv = σ2, and σhmin = σ3 (Heidbach et al.,2008). Using an average clastic rock density of 2.3 g cm−3 and a hydro-static pressure gradient increase of ~10MPa km−1, the vertical principalstress increases at a rate of 23 MPa km−1 (Zoback, 2010).
An average depth of 1500 m was estimated for the interpreted faultfamilies based on well data, with the resulting vertical principal stressapproaching 35 MPa. According to Andersonian Fault theory(Anderson, 1951), compressive fault regimes (strike-slip or reversefaults) have similar values of σ3 and σv; i.e. the ratio of σ3/σv is closeto 1. Grollimund et al. (2001) postulate a σ3/σv ratio between 0.9 and

Fig. 4.Wells K15-04, K15-07 and K15-02 are tied to seismic data to help identify different lithologies and seismic-stratigraphic units. Both interpreted and uninterpreted seismic sectionsare shown. The section used is highlighted in Fig. 1c Colours in Fig. 3 correspond to those used in this figure for distinct stratigraphic units. Thewells are gamma-ray logs (GR) andmeasurein American Petroleum Institute (API) units.
101N.I.P. Ward et al. / Tectonophysics 690 (2016) 97–116
1 for the southern Norwegian North Sea, commenting on similar stressconditions throughout NW Europe. As faults are currently undergoingoblique-reverse movements in the study area, the ratio of 0.9 wasused in the stress analyses. Therefore: σhmin= 0.9 σv ~ 31.5 MPa. Sensi-tivity tests show that slight variations of σhmin (±0.1) does not dramat-ically change the results of the paper. The stress difference ratio (Φ) canbe used to calculate the maximum horizontal stress (Alves and Elliott,2014; Morris et al., 1996):
Φ ¼ σ2−σ3ð Þ= σ1−σ3ð Þ: ð2Þ
An average stress difference ratio value of 0.25 was calculated forpresent day conditions, making σHmax = 45.5 MPa (Hillis and Nelson,2005; Newnes, 2014; van Gent et al., 2009). The stress difference ratiovalue varies has a range of ±0.13, although an average for the widedata range seemed appropriate, even though σHmax would change bya maximum of ±15 MPa (Hillis and Nelson, 2005; Newnes, 2014; vanGent et al., 2009).
The effective normal stress used for slip tendency analyses takes intoaccount pore fluid pressure (Pf). As the fluid pressure increases, theeffective stress decreases, making a fault more likely to slip (Handinet al., 1963). At the depth in which concentric faults are located, porefluids appear to hydrostatic, i.e., they have no overpressure (Verweijand Simmelink, 2002). Injecting CO2 into reservoirs at this depth willtherefore increase the pore fluid pressure.
Throw-depth (t-z) and throw-distance (t-x) analyses were per-formed to understand fault propagation histories (Baudon andCartwright, 2008; Jackson and Rotevatn, 2013; Mansfield andCartwright, 1996; Omosanya and Alves, 2014). Throw valuesweremea-sured along the same composite lines used to map the faults. Using t-zplots, the age and depth of fault reactivation can be estimated, as wellas the horizon reactivation took place on. Themode of vertical propaga-tion of fault could be distinguished using t-z plots (Baudon andCartwright, 2008). The resulting t-x plots show the history of lateralpropagation and give evidence of any fault segment linkage(Cartwright et al., 1995).
3. Geological setting
3.1. Evolution of the Broad Fourteens Basin
The Broad Fourteens Basin, part of the larger South Permian Basin,records a complex history of rifting, halokinesis and inversion (Duinet al., 2006; Nalpas et al., 1995; Van Wijhe, 1987; Verweij andSimmelink, 2002; Ziegler, 1990). It was formed during the Mesozoic inresponse to E-W opening of the Atlantic Ocean (Verweij andSimmelink, 2002). Therefore, the evolution of the basin can be dividedinto three intervals with distinct deformation histories:a) Carboniferous-Permian; b) Triassic-Jurassic; c) Late Cretaceous-Cenozoic.
3.1.1. Carboniferous-Permian pre-rift evolutionTowards the end of the Carboniferous, the Variscan Foreland basin
developed in the Southern North Sea. Thick lacustrine and deltaic inter-vals with interbedded coal seamswere deposited as part of the LimburgGroup. Included in this unit are theWestphalian CoalMeasures, amajorsource of gas in the Southern North Sea (Gerling et al., 1999; VanWijhe,1987). Oblique-slip normal faulting predominated after the VariscanOrogeny, with the largest faults cutting through the Variscan fold beltand propagating along older NW-SE trending basement faults. Thepresent-day structural grain of the Southern North Sea follows horstand graben structures formed by these faults (Duin et al., 2006;Oudmayer and De Jager, 1993; Van Wijhe, 1987; Ziegler, 1990)(Figs. 1 and 5).
Sedimentation in the Permianwas interrupted by thermal upwellingfrom dolerite intrusions through oblique-slip dextral normal faults. Thishiatus is expressed in the form of a Saalian unconformity separatingLower fromUpper Rotliegend strata (VanWees et al., 2000). Subsidenceresumed in the Late Permian, and the South Permian Basin becameseparated from the North Permian Basin by the Mid North Sea High(Duin et al., 2006). Upper Rotliegend terrestrial sandstones of theSlochteren Formation were deposited above the Saalian unconformityand became the major reservoir for the Permian gas plays (Verweijand Simmelink, 2002).
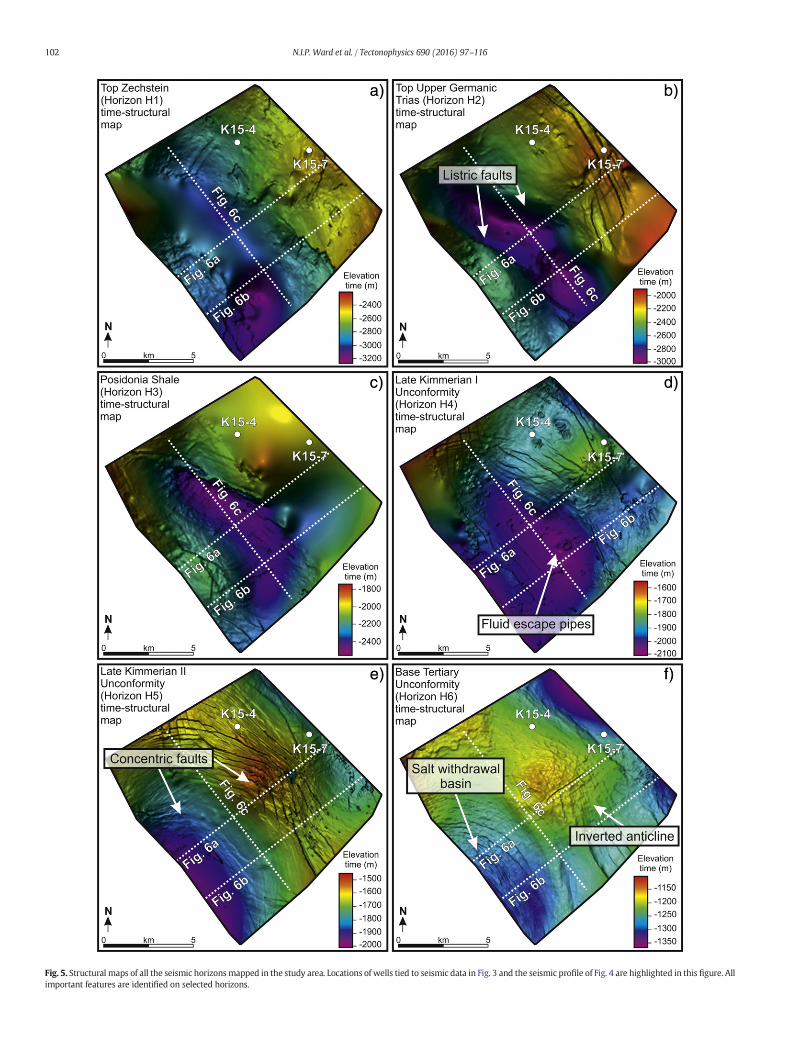
Fig. 5. Structural maps of all the seismic horizons mapped in the study area. Locations of wells tied to seismic data in Fig. 3 and the seismic profile of Fig. 4 are highlighted in this figure. Allimportant features are identified on selected horizons.
102 N.I.P. Ward et al. / Tectonophysics 690 (2016) 97–116

103N.I.P. Ward et al. / Tectonophysics 690 (2016) 97–116
The Zechstein Sea subsequently flooded the study area in the LatestPermian. Carbonate-evaporite cycles in Zechstein evaporites reflect fluc-tuations in sea level (Fig. 3), but thick deposits of Zechstein evaporites inthe North of the Broad Fourteens Basin became an effective seal rock forPermian gas plays (Coward, 1995).
3.1.2. Triassic-Jurassic syn-rift evolutionRifting intensified during the Triassic, allowing for differential
subsidence in the Southern North Sea (Alves and Elliott, 2014; Duinet al., 2006). In the rapidly subsiding Broad Fourteens Basin, aeoliansands and lacustrine claystones from the Lower and Upper GermanicTrias Group were deposited (Fig. 2). The Lower Buntsandstein is aprolific reservoir for Permian gas, particularly where Zechstein salthas been withdrawn and welds have formed between Triassic rocksand the Rotliegend Group (Van Hulten, 2010b). Towards the end ofthe Triassic salt tectonics and reactive diapirism became concentrat-ed along extensional boundary faults (Stewart and Coward, 1995;Ziegler, 1992). Rift-raft tectonics led to the further deepening ofthe Broad Fourteens Basin and open marine conditions (Alves andElliott, 2014; Penge et al., 1993). As a result, the deepwater AltenaShales were deposited in the Broad Fourteens Basin, with the morebituminous Posidonia Shale Formation comprising the source inter-val for Jurassic oil plays, despite a significant isolation of the South-ern North Sea in confined sub-basins (Duin et al., 2006; Nalpaset al., 1995).
Deposition of the Altena Shales stopped in the Middle Jurassicduring the Mid-Kimmerian upwarping event. In areas of greatest up-lift, up to 1500 m of Jurassic rocks were eroded (Heim et al., 2013).Despite this localised uplift event, sharp pulses of NE-SW rifting con-tinued to rotate the Broad Fourteens Basin to its present day orienta-tion. Increased erosion of Triassic, Zechstein and Rotliegend rocks onstructural highs generated thick successions of the Delfland Sub-group and Vlieland Sandstone — both reservoirs for oil sourcedfrom Posidonia Shale (Duin et al., 2006; Van Wijhe, 1987; Verweijand Simmelink, 2002).
3.1.3. Late Cretaceous-Cenozoic basin inversion and its impact onmaturation curves
A major episode of sea-level rise, accompanied by post-rift subsi-dence, led to the accumulation of thick layers of chalk both in indi-vidual basins and on the marginal highs (Van Wijhe, 1987; Verweijand Simmelink, 2002). In the Turonian, N-S Alpine compressioninterrupted subsidence and Subhercynean inversion reactivatedVariscan faults with a reverse-dextral motion (De Lugt et al., 2003;Nalpas et al., 1995). In such a setting, the localisation of a salt(Zechstein) décollement layer to the North of the Broad FourteensBasin accounts for the lack of connectivity between sub-salt andsupra-salt faults (Van Wijhe, 1987). Maximum erosion (~3000 m)took place in the centre of the inverted basin, close to the axis of in-version (De Lugt et al., 2003; Nalpas et al., 1995).
Three additional inversion events took place in the Broad Four-teens Basin, separated by periods of subsidence. The Laramide inver-sion in the Cenozoic reactivated Subhercynean faults, creating aprominent Cretaceous-Tertiary unconformity (De Lugt et al., 2003;Oudmayer and De Jager, 1993). Major basin inversion events are re-corded in the Cenozoic, the largest of which coincided with the Pyr-enean Orogeny (Oligocene) and created an unconformity at the baseof the Miocene (Oudmayer and De Jager, 1993; Verweij andSimmelink, 2002). It separated the Lower North Sea Group fromthe Middle North Sea Group (Wong et al., 2001). The boundary be-tween the Middle and Upper North Sea Groups is based on a breakof sedimentation resulting from regional uplift and global low insea level, associated with the Alpine Orogeny (Savian unconformity,Middle Miocene) (Oudmayer and De Jager, 1993; Wong et al., 2001).
3.2. Concentric faults on diapir crests vs. concentric faults in salt-withdrawal basins
Concentric faults surrounding salt structures initiate during both therise and fall of diapirs. The expansion and upward movement of an in-truding diapir can cause concentric faults to form around the marginof the diapir head. Steep, normal faults caused by the shearing of thesalt body accommodate the strain, dipping away from the diapir(Stewart, 2006). Rejuvenation of active diapirism by lateral compres-sion may cause concentric faults to form above the salt diapir. Steep orreverse concentric faults grow in overlying strata and root to the topof the diapir, dipping towards its core (Stewart, 2006). Similar concen-tric faults form during salt dissolution and collapse (or shrinking) of asalt body. The accommodation space created by removal of salt andshrinking of the diapir creates normal faults that dip towards the centreof the diapir (Bertoni and Cartwright, 2005).
The style of concentric faults adjacent to and above salt diapirs differsfrom concentric faults formedwithin salt-withdrawal basins, as discussedin this paper. Evacuation of salt and subsidence of the overlying strataforms secondary rim synclines marginal to the salt diapir itself. Faultsdip towards the basin centre rather than towards the salt body itself,dipping either away from or towards the salt diapir (Stewart, 2006).
4. Seismic stratigraphy
The main seismic units interpreted in this study are bounded by re-gional unconformities. Each unit consists of a series of mapped horizons(Figs. 4 and 5). In this section, nineteen (19) wells were tied to theinterpreted seismic volume. Exploration wells K15-02, K15-04, andK15-07 were used to describe the lithologies crossed by the wells andillustrate stratal thickness variations across the interpreted seismicvolume (Fig. 3).
Well K15-02 was drilled close to a salt wall, on the footwall of alistric, south-dipping fault (Figs. 1c and 4). Well K15-07 was drilled ona Late Cretaceous inverted anticline. This well crossed a relatively thinUpper Jurassic interval and an intrusion of salt at a depth of 2205 m.Well K15-04 reached its maximum depth at the base of the RijnlandGroup, but a deviation well K15-04-S2 continued through to thePermian Rotliegendes Group. It was drilled SW of a large listric fault,recording the thickest succession of Schieland Group (~640 m)(Figs. 1c and 4). No wells were drilled in either the crest of the invertedanticline or the SW salt-withdrawal basin, so seismic horizons in thiszone were tied to the wells closer to this region.
4.1. Rotliegend Group sandstones (Autunian to Tatarian)
The Rotliegend Group sandstones are the deepest resolvable unit on3D seismic data (Fig. 6a–c). A bright reflection along the upper bound-ary separates the Upper Rotliegend from the Zechstein Group. Similargamma-ray curves in wells K15-07 and K15-02 reflect an abundanceof sand in both locations. Maxima in gamma-ray values on these logsindicate localised accumulations of gas (Fig. 3). The drilled Rotliegendsandstones consist largely of terrestrial course grained deposits(e.g. Slochteren Formation) and finer grained desert lake deposits(e.g. Silverpit Formation) (Verweij and Simmelink, 2002).
Parallel reflections are truncated by large E-W trending Variscanfaults (Fig. 6a–c). These faults can reach displacement values of~300 m. The base of the unit is hard to identify because the overlyingsalt dims the internal reflections of Rotliegend strata. There is little var-iation in thickness across the basin, irrespective of large fault displace-ments (Fig. 6a–c).
4.2. Zechstein Group (Late Permian)
A high-amplitude seismic reflection separates the Zechstein fromthe Rotliegend Groups (Figs. 4 and 5a). The upper boundary of the

Fig. 6. Interpreted seismic profiles highlighting the styles of faulting and fluid flow in the study area. a) SW-NE section identifying fault types. In this section, the concentric faults on thecrest of the inverted anticline propagate above the Base Tertiary unconformity. b) SW-NE section showing fluid escape pipes, concentric faults truncated by H6, and thinning of Zechsteinsalt. c) W-E section showing evidence of fluid escape and an interpreted mud volcano at the upper terminus of a fluid pipe. The raft-bounding listric fault detaches in Zechstein salt.
104 N.I.P. Ward et al. / Tectonophysics 690 (2016) 97–116
Zechstein Group is a continuous mid-high amplitude reflection(Horizon H1) that is disrupted where salt has penetrated throughyounger Triassic rocks, forming salt diapirs (Figs. 3 and 4). Low ampli-tude, chaotic internal reflections onlap the faulted internal reflectionstypical of the RotliegendGroup (Fig. 4).Where salt has completely evac-uated, the bottom reflection connects to the top reflection H1 (Fig. 6b).
Low gamma-ray values are typical of thick salt layers (Passey et al.,1990). Fig. 3 shows the presence of thick layers of salt separated bycyclic carbonate intervals (Coward, 1995). This figure also showsmarked thickness variations across a small distance. At the top of theZechstein Salt there is a unit of rocks with high gamma-ray values thatcan be traced between wells (Fig. 3).

105N.I.P. Ward et al. / Tectonophysics 690 (2016) 97–116
4.3. Upper and Lower Germanic Trias Groups (Latest Permian to Norian)
The Trias Group comprises Triassic siliciclastic rocks (Verweij andSimmelink, 2002). The bright reflection at the base (Horizon H1) indi-cates a change from high-velocity Zechstein evaporites to relativelylow-velocity aeolian sandstones and lacustrine claystones of theLower Germanic Trias Group (~500 m thick) (Figs. 3 and 4). TheLower Buntsandstein Formation has a similar gamma-ray character inwells K15-07 and K15-02. However, well K15-07 is situated on thecrest of an inverted anticline and has a condensed section showing asimilar decreasing gamma-ray trend above the Zechstein Salt (Fig. 3).
High gamma-ray values at the base of the Lower Germanic TriasGroup indicate a higher content in organic matter, which continues atleast 50 m into the Zechstein Group (Figs. 3 and 4). The transitionbetween Zechstein Evaporites and Lower Buntsandstein Formation isthe Zechstein Upper Claystone Formation (Van Adrichem Boogaertand Kouwe, 1994–1997). The overlying Upper Germanic Trias Groupcomprises ~500 m of marine carbonates and evaporites. The constantthicknesses observed in both the Rot (~100 m) and MuschelkalkFormations (~150 m) and the similar gamma-ray profiles, suggest tec-tonic quiescence. In well K15-02, the upper boundary of theMuschelkalk Formation marks the top of Triassic strata (Fig. 3).
4.4. Altena Group (Rhaetian to Oxfordian)
Towards the axis of the inverted anticline that dominates the studyarea, ~800 m of Altena Group strata are preserved conformably overthe Keuper Formation of the Upper Germanic Trias Group (Figs. 3 and4). Deep-water argillaceous shales were deposited in the Broad Four-teens Basin and are topped by Horizon H4 (Figs. 3, 4 and 5d). Thebrightest reflection on the interpreted seismic data is the PosidoniaShale — Horizon H3 (Fig. 5c). This horizon was not crossed by theinterpreted wells. Significant individualisation of sub-basins and ero-sion associated with Mid-Kimmerian upwarping and Late Kimmerian Irifting caused the removal of Jurassic strata in the NE of the study area(Verweij and Simmelink, 2002). In addition, thefirst signs of raft tecton-ics occur in the Early Jurassic (Alves and Elliott, 2014), and a large listricfault offsets the strata in this unit, with thickness variations either sideof the fault (Fig. 4). The top horizon (Horizon H4) of Unit I drapesover the raft and has little offset across the fault (Fig. 5d).
4.5. Schieland Group (Kimmeridgian to Valanginian)
The Schieland Group is a lensoidal package of rock bounded byHorizons H4 and H5 (Figs. 3 and 4). In the study area, these intervalsare part of the Delfland Subgroup and contain carbonaceous claystonesand thick-bedded sandstones belonging to the Breeveertien Formation(Van Adrichem Boogaert and Kouwe, 1993). They occur only withinthe crest of the inverted anticline (K15-07) and are thickest at the inver-sion axis (~710 m) (Fig. 6a–b). Both the upper and lower boundaries ofthe unit are unconformities. The lower boundary (Horizon H4) reflectsthe Late Kimmerian I rifting event and the upper boundary (HorizonH5) represents the Late Kimmerian II rifting event. Most faults locatedon the inversion crest displace these intervals, but rarely continue intothe Altena Group. The unit is localised and does not occur to the SW inthe salt-withdrawal basin, or NE towards the salt wall (Fig. 6).Importantly, all gas escape features in the study area are capped byHorizon H5 (Figs. 5e and 6). Morphologies and mechanisms for pipetermination are discussed in Section 6.
4.6. Rijnland and Chalk Groups (Valanginian to Danian)
The lower and upper boundaries of the Rijnland and Chalk Groupsare regional unconformities. The base is the Late Kimmerian II unconfor-mity (Horizon H5) and the top is the Base Tertiary unconformity(Horizon H6) (Figs. 2 and 5e–f). Deposition of coastal-shallow marine
Vlieland Sandstone developed only in the basin axis. Calcareousclaystones of the Vlieland Claystone Formation andmarls of theHollandFormation (Rijnland Group) have a relatively constant thicknessthroughout the study area (~300 m and ~110 m, respectively) (Fig. 6).Deposition on the basin margins was sandier than in the basin centreas demonstrated by higher gamma-ray values in well K15-07 whencompared to well K15-02 (Fig. 3). Unlike the strata below, theOmmelanden Formation (Chalk Group) is thicker away from theinverted anticline (~650 m) (Fig. 6). This is due to uplift being concen-trated above the listric fault in the centre of the basin. Therefore, erosionduring the Laramide and Pyrenean inversions removed more rock fromthe axis than the margin (Nalpas et al., 1995).
In the SW salt-withdrawal basin, concentric faults are nearly allconcentrated in these units; few offset younger tertiary strata abovehorizon H6. On the inverted crest, concentric faults pass through intothe Schieland Group, but rarely continue into Tertiary strata (Figs. 5fand 6a–c). No fluid pipes can be identified.
5. Analysis of fault families
Three fault families were identified and analysed in this work(Fig. 7). Listric faults constrained to Altena Group and Triassic unitsare associated with the gravitational gliding of individual rafts— isolat-ed, fragmented blocks that are displaced over a décollement layer(Alves, 2012; Alves and Elliott, 2014; Penge et al., 1993). Shallowerconcentric faults occur within the salt-withdrawal basin and above theinversion crest. Comparisons are made between the three sets of faults.
Fault overlay diagrams display the geometry and spatial relationshipbetween different faults (Fig. 7). Slices through different horizons havebeen stacked for each family and the largest gas pipes identified on theseismic data have been illustrated. One observation that can be drawnfrom this figure is the spatial relationship the shallow faults have withthe deeper listric faults. There are two clusters of faults separated by10–20 km of undeformed rock (Fig. 7). In the NE, crestal faults on theinverted anticline tend to dip towards the deeper listric fault, whereasin the SW, most salt-withdrawal basin faults dip away from the under-lying listric fault. In both cases, the faults are concentrated on the convexside of the listric fault that is further away from the salt diapir. Faults onthe inversion crest located furthest east curve away from the previouslymentioned salt diapir (Fig. 7).
5.1. Faults in salt-withdrawal basin
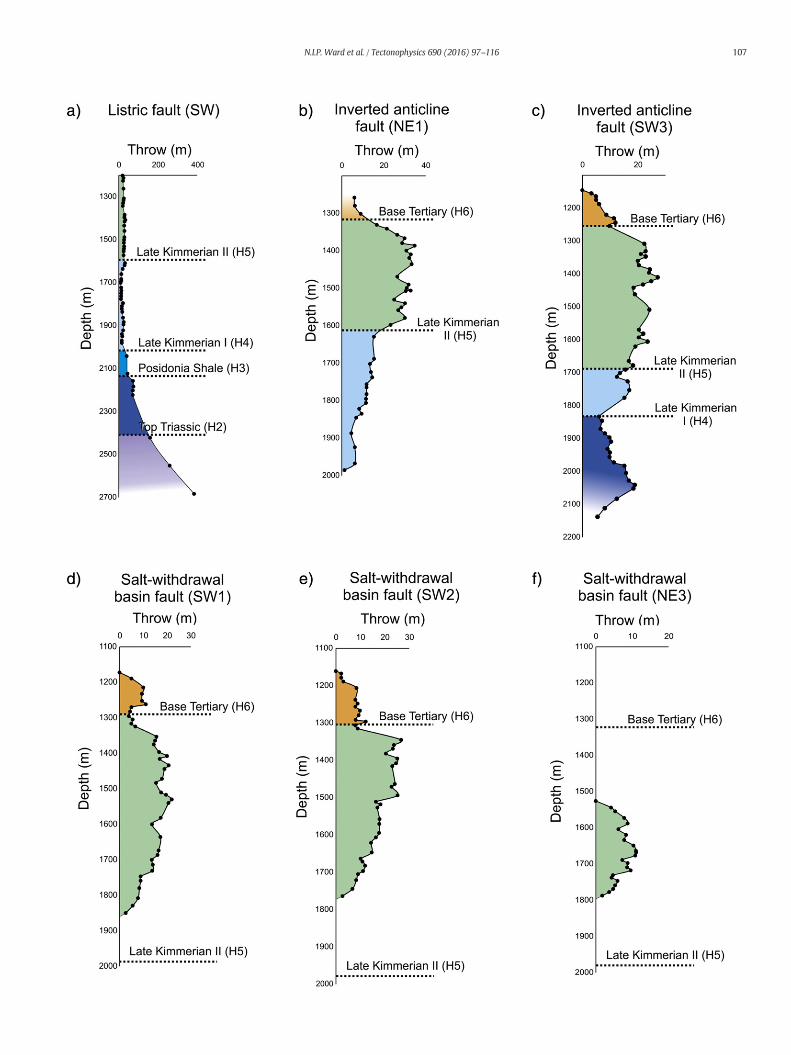
Concentric faults in the salt-withdrawal basin are restricted toCretaceous Rijnland/Chalk Groups and the earliest Tertiary Lower NorthSea Group units. At the lower tips of these faults, throw values are negli-giblewithin the RijnlandGroup, never cross-cutting horizonH5 (Figs. 6a–b and8d–f). As a comparison, SW-dipping faults terminate above theBaseTertiary unconformity (HorizonH6). Throw-depth (t-z) plots reveal a dis-tinct decrease in throw above H6, attributed to reactivation and upwardpropagation of the fault (Baudon and Cartwright, 2008) (Fig. 8d–e). Max-imum throw (~20m) is recorded towards the top of the Cretaceous ChalkGroup, interpreted to be the locus of fault nucleation. Strata deformed bythe first stage of faulting have been eroded by the inversion events, so thethrow recorded above H6 must have been caused by renewed, post-inversion stresses. Both interpreted horizons and t-x plots show evidenceof fault segment linkage asmultiple peaks in throwmaxima are observed(Fig. 9d–f) (Cartwright et al., 1995). Faults dipping SW are more numer-ous, but smaller conjugate NE dipping faults cut across the SW fault set.The concave side of the faults are focussed towards the salt diapir~4000 m to the southwest (Fig. 1c).
5.2. Crestal faults on inverted anticline
Crestal faults on the inverted anticline are not truncated at H5 anddisplace Jurassic Schieland Group, Cretaceous Rijnland Group and the

Fig. 7. Fault overlay diagram for all interpreted concentric faults. Faults were drawn frommultiple reflections between Ommelanden Formation (Chalk Group) and the Delfiand Subgroup(Schieland Group). Concentric faults in the salt withdrawal basin are shown in red, concentric faults on the crest of the inverted anticline are shown in blue, and listric faults are shown inblack. Darker coloured faults indicate greater depth. Arrows show the dip direction of the fault. Themorphology of gas pipes at their upper terminus (HorizonH5) and throughHorizonH3arc drawn to show their spatial relationship to faults. Fluid escape pipes from Fig. 11a–c) at-c labelled.
106 N.I.P. Ward et al. / Tectonophysics 690 (2016) 97–116
Texel Formation of the Cretaceous Chalk Group, even though at thepresent day they occur at the samedepth as the faults crossing thewith-drawal basin (Fig. 8b–c). Crestal faults rarely propagate into Tertiarystrata. Faults that do propagate above the Base Cretaceous Unconformi-ty (H6) have throw values of b10 m (Fig. 8b–c). This figure shows thatmaximum throws (~35 m) are reached between the Chalk Group andthe Rijnland Group.
Along H5 (Jurassic-Cretaceous boundary) there is a throw mini-mum, leading to another increase in throw down dip (Fig. 8c). Thischaracter reflects reactivation via dip linkage, where two separate faultshave propagated towards each other (Baudon and Cartwright, 2008;Omosanya and Alves, 2014). Multiple throw peaks on t-x plots showfault segment linkage is a common process (Fig. 9b–c). With a densemesh of faults occurring above the inversion crest, the fault traces aredifficult to image, leading to inaccuracies in how the faults interact atthis point. However, using variance slices and mapped horizons, it isclear that maximum curvature occurs at the top of the anticline andwhere many fault segments connect (Fig. 7).
5.3. Listric faults
Listric faults are less common in the study area and bound individualTriassic-Jurassic rafts (Alves and Elliott, 2014). These faults sole-out in
Fig. 8. Throw-depth (t-z) profiles for six representative faults. Unconformity surfaces relating to poa single plot provides evidence of reactivation along a fault (Baudon and Cartwright, 2008). Colourd–f)— salt withdrawal basin fault.
the Zechstein Salt, which acts as a décollement layer. Along strike, singlelistric faults are linked to multiple fault segments on the inverted anti-cline (Fig. 10). Where the lower tips of the crestal faults join to theupper tip of the listric fault (H4), throw decreases from ~100 m to~30 m (Fig. 8a). This sudden jump in throw values suggest the listricfault was reactivated with the multiple crestal fault segmentsconnecting to the listric fault, providing evidence that reactivationcaused vertical propagation via dip linkage. Two sudden gradientchanges occur on t-x plots of listric faults where throw increases by~300 m. Three fault segments are highlighted in Fig. 9a, each separatedby a trough in the along strike throw profiles. Maximum displacementalong this fault is observed at its SE tip, where the fault intersects asalt wall (Figs. 1c and 9a). The fault does not continue on the east sideof the salt wall, suggesting the movement of salt has influenced thevariations in along strike displacement. Thickness variations betweenthe footwall and the hanging-wall of the listric faults show they aresyn-sedimentary (Childs et al., 2003).
6. Evidence for fluid expulsion
Highly localised vertical to sub-vertical pathways of focused fluidflow (fluid escape pipes) are seen on seismic data as columns ofdisrupted reflection continuity (Cartwright and Santamarina, 2015;
ints of reactivation and linkage are highlightedwith a dashed line.Multiple throwmaxima ons used represent the units identified in Fig. 3. a)— listric fault; b–c)— inverted anticline fault;

108 N.I.P. Ward et al. / Tectonophysics 690 (2016) 97–116
Gay et al., 2007; Hustoft et al., 2007). The locations of pipes are oftencontrolled by underlying structures such as fault zones, salt diapirs, ero-sional surfaces or anticlinal crests (Gay et al., 2007). Fluid escape pipesare generally clustered (Cartwright and Santamarina, 2015; Gay et al.,2007; Hustoft et al., 2010). Within the studied polygon, 14 clusters of109 individual pipes (clustered and non-clustered) were measured(Fig. 7). The upper terminus of individual pipes range in width from~200 m to ~1200 m, whereas their height depends on the depth ofthe root zone and ranges from ~300 m to ~1100 m. Most of the gaspipes are rooted in the Lower Germanic Trias Group, crossing thePosidonia Shale (Fig. 11). All the gas pipes terminate at the Jurassic-Cretaceous boundary (Horizon H5-Late Kimmerian II rifting event)(Figs. 5d–e, 6b–c and 11).
Different morphologies of the upper terminus of fluid escape pipesare observed in Figs. 5d, 7 and 11. All are circular to slightly ellipticalin planform, but are characterised by variations in the shape in cross-section and size. Strata above and within fluid escape pipe a) havebeen upwarped to form a mound (Fig. 11a). Reflections above H5 arealso mostly continuous across the pipe, maintaining their thicknessand not onlapping the structure (Fig. 5a).
In Fig. 11b, fluid escape pipe b) is small compared to other examplesand is strongly elliptical in planform. There is no topographic expressionabove H5, although reflections thin out towards the upper terminus ofpipe b), indicating numerous stages of growth and pulses of fluid flow.Fluid escape pipe c) has the same shape as mud volcanoes describedin Kopf (2002) (Fig. 11c). Reflections onlap the flanks both within andoutside the structure. It tapers to a root zonewithin the LowerGermanicTrias Group, ~100m above a small salt swell. Above H5, topographic re-lief has caused sediments to onlap onto the SE flank and thin over thecrest of the structure. Fluid escape pipe d) is a cluster of smaller individ-ual pipes (Figs. 7 and 11d). They each show examples of buried pock-marks (Andresen and Huuse, 2011; Cartwright and Santamarina,2015). The pipes root into the Zechstein Salt, disrupting reflections inH1. The geometry of the upper terminus is consistent with those de-scribed by Andresen and Huuse (2011) as depressions, interpreted aspockmarks, having erosional bases and onlapping fill.
7. Slip tendency analyses for concentric faults
7.1. Slip tendency results and effects of changing pore fluid pressure
Due to the curvature of the concentric faults, some sections of thefault surfaces may be optimally oriented for reactivation in the modernstressfield. Slip tendency analyses demonstrate how the likelihood for afault to fail can change along the strike of a curved concentric fault(Fig. 12). The results calculated on Move™ are provided as a valuenormalised to the maximum slip: Ts ¼ Ts=T max, so that 1 indicates thehighest expected level of slip and 0 is no slip (Healy et al., 2015). Thisallows direct comparisons between different sets of results (Healyet al., 2015; McFarland et al., 2012). Fault models in Fig. 12 show sliptendencies on the fault surfaces and include the orientations of principalstresses.Maximumnormalised slip tendency values occur on sections ofthe fault that strike 30° to the orientation of σ1. When Pf = 0 MPa,segments of faults in the north striking 30° to σ1 have Ts valuesapproaching 0.2, whereas in the south, the faults segments are strikingb30° to σ1 and have Ts ≥ 0 (Fig. 12a). Relatively high slip tendenciesare also observed in shallower faults with lower dips, as fault reactiva-tion in a compressional setting favours low-angle thrusts (Wiprut andZoback, 2002). Smaller faults in the SW salt-withdrawal basin havehigher Ts values than faults on the inverted anticline and listric faultsas they are an ideal orientation for fault reactivation. They are generallysmaller and less curved, and hence the slip tendency is more homoge-neous along strike (Fig. 12). Along these sets of faults, a zone of highTs values occur on faults that strike ~295°, 30° to the orientation of σ1
and optimal for strike-slip reactivation (De Lugt et al., 2003; Nalpaset al., 1995).
We plotted Mohr circles to help visualise and quantify how increas-ing pore fluid pressure reduces the effective normal stress (σn′),therefore increasing the Ts moving the fault towards failure (Fig. 13a).Two Coulomb failure envelopes have been plotted on this diagram toshow the conditions required to reactivate a fault (fault failure) orcreate new faults in an intact rock (intact rock failure). An averagefault depth of 1500 m was considered and boundary conditions forthe angle of internal friction (φ) and cohesion (C) of 30° and 10 MPawere used respectively (Barton, 1973). The same angle of internalfriction was assumed for fault reactivation, but cohesion was set to0 MPa (Morris et al., 1996).
The assumption of a cohesionless surface for the fault plane does notrepresent a true fault surface. All faultswill have some amount of rough-ness, a character that increases the amount of friction expected on faultsurfaces (Barton, 1973). However, approximating a cohesionless faultwill give the lowest boundary for failure along a fault plane. These fail-ure envelopes allow us to predict optimum fault orientations for reacti-vation bymeasuring the angle between σ1 and the point of intersectionbetween the envelope and the Mohr circle (2θ). The fault strike wherereactivation is likely to occur is consequently 90–(θ/2). The Mohr circlein Fig. 13a at 25 MPa intersects the fault failure envelope between103.5° and 136.5° from σ1. This indicates that faults striking at~21.75°–38.25° to σ1 are most likely to fail, matching the results foundon the fault models. As pore fluid pressure is increased to 30 MPa, opti-mum angles for reactivation are extended to ~3.5°–56.5° to σ1. This isemphasised by the fault models in Fig. 12c and d,where at 30MPa, any-thing above the fault failure envelope has a Ts ≈ 1.
7.2. Slip tendency analysis using different lithologies
To help understand the behaviour of different sets of concentricfaults, representativeMohr circles have been created for key lithologies.Measurements of φ and C for each lithology were taken from Farmerand Jumikis (1968). Fig. 13b shows Mohr circles for the faults withinthe salt-withdrawal basin. The average depth of these faults is~1600 m, and the most common lithology they displace is chalk. As inSection 7.1, two failure envelopes were added to the diagrams; φ =39° for both, and C = 3.5 MPa for the failure within the intact rockand 0 MPa for fault reactivation. Results show that faults are only likelyto reactivate when pore fluid pressures reach 30 MPa and the faultstrikes ~11.5°–40° relative to σ1. New faults are not expected to formunder these conditions. Concentric faults on the inverted anticlinehave an average depth of ~2000m and cut into the Vlieland Sandstone,a small but important reservoir rock. A cohesion value of 8 MPa and a φvalue of 35° was calculated for a sandstone (Farmer and Jumikis, 1968).Between pore fluid pressures of 0MPa and 30MPa, Ts never exceeds 0.5(Fig. 13c). Even when pore fluid pressures reach 30 MPa, the Mohr'scircles do not pass the fault failure envelope, indicating that faults areunlikely to reactivate under these conditions (C = 0 MPa).
The height of the listric faults is N1 km, so the Posidonia Shale waschosen as a representative horizon, as it is a prolific source rock in theSouthernNorth Sea (Duin et al., 2006). The averagedepthof the PosidoniaShale is 2400 m and predicted C and φ are 3 MPa and 15° respectively(Farmer and Jumikis, 1968). Such a low angle of internal friction meansthat an increase in Pf greatly increases the chances of fault reactivation.At 25 MPa, faults oriented between 21° and 54° to σ1 are likely to reacti-vate (Fig. 13d).WhenPf=30MPa, not only are faults striking 15.5°–59.5°to σ1 likely to fail, but new faults striking 31.5°–43.5° to σ1 start to form.
8. Discussion
8.1. Propagation history of concentric faults
The throw profiles in Figs. 8 and 9 help determine the timing of faultinitiation. In the study area, it is not possible to infer the exact age of
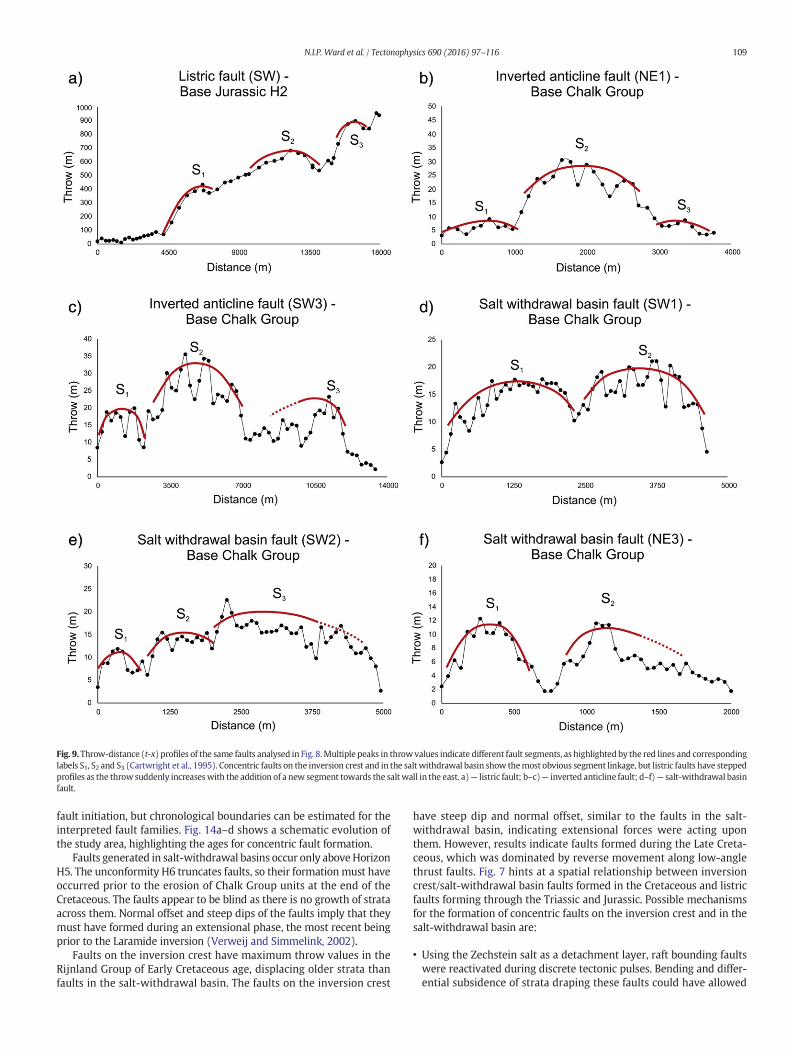
Fig. 9. Throw-distance (t-x) profiles of the same faults analysed in Fig. 8.Multiple peaks in throwvalues indicate different fault segments, as highlighted by the red lines and correspondinglabels S1, S2 and S3 (Cartwright et al., 1995). Concentric faults on the inversion crest and in the salt withdrawal basin show themost obvious segment linkage, but listric faults have steppedprofiles as the throw suddenly increaseswith the addition of a new segment towards the salt wall in the east. a)— listric fault; b–c)— inverted anticline fault; d–f)— salt-withdrawal basinfault.
109N.I.P. Ward et al. / Tectonophysics 690 (2016) 97–116
fault initiation, but chronological boundaries can be estimated for theinterpreted fault families. Fig. 14a–d shows a schematic evolution ofthe study area, highlighting the ages for concentric fault formation.
Faults generated in salt-withdrawal basins occur only above HorizonH5. The unconformity H6 truncates faults, so their formation must haveoccurred prior to the erosion of Chalk Group units at the end of theCretaceous. The faults appear to be blind as there is no growth of strataacross them. Normal offset and steep dips of the faults imply that theymust have formed during an extensional phase, the most recent beingprior to the Laramide inversion (Verweij and Simmelink, 2002).
Faults on the inversion crest have maximum throw values in theRijnland Group of Early Cretaceous age, displacing older strata thanfaults in the salt-withdrawal basin. The faults on the inversion crest
have steep dip and normal offset, similar to the faults in the salt-withdrawal basin, indicating extensional forces were acting uponthem. However, results indicate faults formed during the Late Creta-ceous, which was dominated by reverse movement along low-anglethrust faults. Fig. 7 hints at a spatial relationship between inversioncrest/salt-withdrawal basin faults formed in the Cretaceous and listricfaults forming through the Triassic and Jurassic. Possible mechanismsfor the formation of concentric faults on the inversion crest and in thesalt-withdrawal basin are:
• Using the Zechstein salt as a detachment layer, raft bounding faultswere reactivated during discrete tectonic pulses. Bending and differ-ential subsidence of strata draping these faults could have allowed
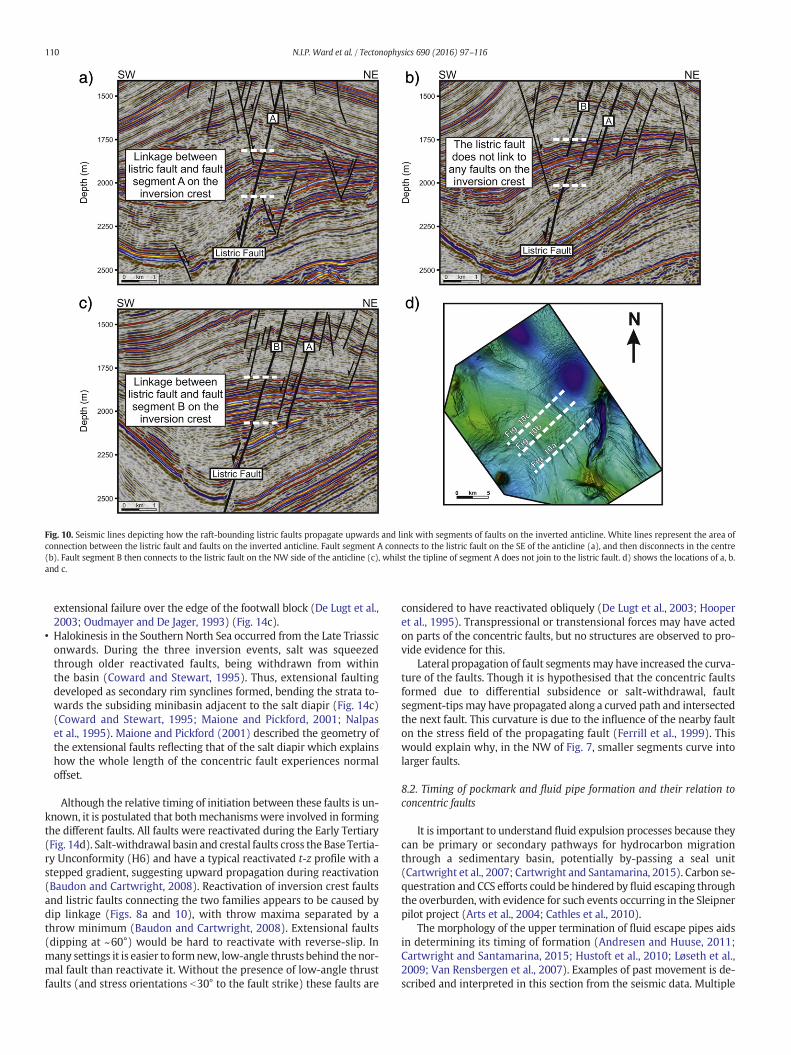
Fig. 10. Seismic lines depicting how the raft-bounding listric faults propagate upwards and link with segments of faults on the inverted anticline. White lines represent the area ofconnection between the listric fault and faults on the inverted anticline. Fault segment A connects to the listric fault on the SE of the anticline (a), and then disconnects in the centre(b). Fault segment B then connects to the listric fault on the NW side of the anticline (c), whilst the tipline of segment A does not join to the listric fault. d) shows the locations of a, b.and c.
110 N.I.P. Ward et al. / Tectonophysics 690 (2016) 97–116
extensional failure over the edge of the footwall block (De Lugt et al.,2003; Oudmayer and De Jager, 1993) (Fig. 14c).
• Halokinesis in the Southern North Sea occurred from the Late Triassiconwards. During the three inversion events, salt was squeezedthrough older reactivated faults, being withdrawn from withinthe basin (Coward and Stewart, 1995). Thus, extensional faultingdeveloped as secondary rim synclines formed, bending the strata to-wards the subsiding minibasin adjacent to the salt diapir (Fig. 14c)(Coward and Stewart, 1995; Maione and Pickford, 2001; Nalpaset al., 1995). Maione and Pickford (2001) described the geometry ofthe extensional faults reflecting that of the salt diapir which explainshow the whole length of the concentric fault experiences normaloffset.
Although the relative timing of initiation between these faults is un-known, it is postulated that bothmechanismswere involved in formingthe different faults. All faults were reactivated during the Early Tertiary(Fig. 14d). Salt-withdrawal basin and crestal faults cross the Base Tertia-ry Unconformity (H6) and have a typical reactivated t-z profile with astepped gradient, suggesting upward propagation during reactivation(Baudon and Cartwright, 2008). Reactivation of inversion crest faultsand listric faults connecting the two families appears to be caused bydip linkage (Figs. 8a and 10), with throw maxima separated by athrow minimum (Baudon and Cartwright, 2008). Extensional faults(dipping at ~60°) would be hard to reactivate with reverse-slip. Inmany settings it is easier to formnew, low-angle thrusts behind the nor-mal fault than reactivate it. Without the presence of low-angle thrustfaults (and stress orientations b30° to the fault strike) these faults are
considered to have reactivated obliquely (De Lugt et al., 2003; Hooperet al., 1995). Transpressional or transtensional forces may have actedon parts of the concentric faults, but no structures are observed to pro-vide evidence for this.
Lateral propagation of fault segmentsmay have increased the curva-ture of the faults. Though it is hypothesised that the concentric faultsformed due to differential subsidence or salt-withdrawal, faultsegment-tipsmay have propagated along a curved path and intersectedthe next fault. This curvature is due to the influence of the nearby faulton the stress field of the propagating fault (Ferrill et al., 1999). Thiswould explain why, in the NW of Fig. 7, smaller segments curve intolarger faults.
8.2. Timing of pockmark and fluid pipe formation and their relation toconcentric faults
It is important to understand fluid expulsion processes because theycan be primary or secondary pathways for hydrocarbon migrationthrough a sedimentary basin, potentially by-passing a seal unit(Cartwright et al., 2007; Cartwright and Santamarina, 2015). Carbon se-questration and CCS efforts could be hindered by fluid escaping throughthe overburden, with evidence for such events occurring in the Sleipnerpilot project (Arts et al., 2004; Cathles et al., 2010).
The morphology of the upper termination of fluid escape pipes aidsin determining its timing of formation (Andresen and Huuse, 2011;Cartwright and Santamarina, 2015; Hustoft et al., 2010; Løseth et al.,2009; Van Rensbergen et al., 2007). Examples of past movement is de-scribed and interpreted in this section from the seismic data. Multiple
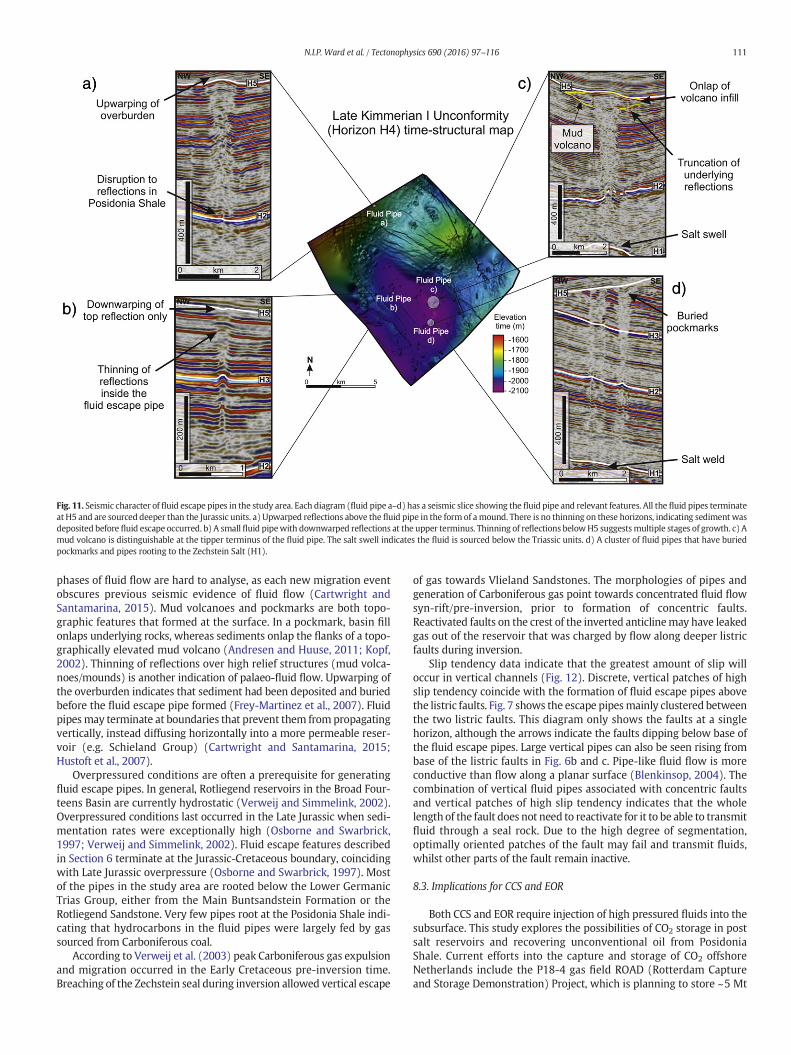
Fig. 11. Seismic character of fluid escape pipes in the study area. Each diagram (fluid pipe a–d) has a seismic slice showing the fluid pipe and relevant features. All the fluid pipes terminateat H5 and are sourced deeper than the Jurassic units. a) Upwarped reflections above the fluid pipe in the form of amound. There is no thinning on these horizons, indicating sediment wasdeposited before fluid escape occurred. b) A small fluid pipewith downwarped reflections at the upper terminus. Thinning of reflections belowH5 suggestsmultiple stages of growth. c) Amud volcano is distinguishable at the tipper terminus of the fluid pipe. The salt swell indicates the fluid is sourced below the Triassic units. d) A cluster of fluid pipes that have buriedpockmarks and pipes rooting to the Zechstein Salt (H1).
111N.I.P. Ward et al. / Tectonophysics 690 (2016) 97–116
phases of fluid flow are hard to analyse, as each new migration eventobscures previous seismic evidence of fluid flow (Cartwright andSantamarina, 2015). Mud volcanoes and pockmarks are both topo-graphic features that formed at the surface. In a pockmark, basin fillonlaps underlying rocks, whereas sediments onlap the flanks of a topo-graphically elevated mud volcano (Andresen and Huuse, 2011; Kopf,2002). Thinning of reflections over high relief structures (mud volca-noes/mounds) is another indication of palaeo-fluid flow. Upwarping ofthe overburden indicates that sediment had been deposited and buriedbefore the fluid escape pipe formed (Frey-Martinez et al., 2007). Fluidpipesmay terminate at boundaries that prevent them from propagatingvertically, instead diffusing horizontally into a more permeable reser-voir (e.g. Schieland Group) (Cartwright and Santamarina, 2015;Hustoft et al., 2007).
Overpressured conditions are often a prerequisite for generatingfluid escape pipes. In general, Rotliegend reservoirs in the Broad Four-teens Basin are currently hydrostatic (Verweij and Simmelink, 2002).Overpressured conditions last occurred in the Late Jurassic when sedi-mentation rates were exceptionally high (Osborne and Swarbrick,1997; Verweij and Simmelink, 2002). Fluid escape features describedin Section 6 terminate at the Jurassic-Cretaceous boundary, coincidingwith Late Jurassic overpressure (Osborne and Swarbrick, 1997). Mostof the pipes in the study area are rooted below the Lower GermanicTrias Group, either from the Main Buntsandstein Formation or theRotliegend Sandstone. Very few pipes root at the Posidonia Shale indi-cating that hydrocarbons in the fluid pipes were largely fed by gassourced from Carboniferous coal.
According to Verweij et al. (2003) peak Carboniferous gas expulsionand migration occurred in the Early Cretaceous pre-inversion time.Breaching of the Zechstein seal during inversion allowed vertical escape
of gas towards Vlieland Sandstones. The morphologies of pipes andgeneration of Carboniferous gas point towards concentrated fluid flowsyn-rift/pre-inversion, prior to formation of concentric faults.Reactivated faults on the crest of the inverted anticlinemay have leakedgas out of the reservoir that was charged by flow along deeper listricfaults during inversion.
Slip tendency data indicate that the greatest amount of slip willoccur in vertical channels (Fig. 12). Discrete, vertical patches of highslip tendency coincide with the formation of fluid escape pipes abovethe listric faults. Fig. 7 shows the escape pipesmainly clustered betweenthe two listric faults. This diagram only shows the faults at a singlehorizon, although the arrows indicate the faults dipping below base ofthe fluid escape pipes. Large vertical pipes can also be seen rising frombase of the listric faults in Fig. 6b and c. Pipe-like fluid flow is moreconductive than flow along a planar surface (Blenkinsop, 2004). Thecombination of vertical fluid pipes associated with concentric faultsand vertical patches of high slip tendency indicates that the wholelength of the fault does not need to reactivate for it to be able to transmitfluid through a seal rock. Due to the high degree of segmentation,optimally oriented patches of the fault may fail and transmit fluids,whilst other parts of the fault remain inactive.
8.3. Implications for CCS and EOR
Both CCS and EOR require injection of high pressured fluids into thesubsurface. This study explores the possibilities of CO2 storage in postsalt reservoirs and recovering unconventional oil from PosidoniaShale. Current efforts into the capture and storage of CO2 offshoreNetherlands include the P18-4 gas field ROAD (Rotterdam Captureand Storage Demonstration) Project, which is planning to store ~5 Mt
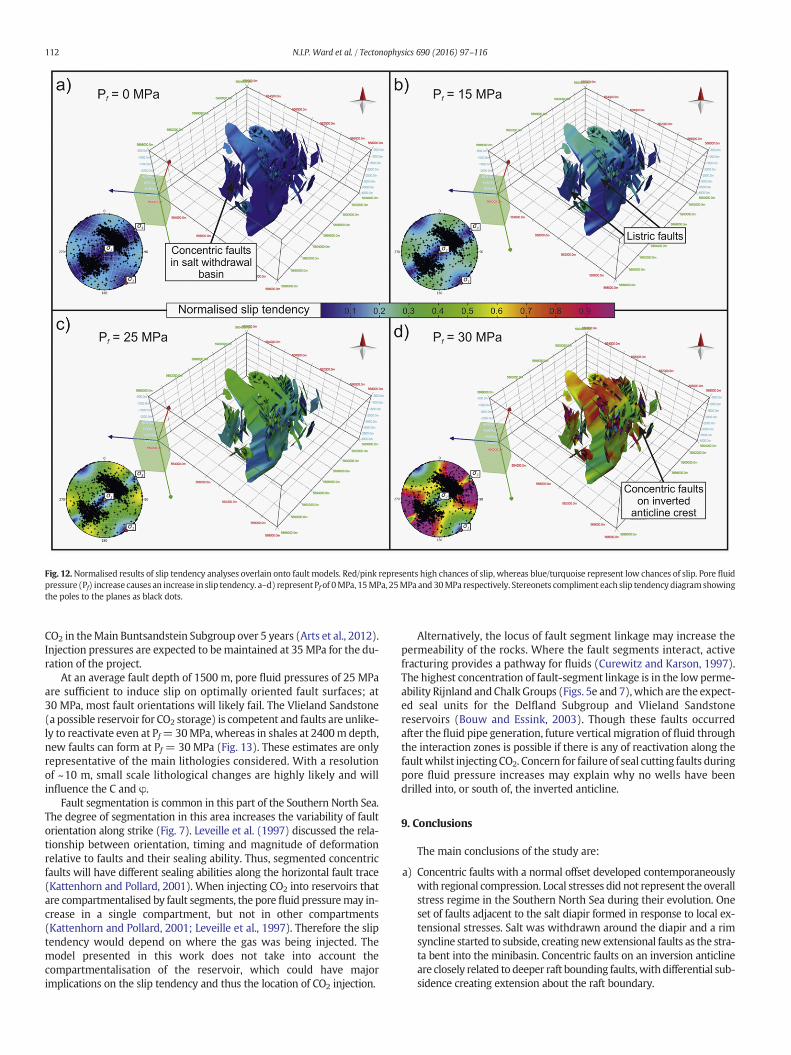
Fig. 12.Normalised results of slip tendency analyses overlain onto fault models. Red/pink represents high chances of slip, whereas blue/turquoise represent low chances of slip. Pore fluidpressure (Pf) increase causes an increase in slip tendency. a–d) represent Pf of 0MPa, 15MPa, 25MPa and 30MPa respectively. Stereonets compliment each slip tendency diagramshowingthe poles to the planes as black dots.
112 N.I.P. Ward et al. / Tectonophysics 690 (2016) 97–116
CO2 in theMain Buntsandstein Subgroup over 5 years (Arts et al., 2012).Injection pressures are expected to bemaintained at 35MPa for the du-ration of the project.
At an average fault depth of 1500 m, pore fluid pressures of 25 MPaare sufficient to induce slip on optimally oriented fault surfaces; at30 MPa, most fault orientations will likely fail. The Vlieland Sandstone(a possible reservoir for CO2 storage) is competent and faults are unlike-ly to reactivate even at Pf=30MPa, whereas in shales at 2400m depth,new faults can form at Pf = 30 MPa (Fig. 13). These estimates are onlyrepresentative of the main lithologies considered. With a resolutionof ~10 m, small scale lithological changes are highly likely and willinfluence the C and φ.
Fault segmentation is common in this part of the Southern North Sea.The degree of segmentation in this area increases the variability of faultorientation along strike (Fig. 7). Leveille et al. (1997) discussed the rela-tionship between orientation, timing and magnitude of deformationrelative to faults and their sealing ability. Thus, segmented concentricfaults will have different sealing abilities along the horizontal fault trace(Kattenhorn and Pollard, 2001). When injecting CO2 into reservoirs thatare compartmentalised by fault segments, the pore fluid pressuremay in-crease in a single compartment, but not in other compartments(Kattenhorn and Pollard, 2001; Leveille et al., 1997). Therefore the sliptendency would depend on where the gas was being injected. Themodel presented in this work does not take into account thecompartmentalisation of the reservoir, which could have majorimplications on the slip tendency and thus the location of CO2 injection.
Alternatively, the locus of fault segment linkage may increase thepermeability of the rocks. Where the fault segments interact, activefracturing provides a pathway for fluids (Curewitz and Karson, 1997).The highest concentration of fault-segment linkage is in the low perme-ability Rijnland andChalk Groups (Figs. 5e and 7),which are the expect-ed seal units for the Delfland Subgroup and Vlieland Sandstonereservoirs (Bouw and Essink, 2003). Though these faults occurredafter the fluid pipe generation, future vertical migration of fluid throughthe interaction zones is possible if there is any of reactivation along thefaultwhilst injectingCO2. Concern for failure of seal cutting faults duringpore fluid pressure increases may explain why no wells have beendrilled into, or south of, the inverted anticline.
9. Conclusions
The main conclusions of the study are:
a) Concentric faults with a normal offset developed contemporaneouslywith regional compression. Local stresses did not represent the overallstress regime in the Southern North Sea during their evolution. Oneset of faults adjacent to the salt diapir formed in response to local ex-tensional stresses. Salt was withdrawn around the diapir and a rimsyncline started to subside, creating newextensional faults as the stra-ta bent into the minibasin. Concentric faults on an inversion anticlineare closely related to deeper raft bounding faults,withdifferential sub-sidence creating extension about the raft boundary.

Fig. 13.Mohr's circle diagrams of different lithologies in the study area and the effects of increasing pore fluid pressure. a) Diagram demonstrating how increasing the pore fluid pressuremakes a fault more likely to reactivate. An average depth and lithologywas assumed for the parameters. b–d) Diagrams showing the likelihood for faults to reactivate in the Chalk Group,Vlieland Sandstone and Posidonia Shale respectively. Values of cohesion (C) and angle of internal friction (p) were calculated by Farmer and Jumikis (1968).
113N.I.P. Ward et al. / Tectonophysics 690 (2016) 97–116
b) Growth histories of concentric faults can be complex, with verticallinkage frommultiple phases of reactivation during inversion andhor-izontal segment linkage via lateral propagation. Fault segment linkagecan increase the curvature of faults as each segment curves towardsthe propagating larger fault.
c) Slip tendency analyses shows patches of high slip along parts of thefault that are optimally orientedwith respect to the present day stressfield, increasing the chances of fluid leakage. The heterogeneity offault slip along strike increases with the length and curvature of afault, making evaluation of each individual fault necessary. Sub-vertical patches of high slip tendency along a single fault occur near
vertical fluid pipes. Variations in lithology and depth of faults have astrong influence on the slip tendency and the failure profiles. Evenat depth, faults cross-cutting the Posidonia Shales aremuchmore like-ly to reactivate than those within shallower sandstones as pore fluidpressure increases.
d) Fluid escape features found on 3D seismic data provide evidence forvertical migration of fluids from Carboniferous Gas reservoirs.Overpressured conditions in these reservoirs occurred most recentlyduring the Late Jurassic allowing fluid to flow to the surface andform pockmarks and mud volcanoes, indicating that most fluid pipesare palaeo-features.

Fig. 14. Schematic cartoon of the geological evolution of the study area (based on Fig. 6) highlighting the age and growth of different fault families. The cartoon shows listric faults active induring the Jurassic syn-rift form in associationwith rift-raft tectonics. Shallower concentric faults are formed by the Late Cretaceous in response to the evacuation of salt (salt-withdrawal)and differential subsidence of the footwall of a listric fault (faults on the inversion anticline crest). ZE, Zechstein Group; RB, Lower Germanic Trias Group; RN, Upper Germanic Trias Group;AT, Altena Group; SL, Schieland Group; KN, Rijnland Group; CK, Chalk Group.
114 N.I.P. Ward et al. / Tectonophysics 690 (2016) 97–116
e) In the inversion crest, where the Vlieland Sandstone reservoir is stillpreserved, concentric faults cut through the strata and create apathway for fluids to leak. Faults are unlikely to reactivate at porefluid pressures b30 MPa in the sandstones, however, they mayreactivate within the chalk seal above. Although faults may providepathways to fluid flow, they can also compartmentalise a reservoir.If this is the case, then an increase in pore fluid pressure on one faultmight not have the same effect the other side of the fault.
f) Storage of CO2 in Block K15 is possible at pore fluid pressures similarto those being implemented in the Southern North Sea (Arts et al.,2012). To ensure no faults are reactivated and transmit fluids, porefluid pressures will have to remain b30 MPa. Faults studied here arehighly segmented, and the locus of segment interaction can providea suitable pathway for seal bypass.
Acknowledgements
The work contained in this paper was conducted during a PhD studyundertaken as part of the Natural Environment Research Council(NERC) Centre for Doctoral Training (CDT) in Oil & Gas and is funded
by NERC and co-sponsored by Cardiff University, whose support isgratefully acknowledged. We thank Tullow Oil for access and permis-sion to publish examples from their 3D seismic data volumes.Schlumberger (for Petrel©) andMidland Valley (Move™) are acknowl-edged for the provision of academic licences to Cardiff's 3D Seismic Lab.NLOG and TNO are acknowledged for the well data in this work. Wethank two anonymous reviewers and the editor J. Crider for their con-structive comments.
References
Alsop, G.I., 1996. Physical modelling of fold and fracture geometries associated with saltdiapirism. Geol. Soc. Lond., Spec. Publ. 100, 227–241.
Alves, T.M., 2012. Scale-relationships and geometry of normal faults reactivated duringgravitational gliding of Albian rafts (Espírito Santo Basin, SE Brazil). Earth Planet.Sci. Lett. 331, 80–96.
Alves, T.M., Elliott, C., 2014. Fluid flow during early compartmentalisation of rafts: a NorthSea analogue for divergent continental margins. Tectonophysics 634, 91–96.
Anderson, E.M., 1951. The Dynamics of Faulting, 1951. Oliver and Boyd, Edinburgh.Andresen, K.J., Huuse,M., 2011. ‘Bulls-eye’ pockmarks and polygonal faulting in the Lower
Congo Basin: relative timing and implications for fluid expulsion during shallowburial. Mar. Geol. 279, 111–127.
Arts, R., Eiken, O., Chadwick, A., Zweigel, P., van der Meer, B., Kirby, G., 2004. Seismicmonitoring at the Sleipner underground CO2 storage site (North Sea). Geol. Soc.Lond., Spec. Publ. 233, 181–191.
115N.I.P. Ward et al. / Tectonophysics 690 (2016) 97–116
Arts, R., Vandeweijer, V., Hofstee, C., Pluymaekers, M., Loeve, D., Kopp, A., Plug, W., 2012.The feasibility of CO2 storage in the depleted P18-4 gas field offshore the Netherlands(the ROAD project). Int. J. Greenhouse Gas Control 11, S10–S20.
Barton, N., 1973. Review of a new shear-strength criterion for rock joints. Eng. Geol. 7,287–332.
Baudon, C., Cartwright, J., 2008. The kinematics of reactivation of normal faults using highresolution throw mapping. J. Struct. Geol. 30, 1072–1084.
Bentham, M., Green, A., Gammer, D., 2013. The occurrence of faults in the BunterSandstone Formation of the UK sector of the Southern North Sea and the potentialimpact on storage capacity. Energy Procedia 37, 5101–5109.
Bertoni, C., Cartwright, J.A., 2005. 3D seismic analysis of circular evaporite dissolutionstructures, Eastern Mediterranean. J. Geol. Soc. 162, 909–926.
Blenkinsop, T.G., 2004. Orebody geometry in lode gold deposits from Zimbabwe: implica-tions for fluid flow, deformation and mineralization. J. Struct. Geol. 26, 1293–1301.
Bouw, L., Essink, G., 2003. Fluid flow in the northern Broad Fourteens Basin during LateCretaceous inversion. Neth. J. Geosci. (Geol. Mijnb.) 82, 55–69.
Brown, A.R., Brown, A.R., Brown, A.R., Brown, A.R., 2004. Interpretation of three-dimensional seismic data. American Association of Petroleum Geologists, Tulsa.
Cartwright, J., Huuse, M., Aplin, A., 2007. Seal bypass systems. AAPG Bull. 91, 1141–1166.Cartwright, J., Santamarina, C., 2015. Seismic characteristics of fluid escape pipes in
sedimentary basins: implications for pipe genesis. Mar. Pet. Geol. 65, 126–140.Cartwright, J., Stewart, S., Clark, J., 2001. Salt dissolution and salt-related deformation of
the Forth Approaches Basin, UK North Sea. Mar. Pet. Geol. 18, 757–778.Cartwright, J.A., Trudgill, B.D., Mansfield, C.S., 1995. Fault growth by segment linkage: an
explanation for scatter in maximum displacement and trace length data from theCanyonlands Grabens of SE Utah. J. Struct. Geol. 17, 1319–1326.
Cathles, L., Su, Z., Chen, D., 2010. The physics of gas chimney and pockmark formation,with implications for assessment of seafloor hazards and gas sequestration. Mar.Pet. Geol. 27, 82–91.
Cawley, S., Saunders, M., Le Gallo, Y., Carpentier, B., Holloway, S., Kirby, G., Bennison, T.,Wickens, L., Wickramaratna, R., Bidstrup, T., 2015. The NGCAS project—assessingthe potential for EOR and CO2 storage at the Forties Oilfield, Offshore UK. CarbonDioxide Capture for Storage in Deep Geologic Formations—Results from the CO Vol.2, pp. 713–750.
Childs, C., Nicol, A., Walsh, J.J., Watterson, J., 2003. The growth and propagation ofsynsedimentary faults. J. Struct. Geol. 25, 633–648.
Coward, M., 1995. Structural and tectonic setting of the Permo-Triassic basins ofnorthwest Europe. Geol. Soc. Lond., Spec. Publ. 91, 7–39.
Coward, M., Stewart, S., 1995. Salt-influenced Structures in the Mesozoic–Tertiary Coverof the Southern North Sea, UK.
Curewitz, D., Karson, J.A., 1997. Structural settings of hydrothermal outflow: fracturepermeability maintained by fault propagation and interaction. J. Volcanol. Geotherm.Res. 79, 149–168.
De Lugt, I.R., Van Wees, J.D., Wong, T.E., 2003. The tectonic evolution of the southernDutch North Sea during the Palaeogene: basin inversion in distinct pulses.Tectonophysics 373, 141–159.
Duin, E., Doornenbal, J., Rijkers, R., Verbeek, J., Wong, T.E., 2006. Subsurface structure ofthe Netherlands—results of recent onshore and offshore mapping. Neth. J. Geosci.85, 245.
Farmer, I.W., Jumikis, A.R., 1968. Engineering Properties of Rocks. E. & F. N. Spon Limited,11 New Fetter Lane, London E.C.4.
Ferrill, D.A., Stamatakos, J.A., Sims, D., 1999. Normal fault corrugation: implications forgrowth and seismicity of active normal faults. J. Struct. Geol. 21, 1027–1038.
Frey-Martinez, J., Cartwright, J., Hall, B., Huuse, M., 2007. Clastic Intrusion at the Base ofDeep-Water Sands: A Trap-Forming Mechanism in the Eastern Mediterranean.
Frikken, H.W., 1999. Reservoir-Geological Aspects of Productivity and Connectivity ofGasfields in the Netherlands. Delft University of Technology, TU Delft.
Gay, A., Lopez, M., Berndt, C., Seranne, M., 2007. Geological controls on focused fluid flowassociated with seafloor seeps in the Lower Congo Basin. Mar. Geol. 244, 68–92.
Ge, H., Jackson, M.P., 1998. Physical modeling of structures formed by salt withdrawal:implications for deformation caused by salt dissolution. AAPG Bull. 82, 228–250.
Gerling, P., Geluk, M., Kockel, F., Lokhorst, A., Lott, G., Nicholson, R., 1999. ‘NW EuropeanGas Atlas’—new implications for the Carboniferous gas plays in the western part ofthe Southern Permian Basin. Geological Society, London, Petroleum Geology Confer-ence Series. Geological Society of London, pp. 799–808.
Grollimund, B., Zoback, M.D., Wiprut, D.J., Arnesen, L., 2001. Stress orientation, porepressure and least principal stress in the Norwegian sector of the North Sea. Pet.Geosci. 7, 173–180.
Handin, J., Hager Jr., R.V., Friedman, M., Feather, J.N., 1963. Experimental deformation ofsedimentary rocks under confining pressure: pore pressure tests. AAPG Bull. 47,717–755.
Hardman, R., Booth, J., 1991. The significance of normal faults in the exploration andproduction of North Sea hydrocarbons. Geol. Soc. Lond., Spec. Publ. 56, 1–13.
Healy, D., Blenkinsop, T.G., Timms, N.E., Meredith, P.G., Mitchell, T.M., Cooke, M.L., 2015.Polymodal faulting: time for a new angle on shear failure. J. Struct. Geol. 80, 57–71.
Heidbach, O., Tingay, M., Barth, A., Reinecker, J., Kurfeß, D., Müller, B., 2008. The WorldStress Map Database Release 2008 (2008). http://dx.doi.org/10.1594/GFZ WSM.Rel2008.
Heim, S., Lutz, R., Nelskamp, S., Verweij, H., Kaufmann, D., Reinhardt, L., 2013. Geologicalevolution of the North Sea: cross-border basin modeling study on the SchillgroundHigh. Energy Procedia 40, 222–231.
Herber, R., De Jager, J., 2010. Geoperspective oil and gas in the Netherlands—is there afuture? Neth. J. Geosci. 89, 91–107.
Hillis, R., Nelson, E., 2005. In situ stresses in the North Sea and their applications: petro-leum geomechanics from exploration to development. Geological Society, London,Petroleum Geology Conference Series. Geological Society of London, pp. 551–564.
Hooper, R.J., Goh, L.S., Dewey, F., 1995. The inversion history of the northeasternmargin ofthe Broad Fourteens Basin. Geol. Soc. Lond., Spec. Publ. 88, 307–317.
Hustoft, S., Bünz, S., Mienert, J., 2010. Three-dimensional seismic analysis of the morphol-ogy and spatial distribution of chimneys beneath the Nyegga pockmark field, offshoremid-Norway. Basin Res. 22, 465–480.
Hustoft, S., Mienert, J., Bünz, S., Nouzé, H., 2007. High-resolution 3D-seismic data indicatefocussed fluid migration pathways above polygonal fault systems of the mid-Norwegian margin. Mar. Geol. 245, 89–106.
Jackson, C.A.-L., Rotevatn, A., 2013. 3D seismic analysis of the structure and evolution of asalt-influenced normal fault zone: a test of competing fault growth models. J. Struct.Geol. 54, 215–234.
Kattenhorn, S.A., Pollard, D.D., 2001. Integrating 3-D seismic data, field analogs, andmechanical models in the analysis of segmented normal faults in the Wytch Farmoil field, southern England, United Kingdom. AAPG Bull. 85, 1183–1210.
Kopf, A.J., 2002. Significance of mud volcanism. Rev. Geophys. 40 2-1–2-52.Leveille, G.P., Knipe, R., More, C., Ellis, D., Dudley, G., Jones, G., Fisher, Q.J., Allinson, G.,
1997. Compartmentalization of Rotliegendes gas reservoirs by sealing faults, JupiterFields area, southern North Sea. Geol. Soc. Lond., Spec. Publ. 123, 87–104.
Lokhorst, A., Wildenborg, T., 2005. Introduction on CO2 geological storage—classificationof storage options. Oil Gas Sci. Technol. 60, 513–515.
Løseth, H., Gading, M., Wensaas, L., 2009. Hydrocarbon leakage interpreted on seismicdata. Mar. Pet. Geol. 26, 1304–1319.
Maione, S.J., Pickford, S., 2001. Discovery of ring faults associated with salt withdrawal ba-sins, Early Cretaceous age, in the East Texas Basin. The Leading Edge, pp. 818–829.
Mansfield, C., Cartwright, J., 1996. High resolution fault displacement mapping fromthree-dimensional seismic data: evidence for dip linkage during fault growth.J. Struct. Geol. 18, 249–263.
McFarland, J.M., Morris, A.P., Ferrill, D.A., 2012. Stress inversion using slip tendency.Comput. Geosci. 41, 40–46.
Morris, A., Ferrill, D.A., Henderson, D.B., 1996. Slip-tendency analysis and fault reactiva-tion. Geology 24, 275–278.
Nalpas, T., Le Douaran, S., Brun, J.-P., Unternehr, P., Richert, J.-P., 1995. Inversion of theBroad Fourteens Basin (offshore Netherlands), a small-scale model investigation.Sediment. Geol. 95, 237–250.
Neele, F., ten Veen, J., Wilschut, F., Hofstee, C., 2012. Independent assessment of high-capacity offshore CO2 storage options. TNO-Report, RCI-ISA Phase 3.
Newnes, S., 2014. Tectonic Reactivation as a Control on Gas and CO2 Leakage in theRotliegend Reservoir, Dutch North Sea. Cardiff University, Unpublished master'sthesis.
Omosanya, K.D.O., Alves, T.M., 2014. Mass-transport deposits controlling fault propaga-tion, reactivation and structural decoupling on continental margins (Espírito SantoBasin, SE Brazil). Tectonophysics 628, 158–171.
Osborne, M.J., Swarbrick, R.E., 1997. Mechanisms for generating overpressure in sedimen-tary basins: a reevaluation. AAPG Bull. 81, 1023–1041.
Oudmayer, B.C., De Jager, J., 1993. Fault reactivation and oblique-slip in the SouthernNorth Sea. In: Parker, J.R. (Ed.), PetroleumGeology of Northwest Europe: Proceedingsof the 4th Conference. The Geological Society, London, pp. 1281–1290.
Passey, Q., Creaney, S., Kulla, J., Moretti, F., Stroud, J., 1990. A practical model for organicrichness from porosity and resistivity logs. AAPG Bull. 74, 1777–1794.
Penge, J., Taylor, B., Huckerby, J., Munns, J., 1993. Extension and salt tectonics in the EastCentral Graben. Geological Society, London, Petroleum Geology Conference Series.Geological Society of London, pp. 1197–1209.
Price, N.J., Cosgrove, J.W., 1990. Analysis of Geological Structures. Cambridge UniversityPress, Cambridge.
Stewart, S.A., 1999. Seismic interpretation of circular geological structures. Pet. Geosci. 5,273–285.
Stewart, S.A., 2006. Implications of passive salt diapir kinematics for reservoir segmenta-tion by radial and concentric faults. Mar. Pet. Geol. 23, 843–853.
Stewart, S.A., Coward, M.P., 1995. Synthesis of salt tectonics in the southern North Sea,UK. Mar. Pet. Geol. 12, 457–475.
Underhill, J.R., 2004. Earth science: an alternative origin for the ‘Silverpit crater’. Nature428.
Underhill, J.R., 2009. Role of intrusion-induced salt mobility in controlling the forma-tion of the enigmatic ‘Silverpit Crater’, UK Southern North Sea. Pet. Geosci. 15,197–216.
Van Adrichem Boogaert, H., Kouwe, W., 1993. Stratigraphic nomenclature of theNetherlands, revision and update by RGD and NOGEPA. Med. Rijks Geol. Dienst. 50,1–40.
Van Adrichem Boogaert, H.A., Kouwe, W.F.P., 1994-1997. Stratigraphic nomenclature ofthe Netherlands, revision and update by RGD and NOGEPA. Mededelingen RijksGeologische Dienst, Section A-J.
van Gent, H.W., Back, S., Urai, J.L., Kukla, P.A., Reicherter, K., 2009. Paleostresses of theGroningen area, the Netherlands—results of a seismic based structural reconstruction.Tectonophysics 470, 147–161.
Van Hulten, F.F.N., 2010a. Can stratigraphic plays change the petroleum exploration out-look of the Netherlands? Geological Society, London, Petroleum Geology ConferenceSeries. Geological Society of London, pp. 261–275
Van Hulten, F.F.N., 2010b. Geological factors effecting compartmentalization of Rotliegendgas fields in the Netherlands. Geol. Soc. Lond., Spec. Publ. 347, 301–315.
Van Rensbergen, P., Rabaute, A., Colpaert, A., Ghislain, T.S., Mathijs, M., Bruggeman, A.,2007. Fluid migration and fluid seepage in the Connemara Field, Porcupine Basininterpreted from industrial 3D seismic and well data combined with high-resolution site survey data. Int. J. Earth Sci. 96, 185–197.
Van Wees, J.-D., Stephenson, R., Ziegler, P., Bayer, U., McCann, T., Dadlez, R., Gaupp, R.,Narkiewicz, M., Bitzer, F., Scheck, M., 2000. On the origin of the southern PermianBasin, central Europe. Mar. Pet. Geol. 17, 43–59.

116 N.I.P. Ward et al. / Tectonophysics 690 (2016) 97–116
Van Wijhe, D.V., 1987. Structural evolution of inverted basins in the Dutch offshore.Tectonophysics 137, 171–219.
Verweij, J.M., Simmelink, H.J., 2002. Geodynamic and hydrodynamic evolution of theBroad Fourteens Basin (The Netherlands) in relation to its petroleum systems. Mar.Pet. Geol. 19, 339–359.
Verweij, J.M., Simmelink, H.J., Van Balen, R.T., David, P., 2003. History of petroleum sys-tems in the southern part of the Broad Fourteens Basin. Neth. J. Geosci. 82, 71–90.
Weijermars, R., 2013. Economic appraisal of shale gas plays in Continental Europe. Appl.Energy 106, 100–115.
Wiprut, D., Zoback, M.D., 2000. Fault reactivation and fluid flow along a previouslydormant normal fault in the northern North Sea. Geology 28, 595–598.
Wiprut, D., Zoback, M.D., 2002. Fault reactivation, leakage potential, and hydrocarboncolumn heights in the northern North Sea. Norwegian Petroleum Society SpecialPublications Vol. 11, pp. 203–219.
Wong, T.E., Parker, N., Horst, P., 2001. Tertiary sedimentary development of the BroadFourteens area, the Netherlands. Geol. Mijnb. 80, 85–94.
Ziegler, P., 1992. North Sea rift system. Tectonophysics 208, 55–75.Ziegler, P.A., 1990. Geological atlas of western and central Europe. Shell Internationale
Petroleum, second ed. Maatschappij B.V., The Hague.Zoback, M.D., 2010. Reservoir Geomechanics. Cambridge University Press.