Embed Size (px)
Citation preview


RESERVE BANK OF INDIA
STATISTICAL TABLESRELATING TO
BANKS IN INDIA2012 – 13

Copies of this publication are available at the following address:
The Director, Division of Reports and Knowledge Dissemination (Sales Section)Department of Economic and Policy Research, Reserve Bank of India,
Amar Building (Ground Floor) Fort,Post Box No. 1036, Mumbai – 400 001.
Telephone : (022) 2260 3000 [Ext. : 4002] Fax : (022) 2263 2110Email : [email protected]
The publication can also be accessed through internet at the RBI Website http://dbie.rbi.org.in
PRICE
Inland : (i) ` 240 (ii) ` 300 (Inclusive of postage)
Abroad : (i) US $ 13 ( Inclusive of courier charges)
Cheque/Drafts should be drawn in favour of “Reserve Bank of India”Payable at Mumbai

I
CONTENTS FOREWORD
EXPLANATORY NOTES
LIABILITIES AND ASSETS OF RESERVE BANK OF INDIA – 2012 AND 2013
STATISTICS RELATING TO SCHEDULED COMMERCIAL BANKS AT A GLANCE
Table No. Title Page No.
SUMMARY TABLES
1 OFFICES
1.1 OfficesofCommercialBanksinIndia–2007to2013 1
1.2 Populationgroup-wisedistributionofofficesopenedorclosed by Commercial Banks – 2012 and 2013 3
1.3 Stateandpopulationgroup-wisedistributionofofficesof Commercial Banks – 2012 and 2013 5
1.4 State and population group-wise distribution of centresandofficesofCommercialBanks–2012and2013 7
1.5 OfficesofIndianCommercialBanksoutsideIndia–2011to2013 10
1.6 Region-wisedistributionofofficesofStateandDistrict Central Co-operative Banks – 2012 and 2013 11
1.7 State-wisedistributionofnumberofbranchesofStateand District Central Co-operative Banks – 2011 and 2012 13
2 BUSINESS
2.1 Business of Scheduled Banks in India – 2012-13 14
2.2 Bank group-wise business of Scheduled Banks in India – 2012-13 20
2.3 State-wise distribution of deposits and credit of Scheduled CommercialBanksinIndia-2012and2013 37
2.4 State and bank group-wise distribution of deposits and credit of Scheduled Commercial Banks – 2012 and 2013 39
2.5 Population group-wise distribution of deposits and credit of Scheduled Commercial Banks - 2009 to 2013 43
2.6 Bank group-wise selected ratios of Scheduled Commercial Banks – 2012 and 2013 45
2.7 Bankgroup-wisematurityprofileofselecteditemsof liabilitiesandassets–2012and2013 47

II
Table No. Title Page No.
3 LIABILITIES AND ASSETS
3.1 Bank group-wise liabilities and assets of Scheduled Commercial Banks in India – 2012 and 2013 51
3.2 State-wise distribution of liabilities and assets of State Co-operative Banks – 2011 and 2012 59
3.3 State-wise distribution of liabilities and assets of
District Central Co-operative Banks – 2011 and 2012 63
3.4 Liabilities and assets of Indian Scheduled Commercial Banks in foreign countries – 2011 to 2013 65
4 DEPOSITS
4.1 Maturity pattern of term deposits of Scheduled Commercial Banks – 2010 to 2012 66
4.2 Ownership of deposits with Scheduled CommercialBanks–2010and2012 67
5 ADVANCES
5.1 Bank group-wise classification of outstanding credit of Scheduled CommercialBanksaccordingtooccupation–2012 70
5.2 Bank group-wise distribution of outstanding credit of Scheduled CommercialBanksaccordingtosizeofcreditlimit–2012 74
5.3 Distribution of outstanding credit of Scheduled Commercial Banksaccordingtointerestraterange–2011and2012 76
5.4 OutstandingadvancesofScheduledCommercialBankstoexporters 77
5.5 Outstanding advances of Scheduled Commercial Banks forpublicfoodprocurementoperations 77
5.6 Sector-wisegrossbankcreditofScheduledCommercialBanks 78
5.7 Industry-wisegrossbankcreditofScheduledCommercialBanks 80
6 PRIORITY SECTOR ADVANCES
6.1 Distribution of select items of Scheduled Commercial Banks’ advancestoPrioritySectors–2012 82
6.2 State-wise distribution of outstanding advances of ScheduledCommercialBankstoAgriculture–2012 89
6.3 Distribution of outstanding advances of Public Sector Banks to Priority Sectors – 2013 93
6.4 Distribution of outstanding advances of Public Sector Banks to Agriculture – 2013 94
6.5 Distribution of outstanding advances of Public Sector Banks to micro and small enterprises, education, housing and to weaker sections under priority sector - 2013 95

III
Table No. Title Page No.
7 NPAs
7.1 Bankgroup-wiseclassificationofloanassetsofScheduled CommercialBanks–2008to2013 96
7.2 CompositionofNPAsofPublicSectorBanks–2004to2013 98
8 INVESTMENTS
8.1 InvestmentsofScheduledCommercialBanks–2011and2012 99
8.2 State-wisedistributionofScheduled Commercial Banks’ investments in State Government Securities and Shares/Debentures/Bonds of State Level Bodies – 2011 and 2012 101
9 EARNINGS AND EXPENSES
9.1 Bank group-wise earnings and expenses of Scheduled Commercial Banks in India – 2011-12 and 2012-13 106
10 EMPLOYEES
10.1 State-wise distribution of employees of Scheduled Commercial Banks – 2012 109
11 MISCELLANEOUS
11.1 Cash Reserve Ratio and interest rates – 2011-12 and 2012-13 110
11.2 Cheque Clearances – 2010-11 to 2012-13 111
11.3 NumberofClearingHouses–1987to2013 112
11.4 Bank group-wise and occupation-wise weighted average lending rate and deposit rate – 2011 and 2012 113
11.5 Bank group-wise insured deposits – 2011-12 and 2012-13 116
11.6 Bank Group-wise and Instrument-wise Derivatives of Scheduled CommercialBanksinIndiaasatendMarch2012and2013 117
BANK-WISE TABLES
B1 Liabilities and assets of Scheduled Commercial Banks – 2012 and 2013 119
B2 EarningsandexpensesofScheduledCommercialBanks–2011-12and2012-13 183
B3 Bank-wise Capital Adequacy Ratio (CRAR) of Scheduled Commercial Banks - 2012 and 2013 215
B4 ProvisionsandcontingenciesofScheduledCommercialBanks–2013 218
B5 Contingent liabilities of Scheduled Commercial Banks – 2012 and 2013 221
B6 Movement of Non-Performing Assets (NPAs) of Scheduled Commercial Banks – 2012 and 2013 227
B7 Bank-wiseandBankGroup-wiseGrossNon-PerformingAssets, Gross Advances, and Gross NPA Ratio of Scheduled Commercial Banks – 2013 230

IV
Table No. Title Page No.
B8 AppropriationofprofitofScheduledCommercialBanks–2011-12and2012-13 233
B9 Exposure to sensitive sectors of Scheduled Commercial Banks – 2012 and 2013 242
B10 MaturityprofileofselecteditemsofliabilitiesandassetsofScheduled Commercial Banks – 2012 and 2013 245
B11 Loan subjected to restructuring and corporate debt restructured – 2012-13 293
B12 Selected ratios of Scheduled Commercial Banks – 2012 and 2013 295
B13 Bank-wise, Bank Group-wise and population group-wise number of branches of Scheduled Commercial Banks – 2012 and 2013 319
B14 CommercialBanksandtheirofficesinStatesand UnionTerritories–2012and2013 327
B15 Bank-wise and category-wise employees of Scheduled Commercial Banks – 2012 and 2013 343
B16 Unclaimed deposits with Scheduled Commercial Banks – 2012 345
B17 ListofamalgamatedRegionalRuralBanksasonSeptember02,2013 351
B18 Bank-wiseandcountry-wiseofficesofIndianScheduled Commercial Banks outside India – 2013 355
MAPS
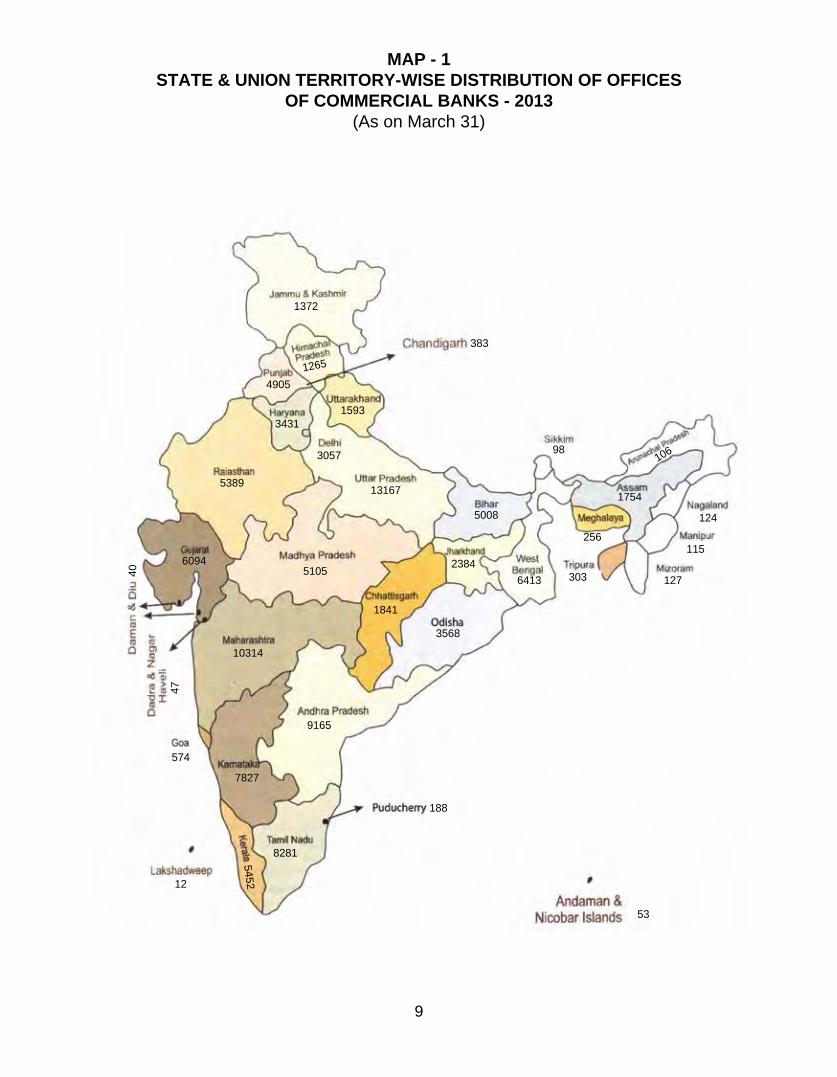
1 StateandUnionTerritory-wisedistributionofofficesofCommercialBanks–2013 9 2 State and Union Territory-wise credit-deposit ratio of Scheduled Commercial Banks – 2013 42
GRAPHS 1 Populationgroup-wisedistributionofnumberofofficesof Commercial Banks – 2012 and 2013 2
2 All Scheduled Banks’ business in India – 2005-06 to 2012-13 36
3 Population group-wise distribution of deposits and credit of Scheduled Commercial Banks – 2012 and 2013 44
4 Occupation-wise distribution of credit by Scheduled Commercial BanksaccordingtoBankGroups–2012 73
5 Distribution of outstanding credit of Scheduled Commercial Banks accordingtointerestraterange–2011and2012 75
6 Composition of investments of Scheduled Commercial Banks – 2011 and 2012 100
7 Earnings,expensesandprofitsofScheduled CommercialBanks–2007-08to2012-13 104
8 CompositionofmajoritemsintotalearningsandexpensesofScheduled Commercial Banks – 2011-12 and 2012-13 105
V
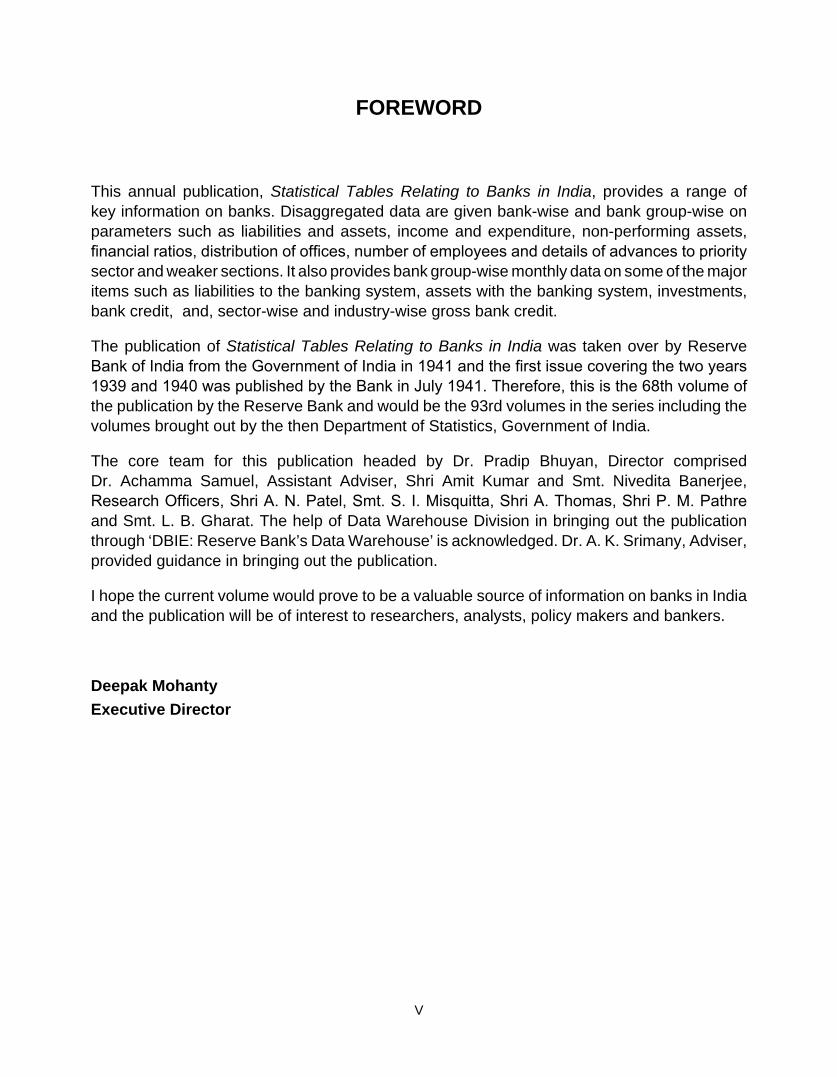
FOREWORD
This annual publication, Statistical Tables Relating to Banks in India, provides a range of key information on banks. Disaggregated data are given bank-wise and bank group-wise on parameters such as liabilities and assets, income and expenditure, non-performing assets, financialratios,distributionofoffices,numberofemployeesanddetailsofadvancestoprioritysector and weaker sections. It also provides bank group-wise monthly data on some of the major items such as liabilities to the banking system, assets with the banking system, investments, bank credit, and, sector-wise and industry-wise gross bank credit.
The publication of Statistical Tables Relating to Banks in India was taken over by Reserve BankofIndiafromtheGovernmentofIndiain1941andthefirstissuecoveringthetwoyears1939and1940waspublishedbytheBankinJuly1941.Therefore,thisisthe68thvolumeofthe publication by the Reserve Bank and would be the 93rd volumes in the series including the volumes brought out by the then Department of Statistics, Government of India.
The core team for this publication headed by Dr. Pradip Bhuyan, Director comprised Dr. Achamma Samuel, Assistant Adviser, Shri Amit Kumar and Smt. Nivedita Banerjee, ResearchOfficers,ShriA.N.Patel,Smt.S.I.Misquitta,ShriA.Thomas,ShriP.M.Pathreand Smt. L. B. Gharat. The help of Data Warehouse Division in bringing out the publication through ‘DBIE: Reserve Bank’s Data Warehouse’ is acknowledged. Dr. A. K. Srimany, Adviser, provided guidance in bringing out the publication.
I hope the current volume would prove to be a valuable source of information on banks in India and the publication will be of interest to researchers, analysts, policy makers and bankers.
Deepak MohantyExecutive Director


VII
EXPLANATORY NOTESI. Bank-related1. All banks which are included in the Second Schedule to the Reserve Bank of India Act, 1934 are Scheduled
Banks. These banks comprise Scheduled Commercial Banks and Scheduled Co-operative Banks. 2. Scheduled Commercial Banks in India are categorised into five different groups according to their
ownership and / or nature of operation. These bank groups are (i) State Bank of India and its Associates, (ii) Nationalised Banks, (iii) Private Sector Banks, (iv) Foreign Banks, and (v) Regional Rural Banks. In the bankgroup-wiseclassification,IDBIBankLtd.isincludedinNationalisedBanks.
3. Scheduled Co-operative Banks consist of Scheduled State Co-operative Banks and Scheduled Urban Co-operative Banks.
4. Regional Rural Banks and Scheduled Co-operative Banks are excluded in bank-wise tables and their summary tables at bank group level. However, details of Regional Rural Banks and Scheduled Co-operative Banks as groups are presented in Tables 2.1 and 2.2.
5. During the financial year2012-13, the following changeshave takenplace in the commercial bankingsystem:i) The name of “Oman International Bank” has been changed to “HSBC Bank Oman S. A. O. G.” with
effect from June 3, 2012.
ii) The Foreign Bank, “Westpac Banking Corporation”, was included in the second schedule of the Reserve Bank of India Act, 1934 with effect from January 12, 2013.
iii) The Foreign Bank, “Sumitomo Mitsui Banking Corporation”, was included in the second schedule of the Reserve Bank of India Act, 1934 with effect from February 2, 2013.
Thesechangesarereflectedinthetableswhereindividualbank’sdataarepresented.6. Population groups of the banked centres presented in this volume are based on the 2001 census. The
populationgroupsaredefinedasunder:
Population Population Groups
0 - 10,000 Rural
10,000 - 1,00,000 Semi-Urban
1,00,000 - 10,00,000 Urban
10,00,000 & above Metropolitan
II. Table-related
Tables 2.1 and 2.2 - Data are compiled from the fortnightly “Form-A” returns submitted by the Scheduled Commercial Banks under Section 42(2) of the Reserve Bank of India Act, 1934 and relate to their business in India. Inter-bank deposits / assets of maturity of 15 days and above and up to 1 year are excluded. Data on balances with the Reserve Bank of India are obtained from Weekly Statement of Affairs of the Reserve Bank of India, Department of Government and Bank Accounts.
Tables 2.3, 2.4, 2.5, 4.1, 5.1, 5.2 and 5.3 –ThedepositfiguresreportedinTables2.3,2.4,2.5and4.1exclude inter-bank deposits and, therefore, their coverage is different from that of ‘deposits’ reported in table 3.1. The bank credit data in tables 2.3, 2.4, 2.5, 5.1, 5.2 and 5.3 comprise term loans, cash credit, overdrafts and bills purchased and discounted. In addition, the data on bank credit in tables 5.1, 5.2 and 5.3 also include dues from banks.
Tables 2.6 and B12 –SelectedfinancialratiosofScheduledCommercialBanks(excludingRRBs)areobtained / calculated from the published annual accounts of banks and relate to the year ended March 31 of 2012 and 2013. The ratios 21 and 30 to 35, viz., “return on assets”, “business (deposits plus advances) peremployee”,“profitperemployee”,“capitaladequacyratio”,“capitaladequacyratio–TierI”,“capital

VIII
adequacy ratio- Tier II” and “ratio of net NPAs to net advances” are obtained from “notes to accounts” of published annual accounts of individual banks. They are not aggregated at the bank-group level.
Other ratios are calculated using the following concepts.
1. Definitionsoftheconceptsusedintheratiosareasfollows:(i) Cash in cash-deposit ratio includes cash in hand and balances with RBI.(ii) Investments in investment-deposit ratio represent total investments including investments in non-
approved securities.(iii) Netinterestincomeisdefinedasthetotalinterestearnedlesstotalinterestpaid.(iv) Intermediationcostisdefinedastotaloperatingexpenses.(v) Wagebillsaredefinedaspaymentstoandprovisionsforemployees(PPE).(vi) Operating profit is defined as total earnings less total expenses, excluding provisions and
contingencies, and(vii) Burdenisdefinedasthetotalnon-interestexpenseslesstotalnon-interestincome.
2. Items like capital, reserves, deposits, borrowings, advances, investments and assets / liabilities used to computevariousfinancialearnings/expensesratios(Sr.no.11to29)areaveragesforthetworelevantyears.
3. Definitionsoftheratiosareasfollows:(i) Cash-Deposit ratio = (Cash in hand + Balances with RBI) / Deposits.(ii) Ratio of secured advances to total advances = (Advances secured by tangible assets + Advances
covered by bank or Govt. guarantees) / Advances.(iii) Ratio of interest income to total assets = Interest earned / Total assets.(ii) Net interest margin = Net Interest Income / Total Assets.(iv) Ratio of non-interest income to total assets = Other income / Total assets.(v) Ratio of intermediation cost to total assets = Operating expenses / Total assets.(vi) Ratio of wage bill to intermediation costs (Operating Expenses) = PPE / Operating Expenses.(vii) Ratio of wage bill to total expenses = PPE / Total expenses.(viii) Ratio of wage bill to total income = PPE / Total income.(ix) Ratio of burden to total assets = (Operating expenses - Other income) / Total assets.(x) Ratio of burden to interest income = (Operating expenses - Other income) / Interest income.(xi) Ratioofoperatingprofitstototalassets=Operatingprofit/Totalassets.(xii) Return on assets for a bank group (for Table 2.6) is obtained as weighted average of return on
assets of individual banks (from Table B12) in the group, weights being the proportion of total assets of the bank as percentage to total assets of all banks in the corresponding bank group.
(xiii) ReturnonEquity=NetProfit/(Capital+ReservesandSurplus).(xiv) Cost of Deposits = IPD / Deposits.(xv) Cost of Borrowings = IPB / Borrowings.(xvi) Cost of Funds = (IPD + IPB) / (Deposits + Borrowings).(xvii) Return on Advances = IEA / Advances.(xviii) Return on Investments = IEI / Investments.(xix) Return on Advances adjusted to Cost of Funds = Return on Advances – Cost of Funds.(xx) Return on Investment adjusted to Cost of Funds = Return on Investments – Cost of Funds.
Wherever appropriate, denominators in the ratios use averages of “current year” and “previous year”. For instance, ratio of net interest margin to total assets for the year 2012-13 uses denominator as average total assets for the years 2011-12 and 2012-13. Abbreviationsusedintheabovedefinitionsareasfollows.PPE = Payments to and provisions for employeesIPD = Interest paid on depositsIPB = Interest paid on borrowings from RBI and other agenciesIEA = Interest earned on advances and billsIEI = Interest earned on investments Table 4.2 –Fortheyear2010,thedepositshavebeenestimatedusingstratifiedrandomsampleof21,881
branches. From 2012, the survey is being conducted on census basis, and the results are based on data received from 94,062 branches. Data for 2011 are not published.

IX
Tables 6.1 to 6.5 - Apart from giving separate data for some sub-heads of priority sector, the priority sector advances have been presented as per cent of Adjusted Net Bank Credit (ANBC) or credit equivalent of Off-Balance Sheet Exposures (OBE) whichever is higher.
Tables 9.1 and B2 –Datainthesetablesareobtainedfromvariousschedulesofprofitandlossaccountas published by banks in their annual accounts. ‘Total expenses’ shown in these tables exclude ‘provisions andcontingencies’.Theitem‘profit’iscomputedbysubtractinginterestexpenses,operatingexpensesandprovisions and contingencies from total earnings of the bank.
Table 10.1 - This table is based on the data collected through Basic Statistical Return (BSR) II and include only full-time employees of the banks.
Table 11.4 - Data are based on BSR I and BSR II received from all branches of scheduled commercial banks.
Tables B1 to B12 - Present data on individual Scheduled Commercial Banks, excluding Regional Rural Banks.
Table B16 - Data relate to deposit accounts in India, which have not been operated upon for 10 years or more as on 31st December 2012 and are based on returns submitted by banks in Form IX under Section 26 of the Banking Regulation Act, 1949.
III. General1. The totals in the tables may not exactly tally with the sum of the constituent items on account of
roundingoffofthefigures.2. Figuresinbrackets,unlessotherwisespecified,indicatepercentagetototals.3. The unit million is equal to 1,000,000 and unit billion is equal to 1,000,000,000.4. The symbol `–’ indicates nil / negligible and ‘..’ not available / not applicable. 5. Source and notes as appropriate are given at the end of each table.6. Thefinancialyears‘2012’and‘2013’referto‘April2011toMarch2012’and‘April2012toMarch2013’
respectively.7. Someofthedataforthepreviousyearshavebeenrevised.8. ThepublicationcanalsobeaccessedthroughDBIEplatformatRBIWebsiteinthelink http://dbie.rbi.org.in.

X
As on As on As on As on
Liabilities March 31, March 31, Assets March 31, March 31,
2012 2013 2012 2013
(1) (2) (3) (4)
1. Capital paid-up 50 50 1. Notes 130 92
2. Rupee coin 1 --
2. Reserve fund 65000 65000 3. Small coin -- --
4. Bills purchased and discounted -- --
3. National Industrial Credit 200 210 (a) Internal -- --
(long-term operations) Fund (b) External -- --
(c) Government Treasury bills -- --
4. National Housing Credit 1940 1950 5. Balances held abroad 3087187 2930963
(long-term operations) Fund 6. Investments@ 5980338 6821578
7.Loansandadvancesto: 10289 10159
5. Deposits 3929047 4008406 (i) Central Government -- --
(ii) State Government 10289 10159
a) Government 241947 666466 8.Loansandadvancesto: 75073 421119
(i) Scheduled Commercial Banks 48474 403446
(i) Central Government 241522 666042 (ii) Scheduled State Co-operative Banks -- --
(ii) State Government # 425 424 (iii) Other Scheduled Co-operative Banks -- 92
(iv) Non-scheduled State Co-operative Banks -- --
b) Banks 3562915 3206711 (v) National Bank for Agriculture and -- --
Rural Development (NABARD)
(i) Scheduled Commercial 3373574 3018916 (vi) Others 26599 17581
Banks 9. Loans, advances and investments from National -- --
Industrial Credit (long-term operations) Fund
(ii) Scheduled State 37592 35313 (a) Loans and advances to: -- --
Co-operative Banks (i) Industrial Development Bank of India -- --
(ii) Export Import Bank of India -- --
(iii) Other Scheduled 57148 59534 (iii) Industrial Investment Bank of India -- --
Co-operative Banks (iv) Others -- --
(b) Investments in bonds/debentures issued by: -- --
(iv) Non-scheduled State 860 2522 (i) Industrial Development Bank of India -- --
Co-operative Banks (ii) Export Import Bank of India -- --
(iii) Industrial Investment Bank of India -- --
(v) Other banks 93741 90426 (iv) Others -- --
10. Loans, advances and investments from National -- --
c) Others 124185 135229 Housing Credit (long-term operations) Fund
(a) Loans and advances to National Housing Bank -- --
6. Bills payable 9447 228 (b) Investments in bonds/debentures issued by -- --
National Housing Bank
7.Otherliabilities 5898808 6880060 11. Other assets * 751474 771993Total Liabilities 9904492 10955904 Total Assets 9904492 10955904
1. Notes held in the 130 92 1. Gold coin and bullion 724435 732225
Banking department (i) Held in India 724435 732225
(ii) Held outside India -- --
2. Notes in circulation 10537859 11756354 2. Foreign Securities 9802249 11011884Total (1+2) 10526684 117441093. Rupee coin 841 1873
4. Government of India rupee securities 10464 10464
5. Internal bills of exchange -- --
& other commercial paperTotal Liabilities ( Total notes issued ) 10537989 11756446 Total Assets 10537989 11756446
Note:*IncludesgoldvaluedatRs.658067.10millionasonMarch31,2012andRs.665143.40millionasonMarch31,2013.
# : Includes the balance of Government of Union Territory of Puducherry.Source : Weekly Statement of Affairs of the Reserve Bank of India, Department of Government and Bank Accounts.
(Amount in ` million)
LIABILITIES AND ASSETS OF THE RESERVE BANK OF INDIA : 2012 AND 2013
BANKING DEPARTMENT
ISSUE DEPARTMENT
@:IncludesForeignCurrencyAssetofRs.447751.3millionasonMarch31,2012&Rs.238116.2millionasonMarch31,2013whichformspartofbalancesheldabroad.

XI
Indicators March March March March March March March March March2005 2006 2007 2008 2009 2010 2011 2012 2013
Number of Commercial Banks 288 222 182 173 170 167 167 173 155(a) Scheduled Commercial Banks 284 218 178 169 166 163 163 169 151of which : Regional Rural Banks 196 133 96 90 86 82 82 82 64(b) Non-Scheduled Commercial Banks 4 4 4 4 4 4 4 4 4
Number of Bank Offices in India 70373 72072 74653 78787 82897 88203 94019 102377 109811 (a) Rural 30790 30251 30409 30927 31598 32529 33868 36503 39439 (b) Semi-Urban 15325 15991 16770 18027 19337 21022 23299 26144 28691 (c) Urban 12419 13232 14202 15566 16726 18288 19046 20650 21720 (d) Metropolitan 11839 12598 13272 14267 15236 16364 17806 19080 19961
Population per Office (in thousands) 16 16 15 15 15 14 13 13 12
Aggregate deposits of Scheduled Commercial Banks in India (Rs. billion) 17001.98 21090.49 26119.34 31969.40 38341.10 44928.26 52079.69 59090.82 67504.54
(a) Demand deposits 2480.28 3646.40 4297.31 5243.10 5230.85 6456.10 6417.05 6253.30 6622.99 (b) Time deposits 14521.71 17444.09 21822.03 26726.30 33110.25 38472.16 45662.64 52837.52 60881.55
Bank credit of Scheduled Commercial Banks in India (Rs. billion) 11004.28 15070.77 19311.90 23619.13 27755.49 32447.88 39420.83 46118.52 52604.59
SLR investments of Scheduled Commercial Banks in India (Rs. billion) 7391.54 7174.54 7915.16 9717.14 11664.10 13847.53 15016.19 17377.87 20061.05
Deposits of Scheduled Commercial Banks per office (Rs. million) 257 305 368 434 498 548 609 643 674
Credit of Scheduled Commercial Banks per office (Rs. million) 170 221 276 322 362 398 458 498 526
Per capita Deposit of Scheduled 16281 19130 23382 28610 33919 39107 45505 50183 56380Commercial Banks (Rs.)
Per capita Credit of Scheduled Commercial Banks (Rs.) 10752 13869 17541 21218 24617 28431 34187 38874 44028
Deposits of Scheduled Commercial Banks as percentage to Gross National Product at factor cost (at current prices) 62.3 64.3 68.8 72.8 77.1 78.2 78.2 78.0 79.4
Scheduled Commercial Banks' Advances to Priority Sectors (Rs. billion) 3706.03 5127.90 6553.17 7814.76 9089.29 10915.10 13158.59 14710.5 16411.0
Share of Priority Sector Advances in Total Advances of Scheduled Commercial Banks (per cent) 32.2 33.8 33.1 31.6 30.3 31.2 30.6 29.5 28.8
Credit-Deposit Ratio (per cent) 62.6 70.1 73.5 74.6 73.8 73.7 76.5 78.6 79.1
Investment-Deposit Ratio (per cent) 47.3 40.0 35.3 35.5 35.7 36.4 34.3 34.6 35.2
Cash-Deposit Ratio (per cent) 6.4 6.7 7.2 9.7 7.3 7.7 8.2 5.8 5.1
STATISTICS RELATING TO COMMERCIAL BANKS AT A GLANCE
Notes :
6) For working out cash-deposit ratio, cash is taken as the total of 'cash in hand' and 'balances with the Reserve Bank of India'. 7) Investments of Scheduled Commercial Banks in India include only investments in government securities and other approved securities.
1) Number of bank offices includes Administrative Offices.
2) Classification of bank offices according to population, for years are based on 2001 census.
3) Population per office, per capita deposits and per capita credit are based on the estimated population figures as on March 01, supplied by the Office of the Registrar General, India.4) Aggregate deposits, bank credit and SLR investments of Scheduled Commercial Banks in India are as per "Form-A" return under Section 42(2) of the Reserve Bank of India Act, 1934 and relate to the last Friday of the reference period.5) Scheduled Commercial Banks' advances to priority sectors and the related ratios are exclusive of Regional Rural Banks.

Summary Tables

1
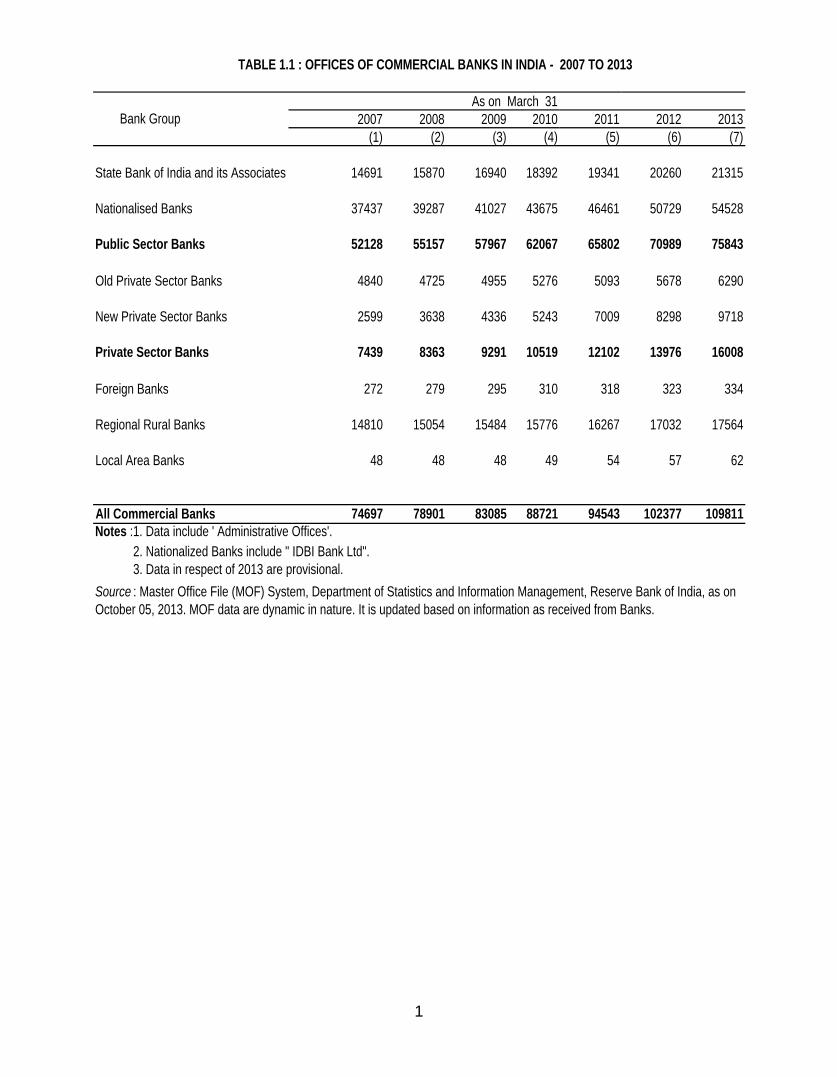
2007 2008 2009 2010 2011 2012 2013(1) (2) (3) (4) (5) (6) (7)
State Bank of India and its Associates 14691 15870 16940 18392 19341 20260 21315
Nationalised Banks 37437 39287 41027 43675 46461 50729 54528
Public Sector Banks 52128 55157 57967 62067 65802 70989 75843
Old Private Sector Banks 4840 4725 4955 5276 5093 5678 6290
New Private Sector Banks 2599 3638 4336 5243 7009 8298 9718
Private Sector Banks 7439 8363 9291 10519 12102 13976 16008
Foreign Banks 272 279 295 310 318 323 334
Regional Rural Banks 14810 15054 15484 15776 16267 17032 17564
Local Area Banks 48 48 48 49 54 57 62
All Commercial Banks 74697 78901 83085 88721 94543 102377 109811Notes :1. Data include ' Administrative Offices'. 2. Nationalized Banks include " IDBI Bank Ltd". 3. Data in respect of 2013 are provisional.
As on March 31
TABLE 1.1 : OFFICES OF COMMERCIAL BANKS IN INDIA - 2007 TO 2013
Bank Group
Source : Master Office File (MOF) System, Department of Statistics and Information Management, Reserve Bank of India, as on October 05, 2013. MOF data are dynamic in nature. It is updated based on information as received from Banks.

2
GRAPH - 1POPULATION GROUP-WISE DISTRIBUTION OF NUMBER OF OFFICES OF
COMMERCIAL BANKS - 2012 AND 2013(As on March 31)
0
5000
10000
15000
20000
25000
30000
35000
40000
2012 2013
36503 39439
2614428691
2065021720
19080 19961
Rural Semi-Urban Urban Metropolitan

3
Rural Semi-Urban Urban Metropo-
litan Total Rural Semi-Urban Urban Metropo-
litan Total
(1) (2) (3) (4) (5) (6) (7) (8) (9) (10)State Bank of India and its Associates @ 6704 5822 4162 3572 20260 353 221 222 149 945Nationalised Banks 15666 12281 11576 11206 50729 1359 1502 818 597 4276Public Sector Banks 22370 18103 15738 14778 70989 1712 1723 1040 746 5221Old Private Sector Banks @ 898 2048 1527 1205 5678 121 291 84 93 589New Private Sector Banks 705 2659 2258 2676 8298 158 596 252 285 1291Private Sector Banks 1603 4707 3785 3881 13976 279 887 336 378 1880Foreign Banks 7 8 62 246 323 0 0 0 5 5Regional Rural Banks 12507 3300 1050 175 17032 551 156 45 14 766Local Area Banks 16 26 15 0 57 2 1 0 0 3All Commercial Banks 36503 26144 20650 19080 102377 2544 2767 1421 1143 7875
Rural Semi-Urban Urban Metropo-
litan Total Rural Semi-Urban Urban Metropo-
litan Total
(11) (12) (13) (14) (15) (16) (17) (18) (19) (20)State Bank of India and its Associates 0 2 16 10 28 353 219 206 139 917Nationalised Banks $ 1 0 3 4 8 1358 1502 815 593 4268Public Sector Banks 1 2 19 14 36 1711 1721 1021 732 5185Old Private Sector Banks 0 0 1 1 2 121 291 83 92 587New Private Sector Banks 0 1 0 1 2 158 595 252 284 1289Private Sector Banks 0 1 1 2 4 279 886 335 376 1876Foreign Banks 0 0 0 0 0 0 0 0 5 5Regional Rural Banks 1 0 0 0 1 550 156 45 14 765Local Area Banks 0 0 0 0 0 2 1 0 0 3All Commercial Banks 2 3 20 16 41 2542 2764 1401 1127 7834
Notes : 1. @ Number of branches as on March 31, 2012 comprises the effect of merger of SBI Commercial & International Bank Ltd. (old private sector bank) with State Bank of India w.e.f. 29 July- 2011. 2. Data include 'Administrative Offices'. 3. '0' indicate 'Nil'. 4. Data in respect of 2013 are provisional. 5. Population groups are defined as follows: 'Rural' includes centres with population of less than 10,000, 'Semi-Urban' includes centres with population of 10,000 and above but less than of one lakh, 'Urban' includes centres with population of one lakh and above but less than of ten lakhs, and 'Metropolitan' includes centres with population of 10 lakhs and above. All population figures are as per census 2001.Source : Master Office File (MOF) System, Department of Statistics and Information Management, Reserve Bank of India, as on October 05, 2013. MOF data are dynamic in nature. It is updated based on information as received from Banks.
Closed/merged/converted during April 01,2011 to March 31,2012 Net increase(+) or decrease (-)
TABLE 1.2: POPULATION GROUP-WISE DISTRIBUTION OF OFFICES OPENED OR CLOSED BY COMMERCIAL BANKS - 2012 AND 2013Number of Offices
As on March 31, 2012 Opened during April 1, 2011 to March 31,2012Bank Group
Bank Group
Number of Offices

4
Rural Semi-Urban Urban Metropo-
litan Total Rural Semi-Urban Urban Metropo-
litan Total
(1) (2) (3) (4) (5) (6) (7) (8) (9) (10)State Bank of India and its Associates 7095 6137 4355 3728 21315 392 318 197 159 1066Nationalised Banks $ 17052 13657 12152 11667 54528 1387 1376 580 469 3812Public Sector Banks 24147 19794 16507 15395 75843 1779 1694 777 628 4878Old Private Sector Banks 1071 2358 1615 1246 6290 173 310 88 41 612New Private Sector Banks 1292 3119 2429 2878 9718 587 460 171 203 1421Private Sector Banks 2363 5477 4044 4124 16008 760 770 259 244 2033Foreign Banks 8 10 66 250 334 1 2 4 5 12Regional Rural Banks 12904 3381 1087 192 17564 399 82 38 17 536Local Area Banks 17 29 16 0 62 1 3 1 0 5All Commercial Banks 39439 28691 21720 19961 109811 2940 2551 1079 894 7464
Rural Semi-Urban Urban Metropo-
litan Total Rural Semi-Urban Urban Metropo-
litan Total
(11) (12) (13) (14) (15) (16) (17) (18) (19) (20)State Bank of India and its Associates 1 3 4 3 11 391 315 193 156 1055Nationalised Banks $ 1 0 4 8 13 1386 1376 576 461 3799Public Sector Banks 2 3 8 11 24 1777 1691 769 617 4854Old Private Sector Banks 0 0 0 0 0 173 310 88 41 612New Private Sector Banks 0 0 0 1 1 587 460 171 202 1420Private Sector Banks 0 0 0 1 1 760 770 259 243 2032Foreign Banks 0 0 0 1 1 1 2 4 4 11Regional Rural Banks 2 1 1 0 4 397 81 37 17 532Local Area Banks 0 0 0 0 0 1 3 1 0 5All Commercial Banks 4 4 9 13 30 2936 2547 1070 881 7434Notes : 1. @ Number of branches as on March 31, 2012 comprises the effect of merger of SBI Commercial & International Bank Ltd. (old private sector bank) with State Bank of India w.e.f. 29 July- 2011. 2. Data include 'Administrative Offices'. 3. '0' indicate 'Nil'. 4. Data in respect of 2013 are provisional. 5. Population groups are defined as follows: 'Rural' includes centres with population of less than 10,000, 'Semi-Urban' includes centres with population of 10,000 and above but less than of one lakh, 'Urban' includes centres with population of one lakh and above but less than of ten lakhs, and 'Metropolitan' includes centres with population of 10 lakhs and above. All population figures are as per census 2001.Source : Master Office File (MOF) System, Department of Statistics and Information Management, Reserve Bank of India, as on October 05, 2013. MOF data are dynamic in nature. It is updated based on information as received from Banks.
Number of OfficesClosed/merged/converted during April 1,2012 to March 31, 2013 Net increase(+) or decrease (-)
TABLE 1.2: POPULATION GROUP-WISE DISTRIBUTION OF OFFICES OPENED OR CLOSED BY COMMERCIAL BANKS - 2012 AND 2013 (Concld.)
Bank Group
Bank Group
Number of OfficesAs on March 31, 2013 Opened during April 1,2012 to March 31,2013

5
Rural Semi- Urban
Urban Metro-politan
Total Rural Semi- Urban
Urban Metro-politan
Total
(1) (2) (3) (4) (5) (6) (7) (8) (9) (10) (11)Chhattisgarh 1478 75 64 52 0 191 781 400 485 0 1666
Madhya Pradesh 4548 73 135 50 38 296 1854 1324 969 689 4836
Uttar Pradesh 11341 412 268 174 119 973 5600 2484 2301 1927 12312
Uttarakhand 1337 59 50 27 0 136 692 449 332 0 1473Central Region Total 18704 619 517 303 157 1596 8927 4657 4087 2616 20287
Andaman & Nicobar 43 3 1 0 0 4 22 25 0 0 47Bihar 4389 109 113 56 35 313 2574 1149 624 354 4701Jharkhand 2035 71 61 39 5 176 1100 514 469 127 2210Odisha 3108 69 113 56 0 238 1820 809 717 0 3346Sikkim 85 6 0 0 0 6 62 29 0 0 91West Bengal 5772 95 97 103 74 369 2558 845 1215 1522 6140Eastern Region Total 15432 353 385 254 114 1106 8136 3371 3025 2003 16535
Arunachal Pradesh 89 3 6 0 0 9 54 44 0 0 98Assam 1566 12 32 38 0 82 819 434 394 0 1647Manipur 86 7 3 2 0 12 43 30 25 0 98Meghalaya 223 5 4 8 0 17 134 40 66 0 240Mizoram 103 4 5 4 0 13 61 20 35 0 116Nagaland 96 4 8 0 0 12 41 67 0 0 108Tripura 251 13 8 6 0 27 136 74 68 0 278North Eastern Region Total 2414 48 66 58 0 172 1288 709 588 0 2585
Chandigarh 344 1 0 25 0 26 10 0 360 0 370Delhi 2725 17 7 0 145 169 79 46 0 2768 2893Haryana 2755 124 88 82 22 316 949 749 1194 178 3070Himachal Pradesh 1108 57 24 5 0 86 880 233 81 0 1194Jammu & Kashmir 1132 50 33 26 0 109 645 266 330 0 1241Punjab 4044 134 144 62 37 377 1470 1408 906 634 4418Rajasthan 4586 117 167 61 34 379 1953 1427 1049 529 4958Northern Region Total 16694 500 463 261 238 1462 5986 4129 3920 4109 18144
Andhra Pradesh 7891 243 201 108 112 664 2871 2089 1845 1750 8555Karnataka 6715 238 154 98 100 590 2487 1558 1571 1689 7305Kerala 4744 14 266 72 0 352 353 3386 1357 0 5096
Lakshadweep 12 0 0 0 0 0 8 4 0 0 12
Puducherry 160 2 4 6 0 12 36 44 92 0 172
Tamil Nadu 6985 230 312 119 71 732 2028 2476 1859 1351 7714Southern Region Total 26507 727 937 403 283 2350 7783 9557 6724 4790 28854
Dadra & Nagar Haveli 35 2 4 0 0 6 12 29 0 0 41
Daman & Diu 25 0 11 0 0 11 2 34 0 0 36Goa 488 24 21 0 0 45 205 328 0 0 533Gujarat 5208 141 149 50 110 450 1773 1396 811 1678 5658Maharashtra 9036 130 214 92 241 677 2391 1934 1495 3884 9704Western Region Total 14792 297 399 142 351 1189 4383 3721 2306 5562 15972
Grand Total 94543 2544 2767 1421 1143 7875 36503 26144 20650 19080 102377Notes : 1) Data include ‘Administrative Offices’. 2) Population groups are defined as follows: 'Rural' includes centres with population of less than 10,000, 'Semi-Urban' includes centres with population of 10,000 and abovebut less than of one lakh, 'Urban' includes centres with population of one lakh and above but less than of ten lakhs, and 'Metropolitan' includes centres with population of 10 lakhs
and above. All population figures are as per census 2001.Source : Master Office File (MOF) System, Department of Statistics and Information Management, Reserve Bank of India, as on October 05, 2013. MOF data are dynamic in nature. It is updated based on information as received from Banks.
TABLE 1.3 : STATE AND POPULATION GROUP-WISE DISTRIBUTION OF OFFICES OF COMMERCIAL BANKS - 2012 AND 2013
Regions / States / Union Territories
Number of Offices
As on March 31,
2011
Opened during April 01, 2011 to March 31, 2012 As on March 31, 2012

6
Rural Semi- Urban
Urban Metro-politan
Total Rural Semi- Urban
Urban Metro-politan
Total
(1) (2) (3) (4) (5) (6) (7) (8) (9) (10) (11)Chhattisgarh 1666 75 63 37 0 175 856 463 522 0 1841Madhya Pradesh 4836 112 87 43 29 271 1965 1410 1012 718 5105Uttar Pradesh 12312 409 229 131 94 863 6008 2711 2429 2019 13167Uttarakhand 1473 55 45 20 0 120 747 494 352 0 1593Central Region Total 20287 651 424 231 123 1429 9576 5078 4315 2737 21706
Andaman & Nicobar 47 4 2 0 0 6 26 27 0 0 53Bihar 4701 129 113 36 29 307 2703 1262 660 383 5008Jharkhand 2210 57 68 40 9 174 1157 582 509 136 2384Odisha 3346 89 92 42 0 223 1909 901 758 0 3568Sikkim 91 7 0 0 0 7 69 29 0 0 98West Bengal 6140 100 86 42 46 274 2658 931 1257 1567 6413Eastern Region Total 16535 386 361 160 84 991 8522 3732 3184 2086 17524
Arunachal Pradesh 98 3 5 0 0 8 57 49 0 0 106Assam 1647 29 51 27 0 107 848 485 421 0 1754Manipur 98 7 5 5 0 17 50 35 30 0 115Meghalaya 240 3 8 5 0 16 137 48 71 0 256Mizoram 116 3 2 6 0 11 64 22 41 0 127Nagaland 108 4 12 0 0 16 45 79 0 0 124Tripura 278 13 9 3 0 25 149 83 71 0 303North Eastern Region Total 2585 62 92 46 0 200 1350 801 634 0 2785
Chandigarh 370 1 0 12 0 13 11 0 372 0 383Delhi 2893 7 8 1 149 165 86 54 1 2916 3057Haryana 3070 188 82 68 23 361 1137 831 1262 201 3431Himachal Pradesh 1194 50 21 0 0 71 930 254 81 0 1265Jammu & Kashmir 1241 69 40 22 0 131 714 306 352 0 1372Punjab 4418 271 144 41 33 489 1741 1551 947 666 4905Rajasthan 4958 174 155 79 23 431 2127 1582 1128 552 5389Northern Region Total 18144 760 450 223 228 1661 6746 4578 4143 4335 19802
Andhra Pradesh 8555 249 202 84 76 611 3120 2291 1929 1825 9165Karnataka 7305 198 144 81 101 524 2685 1702 1651 1789 7827Kerala 5096 22 283 51 0 356 375 3669 1408 0 5452Lakshadweep 12 0 0 0 0 0 8 4 0 0 12Puducherry 172 5 5 6 0 16 41 49 98 0 188Tamil Nadu 7714 219 235 79 40 573 2247 2711 1934 1389 8281Southern Region Total 28854 693 869 301 217 2080 8476 10426 7020 5003 30925
Dadra & Nagar Haveli 41 2 4 0 0 6 14 33 0 0 47
Daman & Diu 36 0 4 0 0 4 2 38 0 0 40Goa 533 19 22 0 0 41 224 350 0 0 574Gujarat 5658 201 139 38 61 439 1974 1535 849 1736 6094Maharashtra 9704 166 186 80 181 613 2555 2120 1575 4064 10314Western Region Total 15972 388 355 118 242 1103 4769 4076 2424 5800 17069
Grand Total 102377 2940 2551 1079 894 7464 39439 28691 21720 19961 109811
TABLE 1.3 : STATE AND POPULATION GROUP-WISE DISTRIBUTION OF OFFICES OF COMMERCIAL BANKS - 2012 AND 2013
Regions / States / Union Territories
Number of OfficesAs on
March 31, 2012
Opened during April 01, 2012 to March 31, 2013 As on March 31, 2013
Notes : 1) Data include ‘Administrative Offices’. 2) Population groups are defined as follows: 'Rural' includes centres with population of less than 10,000, 'Semi-Urban' includes centres with population of 10,000 and abovebut less than of one lakh, 'Urban' includes centres with population of one lakh and above but less than of ten lakhs, and 'Metropolitan' includes centres with population of 10 lakhs
and above. All population figures are as per census 2001.Source: Master Office File (MOF) System, Department of Statistics and Information Management, Reserve Bank of India, as on October 05, 2013. MOF data are dynamic in nature. It is updated based on information as received from Banks.

7
No. of centres
No. of offices
No. of centres
No. of offices
No. of centres
No. of offices
No. of centres
No. of offices
No. of centres
No. of offices
(1) (2) (3) (4) (5) (6) (7) (8) (9) (10)
Northern Region 4776 5986 625 4129 54 3920 5 4109 5460 18144(15.6) (16.4) (10.3) (15.8) (14.1) (19.0) (14.7) (21.5) (14.7) (17.7)
Chandigarh 9 10 0 0 1 360 0 0 10 370Delhi 66 79 25 46 0 0 1 2768 92 2893Haryana 757 949 142 749 19 1194 1 178 919 3070Himachal Pradesh 655 880 13 233 1 81 0 0 669 1194Jammu & Kashmir 494 645 40 266 3 330 0 0 537 1241Punjab 1105 1470 132 1408 12 906 2 634 1251 4418Rajasthan 1690 1953 273 1427 18 1049 1 529 1982 4958North Eastern Region 1123 1288 148 709 10 588 0 0 1281 2585
(3.7) (3.5) (2.4) (2.7) (2.6) (2.8) (0.0) (0.0) (3.5) (2.5)Arunachal Pradesh 50 54 10 44 0 0 0 0 60 98Assam 708 819 68 434 5 394 0 0 781 1647Manipur 40 43 14 30 1 25 0 0 55 98Meghalaya 120 134 13 40 2 66 0 0 135 240Mizoram 56 61 8 20 1 35 0 0 65 116Nagaland 38 41 12 67 0 0 0 0 50 108Tripura 111 136 23 74 1 68 0 0 135 278Eastern Region 7052 8136 940 3371 89 3025 4 2003 8085 16535
(23.0) (22.3) (15.5) (12.9) (23.3) (14.6) (11.8) (10.5) (21.8) (16.2)Andaman & Nicobar 17 22 2 25 0 0 0 0 19 47Bihar 2296 2574 446 1149 18 624 1 354 2761 4701Jharkhand 924 1100 85 514 6 469 1 127 1016 2210Odisha 1568 1820 103 809 8 717 0 0 1679 3346Sikkim 38 62 1 29 0 0 0 0 39 91West Bengal 2209 2558 303 845 57 1215 2 1522 2571 6140Central Region 7490 8927 1057 4657 80 4087 8 2616 8635 20287
(24.5) (24.5) (17.4) (17.8) (20.9) (19.8) (23.5) (13.7) (23.3) (19.8)Chhattisgarh 615 781 74 400 7 485 0 0 696 1666Madhya Pradesh 1541 1854 277 1324 23 969 2 689 1843 4836Uttar Pradesh 4799 5600 663 2484 47 2301 6 1927 5515 12312Uttarakhand 535 692 43 449 3 332 0 0 581 1473Western Region 3642 4383 794 3721 54 2306 12 5562 4502 15972
(11.9) (12.0) (13.1) (14.2) (14.1) (11.2) (35.3) (29.2) (12.1) (15.6)Dadra & Nagar Haveli 8 12 2 29 0 0 0 0 10 41Daman & Diu 2 2 4 34 0 0 0 0 6 36Goa 133 205 23 328 0 0 0 0 156 533Gujarat 1445 1773 279 1396 21 811 4 1678 1749 5658Maharashtra 2054 2391 486 1934 33 1495 8 3884 2581 9704Southern Region 6550 7783 2505 9557 95 6724 5 4790 9155 28854
(21.4) (21.3) (41.3) (36.6) (24.9) (32.6) (14.7) (25.1) (24.7) (28.2)Andhra Pradesh 2412 2871 557 2089 36 1845 3 1750 3008 8555Karnataka 2130 2487 304 1558 23 1571 1 1689 2458 7305Kerala 273 353 1060 3386 10 1357 0 0 1343 5096Lakshadweep 7 8 2 4 0 0 0 0 9 12Puducherry 27 36 7 44 2 92 0 0 36 172Tamil Nadu 1701 2028 575 2476 24 1859 1 1351 2301 7714All India 30633 36503 6069 26144 382 20650 34 19080 37118 102377
(100.0) (100.0) (100.0) (100.0) (100.0) (100.0) (100.0) (100.0) (100.0)
Urban Metropolitan Total
Notes : 1. Data include 'Administrative Offices'.
TABLE 1.4 : STATE AND POPULATION GROUP-WISE DISTRIBUTION OF CENTRES AND OFFICES OF COMMERCIAL BANKS -
As on March 31, 2012
Region/State/Union Territory
Rural Semi-Urban
2012 and 2013
(100.0)
2. Population groups are defined as follows: 'Rural' includes centres with population of less than 10,000, 'Semi-Urban' includes centres with population of 10,000 above but less than of one lakh, 'Urban' includes centres with population of one lakh and above but less than of ten lakhs, and 'Metropolitan' includes centres with population of 10 lakhs and above. All population figures are as per census 2001.
Source : Master Office File (MOF) System, Department of Statistics and Information Management, Reserve Bank of India, as on October 05, 2013. MOF data are dynamic in nature. It is updated based on information as received from banks.

8
No. of centres
No. of offices
No. of centres
No. of offices
No. of centres
No. of offices
No. of centres
No. of offices
No. of centres
No. of offices
(1) (2) (3) (4) (5) (6) (7) (8) (9) (10)Northern Region 5208 6746 639 4578 55 4143 5 4335 5907 19802
(16.0) (17.1) (10.4) (16.0) (14.4) (19.1) 15 22 (15.1) (18.0)Chandigarh 10 11 0 0 1 372 0 0 11 383Delhi 71 86 31 54 1 1 1 2916 104 3057Haryana 876 1137 147 831 19 1262 1 201 1043 3431Himachal Pradesh 676 930 14 254 1 81 0 0 691 1265Jammu & Kashmir 535 714 40 306 3 352 0 0 578 1372Punjab 1237 1741 132 1551 12 947 2 666 1383 4905Rajasthan 1803 2127 275 1582 18 1128 1 552 2097 5389
North Eastern Region 1158 1350 151 801 10 634 0 0 1319 2785(3.6) (3.4) (2.4) (2.8) (2.6) (2.9) 0 0 (3.4) (2.5)
Arunachal Pradesh 51 57 10 49 0 0 0 0 61 106Assam 726 848 71 485 5 421 0 0 802 1754Manipur 44 50 14 35 1 30 0 0 59 115Meghalaya 120 137 13 48 2 71 0 0 135 256Mizoram 58 64 8 22 1 41 0 0 67 127Nagaland 42 45 12 79 0 0 0 0 54 124Tripura 117 149 23 83 1 71 0 0 141 303
Eastern Region 7247 8522 958 3732 89 3184 4 2086 8298 17524(22.3) (21.6) (15.5) (13.0) (23.2) (14.7) (11.8) (10.5) (21.2) (16.0)
Andaman & Nicobar 17 26 2 27 0 0 0 0 19 53Bihar 2377 2703 455 1262 18 660 1 383 2851 5008Jharkhand 951 1157 86 582 6 509 1 136 1044 2384Odisha 1606 1909 103 901 8 758 0 0 1717 3568Sikkim 39 69 1 29 0 0 0 0 40 98West Bengal 2257 2658 311 931 57 1257 2 1567 2627 6413
Central Region 7929 9576 1073 5078 80 4315 8 2737 9090 21706(24.4) (24.3) (17.4) (17.7) (20.9) (19.9) (23.5) (13.7) (23.3) (19.8)
Chhattisgarh 662 856 74 463 7 522 0 0 743 1841Madhya Pradesh 1610 1965 278 1410 23 1012 2 718 1913 5105Uttar Pradesh 5096 6008 678 2711 47 2429 6 2019 5827 13167Uttarakhand 561 747 43 494 3 352 0 0 607 1593
Western Region 3913 4769 802 4076 54 2424 12 5800 4781 17069(12.0) (12.1) (13.0) (14.2) (14.1) (11.2) (35.3) (29.1) (12.2) (15.5)
Dadra & Nagar Haveli 8 14 2 33 0 0 0 0 10 47Daman & Diu 2 2 4 38 0 0 0 0 6 40Goa 138 224 24 350 0 0 0 0 162 574Gujarat 1596 1974 284 1535 21 849 4 1736 1905 6094Maharashtra 2169 2555 488 2120 33 1575 8 4064 2698 10314
Southern Region 7023 8476 2550 10426 95 7020 5 5003 9673 30925(21.6) (21.5) (41.3) (36.3) (24.8) (32.3) (14.7) (25.1) (24.8) (28.2)
Andhra Pradesh 2580 3120 565 2291 36 1929 3 1825 3184 9165Karnataka 2264 2685 306 1702 23 1651 1 1789 2594 7827Kerala 286 375 1082 3669 10 1408 0 0 1378 5452Lakshadweep 7 8 2 4 0 0 0 0 9 12Puducherry 31 41 7 49 2 98 0 0 40 188Tamil Nadu 1855 2247 588 2711 24 1934 1 1389 2468 8281All India 32478 39439 6173 28691 383 21720 34 19961 39068 109811
(100.0) (100.0) (100.0) (100.0) (100.0) (100.0) (100.0) (100.0) (100.0)
TABLE 1.4 : STATE AND POPULATION GROUP-WISE DISTRIBUTION OF CENTRES AND OFFICES OF COMMERCIAL BANKS -
As on March 31, 2013Metropolitan Total
Region/State/Union Territory
Rural Semi- Urban
2012 and 2013 (Concld.)
(100.0)
Notes : 1. Data include 'Administrative Offices'.2. Population groups are defined as follows: 'Rural' includes centres with population of less than 10,000, 'Semi-Urban' includes centres with population of 10,000 above but less than of one lakh, 'Urban' includes centres with population of one lakh and above but less than of ten lakhs, and 'Metropolitan' includes centres with population of 10 lakhs and above. All population figures are as per census 2001.
Source : Master Office File (MOF) System, Department of Statistics and Information Management, Reserve Bank of India, as on October 05, 2013. MOF data are dynamic in nature. It is updated based on information as received from banks.
9
MAP - 1STATE & UNION TERRITORY-WISE DISTRIBUTION OF OFFICES
OF COMMERCIAL BANKS - 2013(As on March 31)
383
1372
4905
1593
5389
3057
3431
13167
51056094
10314
1841
3568
9165
7827
574
40
47
12
8281
188
53
3036413 127
115
124
98
5008
2384
1754
106
256
5452
1265

10
TABLE 1.5 : OFFICES OF INDIAN COMMERCIAL BANKSOUTSIDE INDIA - 2011 TO 2013
Sr. No.
Name of the Country 2011 2012 2013
(1) (2) (3)
1 Afghanistan 1 1 1
2 Australia 1 1 2
3 Bahamas Island (Nassau) 2 2 2
4 Bahrain 5 7 6
5 Bangladesh 5 6 6
6 Belgium 3 3 3
7 Cambodia 1 1 1
8 Cayman Islands 1 1 1
9 Channel Islands 1 1 1
10 China 4 4 5
11 Fiji Islands 9 9 9
12 France 2 2 2
13 Germany 1 1 1
14 Hong kong 18 18 19
15 Israel 1 1 1
16 Japan 4 4 4
17 Kenya 4 4 4
18 Maldives Islands 2 2 2
19 Mauritius 8 8 9
20 Qatar 1 2 2
21 Saudi Arabia - 1 1
22 Seychelles 1 1 1
23 Singapore 16 17 17
24 South Africa 3 4 4
25 South Korea 1 1 1
26 Sri Lanka 8 9 9
27 Sultanate of Oman 4 4 5
28 Thailand 1 1 1
29 United Arab Emirates 11 11 13
30 United Kingdom 28 30 30
31 United States of America 8 8 8
Total 155 165 171
As on March 31
Source : Department of Banking Operations and Development, RBI.

11
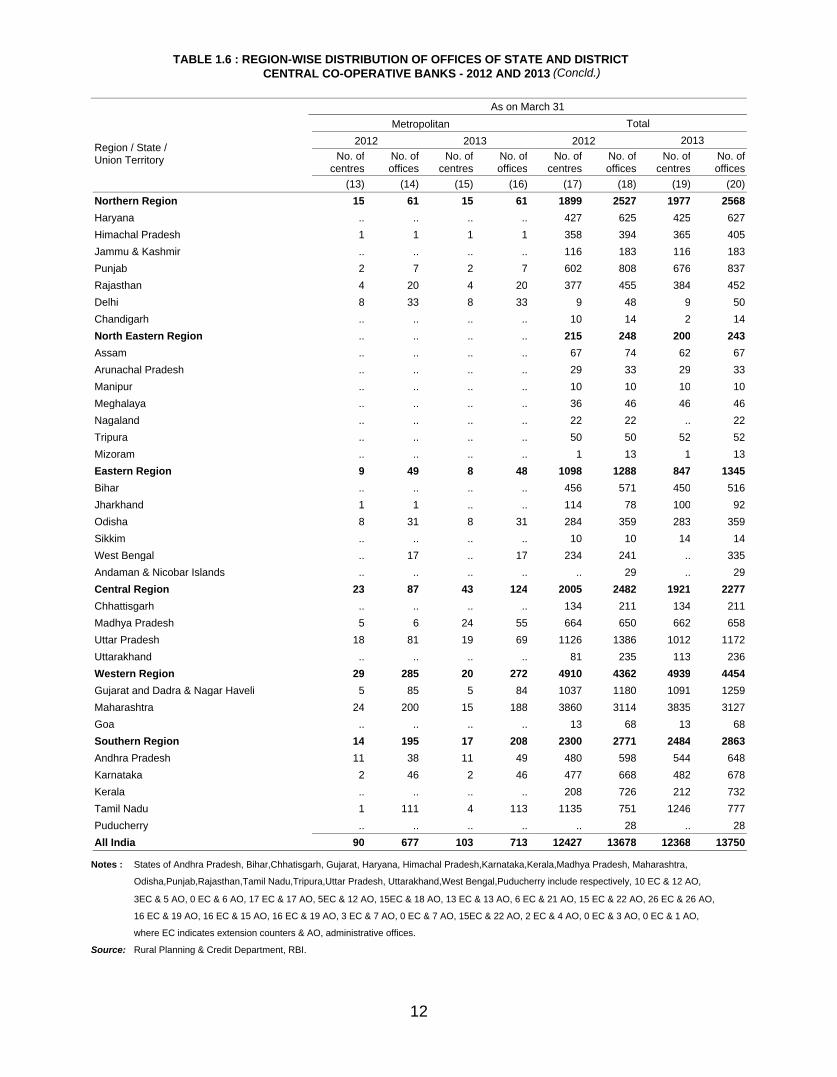
TABLE 1.6 : REGION-WISE DISTRIBUTION OF OFFICES OF STATE AND DISTRICT CENTRAL CO-OPERATIVE BANKS - 2012 AND 2013
Region / State / Union Territory
Rural Semi-urban Urban2012 2013 2012 2013 2012 2013
No. ofcentres
No. ofoffices
No. ofcentres
No. ofoffices
No. ofcentres
No. ofoffices
No. ofcentres
No. ofoffices
No. ofcentres
No. ofoffices
No. ofcentres
No. ofoffices
(1) (2) (3) (4) (5) (6) (7) (8) (9) (10) (11) (12)Northern Region 1356 1645 1407 1672 394 506 415 515 134 315 140 320Haryana 320 450 319 449 55 81 56 83 52 94 50 95Himachal Pradesh 320 337 318 340 29 48 36 54 8 8 10 10Jammu & Kashmir 89 109 89 109 19 40 19 40 8 34 8 34Punjab 470 578 522 599 99 128 118 137 31 95 34 94Rajasthan 150 150 157 155 192 209 186 201 31 76 37 76Delhi 1 15 1 17 .. .. .. .. .. .. .. ..Chandigarh 6 6 1 3 .. .. .. .. 4 8 1 11North Eastern Region 103 103 90 102 54 61 46 63 58 84 64 78Assam 18 18 18 18 21 21 21 21 28 35 23 28Arunachal Pradesh 20 20 20 20 .. .. .. .. 9 13 9 13Manipur 4 4 4 4 5 5 5 5 1 1 1 1Meghalaya 22 22 18 18 7 7 9 9 7 17 19 19Nagaland 12 12 .. 12 10 10 .. 10 .. .. .. ..Tripura 27 27 30 30 11 11 11 11 12 12 11 11Mizoram .. .. .. .. .. 7 .. 7 1 6 1 6Eastern Region 481 629 431 640 347 393 268 376 261 217 140 281Bihar 225 259 219 236 140 178 136 157 91 134 95 123Jharkhand 46 39 40 39 42 25 43 36 25 13 17 17Odisha 139 144 159 164 98 117 88 109 39 67 28 55Sikkim 9 9 13 13 1 1 1 1 .. .. .. ..West Bengal 62 153 .. 163 66 68 .. 69 106 3 .. 86Andaman & NicobarIslands .. 25 .. 25 .. 4 .. 4 .. .. .. ..
Central Region 946 1091 866 1032 726 861 654 686 310 443 358 435Chhattisgarh 75 130 83 148 35 46 26 29 24 35 25 34Madhya Pradesh 285 244 266 233 244 238 235 218 130 162 137 152Uttar Pradesh 532 596 446 507 428 476 366 378 148 233 181 218Uttarakhand 54 121 71 144 19 101 27 61 8 13 15 31Western Region 4058 3021 4158 3092 646 660 572 712 177 396 189 378Gujarat and Dadra &Nagar Haveli 805 793 841 844 198 211 210 232 29 91 35 99
Maharashtra 3253 2228 3317 2211 440 418 350 454 143 268 153 274Goa .. .. .. 37 8 31 12 26 5 37 1 5Southern Region 1488 1153 1565 1213 519 832 573 853 279 591 329 589Andhra Pradesh 227 242 263 277 167 209 179 202 75 109 91 120Karnataka 235 306 238 312 151 174 144 167 89 142 98 153Kerala 99 382 100 405 69 197 73 200 40 147 39 127Tamil Nadu 927 213 964 209 132 249 177 281 75 178 101 174Puducherry .. 10 .. 10 .. 3 .. 3 .. 15 .. 15All India 8432 7642 8517 7751 2686 3313 2528 3205 1219 2046 1220 2081
As on March 31
Notes : States of Andhra Pradesh, Bihar,Chhatisgarh, Gujarat, Haryana, Himachal Pradesh,Karnataka,Kerala,Madhya Pradesh, Maharashtra,
Odisha,Punjab,Rajasthan,Tamil Nadu,Tripura,Uttar Pradesh, Uttarakhand,West Bengal,Puducherry include respectively, 10 EC & 12 AO,
3EC & 5 AO, 0 EC & 6 AO, 17 EC & 17 AO, 5EC & 12 AO, 15EC & 18 AO, 13 EC & 13 AO, 6 EC & 21 AO, 15 EC & 22 AO, 26 EC & 26 AO,
16 EC & 19 AO, 16 EC & 15 AO, 16 EC & 19 AO, 3 EC & 7 AO, 0 EC & 7 AO, 15EC & 22 AO, 2 EC & 4 AO, 0 EC & 3 AO, 0 EC & 1 AO,
where EC indicates extension counters & AO, administrative offices.
Source: Rural Planning & Credit Department, RBI.
12
TABLE 1.6 : REGION-WISE DISTRIBUTION OF OFFICES OF STATE AND DISTRICT CENTRAL CO-OPERATIVE BANKS - 2012 AND 2013 (Concld.)
Region / State / Union Territory
Metropolitan Total2012 2013 2012 2013
No. ofcentres
No. ofoffices
No. ofcentres
No. ofoffices
No. ofcentres
No. ofoffices
No. ofcentres
No. ofoffices
(13) (14) (15) (16) (17) (18) (19) (20)Northern Region 15 61 15 61 1899 2527 1977 2568Haryana .. .. .. .. 427 625 425 627Himachal Pradesh 1 1 1 1 358 394 365 405Jammu & Kashmir .. .. .. .. 116 183 116 183Punjab 2 7 2 7 602 808 676 837Rajasthan 4 20 4 20 377 455 384 452Delhi 8 33 8 33 9 48 9 50Chandigarh .. .. .. .. 10 14 2 14North Eastern Region .. .. .. .. 215 248 200 243Assam .. .. .. .. 67 74 62 67Arunachal Pradesh .. .. .. .. 29 33 29 33Manipur .. .. .. .. 10 10 10 10Meghalaya .. .. .. .. 36 46 46 46Nagaland .. .. .. .. 22 22 .. 22Tripura .. .. .. .. 50 50 52 52Mizoram .. .. .. .. 1 13 1 13Eastern Region 9 49 8 48 1098 1288 847 1345Bihar .. .. .. .. 456 571 450 516Jharkhand 1 1 .. .. 114 78 100 92Odisha 8 31 8 31 284 359 283 359Sikkim .. .. .. .. 10 10 14 14West Bengal .. 17 .. 17 234 241 .. 335Andaman & Nicobar Islands .. .. .. .. .. 29 .. 29Central Region 23 87 43 124 2005 2482 1921 2277Chhattisgarh .. .. .. .. 134 211 134 211Madhya Pradesh 5 6 24 55 664 650 662 658Uttar Pradesh 18 81 19 69 1126 1386 1012 1172Uttarakhand .. .. .. .. 81 235 113 236Western Region 29 285 20 272 4910 4362 4939 4454Gujarat and Dadra & Nagar Haveli 5 85 5 84 1037 1180 1091 1259Maharashtra 24 200 15 188 3860 3114 3835 3127Goa .. .. .. .. 13 68 13 68Southern Region 14 195 17 208 2300 2771 2484 2863Andhra Pradesh 11 38 11 49 480 598 544 648Karnataka 2 46 2 46 477 668 482 678Kerala .. .. .. .. 208 726 212 732Tamil Nadu 1 111 4 113 1135 751 1246 777Puducherry .. .. .. .. .. 28 .. 28All India 90 677 103 713 12427 13678 12368 13750
As on March 31
Notes : States of Andhra Pradesh, Bihar,Chhatisgarh, Gujarat, Haryana, Himachal Pradesh,Karnataka,Kerala,Madhya Pradesh, Maharashtra,
Odisha,Punjab,Rajasthan,Tamil Nadu,Tripura,Uttar Pradesh, Uttarakhand,West Bengal,Puducherry include respectively, 10 EC & 12 AO,
3EC & 5 AO, 0 EC & 6 AO, 17 EC & 17 AO, 5EC & 12 AO, 15EC & 18 AO, 13 EC & 13 AO, 6 EC & 21 AO, 15 EC & 22 AO, 26 EC & 26 AO,
16 EC & 19 AO, 16 EC & 15 AO, 16 EC & 19 AO, 3 EC & 7 AO, 0 EC & 7 AO, 15EC & 22 AO, 2 EC & 4 AO, 0 EC & 3 AO, 0 EC & 1 AO,
where EC indicates extension counters & AO, administrative offices.
Source: Rural Planning & Credit Department, RBI.

13
TABLE 1.7 : STATE-WISE DISTRIBUTION OF NUMBER OF BRANCHES OF STATE AND DISTRICTCENTRAL CO-OPERATIVE BANKS - 2011 AND 2012
Region / State / Union Territory
State Co-operative Banks District Central Co-operative Banks Total
2011 2012 2011 2012 2011 2012
(1) (2) (3) (4) (5) (6)
Northern Region 299 309 2130 2137 2429 2446Haryana 13 13 594 594 607 607Himachal Pradesh 175 175 183 187 358 362Jammu & Kashmir 24 24 137 137 161 161Punjab 20 20 807 805 827 825Rajasthan 13 16 409 414 422 430Chandigarh 14 14 * * 14 14Delhi 40 47 * * 40 47
North Eastern Region 232 230 * * 232 230Assam 75 67 * * 75 67Manipur 11 11 * * 11 11Meghalaya 41 46 * * 41 46Nagaland 21 22 * * 21 22Tripura 40 40 * * 40 40Arunachal Pradesh 32 32 * * 32 32Mizoram 12 12 * * 12 12
Eastern Region 108 112 996 1038 1104 1150Bihar 16 16 279 279 295 295Jharkhand $ $ 114 114 114 114Odisha 14 14 322 323 336 337Sikkim 6 10 * * 6 10West Bengal 43 43 281 322 324 365Andaman & Nicobar 29 29 * * 29 29
Central Region 69 69 2520 2624 2589 2693Chhattisgarh 5 5 206 207 211 212Madhya Pradesh 20 20 807 835 827 855Uttar Pradesh 29 29 1302 1350 1331 1379Uttarakhand 15 15 205 232 220 247
Western Region 121 121 4887 4919 5008 5040Gujarat 1 1 1182 1191 1183 1192Maharashtra 53 53 3705 3728 3758 3781Goa 67 67 * * 67 67
Southern Region 158 158 2585 2584 2743 2742Andhra Pradesh 26 24 569 571 595 595Karnataka 38 40 608 605 646 645Kerala 20 20 670 670 690 690Tamil Nadu 46 46 738 738 784 784Puducherry 28 28 * * 28 28
All-India 987 999 13118 13302 14105 14301
As on March 31
Notes :1. * Indicates No District Central Co-operative Banks in the State.2. $ State Co-operative banks not started functioning3. Data for the year 2012 are provisional.4. Data for the States of Bihar, Manipur, Meghalaya, Tripura and West Bengal are repeated for the year 2012 from previous
year.Source:: National Bank for Agriculture and Rural Development.

14
TABLE 2.1 : BUSINESS OF SCHEDULED BANKS IN INDIA - 2012-13
Items
Mar Apr May Jun Jul Aug Sep Oct3/1/12 4/1/12 5/1/12 6/1/12 7/1/12 8/1/12 9/1/12 10/1/122012 2012 2012 2012 2012 2012 2012 2012
(1) (2) (3) (4) (5) (6) (7) (8)
All Scheduled Commercial Banks
No. of Reporting Banks 169 169 169 169 169 169 169 165
I Liabilities to the banking System 1223.19 1313.29 1173.14 1191.60 1106.18 1172.47 1114.99 1132.65
(a) Demand and time deposits from banks 842.53 812.33 783.26 806.23 755.75 759.90 777.15 757.92
(b) Borrowing from banks 319.23 435.74 323.79 316.30 275.88 326.50 258.38 309.66
(c) Other demand and time liabilities 61.43 65.23 66.09 69.06 74.56 86.08 79.47 65.07
II Liabilities to others in India 64889.25 65794.34 66254.03 68161.43 68041.83 68725.92 68683.37 69333.03
(a) Aggregate deposits 59090.82 60369.07 60632.77 62328.02 62471.44 62951.61 62921.72 63881.22
(i) Demand deposits 6253.30 6002.23 5817.75 6512.93 5939.23 6062.55 5986.84 5851.72
(ii) Time Deposits 52837.52 54366.83 54815.02 55815.10 56532.21 56889.06 56934.87 58029.50
(b) Borrowings (other than from RBI, NABARD, EXIM Bank) 2064.54 1963.54 1987.09 2034.37 1987.35 1993.65 2010.70 1918.71
(c) Other demand and time liabilities 3733.89 3461.73 3634.17 3799.04 3583.03 3780.66 3750.95 3533.11
III Assets with the banking system 1779.12 1918.27 1825.64 1928.05 1815.40 1851.20 1764.36 1812.73
Money at call and short notice 232.78 339.32 241.79 210.11 208.09 268.83 211.14 237.79
IV Cash in Hand & Balances with RBI 3594.00 3560.78 3456.57 3665.57 3617.17 3575.52 3590.51 3719.24
V Investment in India 17377.87 18188.32 18250.85 18640.81 19183.35 19568.96 19477.54 19626.39
(a) Government securities 17350.18 18159.04 18222.99 18615.63 19155.80 19542.60 19452.58 19598.78
(b) Other approved securities 27.70 29.27 27.86 25.18 27.56 26.37 24.95 27.61
VI Bank Credit 46118.52 46192.49 46499.24 47630.38 47044.97 47232.64 47637.40 48135.62
(a) Loans Cash Credit and Overdrafts 44359.77 44451.43 44806.19 45881.93 45337.22 45488.74 45919.68 46400.67
(b) Inland Bills Purchased 163.44 169.48 167.29 173.93 168.56 186.06 193.20 212.09
(c) Inland Bills Discounted 979.78 964.08 940.27 973.65 972.49 981.53 964.58 932.56
(d) Foreign bills purchased 211.68 220.82 200.02 210.54 188.31 193.54 185.72 188.40
(e) Foreign bills discounted 403.85 386.68 385.47 390.33 378.40 382.78 374.22 401.90
As on the last reporting Friday of
(Amount in ` Billion)
: Form 'A' / 'B' Return under Section 42(2) of RBI Act, 1934, Department of Statistics and Information Management, RBI. Source

15
TABLE 2.1 : BUSINESS OF SCHEDULED BANKS IN INDIA - 2012-13(Contd.)
Items
Nov Dec Jan Feb Mar11/1/12 12/1/12 1/1/13 2/1/13 3/1/132012 2012 2013 2013 2013
(9) (10) (11) (12) (13)
All Scheduled Commercial Banks
No. of Reporting Banks 158 158 154 153 151
I Liabilities to the banking System 1177.88 1216.77 1195.88 1299.84 1331.01
(a) Demand and time deposits from banks 787.38 796.91 785.47 788.17 846.53
(b) Borrowing from banks 306.80 347.46 326.85 419.77 393.58
(c) Other demand and time liabilities 83.70 72.41 83.56 91.90 90.89
II Liabilities to others in India 70264.58 70741.87 71263.28 71771.10 73837.51
(a) Aggregate deposits 64400.28 64748.22 65288.02 65651.37 67504.54
(i) Demand deposits 6225.70 6371.93 6103.64 6304.97 6622.99
(ii) Time Deposits 58174.58 58376.29 59184.38 59346.40 60881.55
(b) Borrowings (other than from RBI, NABARD, EXIM Bank) 2017.72 2041.67 2066.02 2131.70 2216.63
(c) Other demand and time liabilities 3846.58 3951.98 3909.23 3988.03 4116.34
III Assets with the banking system 1732.78 1942.14 1764.74 1842.35 2199.48
Money at call and short notice 234.96 284.41 219.67 304.59 296.05
IV Cash in Hand & Balances with RBI 3283.36 3419.28 3562.04 3431.29 3227.58
V Investment in India 19669.70 19383.46 19661.10 19646.41 20061.05
(a) Government securities 19646.98 19360.35 19638.24 19625.77 20036.53
(b) Other approved securities 22.72 23.10 22.86 20.64 24.52
VI Bank Credit 49587.90 50258.72 50509.15 51272.64 52604.59
(a) Loans Cash Credit and Overdrafts 47829.45 48387.84 48640.07 49358.91 50591.75
(b) Inland Bills Purchased 226.74 228.77 226.04 233.88 248.65
(c) Inland Bills Discounted 940.31 988.88 991.76 1040.74 1094.54
(d) Foreign bills purchased 176.28 206.86 207.37 202.78 214.92
(e) Foreign bills discounted 415.11 446.37 443.92 436.32 454.73
As on the last reporting Friday of
(Amount in ` Billion)
: Form 'A' / 'B' Return under Section 42(2) of RBI Act, 1934, Department of Statistics and Information Management, RBI.Source

16
TABLE 2.1 : BUSINESS OF SCHEDULED BANKS IN INDIA - 2012-13(Contd.)
Items
Mar Apr May Jun Jul Aug Sep3/1/12 4/1/12 5/1/12 6/1/12 7/1/12 8/1/12 9/1/122012 2012 2012 2012 2012 2012 2012
(1) (2) (3) (4) (5) (6) (7)
All Scheduled Co-operative Banks
No. of Reporting Banks 68 68 68 67 67 67 67
I Liabilities to the banking System 32.89 36.18 37.01 31.24 32.29 34.23 33.09
(a) Demand and time deposits from banks 31.95 33.66 33.49 28.49 29.34 30.14 30.59
(b) Borrowing from banks 0.87 2.47 3.44 2.70 2.65 4.05 2.45
(c) Other demand and time liabilities 0.07 0.05 0.07 0.06 0.30 0.05 0.05
II Liabilities to others in India 1766.55 1800.57 1799.65 1826.86 1855.06 1872.91 1874.37
(a) Aggregate deposits 1687.11 1721.08 1725.92 1758.40 1787.50 1801.34 1808.53
(i) Demand deposits 148.36 148.38 146.67 158.93 153.27 160.16 154.73
(ii) Time Deposits 1538.76 1572.70 1579.25 1599.47 1634.24 1641.18 1653.80
(b) Borrowings (other than from RBI, NABARD, EXIM Bank) 18.75 14.69 14.42 14.19 14.98 17.07 11.33
(c) Other demand and time liabilities 60.69 64.80 59.31 54.27 52.58 54.50 54.51
III Assets with the banking system 261.00 280.58 279.81 270.27 266.88 267.15 279.51
Money at call and short notice 124.11 121.69 122.93 107.43 99.77 99.40 102.12
IV Cash in Hand & Balances with RBI 92.98 91.96 94.71 95.78 95.85 100.72 97.47
V Investment in India 535.00 542.22 547.08 555.45 562.53 570.56 571.46
(a) Government securities 532.52 538.77 544.76 553.14 560.23 568.24 569.17
(b) Other approved securities 2.48 3.45 2.33 2.32 2.30 2.32 2.29
VI Bank Credit 1419.31 1429.47 1435.02 1452.69 1485.34 1506.67 1531.27
(a) Loans Cash Credit and Overdrafts 1400.65 1410.01 1414.74 1433.14 1465.21 1486.54 1510.98
(b) Inland Bills Purchased 4.90 5.09 4.94 4.17 4.84 4.41 5.40
(c) Inland Bills Discounted 9.86 10.33 11.25 10.94 11.67 12.27 11.61
(d) Foreign bills purchased 1.02 1.11 0.90 0.66 0.37 0.30 0.20
(e) Foreign bills discounted 2.87 2.93 3.19 3.80 3.24 3.15 3.07
As on the last reporting Friday of
(Amount in ` Billion)
: Form 'A' / 'B' Return under Section 42(2) of RBI Act, 1934, Department of Statistics and Information Management, RBI. Source

17
TABLE 2.1 : BUSINESS OF SCHEDULED BANKS IN INDIA - 2012-13(Contd.)
Items
Oct Nov Dec Jan Feb Mar10/1/12 11/1/12 12/1/12 1/1/13 2/1/13 3/1/132012 2012 2012 2013 2013 2013
(8) (9) (10) (11) (12) (13)
All Scheduled Co-operative Banks
No. of Reporting Banks 67 67 67 67 67 67
I Liabilities to the banking System 35.08 32.75 35.05 40.95 37.14 37.20
(a) Demand and time deposits from banks 31.13 29.83 29.89 30.59 31.15 32.72
(b) Borrowing from banks 3.89 2.85 4.42 10.30 5.56 4.42
(c) Other demand and time liabilities 0.06 0.06 0.73 0.05 0.43 0.06
II Liabilities to others in India 1891.48 1910.64 1929.92 1948.03 1972.75 1980.96
(a) Aggregate deposits 1829.74 1842.01 1860.89 1884.25 1902.46 1915.41
(i) Demand deposits 156.23 161.65 160.94 157.20 159.47 160.28
(ii) Time Deposits 1673.51 1680.36 1699.95 1727.06 1742.99 1755.14
(b) Borrowings (other than from RBI, NABARD, EXIM Bank) 10.58 13.82 12.06 11.92 12.03 10.57
(c) Other demand and time liabilities 51.15 54.82 56.97 51.86 58.26 54.98
III Assets with the banking system 254.30 253.90 292.48 253.50 240.43 248.81
Money at call and short notice 86.41 89.42 117.30 107.69 97.81 101.60
IV Cash in Hand & Balances with RBI 94.29 92.99 91.69 91.20 88.90 93.32
V Investment in India 578.94 587.32 594.96 601.61 600.32 599.20
(a) Government securities 576.82 585.14 592.79 597.94 598.11 597.01
(b) Other approved securities 2.12 2.18 2.17 3.68 2.22 2.20
VI Bank Credit 1554.41 1564.58 1607.21 1625.71 1646.44 1676.83
(a) Loans Cash Credit and Overdrafts 1534.62 1544.96 1583.85 1603.14 1622.68 1652.31
(b) Inland Bills Purchased 5.30 5.50 5.41 4.84 5.93 4.45
(c) Inland Bills Discounted 11.22 10.87 14.10 13.81 13.44 15.37
(d) Foreign bills purchased 0.24 0.45 0.97 1.35 1.77 1.72
(e) Foreign bills discounted 3.02 2.80 2.89 2.56 2.63 2.98
As on the last reporting Friday of
(Amount in ` Billion)
: Form 'A' / 'B' Return under Section 42(2) of RBI Act, 1934, Department of Statistics and Information Management, RBI.Source

18
TABLE 2.1 : BUSINESS OF SCHEDULED BANKS IN INDIA - 2012-13(Contd.)
Items
Mar Apr May Jun Jul Aug Sep3/1/12 4/1/12 5/1/12 6/1/12 7/1/12 8/1/12 9/1/122012 2012 2012 2012 2012 2012 2012
(1) (2) (3) (4) (5) (6) (7)
All Scheduled Banks
No. of Reporting Banks 237 237 237 236 236 236 236
I Liabilities to the banking System 1256.08 1349.47 1210.14 1222.84 1138.48 1206.70 1148.08
(a) Demand and time deposits from banks 874.48 845.99 816.75 834.72 785.09 790.04 807.73
(b) Borrowing from banks 320.10 438.21 327.24 319.00 278.53 330.55 260.83
(c) Other demand and time liabilities 61.50 65.27 66.16 69.12 74.86 86.12 79.52
II Liabilities to others in India 66655.80 67594.91 68053.68 69988.29 69896.89 70598.83 70557.74
(a) Aggregate deposits 60777.93 62090.14 62358.68 64086.42 64258.94 64752.95 64730.24
(i) Demand deposits 6401.65 6150.61 5964.42 6671.85 6092.50 6222.71 6141.57
(ii) Time Deposits 54376.28 55939.53 56394.27 57414.57 58166.45 58530.23 58588.67
(b) Borrowings (other than from RBI, NABARD, EXIM Bank) 2083.28 1978.24 2001.51 2048.56 2002.33 2010.72 2022.03
(c) Other demand and time liabilities 3794.58 3526.53 3693.49 3853.31 3635.61 3835.16 3805.47
III Assets with the banking system 2040.12 2198.85 2105.45 2198.32 2082.28 2118.34 2043.87
Money at call and short notice 356.89 461.02 364.73 317.54 307.86 368.23 313.26
IV Cash in Hand & Balances with RBI 3686.98 3652.74 3551.29 3761.35 3713.02 3676.24 3687.98
V Investment in India 17912.87 18730.54 18797.94 19196.26 19745.88 20139.52 20049.00
(a) Government securities 17882.70 18697.81 18767.75 19168.76 19716.03 20110.84 20021.75
(b) Other approved securities 30.18 32.73 30.19 27.50 29.85 28.68 27.24
VI Bank Credit 47537.83 47621.96 47934.26 49083.08 48530.31 48739.31 49168.67
(a) Loans Cash Credit and Overdrafts 45760.42 45861.45 46220.92 47315.07 46802.43 46975.28 47430.65
(b) Inland Bills Purchased 168.34 174.57 172.23 178.09 173.39 190.46 198.61
(c) Inland Bills Discounted 989.64 974.41 951.51 984.58 984.16 993.80 976.19
(d) Foreign bills purchased 212.71 221.92 200.93 211.20 188.68 193.84 185.92
(e) Foreign bills discounted 406.72 389.61 388.66 394.13 381.64 385.93 377.30
As on the last reporting Friday of(Amount in ` Billion)
: Form 'A' / 'B' Return under Section 42(2) of RBI Act, 1934, Department of Statistics and Information Management, RBI. Source

19
TABLE 2.1 : BUSINESS OF SCHEDULED BANKS IN INDIA - 2012-13(Concld.)
Items
Oct Nov Dec Jan Feb Mar10/1/12 11/1/12 12/1/12 1/1/13 2/1/13 3/1/132012 2012 2012 2013 2013 2013
(8) (9) (10) (11) (12) (13)
All Scheduled Banks
No. of Reporting Banks 232 225 225 221 220 218
I Liabilities to the banking System 1167.74 1210.62 1251.82 1236.83 1336.98 1368.21
(a) Demand and time deposits from banks 789.06 817.21 826.81 816.06 819.32 879.25
(b) Borrowing from banks 313.54 309.65 351.88 337.15 425.33 398.01
(c) Other demand and time liabilities 65.13 83.76 73.14 83.61 92.33 90.94
II Liabilities to others in India 71224.51 72175.22 72671.79 73211.30 73743.85 75818.47
(a) Aggregate deposits 65710.96 66242.29 66609.11 67172.27 67553.83 69419.95
(i) Demand deposits 6007.95 6387.35 6532.88 6260.84 6464.44 6783.26
(ii) Time Deposits 59703.01 59854.93 60076.23 60911.43 61089.40 62636.69
(b) Borrowings (other than from RBI, NABARD, EXIM Bank) 1929.29 2031.54 2053.72 2077.94 2143.73 2227.20
(c) Other demand and time liabilities 3584.26 3901.39 4008.95 3961.09 4046.29 4171.32
III Assets with the banking system 2067.03 1986.69 2234.61 2018.25 2082.77 2448.29
Money at call and short notice 324.20 324.38 401.71 327.36 402.39 397.65
IV Cash in Hand & Balances with RBI 3813.53 3376.35 3510.97 3653.23 3520.19 3320.91
V Investment in India 20205.33 20257.02 19978.42 20262.72 20246.73 20660.25
(a) Government securities 20175.60 20232.12 19953.14 20236.18 20223.88 20633.54
(b) Other approved securities 29.73 24.90 25.27 26.54 22.85 26.71
VI Bank Credit 49690.03 51152.48 51865.93 52134.86 52919.08 54281.41
(a) Loans Cash Credit and Overdrafts 47935.29 49374.42 49971.69 50243.21 50981.58 52244.05
(b) Inland Bills Purchased 217.39 232.24 234.18 230.88 239.81 253.09
(c) Inland Bills Discounted 943.78 951.18 1002.98 1005.57 1054.18 1109.91
(d) Foreign bills purchased 188.65 176.73 207.83 208.72 204.54 216.64
(e) Foreign bills discounted 404.93 417.91 449.26 446.48 438.95 457.71
As on the last reporting Friday of(Amount in ` Billion)
: Form 'A' / 'B' Return under Section 42(2) of RBI Act, 1934, Department of Statistics and Information Management, RBI.Source
20
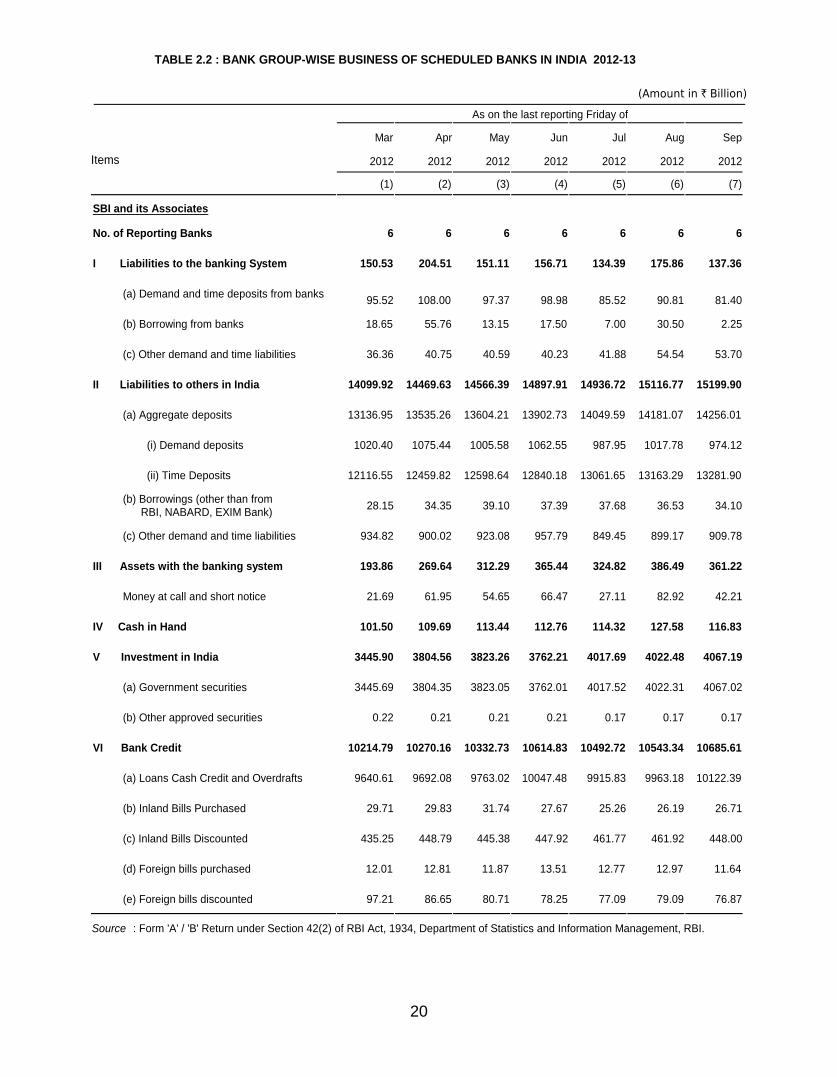
TABLE 2.2 : BANK GROUP-WISE BUSINESS OF SCHEDULED BANKS IN INDIA 2012-13
(Amount in ` Billion)
Items
Mar Apr May Jun Jul Aug Sep
2012 2012 2012 2012 2012 2012 2012
(1) (2) (3) (4) (5) (6) (7)
SBI and its Associates
No. of Reporting Banks 6 6 6 6 6 6 6
I Liabilities to the banking System 150.53 204.51 151.11 156.71 134.39 175.86 137.36
(a) Demand and time deposits from banks 95.52 108.00 97.37 98.98 85.52 90.81 81.40
(b) Borrowing from banks 18.65 55.76 13.15 17.50 7.00 30.50 2.25
(c) Other demand and time liabilities 36.36 40.75 40.59 40.23 41.88 54.54 53.70
II Liabilities to others in India 14099.92 14469.63 14566.39 14897.91 14936.72 15116.77 15199.90
(a) Aggregate deposits 13136.95 13535.26 13604.21 13902.73 14049.59 14181.07 14256.01
(i) Demand deposits 1020.40 1075.44 1005.58 1062.55 987.95 1017.78 974.12
(ii) Time Deposits 12116.55 12459.82 12598.64 12840.18 13061.65 13163.29 13281.90
(b) Borrowings (other than from RBI, NABARD, EXIM Bank) 28.15 34.35 39.10 37.39 37.68 36.53 34.10
(c) Other demand and time liabilities 934.82 900.02 923.08 957.79 849.45 899.17 909.78
III Assets with the banking system 193.86 269.64 312.29 365.44 324.82 386.49 361.22
Money at call and short notice 21.69 61.95 54.65 66.47 27.11 82.92 42.21
IV Cash in Hand 101.50 109.69 113.44 112.76 114.32 127.58 116.83
V Investment in India 3445.90 3804.56 3823.26 3762.21 4017.69 4022.48 4067.19
(a) Government securities 3445.69 3804.35 3823.05 3762.01 4017.52 4022.31 4067.02
(b) Other approved securities 0.22 0.21 0.21 0.21 0.17 0.17 0.17
VI Bank Credit 10214.79 10270.16 10332.73 10614.83 10492.72 10543.34 10685.61
(a) Loans Cash Credit and Overdrafts 9640.61 9692.08 9763.02 10047.48 9915.83 9963.18 10122.39
(b) Inland Bills Purchased 29.71 29.83 31.74 27.67 25.26 26.19 26.71
(c) Inland Bills Discounted 435.25 448.79 445.38 447.92 461.77 461.92 448.00
(d) Foreign bills purchased 12.01 12.81 11.87 13.51 12.77 12.97 11.64
(e) Foreign bills discounted 97.21 86.65 80.71 78.25 77.09 79.09 76.87
As on the last reporting Friday of
: Form 'A' / 'B' Return under Section 42(2) of RBI Act, 1934, Department of Statistics and Information Management, RBI.Source

21
TABLE 2.2 : BANK GROUP-WISE BUSINESS OF SCHEDULED BANKS IN INDIA 2012-13
(Amount in ` Billion)
(Contd.)
Items
Oct Nov Dec Jan Feb Mar
2012 2012 2012 2013 2013 2013
(8) (9) (10) (11) (12) (13)
SBI and its Associates
No. of Reporting Banks 6 6 6 6 6 6
I Liabilities to the banking System 132.93 163.40 161.55 140.48 172.60 153.45
(a) Demand and time deposits from banks 82.28 87.52 88.66 84.75 93.44 98.36
(b) Borrowing from banks 10.75 18.00 28.75 9.50 22.30 6.50
(c) Other demand and time liabilities 39.90 57.88 44.14 46.24 56.86 48.59
II Liabilities to others in India 15351.27 15610.28 15549.62 15622.06 15841.04 16219.47
(a) Aggregate deposits 14404.62 14624.35 14570.43 14696.48 14920.46 15248.30
(i) Demand deposits 996.10 1026.91 1033.90 963.47 1055.91 1144.66
(ii) Time Deposits 13408.52 13597.44 13536.54 13733.01 13864.55 14103.63
(b) Borrowings (other than from RBI, NABARD, EXIM Bank) 34.00 31.06 30.57 31.29 31.65 30.49
(c) Other demand and time liabilities 912.66 954.87 948.61 894.30 888.93 940.69
III Assets with the banking system 400.61 357.79 377.71 321.52 393.85 401.79
Money at call and short notice 43.05 52.51 66.52 15.96 65.67 37.82
IV Cash in Hand 118.28 131.18 124.61 137.61 135.71 125.47
V Investment in India 4048.71 3978.06 3846.98 3828.46 3763.09 3855.59
(a) Government securities 4048.53 3977.89 3846.81 3828.29 3762.93 3855.43
(b) Other approved securities 0.17 0.17 0.17 0.17 0.16 0.16
VI Bank Credit 10778.72 11280.32 11392.54 11509.16 11721.67 12016.45
(a) Loans Cash Credit and Overdrafts 10213.78 10685.74 10789.67 10877.49 11074.79 11341.56
(b) Inland Bills Purchased 27.64 28.74 25.99 24.78 22.64 19.39
(c) Inland Bills Discounted 451.36 462.87 474.81 500.43 516.56 540.48
(d) Foreign bills purchased 11.57 15.78 15.24 15.35 17.14 18.62
(e) Foreign bills discounted 74.37 87.19 86.82 91.09 90.54 96.39
As on the last reporting Friday of
: Form 'A' / 'B' Return under Section 42(2) of RBI Act, 1934, Department of Statistics and Information Management, RBI.Source

22
TABLE 2.2 : BANK GROUP-WISE BUSINESS OF SCHEDULED BANKS IN INDIA 2012-13
(Amount in ` Billion)
(Contd.)
Items
Mar Apr May Jun Jul Aug Sep
2012 2012 2012 2012 2012 2012 2012
(1) (2) (3) (4) (5) (6) (7)
Nationalised Banks $
No. of Reporting Banks 20 20 20 20 20 20 20
I Liabilities to the banking System 648.64 589.85 601.67 616.70 579.85 613.57 618.80
(a) Demand and time deposits from banks 559.56 525.87 514.39 536.41 498.57 500.02 530.91
(b) Borrowing from banks 73.27 49.42 72.91 63.09 64.61 96.98 71.35
(c) Other demand and time liabilities 15.81 14.56 14.37 17.20 16.67 16.58 16.54
II Liabilities to others in India 33305.31 33980.49 34090.15 34873.08 34681.79 34944.50 34809.36
(a) Aggregate deposits 31015.28 31797.54 31800.04 32536.58 32441.90 32624.62 32500.86
(i) Demand deposits 2347.15 2280.82 2229.68 2547.19 2294.37 2319.95 2314.52
(ii) Time Deposits 28668.14 29516.72 29570.36 29989.39 30147.52 30304.68 30186.35
(b) Borrowings (other than from RBI, NABARD, EXIM Bank) 730.45 695.34 690.07 703.40 679.61 687.52 680.52
(c) Other demand and time liabilities 1559.58 1487.62 1600.03 1633.11 1560.28 1632.35 1627.98
III Assets with the banking system 503.87 623.41 557.19 546.76 518.35 525.15 465.31
Money at call and short notice 113.80 199.62 121.02 68.15 105.69 114.14 87.16
IV Cash in Hand 122.78 127.04 132.41 144.64 139.62 180.27 147.36
V Investment in India 8776.12 9132.90 9222.91 9494.35 9650.73 9951.50 9817.76
(a) Government securities 8764.65 9121.52 9211.54 9483.27 9639.96 9940.66 9806.92
(b) Other approved securities 11.47 11.37 11.37 11.08 10.76 10.84 10.84
VI Bank Credit 23728.93 23727.71 23807.36 24403.67 23865.10 23906.39 24003.70
(a) Loans Cash Credit and Overdrafts 23098.07 23114.84 23198.76 23756.59 23251.63 23295.30 23398.28
(b) Inland Bills Purchased 93.95 99.86 97.92 106.32 109.10 125.40 136.46
(c) Inland Bills Discounted 242.89 215.64 213.64 230.41 201.91 190.10 176.86
(d) Foreign bills purchased 114.03 115.80 116.58 123.49 117.03 113.53 110.55
(e) Foreign bills discounted 180.00 181.57 180.46 186.85 185.44 182.07 181.55
As on the last reporting Friday of
: Form 'A' / 'B' Return under Section 42(2) of RBI Act, 1934, Department of Statistics and Information Management, RBI.SourceNotes : $ Includes IDBI Bank Ltd.

23
TABLE 2.2 : BANK GROUP-WISE BUSINESS OF SCHEDULED BANKS IN INDIA 2012-13
(Amount in ` Billion)
(Contd.)
Items
Oct Nov Dec Jan Feb Mar
2012 2012 2012 2013 2013 2013
(8) (9) (10) (11) (12) (13)
Nationalised Banks $
No. of Reporting Banks 20 20 20 20 20 20
I Liabilities to the banking System 588.31 652.50 670.02 674.82 690.02 705.15
(a) Demand and time deposits from banks 511.69 549.81 553.39 552.85 549.14 596.64
(b) Borrowing from banks 61.85 87.78 101.75 97.59 116.70 84.26
(c) Other demand and time liabilities 14.78 14.90 14.88 24.37 24.18 24.24
II Liabilities to others in India 35152.89 35304.04 35666.44 36133.53 36175.49 37406.87
(a) Aggregate deposits 33071.56 32971.54 33335.97 33820.13 33851.62 35014.32
(i) Demand deposits 2229.18 2418.96 2414.95 2358.12 2403.08 2534.88
(ii) Time Deposits 30842.38 30552.58 30921.03 31462.00 31448.55 32479.44
(b) Borrowings (other than from RBI, NABARD, EXIM Bank) 647.70 693.40 655.34 649.96 647.88 654.61
(c) Other demand and time liabilities 1433.62 1639.10 1675.12 1663.44 1675.99 1737.94
III Assets with the banking system 483.72 456.12 570.63 528.79 562.40 695.65
Money at call and short notice 126.95 109.40 146.22 141.36 154.42 185.44
IV Cash in Hand 134.52 160.78 150.63 137.85 169.24 140.92
V Investment in India 10065.50 10125.37 9861.84 10120.19 9961.82 10287.49
(a) Government securities 10054.66 10114.96 9851.43 10110.11 9952.28 10277.99
(b) Other approved securities 10.84 10.41 10.41 10.08 9.53 9.50
VI Bank Credit 24145.07 24706.33 25095.16 25230.66 25552.04 26346.54
(a) Loans Cash Credit and Overdrafts 23534.01 24080.43 24446.14 24584.72 24888.74 25622.79
(b) Inland Bills Purchased 153.47 166.76 165.76 165.66 172.09 187.02
(c) Inland Bills Discounted 169.31 165.35 169.34 156.83 159.26 205.95
(d) Foreign bills purchased 106.60 108.10 116.54 123.77 127.03 124.16
(e) Foreign bills discounted 181.69 185.70 197.38 199.68 204.92 206.62
As on the last reporting Friday of
: Form 'A' / 'B' Return under Section 42(2) of RBI Act, 1934, Department of Statistics and Information Management, RBI.SourceNotes : $ Includes IDBI Bank Ltd.

24
TABLE 2.2 : BANK GROUP-WISE BUSINESS OF SCHEDULED BANKS IN INDIA 2012-13
(Amount in ` Billion)
(Contd.)
Items
Mar Apr May Jun Jul Aug Sep
2012 2012 2012 2012 2012 2012 2012
(1) (2) (3) (4) (5) (6) (7)
Old Private Sector Banks
No. of Reporting Banks 13 13 13 13 13 13 13
I Liabilities to the banking System 30.33 29.59 28.15 27.73 22.78 24.81 36.79
(a) Demand and time deposits from banks 24.65 23.38 22.61 22.04 19.13 19.11 21.24
(b) Borrowing from banks 3.16 3.78 2.81 2.79 1.30 2.79 13.18
(c) Other demand and time liabilities 2.53 2.43 2.73 2.90 2.36 2.91 2.37
II Liabilities to others in India 3049.90 3118.53 3131.61 3216.18 3248.41 3287.70 3241.57
(a) Aggregate deposits 2868.49 2956.40 2973.27 3044.37 3084.49 3090.02 3071.24
(i) Demand deposits 247.27 242.50 240.38 256.15 248.73 263.08 251.94
(ii) Time Deposits 2621.23 2713.90 2732.89 2788.22 2835.76 2826.94 2819.30
(b) Borrowings (other than from RBI, NABARD, EXIM Bank) 86.68 73.44 77.64 81.22 70.78 78.83 73.95
(c) Other demand and time liabilities 94.72 88.68 80.70 90.59 93.14 118.86 96.39
III Assets with the banking system 32.19 27.29 20.89 33.74 27.05 28.41 22.58
Money at call and short notice 9.80 11.65 2.45 3.35 6.65 6.55 8.65
IV Cash in Hand 23.27 26.34 27.77 27.53 27.42 34.31 29.69
V Investment in India 779.23 811.10 831.46 832.28 861.72 868.97 845.81
(a) Government securities 779.05 810.92 831.28 832.10 861.59 868.84 845.68
(b) Other approved securities 0.18 0.18 0.18 0.18 0.13 0.13 0.13
VI Bank Credit 2228.73 2254.14 2270.69 2317.26 2297.77 2295.29 2325.64
(a) Loans Cash Credit and Overdrafts 2125.59 2153.84 2174.89 2223.06 2209.51 2211.78 2242.69
(b) Inland Bills Purchased 25.64 25.57 23.92 25.18 21.08 19.38 18.13
(c) Inland Bills Discounted 51.87 49.26 44.58 42.66 40.60 37.24 39.03
(d) Foreign bills purchased 12.98 12.08 12.20 12.73 12.26 13.00 12.74
(e) Foreign bills discounted 12.66 13.39 15.10 13.63 14.32 13.89 13.05
As on the last reporting Friday of
: Form 'A' / 'B' Return under Section 42(2) of RBI Act, 1934, Department of Statistics and Information Management, RBI.Source

25
TABLE 2.2 : BANK GROUP-WISE BUSINESS OF SCHEDULED BANKS IN INDIA 2012-13
(Amount in ` Billion)
(Contd.)
Items
Oct Nov Dec Jan Feb Mar
2012 2012 2012 2013 2013 2013
(8) (9) (10) (11) (12) (13)
Old Private Sector Banks
No. of Reporting Banks 13 13 13 13 13 13
I Liabilities to the banking System 28.28 29.89 36.89 28.39 24.04 27.82
(a) Demand and time deposits from banks 19.40 19.87 20.74 19.08 18.11 18.28
(b) Borrowing from banks 6.54 7.63 14.31 7.39 4.14 7.64
(c) Other demand and time liabilities 2.35 2.39 1.84 1.92 1.80 1.90
II Liabilities to others in India 3289.12 3376.82 3399.59 3428.34 3520.83 3643.08
(a) Aggregate deposits 3117.46 3186.60 3210.38 3244.08 3327.30 3425.85
(i) Demand deposits 252.21 258.02 255.27 251.69 261.37 258.98
(ii) Time Deposits 2865.26 2928.58 2955.11 2992.39 3065.92 3166.88
(b) Borrowings (other than from RBI, NABARD, EXIM Bank) 75.81 81.44 82.68 81.15 83.90 105.71
(c) Other demand and time liabilities 95.84 108.78 106.54 103.11 109.63 111.52
III Assets with the banking system 20.73 23.95 45.71 32.16 41.36 55.92
Money at call and short notice 3.60 4.80 9.05 4.75 15.00 12.85
IV Cash in Hand 28.33 34.92 34.69 29.96 33.79 28.62
V Investment in India 853.08 874.30 858.64 883.78 910.66 934.93
(a) Government securities 852.95 874.17 858.51 883.65 910.53 934.80
(b) Other approved securities 0.13 0.13 0.13 0.13 0.13 0.13
VI Bank Credit 2366.39 2443.22 2469.91 2501.85 2538.02 2633.68
(a) Loans Cash Credit and Overdrafts 2278.26 2359.25 2381.11 2410.83 2443.41 2534.73
(b) Inland Bills Purchased 19.71 17.39 20.72 19.96 20.24 21.47
(c) Inland Bills Discounted 44.19 42.55 42.12 43.62 45.91 45.98
(d) Foreign bills purchased 11.85 12.62 13.20 13.09 12.99 14.01
(e) Foreign bills discounted 12.38 11.41 12.77 14.35 15.46 17.48
As on the last reporting Friday of
: Form 'A' / 'B' Return under Section 42(2) of RBI Act, 1934, Department of Statistics and Information Management, RBI.Source

26
TABLE 2.2 : BANK GROUP-WISE BUSINESS OF SCHEDULED BANKS IN INDIA 2012-13
(Amount in ` Billion)
(Contd.)
Items
Mar Apr May Jun Jul Aug Sep
2012 2012 2012 2012 2012 2012 2012
(1) (2) (3) (4) (5) (6) (7)
New Private Sector Banks
No. of Reporting Banks 7 7 7 7 7 7 7
I Liabilities to the banking System 227.00 291.33 224.54 209.69 186.08 209.97 179.35
(a) Demand and time deposits from banks 120.08 111.48 106.88 104.37 106.51 101.90 93.75
(b) Borrowing from banks 103.68 177.28 114.67 101.69 76.78 105.10 82.23
(c) Other demand and time liabilities 3.23 2.57 2.99 3.63 2.79 2.97 3.37
II Liabilities to others in India 9256.18 9152.74 9304.93 9786.27 9808.38 10003.97 10002.46
(a) Aggregate deposits 7674.35 7666.13 7813.77 8276.18 8309.18 8424.04 8452.89
(i) Demand deposits 1441.99 1232.59 1201.76 1478.81 1276.17 1306.24 1336.26
(ii) Time Deposits 6232.36 6433.54 6612.00 6797.37 7033.01 7117.80 7116.63
(b) Borrowings (other than from RBI, NABARD, EXIM Bank) 879.60 897.13 879.93 850.25 859.33 880.46 872.42
(c) Other demand and time liabilities 702.24 589.48 611.23 659.84 639.87 699.46 677.15
III Assets with the banking system 179.15 140.48 116.94 140.02 138.16 142.54 150.54
Money at call and short notice 28.03 9.17 1.51 16.78 16.76 5.54 7.05
IV Cash in Hand 89.63 87.66 88.67 98.97 74.51 101.09 88.18
V Investment in India 2600.46 2660.01 2587.46 2630.78 2666.36 2730.46 2718.20
(a) Government securities 2600.46 2660.00 2587.45 2630.77 2666.35 2730.45 2718.19
(b) Other approved securities 0.01 0.01 0.01 0.01 0.01 0.01 0.01
VI Bank Credit 6513.62 6451.02 6553.38 6683.23 6765.89 6908.65 7067.62
(a) Loans Cash Credit and Overdrafts 6295.73 6258.88 6378.57 6497.20 6565.77 6677.86 6824.25
(b) Inland Bills Purchased 4.42 3.96 3.71 3.49 2.91 3.59 2.63
(c) Inland Bills Discounted 177.14 150.16 132.67 140.11 156.87 188.63 201.03
(d) Foreign bills purchased 10.27 10.48 10.91 12.74 13.50 13.98 15.12
(e) Foreign bills discounted 26.05 27.54 27.53 29.70 26.84 24.59 24.58
As on the last reporting Friday of
: Form 'A' / 'B' Return under Section 42(2) of RBI Act, 1934, Department of Statistics and Information Management, RBI.Source

27
TABLE 2.2 : BANK GROUP-WISE BUSINESS OF SCHEDULED BANKS IN INDIA 2012-13
(Amount in ` Billion)
(Contd.)
Items
Oct Nov Dec Jan Feb Mar
2012 2012 2012 2013 2013 2013
(8) (9) (10) (11) (12) (13)
New Private Sector Banks
No. of Reporting Banks 7 7 7 7 7 7
I Liabilities to the banking System 232.22 200.27 191.73 200.44 270.37 220.77
(a) Demand and time deposits from banks 93.21 80.37 80.19 70.10 73.83 70.94
(b) Borrowing from banks 136.65 117.21 107.50 127.16 193.59 146.48
(c) Other demand and time liabilities 2.37 2.68 4.03 3.19 2.94 3.35
II Liabilities to others in India 10168.76 10483.09 10604.55 10604.07 10643.42 10945.07
(a) Aggregate deposits 8665.34 8912.14 8912.59 8815.09 8773.26 9051.63
(i) Demand deposits 1305.53 1388.34 1492.64 1395.90 1426.69 1524.88
(ii) Time Deposits 7359.81 7523.80 7419.96 7419.19 7346.56 7526.75
(b) Borrowings (other than from RBI, NABARD, EXIM Bank) 848.59 859.64 920.47 989.27 1015.94 1042.21
(c) Other demand and time liabilities 654.84 711.30 771.49 799.70 854.22 851.23
III Assets with the banking system 156.38 156.14 187.45 142.41 147.16 186.66
Money at call and short notice 3.58 17.40 0.64 7.44 18.23 3.06
IV Cash in Hand 83.52 112.84 105.82 110.31 100.89 86.15
V Investment in India 2737.76 2784.11 2894.12 2868.98 3025.78 3125.65
(a) Government securities 2737.76 2784.11 2894.11 2868.97 3025.78 3125.65
(b) Other approved securities 0.01 0.01 0.01 0.01 0.01 0.01
VI Bank Credit 7190.03 7402.33 7429.29 7421.36 7549.94 7675.39
(a) Loans Cash Credit and Overdrafts 6978.90 7193.11 7194.73 7205.40 7316.97 7451.24
(b) Inland Bills Purchased 2.86 3.91 6.97 6.54 8.03 8.26
(c) Inland Bills Discounted 166.69 161.77 180.56 162.15 178.43 170.41
(d) Foreign bills purchased 16.25 17.63 15.47 17.46 16.03 14.95
(e) Foreign bills discounted 25.32 25.91 31.55 29.81 30.48 30.53
As on the last reporting Friday of
: Form 'A' / 'B' Return under Section 42(2) of RBI Act, 1934, Department of Statistics and Information Management, RBI.Source

28
TABLE 2.2 : BANK GROUP-WISE BUSINESS OF SCHEDULED BANKS IN INDIA 2012-13
(Amount in ` Billion)
(Contd.)
Items
Mar Apr May Jun Jul Aug Sep
2012 2012 2012 2012 2012 2012 2012
(1) (2) (3) (4) (5) (6) (7)
Foreign Banks
No. of Reporting Banks 41 41 41 41 41 41 41
I Liabilities to the banking System 131.82 168.71 140.18 146.86 151.90 115.34 113.94
(a) Demand and time deposits from banks 35.22 34.53 33.30 34.63 39.33 38.86 39.43
(b) Borrowing from banks 93.13 129.43 101.49 107.17 107.52 71.43 71.41
(c) Other demand and time liabilities 3.48 4.75 5.38 5.05 5.04 5.05 3.11
II Liabilities to others in India 3390.46 3247.20 3329.77 3534.43 3495.50 3481.79 3517.06
(a) Aggregate deposits 2661.82 2638.21 2660.58 2769.46 2764.62 2792.52 2779.05
(i) Demand deposits 851.71 813.90 789.41 812.95 770.68 793.74 744.87
(ii) Time Deposits 1810.11 1824.31 1871.18 1956.50 1993.94 1998.77 2034.18
(b) Borrowings (other than from RBI, NABARD, EXIM Bank) 338.06 261.68 298.74 361.99 339.85 310.16 349.16
(c) Other demand and time liabilities 390.58 347.31 370.44 402.98 391.03 379.11 388.86
III Assets with the banking system 401.21 380.55 345.21 354.01 324.98 287.14 275.24
Money at call and short notice 12.09 12.31 17.71 8.87 3.72 10.39 15.99
IV Cash in Hand 5.91 6.96 8.15 7.91 7.71 9.65 10.17
V Investment in India 1288.56 1287.98 1294.77 1430.53 1491.05 1500.22 1533.82
(a) Government securities 1288.54 1287.86 1294.75 1430.46 1490.93 1500.20 1533.80
(b) Other approved securities 0.02 0.12 0.02 0.07 0.12 0.02 0.02
VI Bank Credit 2321.16 2342.05 2387.32 2442.10 2436.23 2374.02 2357.31
(a) Loans Cash Credit and Overdrafts 2088.96 2085.21 2143.79 2188.56 2207.37 2135.87 2134.71
(b) Inland Bills Purchased 9.40 9.90 9.82 11.13 10.13 11.41 9.19
(c) Inland Bills Discounted 72.46 99.76 103.57 112.43 111.26 103.53 99.58
(d) Foreign bills purchased 62.40 69.65 48.47 48.08 32.76 40.07 35.67
(e) Foreign bills discounted 87.93 77.53 81.67 81.90 74.71 83.14 78.17
As on the last reporting Friday of
: Form 'A' / 'B' Return under Section 42(2) of RBI Act, 1934, Department of Statistics and Information Management, RBI.Source
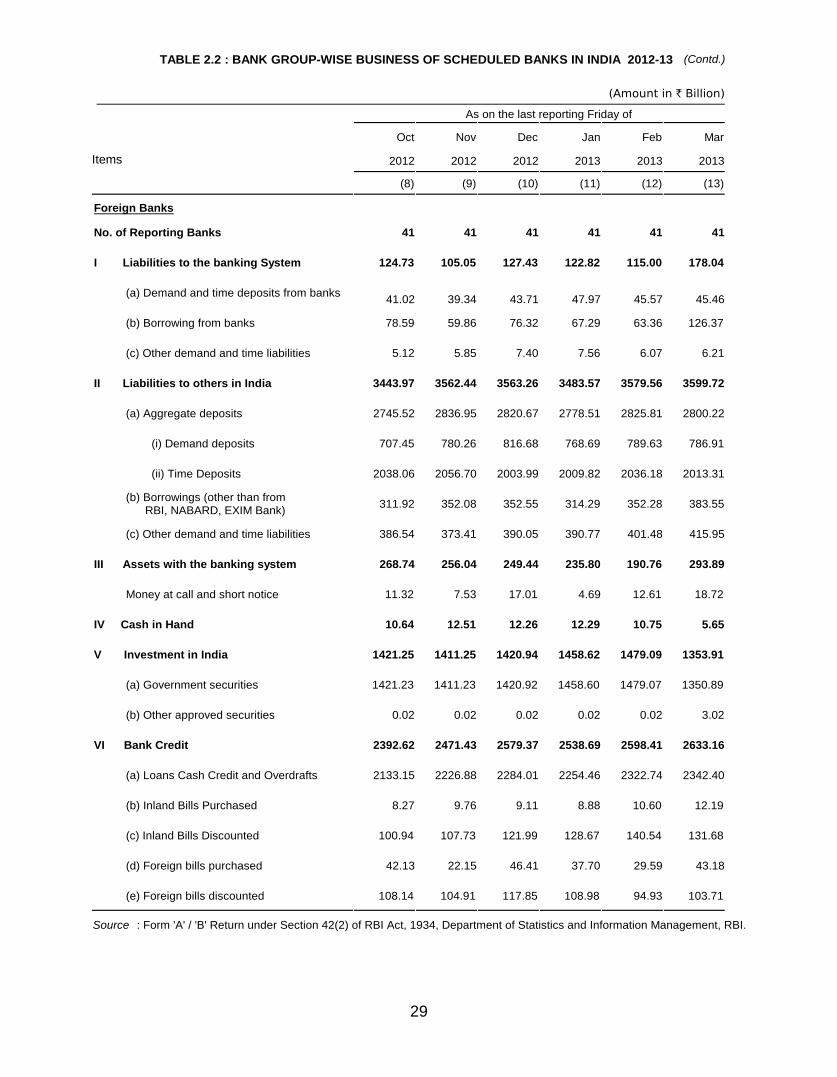
29
TABLE 2.2 : BANK GROUP-WISE BUSINESS OF SCHEDULED BANKS IN INDIA 2012-13
(Amount in ` Billion)
(Contd.)
Items
Oct Nov Dec Jan Feb Mar
2012 2012 2012 2013 2013 2013
(8) (9) (10) (11) (12) (13)
Foreign Banks
No. of Reporting Banks 41 41 41 41 41 41
I Liabilities to the banking System 124.73 105.05 127.43 122.82 115.00 178.04
(a) Demand and time deposits from banks 41.02 39.34 43.71 47.97 45.57 45.46
(b) Borrowing from banks 78.59 59.86 76.32 67.29 63.36 126.37
(c) Other demand and time liabilities 5.12 5.85 7.40 7.56 6.07 6.21
II Liabilities to others in India 3443.97 3562.44 3563.26 3483.57 3579.56 3599.72
(a) Aggregate deposits 2745.52 2836.95 2820.67 2778.51 2825.81 2800.22
(i) Demand deposits 707.45 780.26 816.68 768.69 789.63 786.91
(ii) Time Deposits 2038.06 2056.70 2003.99 2009.82 2036.18 2013.31
(b) Borrowings (other than from RBI, NABARD, EXIM Bank) 311.92 352.08 352.55 314.29 352.28 383.55
(c) Other demand and time liabilities 386.54 373.41 390.05 390.77 401.48 415.95
III Assets with the banking system 268.74 256.04 249.44 235.80 190.76 293.89
Money at call and short notice 11.32 7.53 17.01 4.69 12.61 18.72
IV Cash in Hand 10.64 12.51 12.26 12.29 10.75 5.65
V Investment in India 1421.25 1411.25 1420.94 1458.62 1479.09 1353.91
(a) Government securities 1421.23 1411.23 1420.92 1458.60 1479.07 1350.89
(b) Other approved securities 0.02 0.02 0.02 0.02 0.02 3.02
VI Bank Credit 2392.62 2471.43 2579.37 2538.69 2598.41 2633.16
(a) Loans Cash Credit and Overdrafts 2133.15 2226.88 2284.01 2254.46 2322.74 2342.40
(b) Inland Bills Purchased 8.27 9.76 9.11 8.88 10.60 12.19
(c) Inland Bills Discounted 100.94 107.73 121.99 128.67 140.54 131.68
(d) Foreign bills purchased 42.13 22.15 46.41 37.70 29.59 43.18
(e) Foreign bills discounted 108.14 104.91 117.85 108.98 94.93 103.71
As on the last reporting Friday of
: Form 'A' / 'B' Return under Section 42(2) of RBI Act, 1934, Department of Statistics and Information Management, RBI.Source

30
TABLE 2.2 : BANK GROUP-WISE BUSINESS OF SCHEDULED BANKS IN INDIA 2012-13
(Amount in ` Billion)
(Contd.)
Items
Mar Apr May Jun Jul Aug Sep
2012 2012 2012 2012 2012 2012 2012
(1) (2) (3) (4) (5) (6) (7)
Regional Rural Banks
No. of Reporting Banks 82 82 82 82 82 82 82
I Liabilities to the banking System 34.86 29.30 27.49 33.92 31.19 32.92 28.75
(a) Demand and time deposits from banks 7.51 9.06 8.70 9.79 6.70 9.20 10.41
(b) Borrowing from banks 27.33 20.07 18.76 24.06 18.66 19.69 17.96
(c) Other demand and time liabilities 0.02 0.17 0.02 0.06 5.83 4.03 0.38
II Liabilities to others in India 1787.48 1825.75 1831.18 1853.56 1871.03 1891.20 1913.01
(a) Aggregate deposits 1733.93 1775.54 1780.89 1798.71 1821.66 1839.34 1861.66
(i) Demand deposits 344.79 356.99 350.94 355.28 361.32 361.77 365.14
(ii) Time Deposits 1389.14 1418.55 1429.96 1443.43 1460.33 1477.57 1496.52
(b) Borrowings (other than from RBI, NABARD, EXIM Bank) 1.60 1.60 1.60 0.12 0.11 0.15 0.55
(c) Other demand and time liabilities 51.95 48.61 48.69 54.73 49.26 51.71 50.80
III Assets with the banking system 468.84 476.89 473.11 488.07 482.05 481.46 489.49
Money at call and short notice 47.38 44.63 44.46 46.49 48.16 49.29 50.08
IV Cash in Hand 18.20 17.27 17.69 19.45 16.95 16.75 15.68
V Investment in India 487.59 491.76 491.00 490.66 495.80 495.33 494.75
(a) Government securities 471.79 474.38 474.92 477.02 479.44 480.14 480.97
(b) Other approved securities 15.80 17.38 16.07 13.64 16.37 15.19 13.78
VI Bank Credit 1111.29 1147.41 1147.76 1169.29 1187.26 1204.96 1197.52
(a) Loans Cash Credit and Overdrafts 1110.82 1146.59 1147.15 1169.04 1187.10 1204.76 1197.36
(b) Inland Bills Purchased 0.31 0.36 0.18 0.14 0.08 0.09 0.08
(c) Inland Bills Discounted 0.16 0.46 0.43 0.11 0.09 0.11 0.08
(d) Foreign bills purchased - - - - - - -
(e) Foreign bills discounted - - - - - - -
As on the last reporting Friday of
: Form 'A' / 'B' Return under Section 42(2) of RBI Act, 1934, Department of Statistics and Information Management, RBI.Source

31
TABLE 2.2 : BANK GROUP-WISE BUSINESS OF SCHEDULED BANKS IN INDIA 2012-13
(Amount in ` Billion)
(Contd.)
Items
Oct Nov Dec Jan Feb Mar
2012 2012 2012 2013 2013 2013
(8) (9) (10) (11) (12) (13)
Regional Rural Banks
No. of Reporting Banks 78 71 71 67 66 64
I Liabilities to the banking System 26.17 26.77 29.15 28.93 27.80 45.77
(a) Demand and time deposits from banks 10.34 10.45 10.22 10.73 8.07 16.85
(b) Borrowing from banks 15.28 16.31 18.82 17.92 19.68 22.33
(c) Other demand and time liabilities 0.55 - 0.11 0.28 0.05 6.59
II Liabilities to others in India 1927.02 1927.92 1958.40 1991.70 2010.76 2023.29
(a) Aggregate deposits 1876.72 1868.70 1898.18 1933.73 1952.93 1964.22
(i) Demand deposits 361.25 353.22 358.51 365.77 368.29 372.69
(ii) Time Deposits 1515.47 1515.48 1539.67 1567.96 1584.64 1591.54
(b) Borrowings (other than from RBI, NABARD, EXIM Bank) 0.69 0.10 0.06 0.07 0.05 0.06
(c) Other demand and time liabilities 49.61 59.12 60.16 57.90 57.77 59.01
III Assets with the banking system 482.54 482.74 511.21 504.07 506.82 565.57
Money at call and short notice 49.30 43.32 44.97 45.47 38.66 38.16
IV Cash in Hand 15.35 18.34 18.66 15.95 17.45 18.10
V Investment in India 500.09 496.60 500.93 501.07 505.97 503.48
(a) Government securities 483.65 484.61 488.56 488.62 495.17 491.78
(b) Other approved securities 16.44 11.99 12.37 12.46 10.79 11.70
VI Bank Credit 1262.79 1284.28 1292.45 1307.43 1312.57 1299.36
(a) Loans Cash Credit and Overdrafts 1262.57 1284.04 1292.17 1307.17 1312.26 1299.02
(b) Inland Bills Purchased 0.14 0.18 0.21 0.21 0.27 0.31
(c) Inland Bills Discounted 0.08 0.05 0.06 0.05 0.05 0.03
(d) Foreign bills purchased - - - - - -
(e) Foreign bills discounted - - - - - -
As on the last reporting Friday of
: Form 'A' / 'B' Return under Section 42(2) of RBI Act, 1934, Department of Statistics and Information Management, RBI.Source
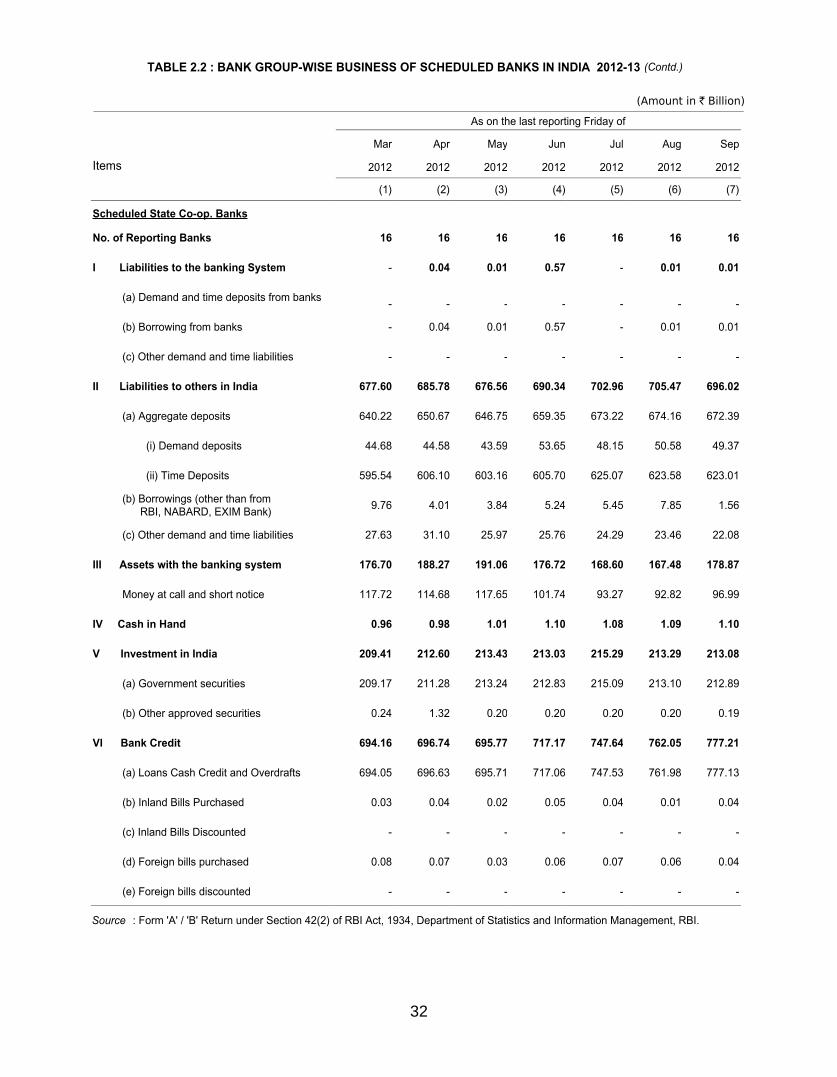
32
TABLE 2.2 : BANK GROUP-WISE BUSINESS OF SCHEDULED BANKS IN INDIA 2012-13
(Amount in ` Billion)
(Contd.)
Items
Mar Apr May Jun Jul Aug Sep
2012 2012 2012 2012 2012 2012 2012
(1) (2) (3) (4) (5) (6) (7)
Scheduled State Co-op. Banks
No. of Reporting Banks 16 16 16 16 16 16 16
I Liabilities to the banking System - 0.04 0.01 0.57 - 0.01 0.01
(a) Demand and time deposits from banks - - - - - - -
(b) Borrowing from banks - 0.04 0.01 0.57 - 0.01 0.01
(c) Other demand and time liabilities - - - - - - -
II Liabilities to others in India 677.60 685.78 676.56 690.34 702.96 705.47 696.02
(a) Aggregate deposits 640.22 650.67 646.75 659.35 673.22 674.16 672.39
(i) Demand deposits 44.68 44.58 43.59 53.65 48.15 50.58 49.37
(ii) Time Deposits 595.54 606.10 603.16 605.70 625.07 623.58 623.01
(b) Borrowings (other than from RBI, NABARD, EXIM Bank) 9.76 4.01 3.84 5.24 5.45 7.85 1.56
(c) Other demand and time liabilities 27.63 31.10 25.97 25.76 24.29 23.46 22.08
III Assets with the banking system 176.70 188.27 191.06 176.72 168.60 167.48 178.87
Money at call and short notice 117.72 114.68 117.65 101.74 93.27 92.82 96.99
IV Cash in Hand 0.96 0.98 1.01 1.10 1.08 1.09 1.10
V Investment in India 209.41 212.60 213.43 213.03 215.29 213.29 213.08
(a) Government securities 209.17 211.28 213.24 212.83 215.09 213.10 212.89
(b) Other approved securities 0.24 1.32 0.20 0.20 0.20 0.20 0.19
VI Bank Credit 694.16 696.74 695.77 717.17 747.64 762.05 777.21
(a) Loans Cash Credit and Overdrafts 694.05 696.63 695.71 717.06 747.53 761.98 777.13
(b) Inland Bills Purchased 0.03 0.04 0.02 0.05 0.04 0.01 0.04
(c) Inland Bills Discounted - - - - - - -
(d) Foreign bills purchased 0.08 0.07 0.03 0.06 0.07 0.06 0.04
(e) Foreign bills discounted - - - - - - -
As on the last reporting Friday of
: Form 'A' / 'B' Return under Section 42(2) of RBI Act, 1934, Department of Statistics and Information Management, RBI.Source

33
TABLE 2.2 : BANK GROUP-WISE BUSINESS OF SCHEDULED BANKS IN INDIA 2012-13
(Amount in ` Billion)
(Contd.)
Items
Oct Nov Dec Jan Feb Mar
2012 2012 2012 2013 2013 2013
(8) (9) (10) (11) (12) (13)
Scheduled State Co-op. Banks
No. of Reporting Banks 16 16 16 16 16 16
I Liabilities to the banking System - - 2.09 6.71 2.94 0.77
(a) Demand and time deposits from banks - - - - - -
(b) Borrowing from banks - - 2.09 6.71 2.94 0.77
(c) Other demand and time liabilities - - - - - -
II Liabilities to others in India 693.84 699.83 714.06 725.35 730.82 737.98
(a) Aggregate deposits 671.14 673.18 689.62 701.93 706.02 714.63
(i) Demand deposits 50.93 50.11 52.30 50.81 49.15 51.74
(ii) Time Deposits 620.21 623.07 637.32 651.13 656.87 662.89
(b) Borrowings (other than from RBI, NABARD, EXIM Bank) 0.28 2.48 1.31 0.39 1.10 0.25
(c) Other demand and time liabilities 22.41 24.18 23.12 23.03 23.71 23.10
III Assets with the banking system 152.38 157.21 195.63 160.12 138.87 152.45
Money at call and short notice 80.65 85.23 112.96 103.03 91.28 97.51
IV Cash in Hand 1.00 1.09 1.16 1.04 1.10 1.17
V Investment in India 213.58 214.79 222.94 225.82 224.49 224.80
(a) Government securities 213.39 214.61 222.77 225.69 224.36 224.67
(b) Other approved securities 0.19 0.18 0.18 0.13 0.13 0.13
VI Bank Credit 791.58 796.49 814.04 825.91 838.66 853.07
(a) Loans Cash Credit and Overdrafts 791.52 796.38 813.91 825.79 838.58 853.00
(b) Inland Bills Purchased 0.03 0.03 0.05 0.05 0.04 0.03
(c) Inland Bills Discounted - - - - - -
(d) Foreign bills purchased 0.03 0.08 0.09 0.08 0.04 0.05
(e) Foreign bills discounted - - - - - -
As on the last reporting Friday of
: Form 'A' / 'B' Return under Section 42(2) of RBI Act, 1934, Department of Statistics and Information Management, RBI.Source

34
TABLE 2.2 : BANK GROUP-WISE BUSINESS OF SCHEDULED BANKS IN INDIA 2012-13
(Amount in ` Billion)
(Contd.)
Items
Mar Apr May Jun Jul Aug Sep
2012 2012 2012 2012 2012 2012 2012
(1) (2) (3) (4) (5) (6) (7)
Scheduled Urban Co-operative Banks
No. of Reporting Banks 52 52 52 51 51 51 51
I Liabilities to the banking System 32.89 36.14 37.00 30.67 32.29 34.22 33.08
(a) Demand and time deposits from banks 31.95 33.66 33.49 28.49 29.34 30.14 30.59
(b) Borrowing from banks 0.87 2.43 3.44 2.13 2.65 4.04 2.44
(c) Other demand and time liabilities 0.07 0.05 0.07 0.06 0.30 0.05 0.05
II Liabilities to others in India 1088.95 1114.79 1123.09 1136.51 1152.10 1167.44 1178.35
(a) Aggregate deposits 1046.89 1070.40 1079.17 1099.05 1114.29 1127.18 1136.14
(i) Demand deposits 103.68 103.80 103.08 105.28 105.12 109.59 105.35
(ii) Time Deposits 943.21 966.60 976.08 993.77 1009.17 1017.60 1030.79
(b) Borrowings (other than from RBI, NABARD, EXIM Bank) 8.99 10.68 10.58 8.95 9.53 9.22 9.77
(c) Other demand and time liabilities 33.07 33.70 33.34 28.51 28.29 31.03 32.44
III Assets with the banking system 84.30 92.30 88.75 93.56 98.29 99.67 100.64
Money at call and short notice 6.39 7.02 5.28 5.69 6.50 6.57 5.13
IV Cash in Hand 7.44 8.13 8.55 8.62 9.22 9.82 9.42
V Investment in India 325.59 329.62 333.65 342.42 347.24 357.26 358.38
(a) Government securities 323.35 327.49 331.52 340.30 345.14 355.14 356.28
(b) Other approved securities 2.24 2.13 2.13 2.12 2.10 2.12 2.10
VI Bank Credit 725.14 732.73 739.25 735.52 737.69 744.61 754.06
(a) Loans Cash Credit and Overdrafts 706.60 713.38 719.02 716.07 717.68 724.56 733.85
(b) Inland Bills Purchased 4.87 5.05 4.92 4.12 4.80 4.40 5.37
(c) Inland Bills Discounted 9.86 10.33 11.24 10.94 11.67 12.27 11.61
(d) Foreign bills purchased 0.94 1.04 0.87 0.60 0.29 0.24 0.16
(e) Foreign bills discounted 2.87 2.93 3.19 3.80 3.24 3.15 3.07
As on the last reporting Friday of
: Form 'A' / 'B' Return under Section 42(2) of RBI Act, 1934, Department of Statistics and Information Management, RBI.Source

35
TABLE 2.2 : BANK GROUP-WISE BUSINESS OF SCHEDULED BANKS IN INDIA 2012-13
(Amount in ` Billion)
(Concld.)
Items
Oct Nov Dec Jan Feb Mar
2012 2012 2012 2013 2013 2013
(8) (9) (10) (11) (12) (13)
Scheduled Urban Co-operative Banks
No. of Reporting Banks 51 51 51 51 51 51
I Liabilities to the banking System 35.08 32.75 32.95 34.24 34.20 36.43
(a) Demand and time deposits from banks 31.13 29.83 29.89 30.59 31.15 32.72
(b) Borrowing from banks 3.88 2.85 2.33 3.59 2.62 3.66
(c) Other demand and time liabilities 0.06 0.06 0.73 0.05 0.43 0.06
II Liabilities to others in India 1197.64 1210.81 1215.86 1222.68 1241.93 1242.98
(a) Aggregate deposits 1158.60 1168.83 1171.27 1182.32 1196.44 1200.78
(i) Demand deposits 105.30 111.54 108.64 106.39 110.32 108.53
(ii) Time Deposits 1053.31 1057.29 1062.63 1075.93 1086.12 1092.25
(b) Borrowings (other than from RBI, NABARD, EXIM Bank) 10.30 11.34 10.74 11.53 10.94 10.32
(c) Other demand and time liabilities 28.74 30.64 33.85 28.83 34.55 31.88
III Assets with the banking system 101.92 96.69 96.85 93.38 101.56 96.36
Money at call and short notice 5.76 4.19 4.34 4.67 6.52 4.09
IV Cash in Hand 8.63 10.07 9.37 8.34 9.57 8.77
V Investment in India 365.36 372.53 372.02 375.79 375.84 374.40
(a) Government securities 363.43 370.52 370.02 372.25 373.75 372.34
(b) Other approved securities 1.93 2.00 2.00 3.55 2.09 2.06
VI Bank Credit 762.82 768.09 793.17 799.80 807.78 823.75
(a) Loans Cash Credit and Overdrafts 743.10 748.58 769.94 777.36 784.09 799.31
(b) Inland Bills Purchased 5.27 5.47 5.36 4.80 5.89 4.42
(c) Inland Bills Discounted 11.22 10.87 14.10 13.81 13.44 15.37
(d) Foreign bills purchased 0.21 0.37 0.88 1.27 1.72 1.67
(e) Foreign bills discounted 3.02 2.80 2.89 2.56 2.63 2.98
As on the last reporting Friday of
: Form 'A' / 'B' Return under Section 42(2) of RBI Act, 1934, Department of Statistics and Information Management, RBI.Source
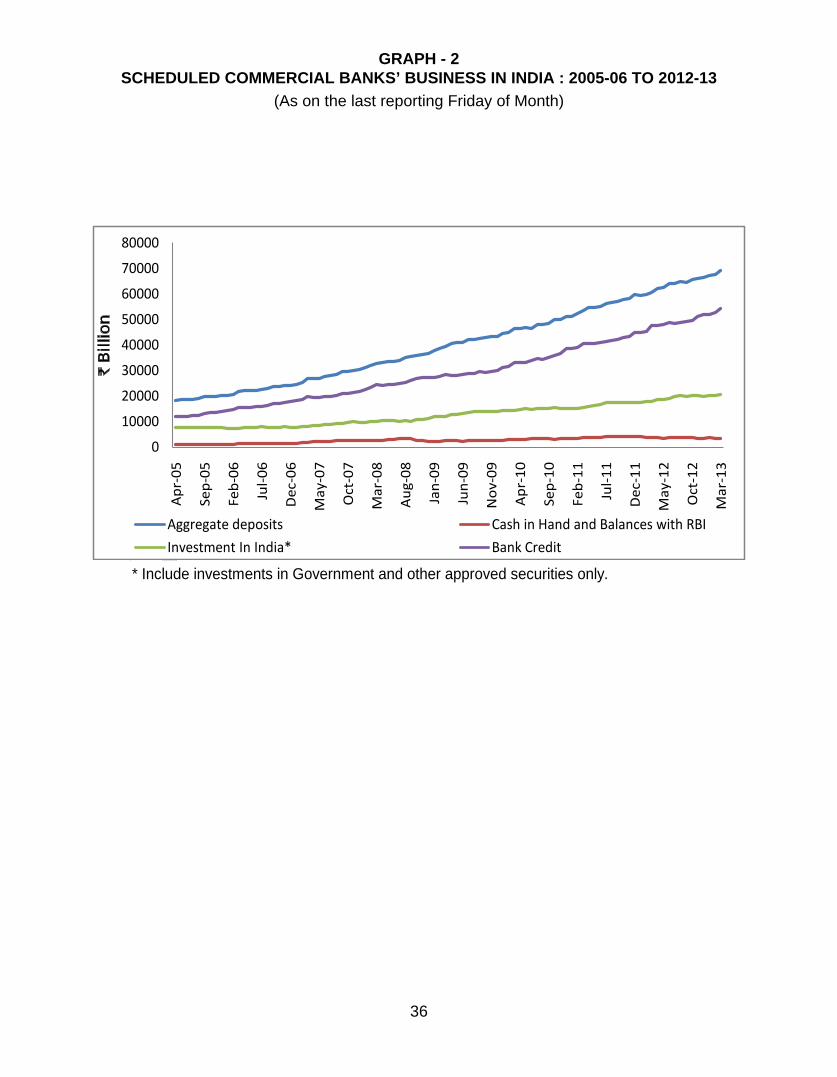
36
GRAPH - 2SCHEDULED COMMERCIAL BANKS’ BUSINESS IN INDIA : 2005-06 TO 2012-13
(As on the last reporting Friday of Month)
Note : * Include investments in Government and other approved securities only.
0
10000
20000
30000
40000
50000
60000
70000
80000
Apr
-05
Sep-
05
Feb-
06
Jul-0
6
Dec
-06
May
-07
Oct
-07
Mar
-08
Aug
-08
Jan-
09
Jun-
09
Nov
-09
Apr
-10
Sep-
10
Feb-
11
Jul-1
1
Dec
-11
May
-12
Oct
-12
Mar
-13
` B
illion
Aggregate deposits Cash in Hand and Balances with RBI
Investment In India* Bank Credit

37
TABLE 2.3: STATE-WISE DISTRIBUTION OF DEPOSITS AND CREDIT OF SCHEDULED COMMERCIAL BANKS IN INDIA-2012 AND 2013
As on March 31
Deposits Credit
Region/State/UnionTerritory
No.of reportingoffices
Amount(in `
Billion)
Pecent share in total
deposits
Pecent share in total
deposits
Pecent share in total
credit
Pecent share in total
credit
(1) (2) (3) (4) (5) (6) (7) (8) (9) (10)
NORTHERN REGION 16926 18793 12874.61 20.85 14542.16 20.6 11262.52 23.5 12874.91 23.4CHANDIGARH 296 325 399.96 0.65 456.82 0.6 454.47 1.0 575.17 1.0HARYANA 2882 3293 1467.03 2.38 1699.11 2.4 1159.23 2.4 1292.74 2.3HIMACHAL PRADESH 1137 1236 384.32 0.62 455.28 0.6 142.83 0.3 157.72 0.3JAMMU & KASHMIR 1077 1275 495.77 0.80 594.54 0.8 169.85 0.4 218.06 0.4NCT OF DELHI 2665 2848 6863.38 11.12 7558.21 10.7 6542.65 13.7 7373.04 13.4PUNJAB 4132 4625 1744.33 2.83 2006.80 2.8 1423.52 3.0 1625.50 3.0RAJASTHAN 4737 5191 1519.83 2.46 1771.39 2.5 1369.96 2.9 1632.68 3.0NORTH-EASTERN REGION 2443 2655 1087.70 1.76 1268.72 1.8 368.01 0.8 420.10 0.8ARUNACHAL PRADESH 91 99 61.19 0.10 72.15 0.1 13.76 0.0 15.31 0.0ASSAM 1574 1682 674.55 1.09 777.29 1.1 251.71 0.5 285.76 0.5MANIPUR 87 101 42.35 0.07 53.55 0.1 12.74 0.0 14.69 0.0MEGHALAYA 231 249 112.34 0.18 139.72 0.2 28.40 0.1 32.74 0.1MIZORAM 104 115 34.28 0.06 42.29 0.1 13.06 0.0 14.90 0.0NAGALAND 99 117 58.39 0.09 64.58 0.1 15.63 0.0 18.02 0.0TRIPURA 257 292 104.61 0.17 119.13 0.2 32.70 0.1 38.69 0.1EASTERN REGION 15746 16875 7399.13 11.98 8605.76 12.2 3693.29 7.7 4216.52 7.7ANDAMAN & NICOBAR IS 45 53 20.39 0.03 23.55 0.0 7.74 0.0 8.96 0.0BIHAR 4503 4828 1413.08 2.29 1652.09 2.3 411.51 0.9 497.35 0.9JHARKHAND 2118 2280 889.21 1.44 1057.01 1.5 298.99 0.6 334.15 0.6ODISHA 3196 3447 1254.20 2.03 1439.78 2.0 588.46 1.2 663.25 1.2SIKKIM 88 97 41.47 0.07 49.89 0.1 13.28 0.0 13.45 0.0WEST BENGAL 5796 6170 3780.78 6.12 4383.44 6.2 2373.30 5.0 2699.34 4.9CENTRAL REGION 19092 20811 7293.36 11.81 8661.17 12.3 3424.75 7.2 4081.34 7.4CHHATTISGARH 1522 1740 689.17 1.12 838.28 1.2 368.60 0.8 445.03 0.8MADHYA PRADESH 4600 4903 1689.53 2.74 2008.20 2.8 949.54 2.0 1157.76 2.1UTTARAKHAND 1403 1542 567.35 0.92 664.53 0.9 202.06 0.4 231.47 0.4UTTAR PRADESH 11567 12626 4347.32 7.04 5150.15 7.3 1904.55 4.0 2247.08 4.1WESTERN REGION 14886 16189 19401.50 31.42 21907.33 31.1 16127.33 33.7 18496.77 33.6DADRA & NAGAR HAVELI 40 47 15.91 0.03 19.77 0.0 5.48 0.0 7.52 0.0DAMAN & DIU 32 38 20.80 0.03 25.73 0.0 3.58 0.0 5.05 0.0GOA 482 529 366.72 0.59 400.86 0.6 106.03 0.2 112.89 0.2GUJARAT 5279 5801 3061.13 4.96 3610.54 5.1 2134.47 4.5 2606.42 4.7MAHARASHTRA 9053 9774 15936.94 25.81 17850.43 25.3 13877.77 29.0 15764.89 28.6SOUTHERN REGION 26966 29324 13685.18 22.17 15528.19 22.0 12951.85 27.1 14975.31 27.2ANDHRA PRADESH 7947 8737 3468.00 5.62 3984.97 5.7 3814.06 8.0 4381.07 8.0KARNATAKA 6810 7361 4117.24 6.67 4646.39 6.6 2908.06 6.1 3315.40 6.0KERALA 4783 5207 2005.73 3.25 2342.17 3.3 1515.26 3.2 1717.12 3.1LAKSHADWEEP 12 12 5.66 0.01 6.20 0.0 0.55 0.0 0.61 0.0PUDUCHERRY 161 177 76.72 0.12 82.67 0.1 54.96 0.1 68.66 0.1TAMIL NADU 7253 7830 4011.82 6.50 4465.77 6.3 4658.97 9.7 5492.45 10.0All India 96059 104647 61741.47 100.00 70513.32 100.0 47827.75 100.0 55064.96 100.0
Source : Quarterly Statistics on Deposits and Credit of Scheduled Commercial Banks- March 2012 and 2013, RBI.
2012 2013 2012 2013 2012 2013
Amount(in `
Billion)
Amount(in `
Billion)
Amount(in `
Billion)

38
2012 2013 2012 2013 2012 2013 2012 2013 2012 2013(11) (12) (13) (14) (15) (16) (17) (18) (19) (20)
NORTHERN REGION 9559 8766 79576 88272 761 774 69612 78152 665 685CHANDIGARH 3620 3349 373290 419697 1351 1406 424171 528424 1535 1770HARYANA 8961 7988 56806 64591 509 516 44888 49143 402 393HIMACHAL PRADESH 6104 5683 55380 64818 338 368 20582 22455 126 128JAMMU & KASHMIR 11911 10285 38647 45337 460 466 13241 16629 158 171NCT OF DELHI 6410 6117 401757 433880 2575 2654 382983 423250 2455 2589PUNJAB 6794 6150 62140 70556 422 434 50711 57150 345 351RAJASTHAN 14771 13745 21721 24828 321 341 19579 22883 289 315NORTH-EASTERN REGION 18703 17482 23805 27335 445 478 8054 9051 151 158ARUNACHAL PRADESH 15558 14643 43222 49772 672 729 9718 10561 151 155ASSAM 20116 19122 21304 24167 429 462 7950 8884 160 170MANIPUR 31696 27661 15360 19167 487 530 4620 5258 146 145MEGHALAYA 13157 12516 36962 44831 486 561 9345 10503 123 131MIZORAM 10705 9879 30787 37223 330 368 11730 13119 126 130NAGALAND 19998 16915 29491 32633 590 552 7895 9105 158 154TRIPURA 14486 12929 28099 31556 407 408 8785 10247 127 132EASTERN REGION 17519 16638 26822 30652 470 510 13388 15018 235 250ANDAMAN & NICOBAR IS 8498 7262 53314 61184 453 444 20252 23290 172 169BIHAR 23577 22491 13310 15215 314 342 3876 4580 91 103JHARKHAND 15884 15058 26431 30788 420 464 8887 9733 141 147ODISHA 13301 12498 29503 33419 392 418 13842 15395 184 192SIKKIM 6987 6413 67444 80200 471 514 21603 21627 151 139WEST BENGAL 15967 15195 40855 46756 652 710 25646 28792 409 437CENTRAL REGION 16426 15351 23257 27111 382 416 10921 12775 179 196CHHATTISGARH 17129 15294 26435 31501 453 482 14139 16723 242 256MADHYA PRADESH 16075 15362 22848 26662 367 410 12841 15371 206 236UTTAR PRADESH 17575 16399 21385 24873 376 408 9369 10852 165 178UTTARAKHAND 7339 6797 55098 63407 404 431 19623 22086 144 150WESTERN REGION 11931 11147 109237 121393 1303 1353 90802 102495 1083 1143DADRA & NAGAR HAVELI 8958 7968 44401 52796 398 421 15291 20091 137 160DAMAN & DIU 7924 6966 82007 97209 650 677 14100 19070 112 133GOA 3049 2801 249532 270557 761 758 72148 76193 220 213GUJARAT 11643 10784 49806 57716 580 622 34729 41664 404 449MAHARASHTRA 12600 11846 139715 154165 1760 1826 121663 136154 1533 1613SOUTHERN REGION 9485 8831 53506 59966 507 530 50639 57831 480 511ANDHRA PRADESH 10773 9909 40507 46029 436 456 44549 50604 480 501KARNATAKA 9110 8554 66364 73794 605 631 46873 52655 427 450KERALA 7014 6473 59789 69487 419 450 45169 50943 317 330LAKSHADWEEP 5402 5435 87318 95100 472 517 8462 9359 46 51PUDUCHERRY 7921 7384 60158 63254 477 467 43090 52535 341 388TAMIL NADU 10096 9493 54786 60079 553 570 63624 73892 642 701
All India 12808 11951 50183 56380 643 674 38874 44028 498 526Source : Quarterly Statistics on Deposits and Credit of Scheduled Commercial Banks- March 2012 and 2013, RBI.
As on March 31
Region/State/UT
TABLE 2.3: STATE-WISE DISTRIBUTION OF DEPOSITS AND CREDIT OF SCHEDULED COMMERCIAL BANKS IN INDIA-2012 AND 2013 (Concld.)
Population per office
Per Capita Deposits (in Rs)
Deposits per office (in Rs
Million)
Per Capita Credit (in Rs)
Credit per office (in Rs
Million)

39
TABLE 2.4 : STATE AND BANK GROUP-WISE DISTRIBUTION OF DEPOSITS AND CREDIT OF SCHEDULED COMMERCIAL BANKS - 2012 AND 2013
(Amount in ` Billion)
Region / State / Union territories
SBI and its Associates Nationalised Banks $
2012 2013 2012 2013
DEPOSIT CREDIT DEPOSIT CREDIT DEPOSIT CREDIT DEPOSIT CREDIT
(1) (2) (3) (4) (5) (6) (7) (8)Northern Region 2503.27 2330.96 2848.42 2905.11 7124.15 6301.64 7835.13 6891.27
(18.6) (22.3) (18.3) (23.3) (21.8) (25.1) (21.2) (24.6)Haryana 267.45 330.29 303.96 373.66 749.16 613.17 841.44 663.66Himachal Pradesh 135.68 56.36 158.91 62.08 212.58 74.96 252.66 84.06Jammu & Kashmir 76.06 16.53 87.70 21.06 64.35 20.93 74.55 23.87Punjab 466.48 448.00 537.06 511.29 1035.67 820.74 1176.36 910.13Rajasthan 538.00 347.15 628.38 409.67 639.48 770.57 737.70 915.04Chandigarh 109.43 104.13 115.82 122.05 210.38 293.32 246.58 384.75Nct Of Delhi 910.16 1028.50 1016.59 1405.29 4212.53 3707.94 4505.85 3909.77North-Eastern Region 490.73 165.23 567.27 178.72 431.51 130.87 502.89 152.73
(3.6) (1.6) (3.7) (1.4) (1.3) (0.5) (1.4) (0.5)Arunachal Pradesh 45.35 11.19 51.53 11.82 12.20 2.08 16.37 2.88Assam 281.72 101.15 315.35 108.82 303.32 101.15 354.25 116.21Manipur 18.71 7.18 24.62 7.75 18.90 5.10 21.45 6.23Meghalaya 62.75 16.74 78.86 18.68 34.28 7.84 40.85 9.34Mizoram 17.61 7.99 21.81 8.46 5.04 1.02 6.01 1.26Nagaland 30.86 11.71 35.21 12.67 17.41 3.37 18.52 4.44Tripura 33.71 9.27 39.89 10.52 40.35 10.30 45.45 12.35Eastern Region 2069.12 1037.10 2361.74 1173.24 4058.83 2015.99 4789.18 2284.87
(15.4) (9.9) (15.2) (9.4) (12.4) (8.0) (13.0) (8.1)Bihar 445.89 120.22 513.73 135.04 760.95 209.43 905.43 265.40Jharkhand 336.83 108.93 389.22 119.91 462.77 150.97 558.83 166.84Odisha 418.51 204.20 468.78 217.88 604.95 281.44 697.14 328.87Sikkim 13.64 6.13 16.54 6.37 22.44 5.87 26.49 5.74West Bengal 843.21 592.90 961.03 688.56 2199.84 1365.33 2592.00 1514.58Andaman & Nicobar Islands 11.03 4.73 12.44 5.47 7.88 2.95 9.30 3.44Central Region 2042.62 824.60 2413.18 962.08 4097.62 2010.52 4896.39 2389.84
(15.2) (7.9) (15.5) (7.7) (12.5) (8.0) (13.3) (8.5)Chhattisgarh 239.31 133.28 277.68 152.38 351.13 181.40 446.52 223.83Madhya Pradesh 622.50 337.57 769.22 412.01 839.79 445.03 967.80 535.32Uttar Pradesh 928.86 296.83 1080.40 334.17 2651.30 1268.69 3178.18 1498.93Uttarakhand 251.95 56.91 285.88 63.51 255.41 115.40 303.89 131.77Western Region 2920.22 2800.92 3404.46 3413.86 10761.51 8476.78 12013.92 9467.23
(21.7) (26.8) (21.9) (27.3) (32.9) (33.8) (32.5) (33.7)Goa 69.93 22.94 78.04 25.65 234.73 61.19 251.88 68.07Gujarat 740.62 553.39 850.45 651.23 1806.16 1154.11 2085.08 1380.87Maharashtra 2097.83 2223.06 2462.01 2735.06 8702.89 7255.93 9654.23 8011.24Dadra & Nagar Haveli 1.05 0.49 1.29 0.68 11.37 3.15 14.53 3.83Daman & Diu 10.79 1.05 12.67 1.25 6.36 2.39 8.19 3.22Southern Region 3424.58 3298.09 3935.16 3849.69 6233.84 6124.88 6901.81 6871.76
(25.5) (31.5) (25.3) (30.8) (19.1) (24.4) (18.7) (24.5)Andhra Pradesh 1108.73 1148.07 1334.14 1336.34 1589.74 1892.04 1779.27 2144.10Karnataka 911.12 708.70 1020.97 801.83 1955.32 1421.33 2154.21 1526.50Kerala 693.22 471.69 788.83 560.19 553.43 515.20 626.53 581.28Tamil Nadu 690.16 956.70 769.58 1135.46 2090.42 2269.95 2293.09 2588.96Lakshadweep 0.66 0.09 0.71 0.11 5.00 0.46 5.49 0.50Puducherry 20.70 12.84 20.92 15.77 39.93 25.91 43.22 30.42All India 13450.53 10456.90 15530.24 12482.70 32707.47 25060.67 36939.33 28057.70
(100.0) (100.0) (100.0) (100.0) (100.0) (100.0) (100.0) (100.0)
Notes : 1. Figures in bracket indicate per cent share in all India total.2. $ Includes IDBI Bank Ltd.
Source : Quarterly Statistics on Deposits and Credit of Scheduled Commercial Banks, March 2012 & 2013, RBI.3. - Nil

40
TABLE 2.4 : STATE AND BANK GROUP-WISE DISTRIBUTION OF DEPOSITS AND CREDIT OF SCHEDULED COMMERCIAL BANKS - 2012 AND 2013 (Contd.)
(Amount in ` Billion)
Region / State / Union territories
Foreign Banks Regional Rural Banks Region / State / Union territories
2012 2013 2012 2013
CREDIT DEPOSIT CREDIT DEPOSIT CREDIT DEPOSIT CREDIT DEPOSIT CREDIT
(8) (9) (10) (11) (12) (13) (14) (15) (16)6891.27 Northern Region 566.88 743.19 636.52 813.72 261.09 174.30 294.79 198.45Northern Region
(24.6) (20.8) (32.0) (22.7) (30.1) (14.3) (15.0) (14.3) (14.5)663.66 Haryana 40.38 32.94 38.19 31.25 70.27 48.73 84.85 55.46 Haryana84.06 Himachal Pradesh - - - - 19.14 8.19 20.73 8.98 Himachal Pradesh23.87 Jammu & Kashmir - - - - 22.92 8.88 26.28 10.38 Jammu & Kashmir
910.13 Punjab 6.54 3.30 6.65 2.93 35.01 26.20 38.78 30.94 Punjab915.04 Rajasthan 4.97 6.67 4.64 6.26 113.75 82.30 124.15 92.70 Rajasthan384.75 Chandigarh 7.96 3.69 7.82 4.14 0.00 0.00 0.00 0.00 Chandigarh
3909.77 Nct Of Delhi 507.03 696.59 579.22 769.13 0.00 0.00 0.00 0.00 Nct Of Delhi152.73 North-Eastern Region 1.95 0.93 2.24 0.82 99.84 46.72 112.34 55.50 North-Eastern Region
(0.5) (0.1) (0.0) (0.1) (0.0) (5.5) (4.0) (5.4) (4.1)2.88 Arunachal Pradesh - - - - 1.93 0.33 1.95 0.42 Arunachal Pradesh
116.21 Assam 1.95 0.93 2.24 0.82 51.68 27.77 58.32 32.86 Assam6.23 Manipur - - - - 1.33 0.36 1.36 0.46 Manipur9.34 Meghalaya - - - - 8.03 2.76 9.76 3.69 Meghalaya1.26 Mizoram - - - - 8.61 3.59 10.36 4.60 Mizoram4.44 Nagaland - - - - 0.58 0.16 0.62 0.19 Nagaland
12.35 Tripura - - - - 27.69 11.74 29.97 13.29 Tripura2284.87 Eastern Region 92.95 74.03 94.70 84.15 393.46 192.30 422.36 214.65 Eastern Region
(8.1) (3.4) (3.2) (3.4) (3.1) (21.5) (16.5) (20.5) (15.7)265.40 Bihar 1.23 0.01 1.29 0.00 150.76 70.44 160.24 78.67 Bihar166.84 Jharkhand 0.00 0.00 0.00 0.00 37.02 12.95 39.61 14.71 Jharkhand328.87 Odisha 0.74 0.09 0.88 0.20 97.03 56.43 100.73 61.49 Odisha
5.74 Sikkim 0.00 0.00 0.00 0.00 0.00 0.00 0.00 0.00 Sikkim1514.58 West Bengal 90.97 73.94 92.52 83.95 108.65 52.48 121.78 59.78 West Bengal
3.44 Andaman & Nicobar Islands - - - - - - - - Andaman & Nicobar Islands2389.84 Central Region 25.65 6.37 25.81 5.76 572.88 289.74 650.76 335.93 Central Region
(8.5) (0.9) (0.3) (0.9) (0.2) (31.3) (24.9) (31.5) (24.6)223.83 Chhattisgarh 0.23 0.01 0.18 0.01 50.53 16.68 58.78 19.77 Chhattisgarh535.32 Madhya Pradesh 2.59 1.99 2.42 2.17 111.72 59.31 126.86 71.10 Madhya Pradesh
1498.93 Uttar Pradesh 22.38 4.37 22.69 3.58 392.27 203.64 443.49 232.61 Uttar Pradesh131.77 Uttarakhand 0.45 0.00 0.52 0.00 18.37 10.11 21.63 12.45 Uttarakhand
9467.23 Western Region 1546.27 1011.76 1542.66 1195.36 109.97 58.17 123.30 74.70 Western Region(33.7) (56.7) (43.6) (55.1) (44.2) (6.0) (5.0) (6.0) (5.5)68.07 Goa 0.00 0.00 0.00 0.00 0.00 0.00 0.00 0.00 Goa
1380.87 Gujarat 26.75 29.12 26.06 31.21 54.27 25.06 61.22 31.95 Gujarat8011.24 Maharashtra 1519.52 982.64 1516.60 1164.15 55.69 33.12 62.08 42.75 Maharashtra
3.83 Dadra & Nagar Haveli - - - - - - - - Dadra & Nagar Haveli3.22 Daman & Diu - - - - - - - - Daman & Diu
6871.76 Southern Region 495.78 485.45 498.88 607.19 392.86 404.44 461.06 487.68 Southern Region(24.5) (18.2) (20.9) (17.8) (22.4) (21.5) (34.7) (22.3) (35.7)
2144.10 Andhra Pradesh 77.23 52.23 66.36 55.09 152.58 167.56 174.03 205.55 Andhra Pradesh1526.50 Karnataka 250.02 152.14 247.66 202.73 150.09 130.53 177.28 151.43 Karnataka581.28 Kerala 10.82 6.03 9.47 4.72 55.08 61.27 68.21 75.60 Kerala
2588.96 Tamil Nadu 157.36 274.94 174.98 344.55 33.72 43.43 39.41 52.62 Tamil Nadu0.50 Lakshadweep - - - - - - - - Lakshadweep
30.42 Puducherry 0.36 0.11 0.42 0.09 1.39 1.66 2.13 2.48 Puducherry28057.70 All India 2729.49 2321.73 2800.81 2707.02 1830.09 1165.67 2064.61 1366.90 All India
(100.0) (100.0) (100.0) (100.0) (100.0) (100.0) (100.0) (100.0) (100.0)
Notes : 1. Figures in bracket indicate per cent share in all India total.2. $ Includes IDBI Bank Ltd.
Source : Quarterly Statistics on Deposits and Credit of Scheduled Commercial Banks, March 2012 & 2013, RBI.3. - Nill
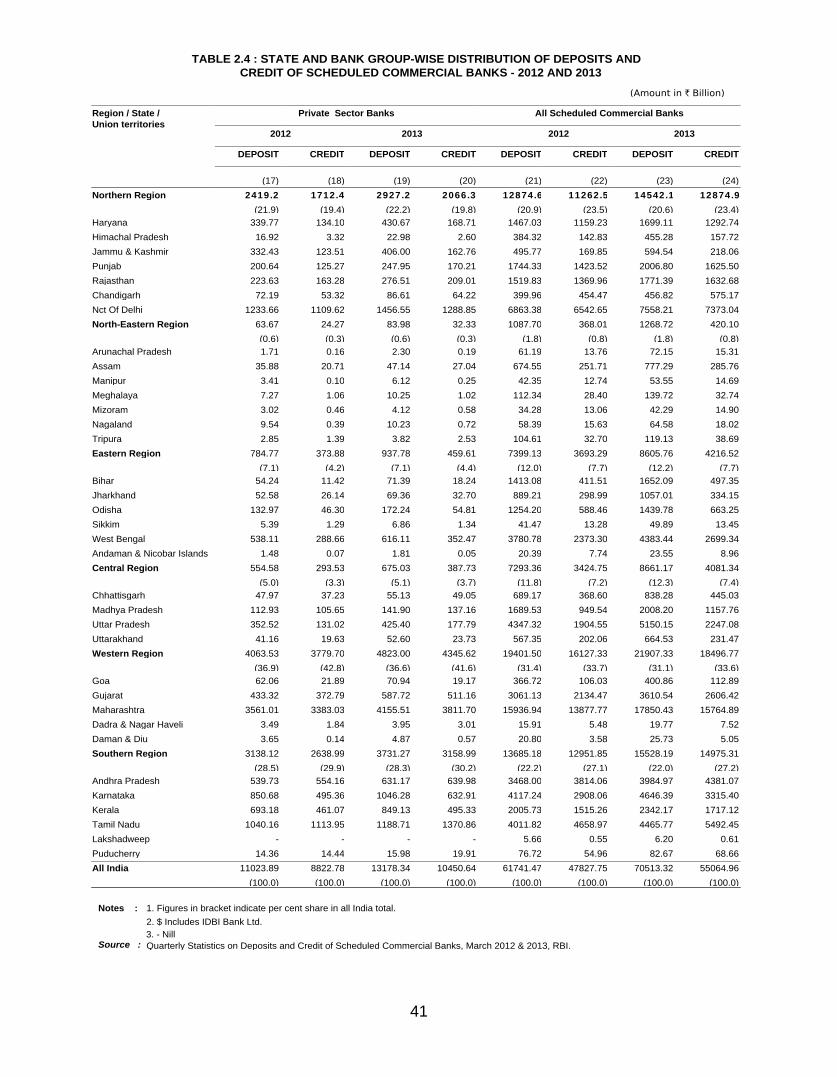
41
TABLE 2.4 : STATE AND BANK GROUP-WISE DISTRIBUTION OF DEPOSITS AND CREDIT OF SCHEDULED COMMERCIAL BANKS - 2012 AND 2013
(Amount in ` Billion)
Region / State / Union territories
Private Sector Banks All Scheduled Commercial Banks
2012 2013 2012 2013
DEPOSIT CREDIT DEPOSIT CREDIT DEPOSIT CREDIT DEPOSIT CREDIT
(17) (18) (19) (20) (21) (22) (23) (24)Northern Region 2419.23 1712.42 2927.28 2066.35 12874.61 11262.52 14542.16 12874.91
(21.9) (19.4) (22.2) (19.8) (20.9) (23.5) (20.6) (23.4)Haryana 339.77 134.10 430.67 168.71 1467.03 1159.23 1699.11 1292.74Himachal Pradesh 16.92 3.32 22.98 2.60 384.32 142.83 455.28 157.72Jammu & Kashmir 332.43 123.51 406.00 162.76 495.77 169.85 594.54 218.06Punjab 200.64 125.27 247.95 170.21 1744.33 1423.52 2006.80 1625.50Rajasthan 223.63 163.28 276.51 209.01 1519.83 1369.96 1771.39 1632.68Chandigarh 72.19 53.32 86.61 64.22 399.96 454.47 456.82 575.17Nct Of Delhi 1233.66 1109.62 1456.55 1288.85 6863.38 6542.65 7558.21 7373.04North-Eastern Region 63.67 24.27 83.98 32.33 1087.70 368.01 1268.72 420.10
(0.6) (0.3) (0.6) (0.3) (1.8) (0.8) (1.8) (0.8)Arunachal Pradesh 1.71 0.16 2.30 0.19 61.19 13.76 72.15 15.31Assam 35.88 20.71 47.14 27.04 674.55 251.71 777.29 285.76Manipur 3.41 0.10 6.12 0.25 42.35 12.74 53.55 14.69Meghalaya 7.27 1.06 10.25 1.02 112.34 28.40 139.72 32.74Mizoram 3.02 0.46 4.12 0.58 34.28 13.06 42.29 14.90Nagaland 9.54 0.39 10.23 0.72 58.39 15.63 64.58 18.02Tripura 2.85 1.39 3.82 2.53 104.61 32.70 119.13 38.69Eastern Region 784.77 373.88 937.78 459.61 7399.13 3693.29 8605.76 4216.52
(7.1) (4.2) (7.1) (4.4) (12.0) (7.7) (12.2) (7.7)Bihar 54.24 11.42 71.39 18.24 1413.08 411.51 1652.09 497.35Jharkhand 52.58 26.14 69.36 32.70 889.21 298.99 1057.01 334.15Odisha 132.97 46.30 172.24 54.81 1254.20 588.46 1439.78 663.25Sikkim 5.39 1.29 6.86 1.34 41.47 13.28 49.89 13.45West Bengal 538.11 288.66 616.11 352.47 3780.78 2373.30 4383.44 2699.34Andaman & Nicobar Islands 1.48 0.07 1.81 0.05 20.39 7.74 23.55 8.96Central Region 554.58 293.53 675.03 387.73 7293.36 3424.75 8661.17 4081.34
(5.0) (3.3) (5.1) (3.7) (11.8) (7.2) (12.3) (7.4)Chhattisgarh 47.97 37.23 55.13 49.05 689.17 368.60 838.28 445.03Madhya Pradesh 112.93 105.65 141.90 137.16 1689.53 949.54 2008.20 1157.76Uttar Pradesh 352.52 131.02 425.40 177.79 4347.32 1904.55 5150.15 2247.08Uttarakhand 41.16 19.63 52.60 23.73 567.35 202.06 664.53 231.47Western Region 4063.53 3779.70 4823.00 4345.62 19401.50 16127.33 21907.33 18496.77
(36.9) (42.8) (36.6) (41.6) (31.4) (33.7) (31.1) (33.6)Goa 62.06 21.89 70.94 19.17 366.72 106.03 400.86 112.89Gujarat 433.32 372.79 587.72 511.16 3061.13 2134.47 3610.54 2606.42Maharashtra 3561.01 3383.03 4155.51 3811.70 15936.94 13877.77 17850.43 15764.89Dadra & Nagar Haveli 3.49 1.84 3.95 3.01 15.91 5.48 19.77 7.52Daman & Diu 3.65 0.14 4.87 0.57 20.80 3.58 25.73 5.05Southern Region 3138.12 2638.99 3731.27 3158.99 13685.18 12951.85 15528.19 14975.31
(28.5) (29.9) (28.3) (30.2) (22.2) (27.1) (22.0) (27.2)Andhra Pradesh 539.73 554.16 631.17 639.98 3468.00 3814.06 3984.97 4381.07Karnataka 850.68 495.36 1046.28 632.91 4117.24 2908.06 4646.39 3315.40Kerala 693.18 461.07 849.13 495.33 2005.73 1515.26 2342.17 1717.12Tamil Nadu 1040.16 1113.95 1188.71 1370.86 4011.82 4658.97 4465.77 5492.45Lakshadweep - - - - 5.66 0.55 6.20 0.61Puducherry 14.36 14.44 15.98 19.91 76.72 54.96 82.67 68.66All India 11023.89 8822.78 13178.34 10450.64 61741.47 47827.75 70513.32 55064.96
(100.0) (100.0) (100.0) (100.0) (100.0) (100.0) (100.0) (100.0)
Notes : 1. Figures in bracket indicate per cent share in all India total.2. $ Includes IDBI Bank Ltd.
Source : Quarterly Statistics on Deposits and Credit of Scheduled Commercial Banks, March 2012 & 2013, RBI.3. - Nill

42
MAP - 2STATE & UNION TERRITORY-WISE CREDIT - DEPOSIT RATIO OF SCHEDULED
COMMERCIAL BANKS - 2013(As on March 31)
125.9 (113.6)
36.7 (34.3)
81.0 (81.6)
76.1 (79.0)
92.2 (90.1)
97.6 (95.3)
34.8 (35.6)
57.7 (56.2)
72.2 (69.7)
88.3 (87.1)
71.4(70.6)
109.9(110.0)
123.0(116.1)
83.1(71.6)
38.1(38.0)
9.8(9.7)
28.2(28.9)
38.1
(34.4
)
19.6
(17.2
)
73.3
(75.5
)53.1
(53.5)
46.1 (46.9)
31.6 (33.6)
30.1 (29.1)
27.0 (32.0)
36.8 (37.3)
23.4 (25.3)
32.5 (31.3)
35.2 (38.1)
27.4 (30.1)
Figures in brackets indicateCredit - Deposit ratio for 2012All figures are in per cent.
27.9 (26.8)
21.2
(22.5)
61.6 (62.8)
43.6 (43.8)
34.6 (37.2)
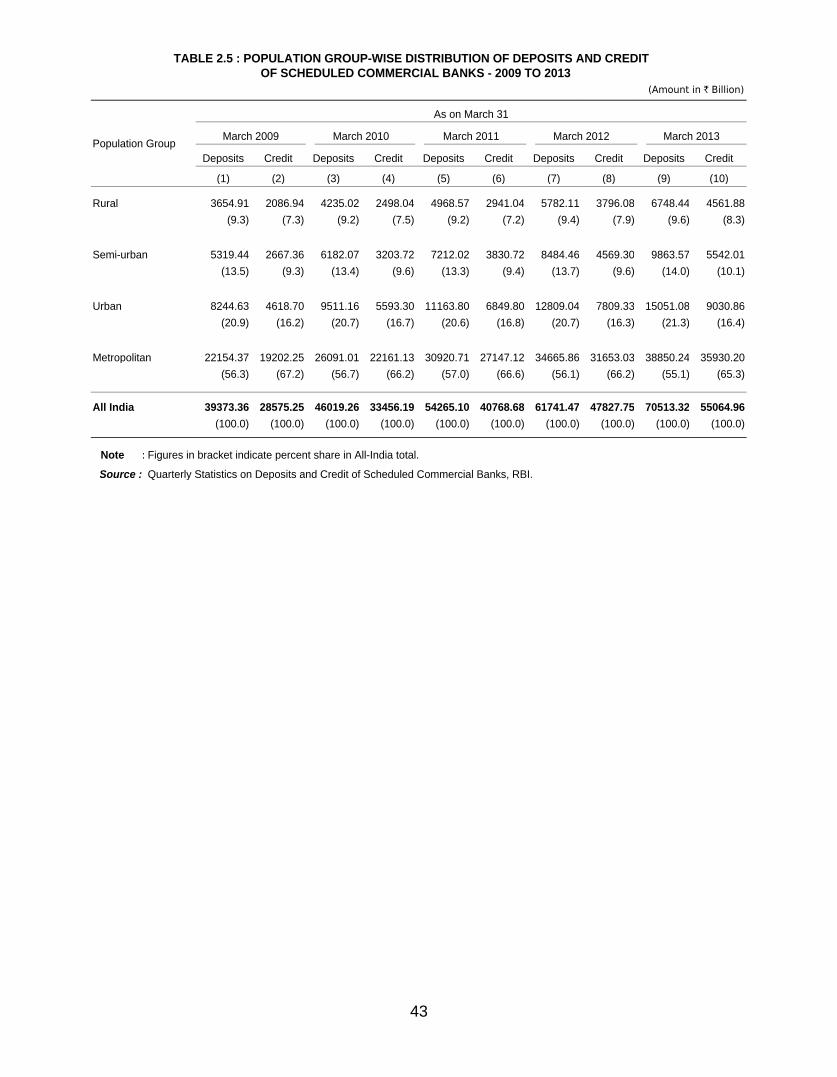
43
TABLE 2.5 : POPULATION GROUP-WISE DISTRIBUTION OF DEPOSITS AND CREDIT OF SCHEDULED COMMERCIAL BANKS - 2009 TO 2013
(Amount in ` Billion)
Population Group
As on March 31
March 2009 March 2010 March 2011 March 2012 March 2013
Deposits Credit Deposits Credit Deposits Credit Deposits Credit Deposits Credit
(1) (2) (3) (4) (5) (6) (7) (8) (9) (10)
Rural 3654.91 2086.94 4235.02 2498.04 4968.57 2941.04 5782.11 3796.08 6748.44 4561.88(9.3) (7.3) (9.2) (7.5) (9.2) (7.2) (9.4) (7.9) (9.6) (8.3)
Semi-urban 5319.44 2667.36 6182.07 3203.72 7212.02 3830.72 8484.46 4569.30 9863.57 5542.01(13.5) (9.3) (13.4) (9.6) (13.3) (9.4) (13.7) (9.6) (14.0) (10.1)
Urban 8244.63 4618.70 9511.16 5593.30 11163.80 6849.80 12809.04 7809.33 15051.08 9030.86(20.9) (16.2) (20.7) (16.7) (20.6) (16.8) (20.7) (16.3) (21.3) (16.4)
Metropolitan 22154.37 19202.25 26091.01 22161.13 30920.71 27147.12 34665.86 31653.03 38850.24 35930.20(56.3) (67.2) (56.7) (66.2) (57.0) (66.6) (56.1) (66.2) (55.1) (65.3)
All India 39373.36 28575.25 46019.26 33456.19 54265.10 40768.68 61741.47 47827.75 70513.32 55064.96(100.0) (100.0) (100.0) (100.0) (100.0) (100.0) (100.0) (100.0) (100.0) (100.0)
Note : Figures in bracket indicate percent share in All-India total.
Source : Quarterly Statistics on Deposits and Credit of Scheduled Commercial Banks, RBI.

44
GRAPH - 3POPULATION GROUP-WISE DISTRIBUTION OF DEPOSITS AND CREDIT OF
SCHEDULED COMMERCIAL BANKS - 2012 AND 2013(As on March 31)
0.00
5000.00
10000.00
15000.00
20000.00
25000.00
30000.00
35000.00
40000.00
2012 2013
5782
.11
6748
.44
8484
.46
9863
.57
1280
9.04
1505
1.08
3466
5.86
3885
0.24
Rs.
Bill
ion
Deposits
Rural
Semi-Urban
Urban
Metropolitan
0.00
5000.00
10000.00
15000.00
20000.00
25000.00
30000.00
35000.00
40000.00
2012 2013
3796
.08
4561
.88
4569
.30
5542
.01
7809
.33
9030
.86
3165
3.03
3593
0.20
Rs.
Bill
ion
Credit
Rural
Semi-Urban
Urban
Metropolitan
0.00
5000.00
10000.00
15000.00
20000.00
25000.00
30000.00
35000.00
40000.00
2012 2013
5782
.11
6748
.44
8484
.46
9863
.57
1280
9.04
1505
1.08
3466
5.86
3885
0.24
Rs. B
illio
n
Deposits
Rural
Semi-Urban
Urban
Metropolitan
0.00
5000.00
10000.00
15000.00
20000.00
25000.00
30000.00
35000.00
40000.00
2012 2013
3796
.08
4561
.88
4569
.30
5542
.01
7809
.33
9030
.86
3165
3.03
3593
0.20
Rs. B
illio
n
Credit
Rural
Semi-Urban
Urban
Metropolitan

45
TABLE 2.6 : BANK GROUP-WISE SELECTED RATIOS OF SCHEDULED COMMERCIAL BANKS : 2012 AND 2013
2 As on March 31 8
Ratios
State Bankof India &
its Associates
NationalisedBanks $
PublicSectorBanks
Old PrivateSectorBanks
2012 2013 2012 2013 2012 2013 2012 2013
(1) (2) (3) (4) (5) (6) (7) (8)
1. Cash-Deposit ratio 5.63 5.52 5.59 4.60 5.60 4.86 5.30 4.47
2. Credit-Deposit ratio 81.99 85.22 75.77 74.95 77.51 77.85 72.83 72.20
3. Investment-Deposit ratio 29.70 29.23 30.30 31.16 30.13 30.62 34.61 35.97
4. (Credit+Investment)-Deposit ratio 111.69 114.44 106.07 106.12 107.65 108.46 107.45 108.17
5. Ratio of deposits to total liabilities 79.32 78.35 84.27 84.29 82.82 82.53 84.26 84.07
6. Ratio of demand & savings bank deposits to total deposits 40.80 40.76 28.50 28.55 31.96 31.99 26.46 25.73
7. Ratio of priority sector advances to total advances 30.02 27.26 28.32 28.33 28.82 28.00 31.64 31.81
8. Ratio of term loan to total advances 49.25 48.34 53.98 53.27 52.58 51.75 46.39 43.75
9. Ratio of secured advances total advances 82.80 84.37 82.54 87.58 82.62 86.59 88.83 91.00
10. Ratio of investments in non-approved securities to total investments 16.26 20.39 17.05 18.69 16.83 19.15 28.14 27.72
11. Ratio of interest income to total assets 8.52 8.54 8.57 8.54 8.55 8.54 9.54 9.74
12. Ratio of net interest income to total assets (Net Interest Margin) 3.25 2.98 2.55 2.39 2.76 2.57 2.95 2.94
13. Ratio of non-interest income to total assets 1.06 1.03 0.82 0.81 0.89 0.87 0.99 1.01
14. Ratio of intermediation cost of total assets 1.94 1.93 1.44 1.41 1.59 1.57 1.91 1.89
15. Ratio of wage bills to intermediation cost 64.74 62.73 63.13 63.14 63.71 62.99 57.73 56.43
16. Ratio of wage bills to total expense 17.43 16.20 12.21 11.81 13.72 13.09 13.00 12.28
17. Ratio of wage bills to total income 13.13 12.68 9.71 9.54 10.74 10.48 10.50 9.92
18. Ratio of burden to total assets 0.88 0.90 0.63 0.60 0.70 0.69 0.92 0.88
19. Ratio of burden to interest income 10.38 10.59 7.30 7.08 8.21 8.12 9.65 9.02
20. Ratio of operating profits to total assets 2.36 2.08 1.92 1.79 2.05 1.88 2.03 2.07
21. Return on assets 0.89 0.88 0.88 0.74 0.88 0.78 1.20 1.26
22. Return on equity 16.00 15.29 15.05 12.34 15.33 13.24 15.22 16.22
23. Cost of deposits 5.97 6.37 6.51 6.74 6.36 6.63 7.25 7.46
24. Cost of borrowings 6.44 5.69 7.46 6.40 7.10 6.15 9.73 9.45
25. Cost of funds 5.66 5.96 6.22 6.39 6.06 6.27 7.10 7.27
26. Return on advances 10.27 9.90 10.32 10.16 10.31 10.08 11.98 12.15
27. Return on investments 7.80 8.08 7.43 7.42 7.54 7.60 7.38 7.49
28. Return on advances adjusted to cost of funds 4.62 3.93 4.10 3.76 4.25 3.81 4.88 4.88
29. Return on investments adjusted to cost of funds 2.15 2.11 1.21 1.02 1.48 1.33 0.28 0.22
(in per cent)
Note : $ Includes IDBI Bank Ltd.
Source : Annual accounts of banks.

46
10 As on March 31 16
Ratios
New PrivateSectorBanks
PrivateSectorBanks
ForeignBanks
All ScheduledCommercial
Banks2012 2013 2012 2013 2012 2013 2012 2013
(9) (10) (11) (12) (13) (14) (15) (16)
1. Cash-Deposit ratio 6.27 5.64 6.01 5.33 8.37 7.45 5.79 5.05
2. Credit-Deposit ratio 85.75 85.46 82.28 81.90 82.99 91.56 78.62 79.14
3. Investment-Deposit ratio 48.52 48.11 44.78 44.86 72.45 79.19 34.62 35.17
4. (Credit+Investment)-Deposit ratio 134.27 133.56 127.06 126.76 155.44 170.74 113.23 114.31
5. Ratio of deposits to total liabilities 65.14 66.14 69.38 70.15 47.08 46.33 77.56 77.61
6. Ratio of demand & savings bank deposits to total deposits 41.37 41.19 37.36 37.05 44.03 40.58 33.46 33.28
7. Ratio of priority sector advances to total advances 28.28 25.88 29.08 27.28 31.55 29.20 28.99 27.91
8. Ratio of term loan to total advances 72.83 70.55 66.54 64.22 40.47 39.06 54.69 53.61
9. Ratio of secured advances total advances 82.39 81.86 83.92 84.02 49.04 47.33 81.34 84.33
10. Ratio of investments in non-approved securities to total investments 35.61 36.70 34.06 34.77 31.39 26.56 22.20 23.54
11. Ratio of interest income to total assets 8.47 8.84 8.71 9.04 6.67 6.98 8.45 8.53
12. Ratio of net interest income to total assets (Net Interest Margin) 3.13 3.30 3.09 3.22 3.89 3.89 2.90 2.79
13. Ratio of non-interest income to total assets 1.80 1.79 1.62 1.62 2.02 1.85 1.11 1.09
14. Ratio of intermediation cost of total assets 2.28 2.29 2.20 2.20 2.47 2.36 1.77 1.75
15. Ratio of wage bills to intermediation cost 39.95 38.99 43.37 42.33 43.22 42.11 56.69 55.74
16. Ratio of wage bills to total expense 11.97 11.40 12.22 11.61 20.35 18.22 13.73 13.02
17. Ratio of wage bills to total income 8.88 8.39 9.25 8.73 12.29 11.25 10.52 10.13
18. Ratio of burden to total assets 0.48 0.50 0.58 0.58 0.45 0.51 0.66 0.66
19. Ratio of burden to interest income 5.72 5.60 6.68 6.42 6.78 7.28 7.82 7.70
20. Ratio of operating profits to total assets 2.65 2.81 2.51 2.64 3.44 3.38 2.24 2.13
21. Return on assets 1.63 1.74 1.53 1.63 1.76 1.94 1.08 1.03
22. Return on equity 15.27 16.51 15.26 16.46 10.79 11.52 14.60 13.84
23. Cost of deposits 6.14 6.45 6.43 6.72 4.34 4.67 6.28 6.57
24. Cost of borrowings 7.38 7.24 7.54 7.42 3.52 4.06 6.73 6.22
25. Cost of funds 5.45 5.77 5.84 6.12 3.86 4.05 5.90 6.12
26. Return on advances 10.77 11.33 11.06 11.52 9.61 9.55 10.42 10.33
27. Return on investments 7.23 7.22 7.27 7.28 8.02 8.13 7.52 7.57
28. Return on advances adjusted to cost of funds 5.32 5.57 5.22 5.41 5.74 5.50 4.52 4.21
29. Return on investments adjusted to cost of funds 1.78 1.45 1.43 1.16 4.16 4.08 1.62 1.45
Source : Annual accounts of banks.
TABLE 2.6 : BANK GROUP-WISE SELECTED RATIOS OF SCHEDULED COMMERCIAL BANKS : 2012 AND 2013
(in per cent)
(Concld.)

47
TABLE 2.7 : BANK GROUP-WISE MATURITY PROFILE OF SELECTED ITEMS OFLIABILITIES AND ASSETS - 2012 AND 2013 AS ON MARCH 31
(Amount in ` Billion)
Maturity-wiseliabilities/assets
SBI and its Associates NationalisedBanks $
Public SectorBanks
Old Private SectorBanks
2012 2013 2012 2013 2012 2013 2012 2013
(1) (2) (3) (4) (5) (6) (7) (8)
Deposits 14047.37 16182.00 35961.77 41263.92 50009.14 57445.92 3158.91 3738.96
a) 1 - 14 days 853.36 1039.68 2255.98 2938.38 3109.35 3978.06 175.19 224.23
b) 15 - 28 days 228.46 321.02 958.15 1119.50 1186.61 1440.52 86.75 118.89
c) 29 days to 3 months 859.97 871.19 4884.63 4739.49 5744.60 5610.69 391.67 481.23
d) Over 3 months to 6 months 1313.84 1182.80 3972.04 4087.55 5285.88 5270.35 336.60 325.82
e) Over 6 months to 1 year 2028.20 2448.81 7455.34 8361.71 9483.54 10810.52 528.54 663.62
f) Over 1 year to 3 years 4179.07 4648.69 8461.42 10442.43 12640.49 15091.12 1239.00 1401.44
g) Over 3 years to 5 years 2115.90 2656.83 2158.15 2758.76 4274.05 5415.59 217.12 277.24
h) Over 5 years 2468.56 3012.97 5816.06 6816.10 8284.62 9829.07 184.04 246.50
Borrowings 1572.03 2004.42 2869.24 3391.40 4441.27 5395.82 198.12 252.58
a) 1 - 14 days 225.88 254.64 558.69 492.64 784.57 747.27 39.92 65.62
b) 15 - 28 days 75.85 111.45 66.08 104.12 141.92 215.57 2.15 9.28
c) 29 days to 3 months 251.24 411.91 179.79 348.40 431.03 760.32 15.53 31.86
d) Over 3 months to 6 months 127.64 209.94 265.35 418.80 392.99 628.74 39.48 35.31
e) Over 6 months to 1 year 80.38 126.53 185.69 283.77 266.08 410.30 29.07 25.10
f) Over 1 year to 3 years 167.17 337.88 375.50 414.94 542.67 752.82 26.57 36.74
g) Over 3 years to 5 years 219.93 127.57 455.55 467.59 675.48 595.16 15.45 21.80
h) Over 5 years 423.94 424.51 782.58 861.14 1206.52 1285.65 29.96 26.87
Loans and Advances 11525.93 13798.34 27339.19 31032.97 38865.12 44831.32 2303.35 2700.34
a) 1 - 14 days 756.97 1322.74 1732.27 2079.21 2489.24 3401.95 145.01 187.48
b) 15 - 28 days 151.57 128.30 656.74 752.87 808.30 881.17 63.60 75.35
c) 29 days to 3 months 676.39 730.85 2993.33 3423.85 3669.72 4154.70 215.16 227.37
d) Over 3 months to 6 months 490.95 600.27 2233.14 2456.73 2724.09 3057.00 202.75 246.48
e) Over 6 months to 1 year 671.48 726.38 2948.59 3457.66 3620.07 4184.04 386.08 499.88
f) Over 1 year to 3 years 5311.59 6567.79 9213.82 9922.16 14525.41 16489.95 831.06 923.49
g) Over 3 years to 5 years 1114.82 1456.28 3173.21 3499.90 4288.03 4956.18 210.24 258.85
h) Over 5 years 2352.17 2265.73 4388.10 5440.59 6740.26 7706.32 249.45 281.44
Note : $ Includes IDBI Bank Ltd.Source : Annual accounts of banks.

48
TABLE 2.7 : BANK GROUP-WISE MATURITY PROFILE OF SELECTED ITEMS OFLIABILITIES AND ASSETS - 2012 AND 2013 AS ON MARCH 31 (Contd.)
(Amount in ` Billion)
Maturity-wiseliabilities/assets
New Private SectorBanks
Private SectorBanks Foreign Banks All Scheduled
Commercial Banks
2012 2013 2012 2013 2012 2013 2012 2013
(9) (10) (11) (12) (13) (14) (15) (16)
Deposits 8586.96 10219.39 11745.87 13958.36 2769.16 2878.98 64524.17 74283.25
a) 1 - 14 days 601.54 813.84 776.73 1038.07 618.14 638.19 4504.22 5654.31
b) 15 - 28 days 303.01 315.48 389.76 434.37 185.86 195.93 1762.23 2070.82
c) 29 days to 3 months 1003.64 1159.81 1395.30 1641.04 380.65 435.27 7520.56 7687.00
d) Over 3 months to 6 months 920.48 994.92 1257.08 1320.74 214.14 212.76 6757.09 6803.85
e) Over 6 months to 1 year 1374.23 1324.13 1902.77 1987.75 314.32 304.08 11700.63 13102.36
f) Over 1 year to 3 years 2282.18 2417.84 3521.18 3819.27 823.97 830.81 16985.63 19741.20
g) Over 3 years to 5 years 446.81 991.26 663.94 1268.50 229.96 260.16 5167.95 6944.25
h) Over 5 years 1655.07 2202.11 1839.11 2448.61 2.12 1.77 10125.86 12279.44
Borrowings 2386.41 2746.17 2584.53 2998.75 1199.08 1534.04 8224.87 9928.61
a) 1 - 14 days 368.04 403.81 407.96 469.43 698.21 965.34 1890.73 2182.04
b) 15 - 28 days 54.87 46.26 57.01 55.54 53.98 74.38 252.92 345.50
c) 29 days to 3 months 186.95 202.66 202.48 234.52 117.95 198.26 751.46 1193.09
d) Over 3 months to 6 months 246.60 267.86 286.09 303.17 59.39 56.78 738.47 988.69
e) Over 6 months to 1 year 316.69 288.83 345.76 313.92 84.28 78.05 696.11 802.27
f) Over 1 year to 3 years 279.65 394.64 306.21 431.38 110.16 92.79 959.05 1276.99
g) Over 3 years to 5 years 307.18 399.51 322.63 421.31 32.64 40.87 1030.75 1057.33
h) Over 5 years 626.43 742.60 656.39 769.47 42.47 27.57 1905.38 2082.69
Loans and Advances 7363.11 8732.98 9666.46 11433.32 2298.26 2636.81 50829.84 58901.45
a) 1 - 14 days 285.15 338.47 430.16 525.95 379.86 452.80 3299.26 4380.70
b) 15 - 28 days 137.62 176.86 201.22 252.21 179.73 223.49 1189.25 1356.88
c) 29 days to 3 months 585.10 635.54 800.26 862.91 459.01 493.70 4928.99 5511.32
d) Over 3 months to 6 months 564.83 654.30 767.59 900.77 297.86 340.19 3789.54 4297.97
e) Over 6 months to 1 year 813.30 959.02 1199.37 1458.90 227.21 207.47 5046.65 5850.42
f) Over 1 year to 3 years 2750.80 3288.05 3581.86 4211.54 355.69 467.46 18462.96 21168.95
g) Over 3 years to 5 years 886.06 1075.32 1096.29 1334.17 111.25 166.28 5495.57 6456.63
h) Over 5 years 1340.25 1605.42 1589.70 1886.86 287.65 285.41 8617.62 9878.59
Source : Annual accounts of banks.

49
TABLE 2.7 : BANK GROUP-WISE MATURITY PROFILE OF SELECTED ITEMS OFLIABILITIES AND ASSETS - 2012 AND 2013 AS ON MARCH 31 (Contd.)
(Amount in ` Billion)
Maturity-wiseliabilities/assets
SBI and its Associates NationalisedBanks $
Public SectorBanks
Old Private SectorBanks
2012 2013 2012 2013 2012 2013 2012 2013
(1) (2) (3) (4) (5) (6) (7) (8)
Investments (at book value) 4175.00 4728.19 10949.54 12910.02 15124.54 17638.21 1093.57 1345.53
a) 1 - 14 days 63.33 87.11 664.55 748.50 727.87 835.61 66.98 137.79
b) 15 - 28 days 44.39 51.47 115.37 118.16 159.76 169.63 21.93 30.25
c) 29 days to 3 months 244.28 313.25 724.36 723.97 968.63 1037.22 122.89 144.03
d) Over 3 months to 6 months 127.89 195.65 322.89 457.72 450.77 653.37 46.67 83.72
e) Over 6 months to 1 year 148.73 132.71 580.33 571.08 729.06 703.79 72.95 121.60
f) Over 1 year to 3 years 628.84 647.95 1274.46 1689.25 1903.30 2337.20 133.82 219.48
g) Over 3 years to 5 years 720.07 912.01 1427.62 1746.82 2147.69 2658.83 142.43 149.67
h) Over 5 years 2197.49 2388.04 5839.96 6854.53 8037.45 9242.57 485.90 458.99
Foreign Currency Assets 1806.83 2305.49 4639.33 5839.66 6446.16 8145.15 224.38 197.69
a) 1 - 14 days 340.98 735.37 806.49 966.86 1147.47 1702.23 37.67 28.16
b) 15 - 28 days 63.17 65.70 219.48 370.00 282.65 435.69 5.70 15.42
c) 29 days to 3 months 266.56 225.69 1168.41 1580.60 1434.97 1806.29 70.14 84.59
d) Over 3 months to 6 months 223.37 234.18 965.38 1187.82 1188.75 1422.00 68.13 47.11
e) Over 6 months to 1 year 148.25 110.71 458.88 561.93 607.13 672.63 37.84 19.13
f) Over 1 year to 3 years 248.43 317.86 415.54 486.82 663.97 804.67 4.15 1.81
g) Over 3 years to 5 years 284.09 288.16 323.76 358.84 607.85 646.99 0.38 0.67
h) Over 5 years 231.98 327.82 281.40 326.81 513.38 654.63 0.37 0.79
Foreign Currency Liabilities 1700.11 2053.28 4533.00 5646.57 6233.12 7699.85 230.76 242.95
a) 1 - 14 days 329.76 390.27 762.25 914.08 1092.01 1304.34 25.25 20.09
b) 15 - 28 days 94.69 155.07 252.26 427.03 346.95 582.10 1.95 15.69
c) 29 days to 3 months 327.99 371.49 1162.30 1355.06 1490.29 1726.55 71.50 101.72
d) Over 3 months to 6 months 233.36 256.62 899.93 1044.28 1133.28 1300.90 73.71 56.32
e) Over 6 months to 1 year 238.44 250.58 587.68 861.91 826.11 1112.48 45.36 36.43
f) Over 1 year to 3 years 243.13 416.89 308.78 403.48 551.91 820.37 5.78 5.40
g) Over 3 years to 5 years 192.72 165.01 383.79 430.03 576.51 595.04 1.78 2.30
h) Over 5 years 40.03 47.35 176.01 210.72 216.04 258.06 5.42 5.00
Note : $ Includes IDBI Bank Ltd.Source : Annual accounts of banks.

50
TABLE 2.7 : BANK GROUP-WISE MATURITY PROFILE OF SELECTED ITEMS OFLIABILITIES AND ASSETS - 2012 AND 2013 AS ON MARCH 31 (Concld.)
(Amount in ` Billion)
Maturity-wiseliabilities/assets
New Private SectorBanks
Private SectorBanks Foreign Banks All Scheduled
Commercial Banks
2012 2013 2012 2013 2012 2013 2012 2013
(9) (10) (11) (12) (13) (14) (15) (16)
Investments (at book value) 4166.49 4934.07 5260.06 6279.60 2008.85 2276.00 22393.45 26193.81
a) 1 - 14 days 737.17 855.35 804.15 993.14 927.97 978.34 2460.00 2807.09
b) 15 - 28 days 184.11 177.73 206.04 207.98 46.72 133.08 412.52 510.69
c) 29 days to 3 months 308.11 372.60 431.00 516.63 219.11 214.52 1618.75 1768.37
d) Over 3 months to 6 months 270.25 290.03 316.92 373.75 85.49 137.95 853.18 1165.08
e) Over 6 months to 1 year 411.01 411.83 483.96 533.43 261.32 310.19 1474.34 1547.41
f) Over 1 year to 3 years 774.86 925.32 908.68 1144.80 259.91 250.50 3071.89 3732.50
g) Over 3 years to 5 years 338.46 470.65 480.89 620.31 103.62 80.65 2732.20 3359.80
h) Over 5 years 1142.52 1430.56 1628.42 1889.55 104.71 170.77 9770.58 11302.88
Foreign Currency Assets 1525.37 1835.02 1749.75 2032.71 1121.79 1031.03 9317.71 11208.88
a) 1 - 14 days 213.02 280.02 250.69 308.18 274.74 276.21 1672.90 2286.62
b) 15 - 28 days 41.21 90.00 46.92 105.42 82.53 104.88 412.10 646.00
c) 29 days to 3 months 147.26 235.79 217.40 320.38 291.40 238.47 1943.77 2365.14
d) Over 3 months to 6 months 145.81 178.85 213.94 225.96 236.01 214.11 1638.70 1862.07
e) Over 6 months to 1 year 124.47 109.77 162.31 128.90 82.96 62.84 852.41 864.38
f) Over 1 year to 3 years 264.20 306.80 268.35 308.61 67.07 60.29 999.39 1173.57
g) Over 3 years to 5 years 220.88 285.48 221.26 286.15 36.21 44.39 865.32 977.53
h) Over 5 years 368.50 348.32 368.88 349.11 50.87 29.84 933.13 1033.58
Foreign Currency Liabilities 1668.71 1976.25 1899.47 2219.21 1453.85 1289.22 9586.44 11208.28
a) 1 - 14 days 120.03 146.19 145.27 166.28 295.36 285.67 1532.64 1756.29
b) 15 - 28 days 60.58 56.64 62.53 72.32 57.84 70.64 467.32 725.06
c) 29 days to 3 months 216.77 220.99 288.27 322.71 245.84 290.47 2024.41 2339.73
d) Over 3 months to 6 months 219.22 297.89 292.93 354.21 191.84 100.89 1618.05 1756.00
e) Over 6 months to 1 year 328.11 367.39 373.47 403.82 245.29 221.86 1444.87 1738.17
f) Over 1 year to 3 years 274.49 335.11 280.28 340.50 240.20 211.03 1072.39 1371.91
g) Over 3 years to 5 years 207.90 301.11 209.69 303.41 89.37 59.81 875.56 958.26
h) Over 5 years 241.61 250.94 247.03 255.94 88.12 48.85 551.19 562.86
Source : Annual accounts of banks.
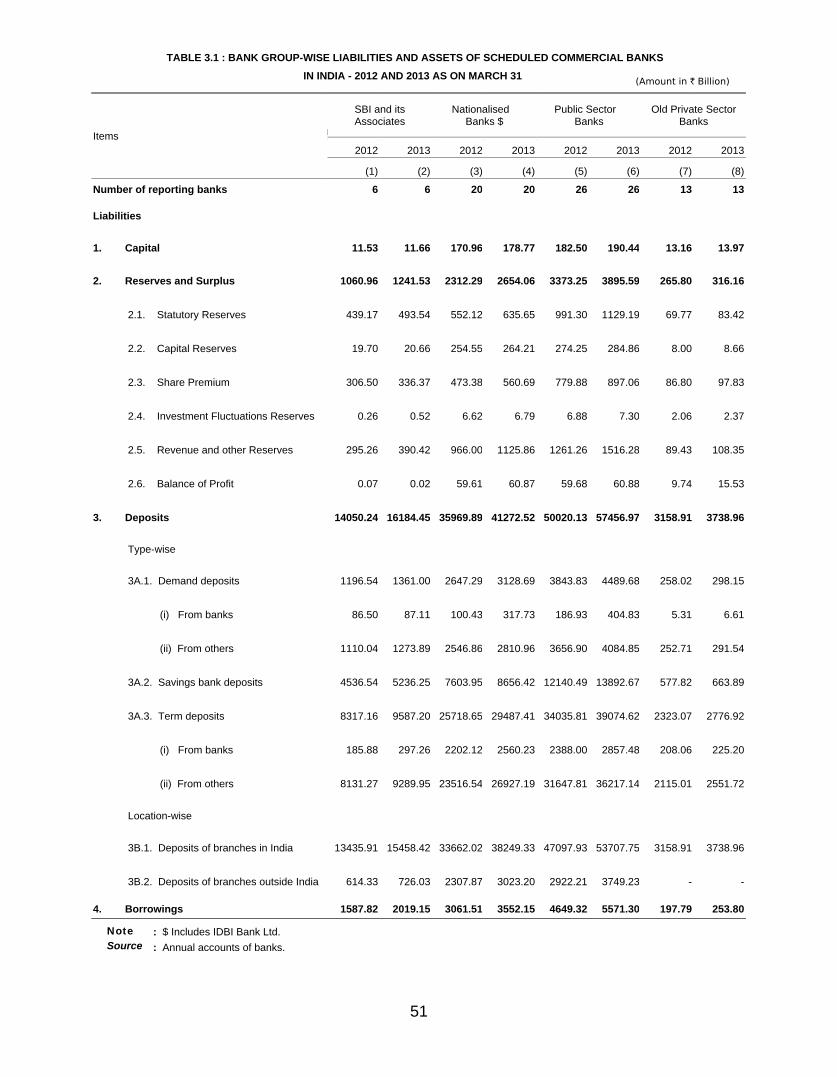
51
TABLE 3.1 : BANK GROUP-WISE LIABILITIES AND ASSETS OF SCHEDULED COMMERCIAL BANKS
IN INDIA - 2012 AND 2013 AS ON MARCH 31 (Amount in ` Billion)
Report TitleItems
SBI and itsAssociates
Nationalised Banks $
Public Sector Banks
Old Private SectorBanks
2012 2013 2012 2013 2012 2013 2012 2013
(1) (2) (3) (4) (5) (6) (7) (8)
Number of reporting banks 6 6 20 20 26 26 13 13
Liabilities
1. Capital 11.53 11.66 170.96 178.77 182.50 190.44 13.16 13.97
2. Reserves and Surplus 1060.96 1241.53 2312.29 2654.06 3373.25 3895.59 265.80 316.16
2.1. Statutory Reserves 439.17 493.54 552.12 635.65 991.30 1129.19 69.77 83.42
2.2. Capital Reserves 19.70 20.66 254.55 264.21 274.25 284.86 8.00 8.66
2.3. Share Premium 306.50 336.37 473.38 560.69 779.88 897.06 86.80 97.83
2.4. Investment Fluctuations Reserves 0.26 0.52 6.62 6.79 6.88 7.30 2.06 2.37
2.5. Revenue and other Reserves 295.26 390.42 966.00 1125.86 1261.26 1516.28 89.43 108.35
2.6. Balance of Profit 0.07 0.02 59.61 60.87 59.68 60.88 9.74 15.53
3. Deposits 14050.24 16184.45 35969.89 41272.52 50020.13 57456.97 3158.91 3738.96
Type-wise
3A.1. Demand deposits 1196.54 1361.00 2647.29 3128.69 3843.83 4489.68 258.02 298.15
(i) From banks 86.50 87.11 100.43 317.73 186.93 404.83 5.31 6.61
(ii) From others 1110.04 1273.89 2546.86 2810.96 3656.90 4084.85 252.71 291.54
3A.2. Savings bank deposits 4536.54 5236.25 7603.95 8656.42 12140.49 13892.67 577.82 663.89
3A.3. Term deposits 8317.16 9587.20 25718.65 29487.41 34035.81 39074.62 2323.07 2776.92
(i) From banks 185.88 297.26 2202.12 2560.23 2388.00 2857.48 208.06 225.20
(ii) From others 8131.27 9289.95 23516.54 26927.19 31647.81 36217.14 2115.01 2551.72
Location-wise
3B.1. Deposits of branches in India 13435.91 15458.42 33662.02 38249.33 47097.93 53707.75 3158.91 3738.96
3B.2. Deposits of branches outside India 614.33 726.03 2307.87 3023.20 2922.21 3749.23 - -
4. Borrowings 1587.82 2019.15 3061.51 3552.15 4649.32 5571.30 197.79 253.80
Source : Annual accounts of banks.Note : $ Includes IDBI Bank Ltd.

52
TABLE 3.1 : BANK GROUP-WISE LIABILITIES AND ASSETS OF SCHEDULED COMMERCIAL BANKS
IN INDIA - 2012 AND 2013 AS ON MARCH 31 (Amount in ` Billion)(Contd.)
Items
SBI and itsAssociates
Nationalised Banks $
Public Sector Banks
Old Private SectorBanks
2012 2013 2012 2013 2012 2013 2012 2013
(1) (2) (3) (4) (5) (6) (7) (8)
4.1. Borrowings in India 720.45 891.88 2043.48 2140.99 2763.93 3032.87 140.40 179.35
(i) From Reserve Bank of India 6.60 158.70 351.49 353.05 358.09 511.76 22.51 25.65
(ii) From other banks 93.72 81.48 53.04 99.40 146.76 180.89 9.75 7.67
(iii) From other institutions and agencies 620.13 651.70 1638.95 1688.53 2259.08 2340.22 108.14 146.03
4.2. Borrowings outside India 867.37 1127.27 1018.03 1411.17 1885.39 2538.44 57.40 74.45
Secured borrowings included in 4 58.93 101.05 324.96 252.74 383.89 353.79 12.47 38.31
5. Other liabilities and provisions 1002.25 1200.40 1168.74 1304.98 2170.99 2505.38 113.53 124.44
5.1. Bills payable 250.34 243.53 144.44 147.73 394.78 391.26 17.19 19.12
5.2. Inter-office adjustment - 163.84 12.24 29.73 12.24 193.57 2.99 2.63
5.3. Interest accrued 149.76 179.00 165.98 173.89 315.75 352.89 16.58 14.59
5.4. Subordinate debt. - - - - - - - -
5.5. Deferred tax liabilities 3.25 7.18 21.52 11.19 24.77 18.38 2.89 1.35
5.6. Others (including provisions) 598.90 606.84 824.57 942.43 1423.47 1549.28 73.87 86.74
Total Liabilities 17712.80 20657.19 42683.40 48962.49 60396.20 69619.67 3749.20 4447.33
6. Cash and balances with RBI 790.88 893.18 2009.33 1900.54 2800.21 2793.72 167.41 167.02
6.1. Cash in hand 129.71 133.14 148.18 172.89 277.88 306.03 23.89 29.27
6.2. Balances with RBI 661.17 760.05 1861.15 1727.65 2522.33 2487.70 143.52 137.75
(i) In current account 661.15 760.05 1857.57 1674.06 2518.72 2434.11 143.52 137.75
(ii) In other account 0.03 - 3.58 53.59 3.61 53.59 - -
7. Balances with banks in India and money at call and short notice 482.30 519.74 1277.62 1909.23 1759.93 2428.97 70.52 107.58
7.1. In India 154.81 133.71 442.33 703.15 597.14 836.86 61.24 95.82
7.1.1. Balances with banks 57.51 45.40 238.33 284.64 295.85 330.04 36.06 67.40
(i) In current account 9.66 8.78 57.69 64.86 67.35 73.64 7.74 11.37
(ii) In other deposit accounts 47.86 36.63 180.64 219.78 228.50 256.40 28.32 56.03
7.1.2. Money at call and short notice 97.29 88.31 204.00 418.51 301.29 506.82 25.18 28.42
(i) with banks 74.23 81.23 156.53 269.62 230.76 350.85 5.45 20.75
(ii) with other institutions 23.07 7.08 47.47 148.89 70.53 155.97 19.73 7.67
7.2. Outside India 327.50 386.02 835.29 1206.09 1162.79 1592.11 9.27 11.76
7.2.1. Balances with banks 243.62 306.09 602.71 937.38 846.33 1243.47 5.09 8.39
(i) In current account 239.40 262.74 178.46 241.29 417.86 504.03 3.31 4.59
(ii) In other deposit accounts 4.22 43.35 424.25 696.09 428.47 739.44 1.78 3.80
7.2.2. Money at call and short notice 83.88 79.93 232.59 268.71 316.46 348.64 4.19 3.38
8. Investments 4173.22 4729.98 10899.48 12861.08 15072.70 17591.06 1093.33 1344.99
Source : Annual accounts of banks.Note : $ Includes IDBI Bank Ltd.

53
TABLE 3.1 : BANK GROUP-WISE LIABILITIES AND ASSETS OF SCHEDULED COMMERCIAL BANKS
IN INDIA - 2012 AND 2013 AS ON MARCH 31 (Amount in ` Billion)(Contd.)
Items
SBI and itsAssociates
Nationalised Banks $
Public Sector Banks
Old Private SectorBanks
2012 2013 2012 2013 2012 2013 2012 2013
(1) (2) (3) (4) (5) (6) (7) (8)
8.1. Investment in India in 4061.45 4623.25 10757.40 12703.39 14818.85 17326.65 1093.33 1344.99
(i) Government securities 3494.45 3765.50 9031.11 10449.90 12525.56 14215.40 785.48 972.09
(ii) Other approved securities 0.20 0.05 9.69 7.25 9.89 7.30 0.18 0.07
(iii) Shares 41.14 46.96 158.36 174.03 199.51 220.98 10.78 10.88
(iv) Debentures and Bonds 143.66 305.28 512.95 634.63 656.61 939.91 56.66 68.99
(v) Subsidiaries and/or joint ventures 54.92 55.28 41.04 42.39 95.96 97.67 3.98 4.00
(vi) Others 327.08 450.18 1004.25 1395.20 1331.32 1845.38 236.26 288.96
8.2. Investment outside India in 111.77 106.73 142.08 157.68 253.85 264.41 - -
(i) Government securities 18.66 28.60 66.70 71.76 85.36 100.37 - -
(ii) Subsidiaries and/or joint ventures 16.03 16.03 20.53 27.01 36.56 43.04 - -
(iii) Others 77.08 62.10 54.85 58.91 131.93 121.00 - -
9. Advances 11519.91 13792.24 27253.16 30935.50 38773.07 44727.74 2300.79 2699.37
Type-wise
9A. (i) Bills purchased and discounted 888.15 1006.84 1418.09 1778.61 2306.24 2785.46 113.27 108.69
(ii) Cash credits,overdrafts & loans repayable on demand 4957.87 6117.87 11123.65 12677.78 16081.52 18795.65 1120.10 1409.65
(iii) Term loans 5673.89 6667.53 14711.43 16479.10 20385.32 23146.63 1067.43 1181.04
Security-wise
9B. (i) Secured by tangible assets 8705.30 10632.06 20598.83 24524.95 29304.12 35157.01 1956.52 2367.97
(ii) Covered by Bank/Government Guarantees 833.32 1004.11 1895.90 2569.25 2729.21 3573.37 87.27 88.59
(iii) Unsecured 1981.30 2156.07 4758.44 3841.30 6739.74 5997.36 257.00 242.81
Sector-wise & Location-wise
9C.I. Advances in India 10179.14 12118.16 24701.78 27613.39 34880.91 39731.55 2300.79 2699.37
(i) Priority sectors 3457.80 3759.63 7717.70 8762.73 11175.50 12522.36 727.96 858.58
(ii) Public sectors 720.40 736.37 3009.77 3257.67 3730.16 3994.04 79.70 83.50
(iii) Banks 1.81 3.12 184.30 183.44 186.11 186.56 5.79 1.76
(iv) Others 5999.13 7619.05 13790.01 15409.55 19789.13 23028.60 1487.34 1755.53
Source : Annual accounts of banks.Note : $ Includes IDBI Bank Ltd.

54
TABLE 3.1 : BANK GROUP-WISE LIABILITIES AND ASSETS OF SCHEDULED COMMERCIAL BANKS
IN INDIA - 2012 AND 2013 AS ON MARCH 31 (Amount in ` Billion)(Contd.)
Items
SBI and itsAssociates
Nationalised Banks $
Public Sector Banks
Old Private SectorBanks
2012 2013 2012 2013 2012 2013 2012 2013
(1) (2) (3) (4) (5) (6) (7) (8)
9C.II. Advances outside India 1340.78 1674.08 2551.38 3322.11 3892.16 4996.19 - -
(i) Due from banks 170.86 329.15 576.70 784.20 747.56 1113.35 - -
(ii) Due from others 1169.91 1344.92 1974.68 2537.91 3144.60 3882.84 - -
a) Bills purchased and discounted 215.68 212.17 517.86 709.79 733.54 921.95 - -
b) Syndicate loans 474.00 562.59 493.01 619.38 967.01 1181.97 - -
c) Others 480.23 570.17 963.81 1208.74 1444.04 1778.91 - -
10. Fixed Assets 74.16 91.61 308.84 334.39 383.00 426.00 26.82 30.82
10.1. Premises 22.66 28.83 241.31 253.62 263.97 282.45 15.27 16.07
10.2. Fixed assets under construction 3.47 4.52 1.86 2.68 5.33 7.20 0.40 0.60
10.3. Other fixed assets 48.03 58.25 65.66 78.09 113.69 136.34 11.16 14.16
11. Other Assets 672.32 630.44 934.96 1021.74 1607.28 1652.19 90.33 97.55
(i) Inter - office adjustments (net) 31.44 13.33 27.82 21.52 59.26 34.85 1.02 0.88
(ii) Interest accrued 145.24 159.30 274.34 301.80 419.58 461.10 24.30 26.57
(iii) Tax paid in advance/tax deducted at source 97.25 70.30 245.92 286.15 343.17 356.45 23.25 24.40
(iv) Stationery and stamps 1.23 1.22 1.25 1.27 2.48 2.49 0.22 0.28
(v) Others 397.16 386.29 385.64 411.00 782.80 797.30 41.54 45.41
Total Assets 17712.80 20657.19 42683.40 48962.49 60396.20 69619.67 3749.20 4447.33
Source : Annual accounts of banks.Note : $ Includes IDBI Bank Ltd.

55
TABLE 3.1 : BANK GROUP-WISE LIABILITIES AND ASSETS OF SCHEDULED COMMERCIAL BANKS
IN INDIA - 2012 AND 2013 AS ON MARCH 31 (Amount in ` Billion)(Contd.)
Report TitleItems
New Private SectorBanks
Private Sector Banks
Foreign Banks
All ScheduledCommercial Banks
2012 2013 2012 2013 2012 2013 2012 2013
(1) (2) (3) (4) (5) (6) (7) (8)
Number of reporting banks 7 7 20 20 41 43 87 89
Liabilities
1. Capital 34.67 36.02 47.83 49.99 406.31 462.68 636.64 703.10
2. Reserves and Surplus 1279.32 1563.31 1545.12 1879.47 530.60 611.14 5448.98 6386.20
2.1. Statutory Reserves 204.55 264.70 274.32 348.12 155.96 185.84 1421.58 1663.16
2.2. Capital Reserves 34.08 39.75 42.08 48.41 26.53 27.45 342.86 360.72
2.3. Share Premium 625.64 715.86 712.44 813.69 - - 1492.32 1710.75
2.4. Investment Fluctuations Reserves 0.38 1.30 2.44 3.67 5.63 9.87 14.95 20.84
2.5. Revenue and other Reserves 139.98 162.11 229.42 270.46 263.19 296.42 1753.87 2083.15
2.6. Balance of Profit 274.69 379.60 284.43 395.13 79.30 91.57 423.41 547.58
3. Deposits 8586.96 10219.39 11745.87 13958.36 2769.48 2880.00 64535.49 74295.32
Type-wise
3A.1. Demand deposits 1400.84 1616.07 1658.86 1914.22 800.83 738.11 6303.53 7142.01
(i) From banks 56.33 72.38 61.64 78.99 26.90 19.85 275.47 503.67
(ii) From others 1344.51 1543.69 1597.22 1835.23 773.93 718.25 6028.06 6638.33
3A.2. Savings bank deposits 2151.56 2593.36 2729.38 3257.25 418.69 430.70 15288.57 17580.62
3A.3. Term deposits 5034.56 6009.97 7357.63 8786.89 1549.95 1711.19 42943.39 49572.70
(i) From banks 291.58 353.47 499.63 578.67 64.13 65.39 2951.76 3501.55
(ii) From others 4742.99 5656.49 6858.00 8208.21 1485.82 1645.81 39991.63 46071.15
Location-wise
3B.1. Deposits of branches in India 8339.77 9888.21 11498.69 13627.17 2769.48 2879.78 61366.09 70214.70
3B.2. Deposits of branches outside India 247.19 331.18 247.19 331.18 - 0.22 3169.39 4080.63
Source : Annual accounts of banks.

56
TABLE 3.1 : BANK GROUP-WISE LIABILITIES AND ASSETS OF SCHEDULED COMMERCIAL BANKS
IN INDIA - 2012 AND 2013 AS ON MARCH 31 (Amount in ` Billion)(Contd.)
Items
New Private SectorBanks
Private Sector Banks
Foreign Banks
All ScheduledCommercial Banks
2012 2013 2012 2013 2012 2013 2012 2013
(1) (2) (3) (4) (5) (6) (7) (8)
4. Borrowings 2386.41 2746.17 2584.20 2999.98 1204.22 1534.04 8437.74 10105.32
4.1. Borrowings in India 1131.69 1354.08 1272.09 1533.43 625.64 868.72 4661.65 5435.01
(i) From Reserve Bank of India 251.69 296.03 274.20 321.68 349.04 474.68 981.33 1308.11
(ii) From other banks 105.75 142.29 115.50 149.95 153.42 161.93 415.68 492.77
(iii) From other institutions and agencies 774.24 915.76 882.39 1061.79 123.17 232.12 3264.64 3634.13
4.2. Borrowings outside India 1254.72 1392.10 1312.11 1466.55 578.59 665.32 3776.09 4670.31
Secured borrowings included in 4 34.26 62.71 46.73 101.02 454.69 676.08 885.31 1130.88
5. Other liabilities and provisions 894.36 885.81 1007.89 1010.24 971.66 727.77 4150.55 4243.39
5.1. Bills payable 133.76 142.08 150.95 161.20 36.62 30.78 582.36 583.23
5.2. Inter-office adjustment 3.25 1.58 6.25 4.21 0.20 0.05 18.68 197.83
5.3. Interest accrued 104.00 118.41 120.58 133.00 28.41 28.41 464.74 514.30
5.4. Subordinate debt. - - - - - - - -
5.5. Deferred tax liabilities - - 2.89 1.35 0.02 0.04 27.67 19.77
5.6. Others (including provisions) 653.34 623.74 727.21 710.48 905.93 668.49 3056.61 2928.25
Total Liabilities 13181.71 15450.70 16930.91 19898.04 5882.28 6215.63 83209.39 95733.34
6. Cash and balances with RBI 538.15 576.47 705.56 743.50 231.69 214.52 3737.46 3751.74
6.1. Cash in hand 134.05 147.20 157.94 176.47 6.76 6.58 442.58 489.08
6.2. Balances with RBI 404.11 429.27 547.62 567.02 224.92 207.94 3294.87 3262.66
(i) In current account 402.11 427.27 545.62 565.02 191.86 188.62 3256.20 3187.75
(ii) In other account 2.00 2.00 2.00 2.00 33.07 19.31 38.67 74.91
7. Balances with banks in India and money at call and short notice 295.02 469.72 365.54 577.30 311.30 344.60 2436.76 3350.87
7.1. In India 119.76 214.04 181.00 309.86 156.91 163.06 935.05 1309.78
7.1.1. Balances with banks 82.16 126.76 118.22 194.16 116.18 142.92 530.25 667.11
(i) In current account 12.18 15.66 19.93 27.02 15.01 12.46 102.29 113.13
(ii) In other deposit accounts 69.97 111.10 98.29 167.13 101.16 130.45 427.96 553.99
7.1.2. Money at call and short notice 37.60 87.28 62.78 115.70 40.73 20.14 404.80 642.66
(i) with banks 7.79 76.26 13.24 97.01 16.72 16.37 260.72 464.24
(ii) with other institutions 29.81 11.02 49.54 18.69 24.01 3.76 144.08 178.42
7.2. Outside India 175.26 255.68 184.54 267.44 154.39 181.55 1501.71 2041.10
7.2.1. Balances with banks 82.94 159.04 88.03 167.43 123.19 160.09 1057.54 1570.99
(i) In current account 35.38 43.69 38.69 48.27 58.27 49.79 514.82 602.10
(ii) In other deposit accounts 47.56 115.35 49.34 119.15 64.92 110.30 542.72 968.89
7.2.2. Money at call and short notice 92.32 96.64 96.51 100.02 31.20 21.46 444.17 470.11
Source : Annual accounts of banks.

57
TABLE 3.1 : BANK GROUP-WISE LIABILITIES AND ASSETS OF SCHEDULED COMMERCIAL BANKS
IN INDIA - 2012 AND 2013 AS ON MARCH 31 (Amount in ` Billion)(Contd.)
Items
New Private SectorBanks
Private Sector Banks
Foreign Banks
All ScheduledCommercial Banks
2012 2013 2012 2013 2012 2013 2012 2013
(1) (2) (3) (4) (5) (6) (7) (8)
8. Investments 4166.49 4916.07 5259.82 6261.06 2006.51 2280.63 22339.03 26132.75
8.1. Investment in India in 4077.68 4824.38 5171.02 6169.37 2006.51 2280.63 21996.38 25776.65
(i) Government securities 2682.72 3111.71 3468.19 4083.80 1376.59 1671.88 17370.34 19971.08
(ii) Other approved securities 0.01 0.00 0.19 0.07 0.00 3.00 10.08 10.37
(iii) Shares 32.25 35.73 43.03 46.61 1.31 1.56 243.84 269.15
(iv) Debentures and Bonds 529.75 606.15 586.40 675.14 54.34 100.67 1297.35 1715.72
(v) Subsidiaries and/or joint ventures 79.14 81.10 83.12 85.10 - - 179.08 182.77
(vi) Others 753.83 989.68 990.08 1278.64 574.28 503.52 2895.69 3627.55
8.2. Investment outside India in 88.81 91.69 88.81 91.69 - - 342.65 356.10
(i) Government securities 5.57 9.26 5.57 9.26 - - 90.93 109.63
(ii) Subsidiaries and/or joint ventures 67.00 62.61 67.00 62.61 - - 103.56 105.65
(iii) Others 16.23 19.82 16.23 19.82 - - 148.16 140.82
9. Advances 7363.23 8733.11 9664.03 11432.49 2298.49 2636.80 50735.59 58797.03
Type-wise
9A. (i) Bills purchased and discounted 243.93 276.50 357.21 385.18 257.47 332.66 2920.91 3503.30
(ii) Cash credits,overdrafts & loans repayable on demand 1756.72 2295.60 2876.82 3705.25 1110.79 1274.18 20069.13 23775.08
(iii) Term loans 5362.58 6161.02 6430.00 7342.05 930.22 1029.95 27745.54 31518.64
Security-wise
9B. (i) Secured by tangible assets 5922.16 7032.74 7878.69 9400.72 959.97 1062.50 38142.78 45620.23
(ii) Covered by Bank/Government Guarantees 144.33 116.11 231.60 204.69 167.15 185.37 3127.96 3963.43
(iii) Unsecured 1296.74 1584.26 1553.74 1827.07 1163.24 1380.78 9456.72 9205.22
Sector-wise & Location-wise
9C.I. Advances in India 6356.97 7602.26 8657.76 10301.63 2298.49 2635.16 45837.16 52668.35
(i) Priority sectors 2081.96 2260.19 2809.92 3118.77 725.08 769.88 14710.50 16411.01
(ii) Public sectors 121.84 145.74 201.54 229.25 19.10 29.85 3950.81 4253.14
(iii) Banks 8.84 2.57 14.63 4.33 14.68 60.84 215.42 251.72
(iv) Others 4144.33 5193.75 5631.67 6949.28 1539.63 1774.59 26960.43 31752.48
Source : Annual accounts of banks.

58
TABLE 3.1 : BANK GROUP-WISE LIABILITIES AND ASSETS OF SCHEDULED COMMERCIAL BANKS
IN INDIA - 2012 AND 2013 AS ON MARCH 31 (Amount in ` Billion)(Concld.)
Items
New Private SectorBanks
Private Sector Banks
Foreign Banks
All ScheduledCommercial Banks
2012 2013 2012 2013 2012 2013 2012 2013
(1) (2) (3) (4) (5) (6) (7) (8)
9C.II. Advances outside India 1006.27 1130.86 1006.27 1130.86 - 1.64 4898.43 6128.68
(i) Due from banks 41.83 46.95 41.83 46.95 - 1.64 789.39 1161.94
(ii) Due from others 964.44 1083.91 964.44 1083.91 - - 4109.04 4966.74
a) Bills purchased and discounted 11.57 20.53 11.57 20.53 - - 745.12 942.49
b) Syndicate loans 768.35 803.98 768.35 803.98 - - 1735.36 1985.95
c) Others 184.51 259.40 184.51 259.40 - - 1628.56 2038.31
10. Fixed Assets 106.90 113.95 133.72 144.77 50.18 60.41 566.90 631.18
10.1. Premises 54.64 55.93 69.91 72.00 38.84 39.56 372.72 394.02
10.2. Fixed assets under construction 1.80 1.55 2.20 2.15 1.31 10.58 8.84 19.93
10.3. Other fixed assets 50.45 56.47 61.61 70.63 10.03 10.27 185.33 217.23
11. Other Assets 711.92 641.37 802.25 738.92 983.62 678.67 3393.16 3069.77
(i) Inter - office adjustments (net) - - 1.02 0.88 2.37 1.56 62.65 37.30
(ii) Interest accrued 117.75 138.86 142.05 165.43 32.85 38.95 594.47 665.49
(iii) Tax paid in advance/tax deducted at source 49.95 55.03 73.20 79.43 35.69 36.72 452.06 472.60
(iv) Stationery and stamps 0.25 0.24 0.47 0.53 0.01 0.01 2.95 3.02
(v) Others 543.97 447.25 585.51 492.65 912.77 601.43 2281.08 1891.37
Total Assets 13181.71 15450.70 16930.91 19898.04 5881.79 6215.63 83208.90 95733.34
Source : Annual accounts of banks.
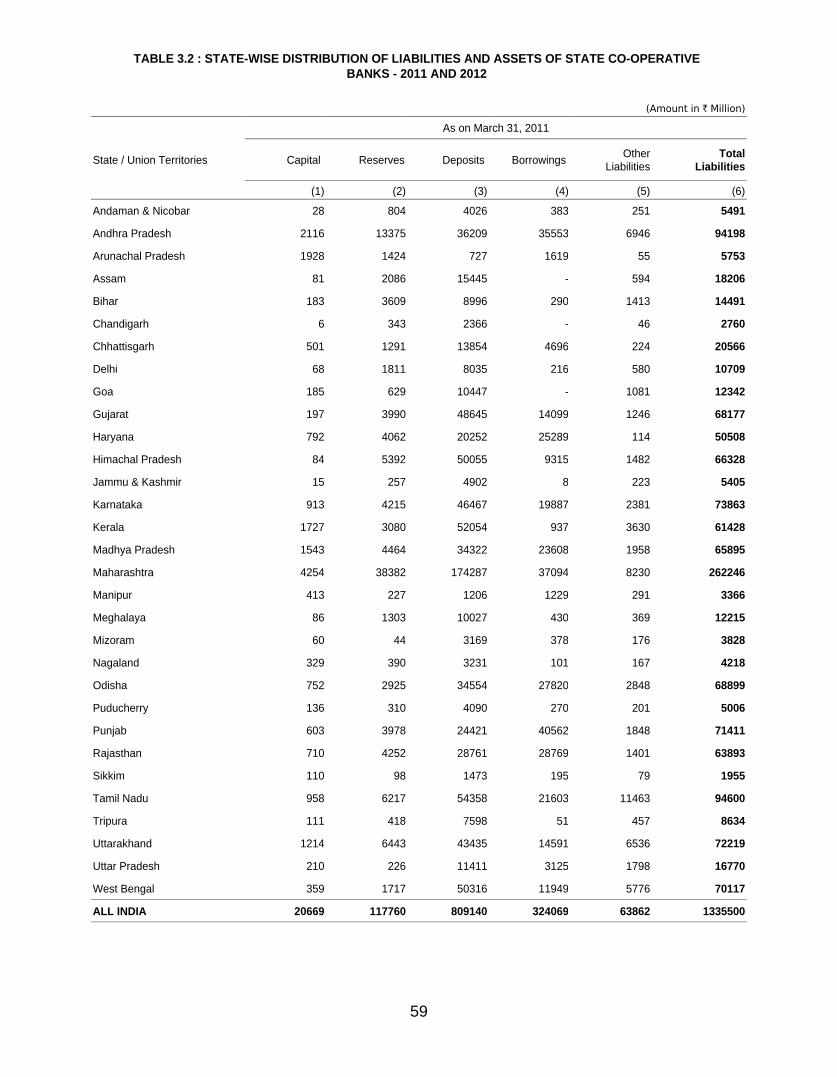
59
TABLE 3.2 : STATE-WISE DISTRIBUTION OF LIABILITIES AND ASSETS OF STATE CO-OPERATIVEBANKS - 2011 AND 2012
(Amount in ` Million)
As on March 31, 2011
State / Union Territories Capital Reserves Deposits Borrowings OtherLiabilities
TotalLiabilities
(1) (2) (3) (4) (5) (6)
Andaman & Nicobar 28 804 4026 383 251 5491
Andhra Pradesh 2116 13375 36209 35553 6946 94198
Arunachal Pradesh 1928 1424 727 1619 55 5753
Assam 81 2086 15445 - 594 18206
Bihar 183 3609 8996 290 1413 14491
Chandigarh 6 343 2366 - 46 2760
Chhattisgarh 501 1291 13854 4696 224 20566
Delhi 68 1811 8035 216 580 10709
Goa 185 629 10447 - 1081 12342
Gujarat 197 3990 48645 14099 1246 68177
Haryana 792 4062 20252 25289 114 50508
Himachal Pradesh 84 5392 50055 9315 1482 66328
Jammu & Kashmir 15 257 4902 8 223 5405
Karnataka 913 4215 46467 19887 2381 73863
Kerala 1727 3080 52054 937 3630 61428
Madhya Pradesh 1543 4464 34322 23608 1958 65895
Maharashtra 4254 38382 174287 37094 8230 262246
Manipur 413 227 1206 1229 291 3366
Meghalaya 86 1303 10027 430 369 12215
Mizoram 60 44 3169 378 176 3828
Nagaland 329 390 3231 101 167 4218
Odisha 752 2925 34554 27820 2848 68899
Puducherry 136 310 4090 270 201 5006
Punjab 603 3978 24421 40562 1848 71411
Rajasthan 710 4252 28761 28769 1401 63893
Sikkim 110 98 1473 195 79 1955
Tamil Nadu 958 6217 54358 21603 11463 94600
Tripura 111 418 7598 51 457 8634
Uttarakhand 1214 6443 43435 14591 6536 72219
Uttar Pradesh 210 226 11411 3125 1798 16770
West Bengal 359 1717 50316 11949 5776 70117
ALL INDIA 20669 117760 809140 324069 63862 1335500

60
TABLE 3.2 : STATE-WISE DISTRIBUTION OF LIABILITIES AND ASSETS OF STATE CO-OPERATIVEBANKS - 2011 AND 2012 (Contd.)
(Amount in ` Million)
As on March 31, 2011
State / Union TerritoriesCash in handand balances
with banksInvestments Loans &
AdvancesOther
AssetsAccumulated
LossesTotal
Assets
(7) (8) (9) (10) (11) (12)
Andaman & Nicobar 480 2991 1730 290 - 5491
Andhra Pradesh 21127 13202 56596 3274 - 94198
Arunachal Pradesh 162 2708 1067 473 1345 5753
Assam 931 11449 3134 2273 418 18206
Bihar 910 6113 6283 1186 - 14491
Chandigarh 83 1995 641 42 - 2760
Chhattisgarh 626 11879 7533 528 - 20566
Delhi 4389 2041 3611 668 - 10709
Goa 863 4947 5880 653 - 12342
Gujarat 2760 38443 25315 1659 - 68177
Haryana 1592 10750 37389 777 - 50508
Himachal Pradesh 429 39049 22104 4746 - 66328
Jammu & Kashmir 227 3798 1006 374 - 5405
Karnataka 4496 27473 40628 1265 - 73863
Kerala 5184 22255 27069 4030 2891 61428
Madhya Pradesh 3494 27656 32715 2031 - 65895
Maharashtra 13505 119876 109890 16457 2519 262246
Manipur 404 1067 1548 137 212 3366
Meghalaya 389 7280 3422 1125 - 12215
Mizoram 741 1024 1896 167 - 3828
Nagaland 131 2422 823 401 441 4218
Odisha 2220 33300 31320 2059 - 68899
Puducherry 345 1177 3211 232 40 5006
Punjab 1475 14663 53248 2026 - 71411
Rajasthan 2174 26194 33528 1997 - 63893
Sikkim 600 587 725 43 - 1955
Tamil Nadu 4363 20600 67988 1649 - 94600
Tripura 719 5378 1807 474 258 8634
Uttarakhand 2681 26293 39989 3257 - 72219
Uttar Pradesh 393 9513 4727 2135 - 16770
West Bengal 5236 28562 33030 3289 - 70117
ALL INDIA 83129 524681 659851 59716 8123 1335500

61
TABLE 3.2 : STATE-WISE DISTRIBUTION OF LIABILITIES AND ASSETS OF STATE CO-OPERATIVEBANKS - 2011 AND 2012 (Contd.)
(Amount in ` Million)
As on March 31, 2012
State / Union Territories Capital Reserves Deposits Borrowings OtherLiabilities
TotalLiabilities
(13) (14) (15) (16) (17) (18)
Andaman & Nicobar 29 874 4560 459 258 6182
Andhra Pradesh 2466 14091 39119 50863 7561 114100
Arunachal Pradesh 1923 1290 957 1490 70 5729
Assam 88 157 15595 70 2623 18533
Bihar 183 3609 8996 290 1413 14491
Chandigarh 6 362 2544 - 17 2929
Chhattisgarh 770 1404 14836 7022 1151 25184
Delhi 71 2039 7935 215 573 10833
Goa 206 886 11603 - 1182 13877
Gujarat 206 3903 48616 24233 2363 79322
Haryana 792 4062 20252 25289 114 50508
Himachal Pradesh 84 6157 52422 7493 1082 67238
Jammu & Kashmir 15 257 4902 8 223 5405
Karnataka 1133 4700 52635 28343 2240 89051
Kerala 3887 4115 59042 13843 3659 84546
Madhya Pradesh 2120 5012 38788 33468 2061 81449
Maharashtra 4446 37525 158624 39657 8257 248509
Manipur 413 227 1206 1229 291 3366
Meghalaya 58 1516 11836 443 742 14594
Mizoram 60 44 3169 378 176 3828
Nagaland 72 283 3668 103 628 4754
Odisha 1707 3164 39543 34032 2935 81380
Puducherry 146 380 5326 192 286 6329
Punjab 677 4176 25934 48227 1938 80952
Rajasthan 842 4608 35800 36106 1416 78773
Sikkim 113 122 1360 209 114 1918
Tamil Nadu 1067 6088 65258 23279 12586 108279
Tripura 111 418 7598 51 457 8634
Uttarakhand 1439 6255 46307 18035 8286 80322
Uttar Pradesh 339 277 12312 5113 659 18700
West Bengal 403 1608 48130 16493 6649 73283
ALL INDIA 25873 119608 848874 416632 72012 1482998

62
TABLE 3.2 : STATE-WISE DISTRIBUTION OF LIABILITIES AND ASSETS OF STATE CO-OPERATIVEBANKS - 2011 AND 2012 (Concld.)
(Amount in ` Million)
As on March 31, 2012
State / Union TerritoriesCash in handand balances
with banksInvestments Loans &
AdvancesOther
AssetsAccumulated
LossesTotal
Assets
(19) (20) (21) (22) (23) (24)
Andaman & Nicobar 462 3158 2228 333 - 6182
Andhra Pradesh 24925 13765 70781 4628 - 114100
Arunachal Pradesh 196 2727 997 467 1342 5729
Assam 825 10196 5048 2306 159 18533
Bihar 910 6113 6283 1186 - 14491
Chandigarh 89 2175 620 44 - 2929
Chhattisgarh 602 12511 11555 515 - 25184
Delhi 4413 2146 3625 649 - 10833
Goa 1093 5273 6244 1268 - 13877
Gujarat 3687 36323 36241 3071 - 79322
Haryana 1592 10750 37389 777 - 50508
Himachal Pradesh 1970 39309 23617 2342 - 67238
Jammu & Kashmir 227 3798 1006 374 - 5405
Karnataka 4780 29082 53815 1374 - 89051
Kerala 3256 41617 30767 5004 3902 84546
Madhya Pradesh 3298 30812 45291 2049 - 81449
Maharashtra 9930 120403 102853 14559 765 248509
Manipur 404 1067 1548 137 212 3366
Meghalaya 431 8885 4222 1056 - 14594
Mizoram 741 1024 1896 167 - 3828
Nagaland 1546 997 1321 458 432 4754
Odisha 2673 38894 37928 1885 - 81380
Puducherry 341 1713 3873 296 106 6329
Punjab 1087 14876 62957 2032 - 80952
Rajasthan 1412 34906 40359 2096 - 78773
Sikkim 495 428 926 68 - 1918
Tamil Nadu 9551 21410 75388 1930 - 108279
Tripura 719 5378 1807 474 258 8634
Uttarakhand 2321 24836 49795 3370 - 80322
Uttar Pradesh 509 10801 6431 959 - 18700
West Bengal 10005 30171 28807 3749 552 73283
ALL INDIA 94489 565544 755617 59621 7727 1482998
Note : 1. Data for the year 2012 are provisional.2. Data for the states of Bihar, Haryana, Jammu & Kashmir, Manipur, Mizoram and Tripura, are repeated for the year 2012
from previous year.Source : National Bank for Agriculture and Rural Development.
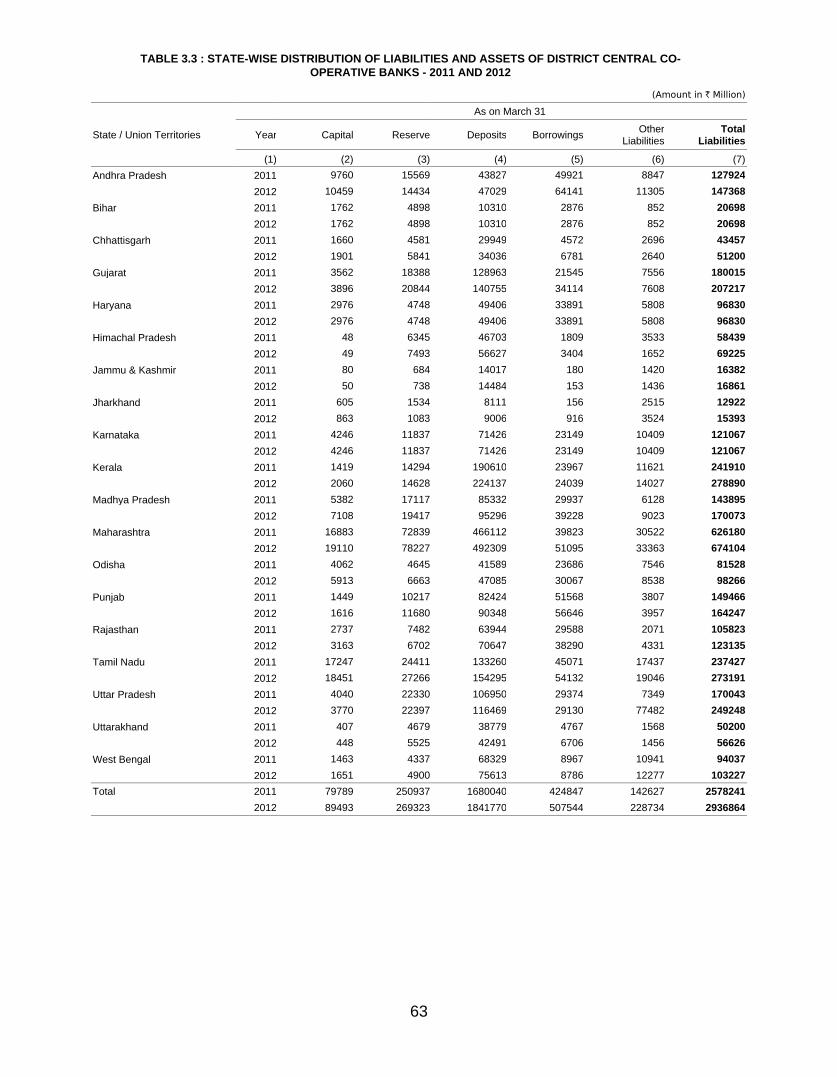
63
TABLE 3.3 : STATE-WISE DISTRIBUTION OF LIABILITIES AND ASSETS OF DISTRICT CENTRAL CO-OPERATIVE BANKS - 2011 AND 2012
(Amount in ` Million)
As on March 31
State / Union Territories Year Capital Reserve Deposits Borrowings OtherLiabilities
TotalLiabilities
(1) (2) (3) (4) (5) (6) (7)Andhra Pradesh 2011 9760 15569 43827 49921 8847 127924
2012 10459 14434 47029 64141 11305 147368Bihar 2011 1762 4898 10310 2876 852 20698
2012 1762 4898 10310 2876 852 20698Chhattisgarh 2011 1660 4581 29949 4572 2696 43457
2012 1901 5841 34036 6781 2640 51200Gujarat 2011 3562 18388 128963 21545 7556 180015
2012 3896 20844 140755 34114 7608 207217Haryana 2011 2976 4748 49406 33891 5808 96830
2012 2976 4748 49406 33891 5808 96830Himachal Pradesh 2011 48 6345 46703 1809 3533 58439
2012 49 7493 56627 3404 1652 69225Jammu & Kashmir 2011 80 684 14017 180 1420 16382
2012 50 738 14484 153 1436 16861Jharkhand 2011 605 1534 8111 156 2515 12922
2012 863 1083 9006 916 3524 15393Karnataka 2011 4246 11837 71426 23149 10409 121067
2012 4246 11837 71426 23149 10409 121067Kerala 2011 1419 14294 190610 23967 11621 241910
2012 2060 14628 224137 24039 14027 278890Madhya Pradesh 2011 5382 17117 85332 29937 6128 143895
2012 7108 19417 95296 39228 9023 170073Maharashtra 2011 16883 72839 466112 39823 30522 626180
2012 19110 78227 492309 51095 33363 674104Odisha 2011 4062 4645 41589 23686 7546 81528
2012 5913 6663 47085 30067 8538 98266Punjab 2011 1449 10217 82424 51568 3807 149466
2012 1616 11680 90348 56646 3957 164247Rajasthan 2011 2737 7482 63944 29588 2071 105823
2012 3163 6702 70647 38290 4331 123135Tamil Nadu 2011 17247 24411 133260 45071 17437 237427
2012 18451 27266 154295 54132 19046 273191Uttar Pradesh 2011 4040 22330 106950 29374 7349 170043
2012 3770 22397 116469 29130 77482 249248Uttarakhand 2011 407 4679 38779 4767 1568 50200
2012 448 5525 42491 6706 1456 56626West Bengal 2011 1463 4337 68329 8967 10941 94037
2012 1651 4900 75613 8786 12277 103227Total 2011 79789 250937 1680040 424847 142627 2578241
2012 89493 269323 1841770 507544 228734 2936864

64
TABLE 3.3 : STATE-WISE DISTRIBUTION OF LIABILITIES AND ASSETS OF DISTRICT CENTRAL CO-OPERATIVE BANKS - 2011 AND 2012 (Concld.)
Note : 1. Data for the year 2012 are provisional.2. Data for the states of Bihar, Haryana and Karnataka are repeated for the year 2012 from previous year.
Source : National Bank for Agriculture and Rural Development.
(Amount in ` Million)
As on March 31
State / Union Territories YearCash in handand balances
with banksInvestments Loans &
AdvancesOther
AssetsAccumulated
LossesTotal
Assets
(8) (9) (10) (11) (12) (13) (14)Andhra Pradesh 2011 6805 31286 79560 8378 1895 127924
2012 7343 32447 97276 8516 1786 147368Bihar 2011 1527 6097 6241 4013 2819 20698
2012 1527 6097 6241 4013 2819 20698Chhattisgarh 2011 2551 28353 11216 1229 108 43457
2012 3436 32859 13082 1746 77 51200Gujarat 2011 8104 95558 66003 8272 2078 180015
2012 11951 100374 83088 9753 2051 207217Haryana 2011 18575 7022 65958 4587 688 96830
2012 18575 7022 65958 4587 688 96830Himachal Pradesh 2011 1623 32818 20314 3683 - 58439
2012 1813 35510 26538 5365 - 69225Jammu & Kashmir 2011 1060 6081 5657 1538 2046 16382
2012 1179 6434 5618 1554 2075 16861Jharkhand 2011 843 8640 1312 1725 402 12922
2012 2144 6552 3052 3559 86 15393Karnataka 2011 19729 15319 67834 17334 851 121067
2012 19729 15319 67834 17334 851 121067Kerala 2011 17488 59124 151985 12853 460 241910
2012 12852 77072 174634 13879 453 278890Madhya Pradesh 2011 15427 47925 72503 6835 1205 143895
2012 16498 58651 86503 7936 485 170073Maharashtra 2011 30932 236724 302742 42276 13506 626180
2012 32178 230685 352963 46859 11419 674104Odisha 2011 3460 25357 43612 7036 2062 81528
2012 3618 31255 53561 7399 2433 98266Punjab 2011 4880 51116 87514 5789 167 149466
2012 5959 52127 98636 7266 259 164247Rajasthan 2011 7738 38887 54708 4292 198 105823
2012 10375 45177 62109 5474 - 123135Tamil Nadu 2011 4927 41174 178665 12000 661 237427
2012 5470 47760 206195 12967 800 273191Uttar Pradesh 2011 7590 80873 52557 13537 15486 170043
2012 9737 93786 117282 12125 16318 249248Uttarakhand 2011 2358 30412 14670 2761 - 50200
2012 2488 33551 17385 3202 - 56626West Bengal 2011 32691 18293 34541 7973 538 94037
2012 33461 18870 40955 9368 572 103227Total 2011 188307 861058 1317592 166111 45172 2578241
2012 200332 931550 1578908 182901 43174 2936864

65
TABLE 3.4 : LIABILITIES AND ASSETS OF INDIAN SCHEDULED COMMERCIAL BANKS IN FOREIGN COUNTRIES - 2011 TO 2013
(Amount in US $ Million)
As on March 31
Item 2011 2012 2013
(1) (2) (3)
No. of Banks 15 15 15
No. of Branches 155 165 171
Liabilities
1. H.O. Funds 7001.63 9682.65 10459.32
2. Customer Deposits 37850.79 44361.86 53161.10
3. Inter-branch Borrowings 6046.13 5566.43 6371.83
4. Inter-bank Borrowings 42466.10 50170.69 59496.59
5. Other Debt Instruments 13824.70 16569.38 21455.60
6. Other Liabilities 2818.96 2935.26 3973.30
Total Liabilities 110008.31 129286.27 154917.74
Assets
1. Cash on Hand & Balances with Central Bank 4183.69 6190.89 7181.05
2. Investments in Securities 6448.73 6019.61 7590.48
3. Inter-Branch placements 3079.96 4180.13 3884.21
4. Inter-Bank Placements 14695.51 16375.09 23954.16
5. Customer Credit (Net) 79567.94 94338.24 109518.22
6. Accumulated Losses 27.62 7.43 8.07
7. Other Assets 2004.86 2174.88 2781.55
Total Assets 110008.31 129286.27 154917.74
Source : 1. Statement of assets & liabilities of overseas branches, Department of Banking Supervision,
RBI for assets & liabilities.
2. Department of Banking Operations & Development, RBI for number of banks and number of branches.

66
TABLE 4.1 : MATURITY PATTERN OF TERM DEPOSITS OF SCHEDULED COMMERCIAL BANKS - 2010 TO 2012
(Amount in ` Billion)
Period of Maturity
As on March 31
2010 2011 2012
No. of Accounts
Amount Outstanding
No. of Accounts
Amount Outstanding
No. of Accounts
Amount Outstanding
(1) (2) (3) (4) (5) (6)
Upto 90 days 4326247 1913.53 2788097 2324.83 2845266 2966.41(3.0) (6.9) (1.9) (7.1) (1.7) (7.8)
91 days & above but 3671209 2322.36 3555315 2863.35 4000644 2825.24less than 6 Months (2.6) (8.4) (2.4) (8.8) (2.4) (7.4)
6 months & above but 8665164 3810.14 7024670 3420.79 5837112 4077.70less than 1 Year (6.0) (13.7) (4.8) (10.5) (3.6) (10.7)
1 year & above but 42372434 10522.75 48695258 13288.36 68332675 17438.87less than 2 Years (29.5) (37.9) (33.1) (40.8) (41.6) (45.7)
2 years & above but 25202884 3427.46 26187351 4162.26 20973944 3574.62less than 3 Years (17.5) (12.3) (17.8) (12.8) (12.8) (9.4)
3 years & above but 31484019 3450.65 29903539 3593.95 27938870 3783.28less than 5 Years (21.9) (12.4) (20.3) (11.0) (17.0) (9.9)
5 years & above 27900886 2306.17 28816759 2878.59 34258782 3533.66(19.4) (8.3) (19.6) (8.8) (20.9) (9.3)
GRAND TOTAL 143622843 27753.06 146970989 32532.13 164187293 38199.78(100.0) (100.0) (100.0) (100.0) (100.0) (100.0)
Note : Figures in brackets represent per cent share in total.Source : Basic Statistical Returns of Scheduled Commercial Banks in India, Volumes 39-41, RBI.

67
I. Government Sector 921.40 1,129.25 1,053.78 1,755.10 4575.73 6,476.21 6,550.91 9,360.57
(15.9) (16.2) (8.6) (10.7) (15.1) (15.9) (13.5) (14.6)
1. Central & State Governments 436.17 596.69 658.31 1,021.74 1,973.84 2,946.68 3,068.33 4,565.10
(7.5) (8.6) (5.3) (6.2) (6.5) (7.2) (6.3) (7.1)
i) Central Government 95.19 224.18 40.79 95.74 731.85 1,243.22 867.83 1,563.13
(1.6) (3.2) (0.3) (0.6) (2.4) (3.0) (1.8) (2.4)
ii) State Governments 340.98 372.51 617.52 926.00 1,241.99 1,703.46 2,200.49 3,001.97
(5.9) (5.4) (5.0) (5.7) (4.1) (4.2) (4.5) (4.7)
2. Local Authorities 102.69 93.52 200.83 329.30 757.11 851.28 1,060.62 1,274.10
(1.8) (1.3) (1.6) (2.0) (2.5) (2.1) (2.2) (2.0)
3. Quasi-Government Bodies 76.42 79.22 60.59 68.90 406.08 356.34 543.09 504.46
(1.3) (1.1) (0.5) (0.4) (1.3) (0.9) (1.1) (0.8)
Of which: State Electricity Boards 14.84 12.54 0.24 9.45 35.61 42.24 50.69 64.24
(0.3) (0.2) (-) (0.1) (0.1) (0.1) (0.1) (0.1)
4. Public Sector Corporations 306.12 359.83 134.05 335.16 1,438.70 2,321.93 1,878.87 3,016.91
(5.3) (5.2) (1.1) (2.0) (4.8) (5.7) (3.9) (4.7)
i) Non-Departmental Commercial Undertakings 273.06 254.26 77.46 125.30 824.06 815.82 1,174.57 1,195.38
(4.7) (3.7) (0.6) (0.8) (2.7) (2.0) (2.4) (1.9)
ii) Others 33.06 105.56 56.59 209.86 614.64 1,506.10 704.30 1,821.53
(0.6) (1.5) (0.5) (1.3) (2.0) (3.7) (1.5) (2.8)
II. Private Corporate Sector (Non-Financial) 1,913.09 2,062.70 69.65 281.99 5,154.22 7,039.80 7,136.96 9,384.49
(33.0) (29.7) (0.6) (1.7) (17.0) (17.3) (14.8) (14.6)
1. Non-Financial Companies 1,513.61 1,438.86 19.60 188.08 3,658.24 4,582.27 5,191.45 6,209.21
(26.1) (20.7) (0.2) (1.1) (12.1) (11.2) (10.7) (9.7)
2. Non-Credit Co-operative Instituations 66.89 28.20 13.79 16.31 219.42 96.30 300.10 140.81
(1.2) (0.4) (0.1) (0.1) (0.7) (0.2) (0.6) (0.2)
3. Others 332.58 595.64 36.26 77.60 1,276.56 2,361.23 1,645.41 3,034.47
(5.7) (8.6) (0.3) (0.5) (4.2) (5.8) (3.4) (4.7)
III. Financial Sector 463.79 742.61 48.17 87.27 4,308.48 5,189.16 4,820.43 6,019.04
(8.0) (10.7) (0.4) (0.5) (14.2) (12.7) (10.0) (9.4)
1. Banks 164.74 225.73 7.12 12.82 2,175.65 2,413.56 2,347.51 2,652.10
(2.8) (3.2) (0.1) (0.1) (7.2) (5.9) (4.9) (4.1)
i) Indian Commercial Banks 61.09 106.48 2.97 3.89 1,550.93 1,548.84 1,614.99 1,659.20
(1.1) (1.5) (-) (-) (5.1) (3.8) (3.3) (2.6)
ii) Foreign Resident Banks
(Offices of Foreign Banks in India)
14.18 15.31 0.07 0.33 73.72 108.59 87.98 124.23
(0.2) (0.2) (-) (-) (0.2) (0.3) (0.2) (0.2)
iii) Co-operative Banks & Credit Societies
89.47 103.94 4.08 8.60 550.99 756.13 644.54 868.67
(1.5) (1.5) (-) (0.1) (1.8) (1.9) (1.3) (1.4)
a. Co-operative Banks 85.84 86.28 0.64 0.84 531.65 592.92 618.13 680.05
(1.5) (1.2) (-) (-) (1.8) (1.5) (1.3) (1.1)
b. Credit Societies 3.63 17.66 3.43 7.75 19.35 163.21 26.41 188.62
(0.1) (0.3) (-) (-) (0.1) (0.4) (0.1) (0.3)
As on March 31
Sector of the Economy
2010 2012 2010 2012 2010 2012 2010 2012
TABLE 4.2 - OWNERSHIP OF BANK DEPOSITS WITH SCHEDULED COMMERCIAL BANKS BY TYPE OF DEPOSITS AND SECTOR MARCH 2010 AND 2012
(Amount in ` Billion)
latoTmreTgnivaStnerruC

68
2. Other Financial Institutions 97.52 117.14 26.86 46.57 1,221.76 1,384.25 1,346.15 1,547.96
(1.7) (1.7) (0.2) (0.3) (4.0) (3.4) (2.8) (2.4)
As on March 31
Sector of the Economy
2010 2012 2010 2012 2010 2012 2010 2012
TABLE 4.2 - OWNERSHIP OF BANK DEPOSITS WITH SCHEDULED COMMERCIAL BANKS BY TYPE OF DEPOSITS AND SECTOR MARCH 2010 AND 2012 (Contd.)
(Amount in ` Billion)
latoTmreTgnivaStnerruC
i) Financial Companies 13.77 39.62 22.80 16.50 90.49 159.47 127.05 215.59
(0.2) (0.6) (0.2) (0.1) (0.3) (0.4) (0.3) (0.3)
a. Housing Finance Companies 8.89 33.08 22.65 16.45 75.79 92.86 107.33 142.39
(0.2) (0.5) (0.2) (0.1) (0.3) (0.2) (0.2) (0.2)
b. Auto Finance Companies 4.88 6.53 0.15 0.05 14.69 66.62 19.72 73.20
(0.1) (0.1) (-) (-) (-) (0.2) (-) (0.1)
ii) Total of Mutual Funds (including Private Sector Mutual Funds)
12.38 4.55 0.36 0.02 645.38 766.26 658.11 770.83
(0.2) (0.1) (-) (-) (2.1) (1.9) (1.4) (1.2)
a. Mutual Funds in Private Sector 7.20 2.34 0.34 0.02 235.18 23.62 242.72 25.98
(0.1) (0.0) (-) (-) (0.8) (0.1) (0.5) (-)
b. Other Mutual Funds 5.17 2.22 0.02 - 410.20 742.64 415.39 744.86
(0.1) (0.0) (-) (-) (1.4) (1.8) (0.9) (1.2)
iii) Unit Trust of India 0.69 0.76 - 0.03 30.32 19.47 31.02 20.26
0.0 (0.0) (-) (-) (0.1) (-) (0.1) (0.0)
iv) Insurance Corporations and Companies
67.41 60.76 0.64 18.17 319.05 331.02 387.09 409.95
(1.2) (0.9) (-) (0.1) (1.1) (0.8) (0.8) (0.6)
v) Term Lending Institutions 1.29 2.23 0.17 1.64 36.15 36.42 37.61 40.29
(-) (0.0) (-) (-) (0.1) (0.1) (0.1) (0.1)
vi) Provident Fund Institutions 1.99 9.22 2.90 10.21 100.38 71.61 105.26 91.04
(-) (0.1) (-) (0.1) (0.3) (0.2) (0.2) (0.1)
3. Other Financial Companies 201.52 399.74 14.18 27.88 911.07 1,391.35 1,126.78 1,818.97
(3.5) (5.8) (0.1) (0.2) (3.0) (3.4) (2.3) (2.8)
i) Financial Services Companies 49.17 171.40 0.62 0.29 299.54 358.88 349.32 530.57
(0.8) (2.5) (-) (-) (1.0) (0.9) (0.7) (0.8)
ii) Other Financial Companies 104.01 198.53 4.40 22.35 194.51 434.81 302.92 655.69
(1.8) (2.9) (-) (0.1) (0.6) (1.1) (0.6) (1.0)
iii) Others 48.35 29.82 9.16 5.24 417.02 597.66 474.54 632.71
(0.8) (0.4) (0.1) (-) (1.4) (1.5) (1.0) (1.0)

69
As on March 31
Sector of the Economy
2010 2012 2010 2012 2010 2012 2010 2012
TABLE 4.2 - OWNERSHIP OF BANK DEPOSITS WITH SCHEDULED COMMERCIAL BANKS BY TYPE OF DEPOSITS AND SECTOR MARCH 2010 AND 2012 (Concld.)(Amount in ` Billion)
latoTmreTgnivaStnerruC
IV. Household Sector 2,373.17 2,887.01 10,485.73 13,539.42 15,189.85 20,822.41 28,048.75 37,248.84
(41.0) (41.5) (85.2) (82.8) (50.2) (51.0) (58.0) (58.1)
1. Individuals (including Hindu Undivided Families)
1,060.18 1,123.07 9,138.07 11,893.42 11,644.48 15,643.60 21,842.73 28,660.09
(18.3) (16.2) (74.2) (72.7) (38.5) (38.3) (45.2) (44.7)
i) Farmers 42.50 60.00 1,024.52 906.41 1,055.13 1,033.50 2,118.42 1,999.91
(0.7) (0.9) (8.3) (5.5) (3.5) (2.5) (4.4) (3.1)
ii) Bussinessmen, Traders, Professionals and Self- Employed Persons
471.90 247.17 1,197.50 677.55 1,723.51 1,307.68 3,419.97 2,232.39
(8.2) (3.6) (9.7) (4.1) (5.7) (3.2) (7.1) (3.5)
iii) Wage and Salary Earners 66.15 50.62 2,083.27 1,347.23 2,158.32 1,305.64 4,298.11 2,703.50
(1.1) (0.7) (16.9) (8.2) (7.1) (3.2) (8.9) (4.2)
iv) Shroffs, Money Lenders, Stock Brockers etc.
47.53 10.99 50.44 53.37 193.33 71.13 291.62 135.49
(0.8) (0.2) (0.4) (0.3) (0.6) (0.2) (0.6) (0.2)
v) Other Individuals 432.09 754.28 4,782.34 8,908.86 6,514.19 11,925.66 11,714.61 21,588.80
(7.5) (10.9) (38.8) (54.5) (21.5) (29.2) (24.2) (33.7)
2. Trusts, Associations, Clubs etc. 102.36 156.80 201.46 197.00 668.24 992.16 972.05 1,345.95
(1.8) (2.3) (1.6) (1.2) (2.2) (2.4) (2.0) (2.1)
3. Proprietary and Partenership Concerns
812.93 1,028.96 70.48 57.08 685.23 813.17 1,568.65 1,899.21
(14.0) (14.8) (0.6) (0.3) (2.3) (2.0) (3.2) (3.0)
4. Educational Institutions 16.96 33.99 77.47 80.27 166.65 227.47 261.09 341.73
(0.3) (0.5) (0.6) (0.5) (0.6) (0.6) (0.5) (0.5)
5. Religious Institutions 2.53 0.76 14.46 5.69 35.36 33.14 52.35 39.60
(-) (-) (0.1) (-) (0.1) (0.1) (0.1) (0.1)
6. Others (Not Elsewhere Classified) 378.20 543.44 983.79 1,305.96 1,989.88 3,112.87 3,351.87 4,962.26
(6.5) (7.9) (8.0) (8.0) (6.6) (7.6) (6.9) (7.7)
V. Foreign Sector 117.04 128.82 654.50 692.20 1,035.03 1,275.71 1,806.57 2,096.72
(2.0) (1.9) (5.3) (4.2) (3.4) (3.1) (3.7) (3.3)
1. Foreign Consulates, Embassies, Trade Missions, Information Services, etc.
8.49 7.47 11.14 2.26 15.40 4.75 35.03 14.49
(0.1) (0.1) (0.1) (-) (0.1) (-) (0.1) (-)
2. Non-Residents 23.07 38.35 615.10 680.79 966.98 1,231.61 1,605.15 1,950.75
(0.4) (0.6) (5.0) (4.2) (3.2) (3.0) (3.3) (3.0)
3. Others 85.48 82.99 28.26 9.15 52.64 39.34 166.39 131.49
(1.5) (1.2) (0.2) (0.1) (0.2) (0.1) (0.3) (0.2)
Total Deposits 5,788.48 6,950.39 12,311.82 16,355.97 30,263.31 40,803.30 48,363.62 64,109.67
(100.0) (100.0) (100.0) (100.0) (100.0) (100.0) (100.0) (100.0)
Notes: 1. March 2011 data are not published.
2. Figures in brackets indicate percentage to total Deposits.
3.''-'' : Nil or Negligible
, RBI.
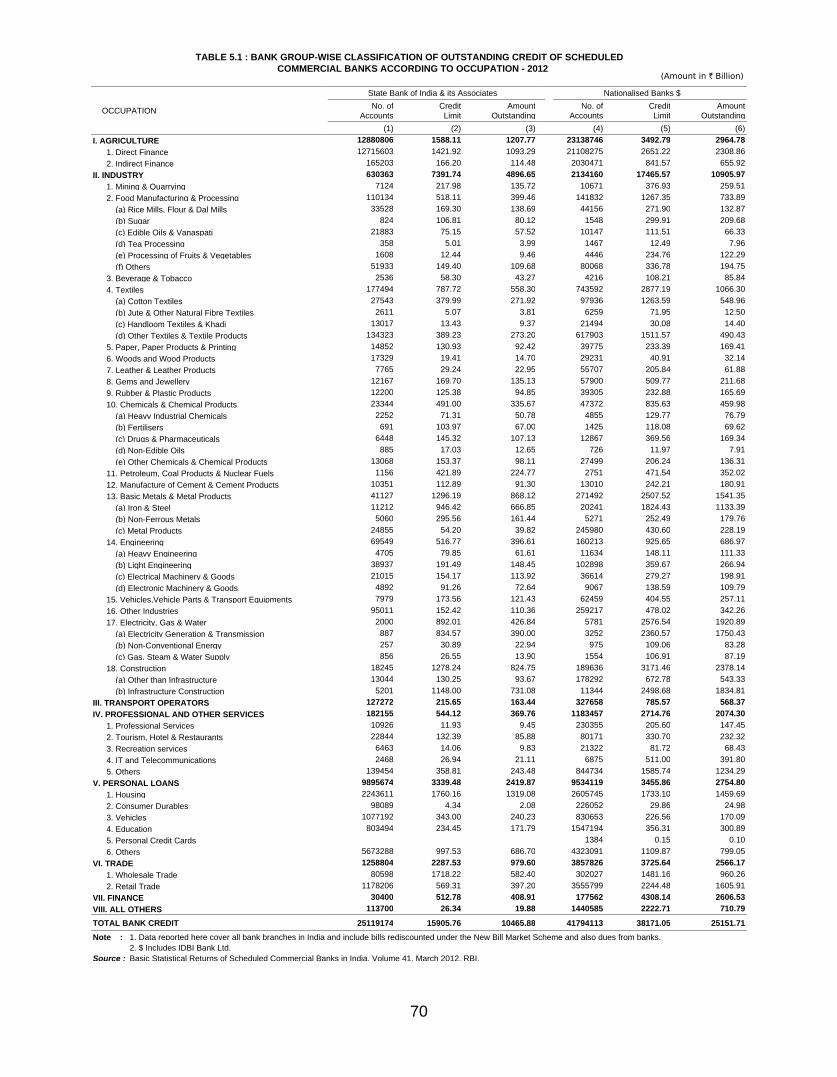
70
TABLE 5.1 : BANK GROUP-WISE CLASSIFICATION OF OUTSTANDING CREDIT OF SCHEDULED COMMERCIAL BANKS ACCORDING TO OCCUPATION - 2012
(Amount in ` Billion)
OCCUPATION
State Bank of India & its Associates Nationalised Banks $No. of
Accounts Credit
LimitAmount
OutstandingNo. of
Accounts Credit
LimitAmount
Outstanding(1) (2) (3) (4) (5) (6)
I. AGRICULTURE 12880806 1588.11 1207.77 23138746 3492.79 2964.78 1. Direct Finance 12715603 1421.92 1093.29 21108275 2651.22 2308.86 2. Indirect Finance 165203 166.20 114.48 2030471 841.57 655.92II. INDUSTRY 630363 7391.74 4896.65 2134160 17465.57 10905.97 1. Mining & Quarrying 7124 217.98 135.72 10671 376.93 259.51 2. Food Manufacturing & Processing 110134 518.11 399.46 141832 1267.35 733.89 (a) Rice Mills, Flour & Dal Mills 33528 169.30 138.69 44156 271.90 132.87 (b) Sugar 824 106.81 80.12 1548 299.91 209.68 (c) Edible Oils & Vanaspati 21883 75.15 57.52 10147 111.51 66.33 (d) Tea Processing 358 5.01 3.99 1467 12.49 7.96 (e) Processing of Fruits & Vegetables 1608 12.44 9.46 4446 234.76 122.29 (f) Others 51933 149.40 109.68 80068 336.78 194.75 3. Beverage & Tobacco 2536 58.30 43.27 4216 108.21 85.84 4. Textiles 177494 787.72 558.30 743592 2877.19 1066.30 (a) Cotton Textiles 27543 379.99 271.92 97936 1263.59 548.96 (b) Jute & Other Natural Fibre Textiles 2611 5.07 3.81 6259 71.95 12.50 (c) Handloom Textiles & Khadi 13017 13.43 9.37 21494 30.08 14.40 (d) Other Textiles & Textile Products 134323 389.23 273.20 617903 1511.57 490.43 5. Paper, Paper Products & Printing 14852 130.93 92.42 39775 233.39 169.41 6. Woods and Wood Products 17329 19.41 14.70 29231 40.91 32.14 7. Leather & Leather Products 7765 29.24 22.95 55707 205.84 61.88 8. Gems and Jewellery 12167 169.70 135.13 57900 509.77 211.68 9. Rubber & Plastic Products 12200 125.38 94.85 39305 232.88 165.69 10. Chemicals & Chemical Products 23344 491.00 335.67 47372 835.63 459.98 (a) Heavy Industrial Chemicals 2252 71.31 50.78 4855 129.77 76.79 (b) Fertilisers 691 103.97 67.00 1425 118.08 69.62 (c) Drugs & Pharmaceuticals 6448 145.32 107.13 12867 369.56 169.34 (d) Non-Edible Oils 885 17.03 12.65 726 11.97 7.91 (e) Other Chemicals & Chemical Products 13068 153.37 98.11 27499 206.24 136.31 11. Petroleum, Coal Products & Nuclear Fuels 1156 421.89 224.77 2751 471.54 352.02 12. Manufacture of Cement & Cement Products 10351 112.89 91.30 13010 242.21 180.91 13. Basic Metals & Metal Products 41127 1296.19 868.12 271492 2507.52 1541.35 (a) Iron & Steel 11212 946.42 666.85 20241 1824.43 1133.39 (b) Non-Ferrous Metals 5060 295.56 161.44 5271 252.49 179.76 (c) Metal Products 24855 54.20 39.82 245980 430.60 228.19 14. Engineering 69549 516.77 396.61 160213 925.65 686.97 (a) Heavy Engineering 4705 79.85 61.61 11634 148.11 111.33 (b) Light Engineering 38937 191.49 148.45 102898 359.67 266.94 (c) Electrical Machinery & Goods 21015 154.17 113.92 36614 279.27 198.91 (d) Electronic Machinery & Goods 4892 91.26 72.64 9067 138.59 109.79 15. Vehicles,Vehicle Parts & Transport Equipments 7979 173.56 121.43 62459 404.55 257.11 16. Other Industries 95011 152.42 110.36 259217 478.02 342.26 17. Electricity, Gas & Water 2000 892.01 426.84 5781 2576.54 1920.89 (a) Electricity Generation & Transmission 887 834.57 390.00 3252 2360.57 1750.43 (b) Non-Conventional Energy 257 30.89 22.94 975 109.06 83.28 (c) Gas, Steam & Water Supply 856 26.55 13.90 1554 106.91 87.19 18. Construction 18245 1278.24 824.75 189636 3171.46 2378.14 (a) Other than Infrastructure 13044 130.25 93.67 178292 672.78 543.33 (b) Infrastructure Construction 5201 1148.00 731.08 11344 2498.68 1834.81III. TRANSPORT OPERATORS 127272 215.65 163.44 327658 785.57 568.37IV. PROFESSIONAL AND OTHER SERVICES 182155 544.12 369.76 1183457 2714.76 2074.30 1. Professional Services 10926 11.93 9.45 230355 205.60 147.45 2. Tourism, Hotel & Restaurants 22844 132.39 85.88 80171 330.70 232.32 3. Recreation services 6463 14.06 9.83 21322 81.72 68.43 4. IT and Telecommunications 2468 26.94 21.11 6875 511.00 391.80 5. Others 139454 358.81 243.48 844734 1585.74 1234.29V. PERSONAL LOANS 9895674 3339.48 2419.87 9534119 3455.86 2754.80 1. Housing 2243611 1760.16 1319.08 2605745 1733.10 1459.69 2. Consumer Durables 98089 4.34 2.08 226052 29.86 24.98 3. Vehicles 1077192 343.00 240.23 830653 226.56 170.09 4. Education 803494 234.45 171.79 1547194 356.31 300.89 5. Personal Credit Cards 1384 0.15 0.10 6. Others 5673288 997.53 686.70 4323091 1109.87 799.05VI. TRADE 1258804 2287.53 979.60 3857826 3725.64 2566.17 1. Wholesale Trade 80598 1718.22 582.40 302027 1481.16 960.26 2. Retail Trade 1178206 569.31 397.20 3555799 2244.48 1605.91VII. FINANCE 30400 512.78 408.91 177562 4308.14 2606.53VIII. ALL OTHERS 113700 26.34 19.88 1440585 2222.71 710.79
TOTAL BANK CREDIT 25119174 15905.76 10465.88 41794113 38171.05 25151.71Note : 1. Data reported here cover all bank branches in India and include bills rediscounted under the New Bill Market Scheme and also dues from banks.
2. $ Includes IDBI Bank Ltd.Source : Basic Statistical Returns of Scheduled Commercial Banks in India, Volume 41, March 2012, RBI.

71
TABLE 5.1 : BANK GROUP-WISE CLASSIFICATION OF OUTSTANDING CREDIT OF SCHEDULED COMMERCIAL BANKS ACCORDING TO OCCUPATION - 2012
(Amount in ` Billion)(Contd.)
OCCUPATION
Foreign Banks Regional Rural BanksNo. of
Accounts Credit
LimitAmount
OutstandingNo. of
Accounts Credit
LimitAmount
Outstanding(7) (8) (9) (10) (11) (12)
I. AGRICULTURE 249 34.51 7.41 11672000 687.39 614.81 1. Direct Finance 108 15.55 1.19 11526472 661.89 593.92 2. Indirect Finance 141 18.96 6.22 145528 25.50 20.89II. INDUSTRY 34297 3030.83 1079.04 461694 34.93 28.44 1. Mining & Quarrying 559 59.33 33.66 826 1.40 1.26 2. Food Manufacturing & Processing 1441 107.25 38.04 111593 5.17 4.06 (a) Rice Mills, Flour & Dal Mills 784 27.76 7.73 64275 2.08 1.61 (b) Sugar 32 14.14 9.23 17 0.10 0.10 (c) Edible Oils & Vanaspati 96 22.64 5.13 5862 0.35 0.18 (d) Tea Processing 7 0.18 0.03 294 0.02 0.02 (e) Processing of Fruits & Vegetables 42 0.32 0.25 207 0.12 0.09 (f) Others 480 42.21 15.67 40938 2.51 2.05 3. Beverage & Tobacco 310 62.16 30.78 123 0.09 0.08 4. Textiles 3344 167.44 40.84 30026 2.18 1.80 (a) Cotton Textiles 1066 45.96 13.44 3120 0.57 0.48 (b) Jute & Other Natural Fibre Textiles 32 2.20 0.06 1162 0.09 0.07 (c) Handloom Textiles & Khadi 26 1.51 0.01 12287 0.64 0.50 (d) Other Textiles & Textile Products 2220 117.77 27.33 13457 0.88 0.74 5. Paper, Paper Products & Printing 1138 269.29 37.55 9793 0.66 0.51 6. Woods and Wood Products 31 0.43 0.32 6210 0.36 0.30 7. Leather & Leather Products 280 16.20 4.47 8341 0.25 0.16 8. Gems and Jewellery 572 81.59 51.64 49467 1.77 1.87 9. Rubber & Plastic Products 1329 48.33 23.16 3382 0.18 0.16 10. Chemicals & Chemical Products 4411 501.56 181.29 2055 0.31 0.25 (a) Heavy Industrial Chemicals 759 60.74 17.50 20 0.03 0.02 (b) Fertilisers 72 22.09 8.05 811 0.06 0.04 (c) Drugs & Pharmaceuticals 1629 257.82 102.13 476 0.04 0.03 (d) Non-Edible Oils 2 0.16 0.02 5 0.00 0.00 (e) Other Chemicals & Chemical Products 1949 160.74 53.59 743 0.18 0.15 11. Petroleum, Coal Products & Nuclear Fuels 217 191.22 58.55 19 0.02 0.01 12. Manufacture of Cement & Cement Products 134 20.94 10.59 2140 0.26 0.23 13. Basic Metals & Metal Products 3649 334.70 125.55 2990 0.49 0.40 (a) Iron & Steel 989 102.10 46.77 146 0.13 0.09 (b) Non-Ferrous Metals 430 119.92 38.85 14 0.01 0.01 (c) Metal Products 2230 112.69 39.93 2830 0.34 0.29 14. Engineering 3840 386.47 157.80 6916 1.31 1.07 (a) Heavy Engineering 618 79.46 42.02 210 0.13 0.10 (b) Light Engineering 1443 102.94 35.92 2135 0.39 0.29 (c) Electrical Machinery & Goods 1412 137.50 45.40 2735 0.65 0.57 (d) Electronic Machinery & Goods 367 66.57 34.46 1836 0.14 0.11 15. Vehicles,Vehicle Parts & Transport Equipments 1998 326.41 101.97 15731 1.18 0.95 16. Other Industries 2607 142.71 26.29 193044 10.24 7.58 17. Electricity, Gas & Water 69 28.44 13.02 372 0.35 0.30 (a) Electricity Generation & Transmission 43 18.10 10.77 20 0.01 0.01 (b) Non-Conventional Energy 7 0.59 0.34 329 0.33 0.29 (c) Gas, Steam & Water Supply 19 9.74 1.92 23 0.01 0.01 18. Construction 8368 286.34 143.53 18666 8.71 7.43 (a) Other than Infrastructure 891 91.87 38.71 17683 7.96 6.75 (b) Infrastructure Construction 7477 194.47 104.82 983 0.75 0.68III. TRANSPORT OPERATORS 16173 93.52 24.54 102607 18.71 14.84IV. PROFESSIONAL AND OTHER SERVICES 16267 1197.88 374.89 506611 31.00 26.02 1. Professional Services 3280 88.96 44.98 136567 6.09 5.14 2. Tourism, Hotel & Restaurants 349 19.38 11.29 80262 4.27 4.13 3. Recreation services 129 32.23 12.77 2288 0.11 0.09 4. IT and Telecommunications 546 470.84 153.49 115 0.06 0.05 5. Others 11963 586.47 152.36 287379 20.47 16.61V. PERSONAL LOANS 9287900 793.30 448.47 2441210 222.86 178.28 1. Housing 437185 241.30 201.50 286136 60.23 49.65 2. Consumer Durables 4265 2.13 0.75 316640 27.03 20.17 3. Vehicles 6508 0.57 0.75 115321 15.22 12.27 4. Education 8 0.00 0.00 78851 11.47 10.22 5. Personal Credit Cards 4863525 417.01 80.85 6. Others 3976409 132.30 164.63 1644262 108.91 85.97VI. TRADE 8856 491.69 148.08 1794689 99.95 80.36 1. Wholesale Trade 4576 359.20 95.67 154463 9.13 7.95 2. Retail Trade 4280 132.50 52.41 1640226 90.81 72.41VII. FINANCE 41813 910.94 264.44 566803 58.12 41.37VIII. ALL OTHERS 5573 202.33 38.86 3182448 397.52 179.80
TOTAL BANK CREDIT 9411128 6755.00 2385.74 20728062 1550.47 1163.90Note : Data reported here cover all bank branches in India and include bills rediscounted under the New Bill Market Scheme and also dues from banks.Source : Basic Statistical Returns of Scheduled Commercial Banks in India, Volume 41, March 2012, RBI.

72
TABLE 5.1 : BANK GROUP-WISE CLASSIFICATION OF OUTSTANDING CREDIT OF SCHEDULED COMMERCIAL BANKS ACCORDING TO OCCUPATION - 2012
(Amount in ` Billion)(Concld.)
OCCUPATION
Private Sector Banks All Scheduled Commercial BanksNo. of
Accounts Credit
LimitAmount
OutstandingNo. of
AccountsCredit
LimitAmount
Outstanding(13) (14) (15) (16) (17) (18)
I. AGRICULTURE 4139384 1023.08 824.58 51831185 6825.88 5619.35 1. Direct Finance 4037994 839.30 689.51 49388452 5589.87 4686.78 2. Indirect Finance 101390 183.78 135.07 2442733 1236.01 932.57II. INDUSTRY 318366 4532.85 2509.55 3578880 32455.92 19419.65 1. Mining & Quarrying 3121 122.77 86.27 22301 778.40 516.41 2. Food Manufacturing & Processing 20011 253.09 184.20 385011 2150.97 1359.64 (a) Rice Mills, Flour & Dal Mills 3774 54.89 37.03 146517 525.93 317.94 (b) Sugar 212 22.60 16.52 2633 443.56 315.64 (c) Edible Oils & Vanaspati 1506 38.35 28.22 39494 247.99 157.38 (d) Tea Processing 1026 4.23 1.71 3152 21.93 13.72 (e) Processing of Fruits & Vegetables 459 5.90 3.64 6762 253.54 135.74 (f) Others 13034 127.12 97.07 186453 658.03 419.22 3. Beverage & Tobacco 864 42.67 28.31 8049 271.43 188.29 4. Textiles 44965 310.06 196.21 999421 4144.58 1863.45 (a) Cotton Textiles 10269 147.78 95.32 139934 1837.89 930.14 (b) Jute & Other Natural Fibre Textiles 412 3.78 2.64 10476 83.09 19.09 (c) Handloom Textiles & Khadi 11174 4.72 3.49 57998 50.37 27.77 (d) Other Textiles & Textile Products 23110 153.78 94.75 791013 2173.23 886.45 5. Paper, Paper Products & Printing 6618 94.92 59.57 72176 729.19 359.45 6. Woods and Wood Products 3563 16.64 11.01 56364 77.76 58.47 7. Leather & Leather Products 2212 16.21 10.24 74305 267.74 99.71 8. Gems and Jewellery 2347 59.63 47.94 122453 822.45 448.26 9. Rubber & Plastic Products 5663 91.45 52.49 61879 498.23 336.35 10. Chemicals & Chemical Products 8218 261.36 149.98 85400 2089.86 1127.17 (a) Heavy Industrial Chemicals 1213 43.84 28.58 9099 305.69 173.68 (b) Fertilisers 205 30.25 20.19 3204 274.46 164.91 (c) Drugs & Pharmaceuticals 1813 91.35 51.97 23233 864.09 430.60 (d) Non-Edible Oils 90 1.95 1.47 1708 31.12 22.06 (e) Other Chemicals & Chemical Products 4897 93.97 47.77 48156 614.50 335.93 11. Petroleum, Coal Products & Nuclear Fuels 735 143.02 70.94 4878 1227.69 706.28 12. Manufacture of Cement & Cement Products 1955 61.81 43.89 27590 438.11 326.93 13. Basic Metals & Metal Products 11182 426.58 252.55 330440 4565.47 2787.96 (a) Iron & Steel 5154 284.89 162.82 37742 3157.97 2009.93 (b) Non-Ferrous Metals 1224 53.23 31.20 11999 721.20 411.27 (c) Metal Products 4804 88.46 58.53 280699 686.30 366.77 14. Engineering 68037 688.10 187.30 308555 2518.30 1429.75 (a) Heavy Engineering 3474 71.24 45.27 20641 378.79 260.33 (b) Light Engineering 50949 119.91 66.81 196362 774.41 518.41 (c) Electrical Machinery & Goods 12209 414.95 49.06 73985 986.54 407.85 (d) Electronic Machinery & Goods 1405 82.00 26.16 17567 378.57 243.17 15. Vehicles,Vehicle Parts & Transport Equipments 23047 243.35 136.56 111214 1149.06 618.02 16. Other Industries 28978 184.98 82.75 578857 968.38 569.24 17. Electricity, Gas & Water 1039 429.57 204.87 9261 3926.91 2565.94 (a) Electricity Generation & Transmission 461 398.73 179.40 4663 3611.99 2330.60 (b) Non-Conventional Energy 254 18.07 14.48 1822 158.95 121.33 (c) Gas, Steam & Water Supply 324 12.76 10.99 2776 155.97 114.01 18. Construction 85811 1086.64 704.48 320726 5831.40 4058.34 (a) Other than Infrastructure 66707 356.10 233.68 276617 1258.96 916.14 (b) Infrastructure Construction 19104 730.54 470.81 44109 4572.44 3142.20III. TRANSPORT OPERATORS 584607 637.09 407.85 1158317 1750.53 1179.04IV. PROFESSIONAL AND OTHER SERVICES 506110 1390.40 822.07 2394600 5878.17 3667.04 1. Professional Services 83680 109.08 59.23 464808 421.66 266.25 2. Tourism, Hotel & Restaurants 22746 196.24 119.57 206372 682.97 453.19 3. Recreation services 1654 76.93 56.83 31856 205.06 147.95 4. IT and Telecommunications 1882 83.34 59.49 11886 1092.18 625.95 5. Others 396148 924.82 526.96 1679678 3476.31 2173.70V. PERSONAL LOANS 23548984 3048.85 1700.08 54707887 10860.35 7501.51 1. Housing 916069 989.56 757.53 6488746 4784.34 3787.44 2. Consumer Durables 605197 37.36 25.49 1250243 100.72 73.47 3. Vehicles 3164151 479.91 280.31 5193825 1065.27 703.66 4. Education 217904 71.89 37.16 2647451 674.12 520.05 5. Personal Credit Cards 13811285 814.86 140.85 18676194 1232.02 221.79 6. Others 4834378 655.28 458.75 20451428 3003.89 2195.09VI. TRADE 904172 1253.57 913.01 7824347 7858.38 4687.22 1. Wholesale Trade 237334 625.84 452.44 778998 4193.55 2098.73 2. Retail Trade 666838 627.73 460.57 7045349 3664.83 2588.49VII. FINANCE 345405 1274.14 766.98 1161983 7064.12 4088.22VIII. ALL OTHERS 3481792 1323.78 921.32 8224098 4172.69 1870.64
TOTAL BANK CREDIT 33828820 14483.76 8865.43 130881297 76866.05 48032.67Note : Data reported here cover all bank branches in India and include bills rediscounted under the New Bill Market Scheme and also dues from banks.Source : Basic Statistical Returns of Scheduled Commercial Banks in India, Volume 41, March 2012, RBI.

73
11.5%
46.8%1.6%
23.2%
9.4%7.5%
Agriculture
Industry
Transport Operators
Personal Loans and Professional Services
Trade
All Others
State Bank of India & Its Associates
11.8%
43.4%2.3%
11.5%10.2%
20.9%
Agriculture
Industry
Transport Operators
Personal Loans and Professional Services
Trade
All Others
Nationalised Banks $
0.3%
45.2%
1.0%20.7%
6.2%
26.5%
Agriculture
Industry
Transport Operators
Personal Loans and Professional Services
Trade
All Others
Foreign Banks
52.8%
2.4%1.3%
15.8%
6.9%
20.8%
Agriculture
Industry
Transport Operators
Personal Loans and Professional Services
Trade
All Others
Regional Rural Banks
9.3%
28.3%
4.6%19.8%
10.3%
27.6%
Agriculture
Industry
Transport Operators
Personal Loans and Professional Services
Trade
All Others
Private Sector Banks
11.7%
40.4%
2.5%16.2%
9.8%
19.5%
Agriculture
Industry
Transport Operators
Personal Loans and Professional Services
Trade
All Others
All Scheduled Commercial Banks
GRAPH - 4OCCUPATION-WISE DISTRIBUTION OF CREDIT BY SCHEDULED COMMERCIAL
BANKS ACCORDING TO BANK GROUPS - 2012(As on March 31)
Note : $ Includes IDBI Bank Ltd.

74
TABLE 5.2 : BANK GROUP-WISE DISTRIBUTION OF OUTSTANDING CREDIT OFSCHEDULED COMMERCIAL BANKS ACCORDING TO SIZE OF CREDIT LIMIT - 2012
STATE BANK OF INDIAAND ITS ASSOCIATES
NATIONALISED BANKS $ FOREIGN BANKS
CCCCrrrreeeeddddiiiitttt llll iiiimmmmiiiitttt rrrraaaannnnggggeeee ((((IIIInnnn `̀̀̀ MMMMiiii llll llll iiiioooonnnn))))
No. ofAccounts
CreditLimit
AmountOut-
standing
No. ofAccounts
CreditLimit
AmountOut-
standing
No. ofAccounts
CreditLimit
AmountOut-
standing
1 2 3 4 5 6 7 8 9
0.025 and Less 4,579,678 82.51 78.28 11,216,219 196.11 289.77 5,509,630 117.65 130.16
Above 0.025 and upto 0.2 14,216,453 1223.01 974.66 22,572,052 1808.94 1619.31 3,208,638 255.51 102.19
Above 0.2 and upto 0.5 4,488,936 1473.77 1136.96 5,338,180 1751.73 1469.67 502,075 152.71 40.66
Above 0.5 and upto 1.0 1,043,557 771.68 603.24 1,376,494 1030.57 854.82 89,370 62.19 29.24
Above 1.0 and upto 2.5 556,427 888.52 720.05 823,836 1345.13 1108.55 49,785 79.89 55.80
Above 2.5 and upto 5.0 136,205 478.45 362.89 223,972 817.01 654.23 18,809 67.95 53.60
Above 5.0 and upto 10.0 40,636 300.97 222.38 96,164 730.04 566.45 11,586 85.53 65.34
Above 10.0 and upto 40.0 30,953 659.59 496.65 83,572 1755.01 1266.23 10,671 212.56 159.78
Above 40.0 and upto 60.0 6,503 327.15 248.97 15,791 793.78 545.34 1,934 97.07 72.94
Above 60.0 and upto 100.0 6,244 517.54 379.71 14,178 1163.23 773.75 1,965 162.02 96.95
Above 100.0 and upto 250.0 7,503 1252.78 924.44 15,647 2596.66 1717.30 2,773 467.44 220.78
Above 250.0 6,079 7929.79 4317.65 18,008 24182.84 14286.30 3,892 4994.48 1358.29
TOTAL 25,119,174 15905.76 10465.88 41,794,113 38171.05 25151.71 9,411,128 6755.00 2385.74
(Amount in ` Billion)
REGIONAL RURAL BANKS PRIVATE SECTOR BANKS ALL SCHEDULEDCOMMERCIAL BANKS
CCCCrrrreeeeddddiiiitttt llll iiiimmmmiiiitttt rrrraaaannnnggggeeee ((((IIIInnnn `̀̀̀ MMMMiiii llll llll iiiioooonnnn))))
No. ofAccounts
CreditLimit
AmountOut-
standing
No. ofAccounts
CreditLimit
AmountOut-
standing
No. ofAccounts
CreditLimit
AmountOut-
standing
10 11 12 13 14 15 16 17 18
0.025 and Less 9,325,528 167.43 162.23 13,416,035 137.75 101.72 44,047,090 701.44 762.16
Above 0.025 and upto 0.2 10,287,059 720.90 612.33 14,780,081 1048.59 495.56 65,064,283 5056.96 3804.05
Above 0.2 and upto 0.5 987,851 313.65 257.89 3,528,484 1156.22 689.54 14,845,526 4848.09 3594.72
Above 0.5 and upto 1.0 99,449 70.53 57.88 1,050,684 758.14 512.61 3,659,554 2693.11 2057.78
Above 1.0 and upto 2.5 22,623 34.32 27.91 725,519 1151.13 847.69 2,178,190 3498.99 2760.00
Above 2.5 and upto 5.0 3,317 11.92 9.50 181,054 644.44 484.51 563,357 2019.77 1564.73
Above 5.0 and upto 10.0 988 7.19 5.68 69,782 513.74 382.59 219,156 1637.47 1242.43
Above 10.0 and upto 40.0 550 10.28 8.45 50,589 1017.28 743.41 176,335 3654.72 2674.53
Above 40.0 and upto 60.0 62 3.08 2.46 8,161 408.19 281.50 32,451 1629.27 1151.22
Above 60.0 and upto 100.0 34 2.89 1.97 6,646 551.39 370.26 29,067 2397.07 1622.64
Above 100.0 and upto 250.0 144 32.98 3.13 6,462 1070.91 698.36 32,529 5420.77 3564.01
Above 250.0 457 175.30 14.46 5,323 6025.98 3257.70 33,759 43308.39 23234.40
TOTAL 20,728,062 1550.47 1163.90 33,828,820 14483.76 8865.43 130,881,297 76866.05 48032.67
Note : $ Includes IDBI Bank Ltd.Source : Basic Statistical Returns of Scheduled Commercial Banks in India, Volume 41, March 2012.
NATIONALISED BANKS $
Source : Basic Statistical Returns of Scheduled Commercial Banks in India, Volume 41, March 2012, RBI.

75
1.8%
26.1%
28.3%
14.0%
14.7%
8.0%
4.4%1.3%
0.7% 0.4% 0.3%
As on March 31, 2011 0% - 6%
6% - 10%
10% - 12%
12% - 13%
13% - 14%
14% - 15%
15% - 16%
16% - 17%
17% - 18%
18% - 20%
20% & above
1.5%9.0%
30.3%
14.3%
14.7%
13.4%
10.3%
3.6%
1.4% 1.0% 0.6%
As on March 31, 20120% - 6%
6% - 10%
10% - 12%
12% - 13%
13% - 14%
14% - 15%
15% - 16%
16% - 17%
17% - 18%
18% - 20%
20% & above
GRAPH - 5DISTRIBUTION OF OUTSTANDING CREDIT OF SCHEDULED COMMERCIAL
BANKS ACCORDING TO INTEREST RATE RANGE - 2011 AND 2012
Note: Data for outstanding credit relate to accounts with credit limit of over Rs.0.2 Million
As on March 31, 2011
As on March 31, 2012

76
TABLE 5.3 : DISTRIBUTION OF OUTSTANDING CREDIT OF SCHEDULED COMMERCIAL BANKS ACCORDING TO INTEREST RATE RANGE - 2011 AND 2012
(Amount in ` Billion)
Interest Rate Bucket
2011 2012
No. ofAccounts
CreditLimit
AmountOut-
standing
No. ofAccounts
CreditLimit
AmountOut-
standing
(1) (2) (3) (4) (5) (6)
Less than 6% 124420 2037.58 627.39 124964 1608.90 614.43
(0.7) (3.0) (1.8) (0.6) (2.5) (1.5)
6% and above but less than 10% 4110045 16891.72 9244.32 3883809 5765.91 3713.18
(22.2) (25.3) (26.1) (17.9) (8.9) (9.0)
10% and above but less than12% 4720731 21991.44 10040.81 4281258 18899.01 12543.83
(25.5) (32.9) (28.3) (19.7) (29.3) (30.3)
12% and above but less than 13% 2599998 8073.18 4951.03 2722253 8670.08 5920.01
(14.1) (12.1) (14.0) (12.6) (13.4) (14.3)
13% and above but less than 14% 2997335 7755.04 5220.18 2671177 9862.77 6105.82
(16.2) (11.6) (14.7) (12.3) (15.3) (14.7)
14% and above but less than 15% 1268975 5027.69 2831.50 2868354 7906.84 5574.50
(6.9) (7.5) (8.0) (13.2) (12.2) (13.4)
15% and above but less than 16% 638204 2781.81 1549.72 2374913 7137.90 4271.41
(3.5) (4.2) (4.4) (11.0) (11.1) (10.3)
16% and above but less than 17% 294185 955.86 460.67 673490 2082.73 1479.59
(1.6) (1.4) (1.3) (3.1) (3.2) (3.6)
17% and above but less than 18% 198321 420.27 253.96 408706 891.05 573.83
(1.1) (0.6) (0.7) (1.9) (1.4) (1.4)
18% and above but less than20% 298435 439.91 154.43 373901 985.01 414.31
(1.6) (0.7) (0.4) (1.7) (1.5) (1.0)
20% and above 1233899 466.30 105.53 1303614 784.99 236.76
(6.7) (0.7) (0.3) (6.0) (1.2) (0.6)
Total Loans & Advances 18484548 66840.79 35439.53 21686439 64595.17 41447.67
(100.0) (100.0) (100.0) (100.0) (100.0) (100.0)
Inland & Foreign Bills Purchased / Discounted 84733 5172.74 1478.06 83485 6512.48 2018.78
TOTAL 18569281 72013.53 36917.59 21769924 71107.65 43466.46
Notes : 1. Data relate to accounts each with credit limit over ` 0.2 Million. 2. Figures in brackets represent per cent share in total loans and advances.
Source : Basic Statistical Returns of Scheduled Commercial Banks in India, 2011 & 2012, Volumes 40 & 41, RBI.
As on March 31

77
TABLE 5.4 : OUTSTANDING ADVANCES OF SCHEDULED COMMERCIAL BANKS TO EXPORTERS
As on the last reporting Friday 2003 2004 2005 2006 2007 2008 2009 2010 2011 2012 2013
March 502.48 597.44 690.59 862.07 1049.26 1299.83 1289.40 1381.43 1688.41 1915.00 2097.00
June 514.43 629.56 704.34 930.67 1079.83 1299.56 1197.17 1436.59 1638.00 1961.00 2109.00
September 523.39 645.82 753.91 947.73 1133.73 1361.72 1206.37 1484.39 1757.00 1846.00 2197.00
December 567.10 667.12 819.65 977.63 1177.19 1374.51 1237.44 1537.94 1896.00 1983.00
(Amount in ` Billion)
Note : Data pertain to select scheduled commercial banks (excluding Regional Rural Banks), which are availing export credit refinance (ECR) facility from RBI. Since April 01, 2004, data for export credit also include three co-operative banks, viz., (i) Bombay Mercantile Co-operative Bank, (ii) Maharashtra State Co-operative bank and (iii) Saraswat Co-operative Bank, which are availing ECR facility from RBI.
Source : Monetary Policy Department , RBI.
TABLE 5.5 : OUTSTANDING ADVANCES OF SCHEDULED COMMERCIAL BANKS FOR PUBLIC FOOD PROCUREMENT OPERATIONS
(Amount in ` Billion)
As on the last reporting Friday of the month
Bank Group Mar.2012
Apr.2012
May.2012
Jun.2012
Jul.2012
Aug.2012
Sep.2012
Oct.2012
Nov.2012
Dec.2012
Jan.2013
Feb.2013
Mar.2013
(1) (2) (3) (4) (5) (6) (7) (8) (9) (10) (11) (12) (13)1. Public Sector Banks (1.1+1.2) 716 720 926 941 849 839 802 827 936 933 916 933 829
1.1. SBI and its Associates 246 247 311 306 264 260 248 263 301 290 283 321 225
1.2. Nationalised Banks $ 470 473 615 636 584 579 554 564 635 643 633 612 604
2. Private Sector Banks 96 96 125 133 128 128 123 125 141 142 140 136 134
2.1. Old Private Sector Banks 30 31 40 41 38 38 36 37 42 42 42 40 40
2.2. New Private Sector Banks 66 65 85 92 90 90 86 87 99 100 99 95 94
3. Foreign Banks- - - - - - - - - - - - -
Total (1+2+3) 812 815 1051 1074 977 967 925 951 1077 1075 1056 1068 963
Note : $ Includes IDBI Bank Limited.
Source : Department of Economic and Policy Research, RBI.

78
Sector April2012
May2012
June2012
July2012
August2012
September2012
(1) (2) (3) (4) (5) (6)Non-food Credit (1+2+3+4) 42950 43035 44032 43458 43593 43992
1 Agriculture & Allied Activities 5440 5424 5508 5453 5439 5262
2 Industry (Micro & Small, Medium and Large) 19382 19560 20006 19650 19856 20134
2.1 Micro & Small 2395 2376 2416 2418 2438 2600
2.2 Medium 1237 1239 1178 1333 1317 1968
2.3 Large 15749 15944 16412 15899 16102 15566
3 Services 10180 10078 10434 10301 10179 10408
3.1 Transport Operators 784 781 779 791 788 777
3.2 Computer Software 145 143 147 147 148 149
3.3 Tourism, Hotels & Restaurants 326 331 338 337 342 344
3.4 Shipping 73 76 75 74 76 80
3.5 Professional Services 480 478 491 498 497 486
3.6 Trade 2259 2290 2363 2314 2305 2354
3.6.1 Wholesale Trade (other than food procurement) 1231 1262 1327 1290 1284 1309
3.6.2 Retail Trade 1028 1028 1036 1024 1021 1045
3.7 Commercial Real Estate 1143 1159 1160 1158 1158 1158
3.8 Non-Banking Financial Companies (NBFCs) 2442 2428 2542 2434 2402 2422
3.9 Other Services 2530 2392 2539 2548 2463 2636
4 Personal Loans 7948 7974 8085 8055 8119 8188
4.1 Consumer Durables 71 73 75 69 70 70
4.2 Housing (Including Priority Sector Housing) 4084 4099 4144 4148 4183 4213 4.3 Advances against Fixed Deposits (Including FCNR (B), NRNR Deposits etc.) 552 524 523 496 500 572
4.4 Advances to Individuals against share, bonds, etc. 32 29 28 28 27 29
4.5 Credit Card Outstanding 210 210 215 221 229 230
4.6 Education 500 501 509 520 528 535
4.7 Vehicle Loans 902 914 940 946 955 1027
4.8 Other Personal Loans 1598 1624 1652 1627 1628 1512
5 Priority Sector 14039 13905 14045 14001 13997 14105
5.1 Agriculture & Allied Activities 5440 5424 5508 5453 5439 5262
5.2 Micro & Small Enterprises 4939 4916 4937 4902 4900 5112
5.2(a) Manufacturing 2395 2376 2416 2418 2438 2600
5.2(b) Services 2544 2409 2521 2483 2462 2512
5.3 Housing 2558 2544 2554 2537 2533 2585
5.4 Micro-Credit 163 157 152 146 154 216
5.5 Education Loans 480 479 488 498 507 515
5.6 State-Sponsored Orgs. for SC/ST 1 1 1 1 1 1
5.7 Weaker Sections 2392 2370 2387 2410 2423 2579
5.8 Export Credit 372 369 392 394 390 385
TABLE 5.6 : SECTOR WISE GROSS BANK CREDIT OF SCHEDULED COMMERCIAL BANKS
(Continued)
(Amount in ` Billion)

79
Sector October2012
November2012
December2012
January2013
February2013
March2013
(7) (8) (9) (10) (11) (12)Non-food Credit (1+2+3+4) 44320 45552 46231 46621 47377 48696
1 Agriculture & Allied Activities 5351 5495 5590 5709 5774 5899
2 Industry (Micro & Small, Medium and Large) 20264 20853 21140 21428 21823 22302
2.1 Micro & Small 2595 2685 2717 2650 2743 2843
2.2 Medium 1984 2031 2019 1345 1219 1247
2.3 Large 15685 16137 16405 17433 17862 18211
3 Services 10368 10625 10858 10749 11003 11486
3.1 Transport Operators 791 790 730 775 778 796
3.2 Computer Software 151 164 161 161 167 169
3.3 Tourism, Hotels & Restaurants 341 342 351 359 350 354
3.4 Shipping 81 81 80 80 81 82
3.5 Professional Services 503 511 527 542 537 564
3.6 Trade 2441 2538 2558 2581 2706 2760
3.6.1 Wholesale Trade (other than food procurement) 1326 1389 1400 1405 1499 1501
3.6.2 Retail Trade 1115 1148 1158 1176 1207 1259
3.7 Commercial Real Estate 1188 1201 1308 1260 1252 1261
3.8 Non-Banking Financial Companies (NBFCs) 2371 2439 2523 2455 2421 2570
3.9 Other Services 2505 2558 2619 2537 2711 2930
4 Personal Loans 8337 8580 8643 8735 8776 9009
4.1 Consumer Durables 72 75 77 80 81 84
4.2 Housing (Including Priority Sector Housing) 4285 4372 4408 4484 4533 4600 4.3 Advances against Fixed Deposits (Including FCNR (B), NRNR Deposits etc.) 586 615 610 552 555 611
4.4 Advances to Individuals against share, bonds, etc. 30 31 33 31 31 31
4.5 Credit Card Outstanding 227 247 248 252 255 249
4.6 Education 537 543 542 550 551 550
4.7 Vehicle Loans 1040 1093 1107 1068 1086 1111
4.8 Other Personal Loans 1561 1604 1619 1719 1683 1774
5 Priority Sector 13979 14617 14886 14846 15060 15398
5.1 Agriculture & Allied Activities 5351 5495 5590 5709 5774 5899
5.2 Micro & Small Enterprises 5137 5262 5397 5330 5434 5623
5.2(a) Manufacturing 2595 2685 2717 2650 2743 2843
5.2(b) Services 2541 2576 2681 2680 2691 2779
5.3 Housing 2619 2667 2678 2628 2647 2672
5.4 Micro-Credit 218 219 241 151 155 165
5.5 Education Loans 517 523 521 525 527 526
5.6 State-Sponsored Orgs. for SC/ST 1 1 1 1 1 1
5.7 Weaker Sections 2696 2725 2795 2619 2676 2734
5.8 Export Credit 388 401 429 409 443 422
Note: 1. Data are provisional and relate to select banks which account for more than 95 per cent of bank credit of all scheduled commercial banks.
2. Gross bank credit data include bills rediscounted with Reserve Bank, EXIM Bank, other approved financial institutions and inter- bank participations.
Source : Monetary Policy Department, RBI.
TABLE 5.6 : SECTOR WISE GROSS BANK CREDIT OF SCHEDULED COMMERCIAL BANKS(Amount in ` Billion)
(Concld.)

80
IndustryApril2012
May2012
June2012
July2012
August2012
September2012
(1) (2) (3) (4) (5) (6)
Mining & Quarrying (including Coal) 327 329 335 332 331 3602.2 Food Processing 925 932 928 909 920 1023 2.2.1 Sugar 320 316 298 283 282 278 2.2.2 Edible Oils & Vanaspati 131 129 125 123 121 95 2.2.3 Tea 21 21 22 22 24 27 2.2.4 Others 453 465 483 481 494 6232.3 Beverage & Tobacco 150 150 147 147 148 1552.4 Textiles 1594 1598 1615 1601 1612 1578 2.4.1 Cotton Textiles 828 823 830 822 825 805 2.4.2 Jute Textiles 18 18 17 16 19 17 2.4.3 Man-Made Textiles 160 158 158 157 162 112 2.4.4 Other Textiles 589 599 610 606 606 6452.5 Leather & Leather Products 79 79 82 83 82 812.6 Wood & Wood Products 62 63 66 66 67 712.7 Paper & Paper Products 248 254 258 258 262 2832.8 Petroleum, Coal Products & Nuclear Fuels 571 543 620 518 518 6502.9 Chemicals & Chemical Products 1249 1254 1269 1191 1237 1177 2.9.1 Fertiliser 154 144 137 121 163 166 2.9.2 Drugs & Pharmaceuticals 452 458 460 457 461 468 2.9.3 Petro Chemicals 325 332 337 281 283 153 2.9.4 Others 317 321 335 331 330 3912.10 Rubber, Plastic & their Products 297 296 299 292 302 3002.11 Glass & Glassware 63 65 67 67 68 642.12 Cement & Cement Products 370 371 377 373 389 3952.13 Basic Metal & Metal Product 2625 2645 2664 2657 2721 2729 2.13.1 Iron & Steel 1954 1966 2009 2011 2074 2071 2.13.2 Other Metal & Metal Product 671 679 655 646 647 6582.14 All Engineering 1136 1130 1165 1231 1185 1230 2.14.1 Electronics 282 274 273 275 283 3202.14.2 Others 854 856 892 956 902 9102.15 Vehicles, Vehicle Parts & Transport Equipment 530 545 560 575 583 6012.16 Gems & Jewellery 522 522 536 524 533 5412.17 Construction 490 490 491 507 510 5952.18 Infrastructure 6275 6380 6488 6438 6538 6501 2.18.1 Power 3290 3329 3421 3470 3589 3607 2.18.2 Telecommunications 954 995 977 933 885 869 2.18.3 Roads 1109 1127 1159 1173 1207 1233 2.18.4 Other Infrastructure 923 929 932 861 857 7912.19 Other Industries 1867 1915 2037 1881 1851 1800Total 19382 19560 20006 19650 19856 20134
TABLE 5.7: INDUSTRY-WISE GROSS BANK CREDIT OF SCHEDULED COMMERCIAL BANKS
(Continued)
(Amount in ` Billion)

81
IndustryOctober
2012November
2012December
2012January
2013February
2013March
2013
(7) (8) (9) (10) (11) (12)
Mining & Quarrying (including Coal) 378 396 406 343 338 3462.2 Food Processing 1021 1071 1099 1095 1140 1174 2.2.1 Sugar 274 266 267 290 312 330 2.2.2 Edible Oils & Vanaspati 99 154 161 161 167 171 2.2.3 Tea 29 30 26 26 27 26 2.2.4 Others 619 621 645 618 635 6482.3 Beverage & Tobacco 158 163 165 163 164 1652.4 Textiles 1592 1622 1654 1743 1785 1835 2.4.1 Cotton Textiles 808 818 830 873 898 925 2.4.2 Jute Textiles 17 18 18 21 21 22 2.4.3 Man-Made Textiles 111 114 118 184 186 189 2.4.4 Other Textiles 656 673 689 665 680 6992.5 Leather & Leather Products 81 83 86 84 83 872.6 Wood & Wood Products 72 75 77 74 75 772.7 Paper & Paper Products 282 288 284 272 275 2832.8 Petroleum, Coal Products & Nuclear Fuels 592 673 698 541 587 6432.9 Chemicals & Chemical Products 1179 1214 1246 1401 1437 1592 2.9.1 Fertiliser 173 179 192 213 226 269 2.9.2 Drugs & Pharmaceuticals 470 484 488 485 481 495 2.9.3 Petro Chemicals 148 151 161 347 362 441 2.9.4 Others 388 400 406 355 368 3872.10 Rubber, Plastic & their Products 301 302 303 303 307 3122.11 Glass & Glassware 65 65 65 70 71 742.12 Cement & Cement Products 405 425 432 444 454 4592.13 Basic Metal & Metal Product 2853 2971 2964 3034 3093 3141 2.13.1 Iron & Steel 2115 2221 2230 2290 2331 2366 2.13.2 Other Metal & Metal Product 738 749 735 745 761 7752.14 All Engineering 1226 1241 1246 1234 1253 1284 2.14.1 Electronics 328 326 330 329 330 3342.14.2 Others 899 914 916 905 923 9502.15 Vehicles, Vehicle Parts & Transport Equipment 597 586 589 575 594 5892.16 Gems & Jewellery 542 551 573 584 593 6112.17 Construction 566 561 572 518 535 5222.18 Infrastructure 6586 6887 6925 7234 7350 7297 2.18.1 Power 3576 3786 3874 4068 4159 4158 2.18.2 Telecommunications 894 929 930 926 926 878 2.18.3 Roads 1252 1270 1265 1304 1329 1313 2.18.4 Other Infrastructure 864 903 855 936 936 9482.19 Other Industries 1768 1679 1758 1716 1690 1810Total 20264 20853 21140 21428 21823 22302
(Amount in ` Billion)
TABLE 5.7 : INDUSTRY GROSS BANK CREDIT OF SCHEDULED COMMERCIAL BANKS (Concld.)
Notes : 1. Data are provisional and relate to select scheduled commercial banks which account for more than 95 per cent of bank credit of all scheduled commercial banks. 2. Gross bank credit data include bills rediscounted with Reserve Bank, EXIM Bank, other approved financial institutuions and inter-bank participations.
Source : Monetary Policy Department, RBI

82
TABLE 6.1 : DISTRIBUTION OF SELECT ITEMS OF SCHEDULED COMMERCIAL BANK'S ADVANCES TO PRIORITY SECTOR - 2012
State/Union Territory Direct Indirect TotalNo. of
AccountsAmount
OutstandingNo. of
AccountsAmount
OutstandingNo. of
AccountsAmount
Outstanding(1) (2) (3) (4) (5) (6)
Northern Region 4292084 815622 139128 367659 4431212 1183281
Delhi 141221 33166 5613 128352 146834 161518
Punjab 1010710 268616 49331 94574 1060041 363191
Haryana 771207 178497 25507 71572 796714 250069
Chandigarh 40588 20746 8968 21666 49556 42412
Jammu & Kashmir 130680 16074 4470 3333 135150 19407
Himachal Pradesh 250520 29259 16703 7535 267223 36794
Rajasthan 1947158 269263 28536 40626 1975694 309890
North Eastern Region 825820 47114 12813 10313 838633 57426
Assam 569210 32468 9110 7812 578320 40280
Meghalaya 54437 2668 510 134 54947 2802
Mizoram 16194 1207 867 165 17061 1372
Arunachal Pradesh 16116 1118 165 192 16281 1311
Nagaland 41839 2136 711 1181 42550 3317
Manipur 35678 3577 280 105 35958 3682
Tripura 92346 3939 1170 724 93516 4663
Eastern Region 5264408 357851 187677 155519 5452085 513370
Bihar 1900933 116046 49239 19890 1950172 135936
Jharkhand 627650 31416 19204 14200 646854 45616
West Bengal 1470571 137737 96446 100554 1567017 238291
Odisha 1250747 71407 22500 20776 1273247 92183
Sikkim 9867 884 198 76 10065 960
Andaman & Nicobar 4640 360 90 23 4730 383
Central Region 7299169 757242 127393 179517 7426562 936759
Uttar Pradesh 4677104 421256 82474 94002 4759578 515258
Uttarakhand 354470 45232 13940 8991 368410 54223
Madhya Pradesh 1954499 253809 25869 63298 1980368 317107
Chattisgarh 313096 36946 5110 13226 318206 50172
Western Region 4632217 644825 108473 249519 4740690 894344
Gujarat 1528594 230027 25998 111667 1554592 341695
Maharashtra 3070888 411042 77736 136788 3148624 547830
Daman & Diu 415 58 30 1 445 59
Goa 30822 3521 4587 999 35409 4520
Dadra & Nagar Haveli 1498 176 122 64 1620 240
Southern Region 20590439 1784927 378325 463326 20968764 2248253
Andhra Pradesh 7576040 613646 95927 226876 7671967 840522
Karnataka 2728196 321903 106955 82076 2835151 403979
Lakshadweep 1684 55 763 14 2447 69
Tamil Nadu 7245303 575781 93291 117824 7338594 693606
Kerala 2952617 266487 79134 35330 3031751 301817
Puducherry 86599 7055 2255 1205 88854 8260
All India 42904137 4407580 953809 1425853 43857946 5833433
As on last reporting Friday of March
Agriculture and Allied Activities
Source : Annual returns on advances to priority sectors, Rural Planning and Credit Department, RBI.
(Amount in ` Million)

83
TABLE 6.1 : DISTRIBUTION OF SELECT ITEMS OF SCHEDULED COMMERCIAL BANK'S ADVANCES TO PRIORITY SECTOR - 2012 (Contd.)
State/Union TerritoryTotal advances to Small
Enterprise (SE)
Of total advances to SE,advances to manufacturing
enterprises
Of total advances to SE,advances to service
enterprises
No. ofAccounts
AmountOutstanding
No. ofAccounts
AmountOutstanding
No. ofAccounts
AmountOutstanding
(7) (8) (9) (10) (11) (12)
Northern Region 1461163 1178652 267584 622863 1117887 526612
Delhi 274073 421593 56778 235001 172128 179016
Punjab 273682 251453 67274 143728 200062 99694
Haryana 212101 168533 39526 94177 168656 69071
Chandigarh 28411 45311 8136 24197 22480 20848
Jammu & Kashmir 135930 57258 21821 14881 109235 37159
Himachal Pradesh 80024 43220 11976 17579 66309 25660
Rajasthan 456942 191284 62073 93302 379017 95164
North Eastern Region 220639 72305 48112 19209 167661 49829
Assam 157547 52913 33218 14164 121240 36113
Meghalaya 10469 3663 1799 715 8453 2851
Mizoram 4085 1508 1009 436 2893 1046
Arunachal Pradesh 7955 2592 1200 415 6408 2047
Nagaland 7925 3084 2052 877 5409 1942
Manipur 7301 2056 2309 777 4706 1177
Tripura 25357 6489 6525 1825 18552 4654
Eastern Region 1626701 593577 240621 224862 1349013 372084
Bihar 406671 72732 48157 13484 351954 55496
Jharkhand 200433 76294 20839 25404 175484 48792
West Bengal 608662 325580 130775 149723 460931 184057
Odisha 397910 112803 39997 35368 348571 78495
Sikkim 7434 3522 508 325 6871 3116
Andaman & Nicobar 5591 2646 345 558 5202 2128
Central Region 1554771 590513 222211 247670 1285470 332658
Uttar Pradesh 859405 333235 151120 137736 681920 183055
Uttarakhand 106370 50544 14163 19681 91283 33470
Madhya Pradesh 443669 137037 42177 55495 390577 82511
Chattisgarh 145327 69698 14751 34757 121690 33622
Western Region 1620648 1378505 234573 693070 1300640 587833
Gujarat 543300 347330 98164 225547 421862 121283
Maharashtra 1037466 1006193 131441 458947 842814 450255
Daman & Diu 1055 1636 366 1437 687 205
Goa 37516 21782 4251 5954 32862 15589
Dadra & Nagar Haveli 1311 1564 351 1184 2415 501
Southern Region 3374171 1463293 365218 686811 2699856 726639
Andhra Pradesh 1022789 381286 93678 212745 732161 170238
Karnataka 695526 275629 71457 112704 598290 159865
Lakshadweep 813 75 72 9 726 64
Tamil Nadu 1141589 605777 134744 291784 938067 272555
Kerala 488276 192981 63188 66715 407830 119172
Puducherry 25178 7545 2079 2855 22782 4744
All India 9858093 5276846 1378319 2494485 7920527 2595655
As on last reporting Friday of March
Source : Annual returns on advances to priority sectors, Rural Planning and Credit Department, RBI.
(Amount in ` Million)

84
TABLE 6.1 : DISTRIBUTION OF SELECT ITEMS OF SCHEDULED COMMERCIAL BANK'S ADVANCES TO PRIORITY SECTOR - 2012 (Contd.)
State/Union TerritoryOf total advances to SE,
Term loans
Loans to artisans, villageand cottage industries credit
limit not exceeding Rs.50000
Of total advances to SE,advances to units in Khadi
and village Industries
No. ofAccounts
AmountOutstanding
No. ofAccounts
AmountOutstanding
No. ofAccounts
AmountOutstanding
(13) (14) (15) (16) (17) (18)
Northern Region 406772 221954 93024 7946 12546 4263
Delhi 34513 75113 9118 4980 245 1524
Punjab 64235 38538 17394 511 1489 313
Haryana 49046 25521 7880 431 1456 1428
Chandigarh 7977 10169 981 72 70 34
Jammu & Kashmir 69537 26401 27302 1145 2798 282
Himachal Pradesh 21442 7854 7952 277 1635 172
Rajasthan 160022 38358 22397 531 4853 509
North Eastern Region 55629 11795 4460 566 6234 1124
Assam 36485 7848 3014 384 4205 608
Meghalaya 3893 1005 195 22 219 56
Mizoram 1069 262 113 13 194 33
Arunachal Pradesh 2590 682 222 26 368 67
Nagaland 3243 743 356 37 661 202
Manipur 2666 374 311 23 321 91
Tripura 5683 883 249 61 266 66
Eastern Region 444444 100160 68848 3206 17993 3714
Bihar 112457 14603 8138 347 2818 357
Jharkhand 81726 18596 4153 421 2455 342
West Bengal 122039 41367 39900 1578 7363 2356
Odisha 125898 25004 14833 798 5230 625
Sikkim 1007 272 1754 57 62 28
Andaman & Nicobar 1317 319 70 5 65 6
Central Region 470359 114329 40357 3414 15407 2940
Uttar Pradesh 261542 65561 16953 2253 8071 1944
Uttarakhand 38046 13331 2804 171 2311 269
Madhya Pradesh 135736 25227 18758 861 3707 483
Chattisgarh 35035 10211 1842 129 1318 244
Western Region 585863 333275 32199 2325 9596 7888
Gujarat 154165 63863 10530 661 4815 606
Maharashtra 418960 261205 19911 1498 4416 7167
Daman & Diu 260 253 6 0 4 0
Goa 12329 7526 1751 166 355 115
Dadra & Nagar Haveli 149 429 1 0 6 0
Southern Region 854174 352401 479502 20818 19377 8851
Andhra Pradesh 193502 88585 74485 5265 7116 1538
Karnataka 223116 84350 117663 7846 2348 841
Lakshadweep 58 4 2 0 15 2
Tamil Nadu 328986 142827 173119 5495 4907 2433
Kerala 99165 35101 113116 2166 4927 4032
Puducherry 9347 1534 1117 46 64 5
All India 2817241 1133915 718390 38275 81153 28782
As on last reporting Friday of March
(Amount in ` Million)
Source: Annual returns on advances to priority sectors, Rural Planning and Credit Department, RBI.

85
TABLE 6.1 : DISTRIBUTION OF SELECT ITEMS OF SCHEDULED COMMERCIAL BANK'S ADVANCES TO PRIORITY SECTOR - 2012 (Contd.)
State/Union TerritoryMicro credit (other thanloans granted to SHGs/
JLGs)
Total advances to weakersections in priority sector Total loans for Education
No. ofAccounts
AmountOutstanding
No. ofAccounts
AmountOutstanding
No. ofAccounts
AmountOutstanding
(19) (20) (21) (22) (23) (24)
Northern Region 139470 6979 3664715 540006 192775 47396
Delhi 54618 3120 67271 27983 38308 11711
Punjab 21964 809 857962 183761 32776 9032
Haryana 12535 886 553270 91311 36842 8443
Chandigarh 3011 117 36839 6840 6086 1977
Jammu & Kashmir 16487 575 180267 21318 10475 2067
Himachal Pradesh 3508 147 212044 23252 13839 2801
Rajasthan 27347 1325 1757062 185541 54449 11366
North Eastern Region 8029 1713 710734 52305 20144 5131
Assam 6388 1070 485959 33226 14543 3651
Meghalaya 238 6 49079 4304 1452 347
Mizoram 35 2 15386 1571 665 239
Arunachal Pradesh 96 2 19709 2340 476 105
Nagaland 716 19 35911 2789 366 99
Manipur 181 5 25814 3209 1062 367
Tripura 375 610 78876 4867 1580 323
Eastern Region 189079 15758 5153760 339831 260878 59462
Bihar 32353 1185 1551937 84210 78788 18006
Jharkhand 18334 826 764809 35814 41671 10892
West Bengal 93135 10130 1547816 149829 71957 15288
Odisha 43781 3577 1270661 66354 67136 14779
Sikkim 1416 39 15408 3426 385 166
Andaman & Nicobar 60 2 3129 197 941 332
Central Region 124649 4807 6010362 522014 254220 54817
Uttar Pradesh 71839 3104 3960271 323793 137131 31130
Uttarakhand 6562 464 300610 31438 24974 5707
Madhya Pradesh 37583 986 1466927 142278 76993 14841
Chattisgarh 8665 253 282554 24505 15122 3139
Western Region 263897 18366 3843880 399034 203732 51913
Gujarat 65352 2392 1308422 148462 44893 12192
Maharashtra 186380 15561 2495351 245062 154927 38734
Daman & Diu 268 5 649 101 103 31
Goa 11831 406 37648 5193 3615 900
Dadra & Nagar Haveli 66 2 1810 215 194 57
Southern Region 2332202 94244 18254681 1444753 1532375 263484
Andhra Pradesh 555886 25004 6363390 445051 215797 50586
Karnataka 406813 12554 2455722 249642 173270 35184
Lakshadweep 136 4 7952 405 24 4
Tamil Nadu 969170 34471 6481406 492038 822810 117090
Kerala 379206 21538 2864218 251752 308097 58546
Puducherry 20991 674 81993 5866 12377 2074
All India 3057326 141867 37638132 3297943 2464124 482203
As on last reporting Friday of March
(Amount in ` Million)
Source: Annual returns on advances to priority sectors, Rural Planning and Credit Department, RBI.

86
TABLE 6.1 : DISTRIBUTION OF SELECT ITEMS OF SCHEDULED COMMERCIAL BANK'S ADVANCES TO PRIORITY SECTOR - 2012 (Contd.)
State/Union TerritoryLoans to SC/ST
beneficiariesLoans granted to SSO for
onlending to SC/STs Total Housing loans
No. ofAccounts
AmountOutstanding
No. ofAccounts
AmountOutstanding
No. ofAccounts
AmountOutstanding
(25) (26) (27) (28) (29) (30)
Northern Region 1285677 269377 6159 157 756615 362222
Delhi 34216 23277 50 3 141906 113695
Punjab 402324 103734 133 4 137489 61106
Haryana 259089 65891 383 10 98789 56755
Chandigarh 10327 8311 85 1 23272 20442
Jammu & Kashmir 5335 1351 498 85 125280 17147
Himachal Pradesh 82487 17537 17 0 32111 11480
Rajasthan 491899 49276 4993 54 197768 81597
North Eastern Region 348417 26029 525 23 83503 30965
Assam 115921 11071 61 3 51238 19926
Meghalaya 9295 1876 6 2 4571 1655
Mizoram 2067 680 0 0 12447 3880
Arunachal Pradesh 7600 1744 100 1 2274 1091
Nagaland 62498 7125 26 0 2387 973
Manipur 109898 1471 166 4 6549 1713
Tripura 41138 2063 166 13 4037 1727
Eastern Region 1091323 92737 2777 176 457100 177154
Bihar 250487 13214 529 11 44234 17341
Jharkhand 191124 11381 147 3 37946 18734
West Bengal 397522 50713 1009 28 233156 101938
Odisha 245200 14990 1056 132 131308 34469
Sikkim 6699 2387 1 0 8782 3778
Andaman & Nicobar 291 53 35 1 1674 892
Central Region 1254727 113598 3218 151 566421 240378
Uttar Pradesh 785943 62276 2668 112 255940 119963
Uttarakhand 105571 13357 14 0 53084 20414
Madhya Pradesh 289612 32065 488 37 194897 74475
Chattisgarh 73601 5899 48 2 62500 25527
Western Region 734048 102068 1810 102 1143422 965205
Gujarat 273144 33708 637 40 284559 152305
Maharashtra 454815 67001 1166 61 836740 800160
Daman & Diu 2065 668 0 0 2421 1212
Goa 3284 597 7 1 17934 10695
Dadra & Nagar Haveli 740 94 0 0 1768 833
Southern Region 2551211 185506 10882 750 1771382 861446
Andhra Pradesh 769327 50145 3604 322 536989 253352
Karnataka 427037 36200 806 43 388091 223618
Lakshadweep 5433 421 25 0 261 115
Tamil Nadu 1176970 83578 5090 227 437266 220715
Kerala 162717 14501 1297 156 399442 158660
Puducherry 9727 661 60 2 9333 4986
All India 7265403 789315 25371 1360 4778443 2637370
As on last reporting Friday of March
(Amount in ` Million)
Source:Annual returns on advances to priority sectors, Rural Planning and Credit Department, RBI.

87
TABLE 6.1 : DISTRIBUTION OF SELECT ITEMS OF SCHEDULED COMMERCIAL BANK'S ADVANCES TO PRIORITY SECTOR - 2012 (Contd.)
State/Union TerritoryAdvances to Self Help
Groups
Loans to Food and agrobased processing units with
invest. In P & M upto 10crs.
No. ofAccounts
AmountOutstanding
No. ofAccounts
AmountOutstanding
(31) (32) (33) (34)
Northern Region 72175 6334 9618 99663
Delhi 1065 1164 869 27123
Punjab 7708 591 3956 31841
Haryana 9535 1224 3051 25483
Chandigarh 831 59 114 4164
Jammu & Kashmir 1179 61 491 1865
Himachal Pradesh 6148 586 219 493
Rajasthan 45709 2648 918 8693
North Eastern Region 57845 3862 834 1347
Assam 43370 2917 576 1274
Meghalaya 1511 78 21 4
Mizoram 179 36 0 0
Arunachal Pradesh 175 17 2 7
Nagaland 1903 122 15 26
Manipur 5397 234 46 13
Tripura 5310 457 174 23
Eastern Region 354723 33812 12685 23545
Bihar 54742 5778 2065 2444
Jharkhand 28696 2277 1168 2045
West Bengal 133222 12893 8287 15371
Odisha 137668 12833 1137 3671
Sikkim 205 20 15 7
Andaman & Nicobar 190 11 13 7
Central Region 147094 15044 10112 37505
Uttar Pradesh 90419 9627 7353 25796
Uttarakhand 10664 542 299 1778
Madhya Pradesh 31186 3741 1837 6674
Chattisgarh 14825 1134 623 3257
Western Region 178371 10528 12886 60064
Gujarat 65703 2573 5269 28279
Maharashtra 109570 7132 6630 31489
Daman & Diu 0 0 2 0
Goa 3097 822 948 285
Dadra & Nagar Haveli 1 0 37 10
Southern Region 1471430 181139 13829 69894
Andhra Pradesh 866330 104053 4994 33386
Karnataka 118362 21623 2200 12233
Lakshadweep 32 1 0 0
Tamil Nadu 402229 40230 3816 18087
Kerala 76356 14323 2744 5784
Puducherry 8121 908 75 403
All India 2281638 250719 59964 292018
As on last reporting Friday of March
(Amount in ` Million)
Source: Annual returns on advances to priority sectors, Rural Planning and Credit Department, RBI.

88
TABLE 6.1 : DISTRIBUTION OF SELECT ITEMS OF SCHEDULED COMMERCIAL BANK'S ADVANCES TO PRIORITY SECTOR - 2012 (Concld.)
State/Union Territory Export Credit to SE Export Credit to Non - SE Total Export Credit Total priority sectoradvances
No. ofAccounts
AmountOutstanding
No. ofAccounts
AmountOutstanding
No. ofAccounts
AmountOutstanding
No. ofAccounts
AmountOutstanding
(37) (38) (39) (40) (41) (42) (43) (44)
Northern Region 204 2985 1309 114309 1513 117293 6988703 2892997
Delhi 184 2560 1197 99678 1381 102238 656986 811318
Punjab 8 43 33 4464 41 4506 1526118 690059
Haryana 3 165 14 8762 17 8927 1157378 493458
Chandigarh 2 197 44 176 46 373 110465 110436
Jammu & Kashmir 0 0 0 0 0 0 423820 96538
Himachal Pradesh 0 0 1 81 1 81 396723 94523
Rajasthan 7 20 20 1148 27 1168 2717213 596664
North Eastern Region 0 0 2 263 2 263 1171475 167826
Assam 0 0 1 58 1 58 808098 117900
Meghalaya 0 0 1 204 1 204 71684 8680
Mizoram 0 0 0 0 0 0 34293 7000
Arunachal Pradesh 0 0 0 0 0 0 27182 5102
Nagaland 0 0 0 0 0 0 53970 7492
Manipur 0 0 0 0 0 0 51217 7828
Tripura 0 0 0 0 0 0 125031 13825
Eastern Region 64 1790 394 18966 458 20756 7989014 1378463
Bihar 0 0 0 0 0 0 2512747 245211
Jharkhand 0 0 0 0 0 0 945385 152366
West Bengal 64 1790 393 18349 457 20139 2575329 709604
Odisha 0 0 1 617 1 617 1914439 258560
Sikkim 0 0 0 0 0 0 28083 8466
Andaman & Nicobar 0 0 0 0 0 0 13031 4255
Central Region 8 123 15 1752 23 1875 9929856 1829179
Uttar Pradesh 4 105 8 1153 12 1258 6086569 1003954
Uttarakhand 0 0 0 0 0 0 559414 131352
Madhya Pradesh 4 18 7 599 11 618 2734005 545083
Chattisgarh 0 0 0 0 0 0 549868 148790
Western Region 341 15550 3229 294609 3570 310159 7977428 3603044
Gujarat 7 392 280 15748 287 16140 2493613 871701
Maharashtra 334 15158 2948 274006 3282 289164 5368251 2682544
Daman & Diu 0 0 0 0 0 0 4292 2943
Goa 0 0 1 4855 1 4855 106313 43159
Dadra & Nagar Haveli 0 0 0 0 0 0 4959 2696
Southern Region 115 1399 1143 106196 1258 107595 29990919 5037665
Andhra Pradesh 1 2 105 15880 106 15882 10007137 1566951
Karnataka 54 612 276 42918 330 43530 4499933 993925
Lakshadweep 0 0 0 0 0 0 3706 267
Tamil Nadu 49 596 654 45162 703 45758 10715173 1717049
Kerala 11 190 108 2236 119 2426 4608177 735932
Puducherry 0 0 0 0 0 0 156793 23541
All India 732 21846 6092 536095 6824 557941 64047395 14909174
As on last reporting Friday of March
(Amount in ` Million)
Source: Annual returns on advances to priority sectors, Rural Planning and Credit Department, RBI.

89
TABLE 6.2 : STATE-WISE DISTRIBUTION OF OUTSTANDING ADVANCES OF SCHEDULED COMMERCIALBANKS TO AGRICULTRE - 2012
State/Union TerritoryDirect Indirect Total
No. ofAccounts
AmountOutstanding
No. ofAccounts
AmountOutstanding
No. ofAccounts
AmountOutstanding
(1) (2) (3) (4) (5) (6)
Northern Region 4292084 815622 139128 367659 4431212 1183281
Delhi 141221 33166 5613 128352 146834 161518
Punjab 1010710 268616 49331 94574 1060041 363191
Haryana 771207 178497 25507 71572 796714 250069
Chandigarh 40588 20746 8968 21666 49556 42412
Jammu & Kashmir 130680 16074 4470 3333 135150 19407
Himachal Pradesh 250520 29259 16703 7535 267223 36794
Rajasthan 1947158 269263 28536 40626 1975694 309890
North Eastern Region 825820 47114 12813 10313 838633 57426
Assam 569210 32468 9110 7812 578320 40280
Meghalaya 54437 2668 510 134 54947 2802
Mizoram 16194 1207 867 165 17061 1372
Arunachal Pradesh 16116 1118 165 192 16281 1311
Nagaland 41839 2136 711 1181 42550 3317
Manipur 35678 3577 280 105 35958 3682
Tripura 92346 3939 1170 724 93516 4663
Eastern Region 5264408 357851 187677 155519 5452085 513370
Bihar 1900933 116046 49239 19890 1950172 135936
Jharkhand 627650 31416 19204 14200 646854 45616
West Bengal 1470571 137737 96446 100554 1567017 238291
Odisha 1250747 71407 22500 20776 1273247 92183
Sikkim 9867 884 198 76 10065 960
Andaman & Nicobar 4640 360 90 23 4730 383
Central Region 7299169 757242 127393 179517 7426562 936759
Uttar Pradesh 4677104 421256 82474 94002 4759578 515258
Uttarakhand 354470 45232 13940 8991 368410 54223
Madhya Pradesh 1954499 253809 25869 63298 1980368 317107
Chattisgarh 313096 36946 5110 13226 318206 50172
Western Region 4632217 644825 108473 249519 4740690 894344
Gujarat 1528594 230027 25998 111667 1554592 341695
Maharashtra 3070888 411042 77736 136788 3148624 547830
Daman & Diu 415 58 30 1 445 59
Goa 30822 3521 4587 999 35409 4520
Dadra & Nagar Haveli 1498 176 122 64 1620 240
Southern Region 20590439 1784927 378325 463326 20968764 2248253
Andhra Pradesh 7576040 613646 95927 226876 7671967 840522
Karnataka 2728196 321903 106955 82076 2835151 403979
Lakshadweep 1684 55 763 14 2447 69
Tamil Nadu 7245303 575781 93291 117824 7338594 693606
Kerala 2952617 266487 79134 35330 3031751 301817
Puducherry 86599 7055 2255 1205 88854 8260
All India 42904137 4407580 953809 1425853 43857946 5833433
As on last reporting Friday of March
Agriculture and Allied Activities
(Amount in ` Million)
Annual returns on advances to priority sectors, Rural Planning and Credit Department, RBI.Source :

90
TABLE 6.2 : STATE-WISE DISTRIBUTION OF OUTSTANDING ADVANCES OF SCHEDULED COMMERCIALBANKS TO AGRICULTRE - 2012 (Contd.)
State/Union TerritoryLoans to individual
farmers
Loans to corporates,partnership firms, credit
limit upto Rs. 1 cr.
Loans to corporates,partnership firms, credit
limit above Rs. 1 cr.
Loans granted to pre &post harvest activities
No. ofAccounts
AmountOutstanding
No. ofAccounts
AmountOutstanding
No. ofAccounts
AmountOutstanding
No. ofAccounts
AmountOutstanding
(7) (8) (9) (10) (11) (12) (13) (14)
Northern Region 4128211 719551 78001 51630 1928 106916 52953 13877
Delhi 135819 24183 5170 2611 328 42507 182 2989
Punjab 981167 242898 19657 13813 586 17210 1720 3134
Haryana 734795 152634 13030 14442 528 19466 4068 2104
Chandigarh 39663 15468 1016 1199 152 11774 8 30
Jammu & Kashmir 128239 13529 2439 1549 64 1201 1060 156
Himachal Pradesh 241921 29058 3073 1411 16 909 5757 486
Rajasthan 1866607 241781 33616 16605 254 13850 40158 4979
North Eastern Region 802141 40147 7112 3628 182 4995 17056 479
Assam 546911 26363 5200 2557 154 4322 16556 461
Meghalaya 54186 2308 423 134 12 269 47 4
Mizoram 16727 1238 53 67 0 0 16 1
Arunachal Pradesh 16299 761 63 85 6 347 0 0
Nagaland 41629 2493 425 175 2 0 0 0
Manipur 34979 3396 346 160 0 0 119 2
Tripura 91410 3589 602 451 8 57 318 12
Eastern Region 5134362 258457 123174 28753 3751 113285 27705 7357
Bihar 1877019 89463 28648 5414 215 23984 474 106
Jharkhand 605630 24098 36259 2346 42 13175 309 51
West Bengal 1412906 86622 31603 12124 3327 69458 14928 6373
Odisha 1225346 57262 25583 8668 162 6651 11992 825
Sikkim 8936 714 1038 166 0 0 1 1
Andaman & Nicobar 4525 298 43 36 5 17 1 0
Central Region 6765075 702075 138567 37301 3457 51328 213434 13476
Uttar Pradesh 4221292 384424 83404 24713 2598 34303 188556 8685
Uttarakhand 344478 41338 2421 2008 187 3308 11966 2416
Madhya Pradesh 1891493 246649 47803 7944 498 8907 11060 1687
Chattisgarh 307812 29664 4939 2636 174 4810 1852 687
Western Region 4462538 550648 118700 35140 2496 87192 98695 25206
Gujarat 1428493 210529 27021 7557 1323 37890 81863 10264
Maharashtra 3003583 337170 88147 27124 1159 49108 16805 14809
Daman & Diu 404 54 11 3 0 0 0 0
Goa 28628 2745 3510 450 14 194 27 132
Dadra & Nagar Haveli 1430 150 11 5 0 0 0 0
Southern Region 20132046 1673736 309082 88598 15870 153207 107690 12539
Andhra Pradesh 7476040 594486 89638 37892 1334 57163 39166 3563
Karnataka 2687054 297399 55846 14992 1799 30487 13338 5321
Lakshadweep 1684 55 0 0 0 0 0 0
Tamil Nadu 7003762 526300 103628 26488 4135 54860 43458 2362
Kerala 2877577 249050 58436 8969 8594 10576 11692 1260
Puducherry 85929 6446 1534 256 8 120 36 32
All India 41424373 3944614 774636 245049 27684 516922 517533 72933
As on last reporting Friday of March
(Amount in ` Million)
Source : Annual returns on advances to priority sectors, Rural Planning and Credit Department, RBI.

91
TABLE 6.2 : STATE-WISE DISTRIBUTION OF OUTSTANDING ADVANCES OF SCHEDULED COMMERCIALBANKS TO AGRICULTRE - 2012 (Contd.)
State/Union Territory
Loans to Food and agrobased processing units
with invest. In P& M upto10 crs.
Agriclinics and Agri-Business Centres
Loans to farmers throughPACS/FSS/LAMPS
Loans to NBFCs for on-lending to individual
farmers or their SHGs/JLGs
No. ofAccounts
AmountOutstanding
No. ofAccounts
AmountOutstanding
No. ofAccounts
AmountOutstanding
No. ofAccounts
AmountOutstanding
(15) (16) (17) (18) (19) (20) (21) (22)
Northern Region 9618 99663 1653 545 221 4593 42 245
Delhi 869 27123 24 14 3 3488 7 231
Punjab 3956 31841 164 171 25 8 7 7
Haryana 3051 25483 150 144 10 36 7 1
Chandigarh 114 4164 2 7 1 990 0 0
Jammu & Kashmir 491 1865 473 59 18 33 14 5
Himachal Pradesh 219 493 83 13 0 0 2 0
Rajasthan 918 8693 757 138 164 38 5 1
North Eastern Region 834 1347 1493 144 8 1 8 148
Assam 576 1274 922 91 5 1 2 147
Meghalaya 21 4 91 12 1 0 1 0
Mizoram 0 0 221 11 0 0 0 0
Arunachal Pradesh 2 7 12 0 0 0 0 0
Nagaland 15 26 27 3 0 0 5 1
Manipur 46 13 39 7 0 0 0 0
Tripura 174 23 181 20 2 0 0 0
Eastern Region 12685 23545 14900 4143 5145 676 626 2868
Bihar 2065 2444 1372 350 17 2 7 22
Jharkhand 1168 2045 1316 118 12 0 0 0
West Bengal 8287 15371 10340 3257 5101 673 44 2786
Odisha 1137 3671 1846 414 14 1 575 60
Sikkim 15 7 18 2 0 0 0 0
Andaman & Nicobar 13 7 8 2 1 0 0 0
Central Region 10112 37505 3365 945 39 5 2041 46
Uttar Pradesh 7353 25796 2262 620 22 1 84 24
Uttarakhand 299 1778 174 17 0 0 5 1
Madhya Pradesh 1837 6674 773 243 15 4 1952 21
Chattisgarh 623 3257 156 65 2 0 0 0
Western Region 12886 60064 1064 2056 210 281 5076 21936
Gujarat 5269 28279 364 315 36 12 68 102
Maharashtra 6630 31489 694 1741 168 269 5007 21834
Daman & Diu 2 0 1 0 0 0 0 0
Goa 948 285 4 0 6 0 1 0
Dadra & Nagar Haveli 37 10 1 0 0 0 0 0
Southern Region 13829 69894 8406 1685 1119 2413 55858 16053
Andhra Pradesh 4994 33386 5642 1064 431 1727 36250 6308
Karnataka 2200 12233 872 275 372 595 5948 1279
Lakshadweep 0 0 0 0 0 0 0 0
Tamil Nadu 3816 18087 1374 251 276 39 13557 8180
Kerala 2744 5784 418 86 37 52 102 283
Puducherry 75 403 100 9 3 0 1 4
All India 59964 292018 30881 9518 6742 7968 63651 41295
As on last reporting Friday of March
(Amount in ` Million)
Source : Annual returns on advances to priority sectors, Rural Planning and Credit Department, RBI.

92
TABLE 6.2 : STATE-WISE DISTRIBUTION OF OUTSTANDING ADVANCES OF SCHEDULED COMMERCIALBANKS TO AGRICULTRE - 2012 (Concld.)
State/Union TerritoryLoans to NGOs/MFIs for on-
lending to individual farmers ortheir SHGs/JLGs
Other types of indirect finance foragriculture & allied activities
No. ofAccounts
AmountOutstanding
No. ofAccounts
AmountOutstanding
(23) (24) (25) (26)
Northern Region 193 516 104915 179824
Delhi 8 379 4348 65751
Punjab 95 103 35371 40615
Haryana 39 18 15978 28872
Chandigarh 0 0 8516 10711
Jammu & Kashmir 5 1 2253 869
Himachal Pradesh 22 6 15090 5660
Rajasthan 24 10 23359 27346
North Eastern Region 87 1160 6894 4457
Assam 87 1160 5623 3245
Meghalaya 0 0 156 65
Mizoram 0 0 44 56
Arunachal Pradesh 0 0 111 105
Nagaland 0 0 95 422
Manipur 0 0 195 57
Tripura 0 0 670 506
Eastern Region 482 9991 66299 56623
Bihar 28 7 15385 10320
Jharkhand 65 52 7569 2635
West Bengal 166 8693 31006 32993
Odisha 212 1238 12252 10613
Sikkim 1 0 72 57
Andaman & Nicobar 10 0 15 7
Central Region 385 1672 63459 104006
Uttar Pradesh 273 1233 38130 54562
Uttarakhand 37 20 9454 4207
Madhya Pradesh 52 308 13041 37897
Chattisgarh 23 112 2834 7341
Western Region 243 298 71944 105066
Gujarat 41 130 9075 39887
Maharashtra 184 162 58650 64415
Daman & Diu 0 0 25 1
Goa 18 7 4120 760
Dadra & Nagar Haveli 0 0 74 3
Southern Region 6263 27997 262197 187736
Andhra Pradesh 1852 14700 41721 80157
Karnataka 426 5830 80189 30362
Lakshadweep 0 0 102 2
Tamil Nadu 2939 5652 66807 58747
Kerala 943 1783 72192 17778
Puducherry 103 32 1186 690
All India 7653 41635 575708 637711
As on last reporting Friday of March
(Amount in ` Million)
Source : Annual returns on advances to priority sectors, Rural Planning and Credit Department, RBI.

93
TABLE 6.3 : DISTRIBUTION OF OUTSTANDING ADVANCES OF PUBLIC SECTOR BANKS TO PRIORITY SECTORS - 2013
Bank group / Bank
As on the last reporting Friday of March
Adjusted Net BankCredit (ANBC)
Total Off-BalanceSheet Exposures
(OBE)
ANBC/OBE whichever is
higher
Total Priority Sector Advances (PSA) % of PSA to
ANBC/OBE(Target 40%)Number of
AccountsAmount
Outstanding(1) (2) (3) (4) (5) (6)=(5)/(3)*100
A. SBI and its Associates 10462 2310 10462 19.48 3899 37.26
State Bank of India 7591 1962 7591 14.16 2765 36.42
State Bank of Bikaner & Jaipur 500 32 500 1.00 208 41.61
State Bank of Hyderabad 771 .. 771 1.82 308 40.01
State Bank of Mysore 399 56 399 0.57 135 33.82
State Bank of Patiala 641 197 641 0.52 239 37.21
State Bank of Travancore 560 62 560 1.41 244 43.50
B. Nationalised Banks 24846 7497 24846 39.02 8938 35.97
Allahabad Bank 1081 91 1081 1.77 394 36.47
Andhra Bank 851 115 851 2.20 351 41.29
Bank of Baroda 2035 264 2035 2.35 799 39.28
Bank of India 1785 21 1785 3.31 655 36.71
Bank of Maharashtra 572 174 572 0.82 247 43.20
Canara Bank 2238 385 2238 4.83 790 35.30
Central Bank of India 1511 594 1511 2.81 513 33.92
Corporation Bank 1005 257 1005 0.97 380 37.78
Dena Bank 569 71 569 0.59 189 33.18
IDBI Bank Ltd. 1742 878 1742 0.36 388 22.30
Indian Bank 865 442 865 2.81 364 42.10
Indian Overseas Bank 1276 118 1276 2.89 511 40.03
Oriental Bank of Commerce 1120 200 1120 0.93 468 41.78
Punjab and Sind Bank 456 105 456 0.28 142 31.13
Punjab National Bank 2751 2837 2751 3.83 914 33.24
Syndicate Bank 1041 66 1041 2.46 464 44.62
UCO Bank 1088 485 1088 1.67 350 32.13
Union Bank of India 1636 315 1636 2.13 568 34.72
United Bank of India 639 .. 639 1.21 256 40.09
Vijaya Bank 587 79 587 0.80 195 33.23
Public Sector Banks (A+B) 35308 9807 35308 58.50 12837 36.36
(No. of Accounts in Million and Amount in ` Billion)
Quarterly returns on advances to priority sectors, Rural Planning and Credit Department, RBI.Source:Data are provisional.Note:

94
TABLE 6.4 : DISTRIBUTION OF OUTSTANDING ADVANCES OF PUBLIC SECTOR BANKS TO AGRICULTURE - 2013
Bank group / Bank
As on the last reporting Friday of March
Total Agricultural Advances
Direct Agricultural Advances
Indirect Agricultural Advances
Number ofAccounts
AmountOutstanding
Number ofAccounts
AmountOutstanding
Number ofAccounts
AmountOutstanding
(1) (2) (3) (4) (5) (6)
A. SBI and its Associates 15.25 1728 15.12 1507 0.13 221
State Bank of India 11.22 1248 11.10 1086 0.12 163
State Bank of Bikaner & Jaipur 0.76 92 0.76 83 0.00 9
State Bank of Hyderabad 1.46 145 1.45 111 0.01 34
State Bank of Mysore 0.41 63 0.41 58 0.00 6
State Bank of Patiala 0.35 76 0.35 70 0.00 6
State Bank of Travancore 1.05 103 1.04 100 0.00 3
B. Nationalised Banks 28.42 3578 27.77 2954 0.65 625
Allahabad Bank 1.36 177 1.32 137 0.04 40
Andhra Bank 1.71 165 1.70 145 0.00 20
Bank of Baroda 1.67 277 1.64 203 0.03 74
Bank of India 2.41 270 2.37 239 0.03 31
Bank of Maharashtra 0.51 80 0.50 64 0.01 16
Canara Bank 4.05 408 3.76 380 0.29 28
Central Bank of India 2.00 247 1.99 198 0.01 48
Corporation Bank 0.53 95 0.51 67 0.02 28
Dena Bank 0.40 67 0.39 53 0.01 14
IDBI Bank Ltd. 0.17 82 0.17 49 0.00 33
Indian Bank 1.97 170 1.96 158 0.01 12
Indian Overseas Bank 2.23 234 2.21 189 0.02 45
Oriental Bank of Commerce 0.59 179 0.57 139 0.02 40
Punjab and Sind Bank 0.17 52 0.17 47 0.00 5
Punjab National Bank 3.01 381 2.96 346 0.05 34
Syndicate Bank 1.66 202 1.61 160 0.05 41
UCO Bank 1.12 126 1.11 100 0.02 26
Union Bank of India 1.48 202 1.47 154 0.01 48
United Bank of India 0.87 96 0.84 67 0.03 28
Vijaya Bank 0.52 71 0.52 58 0.00 13
Public Sector Banks (A+B) 43.67 5307 42.89 4461 0.78 846
(No. of Accounts in Million and Amount in ` Billion)
Source: Quarterly returns on advances to priority sectors, Rural Planning and Credit Department, RBI.Note: Data are provisional.

95
TABLE 6.5: DISTRIBUTION OF OUTSTANDING ADVANCES OF PUBLIC SECTOR BANKS TO MICRO AND SMALLENTERPRISES, EDUCATION, HOUSING AND TO WEAKER SECTIONS UNDER PRIORITY SECTOR - 2013
Bank group / Bank
As on the last reporting Friday of March
Credit to Micro and Small Enterprises
(Direct+Indirect)Educational Loans Housing Loans
Loans to WeakerSections under
Priority SectorNumber ofAccounts
AmountOutstanding
Number ofAccounts
AmountOutstanding
Number ofAccounts
AmountOutstanding
Number ofAccounts
AmountOutstanding
(1) (2) (3) (4) (5) (6) (7) (8)
A. SBI and its Associates 1.74 1110 0.81 175 1.67 876 13.30 1133
State Bank of India 1.13 735 0.59 126 1.23 656 9.77 770
State Bank of Bikaner & Jaipur 0.15 81 0.02 6 0.07 29 0.78 77
State Bank of Hyderabad 0.16 86 0.05 11 0.14 66 1.17 81
State Bank of Mysore 0.08 38 0.03 6 0.05 28 0.37 54
State Bank of Patiala 0.09 113 0.01 3 0.07 37 0.35 59
State Bank of Travancore 0.13 57 0.11 24 0.13 60 0.85 91
B. Nationalised Banks 5.72 3675 1.66 335 2.25 1271 21.97 2340
Allahabad Bank 0.25 166 0.05 12 0.07 38 1.12 108
Andhra Bank 0.32 122 0.06 13 0.10 51 1.50 100
Bank of Baroda 0.37 398 0.09 19 0.21 104 1.39 140
Bank of India 0.45 289 0.12 23 0.16 68 2.12 181
Bank of Maharashtra 0.16 113 0.03 5 0.09 48 0.45 48
Canara Bank 0.32 264 0.22 43 0.14 71 3.03 262
Central Bank of India 0.49 173 0.11 25 0.15 65 1.48 155
Corporation Bank 0.20 186 0.06 12 0.10 80 0.50 78
Dena Bank 0.13 91 0.01 3 0.04 27 0.33 41
IDBI Bank Ltd. 0.03 142 0.01 2 0.15 155 0.14 54
Indian Bank 0.37 110 0.20 33 0.09 46 1.26 95
Indian Overseas Bank 0.34 200 0.20 29 0.07 35 0.21 132
Oriental Bank of Commerce 0.20 209 0.05 12 0.09 68 0.53 115
Punjab and Sind Bank 0.07 63 0.01 2 0.03 22 0.19 46
Punjab National Bank 0.44 397 0.15 34 0.16 88 2.44 276
Syndicate Bank 0.47 150 0.11 24 0.15 83 1.35 119
UCO Bank 0.38 164 0.06 12 0.11 47 1.06 103
Union Bank of India 0.33 241 0.09 19 0.18 101 1.49 150
United Bank of India 0.24 111 0.02 6 0.07 44 0.87 81
Vijaya Bank 0.16 84 0.03 7 0.07 30 0.50 56
Public Sector Banks (A+B) 7.46 4784 2.48 510 3.92 2148 35.27 3474
(No. of Accounts in Million and Amount in ` Billion)
Source: Quarterly returns on advances to priority sectors, Rural Planning and Credit Department, RBI.Note: Data are provisional.

96
(Amount in ` Billion)
As on March 31
Standard Advances Sub-Standard Advances Doubtful Advances
Bank group / Year Amount Per cent Amount Per cent Amount Per cent
(1) (2) (3) (4) (5) (6)
Public Sector Banks Standard AdvancesPercent Share Sub-Standard AdvancesPercent Share_2Doubtful AdvancesPercent Share_3Public Sector Banks
2008 16,564.51 97.67 168.46 0.99 190.83 1.13 2008
2009 20,546.01 97.90 195.21 0.93 207.08 0.99 2009
2010 24,551.47 97.72 276.85 1.10 246.79 0.98 2010
2011 29,888.72 97.68 336.12 1.10 319.55 1.04 2011
2012 34,379.00 96.83 603.76 1.70 470.75 1.33 2012
2013 38,999.85 96.16 765.89 1.89 734.85 1.81 2013
Private Sector Banks Standard AdvancesPercent Share Sub-Standard AdvancesPercent Share_2Doubtful AdvancesPercent Share_3Private Sector Banks
2008 4,597.22 97.25 72.81 1.54 44.53 0.94 2008
2009 5,031.87 96.75 105.27 2.02 50.18 0.96 2009
2010 5,677.23 97.03 86.78 1.48 65.43 1.12 2010
2011 7,149.78 97.55 44.00 0.60 107.36 1.46 2011
2012 8,628.96 97.92 51.33 0.58 103.16 1.17 2012
2013 10,266.73 98.09 58.54 0.56 110.69 1.06 2013
Foreign Banks Standard AdvancesPercent Share Sub-Standard AdvancesPercent Share_2Doubtful AdvancesPercent Share_3Foreign Banks
2008 1,598.82 98.09 19.63 1.20 7.68 0.47 2008
2009 1,624.20 95.70 58.74 3.46 10.04 0.59 2009
2010 1,603.11 95.74 49.30 2.94 14.41 0.86 2010
2011 1,942.57 97.46 18.65 0.94 21.13 1.06 2011
2012 2,284.40 97.32 20.78 0.89 22.32 0.95 2012
2013 2,606.39 97.03 28.82 1.07 27.51 1.02 2013
All Scheduled Commercial Banks Standard AdvancesPercent Share Sub-Standard AdvancesPercent Share_2Doubtful AdvancesPercent Share_3All Scheduled Commercial Banks
2008 22,760.54 97.61 260.89 1.12 243.04 1.04 2008
2009 27,202.08 97.55 359.22 1.29 267.30 0.96 2009
2010 31,831.81 97.49 412.93 1.26 326.64 1.00 2010
2011 38,981.07 97.64 398.77 1.00 448.04 1.12 2011
2012 45,292.36 97.06 675.87 1.45 596.23 1.28 2012
2013 51,872.97 96.58 853.25 1.59 873.05 1.63 2013
TABLE 7.1 : BANK GROUP-WISE CLASSIFICATION OF LOAN ASSETS OF SCHEDULED COMMERCIAL BANKS - 2008 TO 2013
Source : Department of Banking Supervision, RBI.

97
(Amount in ` Billion)
As on March 31 As on March 31
Loss Advances Gross NPAs Total Gross Advances
Bank group / Year Amount Per cent Amount Per cent Per cent
(8) (9) (10) (11) (12)
Public Sector Banks Loss Advances Percent Share_4Gross NPAs Percent Share_5 Total Gross Advances
2008 36.72 0.22 396.00 2.33 16,960.51
2009 38.03 0.18 440.32 2.10 20,986.33
2010 49.28 0.20 572.93 2.28 25,124.39
2011 55.14 0.18 710.80 2.32 30,599.53
2012 50.37 0.14 1,124.89 3.17 35,503.89
2013 58.15 0.14 1,558.90 3.84 40,558.74
Private Sector Banks Loss Advances Percent Share_4Gross NPAs Percent Share_5 Total Gross Advances
2008 12.44 0.26 129.78 2.75 4,727.00
2009 13.45 0.26 168.90 3.25 5,200.77
2010 21.66 0.37 173.87 2.97 5,851.10
2011 28.39 0.39 179.75 2.45 7,329.53
2012 28.72 0.33 183.21 2.08 8,812.16
2013 30.69 0.29 199.92 1.91 10,466.65
Foreign Banks Loss Advances Percent Share_4Gross NPAs Percent Share_5 Total Gross Advances
2008 3.87 0.24 31.17 1.91 1,629.99
2009 4.16 0.25 72.94 4.30 1,697.14
2010 7.57 0.45 71.28 4.26 1,674.39
2011 10.87 0.55 50.65 2.54 1,993.21
2012 19.82 0.84 62.92 2.68 2,347.32
2013 23.39 0.87 79.72 2.97 2,686.12
All Scheduled Commercial Banks Loss Advances Percent Share_4Gross NPAs Percent Share_5 Total Gross Advances
2008 53.02 0.23 556.95 2.39 23,317.50
2009 55.64 0.20 682.16 2.45 27,884.24
2010 78.51 0.24 818.08 2.51 32,649.89
2011 94.40 0.24 941.21 2.36 39,922.28
2012 98.92 0.21 1,371.02 2.94 46,663.37
2013 112.24 0.21 1,838.54 3.42 53,711.51
TABLE 7.1 : BANK GROUP-WISE CLASSIFICATION OF LOAN ASSETS OF SCHEDULED COMMERCIAL BANKS - 2008 TO 2013 (Concld.)
Source : Department of Banking Supervision, RBI.

98
TABLE 7.2 : COMPOSITION OF NPAs OF PUBLIC SECTOR BANKS - 2004 TO 2013
As on March 31
Bank group / Years Priority Sector Non-priority Sector Public Sector TotalAmount Percent
ShareAmount Percent
ShareAmount Percent
ShareAmount
(1) (2) (3) (4) (5) (6) (7)
Nationalised Banks
2004 167.05 47.74 178.95 51.14 3.90 1.11 349.90
2005 163.81 51.17 153.46 47.94 2.83 0.88 320.09
2006 151.24 53.66 122.53 43.48 8.08 2.87 281.85
2007 157.79 61.28 96.68 37.55 3.02 1.17 257.49
2008 163.85 67.21 77.93 31.96 2.02 0.83 243.80
2009 157.21 60.10 101.40 38.76 2.97 1.13 261.58
2010 199.06 56.13 152.77 43.08 2.80 0.79 354.62
2011 257.21 59.90 169.47 39.47 2.73 0.64 429.40
2012 322.90 48.34 343.13 51.37 1.92 0.29 667.95
2013 404.86 42.21 553.59 57.71 0.78 0.08 959.22
SBI Group
2004 71.36 47.07 78.03 51.48 2.20 1.45 151.59
2005 70.17 47.39 76.24 51.48 1.68 1.13 148.08
2006 72.50 54.95 58.19 44.10 1.25 0.95 131.93
2007 71.75 57.15 51.93 41.36 1.88 1.50 125.56
2008 89.02 58.49 62.22 40.88 0.97 0.63 152.20
2009 84.47 47.26 92.50 51.75 1.77 0.99 178.74
2010 109.40 50.11 106.46 48.77 2.44 1.12 218.31
2011 155.67 55.32 125.67 44.66 0.06 0.02 281.40
2012 239.11 52.33 217.59 47.62 0.25 0.05 456.94
2013 264.42 44.09 334.94 55.85 0.31 0.05 599.67
Public Sector Banks (A+B)
2004 238.40 47.54 256.98 51.24 6.10 1.22 501.48
2005 233.97 49.98 229.69 49.06 4.50 0.96 468.17
2006 223.74 54.07 180.72 43.68 9.32 2.25 413.78
2007 229.54 59.92 148.61 38.80 4.90 1.28 383.05
2008 252.87 63.85 140.15 35.39 2.99 0.75 396.00
2009 241.68 54.89 193.90 44.04 4.74 1.08 440.32
2010 308.46 53.84 259.23 45.25 5.24 0.91 572.93
2011 412.87 58.09 295.15 41.52 2.78 0.39 710.80
2012 562.01 49.96 560.71 49.85 2.17 0.19 1124.89
2013 669.28 42.93 888.53 57.00 1.08 0.07 1558.90
(Amount in ` Billion)
Source : Department of Banking Supervision, RBI.

99
TABLE 8.1 : INVESTMENTS OF SCHEDULED COMMERCIAL BANKS - 2011 TO 2012
Category
As on March 31
2011 2012
Amount Per centShares
Amount Per centShares
(1) (2) (3) (4)
I. Investment by offices in India18456.37 98.8 22158.48 99.1
A. Indian Government Securities14445.24 77.4 17776.67 79.5
(i) Central Government11423.29 61.2 14018.64 62.7
(ii) State Government3021.95 16.2 3758.03 16.8
B. Other Trustee Securities53.32 0.3 44.37 0.2
C. Other Domestic Investments3944.68 21.1 4302.87 19.2
(i) Fixed Deposits372.13 2.0 146.85 0.7
(ii) Shares and Debentures of joint Stock companies (Market Value) 1402.27 7.5 1755.40 7.8
(iii) Certificate of Deposits and Commercial Papers 1398.25 7.5 1286.55 5.8
(iv) Mutual Funds57.63 0.3 94.66 0.4
(v) Others @714.40 3.8 1019.41 4.6
D. Foreign Securities13.13 0.1 34.57 0.2
(i) Foreign Government Securities- - 4.42 0.0
(ii) Other Foreign Investments13.13 0.1 30.15 0.1
II. Investments by Foreign Offices of Indian Banks 215.63 1.2 204.83 0.9
(i) Indian securities- - - -
(ii) Foreign Countries Securities70.00 0.4 73.30 0.3
(iii) Other Investments145.62 0.8 131.54 0.6
Total 18672.00 100.0 22363.32 100.0
(Amount in ` Billion)
Notes: 1.'-' Nil or Negligible
2. @ Includes Investments in Debentures and Bonds of Quasi - Govt. Bodies, Venture Capital Funds, etc.
Source: Basic Statistical Return-5, RBI.
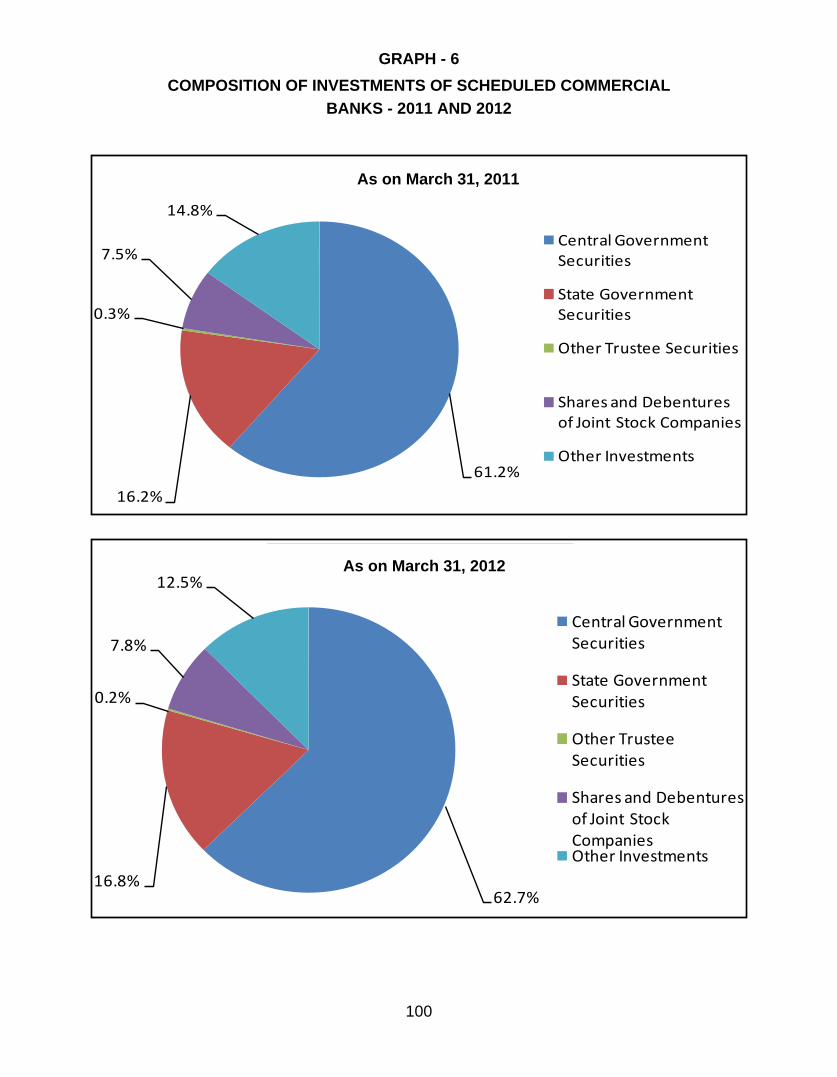
100
61.2%
16.2%
0.3%
7.5%
14.8%
As on March 31, 2011
Central Government Securities
State Government Securities
Other Trustee Securities
Shares and Debentures of Joint Stock Companies
Other Investments
62.7%16.8%
0.2%
7.8%
12.5% As on March 31, 2012
Central Government Securities
State Government Securities
Other Trustee Securities
Shares and Debentures of Joint Stock CompaniesOther Investments
GRAPH - 6COMPOSITION OF INVESTMENTS OF SCHEDULED COMMERCIAL
BANKS - 2011 AND 2012
As on March 31, 2011
As on March 31, 2012

101
TABLE 8.2 : STATE-WISE DISTRIBUTION OF SCHEDULED COMMERCIAL BANKS' INVESTMENTS INSTATE GOVERNMENT SECURITIES AND SHARES/DEBENTURES/BONDS OF STATE LEVEL
BODIES - 2011 AND 2012
State/Union Teritory
As on March 31
State Govt. Securities
Regional Rural Banks
Co-operative Institutions
State Electricity Boards
2011 2012 2011 2012 2011 2012 2011 2012
(1) (2) (3) (4) (5) (6) (7) (8)
Andhra Pradesh 308582 376118 566 511 15 - 150 -
Arunachal Pradesh 2154 2179 141 184 - - - -
Assam 44323 42274 101 122 - - 177 -
Bihar 85892 91665 2347 2576 - - 20 -
Chhattisgarh 14299 13738 427 466 - - 20 -
Goa 14935 18032 - - - - 20 -
Gujarat 257060 338412 290 167 1 - 400 -
Haryana 87346 125537 162 162 - - 114 -
Himachal Pradesh 52965 58969 54 54 - - 35 -
Jammu & Kashmir 40869 56327 623 861 - - 26 -
Jharkhand 48312 50967 524 473 - - - -
Karnataka 141251 173261 310 220 - - 28 -
Kerala 143271 207295 7 3 - - 67 -
Madhya Pradesh 104314 130720 953 1049 15 - 496 -
Maharashtra 356787 436407 791 62 - - 248 -
Manipur 6734 7515 4 4 - - - -
Meghalaya 7341 7659 9 9 - - 35 -
Mizoram 4774 4893 32 32 - - - -
Nagaland 11389 13301 20 38 - - - -
Odisha 23188 20175 876 2848 - - - -
Punjab 161920 201435 1236 79 - - 207 -
Rajasthan 195518 216217 505 602 - - 234 -
Sikkim 4295 4274 - - - - - -
Tamil Nadu 284750 366772 166 54 26 - 57 50
Tripura 6719 7223 4 4 - - - -
Uttar Pradesh 248495 330105 1179 939 - - 229 -
Uttarakhand 43012 50891 208 148 - - - -
West Bengal 311607 394834 321 402 - - 275 3570
Andaman & Nicobar - - - - - - - -
Chandigarh - - - - - - - -
Delhi - - - - - - - -
Daman & Diu - - - - - - - -
Lakshadweep - - - - - - - -
Puducherry 9848 10834 - - - - - -
Dadra & Nagar Haveli - - - - - - - -
All India 3021950 3758029 11856 12069 57 - 2838 3620
(Amount in ` Million)
Note : 1. Figures are inclusive of non-guaranteed bonds and unsecured debentures.
2. Data on State Government Securities are exclusive of loans matured but still held by the banks.
Source : Basic Statistical Return-5, RBI.

102
State/Union Teritory
As on March 31
Municipal Corp.Municipality and
Port Trusts
State FinancialCorporations
HousingBoards
State IndustrialDevelopmentCorporations
2011 2012 2011 2012 2011 2012 2011 2012
(9) (10) (11) (12) (13) (14) (15) (16)
Andhra Pradesh - - 662 420 12 - 137 150
Arunachal Pradesh 20 - 10 - - - - -
Assam - - 10 - - - - -
Bihar - - 42 - - - - -
Chhattisgarh - - 30 - - - - -
Goa - - 20 - - - - 115
Gujarat 165 50 30 8 - - 2 -
Haryana 15 - 193 120 - - 2 -
Himachal Pradesh 20 20 - 5 - - - -
Jammu & Kashmir - - 75 70 - - - -
Jharkhand - - - - - - - -
Karnataka 126 113 387 71 - - 145 333
Kerala 1 - 139 47 5 - 8 -
Madhya Pradesh 2 - 67 81 51 - 21 30
Maharashtra 263 77 243 - - - 34 -
Manipur 5 - - - - - - -
Meghalaya - - - - - - - -
Mizoram - - - - - - - -
Nagaland - - - 14 - - - -
Odisha - - 2 2 - - - -
Punjab - - 61 5 - - - 10
Rajasthan - - 386 125 25 - 65 52
Sikkim - - 15 - - - - -
Tamil Nadu 107 10 242 79 35 - 141 155
Tripura - - - - - - - 16
Uttar Pradesh 5 - 262 7 - - - -
Uttarakhand - - - - - - - -
West Bengal 110 - 41 - 8 - 28 -
Andaman & Nicobar - - - - - - - -
Chandigarh - - - - - - - -
Delhi - - - - - - - -
Daman & Diu - - - - - - - -
Lakshadweep - - - - - - - -
Puducherry - - - - - - 85 85
Dadra & Nagar Haveli - - - - - - - -
All India 839 270 2917 1054 136 - 668 946
TABLE 8.2 : STATE-WISE DISTRIBUTION OF SCHEDULED COMMERCIAL BANKS' INVESTMENTS INSTATE GOVERNMENT SECURITIES AND SHARES/DEBENTURES/BONDS OF STATE LEVEL
BODIES - 2011 AND 2012 (Contd.)(Amount in ` Million)
Note : 1. Figures are inclusive of non-guaranteed bonds and unsecured debentures.
2. Data on State Government Securities are exclusive of loans matured but still held by the banks.
Source : Basic Statistical Return-5, RBI.

103
State/Union Teritory
As on March 31
Road TransportCorporation
Other Govt. & QuasiGovt. Bodies Total
2011 2012 2011 2012 2011 2012
(17) (18) (19) (20) (21) (22)
Andhra Pradesh - - 106 40 310230 377239
Arunachal Pradesh - - - - 2325 2363
Assam - - - - 44611 42396
Bihar - - 1 - 88302 94241
Chhattisgarh - - - - 14776 14204
Goa - - - - 14975 18147
Gujarat - - 94 15 258042 338652
Haryana - - 18 - 87850 125819
Himachal Pradesh - - - - 53074 59048
Jammu & Kashmir - - 100 120 41693 57378
Jharkhand - - - - 48836 51440
Karnataka 2 - 93 38 142342 174036
Kerala 7 - 32 - 143537 207345
Madhya Pradesh - - 12 4 105931 131884
Maharashtra 201 - 458 - 359025 436546
Manipur - - - - 6743 7519
Meghalaya - - - - 7385 7668
Mizoram - - - - 4806 4925
Nagaland - - - - 11409 13353
Odisha - - 1 232 24067 23257
Punjab - - - - 163424 201529
Rajasthan - - 5 - 196738 216996
Sikkim - - - - 4310 4274
Tamil Nadu - - 531 328 286055 367448
Tripura - - - - 6723 7243
Uttar Pradesh - - 2 - 250172 331051
Uttarakhand - - - - 43220 51039
West Bengal - - 252 - 312642 398806
Andaman & Nicobar - - - - - -
Chandigarh - - - - - -
Delhi - - 5 - 5 -
Daman & Diu - - - - - -
Lakshadweep - - - - - -
Puducherry - - - - 9933 10919
Dadra & Nagar Haveli - - - - - -
All India 210 - 1710 777 3043181 3776765
TABLE 8.2 : STATE-WISE DISTRIBUTION OF SCHEDULED COMMERCIAL BANKS' INVESTMENTS INSTATE GOVERNMENT SECURITIES AND SHARES/DEBENTURES/BONDS OF STATE LEVEL
BODIES - 2011 AND 2012 (Concld.)(Amount in ` Million)
Notes : 1. Figures are inclusive of non-guaranteed bonds and unsecured debentures.
2. Data on State Government Securities are exclusive of loans matured but still held by the banks.
Source : Basic Statistical Return-5, RBI.

104
GRAPH - 7 EARNINGS, EXPENSES AND PROFITS OF SCHEDULED COMMERCIAL
BANKS 2007-08 TO 2012-13
3689
4637 49
44
5712
7416
8614
2853 35
28
3721 42
21
5679
6704
409
581
652
788
920
998
427
527
571
703
817
912
0
1000
2000
3000
4000
5000
6000
7000
8000
9000
10000
2007-08 2008-09 2009-10 2010-11 2011-12 2012-13
(`Bi
llion
)
Total Earnings Total Expenses Provisions & Contingencies Profit / Loss

105
62.6%
21.7%
1.7%
8.4%5.6%
2011-12Interest / Discount on advances / bills
Interest earned on investments
Other interest income
Commission, exchange and brokerage
Other non-interest income
65.8%
21.1%
1.5%7.1%
4.5%2012-13
Interest / Discount on advances / bills
Interest earned on investments
Other interest income
Commission, exchange and brokerage
Other non-interest income
61.5%
3.3%
6.0%
17.2%
12.0%
2011-12Interest paid on deposits
Interest paid on borrowings
Other interest expenses
Payments to and provisions for employeesOther operating expenses
66.8%
3.8%
5.3%
13.7%
10.4%
2012-13Interest paid on deposits
Interest paid on borrowings
Other interest expenses
Payments to and provisions for employeesOther operating expenses
Total Earnings = ` 7416 Billion Total Earnings = ` 8614 Billion
Total Expenses = ` 5679 Billion
* Excluding provisions and contingencies.
Total Expenses = ` 6704 Billion
GRAPH - 8 COMPOSITION OF MAJOR ITEMS IN TOTAL EARNINGS OF SCHEDULED
COMMERCIAL BANKS 2011-12 AND 2012-13
COMPOSITION OF MAJOR ITEMS IN TOTAL EXPENSES* OF SCHEDULED COMMERCIAL BANKS 2011-12 AND 2012-13

106
TABLE 9.1 : BANK GROUP-WISE EARNINGS AND EXPENSES OF SCHEDULED COMMERCIAL BANKSIN INDIA - 2011-12 AND 2012-13 AS ON MARCH 31
(Amount in ` Billion)
ItemsSBI and its Associates Nationalised
Banks $Public Sector
Banks2012 2013 2012 2013 2012 2013
(1) (2) (3) (4) (5) (6)
Number of reporting banks 6 6 20 20 26 26
I. Interest Earned 1435.55 1637.68 3411.77 3911.09 4847.32 5548.77
a) Interest/Discount earned on advances/bills 1102.25 1252.56 2599.36 2955.66 3701.61 4208.22
b) Income on investments 313.18 359.54 758.47 881.30 1071.65 1240.85
c) Interest on balances with RBI and other inter-bank funds 7.15 10.06 38.74 53.16 45.89 63.22
d) Others 12.97 15.51 15.20 20.96 28.17 36.48
II. Other Income 178.23 197.44 325.77 370.37 504.00 567.81
a) Commission, exchange and brokerage 147.70 141.15 133.87 143.40 281.58 284.54
b) Net profit (loss) on sale of investments -5.48 16.55 43.94 61.79 38.46 78.34
c) Net profit (loss) on revaluation of investments - -0.04 -1.06 0.19 -1.06 0.15
d) Net profit (loss) on sale of land building and other assets -0.47 -0.42 0.10 0.15 -0.37 -0.27
e) Net profit (loss) on exchange transactions 16.43 19.75 45.53 46.91 61.96 66.66
f) Miscellaneous income 20.05 20.46 103.38 119.41 123.43 139.87
Total (I+II) 1613.78 1835.12 3737.53 4281.46 5351.31 6116.58
III. Interest Expended 888.61 1065.33 2397.28 2813.96 3285.89 3879.29
a) Interest on deposits 791.79 962.66 2188.09 2602.31 2979.88 3564.97
b) Interest on RBI/ Inter - bank borrowings 42.80 46.46 77.66 78.53 120.46 125.00
c) Others 54.02 56.21 131.53 133.11 185.55 189.32
IV. Operating Expenses 327.30 370.94 574.75 647.18 902.05 1018.12
a) Payments to and provisions for employees 211.88 232.68 362.85 408.62 574.73 641.30
b) Rent, taxes and lighting 26.52 30.95 42.24 49.54 68.76 80.49
c) Printing and stationery 3.47 3.74 5.25 5.95 8.72 9.70
d) Advertisement and publicity 2.63 4.55 5.21 5.37 7.84 9.91
e) Depreciation on bank's property 12.83 14.54 22.49 25.01 35.32 39.55
f) Directors' fees, allowances and expenses 0.02 0.03 0.18 0.21 0.20 0.24
g) Auditors' fees and expenses 1.92 1.82 4.20 3.75 6.12 5.57
h) Law charges 1.43 1.58 2.43 2.58 3.85 4.16
i) Postage, telegrams, telephones, etc 4.92 5.80 7.90 8.58 12.82 14.38
j) Repairs and maintenance 4.41 4.73 11.77 12.97 16.18 17.70
k) Insurance 12.62 15.84 29.38 31.28 42.01 47.12
l) Other expenditure 44.65 54.67 80.85 93.33 125.51 148.00
V. Net Interest Income (I-III) 546.94 572.34 1014.49 1097.13 1561.43 1669.48
VI. Provisions and Contingencies 244.54 221.01 423.70 492.33 668.24 713.34
VII. Operating Profit (I+II-III-IV) 397.87 398.84 765.50 820.32 1163.37 1219.17
VIII. Profit (Loss) during the year 153.34 177.83 341.80 327.99 495.14 505.83
Notes : 1. $ Includes IDBI Bank Ltd.Source : Annual accounts of banks of respective years.

107
TABLE 9.1 : BANK GROUP-WISE EARNINGS AND EXPENSES OF SCHEDULED COMMERCIAL BANKSIN INDIA - 2011-12 AND 2012-13 AS ON MARCH 31 (Contd.)
(Amount in ` Billion)
Items
Old Private SectorBanks
New Private SectorBanks
Private SectorBanks
2012 2013 2012 2013 2012 2013(7) (8) (9) (10) (11) (12)
Number of reporting banks 13 13 7 7 20 20
I. Interest Earned 325.80 399.28 1019.75 1265.59 1345.56 1664.86
a) Interest/Discount earned on advances/bills 248.36 303.66 726.81 911.95 975.17 1215.61
b) Income on investments 74.42 91.30 269.87 327.85 344.29 419.14
c) Interest on balances with RBI and other inter-bank funds 2.53 3.80 7.85 10.69 10.39 14.48
d) Others 0.48 0.53 15.22 15.10 15.71 15.63
II. Other Income 33.95 41.45 216.53 256.48 250.48 297.93
a) Commission, exchange and brokerage 15.23 17.14 162.16 185.03 177.39 202.17
b) Net profit (loss) on sale of investments 2.94 7.14 4.87 16.66 7.81 23.81
c) Net profit (loss) on revaluation of investments - 0.11 -4.95 -0.94 -4.95 -0.82
d) Net profit (loss) on sale of land and other assets 0.10 0.02 0.17 0.34 0.27 0.36
e) Net profit (loss) on exchange transactions 4.33 4.45 35.89 37.27 40.22 41.72
f) Miscellaneous income 11.35 12.59 18.39 18.10 29.74 30.69
Total (I+II) 359.75 440.73 1236.28 1522.06 1596.03 1962.79
III. Interest Expended 225.06 278.60 642.79 792.73 867.84 1071.33
a) Interest on deposits 210.10 257.25 490.09 606.96 700.19 864.22
b) Interest on RBI/ Inter - bank borrowings 6.67 9.78 58.17 83.21 64.84 92.99
c) Others 8.29 11.57 94.52 102.56 102.81 114.13
IV. Operating Expenses 65.40 77.46 274.90 327.39 340.30 404.85
a) Payments to and provisions for employees 37.76 43.71 109.83 127.66 147.59 171.37
b) Rent, taxes and lighting 5.71 7.42 24.90 29.33 30.61 36.75
c) Printing and stationery 0.85 0.93 4.90 6.02 5.75 6.95
d) Advertisement and publicity 1.13 1.17 4.57 6.10 5.71 7.27
e) Depreciation on bank's property 3.38 4.21 16.54 17.65 19.92 21.86
f) Directors' fees, allowances and expenses 0.06 0.07 0.04 0.05 0.10 0.12
g) Auditors' fees and expenses 0.23 0.28 0.08 0.09 0.32 0.37
h) Law charges 0.18 0.19 1.28 1.51 1.46 1.71
i) Postage, telegrams, telephones, etc 1.31 1.50 9.09 10.43 10.40 11.94
j) Repairs and maintenance 1.57 1.89 18.96 22.53 20.52 24.42
k) Insurance 2.66 3.02 8.08 9.20 10.75 12.22
l) Other expenditure 10.55 13.07 76.62 96.81 87.17 109.88
V. Net Interest Income (I-III) 100.75 120.68 376.97 472.86 477.71 593.53
VI. Provisions and Contingencies 30.05 35.27 130.66 161.38 160.71 196.65
VII. Operating Profit (I+II-III-IV) 69.29 84.67 318.60 401.94 387.89 486.61
VIII. Profit (Loss) during the year 39.24 49.40 187.94 240.56 227.18 289.95
Source : Annual accounts of banks of respective years.

108
TABLE 9.1 : BANK GROUP-WISE EARNINGS AND EXPENSES OF SCHEDULED COMMERCIAL BANKSIN INDIA - 2011-12 AND 2012-13 AS ON MARCH 31 (Concld.)
(Amount in ` Billion)
ItemsForeign Banks All Scheduled Commercial
Banks2012 2013 2012 2013(13) (14) (15) (16)
Number of reporting banks 41 43 87 89
I. Interest Earned 359.97 422.49 6552.84 7636.12
a) Interest/Discount earned on advances/bills 204.29 235.71 4881.06 5659.54
b) Income on investments 146.88 174.24 1562.82 1834.23
c) Interest on balances with RBI and other inter-bank funds 11.16 11.47 67.44 89.18
d) Others -2.36 1.06 41.52 53.17
II. Other Income 108.96 112.13 863.44 977.87
a) Commission, exchange and brokerage 68.55 62.26 527.52 548.98
b) Net profit (loss) on sale of investments -11.37 4.79 34.90 106.93
c) Net profit (loss) on revaluation of investments 1.53 0.59 -4.48 -0.08
d) Net profit (loss) on sale of land and other assets 1.18 0.88 1.08 0.98
e) Net profit (loss) on exchange transactions 39.13 36.62 141.31 145.00
f) Miscellaneous income 9.93 6.99 163.10 177.54
Total (I+II) 468.92 534.61 7416.27 8613.98
III. Interest Expended 149.82 187.41 4303.56 5138.03
a) Interest on deposits 112.26 131.87 3792.33 4561.05
b) Interest on RBI/ Inter - bank borrowings 29.66 38.10 214.96 256.08
c) Others 7.90 17.44 296.26 320.89
IV. Operating Expenses 133.37 142.88 1375.72 1565.85
a) Payments to and provisions for employees 57.64 60.17 779.95 872.84
b) Rent, taxes and lighting 9.00 10.28 108.37 127.52
c) Printing and stationery 1.30 1.29 15.77 17.94
d) Advertisement and publicity 6.42 7.56 19.97 24.75
e) Depreciation on bank's property 4.53 4.59 59.77 65.99
f) Directors' fees, allowances and expenses - - 0.30 0.36
g) Auditors' fees and expenses 0.08 0.10 6.52 6.05
h) Law charges 1.40 1.24 6.71 7.11
i) Postage, telegrams, telephones, etc 6.03 6.40 29.26 32.71
j) Repairs and maintenance 4.44 5.00 41.14 47.11
k) Insurance 3.00 3.22 55.75 62.57
l) Other expenditure 39.53 43.04 252.20 300.92
V. Net Interest Income (I-III) 210.14 235.08 2249.28 2498.09
VI. Provisions and Contingencies 91.47 88.46 920.42 998.45
VII. Operating Profit (I+II-III-IV) 185.73 204.33 1737.00 1910.10
VIII. Profit (Loss) during the year 94.26 115.86 816.58 911.65
Source : Annual accounts of banks of respective years.

109
TABLE 10.1 - STATE-WISE DISTRIBUTION OF EMPLOYEES OF SCHEDULED COMMERCIAL BANKS - 2012
0 0
Region / State / Union Territory
Officers Clerks Sub-ordinates Total
Number Share (%) Number Share (%) Number Share (%) Number Share (%)
(1) (2) (3) (4) (5) (6) (7) (8)
NORTHERN REGION 100273 19.94 95944 19.93 33723 17.68 229940 19.57
Haryana 15540 15.50 12711 13.25 4919 14.59 33170 14.43 Himachal Pradesh 3527 3.52 3182 3.32 1875 5.56 8584 3.73 Jammu & Kashmir 5984 5.97 3935 4.10 2362 7.00 12281 5.34 Punjab 21853 21.79 40419 42.13 7451 22.09 69723 30.32 Rajasthan 19067 19.02 14770 15.39 7909 23.45 41746 18.16 Chandigarh 4025 4.01 2082 2.17 1128 3.34 7235 3.15 Delhi 30277 30.19 18845 19.64 8079 23.96 57201 24.88
NORTH-EASTERN REGION 10377 2.06 9442 1.96 5364 2.81 25183 2.14
Arunachal Pradesh 343 3.31 370 3.92 161 3.00 874 3.47 Assam 6980 67.26 6380 67.57 3434 64.02 16794 66.69 Manipur 352 3.39 360 3.81 133 2.48 845 3.36 Meghalaya 870 8.38 753 7.98 772 14.39 2395 9.51 Mizoram 297 2.86 318 3.37 155 2.89 770 3.06 Nagaland 506 4.88 377 3.99 261 4.87 1144 4.54 Tripura 1029 9.92 884 9.36 448 8.35 2361 9.38
EASTERN REGION 68271 13.57 106132 22.05 35185 18.44 209588 17.84
Bihar 15795 23.14 13607 12.82 7689 21.85 37091 17.70 Jharkhand 8521 12.48 7160 6.75 3295 9.36 18976 9.05 Sikkim 293 0.43 281 0.26 110 0.31 684 0.33 West Bengal 30760 45.06 71945 67.79 15712 44.66 118417 56.50 Odisha 12732 18.65 12954 12.21 8327 23.67 34013 16.23 Andaman & Nicobar Islands 170 0.25 185 0.17 52 0.15 407 0.19
CENTRAL REGION 76158 15.14 67906 14.11 33012 17.30 177076 15.07
Chhattisgarh 5842 7.67 4317 6.36 2014 6.10 12173 6.87 Madhya Pradesh 19240 25.26 17110 25.20 8363 25.33 44713 25.25 Uttar Pradesh 45746 60.07 41798 61.55 20151 61.04 107695 60.82 Uttarakhand 5330 7.00 4681 6.89 2484 7.52 12495 7.06
WESTERN REGION 111970 22.26 87752 18.23 37133 19.46 236855 20.16
Goa 2551 2.28 2174 2.48 762 2.05 5487 2.32 Gujarat 25342 22.63 23013 26.23 11143 30.01 59498 25.12 Maharashtra 83796 74.84 62357 71.06 25156 67.75 171309 72.33 Dadra & Nagar Haveli 157 0.14 101 0.12 34 0.09 292 0.12 Daman & Diu 124 0.11 107 0.12 38 0.10 269 0.11
SOUTHERN REGION 135889 27.02 114245 23.73 46373 24.31 296507 25.23
Andhra Pradesh 38203 28.11 28337 24.80 14332 30.91 80872 27.27 Karnataka 35874 26.40 28967 25.36 12058 26.00 76899 25.93 Kerala 22776 16.76 21306 18.65 6944 14.97 51026 17.21 Tamil Nadu 38295 28.18 34926 30.57 12786 27.57 86007 29.01 Lakshadweep 34 0.03 34 0.03 10 0.02 78 0.03 Puducherry 707 0.52 675 0.59 243 0.52 1625 0.55
ALL-INDIA 502938 100.00 481421 100.00 190790 100.00 1175149 100.00
Employees as on March 31
Source : Basic Statistical Returns of Scheduled Commercial Banks in India, Volume 41, March 2012, RBI.

110
TABLE 11.1 : CASH RESERVE RATIO AND INTEREST RATES - 2011-12 AND 2012-13
1 2 Base Rate Term Deposit Rate 5Fiscal Year Cash Reserve
RatioBank Rate Maximum Minimum Maximum Minimum Call Money
Rate(WeightedAverage)
(1) (2) (3) (4) (5) (6) (7)2011-12
Apr - 2011 6.00 6.00 9.50 8.50 9.50 7.75 6.86
May - 2011 6.00 6.00 10.00 9.25 9.10 7.75 7.40
Jun - 2011 6.00 6.00 10.00 9.25 9.10 8.25 7.67
Jul - 2011 6.00 6.00 10.75 9.50 9.25 8.50 7.82
Aug - 2011 6.00 6.00 10.75 10.00 9.50 8.50 7.96
Sep - 2011 6.00 6.00 10.75 10.00 9.25 8.50 8.27
Oct - 2011 6.00 6.00 10.75 10.00 9.25 8.50 8.41
Nov - 2011 6.00 6.00 10.75 10.00 9.25 8.50 8.67
Dec - 2011 6.00 6.00 10.75 10.00 9.25 8.50 9.12
Jan - 2012 6.00 6.00 10.75 10.00 9.25 8.50 8.96
Feb - 2012 5.50 9.50 10.75 10.00 9.25 8.50 8.73
Mar - 2012 4.75 9.50 10.75 10.00 9.25 8.50 9.952012-13
Apr - 2012 4.75 9.00 10.75 10.00 9.25 8.50 8.37
May - 2012 4.75 9.00 10.50 10.00 9.25 8.00 8.23
Jun - 2012 4.75 9.00 10.50 10.00 9.25 8.00 8.13
Jul - 2012 4.75 9.00 10.50 10.00 9.25 8.00 7.97
Aug - 2012 4.75 9.00 10.50 10.00 9.25 8.50 7.97
Sep - 2012 4.50 9.00 10.50 9.75 9.25 8.50 8.02
Oct - 2012 4.50 9.00 10.50 9.75 9.00 8.50 8.07
Nov - 2012 4.25 9.00 10.50 9.75 9.00 8.50 8.03
Dec - 2012 4.25 9.00 10.50 9.75 9.00 8.50 8.07
Jan - 2013 4.25 9.00 10.50 9.75 9.00 8.50 8.00
Feb - 2013 4.00 8.75 10.50 9.70 9.00 7.50 7.85
Mar - 2013 4.00 8.50 10.25 9.70 9.00 7.50 7.77
(in per cent)
Notes : 1. Cash Reserve Ratio relates to Scheduled Commercial Banks (excluding Regional Rural Banks).2. Base rate relates to five major banks.3. Term Deposit relates to five major banks for deposits of more than one year maturity.
4. Data cover 90-95 per cent of total transactions reported by major participants.Call Money Rate (Weighted Averages) is volume-weighted average of daily call money rates for the week (Saturday to Friday).
Source : Weekly Statistical Supplement, various issues, RBI.

111
TABLE 11.2 : CHEQUE CLEARANCES - 2010-11 TO 2012-13
Centres
As on March 31
2010-11 2011-12 2012-13
Number Amount Number Amount Number Amount
(1) (2) (3) (4) (5) (6)
1 Ahmedabad 62 4101 59 3990 57 3919
2 Bangalore 66 4741 65 4909 39 3216
3 Bhopal 7 635 6 591 6 541
4 Bhubaneswar 6 636 6 596 6 489
5 Chandigarh 13 1545 13 1427 11 1141
6 Chennai 79 5499 68 5032 123 8863
7 Guwahati 6 557 6 555 6 530
8 Hyderabad 41 3329 39 3439 28 2463
9 Jaipur 21 1385 20 1396 3 184
10 Jammu $ 3 192 3 194 19 1348
11 Kanpur 8 565 8 570 8 602
12 Kolkata 67 5393 63 4667 61 4588
13 Mumbai 247 17069 243 16283 230 15326
14 Nagpur 14 883 14 853 13 825
15 New Delhi 160 14391 160 13840 152 12917
16 Patna 6 666 7 628 5 622
17 Thiruvananthapuram 5 370 5 359 4 252
18 Other MICR Centres 341 21054 330 20868 327 21458
19 Total Non-MICR Centres 232 18329 227 18815 215 20898
Total 1387 101341 1342 99012 1314 100182
(Number in Million and Amount in ` Billion)
Source: Department of Payment and Settlement Systems, Reserve Bank of India.
$ Settlement of MICR Clearing is being done in the book of Reserve Bank of India effective November, 2009.
Note: (1) The data includes cheque clearing for both i. e. clearing houses managed by Reserve Bank Of India and clearing houses
managed by other banks. (2). Paper based inter-bank clearing has been discontinued at all the centres since June, 2005.The other MICR Centres are Agra,Allahabad, Amritsar, Aurangabad,Anand, Baroda, Belgaum, Bhavnagar, Bhilwara, Calicut, Coimbatore,Cuttak, Dehradun, Erode,Gorakhpur, Gwalior, Hubli, Indore, Jabalpur, Jalandhar, Jamshedpur, Jamnagar, Jodhpur, Kochi, Kolhapur, Kota, Lucknow,Ludhiana, Madurai, Mangalore, Mysore, Nasik, Panaji, Pune, Pondichery, Raipur, Rajkot, Ranchi, Salem, Surat, Sholapur, Thrissur, Tiruchirapalli, Tirunelvelli, Tirupur, Udaipur, Varanasi, Vijaywada and Vishakhapatnam.
100182
Source: Department of Payment and Settlement Systems, Reserve Bank of India.
$ Settlement of MICR Clearing is being done in the book of Reserve Bank of India effective November, 2009.
Notes: (1) The data include cheque clearing for both i. e. clearing houses managed by Reserve Bank of India and clearing houses
managed by other banks. (2). Paper based inter-bank clearing has been discontinued at all the centres since June, 2005.The other MICR Centres are Agra,Allahabad, Amritsar, Aurangabad, Anand, Baroda, Belgaum, Bhavnagar, Bhilwara, Calicut, Coimbatore, Cuttak, Dehradun, Erode,Gorakhpur, Gwalior, Hubli, Indore, Jabalpur, Jalandhar, Jamshedpur, Jamnagar, Jodhpur, Kochi, Kolhapur, Kota, Lucknow,Ludhiana, Madurai, Mangalore, Mysore, Nasik, Panaji, Pune, Pondichery, Raipur, Rajkot, Ranchi, Salem, Surat, Sholapur, Thrissur, Tiruchirapalli, Tirunelvelli, Tirupur, Udaipur, Varanasi, Vijaywada and Vishakhapatnam.
(Number in Million and Amount in ` Billion)
Source: Department of Payment and Settlement Systems, Reserve Bank of India.(3) $ Settlement of MICR Clearing is being done in the book of Reserve Bank of India effective November, 2009.
managed by other banks.
(Number in Million and Amount in ` Billion)
Source: Department of Payment and Settlement Systems, Reserve Bank of India.
$ Settlement of MICR Clearing is being done in the book of Reserve Bank of India effective November, 2009.
managed by other banks.
(Number in Million and Amount in ` Billion)

112
TABLE 11.3 : NUMBER OF CLEARING HOUSES - 1987 TO 2013
Number of clearing houses managed by (As on March 31)
YearReserve Bank
of IndiaState Bank
of IndiaAssociates
of State Bankof India
NationalisedBanks
Others Total
(1) (2) (3) (4) (5) (6)
1987 14 470 209 1 - 694
1988 14 499 215 1 - 729
1989 14 574 228 6 - 822
1990 14 575 240 6 - 835
1991 14 576 249 6 - 845
1992 14 576 250 6 - 846
1993 14 577 251 6 - 848
1994 14 577 253 6 - 850
1995 14 577 255 6 - 852
1996 14 577 262 6 - 859
1997 14 578 262 6 - 860
1998 14 592 270 6 - 882
1999 14 622 295 6 - 937
2000 14 647 316 7 - 984
2001 14 649 316 7 - 986
2002 14 672 332 7 - 1025
2003 16 672 332 7 - 1027
2004 16 (15) 684 (9) 327 (2) 18 (13) - 1045 (39)
2005 16 (15) 684 (10) 327 (2) 18 (13) - 1045 (40)
2006 16 (16) 659 (12) 324 (3) 31 (21) - 1030 (52)
2007 16 (16) 667 (17) 333 (4) 29 (22) - 1045 (59)
2008 16 (16) 703 (18) 335 (4) 40 (22) - 1094 (60)
2009 16 (16) 728 (19) 312 (4) 46 (25) 1( 0 ) 1103 (64)
2010 17 (17) 731 (19) 330 (4) 60 (26) 1( 0 ) 1139 (66)
2011 17 (17) 763 (20) 307 (3) 75 (26) 4( 0 ) 1166 (66)
2012 17 (17) 773 (20) 307 (3) 85 (26) 19( 0 ) 1201 (66)
2013 P 17(15+2*) 794 (20) 313 (3) 114 (26) 68( 0 ) 1306(64+2*)
Notes : 1. Figures in bracket indicate MICR Cheque processing Centres and Cheque Truncation System Centres.
2. P: Provisional.
* Cheque Truncation System (CTS) implemented in New Delhi and Chennai - grid (which includes some
of the clearing houses in the states of Andhra Pradesh, Karnataka, Kerala, Punjab (Ludhiana), Tamil Nadu,
West Bengal (Kolkata) and Union Territories of Puducherry and Chandigarh).
Source : Department of Payment and Settlement Systems, RBI.

113
TABLE 11.4 BANK GROUP-WISE AND OCCUPATION-WISE WEIGHTED AVERAGE LENDINGRATE AND DEPOSIT RATE - 2011 AND 2012
(in per cent)
Occupation
State Banks of Indiaand its Associates Nationalised Banks Public Sector Banks
2011 2012 2011 2012 2011 2012
(1) (2) (3) (4) (5) (6)
I. Agriculture 11.05 11.89 11.09 11.94 11.08 11.93
1. Direct Finance 11.39 11.90 11.35 11.94 11.36 11.93
2. Indirect Finance 9.80 11.85 10.54 11.96 10.41 11.94
II. Industry 11.75 13.23 11.81 12.87 11.79 12.98
1. Mining & Quarrying 10.45 12.40 11.17 12.57 10.94 12.52
2. Manufacturing & Processing 11.91 13.40 12.17 13.12 12.08 13.22
3. Electricity, Gas & Water 11.00 12.48 10.81 12.22 10.84 12.27
4. Construction 11.68 13.06 11.74 12.82 11.73 12.88
III. Transport Operators 11.60 12.97 11.60 11.99 11.60 12.20
IV. Professional and Other Services 12.39 14.37 12.44 13.50 12.43 13.63
V. Personal Loans 10.06 11.15 10.70 11.79 10.41 11.49
1. Loans for Purchase of Consumer Durables 12.32 11.25 11.44 13.00 11.45 12.95
2. Loans for Housing 9.39 10.33 10.16 11.19 9.79 10.78
3. Rest of the Personal Loans 11.23 12.54 11.53 12.64 11.41 12.59
VI. Trade 12.12 13.41 12.40 13.08 12.32 13.17
1. Wholesale Trade 11.50 12.88 11.90 13.06 11.78 13.00
2. Retail Trade 12.88 14.16 12.89 13.09 12.89 13.30
VII. Finance 10.01 11.21 9.88 11.21 9.90 11.21
VIII. All Others 11.52 13.36 11.02 12.46 11.03 12.48
Total Bank Credit 11.31 12.62 11.49 12.54 11.44 12.56
Weighted Average Deposit Rate of Term Deposits 8.16 9.09 8.23 9.20 8.24 9.17
Notes : 1. The data given here are based on the accounts with credit limit of over ` 0.2 million.
2. The data are exclusive of Inland & Foreign Bills purchased and discounted.
3. Amount outstanding figures are used as weights for calculating average lending rates.
4. The deposit data corresponds to only term deposits.
5. The data on average deposit rate for 2012 are based on 93549 reporting branches out of 96050 total
branches & that for 2011 based on 77710 reporting branches out of 84825 total branches having term deposits.
6. Mid-points of the interest rate range were taken as values and total deposit amount in the range as weights.
7. Group 'New private Sector Banks' contains Axis, HDFC, Developments Credit, ICICI, Indusind,
Kotak Mahindra and Yes Bank.
Source : Basic Statistical Returns 1 & 2, Department of Statistics and Information Management, RBI.
I
Source :

114
TABLE 11.4 BANK GROUP-WISE AND OCCUPATION-WISE WEIGHTED AVERAGE LENDINGRATE AND DEPOSIT RATE - 2011 AND 2012
(in per cent)
(Contd.)
Occupation
New PrivateSector Banks
Old PrivateSector Banks
Private SectorBanks
2011 2012 2011 2012 2011 2012
(7) (8) (9) (10) (11) (12)
I. Agriculture 10.90 12.10 11.85 12.49 11.09 12.18
1. Direct Finance 11.08 12.15 11.94 12.42 11.23 12.20
2. Indirect Finance 10.12 11.90 11.64 12.73 10.52 12.09
II. Industry 11.25 12.66 12.35 13.37 11.59 12.88
1. Mining & Quarrying 11.26 11.91 11.84 11.80 11.36 11.88
2. Manufacturing & Processing 10.83 12.43 12.68 13.59 11.41 12.79
3. Electricity, Gas & Water 11.50 12.89 10.94 12.77 11.35 12.86
4. Construction 12.06 13.13 11.99 13.27 12.04 13.18
III. Transport Operators 11.70 11.80 12.33 12.61 11.79 11.90
IV. Professional and Other Services 11.50 13.24 12.82 13.99 11.77 13.39
V. Personal Loans 12.24 13.08 11.88 12.48 12.16 12.94
1. Loans for Purchase of Consumer Durables 13.92 12.59 13.14 12.82 12.55 12.71
2. Loans for Housing 10.99 12.07 11.88 12.12 11.19 12.08
3. Rest of the Personal Loans 13.78 14.30 11.80 12.92 13.42 13.99
VI. Trade 11.70 12.89 13.12 13.33 12.39 13.11
1. Wholesale Trade 11.39 12.87 12.80 12.82 12.09 12.85
2. Retail Trade 11.98 12.92 13.45 13.76 12.69 13.37
VII. Finance 9.33 10.48 11.02 11.58 9.68 10.69
VIII. All Others 11.28 13.87 12.35 13.15 11.36 13.82
Total Bank Credit 11.30 12.65 12.29 13.06 11.54 12.75
Weighted Average Deposit Rate of Term Deposits 8.54 9.60 8.60 9.49 8.56 9.56
Notes : 1. The data given here are based on the accounts with credit limit of over ` 0.2 million.
2. The data are exclusive of Inland & Foreign Bills purchased and discounted.
3. Amount outstanding figures are used as weights for calculating average lending rates.
4. The deposit data corresponds to only term deposits.
5. The data on average deposit rate for 2012 are based on 93549 reporting branches out of 96050 total
branches & that for 2011 based on 77710 reporting branches out of 84825 total branches having term deposits.
6. Mid-points of the interest rate range were taken as values and total deposit amount in the range as weights.
7. Group 'New private Sector Banks' contains Axis, HDFC, Developments Credit, ICICI, Indusind,
Kotak Mahindra and Yes Bank.
Source : Basic Statistical Returns 1 & 2, Department of Statistics and Information Management, RBI. Source :
I

115
TABLE 11.4 BANK GROUP-WISE AND OCCUPATION-WISE WEIGHTED AVERAGE LENDINGRATE AND DEPOSIT RATE - 2011 AND 2012
(in per cent)
(Concld.)
Occupation
Foreign Banks Regional RuralBanks
All ScheduledCommercial Banks
2011 2012 2011 2012 2011 2012
(13) (14) (15) (16) (17) (18)
I. Agriculture 10.36 12.44 11.87 11.88 11.11 11.98
1. Direct Finance 9.48 13.20 11.88 11.83 11.36 11.98
2. Indirect Finance 10.73 12.29 11.69 12.34 10.44 11.97
II. Industry 9.96 10.59 12.25 12.84 11.68 12.85
1. Mining & Quarrying 10.41 9.07 12.70 12.27 10.98 12.25
2. Manufacturing & Processing 9.85 10.42 12.52 13.29 11.85 12.99
3. Electricity, Gas & Water 10.01 11.79 11.98 11.99 10.88 12.31
4. Construction 10.54 11.68 11.93 12.48 11.75 12.89
III. Transport Operators 10.09 11.95 12.55 13.20 11.64 12.10
IV. Professional and Other Services 11.03 12.94 12.60 12.87 12.18 13.51
V. Personal Loans 14.69 14.66 11.60 12.17 11.09 11.94
1. Loans for Purchase of Consumer Durables 8.98 17.25 12.85 13.36 11.93 13.02
2. Loans for Housing 12.13 12.55 10.94 11.30 10.27 11.13
3. Rest of the Personal Loans 20.39 23.42 12.29 12.79 12.36 13.14
VI. Trade 10.48 11.56 12.64 13.68 12.28 13.11
1. Wholesale Trade 9.24 10.70 12.58 12.66 11.71 12.87
2. Retail Trade 12.18 12.90 12.65 13.81 12.82 13.31
VII. Finance 8.97 11.74 11.56 13.57 9.80 11.14
VIII. All Others 10.77 11.39 10.87 14.81 11.14 13.29
Total Bank Credit 10.93 11.75 11.86 12.81 11.44 12.57
Weighted Average Deposit Rate of Term Deposits 7.30 7.98 8.42 9.01 8.29 9.19
Notes : 1. The data given here are based on the accounts with credit limit of over ` 0.2 million.
2. The data are exclusive of Inland & Foreign Bills purchased and discounted.
3. Amount outstanding figures are used as weights for calculating average lending rates.
4. The deposit data corresponds to only term deposits.
5. The data on average deposit rate for 2012 are based on 93549 reporting branches out of 96050 total
branches & that for 2011 based on 77710 reporting branches out of 84825 total branches having term deposits.
6. Mid-points of the interest rate range were taken as values and total deposit amount in the range as weights.
7. Group 'New private Sector Banks' contains Axis, HDFC, Developments Credit, ICICI, Indusind,
Kotak Mahindra and Yes Bank.
Source : Basic Statistical Returns 1 & 2, Department of Statistics and Information Management, RBI. Source :
I

116
TABLE 11.5 : BANK GROUP-WISE INSURED DEPOSITS 2011-12 AND 2012-13
(Amount in ` Billion)
As on September 30, 2011
Bank GroupNo. of
InsuredBanks
TotalAssessable
Deposits
TotalInsured
Deposits
Percentage ofInsured Deposits={ (3) / (2) * 100 }
(1) (2) (3) (4)
1. SBI and its Associates 6 11546 4046 35
2. Nationalised Banks $ 20 27956 8797 31
3. Public Sector Banks { (1) + (2) } 26 39501 12842 33
4. Private Sector Banks 20 9958 2336 23
5. Foreign Banks 41 2650 221 8
6. Regional Rural Banks 82 1522 1120 74
7. Co-operative Banks 2026 4033 2518 62
8. Local Area Banks 4 10 5 49
Total 2199 57674 19043 33
(Amount in ` Billion)
As on September 30, 2012
Bank GroupNo. of
InsuredBanks
TotalAssessable
Deposits
TotalInsured
Deposits
Percentage ofInsured Deposits={ (3) / (2) * 100 }
(1) (2) (3) (4)
1. SBI and its Associates 6 13513 5365 40
2. Nationalised Banks $ 20 31521 9286 29
3. Public Sector Banks { (1) + (2) } 26 45034 14651 33
4. Private Sector Banks 20 11822 2749 23
5. Foreign Banks 43 2851 235 8
6. Regional Rural Banks 67 1889 1324 70
7. Co-operative Banks 2007 4602 2619 57
8. Local Area Banks 4 12 5 42
Total 2167 66210 21583 33
Note : $ includes IDBI Bank Ltd.
Source : Deposit Insurance and Credit Guarantee Corporation.

117
Bank Group
SBI and its Associates Nationalised Banks Old Private Sector Banks
2012 2013 2012 2013 2012 2013
(1) (2) (3) (4) (5) (6)
1. Foreign exchange contracts (outstanding) 4,565.35 5,098.53 9,405.56 12,072.27 1,559.46 1,618.02
1.1 Forward forex contracts 4,482.39 5,050.81 9,370.93 12,061.44 1,524.22 1,560.7
1.2 Currency options purchased 82.96 47.72 34.62 10.83 35.23 57.32
2. Futures & Swaps 202.74 215.73 211.16 164.8 67.44 48.93
2.1 Currency futures 0.12 1.4 96.34 0.62 - 0.16
2.2 Cross currency interest rate swaps 202.62 214.33 114.82 164.18 67.44 48.77
3. Interest rate related contracts 614.56 669.39 515.85 605.36 219.17 210.71
3.1 Forward rate agreements 2.49 4.61 - - - -
3.2 Interest rate options - - - - - -
3.3 Interest rate futures - - - - - -
3.4 Single currency interest rate swaps 612.06 664.79 515.85 605.36 217.64 210.71
3.5 Basis swaps - - - - 1.53 -
Total -Contracts/Derivatives 5,382.65 5,983.65 10,132.56 12,842.43 1,846.07 1,877.66
TABLE 11.6 : BANK GROUP-WISE AND INSTRUMENT-WISE DERIVATIVES OFSCHEDULED COMMERCIAL BANKS IN INDIA AS AT END MARCH 2012 AND 2013
Source:
Bank Group
New Private Sector Banks Foreign Banks All Scheduled CommercialBanks
2012 2013 2012 2013 2012 2013
(1) (2) (3) (4) (5) (6)
1. Foreign exchange contracts (outstanding) 13,441.08 12,180.88 40,994.04 33,204.04 69,965.49 64,173.74
1.1 Forward forex contracts 12,978.22 11,854.37 38,307.11 31,793.07 66,662.88 62,320.38
1.2 Currency options purchased 462.86 326.51 2,686.94 1,410.97 3,302.61 1,853.35
2. Futures & Swaps 560.44 670.16 3,244.36 3,238.08 4,286.14 4,337.69
2.1 Currency futures 0.17 6.84 62.46 26.59 159.09 35.62
2.2 Cross currency interest rate swaps 560.26 663.32 3,181.9 3,211.48 4,127.05 4,302.07
3. Interest rate related contracts 6,378.3 6,426.79 45,225.67 36,225.78 52,953.54 44,138.04
3.1 Forward rate agreements 8.73 1.13 21.92 49.48 33.14 55.22
3.2 Interest rate options 42.99 20.76 311.42 218.55 354.41 239.31
3.3 Interest rate futures - - - - - -
3.4 Single currency interest rate swaps 6,317.76 6,393.18 44,839.22 35,891.54 52,502.53 43,765.58
3.5 Basis swaps 8.82 11.72 53.11 66.21 63.46 77.92
Total -Contracts/Derivatives 20,379.81 19,277.83 89,464.08 72,667.89 127,205.16 112,649.46
(Amount in ` Billion)
Department of Banking Supervision, RBI.

Bank-wise Tables
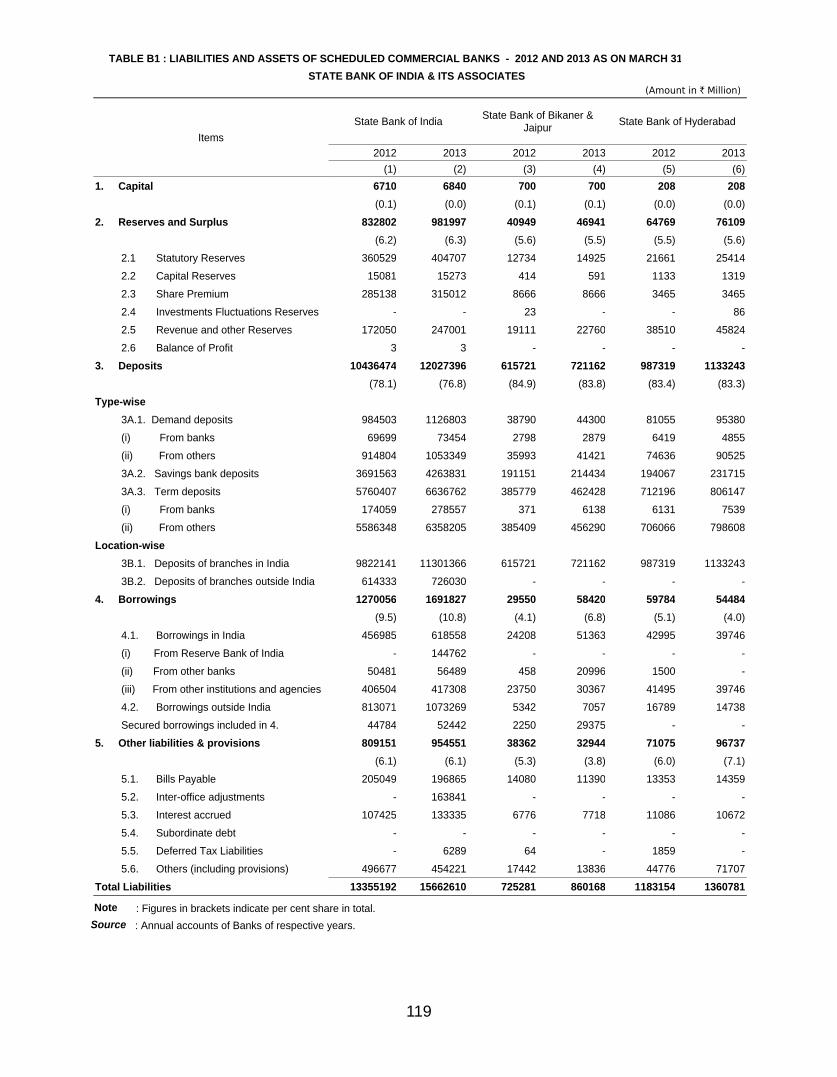
119
TABLE B1 : LIABILITIES AND ASSETS OF SCHEDULED COMMERCIAL BANKS - 2012 AND 2013 AS ON MARCH 31STATE BANK OF INDIA & ITS ASSOCIATES
(Amount in ` Million)
ItemsState Bank of India State Bank of Bikaner &
Jaipur State Bank of Hyderabad
2012 2013 2012 2013 2012 2013(1) (2) (3) (4) (5) (6)
1. Capital 6710 6840 700 700 208 208(0.1) (0.0) (0.1) (0.1) (0.0) (0.0)
2. Reserves and Surplus 832802 981997 40949 46941 64769 76109(6.2) (6.3) (5.6) (5.5) (5.5) (5.6)
2.1 Statutory Reserves 360529 404707 12734 14925 21661 25414
2.2 Capital Reserves 15081 15273 414 591 1133 1319
2.3 Share Premium 285138 315012 8666 8666 3465 3465
2.4 Investments Fluctuations Reserves - - 23 - - 86
2.5 Revenue and other Reserves 172050 247001 19111 22760 38510 45824
2.6 Balance of Profit 3 3 - - - -
3. Deposits 10436474 12027396 615721 721162 987319 1133243(78.1) (76.8) (84.9) (83.8) (83.4) (83.3)
Type-wise 3A.1. Demand deposits 984503 1126803 38790 44300 81055 95380
(i) From banks 69699 73454 2798 2879 6419 4855
(ii) From others 914804 1053349 35993 41421 74636 90525
3A.2. Savings bank deposits 3691563 4263831 191151 214434 194067 231715
3A.3. Term deposits 5760407 6636762 385779 462428 712196 806147
(i) From banks 174059 278557 371 6138 6131 7539
(ii) From others 5586348 6358205 385409 456290 706066 798608
Location-wise 3B.1. Deposits of branches in India 9822141 11301366 615721 721162 987319 1133243
3B.2. Deposits of branches outside India 614333 726030 - - - -
4. Borrowings 1270056 1691827 29550 58420 59784 54484(9.5) (10.8) (4.1) (6.8) (5.1) (4.0)
4.1. Borrowings in India 456985 618558 24208 51363 42995 39746
(i) From Reserve Bank of India - 144762 - - - -
(ii) From other banks 50481 56489 458 20996 1500 -
(iii) From other institutions and agencies 406504 417308 23750 30367 41495 39746
4.2. Borrowings outside India 813071 1073269 5342 7057 16789 14738
Secured borrowings included in 4. 44784 52442 2250 29375 - -
5. Other liabilities & provisions 809151 954551 38362 32944 71075 96737(6.1) (6.1) (5.3) (3.8) (6.0) (7.1)
5.1. Bills Payable 205049 196865 14080 11390 13353 14359
5.2. Inter-office adjustments - 163841 - - - -
5.3. Interest accrued 107425 133335 6776 7718 11086 10672
5.4. Subordinate debt - - - - - -
5.5. Deferred Tax Liabilities - 6289 64 - 1859 -
5.6. Others (including provisions) 496677 454221 17442 13836 44776 71707
Total Liabilities 13355192 15662610 725281 860168 1183154 1360781
Source : Annual accounts of Banks of respective years.
Note : Figures in brackets indicate per cent share in total.

120
TABLE B1 : LIABILITIES AND ASSETS OF SCHEDULED COMMERCIAL BANKS - 2012 AND 2013 AS ON MARCH 31STATE BANK OF INDIA & ITS ASSOCIATES
(Amount in ` Million)
(Contd.)
ItemsState Bank of Mysore State Bank of Patiala State Bank of Travancore
2012 2013 2012 2013 2012 2013(7) (8) (9) (10) (11) (12)
1. Capital 468 468 2948 2948 500 500(0.1) (0.1) (0.3) (0.3) (0.1) (0.0)
2. Reserves and Surplus 39417 42857 44862 50472 38162 43150(6.5) (6.4) (4.6) (4.6) (4.4) (4.2)
2.1 Statutory Reserves 13350 14390 17521 19188 13377 14915 2.2 Capital Reserves 2027 2225 231 290 815 961 2.3 Share Premium 6305 6305 1500 1500 1425 1425 2.4 Investments Fluctuations Reserves 135 135 - 192 101 101 2.5 Revenue and other Reserves 17600 19801 25611 29303 22374 25734 2.6 Balance of Profit - - - - 69 143. Deposits 501863 569690 794166 886721 714698 846237
(83.1) (84.7) (80.6) (81.7) (83.1) (83.3)Type-wise 3A.1. Demand deposits 31300 28569 33979 39440 26917 26505 (i) From banks 2565 1904 1913 1256 3106 2761 (ii) From others 28735 26665 32065 38184 23811 23745 3A.2. Savings bank deposits 130335 151154 160973 183400 168450 191713 3A.3. Term deposits 340228 389967 599214 663881 519331 628019 (i) From banks 2669 702 711 1306 1941 3015 (ii) From others 337559 389265 598503 662575 517390 625004Location-wise 3B.1. Deposits of branches in India 501863 569690 794166 886721 714698 846237 3B.2. Deposits of branches outside India - - - - - -4. Borrowings 44256 38542 108099 88406 76073 87472
(7.3) (5.7) (11.0) (8.1) (8.8) (8.6) 4.1. Borrowings in India 37744 35285 99298 75906 59220 71023 (i) From Reserve Bank of India 5600 2800 1000 11140 - - (ii) From other banks 7000 - 34276 - - 4000 (iii) From other institutions and agencies 25144 32485 64022 64766 59220 67023 4.2. Borrowings outside India 6512 3257 8801 12500 16853 16448 Secured borrowings included in 4. 11894 19235 - - - -5. Other liabilities & provisions 18032 20770 35196 56960 30434 38435
(3.0) (3.1) (3.6) (5.2) (3.5) (3.8) 5.1. Bills Payable 3330 3715 4951 5103 9577 12099 5.2. Inter-office adjustments - - - - - - 5.3. Interest accrued 6839 7095 9015 10689 8620 9492 5.4. Subordinate debt - - - - - - 5.5. Deferred Tax Liabilities - - 1325 895 - - 5.6. Others (including provisions) 7862 9960 19905 40274 12236 16844Total Liabilities 604036 672328 985271 1085506 859867 1015793

121
TABLE B1 : LIABILITIES AND ASSETS OF SCHEDULED COMMERCIAL BANKS - 2012 AND 2013 AS ON MARCH 31STATE BANK OF INDIA & ITS ASSOCIATES
(Amount in ` Million)
ItemsState Bank of India State Bank of Bikaner &
Jaipur State Bank of Hyderabad
2012 2013 2012 2013 2012 2013(1) (2) (3) (4) (5) (6)
1. Cash in hand 111864 115522 3514 3530 5438 5102(0.8) (0.7) (0.5) (0.4) (0.5) (0.4)
2. Balances with RBI 428896 542782 39857 58029 51935 58658(3.2) (3.5) (5.5) (6.7) (4.4) (4.3)
3. Balances with banks in India 46320 36667 193 308 9133 6919(0.3) (0.2) (0.0) (0.0) (0.8) (0.5)
4. Money at call and short notice 143830 151660 - - 23067 7000(1.1) (1.0) (0.0) (0.0) (1.9) (0.5)
5. Balances with banks outside India 240722 301571 980 1499 509 277(1.8) (1.9) (0.1) (0.2) (0.0) (0.0)
6. Investments 3121976 3509273 166695 201459 292418 339680(23.4) (22.4) (23.0) (23.4) (24.7) (25.0)
6.1. Investments in India 3010210 3402545 166695 201459 292418 339680 (i) Government securities 2558336 2692602 161709 176734 270154 317510 (ii) Other approved securities 61 - 137 49 5 - (iii) Shares 33376 38658 1434 1602 2777 2800 (iv) Debentures and Bonds 129991 290551 935 598 5457 6125 (v) Subsidiaries and/or joint ventures 54610 54651 138 372 63 63 (vi) Others 233835 326082 2342 22104 13962 13181 6.2. Investments outside India 111766 106728 - - - - (i) Government securities 18663 28604 - - - - (ii) Subsidiaries and/or joint ventures 16028 16028 - - - - (iii) Others 77076 62097 - - - -7. Advances 8675789 10456166 492443 575350 770523 898565
(65.0) (66.8) (67.9) (66.9) (65.1) (66.0)Type-wise 7A.1. Bills purchased and discounted 771386 886679 18602 16883 15311 17026 7A.2. Cash credits, overdrafts & loans 3741432 4654518 208384 266122 320842 384110 7A.3. Term loans 4162970 4914969 265458 292345 434370 497429Security-wise 7B.1. Secured by tangible assets 6245445 7703422 404201 481546 669674 787387 7B.2. Covered by Bank/Govt. Guarantees 785552 937125 18526 35357 9035 2001 7B.3. Unsecured 1644792 1815619 69716 58446 91814 109177Sector-wise 7C.I. Advances in India 7335013 8782089 492443 575350 770523 898565 (i) Priority sectors 2501770 2643139 174085 203130 266088 303006 (ii) Public sectors 547073 546702 44146 33531 39997 60318 (iii) Banks 1804 688 1 2400 4 30 (iv) others 4284366 5591561 274211 336289 464434 535212 7C.II. Advances outside India 1340776 1674076 - - - -8. Fixed Assets 54665 70050 2021 2313 4374 4725
(0.4) (0.4) (0.3) (0.3) (0.4) (0.3) 8.1. Premises 12832 18746 368 349 1281 1267 8.2. Fixed assets under construction 3327 4093 3 1 58 347 8.3. Other Fixed assets 38507 47212 1651 1963 3036 31119. Other Assets 531130 478920 19579 17681 25757 39855
(4.0) (3.1) (2.7) (2.1) (2.2) (2.9) 9.1. Inter-office adjustments (net) 15739 - 1904 2751 2771 8219 9.2. Interest accrued 110139 120907 6631 7667 11591 11540 9.3. Tax paid 82408 53337 2228 463 5089 7068 9.4. Stationery and Stamps 980 978 50 50 79 78 9.5. Others 321864 303699 8767 6749 6228 12950Total Assets 13355192 15662610 725281 860168 1183154 1360781
Note : Figures in brackets indicate per cent share in total.
Source : Annual accounts of Banks of respective years

122
TABLE B1 : LIABILITIES AND ASSETS OF SCHEDULED COMMERCIAL BANKS - 2012 AND 2013 AS ON MARCH 31STATE BANK OF INDIA & ITS ASSOCIATES
(Amount in ` Million)
(Contd.)
ItemsState Bank of Mysore State Bank of Patiala State Bank of Travancore
2012 2013 2012 2013 2012 2013(7) (8) (9) (10) (11) (12)
1. Cash in hand 2540 2451 2463 2978 3887 3553(0.4) (0.4) (0.2) (0.3) (0.5) (0.3)
2. Balances with RBI 27719 21596 68886 37094 43879 41887(4.6) (3.2) (7.0) (3.4) (5.1) (4.1)
3. Balances with banks in India 209 218 532 597 1126 693(0.0) (0.0) (0.1) (0.1) (0.1) (0.1)
4. Money at call and short notice 2000 9581 3000 - 9274 -(0.3) (1.4) (0.3) (0.0) (1.1) (0.0)
5. Balances with banks outside India 1159 1201 250 - - 1544(0.2) (0.2) (0.0) (0.0) (0.0) (0.2)
6. Investments 147327 167746 220429 239567 224376 272255(24.4) (25.0) (22.4) (22.1) (26.1) (26.8)
6.1. Investments in India 147327 167746 220429 239567 224376 272255 (i) Government securities 129715 144602 192643 200426 181896 233631 (ii) Other approved securities - - - - - - (iii) Shares 805 771 1468 1414 1285 1711 (iv) Debentures and Bonds 1717 2139 1671 2182 3887 3682 (v) Subsidiaries and/or joint ventures 104 189 4 4 - - (vi) Others 14987 20045 24645 35541 37309 33231 6.2. Investments outside India - - - - - - (i) Government securities - - - - - - (ii) Subsidiaries and/or joint ventures - - - - - - (iii) Others - - - - - -7. Advances 398353 449326 629345 737998 553460 674836
(65.9) (66.8) (63.9) (68.0) (64.4) (66.4)Type-wise 7A.1. Bills purchased and discounted 19256 17647 20467 22728 43128 45881 7A.2. Cash credits, overdrafts & loans 159123 176875 282854 343088 245237 293155 7A.3. Term loans 219974 254804 326023 372182 265094 335800Security-wise 7B.1. Secured by tangible assets 334869 395197 598568 688062 452537 576446 7B.2. Covered by Bank/Govt. Guarantees 9737 7055 229 9678 10238 12895 7B.3. Unsecured 53747 47074 30548 40258 90684 85495Sector-wise 7C.I. Advances in India 398353 449326 629345 737998 553460 674836 (i) Priority sectors 112583 134152 202852 231215 200424 244986 (ii) Public sectors 33130 31483 31116 45222 24934 19113 (iii) Banks - - 3 - - - (iv) others 252640 283690 395374 461560 328102 410737 7C.II. Advances outside India - - - - - -8. Fixed Assets 7494 8243 3177 3415 2433 2863
(1.2) (1.2) (0.3) (0.3) (0.3) (0.3) 8.1. Premises 6347 6508 1283 1328 551 633 8.2. Fixed assets under construction 75 63 8 19 - - 8.3. Other Fixed assets 1072 1671 1886 2067 1882 22309. Other Assets 17234 11966 57189 63857 21432 18162
(2.9) (1.8) (5.8) (5.9) (2.5) (1.8) 9.1. Inter-office adjustments (net) 3486 785 6166 1469 1377 105 9.2. Interest accrued 3755 4459 6025 6459 7100 8269 9.3. Tax paid 2358 2380 2438 4114 2728 2938 9.4. Stationery and Stamps 48 43 32 29 41 41 9.5. Others 7588 4298 42529 51787 10186 6809Total Assets 604036 672328 985271 1085506 859867 1015793

123
TABLE B1 : LIABILITIES AND ASSETS OF SCHEDULED COMMERCIAL BANKS - 2012 AND 2013 AS ON MARCH 31NATIONALISED BANKS
(Amount in ` Million)
(Contd.)
ItemsAllahabad Bank Andhra Bank Bank of Baroda
2012 2013 2012 2013 2012 2013(1) (2) (3) (4) (5) (6)
1. Capital 5000 5000 5596 5596 4124 4225(0.3) (0.2) (0.4) (0.4) (0.1) (0.1)
2. Reserves and Surplus 100066 108525 69198 78816 270645 315469(5.5) (5.3) (5.6) (5.4) (6.1) (5.8)
2.1 Statutory Reserves 24574 27544 20262 23485 58639 69841
2.2 Capital Reserves 12229 12504 3480 3594 19749 19869
2.3 Share Premium 17961 17961 17784 17784 63327 71726
2.4 Investments Fluctuations Reserves - 891 - - - -
2.5 Revenue and other Reserves 43463 47332 26681 32973 128929 154033
2.6 Balance of Profit 1839 2293 991 980 - -
3. Deposits 1595931 1787416 1058512 1237956 3848711 4738833(87.2) (87.5) (85.0) (84.6) (86.0) (86.6)
Type-wise 3A.1. Demand deposits 95377 99544 63690 70286 289444 356783
(i) From banks 342 496 418 379 11244 14050
(ii) From others 95035 99047 63272 69907 278199 342733
3A.2. Savings bank deposits 391300 449753 215783 247303 745795 843026
3A.3. Term deposits 1109254 1238119 779039 920367 2813472 3539024
(i) From banks 14684 17622 474 438 529071 724220
(ii) From others 1094570 1220497 778565 919929 2284402 2814804
Location-wise 3B.1. Deposits of branches in India 1589887 1776708 1058512 1237956 2801353 3417056
3B.2. Deposits of branches outside India 6044 10708 - - 1047359 1321777
4. Borrowings 90945 100976 82406 111193 235731 265793(5.0) (4.9) (6.6) (7.6) (5.3) (4.9)
4.1. Borrowings in India 42199 39888 58342 81988 99799 99422
(i) From Reserve Bank of India - - - 33412 - -
(ii) From other banks 119 2769 - - 1680 3354
(iii) From other institutions and agencies 42080 37119 58342 48577 98119 96068
4.2. Borrowings outside India 48745 61088 24064 29205 135931 166371
Secured borrowings included in 4. - - - - 5232 27678
5. Other liabilities & provisions 37404 41815 29742 29428 114005 147034(2.0) (2.0) (2.4) (2.0) (2.5) (2.7)
5.1. Bills Payable 2901 3320 6736 6472 13668 14270
5.2. Inter-office adjustments 584 4238 - - - 3605
5.3. Interest accrued 3545 3514 4985 1167 28060 32594
5.4. Subordinate debt - - - - - -
5.5. Deferred Tax Liabilities 575 246 905 542 - -
5.6. Others (including provisions) 29800 30497 17117 21247 72276 96564
Total Liabilities 1829346 2043732 1245454 1462989 4473215 5471354
Source : Annual accounts of Banks of respective years.
Note : Figures in brackets indicate per cent share in total.

124
TABLE B1 : LIABILITIES AND ASSETS OF SCHEDULED COMMERCIAL BANKS - 2012 AND 2013 AS ON MARCH 31NATIONALISED BANKS
(Amount in ` Million)
(Contd.)
ItemsBank of India Bank of Maharashtra Canara Bank
2012 2013 2012 2013 2012 2013(7) (8) (9) (10) (11) (12)
1. Capital 5745 5966 11776 12495 4430 4430(0.1) (0.1) (1.3) (1.1) (0.1) (0.1)
2. Reserves and Surplus 203873 233215 35451 51475 222470 244348(5.3) (5.2) (3.9) (4.4) (5.9) (5.9)
2.1 Statutory Reserves 52695 59569 8283 10182 59330 66530 2.2 Capital Reserves 30461 31726 1192 1398 33685 34013 2.3 Share Premium 38444 46313 9280 12621 22352 22352 2.4 Investments Fluctuations Reserves - - - 161 - 2050 2.5 Revenue and other Reserves 82272 95608 12242 25648 107102 119403 2.6 Balance of Profit - - 4454 1464 - -3. Deposits 3182160 3818396 765287 943369 3270537 3558560
(82.8) (84.4) (84.0) (80.7) (87.4) (86.3)Type-wise 3A.1. Demand deposits 179609 202857 84515 111856 148185 148931 (i) From banks 9992 10595 587 3942 1464 2359 (ii) From others 169617 192263 83928 107914 146721 146572 3A.2. Savings bank deposits 668446 776212 231801 272899 647922 711682 3A.3. Term deposits 2334105 2839326 448971 558614 2474430 2697947 (i) From banks 365373 389419 453 1804 97639 121049 (ii) From others 1968731 2449907 448517 556809 2376791 2576898Location-wise 3B.1. Deposits of branches in India 2484753 2940667 765287 943369 3160926 3421069 3B.2. Deposits of branches outside India 697407 877728 - - 109612 1374914. Borrowings 321142 353676 69448 128775 155254 202834
(8.4) (7.8) (7.6) (11.0) (4.1) (4.9) 4.1. Borrowings in India 179987 154541 64958 122022 86415 108797 (i) From Reserve Bank of India 37 4 31700 6000 - - (ii) From other banks 10693 22402 - 35630 1272 - (iii) From other institutions and agencies 169256 132134 33258 80392 85143 108797 4.2. Borrowings outside India 141156 199135 4489 6753 68839 94037 Secured borrowings included in 4. - - - - - -5. Other liabilities & provisions 132434 114774 29413 33414 88911 113255
(3.4) (2.5) (3.2) (2.9) (2.4) (2.7) 5.1. Bills Payable 11587 12880 4091 4153 11052 10572 5.2. Inter-office adjustments - - - 668 554 429 5.3. Interest accrued 11332 14936 2835 3406 7644 11528 5.4. Subordinate debt - - - - - - 5.5. Deferred Tax Liabilities 10825 3125 - - 2631 3270 5.6. Others (including provisions) 98691 83833 22487 25187 67029 87456Total Liabilities 3845355 4526027 911374 1169528 3741602 4123426

125
TABLE B1 : LIABILITIES AND ASSETS OF SCHEDULED COMMERCIAL BANKS - 2012 AND 2013 AS ON MARCH 31NATIONALISED BANKS
(Amount in ` Million)
(Contd.)
ItemsCentral Bank of India Corporation Bank Dena Bank
2012 2013 2012 2013 2012 2013(13) (14) (15) (16) (17) (18)
1. Capital 23531 26616 1481 1529 3501 3501(1.0) (1.0) (0.1) (0.1) (0.4) (0.3)
2. Reserves and Surplus 100984 126513 81278 94128 41273 54140(4.4) (4.7) (5.0) (4.9) (4.7) (4.8)
2.1 Statutory Reserves 16582 19120 25834 29421 11686 14118
2.2 Capital Reserves 18970 23122 7201 7599 1144 1193
2.3 Share Premium 38467 59443 10063 12055 8830 8830
2.4 Investments Fluctuations Reserves 4071 - 99 140 - -
2.5 Revenue and other Reserves 22880 24813 38082 44913 19612 29999
2.6 Balance of Profit 15 16 - - - -
3. Deposits 1961733 2260383 1361422 1660055 771668 972072(85.4) (84.3) (83.2) (85.8) (88.3) (85.7)
Type-wise 3A.1. Demand deposits 126804 144912 123054 152367 73472 68699
(i) From banks 2157 10148 304 563 742 1145
(ii) From others 124647 134764 122750 151805 72730 67555
3A.2. Savings bank deposits 525947 590905 178080 207595 193168 212831
3A.3. Term deposits 1308983 1524567 1060288 1300092 505028 690541
(i) From banks 32834 51166 195110 194249 78746 91998
(ii) From others 1276148 1473401 865177 1105843 426282 598544
Location-wise 3B.1. Deposits of branches in India 1961733 2260383 1361422 1660055 771668 972072
3B.2. Deposits of branches outside India - - - - - -
4. Borrowings 129196 183055 142481 128988 38809 84137(5.6) (6.8) (8.7) (6.7) (4.4) (7.4)
4.1. Borrowings in India 100994 168247 118010 105103 35513 80787
(i) From Reserve Bank of India 2501 55431 51500 49350 19600 55500
(ii) From other banks 26 137 2798 - - -
(iii) From other institutions and agencies 98468 112679 63712 55753 15913 25287
4.2. Borrowings outside India 28202 14809 24471 23885 3297 3350
Secured borrowings included in 4. - - - - - -
5. Other liabilities & provisions 82553 84729 48942 49723 18628 20556(3.6) (3.2) (3.0) (2.6) (2.1) (1.8)
5.1. Bills Payable 8878 7021 5883 6170 2932 2576
5.2. Inter-office adjustments - - 1687 1001 633 478
5.3. Interest accrued 13059 13694 6389 6208 2692 3192
5.4. Subordinate debt - - - - - -
5.5. Deferred Tax Liabilities 4550 2588 - - - -
5.6. Others (including provisions) 56066 61426 34983 36344 12372 14310
Total Liabilities 2297997 2681295 1635604 1934423 873879 1134404
Source : Annual accounts of Banks of respective years.
Note : Figures in brackets indicate per cent share in total.

126
TABLE B1 : LIABILITIES AND ASSETS OF SCHEDULED COMMERCIAL BANKS - 2012 AND 2013 AS ON MARCH 31NATIONALISED BANKS
(Amount in ` Million)
(Contd.)
ItemsIDBI Bank Ltd. Indian Bank Indian Overseas Bank
2012 2013 2012 2013 2012 2013(19) (20) (21) (22) (23) (24)
1. Capital 12784 13327 8298 8298 7970 9241(0.4) (0.4) (0.6) (0.5) (0.4) (0.4)
2. Reserves and Surplus 181495 199033 99717 111427 111307 125333(6.3) (6.2) (7.1) (6.8) (5.1) (5.1)
2.1 Statutory Reserves 20492 25200 26438 30398 27697 29116 2.2 Capital Reserves 3174 5092 12275 12266 21491 22104 2.3 Share Premium 76486 81497 6962 6962 26854 35583 2.4 Investments Fluctuations Reserves - - 399 399 980 980 2.5 Revenue and other Reserves 74617 78205 52751 60500 34285 37549 2.6 Balance of Profit 6726 9039 892 902 - -3. Deposits 2104926 2271165 1208038 1419802 1784342 2021353
(72.5) (70.4) (85.4) (87.2) (81.2) (82.6)Type-wise 3A.1. Demand deposits 317222 332890 69659 68465 122873 132075 (i) From banks 25381 30865 422 481 406 433 (ii) From others 291841 302024 69236 67984 122467 131642 3A.2. Savings bank deposits 190024 237603 299419 323403 348620 403790 3A.3. Term deposits 1597679 1700672 838960 1027933 1312849 1485489 (i) From banks 206631 237571 26707 35927 8144 2715 (ii) From others 1391048 1463101 812253 992006 1304705 1482773Location-wise 3B.1. Deposits of branches in India 2094150 2258068 1157717 1348044 1722190 1954574 3B.2. Deposits of branches outside India 10776 13097 50321 71758 62152 667804. Borrowings 534776 658089 48729 28626 236138 233229
(18.4) (20.4) (3.4) (1.8) (10.8) (9.5) 4.1. Borrowings in India 431135 433914 19629 13756 145877 107987 (i) From Reserve Bank of India - - 1500 1840 65000 14000 (ii) From other banks 696 8141 3200 - - - (iii) From other institutions and agencies 430440 425773 14929 11916 80877 93987 4.2. Borrowings outside India 103641 224175 29099 14870 90261 125241 Secured borrowings included in 4. 136620 142108 - - 77854 399645. Other liabilities & provisions 69182 86071 49411 60075 56615 57405
(2.4) (2.7) (3.5) (3.7) (2.6) (2.3) 5.1. Bills Payable 9498 9105 7745 8149 7054 5948 5.2. Inter-office adjustments 17 13 - 3054 - 5284 5.3. Interest accrued 24809 22975 7999 9040 4590 5434 5.4. Subordinate debt - - - - - - 5.5. Deferred Tax Liabilities - - - - - - 5.6. Others (including provisions) 34858 53979 33667 39831 44970 40738Total Liabilities 2903163 3227685 1414192 1628226 2196371 2446560

127
TABLE B1 : LIABILITIES AND ASSETS OF SCHEDULED COMMERCIAL BANKS - 2012 AND 2013 AS ON MARCH 31NATIONALISED BANKS
(Amount in ` Million)
(Contd.)
Items
Oriental Bank ofCommerce Punjab National Bank Punjab and Sind Bank
2012 2013 2012 2013 2012 2013(25) (26) (27) (28) (29) (30)
1. Capital 2918 2918 3392 3535 4342 4540(0.2) (0.1) (0.1) (0.1) (0.6) (0.6)
2. Reserves and Surplus 116507 124838 274762 323234 38147 41501(6.6) (6.2) (6.0) (6.7) (5.2) (5.2)
2.1 Statutory Reserves 26820 30140 68791 80660 7409 8259
2.2 Capital Reserves 14170 12481 25141 25238 9806 9670
2.3 Share Premium 34135 34135 44165 56502 5055 6255
2.4 Investments Fluctuations Reserves - 52 1071 1071 - -
2.5 Revenue and other Reserves 41378 48028 135595 159764 1652 1886
2.6 Balance of Profit 5 2 - - 14225 15431
3. Deposits 1559649 1758975 3795885 3915601 631240 706415(87.9) (87.6) (82.8) (81.8) (86.6) (87.8)
Type-wise 3A.1. Demand deposits 93752 116628 284722 298743 34882 35605
(i) From banks 597 383 21768 29738 81 462
(ii) From others 93155 116246 262954 269004 34801 35143
3A.2. Savings bank deposits 282532 315216 1056570 1234701 116145 121783
3A.3. Term deposits 1183364 1327130 2454592 2382157 480213 549027
(i) From banks 3538 1761 146669 111144 47662 55644
(ii) From others 1179826 1325370 2307923 2271014 432551 493384
Location-wise 3B.1. Deposits of branches in India 1559649 1758975 3705952 3752836 631240 706415
3B.2. Deposits of branches outside India - - 89933 162765 - -
4. Borrowings 52590 76793 372643 396209 33823 25401(3.0) (3.8) (8.1) (8.3) (4.6) (3.2)
4.1. Borrowings in India 38091 62136 228001 183549 31941 24206
(i) From Reserve Bank of India 4000 18000 100000 57000 - 4000
(ii) From other banks 4637 7457 220 5835 12983 -
(iii) From other institutions and agencies 29454 36680 127781 120714 18958 20206
4.2. Borrowings outside India 14499 14657 144642 212661 1882 1194
Secured borrowings included in 4. - - 90000 22000 - -
5. Other liabilities & provisions 43681 43448 135242 150191 21500 26922(2.5) (2.2) (3.0) (3.1) (2.9) (3.3)
5.1. Bills Payable 743 896 21390 23124 1991 2383
5.2. Inter-office adjustments 3830 4543 551 287 795 2995
5.3. Interest accrued 6413 1442 5831 6843 5532 6354
5.4. Subordinate debt - - - - - -
5.5. Deferred Tax Liabilities - - - - 1136 1107
5.6. Others (including provisions) 32695 36567 107471 119937 12046 14083
Total Liabilities 1775346 2006972 4581923 4788770 729053 804779
Source : Annual accounts of Banks of respective years.
Note : Figures in brackets indicate per cent share in total.

128
TABLE B1 : LIABILITIES AND ASSETS OF SCHEDULED COMMERCIAL BANKS - 2012 AND 2013 AS ON MARCH 31NATIONALISED BANKS
(Amount in ` Million)
(Contd.)
ItemsSyndicate Bank UCO Bank Union Bank of India
2012 2013 2012 2013 2012 2013(31) (32) (33) (34) (35) (36)
1. Capital 6020 6020 24877 25756 6615 7078(0.3) (0.3) (1.4) (1.3) (0.3) (0.2)
2. Reserves and Surplus 84392 99394 61257 71068 139715 165884(4.6) (4.6) (3.4) (3.6) (5.3) (5.3)
2.1 Statutory Reserves 20733 25744 14479 16025 44350 50830 2.2 Capital Reserves 1361 1385 7842 8649 7048 7591 2.3 Share Premium 10802 10802 11715 17646 18192 28859 2.4 Investments Fluctuations Reserves - 122 - 920 - - 2.5 Revenue and other Reserves 51496 61341 6110 6683 70118 78600 2.6 Balance of Profit - - 21111 21146 6 43. Deposits 1579411 1853559 1540035 1734310 2228689 2637616
(86.6) (86.2) (85.3) (87.3) (85.0) (84.6)Type-wise 3A.1. Demand deposits 122214 139365 80806 259796 192762 241383 (i) From banks 539 658 5832 189530 9817 9328 (ii) From others 121675 138706 74975 70267 182945 232054 3A.2. Savings bank deposits 342959 380175 263224 297532 504289 574967 3A.3. Term deposits 1114238 1334019 1196005 1176982 1531639 1821266 (i) From banks 166654 238301 175445 158895 87698 108766 (ii) From others 947584 1095718 1020560 1018087 1443941 1712501Location-wise 3B.1. Deposits of branches in India 1477075 1670546 1420170 1583864 2216620 2609983 3B.2. Deposits of branches outside India 102336 183013 119865 150447 12070 276324. Borrowings 105899 128138 129014 94924 179095 237973
(5.8) (6.0) (7.1) (4.8) (6.8) (7.6) 4.1. Borrowings in India 68098 70566 119616 90632 72804 92614 (i) From Reserve Bank of India - - 67150 30500 2350 21253 (ii) From other banks 7718 8176 1 2 7000 2000 (iii) From other institutions and agencies 60380 62390 52465 60130 63454 69361 4.2. Borrowings outside India 37801 57572 9398 4293 106291 145359 Secured borrowings included in 4. - - 8715 16380 1344 13395. Other liabilities & provisions 48960 64113 49801 60455 67999 70058
(2.7) (3.0) (2.8) (3.0) (2.6) (2.2) 5.1. Bills Payable 5473 8191 2478 2462 12941 12227 5.2. Inter-office adjustments 524 143 2346 2789 - - 5.3. Interest accrued 9939 7795 7322 8056 7105 8390 5.4. Subordinate debt - - - - - - 5.5. Deferred Tax Liabilities - - - - 217 317 5.6. Others (including provisions) 33024 47984 37655 47148 47736 49123Total Liabilities 1824681 2151223 1804984 1986514 2622114 3118608

129
TABLE B1 : LIABILITIES AND ASSETS OF SCHEDULED COMMERCIAL BANKS - 2012 AND 2013 AS ON MARCH 31NATIONALISED BANKS
(Amount in ` Million)
(Contd.)
ItemsUnited Bank of India Vijaya Bank
2012 2013 2012 2013(37) (38) (39) (40)
1. Capital 11610 11747 16955 16955(1.1) (1.0) (1.8) (1.5)
2. Reserves and Surplus 44187 47090 35567 38631(4.3) (4.1) (3.7) (3.5)
2.1 Statutory Reserves 6155 7135 10873 12337
2.2 Capital Reserves 21362 21330 2773 3383
2.3 Share Premium 6573 7436 5930 5930
2.4 Investments Fluctuations Reserves - - - -
2.5 Revenue and other Reserves 10096 11189 6641 7391
2.6 Balance of Profit - - 9350 9590
3. Deposits 891163 1006515 830555 970172(87.4) (87.8) (86.7) (87.4)
Type-wise 3A.1. Demand deposits 97408 95334 46840 52164
(i) From banks 8180 12037 158 133
(ii) From others 89229 83296 46682 52031
3A.2. Savings bank deposits 265887 303721 136041 151328
3A.3. Term deposits 527868 607461 647675 766680
(i) From banks 16649 14503 1933 3035
(ii) From others 511219 592958 645742 763645
Location-wise 3B.1. Deposits of branches in India 891163 1006515 830555 970172
3B.2. Deposits of branches outside India - - - -
4. Borrowings 49202 49427 54184 63918(4.8) (4.3) (5.7) (5.8)
4.1. Borrowings in India 47886 36918 54184 63915
(i) From Reserve Bank of India 5200 3266 950 3500
(ii) From other banks - - - 3500
(iii) From other institutions and agencies 42686 33652 53234 56915
4.2. Borrowings outside India 1316 12509 - 3
Secured borrowings included in 4. 5200 3266 - -
5. Other liabilities & provisions 23943 31371 20379 20140(2.3) (2.7) (2.1) (1.8)
5.1. Bills Payable 3777 3943 3618 3864
5.2. Inter-office adjustments 716 202 - -
5.3. Interest accrued 3437 4702 2468 2621
5.4. Subordinate debt - - - -
5.5. Deferred Tax Liabilities - - 679 -
5.6. Others (including provisions) 16013 22525 13613 13656
Total Liabilities 1020104 1146151 957640 1109818
Source : Annual accounts of Banks of respective years.
Note : Figures in brackets indicate per cent share in total.

130
TABLE B1 : LIABILITIES AND ASSETS OF SCHEDULED COMMERCIAL BANKS - 2012 AND 2013 AS ON MARCH 31NATIONALISED BANKS
(Amount in ` Million)
(Contd.)
ItemsAllahabad Bank Andhra Bank Bank of Baroda
2012 2013 2012 2013 2012 2013(1) (2) (3) (4) (5) (6)
1. Cash in hand 3910 5241 4699 6341 12008 15595(0.2) (0.3) (0.4) (0.4) (0.3) (0.3)
2. Balances with RBI 83214 72841 50940 53881 204507 118926(4.5) (3.6) (4.1) (3.7) (4.6) (2.2)
3. Balances with banks in India 4790 9933 20024 1791 38087 46398(0.3) (0.5) (1.6) (0.1) (0.9) (0.8)
4. Money at call and short notice 41469 23063 7792 - 152667 311099(2.3) (1.1) (0.6) (0.0) (3.4) (5.7)
5. Balances with banks outside India 6868 19629 3001 5884 234417 361972(0.4) (1.0) (0.2) (0.4) (5.2) (6.6)
6. Investments 542832 583059 296289 376324 832094 1213937(29.7) (28.5) (23.8) (25.7) (18.6) (22.2)
6.1. Investments in India 542832 583059 296196 374986 792650 1167596 (i) Government securities 452120 457718 267279 329736 691882 1020445 (ii) Other approved securities 700 457 104 82 1633 1332 (iii) Shares 3957 3669 2128 3264 14599 15049 (iv) Debentures and Bonds 35281 44185 7060 13388 29600 29474 (v) Subsidiaries and/or joint ventures 1772 1713 1900 1735 6976 8266 (vi) Others 49003 75316 17725 26781 47960 93029 6.2. Investments outside India - - 93 1338 39444 46342 (i) Government securities - - - - 10596 11148 (ii) Subsidiaries and/or joint ventures - - - 1338 5373 7371 (iii) Others - - 93 - 23474 278237. Advances 1111451 1294897 832230 983733 2873773 3281858
(60.8) (63.4) (66.8) (67.2) (64.2) (60.0)Type-wise 7A.1. Bills purchased and discounted 28135 20854 15962 20891 391179 484093 7A.2. Cash credits, overdrafts & loans 514715 619201 429584 505237 1214015 1383335 7A.3. Term loans 568601 654841 386684 457604 1268579 1414429Security-wise 7B.1. Secured by tangible assets 945796 1097711 694314 867359 1900804 2264545 7B.2. Covered by Bank/Govt. Guarantees 48408 49323 34315 49970 503609 599707 7B.3. Unsecured 117247 147863 103601 66404 469360 417605Sector-wise 7C.I. Advances in India 1064225 1232443 832230 983733 2020754 2242943 (i) Priority sectors 373964 394034 276595 346219 649099 794671 (ii) Public sectors 167729 162320 75099 76190 237045 225391 (iii) Banks - - - - 20951 25713 (iv) others 522532 676089 480536 561324 1113659 1197168 7C.II. Advances outside India 47226 62453 - - 853019 10389148. Fixed Assets 11977 12515 3026 3035 23415 24531
(0.7) (0.6) (0.2) (0.2) (0.5) (0.4) 8.1. Premises 9496 9534 801 778 17711 17214 8.2. Fixed assets under construction 216 371 26 41 - - 8.3. Other Fixed assets 2265 2610 2199 2215 5704 73179. Other Assets 22833 22554 27454 32002 102247 97039
(1.2) (1.1) (2.2) (2.2) (2.3) (1.8) 9.1. Inter-office adjustments (net) - - 935 619 3546 - 9.2. Interest accrued 10857 10022 7230 9717 35159 36368 9.3. Tax paid 5513 7160 10976 14850 19931 33745 9.4. Stationery and Stamps 110 135 66 77 71 65 9.5. Others 6353 5238 8247 6739 43540 26861Total Assets 1829346 2043732 1245454 1462989 4473215 5471354
Note : Figures in brackets indicate per cent share in total.
Source : Annual accounts of Banks of respective years

131
TABLE B1 : LIABILITIES AND ASSETS OF SCHEDULED COMMERCIAL BANKS - 2012 AND 2013 AS ON MARCH 31NATIONALISED BANKS
(Amount in ` Million)
(Contd.)
ItemsBank of India Bank of Maharashtra Canara Bank
2012 2013 2012 2013 2012 2013(7) (8) (9) (10) (11) (12)
1. Cash in hand 11534 17571 5036 5146 10032 11288(0.3) (0.4) (0.6) (0.4) (0.3) (0.3)
2. Balances with RBI 138333 202099 40319 47507 167919 142771(3.6) (4.5) (4.4) (4.1) (4.5) (3.5)
3. Balances with banks in India 38144 91716 3962 8766 11832 15924(1.0) (2.0) (0.4) (0.7) (0.3) (0.4)
4. Money at call and short notice 38235 2672 - - 5500 59602(1.0) (0.1) (0.0) (0.0) (0.1) (1.4)
5. Balances with banks outside India 120866 234301 8126 309 86510 117561(3.1) (5.2) (0.9) (0.0) (2.3) (2.9)
6. Investments 867536 946134 260314 314303 1020574 1211328(22.6) (20.9) (28.6) (26.9) (27.3) (29.4)
6.1. Investments in India 824758 906056 260314 314303 1015313 1205447 (i) Government securities 715706 794908 206438 253733 887639 1019918 (ii) Other approved securities 719 12 - - 97 15 (iii) Shares 8864 9233 2107 1755 11724 15578 (iv) Debentures and Bonds 51808 55388 9445 11715 26055 33756 (v) Subsidiaries and/or joint ventures 4039 4135 688 734 5813 6730 (vi) Others 43621 42382 41636 46367 83984 129451 6.2. Investments outside India 42778 40078 - - 5262 5882 (i) Government securities 21628 23765 - - - - (ii) Subsidiaries and/or joint ventures 4070 4070 - - 366 366 (iii) Others 17080 12244 - - 4896 55167. Advances 2488333 2893675 560598 754708 2324898 2421766
(64.7) (63.9) (61.5) (64.5) (62.1) (58.7)Type-wise 7A.1. Bills purchased and discounted 392876 511686 14897 19487 70972 70542 7A.2. Cash credits, overdrafts & loans 1099367 1228782 194816 278578 1077884 1054785 7A.3. Term loans 996090 1153207 350884 456643 1176041 1296440Security-wise 7B.1. Secured by tangible assets 1526095 1879770 454502 644561 1687224 1912247 7B.2. Covered by Bank/Govt. Guarantees 438197 606560 72 586 67463 87931 7B.3. Unsecured 524041 407346 106023 109562 570212 421588Sector-wise 7C.I. Advances in India 1757736 2013683 560598 754708 2214963 2271401 (i) Priority sectors 561399 649661 188504 243396 692709 820488 (ii) Public sectors 167610 298816 132170 127870 345676 290960 (iii) Banks 2107 1806 1 2715 431 148 (iv) others 1026620 1063401 239923 380727 1176148 1159805 7C.II. Advances outside India 730598 879992 - - 109935 1503668. Fixed Assets 27716 28701 6007 14295 28575 28627
(0.7) (0.6) (0.7) (1.2) (0.8) (0.7) 8.1. Premises 21419 20650 4380 12142 24601 24373 8.2. Fixed assets under construction 486 912 - - - - 8.3. Other Fixed assets 5810 7139 1626 2152 3975 42549. Other Assets 114657 109158 27014 24494 85760 114557
(3.0) (2.4) (3.0) (2.1) (2.3) (2.8) 9.1. Inter-office adjustments (net) 8886 1115 3718 - - - 9.2. Interest accrued 20983 19209 5855 7543 29115 33419 9.3. Tax paid 38605 44056 8556 7238 17495 24243 9.4. Stationery and Stamps 20 22 53 50 81 66 9.5. Others 46163 44756 8831 9662 39069 56829Total Assets 3845355 4526027 911374 1169528 3741602 4123426

132
TABLE B1 : LIABILITIES AND ASSETS OF SCHEDULED COMMERCIAL BANKS - 2012 AND 2013 AS ON MARCH 31NATIONALISED BANKS
(Amount in ` Million)
(Contd.)
ItemsCentral Bank of India Corporation Bank Dena Bank
2012 2013 2012 2013 2012 2013(13) (14) (15) (16) (17) (18)
1. Cash in hand 16676 17578 5828 8943 3388 4480(0.7) (0.7) (0.4) (0.5) (0.4) (0.4)
2. Balances with RBI 114465 118023 87054 79536 48562 81965(5.0) (4.4) (5.3) (4.1) (5.6) (7.2)
3. Balances with banks in India 6519 4252 1166 3644 3117 5541(0.3) (0.2) (0.1) (0.2) (0.4) (0.5)
4. Money at call and short notice - 500 13382 25278 - 800(0.0) (0.0) (0.8) (1.3) (0.0) (0.1)
5. Balances with banks outside India 3605 569 9549 9433 445 5429(0.2) (0.0) (0.6) (0.5) (0.1) (0.5)
6. Investments 592433 726038 474746 581645 230276 343431(25.8) (27.1) (29.0) (30.1) (26.4) (30.3)
6.1. Investments in India 592426 726031 474745 581644 230276 343431 (i) Government securities 507238 601302 370357 466044 194047 267584 (ii) Other approved securities 604 440 46 24 189 25 (iii) Shares 9424 14316 5243 6179 1113 1620 (iv) Debentures and Bonds 41017 44412 14633 20914 7842 10409 (v) Subsidiaries and/or joint ventures 2542 2629 817 750 483 483 (vi) Others 31602 62931 83650 87733 26601 63310 6.2. Investments outside India 7 7 1 1 - - (i) Government securities - - - - - - (ii) Subsidiaries and/or joint ventures 7 7 - - - - (iii) Others - - 1 1 - -7. Advances 1475129 1719358 1004690 1187166 566925 657812
(64.2) (64.1) (61.4) (61.4) (64.9) (58.0)Type-wise 7A.1. Bills purchased and discounted 22539 22997 28274 71740 21613 23930 7A.2. Cash credits, overdrafts & loans 490610 627469 444937 529489 259809 282349 7A.3. Term loans 961980 1068893 531479 585937 285503 351533Security-wise 7B.1. Secured by tangible assets 1033347 1408206 724989 980983 437332 531291 7B.2. Covered by Bank/Govt. Guarantees 78838 95110 962 16379 31386 42083 7B.3. Unsecured 362943 216043 278739 189804 98208 84438Sector-wise 7C.I. Advances in India 1475129 1719358 1004690 1187166 566925 657812 (i) Priority sectors 385222 500284 293245 372146 171531 185159 (ii) Public sectors 97604 218918 141601 193286 119821 135340 (iii) Banks 750 3528 145 5804 4244 5568 (iv) others 991553 996629 569699 615931 271330 331746 7C.II. Advances outside India - - - - - -8. Fixed Assets 24739 26848 3560 4432 4066 11121
(1.1) (1.0) (0.2) (0.2) (0.5) (1.0) 8.1. Premises 19930 20341 976 1139 2641 9393 8.2. Fixed assets under construction - - 21 33 15 22 8.3. Other Fixed assets 4809 6507 2563 3259 1411 17079. Other Assets 64431 68129 35628 34347 17099 23826
(2.8) (2.5) (2.2) (1.8) (2.0) (2.1) 9.1. Inter-office adjustments (net) 2946 9022 - - - - 9.2. Interest accrued 12676 13799 9470 9965 5898 8150 9.3. Tax paid 23311 20935 15095 15629 6102 7834 9.4. Stationery and Stamps 132 136 37 39 26 39 9.5. Others 25366 24238 11026 8714 5073 7802Total Assets 2297997 2681295 1635604 1934423 873879 1134404
Note : Figures in brackets indicate per cent share in total.
Source : Annual accounts of Banks of respective years

133
TABLE B1 : LIABILITIES AND ASSETS OF SCHEDULED COMMERCIAL BANKS - 2012 AND 2013 AS ON MARCH 31NATIONALISED BANKS
(Amount in ` Million)
(Contd.)
ItemsIDBI Bank Ltd. Indian Bank Indian Overseas Bank
2012 2013 2012 2013 2012 2013(19) (20) (21) (22) (23) (24)
1. Cash in hand 16143 13692 3002 4359 11881 11192(0.6) (0.4) (0.2) (0.3) (0.5) (0.5)
2. Balances with RBI 134759 91747 60187 66283 90108 87186(4.6) (2.8) (4.3) (4.1) (4.1) (3.6)
3. Balances with banks in India 7307 5225 688 3013 14061 3547(0.3) (0.2) (0.0) (0.2) (0.6) (0.1)
4. Money at call and short notice 13063 32771 6768 11653 34994 38646(0.4) (1.0) (0.5) (0.7) (1.6) (1.6)
5. Balances with banks outside India 9304 35810 17489 11079 11567 12013(0.3) (1.1) (1.2) (0.7) (0.5) (0.5)
6. Investments 831754 988009 379760 418050 555659 614173(28.6) (30.6) (26.9) (25.7) (25.3) (25.1)
6.1. Investments in India 831753 988009 365093 401338 543734 596246 (i) Government securities 647978 711819 296998 310957 499622 542614 (ii) Other approved securities - - 431 363 657 623 (iii) Shares 33752 34980 4591 4109 7899 9007 (iv) Debentures and Bonds 24950 60472 11917 15461 22538 24415 (v) Subsidiaries and/or joint ventures 6208 6187 884 397 - - (vi) Others 118866 174552 50272 70051 13017 19588 6.2. Investments outside India - - 14668 16712 11925 17927 (i) Government securities - - 13562 15864 10573 11573 (ii) Subsidiaries and/or joint ventures - - - - 130 1863 (iii) Others - - 1106 848 1222 44917. Advances 1805723 1963064 903236 1056425 1407244 1603641
(62.2) (60.8) (63.9) (64.9) (64.1) (65.5)Type-wise 7A.1. Bills purchased and discounted 32224 46188 22944 19859 52514 60750 7A.2. Cash credits, overdrafts & loans 459793 508846 360576 453829 625221 745940 7A.3. Term loans 1313706 1408030 519716 582737 729510 796951Security-wise 7B.1. Secured by tangible assets 1661502 1815357 671426 814893 1162012 1368323 7B.2. Covered by Bank/Govt. Guarantees 10328 5245 55802 79355 45500 67002 7B.3. Unsecured 133893 142463 176008 162177 199732 168317Sector-wise 7C.I. Advances in India 1751693 1846200 854724 997055 1250643 1413021 (i) Priority sectors 484259 344125 297892 361033 422653 498174 (ii) Public sectors 204240 104735 102484 185560 190865 170862 (iii) Banks 1867 3528 - - 9361 4494 (iv) others 1061327 1393812 454348 450462 627763 739491 7C.II. Advances outside India 54029 116865 48512 59370 156602 1906218. Fixed Assets 30188 29253 16307 16905 17440 18470
(1.0) (0.9) (1.2) (1.0) (0.8) (0.8) 8.1. Premises 24969 24011 13089 13169 14707 15017 8.2. Fixed assets under construction 245 167 53 5 149 104 8.3. Other Fixed assets 4974 5075 3165 3731 2584 33499. Other Assets 54922 68113 26755 40459 53417 57691
(1.9) (2.1) (1.9) (2.5) (2.4) (2.4) 9.1. Inter-office adjustments (net) - - 1732 - 1266 - 9.2. Interest accrued 20063 20663 6037 7069 19945 23350 9.3. Tax paid 15032 13149 4921 14394 17710 17707 9.4. Stationery and Stamps 1 1 140 151 82 95 9.5. Others 19827 34300 13925 18844 14414 16539Total Assets 2903163 3227685 1414192 1628226 2196371 2446560

134
TABLE B1 : LIABILITIES AND ASSETS OF SCHEDULED COMMERCIAL BANKS - 2012 AND 2013 AS ON MARCH 31NATIONALISED BANKS
(Amount in ` Million)
(Contd.)
Items
Oriental Bank ofCommerce Punjab and Sind Bank Punjab National Bank
2012 2013 2012 2013 2012 2013(25) (26) (27) (28) (29) (30)
1. Cash in hand 4224 6598 1560 1752 19353 19392(0.2) (0.3) (0.2) (0.2) (0.4) (0.4)
2. Balances with RBI 80393 75122 34841 30737 165576 159470(4.5) (3.7) (4.8) (3.8) (3.6) (3.3)
3. Balances with banks in India 2045 1214 2631 3093 39348 37077(0.1) (0.1) (0.4) (0.4) (0.9) (0.8)
4. Money at call and short notice - 2000 3000 2500 31849 21357(0.0) (0.1) (0.4) (0.3) (0.7) (0.4)
5. Balances with banks outside India 607 962 1121 2709 32154 34057(0.0) (0.0) (0.2) (0.3) (0.7) (0.7)
6. Investments 521013 585547 200641 225425 1227030 1298962(29.3) (29.2) (27.5) (28.0) (26.8) (27.1)
6.1. Investments in India 521013 585547 200641 225425 1213433 1282996 (i) Government securities 393487 440768 170703 187060 997594 1075986 (ii) Other approved securities 680 610 284 114 2233 2115 (iii) Shares 5002 6205 1582 1725 26109 25736 (iv) Debentures and Bonds 19813 19229 12078 11942 76367 99689 (v) Subsidiaries and/or joint ventures 1840 2185 7 7 2939 2950 (vi) Others 100190 116550 15988 24577 108190 76520 6.2. Investments outside India - - - - 13598 15966 (i) Government securities - - - - - - (ii) Subsidiaries and/or joint ventures - - - - 10586 12000 (iii) Others - - - - 3012 39677. Advances 1119777 1289551 461514 514308 2937748 3087252
(63.1) (64.3) (63.3) (63.9) (64.1) (64.5)Type-wise 7A.1. Bills purchased and discounted 36369 43695 8732 4803 74205 89372 7A.2. Cash credits, overdrafts & loans 454139 533885 135546 160489 1436071 1563878 7A.3. Term loans 629268 711971 317235 349016 1427471 1434002Security-wise 7B.1. Secured by tangible assets 993746 1128079 333843 398261 2529029 2631756 7B.2. Covered by Bank/Govt. Guarantees 44042 78733 41292 55690 162106 212000 7B.3. Unsecured 81990 82739 86379 60358 246613 243496Sector-wise 7C.I. Advances in India 1119777 1289551 461514 514308 2720197 2766672 (i) Priority sectors 400305 462397 129261 139900 920330 927530 (ii) Public sectors 100529 99653 106728 127845 226727 213856 (iii) Banks 751 17 7304 472 15040 263 (iv) others 618193 727484 218222 246091 1558100 1625023 7C.II. Advances outside India - - - - 217551 3205808. Fixed Assets 14207 12274 8084 8441 31689 33577
(0.8) (0.6) (1.1) (1.0) (0.7) (0.7) 8.1. Premises 11476 8813 7444 7624 23252 24002 8.2. Fixed assets under construction 214 169 - - - - 8.3. Other Fixed assets 2516 3292 640 818 8437 95759. Other Assets 33080 33705 15659 15813 97177 97626
(1.9) (1.7) (2.1) (2.0) (2.1) (2.0) 9.1. Inter-office adjustments (net) - - - - - - 9.2. Interest accrued 10416 10494 3468 4027 28560 33913 9.3. Tax paid 11499 14337 3489 3157 10578 6444 9.4. Stationery and Stamps 8 21 27 30 85 83 9.5. Others 11156 8852 8676 8599 57954 57186Total Assets 1775346 2006972 729053 804779 4581923 4788770
Note : Figures in brackets indicate per cent share in total.
Source : Annual accounts of Banks of respective years

135
TABLE B1 : LIABILITIES AND ASSETS OF SCHEDULED COMMERCIAL BANKS - 2012 AND 2013 AS ON MARCH 31NATIONALISED BANKS
(Amount in ` Million)
(Contd.)
ItemsSyndicate Bank UCO Bank Union Bank of India
2012 2013 2012 2013 2012 2013(31) (32) (33) (34) (35) (36)
1. Cash in hand 3028 3854 3084 4366 6273 7753(0.2) (0.2) (0.2) (0.2) (0.2) (0.2)
2. Balances with RBI 85059 77099 75031 52688 110062 99876(4.7) (3.6) (4.2) (2.7) (4.2) (3.2)
3. Balances with banks in India 24975 27125 486 1495 17066 13393(1.4) (1.3) (0.0) (0.1) (0.7) (0.4)
4. Money at call and short notice 15000 54000 48422 40844 644 -(0.8) (2.5) (2.7) (2.1) (0.0) (0.0)
5. Balances with banks outside India 10782 3765 9014 24049 22706 41082(0.6) (0.2) (0.5) (1.2) (0.9) (1.3)
6. Investments 408151 456477 457715 522449 623636 808304(22.4) (21.2) (25.4) (26.3) (23.8) (25.9)
6.1. Investments in India 405992 455313 446287 510864 622917 807620 (i) Government securities 365005 401662 398421 432995 504818 617645 (ii) Other approved securities 257 190 723 552 4 - (iii) Shares 3033 3236 3881 3668 7682 9845 (iv) Debentures and Bonds 18025 19018 24528 19771 43886 62588 (v) Subsidiaries and/or joint ventures 336 336 2475 1862 1326 1294 (vi) Others 19335 30871 16260 52016 65200 116248 6.2. Investments outside India 2159 1164 11428 11585 718 684 (i) Government securities - - 9725 8843 614 571 (ii) Subsidiaries and/or joint ventures - - - - - - (iii) Others 2159 1164 1702 2742 104 1137. Advances 1236202 1475690 1155400 1282829 1778821 2081022
(67.7) (68.6) (64.0) (64.6) (67.8) (66.7)Type-wise 7A.1. Bills purchased and discounted 12860 12705 75462 154918 81416 65825 7A.2. Cash credits, overdrafts & loans 235229 295556 342146 352560 919887 1048463 7A.3. Term loans 988113 1167429 737791 775351 777517 966733Security-wise 7B.1. Secured by tangible assets 831180 1013635 798692 1038189 1321100 1657032 7B.2. Covered by Bank/Govt. Guarantees 131192 214485 80344 109068 76577 127175 7B.3. Unsecured 273829 247570 276364 135571 381143 296815Sector-wise 7C.I. Advances in India 1089872 1224694 1059371 1160153 1687267 1951744 (i) Priority sectors 364211 393040 289246 333240 424535 553604 (ii) Public sectors 97093 101376 165109 165649 147892 202314 (iii) Banks 31059 42233 153 8805 82559 61814 (iv) others 597509 688045 604864 652459 1032281 1134012 7C.II. Advances outside India 146330 250996 96030 122675 91554 1292788. Fixed Assets 13516 14340 8048 8896 23358 24790
(0.7) (0.7) (0.4) (0.4) (0.9) (0.8) 8.1. Premises 10947 10725 5888 6493 17635 18427 8.2. Fixed assets under construction 237 266 32 110 36 115 8.3. Other Fixed assets 2331 3349 2128 2294 5687 62479. Other Assets 27970 38874 47785 48899 39549 42388
(1.5) (1.8) (2.6) (2.5) (1.5) (1.4) 9.1. Inter-office adjustments (net) - - - - 4361 10370 9.2. Interest accrued 8789 10403 9714 10178 16882 18383 9.3. Tax paid 13004 7023 12744 14585 -4822 -2730 9.4. Stationery and Stamps 135 107 72 59 52 25 9.5. Others 6042 21341 25254 24077 23075 16339Total Assets 1824681 2151223 1804984 1986514 2622114 3118608

136
TABLE B1 : LIABILITIES AND ASSETS OF SCHEDULED COMMERCIAL BANKS - 2012 AND 2013 AS ON MARCH 31NATIONALISED BANKS
(Amount in ` Million)
(Contd.)
ItemsUnited Bank of India Vijaya Bank
2012 2013 2012 2013(37) (38) (39) (40)
1. Cash in hand 3482 3574 3038 4176(0.3) (0.3) (0.3) (0.4)
2. Balances with RBI 47436 34892 42388 35001(4.7) (3.0) (4.4) (3.2)
3. Balances with banks in India 791 568 1292 923(0.1) (0.0) (0.1) (0.1)
4. Money at call and short notice 11000 34733 12799 25699(1.1) (3.0) (1.3) (2.3)
5. Balances with banks outside India 10064 16119 4512 648(1.0) (1.4) (0.5) (0.1)
6. Investments 290588 334634 286438 312850(28.5) (29.2) (29.9) (28.2)
6.1. Investments in India 290588 334634 286438 312850 (i) Government securities 226763 256393 237009 260611 (ii) Other approved securities 284 264 45 36 (iii) Shares 2923 2977 2747 1874 (iv) Debentures and Bonds 22746 22229 13364 16175 (v) Subsidiaries and/or joint ventures - - - - (vi) Others 37872 52771 33273 34154 6.2. Investments outside India - - - - (i) Government securities - - - - (ii) Subsidiaries and/or joint ventures - - - - (iii) Others - - - -7. Advances 630433 689087 579037 697658
(61.8) (60.1) (60.5) (62.9)Type-wise 7A.1. Bills purchased and discounted 20855 16748 14057 17528 7A.2. Cash credits, overdrafts & loans 173932 190437 255367 314673 7A.3. Term loans 435646 481901 309614 365456Security-wise 7B.1. Secured by tangible assets 487655 575827 404239 496925 7B.2. Covered by Bank/Govt. Guarantees 19761 21892 25705 50962 7B.3. Unsecured 123018 91367 149094 149771Sector-wise 7C.I. Advances in India 630433 689087 579037 697658 (i) Priority sectors 221586 251476 171157 192154 (ii) Public sectors 52335 69479 131414 87250 (iii) Banks 37 8981 7542 7553 (iv) others 356476 359151 268925 410700 7C.II. Advances outside India - - - -8. Fixed Assets 8050 8571 4869 4767
(0.8) (0.7) (0.5) (0.4) 8.1. Premises 6494 6503 3455 3276 8.2. Fixed assets under construction 133 363 - - 8.3. Other Fixed assets 1423 1704 1415 14919. Other Assets 18261 23974 23267 28095
(1.8) (2.1) (2.4) (2.5) 9.1. Inter-office adjustments (net) - - 426 396 9.2. Interest accrued 6405 7882 6819 7247 9.3. Tax paid 5836 7336 10343 15055 9.4. Stationery and Stamps 42 56 10 9 9.5. Others 5977 8700 5669 5389Total Assets 1020104 1146151 957640 1109818
Note : Figures in brackets indicate per cent share in total.
Source : Annual accounts of Banks of respective years

137
TABLE B1 : LIABILITIES AND ASSETS OF SCHEDULED COMMERCIAL BANKS - 2012 AND 2013 AS ON MARCH 31OLD PRIVATE SECTOR BANKS
(Amount in ` Million)
(Contd.)
ItemsCatholic Syrian Bank City Union Bank Dhanlaxmi Bank
2012 2013 2012 2013 2012 2013(1) (2) (3) (4) (5) (6)
1. Capital 314 419 408 474 851 851(0.3) (0.3) (0.2) (0.2) (0.6) (0.6)
2. Reserves and Surplus 5341 7157 12023 15932 6431 6809(4.4) (5.3) (6.6) (6.9) (4.4) (4.9)
2.1 Statutory Reserves 1315 1396 4180 5000 773 773
2.2 Capital Reserves 316 397 439 458 340 350
2.3 Share Premium 2224 2907 2034 3278 5635 5635
2.4 Investments Fluctuations Reserves 22 16 20 24 - -
2.5 Revenue and other Reserves 1464 2441 5284 7104 886 1240
2.6 Balance of Profit - - 66 69 -1202 -1189
3. Deposits 106049 123416 163408 203048 118044 112021(88.0) (90.6) (89.0) (88.4) (80.4) (81.1)
Type-wise 3A.1. Demand deposits 3479 3294 12031 13353 8643 9473
(i) From banks 14 4 45 18 342 86
(ii) From others 3464 3290 11986 13335 8300 9387
3A.2. Savings bank deposits 17005 18340 17685 20693 14198 15687
3A.3. Term deposits 85565 101782 133692 169001 95204 86861
(i) From banks 4214 4595 2128 1420 15464 6997
(ii) From others 81351 97188 131563 167582 79740 79864
Location-wise 3B.1. Deposits of branches in India 106049 123416 163408 203048 118044 112021
3B.2. Deposits of branches outside India - - - - - -
4. Borrowings 5755 1994 3487 4767 17215 15921(4.8) (1.5) (1.9) (2.1) (11.7) (11.5)
4.1. Borrowings in India 5755 1994 3487 4225 14676 14157
(i) From Reserve Bank of India 2980 - 300 - 7980 7830
(ii) From other banks - - - - - -
(iii) From other institutions and agencies 2774 1994 3187 4224 6696 6327
4.2. Borrowings outside India - - - 543 2539 1764
Secured borrowings included in 4. - - - - - -
5. Other liabilities & provisions 3032 3215 4181 5549 4223 2593(2.5) (2.4) (2.3) (2.4) (2.9) (1.9)
5.1. Bills Payable 147 184 1107 1175 480 459
5.2. Inter-office adjustments 300 145 - - - -
5.3. Interest accrued 582 549 624 784 2173 687
5.4. Subordinate debt - - - - - -
5.5. Deferred Tax Liabilities - - - - - -
5.6. Others (including provisions) 2004 2338 2450 3590 1570 1447
Total Liabilities 120491 136201 183507 229771 146765 138195
Source : Annual accounts of Banks of respective years.
Note : Figures in brackets indicate per cent share in total.

138
TABLE B1 : LIABILITIES AND ASSETS OF SCHEDULED COMMERCIAL BANKS - 2012 AND 2013 AS ON MARCH 31OLD PRIVATE SECTOR BANKS
(Amount in ` Million)
(Contd.)
ItemsFederal Bank ING Vysya Bank Jammu & Kashmir Bank
2012 2013 2012 2013 2012 2013(7) (8) (9) (10) (11) (12)
1. Capital 1710 1711 1501 1549 485 485(0.3) (0.2) (0.3) (0.3) (0.1) (0.1)
2. Reserves and Surplus 55353 61936 38297 44719 40447 48162(9.1) (8.7) (8.2) (8.2) (6.7) (6.7)
2.1 Statutory Reserves 10695 12790 5637 7170 12129 14766 2.2 Capital Reserves 1710 1938 2283 2293 631 631 2.3 Share Premium 24756 24761 21562 22858 868 868 2.4 Investments Fluctuations Reserves 1897 1897 2 - - 50 2.5 Revenue and other Reserves 13328 15386 1158 1311 26819 31847 2.6 Balance of Profit 2967 5164 7654 11088 - -3. Deposits 489371 576149 351954 413340 533469 642206
(80.7) (81.1) (74.9) (75.4) (88.5) (89.5)Type-wise 3A.1. Demand deposits 25459 29089 64204 73169 57344 64015 (i) From banks 127 593 3544 4492 1099 1075 (ii) From others 25332 28496 60660 68677 56245 62940 3A.2. Savings bank deposits 109299 127432 56429 61183 159807 187895 3A.3. Term deposits 354613 419627 231322 278989 316318 390296 (i) From banks 4762 6277 75954 97835 47929 53406 (ii) From others 349851 413351 155367 181153 268388 336890Location-wise 3B.1. Deposits of branches in India 489371 576149 351954 413340 533469 642206 3B.2. Deposits of branches outside India - - - - - -4. Borrowings 42410 51870 56965 65113 12410 10750
(7.0) (7.3) (12.1) (11.9) (2.1) (1.5) 4.1. Borrowings in India 29122 37961 28100 28811 11481 10750 (i) From Reserve Bank of India 900 3300 - 1000 5000 3000 (ii) From other banks 582 322 4403 2235 - 1750 (iii) From other institutions and agencies 27640 34339 23697 25576 6481 6000 4.2. Borrowings outside India 13289 13909 28865 36301 929 - Secured borrowings included in 4. 2998 4997 - - - -5. Other liabilities & provisions 17423 18831 21121 23644 15882 15830
(2.9) (2.7) (4.5) (4.3) (2.6) (2.2) 5.1. Bills Payable 205 302 3681 5603 3412 3272 5.2. Inter-office adjustments 1637 1857 174 69 383 - 5.3. Interest accrued 2659 688 1705 2205 1092 1074 5.4. Subordinate debt - - - - - - 5.5. Deferred Tax Liabilities 642 - - - - - 5.6. Others (including provisions) 12280 15984 15561 15767 10995 11484Total Liabilities 606268 710496 469838 548364 602692 717433

139
TABLE B1 : LIABILITIES AND ASSETS OF SCHEDULED COMMERCIAL BANKS - 2012 AND 2013 AS ON MARCH 31OLD PRIVATE SECTOR BANKS
(Amount in ` Million)
(Contd.)
ItemsKarnataka Bank Karur Vysya Bank Lakshmi Vilas Bank
2012 2013 2012 2013 2012 2013(13) (14) (15) (16) (17) (18)
1. Capital 1883 1884 1072 1072 975 975(0.5) (0.5) (0.3) (0.2) (0.6) (0.6)
2. Reserves and Surplus 24099 26687 26010 29780 8608 9168(6.6) (6.4) (6.9) (6.4) (5.3) (5.2)
2.1 Statutory Reserves 12160 13760 8585 10235 2949 3239
2.2 Capital Reserves 637 669 599 764 487 522
2.3 Share Premium 7207 7215 5531 5531 3304 3305
2.4 Investments Fluctuations Reserves - 115 - 210 - -
2.5 Revenue and other Reserves 4095 4927 11277 13029 1867 2102
2.6 Balance of Profit - 1 18 10 1 1
3. Deposits 316083 360562 321116 386530 141141 156190(87.0) (86.8) (85.3) (82.7) (87.3) (88.4)
Type-wise 3A.1. Demand deposits 21015 24624 24783 30533 7221 7385
(i) From banks 29 32 22 15 13 8
(ii) From others 20986 24591 24761 30518 7208 7377
3A.2. Savings bank deposits 56613 65200 36733 43858 13827 15241
3A.3. Term deposits 238454 270739 259600 312138 120093 133564
(i) From banks 261 255 4998 630 4170 3266
(ii) From others 238193 270484 254602 311508 115923 130298
Location-wise 3B.1. Deposits of branches in India 316083 360562 321116 386530 141141 156190
3B.2. Deposits of branches outside India - - - - - -
4. Borrowings 11471 15798 19726 39993 5800 4800(3.2) (3.8) (5.2) (8.6) (3.6) (2.7)
4.1. Borrowings in India 10886 13898 10213 27789 5800 4800
(i) From Reserve Bank of India 1500 3500 - - - -
(ii) From other banks 1 5 - 10 - -
(iii) From other institutions and agencies 9385 10393 10213 27779 5800 4800
4.2. Borrowings outside India 585 1900 9512 12204 - -
Secured borrowings included in 4. - - 8642 26243 - -
5. Other liabilities & provisions 9680 10333 8425 9958 5104 5534(2.7) (2.5) (2.2) (2.1) (3.2) (3.1)
5.1. Bills Payable 2149 2211 2220 2304 686 622
5.2. Inter-office adjustments 50 - - - 232 -
5.3. Interest accrued 989 959 1430 1824 1532 1700
5.4. Subordinate debt - - - - - -
5.5. Deferred Tax Liabilities 1560 897 47 45 225 171
5.6. Others (including provisions) 4931 6266 4728 5786 2429 3041
Total Liabilities 363216 415264 376349 467333 161629 176667
Source : Annual accounts of Banks of respective years.
Note : Figures in brackets indicate per cent share in total.

140
TABLE B1 : LIABILITIES AND ASSETS OF SCHEDULED COMMERCIAL BANKS - 2012 AND 2013 AS ON MARCH 31OLD PRIVATE SECTOR BANKS
(Amount in ` Million)
(Contd.)
ItemsNainital Bank Ratnakar Bank South Indian Bank
2012 2013 2012 2013 2012 2013(19) (20) (21) (22) (23) (24)
1. Capital 675 675 2149 2529 1134 1339(1.7) (1.6) (3.0) (2.0) (0.3) (0.3)
2. Reserves and Surplus 2994 3332 9282 13538 20570 28724(7.6) (7.7) (12.9) (10.4) (5.1) (5.8)
2.1 Statutory Reserves 782 909 557 797 4588 5844 2.2 Capital Reserves 50 50 82 102 370 432 2.3 Share Premium 635 635 7884 11388 5162 9452 2.4 Investments Fluctuations Reserves 18 18 12 12 84 27 2.5 Revenue and other Reserves 1509 1719 748 1237 10133 12598 2.6 Balance of Profit - - 1 2 232 3703. Deposits 34775 37236 47393 83405 365005 442623
(87.8) (86.2) (65.8) (64.3) (90.4) (88.9)Type-wise 3A.1. Demand deposits 1838 2119 5870 11099 12618 15474 (i) From banks 26 24 45 182 4 76 (ii) From others 1812 2094 5825 10916 12614 15398 3A.2. Savings bank deposits 10947 12553 4323 5345 59175 66855 3A.3. Term deposits 21991 22565 37200 66962 293212 360295 (i) From banks 3994 3485 8326 9779 32103 31781 (ii) From others 17997 19080 28874 57182 261109 328514Location-wise 3B.1. Deposits of branches in India 34775 37236 47393 83405 365005 442623 3B.2. Deposits of branches outside India - - - - - -4. Borrowings 81 74 11986 27373 5882 12846
(0.2) (0.2) (16.6) (21.1) (1.5) (2.6) 4.1. Borrowings in India 81 74 11853 26145 4486 6403 (i) From Reserve Bank of India - - 3150 7023 - - (ii) From other banks - - 1000 1000 - - (iii) From other institutions and agencies 81 74 7703 18122 4486 6403 4.2. Borrowings outside India - - 133 1229 1396 6442 Secured borrowings included in 4. 81 74 750 6996 - -5. Other liabilities & provisions 1076 1864 1242 2787 11109 12420
(2.7) (4.3) (1.7) (2.2) (2.8) (2.5) 5.1. Bills Payable 146 186 117 253 1174 1202 5.2. Inter-office adjustments 30 560 - - 186 - 5.3. Interest accrued 31 29 530 806 2047 1995 5.4. Subordinate debt - - - - - - 5.5. Deferred Tax Liabilities 4 - - - - - 5.6. Others (including provisions) 865 1089 596 1729 7702 9222Total Liabilities 39601 43181 72053 129634 403701 497950

141
TABLE B1 : LIABILITIES AND ASSETS OF SCHEDULED COMMERCIAL BANKS - 2012 AND 2013 AS ON MARCH 31OLD PRIVATE SECTOR BANKS
(Amount in ` Million)
(Contd.)
ItemsTamilnad Mercantile Bank
2012 2013(25) (26)
1. Capital 3 3(0.0) (0.0)
2. Reserves and Surplus 16346 20218(8.0) (8.5)
2.1 Statutory Reserves 5424 6745
2.2 Capital Reserves 52 52
2.3 Share Premium - -
2.4 Investments Fluctuations Reserves - -
2.5 Revenue and other Reserves 10864 13410
2.6 Balance of Profit 5 11
3. Deposits 171104 202238(84.2) (85.4)
Type-wise 3A.1. Demand deposits 13519 14525
(i) From banks - -
(ii) From others 13519 14525
3A.2. Savings bank deposits 21780 23614
3A.3. Term deposits 135806 164099
(i) From banks 3752 5477
(ii) From others 132054 158623
Location-wise 3B.1. Deposits of branches in India 171104 202238
3B.2. Deposits of branches outside India - -
4. Borrowings 4607 2506(2.3) (1.1)
4.1. Borrowings in India 4460 2344
(i) From Reserve Bank of India 700 -
(ii) From other banks 3760 2344
(iii) From other institutions and agencies - -
4.2. Borrowings outside India 147 162
Secured borrowings included in 4. - -
5. Other liabilities & provisions 11033 11879(5.4) (5.0)
5.1. Bills Payable 1666 1345
5.2. Inter-office adjustments - -
5.3. Interest accrued 1191 1293
5.4. Subordinate debt - -
5.5. Deferred Tax Liabilities 412 240
5.6. Others (including provisions) 7763 9000
Total Liabilities 203092 236843
Source : Annual accounts of Banks of respective years.
Note : Figures in brackets indicate per cent share in total.

142
TABLE B1 : LIABILITIES AND ASSETS OF SCHEDULED COMMERCIAL BANKS - 2012 AND 2013 AS ON MARCH 31OLD PRIVATE SECTOR BANKS
(Amount in ` Million)
(Contd.)
ItemsCatholic Syrian Bank City Union Bank Dhanlaxmi Bank
2012 2013 2012 2013 2012 2013(1) (2) (3) (4) (5) (6)
1. Cash in hand 661 847 1746 923 1575 1801(0.5) (0.6) (1.0) (0.4) (1.1) (1.3)
2. Balances with RBI 6204 5446 6401 9240 7104 3297(5.1) (4.0) (3.5) (4.0) (4.8) (2.4)
3. Balances with banks in India 2436 3973 2742 4602 581 2523(2.0) (2.9) (1.5) (2.0) (0.4) (1.8)
4. Money at call and short notice - - 250 2073 - -(0.0) (0.0) (0.1) (0.9) (0.0) (0.0)
5. Balances with banks outside India 409 385 223 867 - -(0.3) (0.3) (0.1) (0.4) (0.0) (0.0)
6. Investments 31451 33011 45862 52668 43602 46845(26.1) (24.2) (25.0) (22.9) (29.7) (33.9)
6.1. Investments in India 31451 33011 45862 52668 43602 46845 (i) Government securities 27909 29549 38472 45644 41637 43554 (ii) Other approved securities - - 3 - - - (iii) Shares 7 17 333 374 58 33 (iv) Debentures and Bonds 823 905 303 304 803 1033 (v) Subsidiaries and/or joint ventures - - - - - - (vi) Others 2713 2540 6751 6346 1104 2225 6.2. Investments outside India - - - - - - (i) Government securities - - - - - - (ii) Subsidiaries and/or joint ventures - - - - - - (iii) Others - - - - - -7. Advances 76635 88515 121375 152461 87581 77771
(63.6) (65.0) (66.1) (66.4) (59.7) (56.3)Type-wise 7A.1. Bills purchased and discounted 1949 2548 3215 2944 2352 1354 7A.2. Cash credits, overdrafts & loans 50889 63680 75272 99706 15089 16317 7A.3. Term loans 23797 22288 42888 49811 70140 60099Security-wise 7B.1. Secured by tangible assets 71781 82828 115503 146811 76124 69926 7B.2. Covered by Bank/Govt. Guarantees 1845 2567 1999 2685 2335 248 7B.3. Unsecured 3009 3120 3873 2965 9121 7596Sector-wise 7C.I. Advances in India 76635 88515 121375 152461 87581 77771 (i) Priority sectors 25886 19138 43978 57402 28103 22499 (ii) Public sectors 2913 2878 1999 2685 175 364 (iii) Banks 1653 40 - - - 33 (iv) others 46184 66459 75398 92374 59302 54874 7C.II. Advances outside India - - - - - -8. Fixed Assets 757 1692 977 1413 1487 1358
(0.6) (1.2) (0.5) (0.6) (1.0) (1.0) 8.1. Premises 425 1303 284 317 254 242 8.2. Fixed assets under construction - - - - 93 104 8.3. Other Fixed assets 332 389 693 1096 1140 10119. Other Assets 1937 2333 3932 5525 4835 4601
(1.6) (1.7) (2.1) (2.4) (3.3) (3.3) 9.1. Inter-office adjustments (net) - - 422 74 10 5 9.2. Interest accrued 706 714 940 1139 1549 1651 9.3. Tax paid 388 185 1716 2939 756 743 9.4. Stationery and Stamps 11 11 5 4 6 9 9.5. Others 832 1424 849 1369 2515 2193Total Assets 120491 136201 183507 229771 146765 138195
Note : Figures in brackets indicate per cent share in total.
Source : Annual accounts of Banks of respective years

143
TABLE B1 : LIABILITIES AND ASSETS OF SCHEDULED COMMERCIAL BANKS - 2012 AND 2013 AS ON MARCH 31OLD PRIVATE SECTOR BANKS
(Amount in ` Million)
(Contd.)
ItemsFederal Bank ING Vysya Bank Jammu & Kashmir Bank
2012 2013 2012 2013 2012 2013(7) (8) (9) (10) (11) (12)
1. Cash in hand 3958 5289 3865 5711 1935 2012(0.7) (0.7) (0.8) (1.0) (0.3) (0.3)
2. Balances with RBI 20283 22136 15959 13736 25901 24940(3.3) (3.1) (3.4) (2.5) (4.3) (3.5)
3. Balances with banks in India 4633 6890 1991 1656 5361 13936(0.8) (1.0) (0.4) (0.3) (0.9) (1.9)
4. Money at call and short notice 5046 - 9691 6583 11240 13000(0.8) (0.0) (2.1) (1.2) (1.9) (1.8)
5. Balances with banks outside India 1406 2885 801 649 101 156(0.2) (0.4) (0.2) (0.1) (0.0) (0.0)
6. Investments 174025 211546 127155 182782 216243 257411(28.7) (29.8) (27.1) (33.3) (35.9) (35.9)
6.1. Investments in India 174025 211546 127155 182782 216243 257411 (i) Government securities 115312 145751 89689 125117 115461 140601 (ii) Other approved securities - - - - 88 70 (iii) Shares 1907 2564 590 590 3080 2063 (iv) Debentures and Bonds 9604 8017 1876 2712 20015 24319 (v) Subsidiaries and/or joint ventures 3959 3980 21 21 - - (vi) Others 43242 51234 34979 54343 77599 90358 6.2. Investments outside India - - - - - - (i) Government securities - - - - - - (ii) Subsidiaries and/or joint ventures - - - - - - (iii) Others - - - - - -7. Advances 377560 440967 287214 317720 330774 392004
(62.3) (62.1) (61.1) (57.9) (54.9) (54.6)Type-wise 7A.1. Bills purchased and discounted 18538 14939 12238 12317 10903 7793 7A.2. Cash credits, overdrafts & loans 216832 265154 112557 148683 74045 99471 7A.3. Term loans 142189 160874 162419 156720 245825 284740Security-wise 7B.1. Secured by tangible assets 262781 340828 253325 294455 272024 322805 7B.2. Covered by Bank/Govt. Guarantees 28641 26926 1586 1157 4362 1027 7B.3. Unsecured 86137 73213 32303 22109 54388 68172Sector-wise 7C.I. Advances in India 377560 440967 287214 317720 330774 392004 (i) Priority sectors 121885 114957 94940 109524 99610 114484 (ii) Public sectors 28176 22667 36 368 9747 3415 (iii) Banks 45 30 28 43 3748 1299 (iv) others 227455 303314 192210 207786 217670 272806 7C.II. Advances outside India - - - - - -8. Fixed Assets 3261 3975 5008 4996 4203 4562
(0.5) (0.6) (1.1) (0.9) (0.7) (0.6) 8.1. Premises 1637 1604 3710 3655 2686 2698 8.2. Fixed assets under construction - - 106 159 52 127 8.3. Other Fixed assets 1625 2371 1192 1182 1465 17379. Other Assets 16096 16808 18155 14531 6933 9413
(2.7) (2.4) (3.9) (2.6) (1.2) (1.3) 9.1. Inter-office adjustments (net) - - - - - 253 9.2. Interest accrued 3995 4274 2248 2653 3899 4274 9.3. Tax paid 6205 5674 1366 1666 616 1202 9.4. Stationery and Stamps 27 30 9 14 21 38 9.5. Others 5869 6831 14532 10198 2397 3646Total Assets 606268 710496 469838 548364 602692 717433

144
TABLE B1 : LIABILITIES AND ASSETS OF SCHEDULED COMMERCIAL BANKS - 2012 AND 2013 AS ON MARCH 31OLD PRIVATE SECTOR BANKS
(Amount in ` Million)
(Contd.)
ItemsKarnataka Bank Karur Vysya Bank Lakshmi Vilas Bank
2012 2013 2012 2013 2012 2013(13) (14) (15) (16) (17) (18)
1. Cash in hand 2080 2737 3058 3710 1796 1846(0.6) (0.7) (0.8) (0.8) (1.1) (1.0)
2. Balances with RBI 14967 14443 16150 12577 6304 5435(4.1) (3.5) (4.3) (2.7) (3.9) (3.1)
3. Balances with banks in India 719 1050 758 1395 204 1268(0.2) (0.3) (0.2) (0.3) (0.1) (0.7)
4. Money at call and short notice 250 699 - - - -(0.1) (0.2) (0.0) (0.0) (0.0) (0.0)
5. Balances with banks outside India 640 610 387 279 163 170(0.2) (0.1) (0.1) (0.1) (0.1) (0.1)
6. Investments 128412 134325 105061 138373 43951 43245(35.4) (32.3) (27.9) (29.6) (27.2) (24.5)
6.1. Investments in India 128412 134325 105061 138373 43951 43245 (i) Government securities 81314 88647 92532 126290 35535 38013 (ii) Other approved securities - - - - 49 - (iii) Shares 1817 1639 890 1453 219 271 (iv) Debentures and Bonds 9426 9744 2422 2647 1631 1331 (v) Subsidiaries and/or joint ventures - - - - - - (vi) Others 35856 34294 9216 7982 6516 3629 6.2. Investments outside India - - - - - - (i) Government securities - - - - - - (ii) Subsidiaries and/or joint ventures - - - - - - (iii) Others - - - - - -7. Advances 207207 252077 239492 294801 101887 117028
(57.0) (60.7) (63.6) (63.1) (63.0) (66.2)Type-wise 7A.1. Bills purchased and discounted 7767 9573 12910 15577 3298 4701 7A.2. Cash credits, overdrafts & loans 106087 129692 172606 229898 58659 77533 7A.3. Term loans 93353 112812 53976 49327 39930 34794Security-wise 7B.1. Secured by tangible assets 166569 209741 220813 277472 88383 107128 7B.2. Covered by Bank/Govt. Guarantees 27217 32146 5377 6155 630 441 7B.3. Unsecured 13421 10190 13303 11174 12874 9459Sector-wise 7C.I. Advances in India 207207 252077 239492 294801 101887 117028 (i) Priority sectors 75703 93626 74895 101499 34977 44510 (ii) Public sectors 14441 16045 3552 6995 - 154 (iii) Banks 5 - - - 141 1 (iv) others 117059 142406 161045 186307 66769 72363 7C.II. Advances outside India - - - - - -8. Fixed Assets 1522 1670 2448 3221 1892 1898
(0.4) (0.4) (0.7) (0.7) (1.2) (1.1) 8.1. Premises 804 795 1065 1074 1252 1228 8.2. Fixed assets under construction - - 5 17 - - 8.3. Other Fixed assets 719 874 1378 2130 640 6709. Other Assets 7418 7655 8993 12978 5431 5776
(2.0) (1.8) (2.4) (2.8) (3.4) (3.3) 9.1. Inter-office adjustments (net) - - 564 366 - 103 9.2. Interest accrued 2220 2401 2318 2661 843 889 9.3. Tax paid 2706 2712 642 1710 2526 1474 9.4. Stationery and Stamps 32 43 71 80 17 19 9.5. Others 2461 2498 5399 8162 2045 3291Total Assets 363216 415264 376349 467333 161629 176667
Note : Figures in brackets indicate per cent share in total.
Source : Annual accounts of Banks of respective years

145
TABLE B1 : LIABILITIES AND ASSETS OF SCHEDULED COMMERCIAL BANKS - 2012 AND 2013 AS ON MARCH 31OLD PRIVATE SECTOR BANKS
(Amount in ` Million)
(Contd.)
ItemsNainital Bank Ratnakar Bank South Indian Bank
2012 2013 2012 2013 2012 2013(19) (20) (21) (22) (23) (24)
1. Cash in hand 209 283 326 546 1919 2380(0.5) (0.7) (0.5) (0.4) (0.5) (0.5)
2. Balances with RBI 1935 1561 2307 2362 13799 14587(4.9) (3.6) (3.2) (1.8) (3.4) (2.9)
3. Balances with banks in India 6187 8891 514 2141 9810 18666(15.6) (20.6) (0.7) (1.7) (2.4) (3.7)
4. Money at call and short notice 100 - 2700 1650 93 5792(0.3) (0.0) (3.7) (1.3) (0.0) (1.2)
5. Balances with banks outside India - - 15 187 784 1934(0.0) (0.0) (0.0) (0.1) (0.2) (0.4)
6. Investments 11331 10356 23338 55714 93999 125235(28.6) (24.0) (32.4) (43.0) (23.3) (25.2)
6.1. Investments in India 11331 10356 23338 55714 93999 125235 (i) Government securities 7169 7259 14308 32626 82132 99823 (ii) Other approved securities - - - - - - (iii) Shares - - 47 47 1678 1692 (iv) Debentures and Bonds 1305 1346 4226 12032 1650 1560 (v) Subsidiaries and/or joint ventures - - - - - - (vi) Others 2857 1751 4757 11009 8539 22160 6.2. Investments outside India - - - - - - (i) Government securities - - - - - - (ii) Subsidiaries and/or joint ventures - - - - - - (iii) Others - - - - - -7. Advances 19152 21552 41323 63762 272807 318155
(48.4) (49.9) (57.4) (49.2) (67.6) (63.9)Type-wise 7A.1. Bills purchased and discounted 95 21 3567 2342 30573 28901 7A.2. Cash credits, overdrafts & loans 10008 11957 8271 11950 139885 157611 7A.3. Term loans 9049 9574 29486 49470 102350 131644Security-wise 7B.1. Secured by tangible assets 18150 20391 36923 57199 243274 280376 7B.2. Covered by Bank/Govt. Guarantees 10 10 - 125 10862 14916 7B.3. Unsecured 992 1151 4400 6438 18671 22863Sector-wise 7C.I. Advances in India 19152 21552 41323 63762 272807 318155 (i) Priority sectors 9484 10800 8440 13151 51183 83149 (ii) Public sectors 2 4 404 - 14456 24479 (iii) Banks 175 311 - - - - (iv) others 9491 10437 32479 50611 207168 210527 7C.II. Advances outside India - - - - - -8. Fixed Assets 129 132 589 943 3775 3961
(0.3) (0.3) (0.8) (0.7) (0.9) (0.8) 8.1. Premises 60 59 62 96 2717 2643 8.2. Fixed assets under construction - - 123 101 - 87 8.3. Other Fixed assets 69 73 403 746 1058 12319. Other Assets 559 406 942 2329 6714 7240
(1.4) (0.9) (1.3) (1.8) (1.7) (1.5) 9.1. Inter-office adjustments (net) - - 23 - - 80 9.2. Interest accrued 408 288 516 1239 3515 3180 9.3. Tax paid - 39 20 97 895 921 9.4. Stationery and Stamps - - 4 12 14 15 9.5. Others 150 79 378 982 2291 3044Total Assets 39601 43181 72053 129634 403701 497950
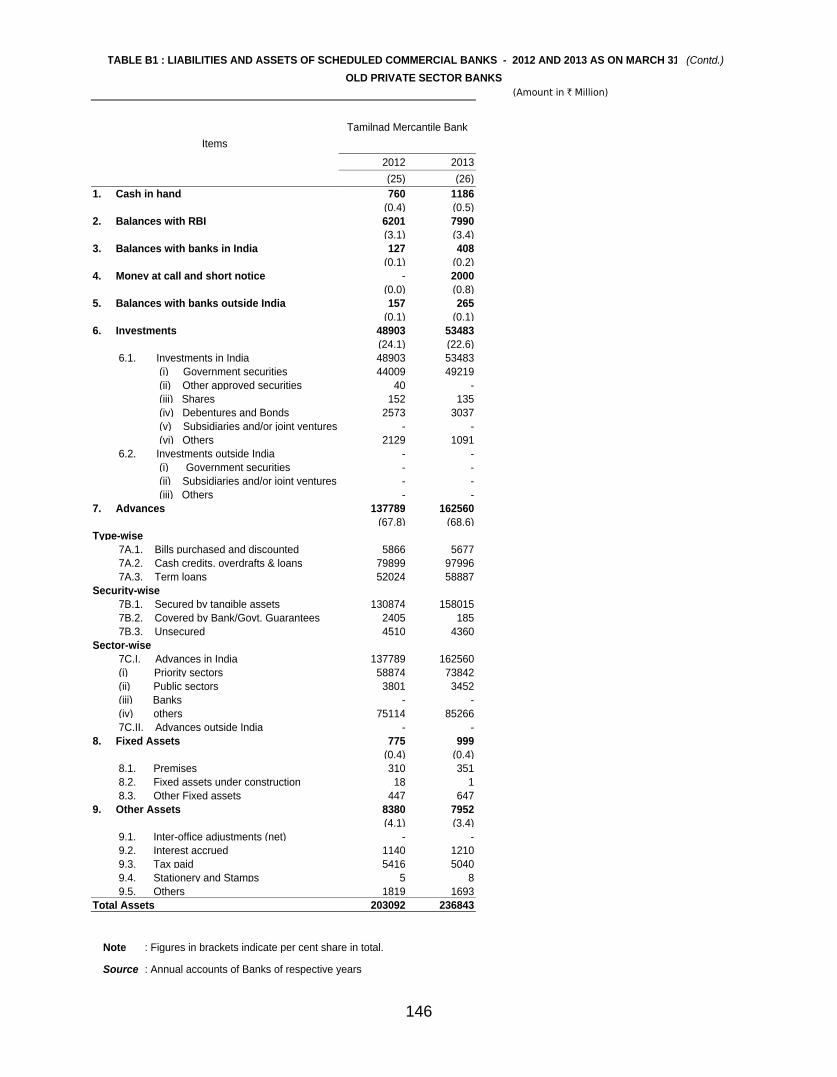
146
TABLE B1 : LIABILITIES AND ASSETS OF SCHEDULED COMMERCIAL BANKS - 2012 AND 2013 AS ON MARCH 31OLD PRIVATE SECTOR BANKS
(Amount in ` Million)
(Contd.)
ItemsTamilnad Mercantile Bank
2012 2013(25) (26)
1. Cash in hand 760 1186(0.4) (0.5)
2. Balances with RBI 6201 7990(3.1) (3.4)
3. Balances with banks in India 127 408(0.1) (0.2)
4. Money at call and short notice - 2000(0.0) (0.8)
5. Balances with banks outside India 157 265(0.1) (0.1)
6. Investments 48903 53483(24.1) (22.6)
6.1. Investments in India 48903 53483 (i) Government securities 44009 49219 (ii) Other approved securities 40 - (iii) Shares 152 135 (iv) Debentures and Bonds 2573 3037 (v) Subsidiaries and/or joint ventures - - (vi) Others 2129 1091 6.2. Investments outside India - - (i) Government securities - - (ii) Subsidiaries and/or joint ventures - - (iii) Others - -7. Advances 137789 162560
(67.8) (68.6)Type-wise 7A.1. Bills purchased and discounted 5866 5677 7A.2. Cash credits, overdrafts & loans 79899 97996 7A.3. Term loans 52024 58887Security-wise 7B.1. Secured by tangible assets 130874 158015 7B.2. Covered by Bank/Govt. Guarantees 2405 185 7B.3. Unsecured 4510 4360Sector-wise 7C.I. Advances in India 137789 162560 (i) Priority sectors 58874 73842 (ii) Public sectors 3801 3452 (iii) Banks - - (iv) others 75114 85266 7C.II. Advances outside India - -8. Fixed Assets 775 999
(0.4) (0.4) 8.1. Premises 310 351 8.2. Fixed assets under construction 18 1 8.3. Other Fixed assets 447 6479. Other Assets 8380 7952
(4.1) (3.4) 9.1. Inter-office adjustments (net) - - 9.2. Interest accrued 1140 1210 9.3. Tax paid 5416 5040 9.4. Stationery and Stamps 5 8 9.5. Others 1819 1693Total Assets 203092 236843
Note : Figures in brackets indicate per cent share in total.
Source : Annual accounts of Banks of respective years

147
TABLE B1 : LIABILITIES AND ASSETS OF SCHEDULED COMMERCIAL BANKS - 2012 AND 2013 AS ON MARCH 31NEW PRIVATE SECTOR BANKS
(Amount in ` Million)
(Contd.)
ItemsAxis Bank Development Credit Bank HDFC Bank
2012 2013 2012 2013 2012 2013(1) (2) (3) (4) (5) (6)
1. Capital 4132 4680 2407 2501 4693 4759(0.1) (0.1) (2.8) (2.2) (0.1) (0.1)
2. Reserves and Surplus 223953 326399 6207 7529 294553 357383(7.8) (9.6) (7.2) (6.7) (8.7) (8.9)
2.1 Statutory Reserves 38426 51374 1115 1370 53093 69908
2.2 Capital Reserves 5425 9460 902 913 2955 3813
2.3 Share Premium 101388 157615 7362 7674 124262 135149
2.4 Investments Fluctuations Reserves - 535 34 37 - 177
2.5 Revenue and other Reserves 5420 7122 28 30 30248 37014
2.6 Balance of Profit 73294 100293 -3234 -2495 83996 111322
3. Deposits 2201043 2526136 63356 83638 2467064 2962470(77.1) (74.2) (73.0) (74.2) (73.0) (74.0)
Type-wise 3A.1. Demand deposits 397541 483221 8392 8992 454078 523103
(i) From banks 20981 29256 186 159 9122 10385
(ii) From others 376560 453965 8207 8833 444956 512718
3A.2. Savings bank deposits 516680 637777 11954 13724 739980 882112
3A.3. Term deposits 1286823 1405138 43009 60922 1273006 1557255
(i) From banks 100944 151219 2208 7660 13840 14279
(ii) From others 1185879 1253919 40801 53262 1259166 1542976
Location-wise 3B.1. Deposits of branches in India 2094496 2386893 63356 83638 2457707 2946407
3B.2. Deposits of branches outside India 106547 139243 - - 9358 16063
4. Borrowings 340717 439511 11235 15256 238465 330066(11.9) (12.9) (12.9) (13.5) (7.1) (8.2)
4.1. Borrowings in India 126833 166452 9925 14456 143245 194826
(i) From Reserve Bank of India 1150 - - 2900 400 2750
(ii) From other banks 4472 22367 7000 7100 8693 7247
(iii) From other institutions and agencies 121211 144085 2925 4456 134151 184829
4.2. Borrowings outside India 213884 273059 1310 800 95220 135240
Secured borrowings included in 4. - - 999 3400 - -
5. Other liabilities & provisions 86433 108881 3565 3863 374319 348642(3.0) (3.2) (4.1) (3.4) (11.1) (8.7)
5.1. Bills Payable 30853 35288 1327 1437 54657 54788
5.2. Inter-office adjustments - - - - - -
5.3. Interest accrued 6478 8267 895 1057 52071 62714
5.4. Subordinate debt - - - - - -
5.5. Deferred Tax Liabilities - - - - - -
5.6. Others (including provisions) 49101 65326 1343 1369 267591 231140
Total Liabilities 2856278 3405607 86768 112788 3379095 4003319
Source : Annual accounts of Banks of respective years.
Note : Figures in brackets indicate per cent share in total.

148
TABLE B1 : LIABILITIES AND ASSETS OF SCHEDULED COMMERCIAL BANKS - 2012 AND 2013 AS ON MARCH 31NEW PRIVATE SECTOR BANKS
(Amount in ` Million)
(Contd.)
ItemsICICI Bank IndusInd Bank Kotak Mahindra Bank
2012 2013 2012 2013 2012 2013(7) (8) (9) (10) (11) (12)
1. Capital 11528 11536 4677 5229 3703 3733(0.2) (0.2) (0.8) (0.7) (0.6) (0.4)
2. Reserves and Surplus 592525 655523 42740 71074 76104 90912(12.1) (12.2) (7.4) (9.7) (11.6) (10.9)
2.1 Statutory Reserves 89917 110737 5685 8338 9229 12631 2.2 Capital Reserves 21843 22173 1273 1357 289 289 2.3 Share Premium 313591 314030 21551 41180 39314 41284 2.4 Investments Fluctuations Reserves - - 39 43 306 411 2.5 Revenue and other Reserves 96632 109561 2316 2248 5338 6130 2.6 Balance of Profit 70542 99023 11876 17909 21628 301663. Deposits 2555000 2926136 423615 541167 385365 510288
(52.2) (54.5) (73.5) (73.8) (58.7) (61.0)Type-wise 3A.1. Demand deposits 349731 369255 68689 88346 73523 76502 (i) From banks 19678 20386 1287 8822 1206 1596 (ii) From others 330052 348869 67403 79524 72317 74905 3A.2. Savings bank deposits 760463 856507 46941 70328 50501 72681 3A.3. Term deposits 1444806 1700374 307985 382494 261341 361105 (i) From banks 98705 117888 37391 11990 3425 8842 (ii) From others 1346101 1582485 270594 370503 257916 352263Location-wise 3B.1. Deposits of branches in India 2423718 2750259 423615 541167 385365 510288 3B.2. Deposits of branches outside India 131282 175878 - - - -4. Borrowings 1401649 1453415 86820 94596 165955 204106
(28.7) (27.1) (15.1) (12.9) (25.3) (24.4) 4.1. Borrowings in India 556554 583925 65718 73468 126068 158267 (i) From Reserve Bank of India 170550 156250 - - 56095 85169 (ii) From other banks 18816 18714 22571 30359 19904 25668 (iii) From other institutions and agencies 367188 408960 43147 43108 50069 47430 4.2. Borrowings outside India 845095 869490 21102 21128 39888 45840 Secured borrowings included in 4. - - - - 9756 94105. Other liabilities & provisions 329987 321336 18108 21000 25540 27898
(6.7) (6.0) (3.1) (2.9) (3.9) (3.3) 5.1. Bills Payable 35556 39160 3722 3513 5701 6569 5.2. Inter-office adjustments 3076 1347 178 231 - - 5.3. Interest accrued 30693 29178 3180 4000 4050 4479 5.4. Subordinate debt - - - - - - 5.5. Deferred Tax Liabilities - - - - - - 5.6. Others (including provisions) 260661 251650 11028 13256 15789 16850Total Liabilities 4890688 5367947 575961 733065 656668 836937

149
TABLE B1 : LIABILITIES AND ASSETS OF SCHEDULED COMMERCIAL BANKS - 2012 AND 2013 AS ON MARCH 31NEW PRIVATE SECTOR BANKS
(Amount in ` Million)
(Contd.)
ItemsYes Bank
2012 2013(13) (14)
1. Capital 3530 3586(0.5) (0.4)
2. Reserves and Surplus 43236 54490(5.9) (5.5)
2.1 Statutory Reserves 7089 10340
2.2 Capital Reserves 1395 1743
2.3 Share Premium 18169 18926
2.4 Investments Fluctuations Reserves 1 98
2.5 Revenue and other Reserves - -
2.6 Balance of Profit 16584 23384
3. Deposits 491517 669556(66.8) (67.6)
Type-wise 3A.1. Demand deposits 48884 66649
(i) From banks 3868 1777
(ii) From others 45015 64872
3A.2. Savings bank deposits 25038 60227
3A.3. Term deposits 417596 542681
(i) From banks 35066 41594
(ii) From others 382529 501087
Location-wise 3B.1. Deposits of branches in India 491517 669556
3B.2. Deposits of branches outside India - -
4. Borrowings 141565 209221(19.2) (21.1)
4.1. Borrowings in India 103347 162683
(i) From Reserve Bank of India 23500 48959
(ii) From other banks 24295 30833
(iii) From other institutions and agencies 55552 82891
4.2. Borrowings outside India 38218 46539
Secured borrowings included in 4. 23500 49896
5. Other liabilities & provisions 56409 54187(7.7) (5.5)
5.1. Bills Payable 1948 1326
5.2. Inter-office adjustments - -
5.3. Interest accrued 6633 8714
5.4. Subordinate debt - -
5.5. Deferred Tax Liabilities - -
5.6. Others (including provisions) 47827 44148
Total Liabilities 736257 991041
Source : Annual accounts of Banks of respective years.
Note : Figures in brackets indicate per cent share in total.

150
TABLE B1 : LIABILITIES AND ASSETS OF SCHEDULED COMMERCIAL BANKS - 2012 AND 2013 AS ON MARCH 31NEW PRIVATE SECTOR BANKS
(Amount in ` Million)
(Contd.)
ItemsAxis Bank Development Credit Bank HDFC Bank
2012 2013 2012 2013 2012 2013(1) (2) (3) (4) (5) (6)
1. Cash in hand 35957 40539 857 906 43070 50077(1.3) (1.2) (1.0) (0.8) (1.3) (1.3)
2. Balances with RBI 71072 107382 3218 2882 106841 96197(2.5) (3.2) (3.7) (2.6) (3.2) (2.4)
3. Balances with banks in India 9663 12845 322 519 20158 49873(0.3) (0.4) (0.4) (0.5) (0.6) (1.2)
4. Money at call and short notice 11135 18669 - 3107 33704 62635(0.4) (0.5) (0.0) (2.8) (1.0) (1.6)
5. Balances with banks outside India 11512 24915 168 1418 5605 14019(0.4) (0.7) (0.2) (1.3) (0.2) (0.4)
6. Investments 931921 1137375 25178 33587 974829 1116136(32.6) (33.4) (29.0) (29.8) (28.8) (27.9)
6.1. Investments in India 924648 1128594 25178 33587 974823 1111105 (i) Government securities 584162 722499 20218 24332 762178 849023 (ii) Other approved securities - - - - 5 - (iii) Shares 7400 7549 2 2 836 1245 (iv) Debentures and Bonds 231508 260744 30 30 9628 17261 (v) Subsidiaries and/or joint ventures 3496 4214 - - 7548 7548 (vi) Others 98083 133588 4927 9223 194627 236028 6.2. Investments outside India 7273 8782 - - 6 5031 (i) Government securities 1170 2683 - - - - (ii) Subsidiaries and/or joint ventures - - - - - - (iii) Others 6103 6098 - - 6 50317. Advances 1697595 1969660 52844 65861 1954200 2397206
(59.4) (57.8) (60.9) (58.4) (57.8) (59.9)Type-wise 7A.1. Bills purchased and discounted 39089 56079 3087 2624 122124 123219 7A.2. Cash credits, overdrafts & loans 468609 546437 18225 20948 686272 945870 7A.3. Term loans 1189898 1367143 31532 42288 1145804 1328118Security-wise 7B.1. Secured by tangible assets 1417163 1613648 45941 62793 1420598 1766064 7B.2. Covered by Bank/Govt. Guarantees 50234 18089 - - 55553 61551 7B.3. Unsecured 230198 337922 6904 3068 478050 569591Sector-wise 7C.I. Advances in India 1444574 1668331 52844 65861 1894985 2301248 (i) Priority sectors 484792 484983 19196 21197 638630 767430 (ii) Public sectors 32536 39190 17 29 70539 84217 (iii) Banks 3478 449 5 150 3714 917 (iv) others 923768 1143710 33626 44485 1182102 1448683 7C.II. Advances outside India 253022 301328 - - 59216 959588. Fixed Assets 22593 23556 1846 2394 23472 27031
(0.8) (0.7) (2.1) (2.1) (0.7) (0.7) 8.1. Premises 8740 8632 828 1940 8031 8726 8.2. Fixed assets under construction 708 1251 588 34 - - 8.3. Other Fixed assets 13146 13674 431 421 15441 183059. Other Assets 64829 70666 2335 2114 217216 190144
(2.3) (2.1) (2.7) (1.9) (6.4) (4.7) 9.1. Inter-office adjustments (net) - - - - - - 9.2. Interest accrued 24195 27144 386 492 32002 39209 9.3. Tax paid 1185 270 927 931 12091 15789 9.4. Stationery and Stamps 13 11 4 4 166 166 9.5. Others 39437 43240 1018 687 172957 134980Total Assets 2856278 3405607 86768 112788 3379095 4003319

151
TABLE B1 : LIABILITIES AND ASSETS OF SCHEDULED COMMERCIAL BANKS - 2012 AND 2013 AS ON MARCH 31NEW PRIVATE SECTOR BANKS
(Amount in ` Million)
(Contd.)
ItemsICICI Bank IndusInd Bank Kotak Mahindra Bank
2012 2013 2012 2013 2012 2013(7) (8) (9) (10) (11) (12)
1. Cash in hand 46696 46775 3204 3968 3116 3303(1.0) (0.9) (0.6) (0.5) (0.5) (0.4)
2. Balances with RBI 157917 143752 25832 28530 17049 18776(3.2) (2.7) (4.5) (3.9) (2.6) (2.2)
3. Balances with banks in India 39651 39471 11006 19236 1258 4662(0.8) (0.7) (1.9) (2.6) (0.2) (0.6)
4. Money at call and short notice 59530 77799 13457 15007 - 4565(1.2) (1.4) (2.3) (2.0) (0.0) (0.5)
5. Balances with banks outside India 58500 106378 1897 1745 4923 5586(1.2) (2.0) (0.3) (0.2) (0.7) (0.7)
6. Investments 1595600 1713936 145719 196542 215668 288734(32.6) (31.9) (25.3) (26.8) (32.8) (34.5)
6.1. Investments in India 1514212 1636199 145719 196542 215529 288593 (i) Government securities 869480 923763 119019 141083 165872 215621 (ii) Other approved securities 4 - - - - - (iii) Shares 22923 25051 537 580 40 182 (iv) Debentures and Bonds 195135 174775 2386 7538 16300 42364 (v) Subsidiaries and/or joint ventures 64797 65483 5 5 3290 3851 (vi) Others 361872 447127 23773 47335 30027 26577 6.2. Investments outside India 81389 77737 - - 139 141 (i) Government securities 4400 6575 - - - - (ii) Subsidiaries and/or joint ventures 66864 62475 - - 138 138 (iii) Others 10125 8687 - - 1 37. Advances 2537277 2902494 350640 443206 390792 484690
(51.9) (54.1) (60.9) (60.5) (59.5) (57.9)Type-wise 7A.1. Bills purchased and discounted 48694 61532 8197 11529 16264 13719 7A.2. Cash credits, overdrafts & loans 334852 451093 85166 107752 73942 97710 7A.3. Term loans 2153731 2389869 257277 323925 300586 373261Security-wise 7B.1. Secured by tangible assets 2138141 2471296 299302 393343 325799 414223 7B.2. Covered by Bank/Govt. Guarantees 13869 22221 22799 7753 - - 7B.3. Unsecured 385266 408977 28538 42111 64993 70467Sector-wise 7C.I. Advances in India 1843247 2168924 350640 443206 390792 484690 (i) Priority sectors 592856 597940 125065 143236 122966 140193 (ii) Public sectors 11968 13438 4494 6340 1450 1922 (iii) Banks 155 188 603 249 - - (iv) others 1238268 1557357 220477 293382 266377 342575 7C.II. Advances outside India 694029 733570 - - - -8. Fixed Assets 46147 46471 6568 7561 4500 4644
(0.9) (0.9) (1.1) (1.0) (0.7) (0.6) 8.1. Premises 31709 31279 3579 3615 1756 1742 8.2. Fixed assets under construction - - 427 155 - - 8.3. Other Fixed assets 14438 15192 2562 3791 2744 29029. Other Assets 349371 290871 17638 17269 19362 21977
(7.1) (5.4) (3.1) (2.4) (2.9) (2.6) 9.1. Inter-office adjustments (net) - - - - - - 9.2. Interest accrued 42175 44902 3558 4611 5981 8223 9.3. Tax paid 34162 36098 1499 1936 - - 9.4. Stationery and Stamps 10 10 20 26 35 25 9.5. Others 273024 209860 12560 10696 13347 13729Total Assets 4890688 5367947 575961 733065 656668 836937
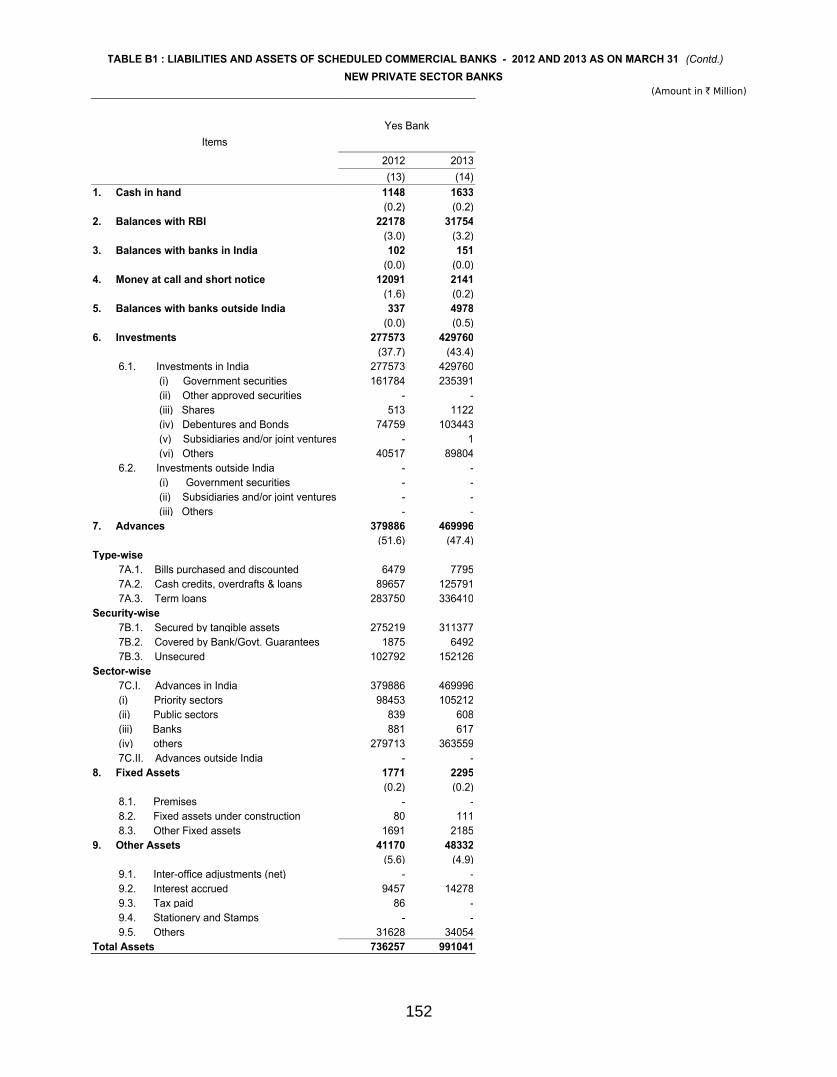
152
TABLE B1 : LIABILITIES AND ASSETS OF SCHEDULED COMMERCIAL BANKS - 2012 AND 2013 AS ON MARCH 31NEW PRIVATE SECTOR BANKS
(Amount in ` Million)
(Contd.)
ItemsYes Bank
2012 2013(13) (14)
1. Cash in hand 1148 1633(0.2) (0.2)
2. Balances with RBI 22178 31754(3.0) (3.2)
3. Balances with banks in India 102 151(0.0) (0.0)
4. Money at call and short notice 12091 2141(1.6) (0.2)
5. Balances with banks outside India 337 4978(0.0) (0.5)
6. Investments 277573 429760(37.7) (43.4)
6.1. Investments in India 277573 429760 (i) Government securities 161784 235391 (ii) Other approved securities - - (iii) Shares 513 1122 (iv) Debentures and Bonds 74759 103443 (v) Subsidiaries and/or joint ventures - 1 (vi) Others 40517 89804 6.2. Investments outside India - - (i) Government securities - - (ii) Subsidiaries and/or joint ventures - - (iii) Others - -7. Advances 379886 469996
(51.6) (47.4)Type-wise 7A.1. Bills purchased and discounted 6479 7795 7A.2. Cash credits, overdrafts & loans 89657 125791 7A.3. Term loans 283750 336410Security-wise 7B.1. Secured by tangible assets 275219 311377 7B.2. Covered by Bank/Govt. Guarantees 1875 6492 7B.3. Unsecured 102792 152126Sector-wise 7C.I. Advances in India 379886 469996 (i) Priority sectors 98453 105212 (ii) Public sectors 839 608 (iii) Banks 881 617 (iv) others 279713 363559 7C.II. Advances outside India - -8. Fixed Assets 1771 2295
(0.2) (0.2) 8.1. Premises - - 8.2. Fixed assets under construction 80 111 8.3. Other Fixed assets 1691 21859. Other Assets 41170 48332
(5.6) (4.9) 9.1. Inter-office adjustments (net) - - 9.2. Interest accrued 9457 14278 9.3. Tax paid 86 - 9.4. Stationery and Stamps - - 9.5. Others 31628 34054Total Assets 736257 991041

153
TABLE B1 : LIABILITIES AND ASSETS OF SCHEDULED COMMERCIAL BANKS - 2012 AND 2013 AS ON MARCH 31FOREIGN BANKS
(Amount in ` Million)
(Contd.)
ItemsAB Bank Abu Dhabi Commercial
BankAmerican Express
Banking Corp.
2012 2013 2012 2013 2012 2013(1) (2) (3) (4) (5) (6)
1. Capital 370 370 2170 2170 6177 7527
(32.3) (18.7) (17.8) (13.3) (29.0) (29.6)
2. Reserves and Surplus 301 381 922 1104 77 77
(26.3) (19.2) (7.6) (6.7) (0.4) (0.3)
2.1 Statutory Reserves 124 144 341 386 77 77
2.2 Capital Reserves - - 15 15 - -
2.3 Share Premium - - - - - -
2.4 Investments Fluctuations Reserves 8 - - 2 - -
2.5 Revenue and other Reserves - - 566 701 - -
2.6 Balance of Profit 169 237 - - - -
3. Deposits 447 1214 6234 7043 5013 6747
(39.0) (61.2) (51.1) (43.0) (23.5) (26.6)
Type-wise
3A.1. Demand deposits 344 1112 618 1088 - -
(i) From banks 302 981 39 49 - -
(ii) From others 41 131 578 1040 - -
3A.2. Savings bank deposits 7 13 899 870 - -
3A.3. Term deposits 96 89 4718 5085 5013 6747
(i) From banks - - - 50 - -
(ii) From others 96 89 4718 5035 5013 6747
Location-wise
3B.1. Deposits of branches in India 447 1214 6234 7043 5013 6747
3B.2. Deposits of branches outside India - - - - - -
4. Borrowings - - 2544 5545 5633 4715
- - (20.9) (33.9) (26.4) (18.6)
4.1. Borrowings in India - - 2290 3591 5633 4715
(i) From Reserve Bank of India - - 100 341 - -
(ii) From other banks - - 2190 3250 5633 4715
(iii) From other institutions and agencies - - - - - -
4.2. Borrowings outside India - - 254 1954 - -
Secured borrowings included in 4. - - 100 341 - -
5. Other liabilities & provisions 27 18 324 515 4437 6335
(2.4) (0.9) (2.7) (3.1) (20.8) (24.9)
5.1. Bills Payable - - 70 141 - -
5.2. Inter-office adjustments - - - - - -
5.3. Interest accrued 1 1 120 165 140 171
5.4. Subordinate debt - - - - - -
5.5. Deferred Tax Liabilities - - 17 31 - -
5.6. Others (including provisions) 26 17 116 179 4297 6164
Total Liabilities 1145 1983 12194 16378 21337 25402
Source : Annual accounts of Banks of respective years.
Note : Figures in brackets indicate per cent share in total.
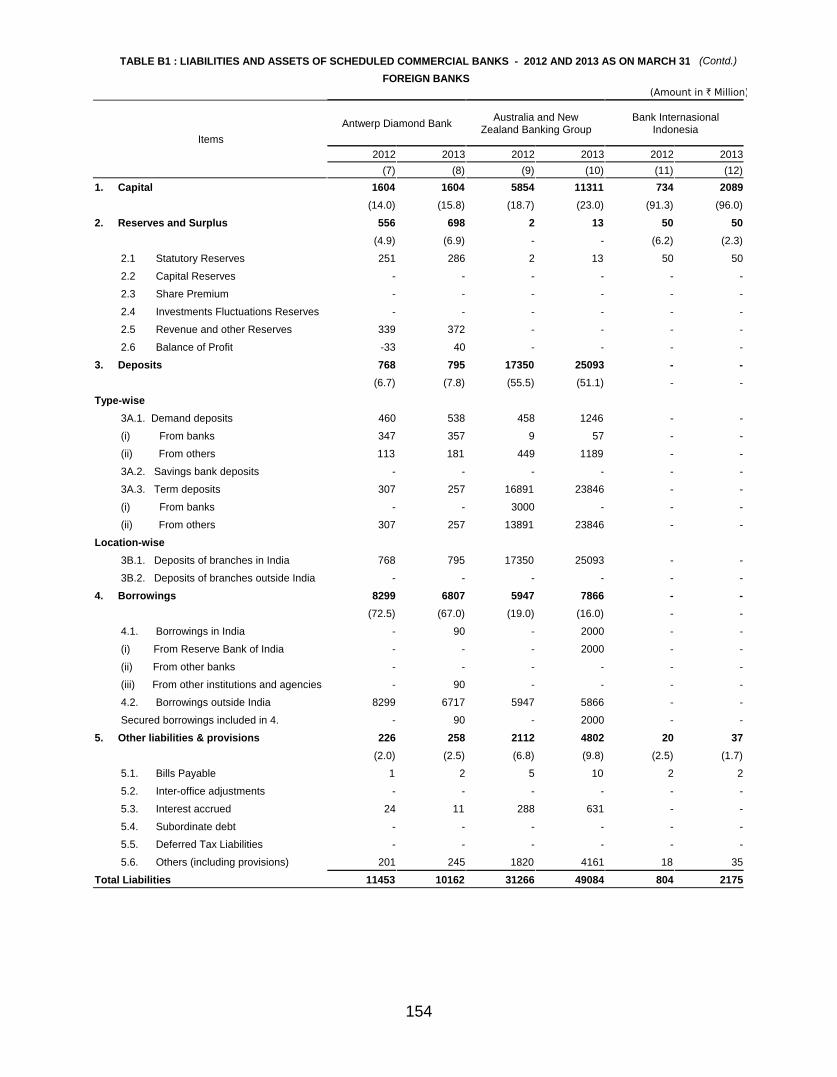
154
TABLE B1 : LIABILITIES AND ASSETS OF SCHEDULED COMMERCIAL BANKS - 2012 AND 2013 AS ON MARCH 31FOREIGN BANKS
(Amount in ` Million)
(Contd.)
ItemsAntwerp Diamond Bank Australia and New
Zealand Banking GroupBank Internasional
Indonesia
2012 2013 2012 2013 2012 2013(7) (8) (9) (10) (11) (12)
1. Capital 1604 1604 5854 11311 734 2089
(14.0) (15.8) (18.7) (23.0) (91.3) (96.0)
2. Reserves and Surplus 556 698 2 13 50 50
(4.9) (6.9) - - (6.2) (2.3)
2.1 Statutory Reserves 251 286 2 13 50 50
2.2 Capital Reserves - - - - - -
2.3 Share Premium - - - - - -
2.4 Investments Fluctuations Reserves - - - - - -
2.5 Revenue and other Reserves 339 372 - - - -
2.6 Balance of Profit -33 40 - - - -
3. Deposits 768 795 17350 25093 - -
(6.7) (7.8) (55.5) (51.1) - -
Type-wise
3A.1. Demand deposits 460 538 458 1246 - -
(i) From banks 347 357 9 57 - -
(ii) From others 113 181 449 1189 - -
3A.2. Savings bank deposits - - - - - -
3A.3. Term deposits 307 257 16891 23846 - -
(i) From banks - - 3000 - - -
(ii) From others 307 257 13891 23846 - -
Location-wise
3B.1. Deposits of branches in India 768 795 17350 25093 - -
3B.2. Deposits of branches outside India - - - - - -
4. Borrowings 8299 6807 5947 7866 - -
(72.5) (67.0) (19.0) (16.0) - -
4.1. Borrowings in India - 90 - 2000 - -
(i) From Reserve Bank of India - - - 2000 - -
(ii) From other banks - - - - - -
(iii) From other institutions and agencies - 90 - - - -
4.2. Borrowings outside India 8299 6717 5947 5866 - -
Secured borrowings included in 4. - 90 - 2000 - -
5. Other liabilities & provisions 226 258 2112 4802 20 37
(2.0) (2.5) (6.8) (9.8) (2.5) (1.7)
5.1. Bills Payable 1 2 5 10 2 2
5.2. Inter-office adjustments - - - - - -
5.3. Interest accrued 24 11 288 631 - -
5.4. Subordinate debt - - - - - -
5.5. Deferred Tax Liabilities - - - - - -
5.6. Others (including provisions) 201 245 1820 4161 18 35
Total Liabilities 11453 10162 31266 49084 804 2175

155
TABLE B1 : LIABILITIES AND ASSETS OF SCHEDULED COMMERCIAL BANKS - 2012 AND 2013 AS ON MARCH 31FOREIGN BANKS
(Amount in ` Million)
(Contd.)
ItemsBank of America Bank of Bahrain & Kuwait Bank of Ceylon
2012 2013 2012 2013 2012 2013(13) (14) (15) (16) (17) (18)
1. Capital 9853 9853 2027 2027 1150 1150
(6.1) (5.3) (17.1) (17.4) (41.4) (37.2)
2. Reserves and Surplus 30613 35306 684 858 471 607
(18.9) (19.1) (5.8) (7.4) (17.0) (19.6)
2.1 Statutory Reserves 8518 9691 304 348 180 214
2.2 Capital Reserves 3222 3458 27 27 - -
2.3 Share Premium - - - - - -
2.4 Investments Fluctuations Reserves - 27 10 14 - -
2.5 Revenue and other Reserves 14932 14876 342 470 - -
2.6 Balance of Profit 3941 7254 - - 291 393
3. Deposits 59649 73780 6719 6958 1048 1194
(36.9) (40.0) (56.5) (59.6) (37.8) (38.6)
Type-wise
3A.1. Demand deposits 29353 40772 1671 909 358 432
(i) From banks 1708 1918 60 6 156 289
(ii) From others 27645 38854 1611 903 202 143
3A.2. Savings bank deposits 1988 2299 698 608 62 80
3A.3. Term deposits 28308 30709 4349 5441 628 682
(i) From banks - - 2 7 - -
(ii) From others 28308 30709 4347 5433 628 682
Location-wise
3B.1. Deposits of branches in India 59649 73780 6719 6958 1048 1194
3B.2. Deposits of branches outside India - - - - - -
4. Borrowings 53144 57133 2212 1557 56 84
(32.8) (31.0) (18.6) (13.3) (2.0) (2.7)
4.1. Borrowings in India 43298 41964 940 960 56 84
(i) From Reserve Bank of India 8200 12750 450 750 - -
(ii) From other banks 8000 4200 490 210 - -
(iii) From other institutions and agencies 27098 25014 - - 56 84
4.2. Borrowings outside India 9846 15169 1272 597 - -
Secured borrowings included in 4. 35298 37764 450 750 - -
5. Other liabilities & provisions 8520 8299 244 276 50 58
(5.3) (4.5) (2.1) (2.4) (1.8) (1.9)
5.1. Bills Payable 1217 1091 9 8 6 7
5.2. Inter-office adjustments 68 44 - - - -
5.3. Interest accrued 260 251 55 53 8 5
5.4. Subordinate debt - - - - - -
5.5. Deferred Tax Liabilities - - - - - 1
5.6. Others (including provisions) 6975 6912 180 214 36 44
Total Liabilities 161779 184371 11886 11677 2774 3093
Source : Annual accounts of Banks of respective years.
Note : Figures in brackets indicate per cent share in total.

156
TABLE B1 : LIABILITIES AND ASSETS OF SCHEDULED COMMERCIAL BANKS - 2012 AND 2013 AS ON MARCH 31FOREIGN BANKS
(Amount in ` Million)
(Contd.)
ItemsBank of Nova Scotia Bank of Tokyo-Mitsubishi
UFJ Barclays Bank
2012 2013 2012 2013 2012 2013(19) (20) (21) (22) (23) (24)
1. Capital 3645 3645 25229 26823 52495 52495
(3.3) (2.6) (22.3) (20.4) (23.1) (21.4)
2. Reserves and Surplus 11339 14205 6112 7200 2915 2915
(10.2) (10.2) (5.4) (5.5) (1.3) (1.2)
2.1 Statutory Reserves 2846 3562 2616 3287 1847 1847
2.2 Capital Reserves - - 8 8 19 19
2.3 Share Premium - - - - - -
2.4 Investments Fluctuations Reserves 32 32 - 28 - -
2.5 Revenue and other Reserves 3713 3713 1895 1895 1049 1049
2.6 Balance of Profit 4749 6898 1593 1983 - -
3. Deposits 46816 60556 32842 41464 53826 50632
(42.2) (43.5) (29.1) (31.5) (23.6) (20.6)
Type-wise
3A.1. Demand deposits 4010 4482 14711 17809 2290 2169
(i) From banks 40 50 15 12 715 162
(ii) From others 3969 4432 14696 17797 1575 2007
3A.2. Savings bank deposits 629 675 1325 1431 2268 1809
3A.3. Term deposits 42177 55399 16806 22225 49268 46654
(i) From banks 18319 24626 - - - -
(ii) From others 23858 30773 16806 22225 49268 46654
Location-wise
3B.1. Deposits of branches in India 46816 60556 32842 41464 53826 50632
3B.2. Deposits of branches outside India - - - - - -
4. Borrowings 46833 58567 45305 52729 107904 122641
(42.2) (42.1) (40.1) (40.0) (47.4) (49.9)
4.1. Borrowings in India 9850 20000 2500 6500 74276 73680
(i) From Reserve Bank of India 9100 20000 2500 2000 12000 17100
(ii) From other banks 750 - - 4000 53926 36080
(iii) From other institutions and agencies - - - 500 8350 20500
4.2. Borrowings outside India 36982 38567 42805 46229 33628 48962
Secured borrowings included in 4. 9100 20000 2500 2500 20350 37600
5. Other liabilities & provisions 2228 2105 3530 3459 10515 17136
(2.0) (1.5) (3.1) (2.6) (4.6) (7.0)
5.1. Bills Payable 408 328 115 55 387 306
5.2. Inter-office adjustments 37 2 - - - -
5.3. Interest accrued 444 534 1165 569 3642 3692
5.4. Subordinate debt - - - - - -
5.5. Deferred Tax Liabilities - - - - - -
5.6. Others (including provisions) 1339 1240 2250 2836 6487 13138
Total Liabilities 110861 139078 113018 131675 227656 245819

157
TABLE B1 : LIABILITIES AND ASSETS OF SCHEDULED COMMERCIAL BANKS - 2012 AND 2013 AS ON MARCH 31FOREIGN BANKS
(Amount in ` Million)
(Contd.)
ItemsBNP Paribas Chinatrust Commercial
Bank Citibank
2012 2013 2012 2013 2012 2013(25) (26) (27) (28) (29) (30)
1. Capital 10696 10696 1607 1607 37438 37438
(9.1) (7.8) (44.3) (37.1) (2.9) (2.9)
2. Reserves and Surplus 10277 12123 127 -4 122405 136355
(8.8) (8.9) (3.5) (-0.1) (9.5) (10.6)
2.1 Statutory Reserves 2468 2936 59 59 32406 39202
2.2 Capital Reserves 144 144 - - 459 649
2.3 Share Premium - - - - - -
2.4 Investments Fluctuations Reserves 230 419 17 1 1812 4188
2.5 Revenue and other Reserves 7435 8624 - - 73573 75046
2.6 Balance of Profit - - 52 -64 14155 17270
3. Deposits 59004 55797 1466 1927 646977 665594
(50.3) (40.8) (40.5) (44.5) (50.4) (51.8)
Type-wise
3A.1. Demand deposits 21995 12615 516 351 199924 186917
(i) From banks 501 406 - - 1991 1469
(ii) From others 21494 12209 516 351 197934 185449
3A.2. Savings bank deposits 1409 1163 31 25 152828 165016
3A.3. Term deposits 35600 42019 919 1551 294224 313661
(i) From banks - 2714 - - 5 5
(ii) From others 35600 39306 919 1551 294220 313656
Location-wise
3B.1. Deposits of branches in India 59004 55797 1466 1927 646977 665594
3B.2. Deposits of branches outside India - - - - - -
4. Borrowings 20653 35453 361 661 289246 318560
(17.6) (25.9) (10.0) (15.3) (22.5) (24.8)
4.1. Borrowings in India 13000 19850 280 130 168731 180244
(i) From Reserve Bank of India 9500 13750 - - 150060 104100
(ii) From other banks 3500 6100 280 130 8350 7007
(iii) From other institutions and agencies - - - - 10321 69138
4.2. Borrowings outside India 7653 15603 81 531 120515 138316
Secured borrowings included in 4. 9500 12950 - - 150540 162430
5. Other liabilities & provisions 16667 22720 62 139 188210 125863
(14.2) (16.6) (1.7) (3.2) (14.7) (9.8)
5.1. Bills Payable 367 436 8 37 14902 10874
5.2. Inter-office adjustments - - - - 1 1
5.3. Interest accrued 667 701 18 18 2634 2312
5.4. Subordinate debt - - - - - -
5.5. Deferred Tax Liabilities - - - - - -
5.6. Others (including provisions) 15632 21584 37 83 170674 112676
Total Liabilities 117296 136789 3625 4330 1284275 1283810
Source : Annual accounts of Banks of respective years.
Note : Figures in brackets indicate per cent share in total.

158
TABLE B1 : LIABILITIES AND ASSETS OF SCHEDULED COMMERCIAL BANKS - 2012 AND 2013 AS ON MARCH 31FOREIGN BANKS
(Amount in ` Million)
(Contd.)
Items
Commonwealth Bank ofAustralia Credit Agricole Credit Suisse AG
2012 2013 2012 2013 2012 2013(31) (32) (33) (34) (35) (36)
1. Capital 1692 1692 9784 9784 11350 11350
(73.9) (55.6) (12.7) (16.2) (45.8) (33.2)
2. Reserves and Surplus - - 7591 7809 812 1716
- - (9.9) (12.9) (3.3) (5.0)
2.1 Statutory Reserves - - 2566 2952 223 449
2.2 Capital Reserves - - - - - -
2.3 Share Premium - - - - - -
2.4 Investments Fluctuations Reserves - - 162 221 - -
2.5 Revenue and other Reserves - - 3379 4636 - 589
2.6 Balance of Profit - - 1484 - 589 678
3. Deposits 109 513 9131 5963 3484 4187
(4.8) (16.9) (11.9) (9.9) (14.0) (12.3)
Type-wise
3A.1. Demand deposits 3 17 1372 861 450 69
(i) From banks - 14 74 47 - -
(ii) From others 3 3 1298 815 450 69
3A.2. Savings bank deposits 48 106 159 144 1 4
3A.3. Term deposits 58 391 7600 4958 3034 4114
(i) From banks - - - - - -
(ii) From others 58 391 7600 4958 3034 4114
Location-wise
3B.1. Deposits of branches in India 109 513 9131 5963 3484 4187
3B.2. Deposits of branches outside India - - - - - -
4. Borrowings 411 756 47978 35291 8783 16502
(18.0) (24.9) (62.5) (58.5) (35.4) (48.3)
4.1. Borrowings in India - - 29785 25683 6239 14113
(i) From Reserve Bank of India - - 10000 14357 - -
(ii) From other banks - - 12745 11326 - 3250
(iii) From other institutions and agencies - - 7040 - 6239 10863
4.2. Borrowings outside India 411 756 18193 9608 2544 2389
Secured borrowings included in 4. - - 17040 13000 6239 10863
5. Other liabilities & provisions 76 80 2265 1484 376 389
(3.3) (2.6) (3.0) (2.5) (1.5) (1.1)
5.1. Bills Payable 5 7 8 9 - -
5.2. Inter-office adjustments - - 86 - - -
5.3. Interest accrued 1 9 155 161 19 50
5.4. Subordinate debt - - - - - -
5.5. Deferred Tax Liabilities - - - - - -
5.6. Others (including provisions) 70 64 2016 1314 356 339
Total Liabilities 2289 3041 76748 60331 24804 34144

159
TABLE B1 : LIABILITIES AND ASSETS OF SCHEDULED COMMERCIAL BANKS - 2012 AND 2013 AS ON MARCH 31FOREIGN BANKS
(Amount in ` Million)
(Contd.)
ItemsDBS Bank Deutsche Bank FirstRand Bank
2012 2013 2012 2013 2012 2013(37) (38) (39) (40) (41) (42)
1. Capital 14603 14603 36314 40914 4092 4092
(4.0) (3.6) (12.7) (10.1) (46.9) (35.8)
2. Reserves and Surplus 11815 14700 27668 37999 -464 -1059
(3.2) (3.6) (9.7) (9.4) (-5.3) (-9.3)
2.1 Statutory Reserves 2976 3698 11064 13647 - -
2.2 Capital Reserves 5 5 177 177 - -
2.3 Share Premium - - - - - -
2.4 Investments Fluctuations Reserves 182 237 411 367 - -
2.5 Revenue and other Reserves 5991 7791 8444 14381 - -
2.6 Balance of Profit 2660 2970 7572 9427 -464 -1059
3. Deposits 129220 154876 168427 207943 366 713
(35.5) (38.0) (58.8) (51.4) (4.2) (6.2)
Type-wise
3A.1. Demand deposits 4606 7879 98779 88690 67 92
(i) From banks - - 2599 327 26 24
(ii) From others 4606 7879 96180 88364 41 67
3A.2. Savings bank deposits 1208 1715 10667 10761 3 76
3A.3. Term deposits 123406 145282 58981 108492 296 546
(i) From banks - - - - - -
(ii) From others 123406 145282 58981 108492 296 546
Location-wise
3B.1. Deposits of branches in India 129220 154876 168427 207943 366 713
3B.2. Deposits of branches outside India - - - - - -
4. Borrowings 148239 168474 12702 81128 4509 6937
(40.7) (41.4) (4.4) (20.0) (51.7) (60.7)
4.1. Borrowings in India 45231 94240 10026 51391 2220 4350
(i) From Reserve Bank of India 28500 42650 - 9000 580 1660
(ii) From other banks 15450 35953 18 21377 1600 2450
(iii) From other institutions and agencies 1281 15637 10009 21014 40 240
4.2. Borrowings outside India 103007 74233 2676 29737 2289 2587
Secured borrowings included in 4. 29781 58287 3809 23814 - -
5. Other liabilities & provisions 59982 54428 41145 36940 221 746
(16.5) (13.4) (14.4) (9.1) (2.5) (6.5)
5.1. Bills Payable 381 197 3991 3603 - -
5.2. Inter-office adjustments - - - - 4 3
5.3. Interest accrued 1312 1330 1110 1245 13 16
5.4. Subordinate debt - - - - - -
5.5. Deferred Tax Liabilities - - - - - -
5.6. Others (including provisions) 58289 52901 36043 32091 205 727
Total Liabilities 363859 407081 286257 404924 8724 11429
Source : Annual accounts of Banks of respective years.
Note : Figures in brackets indicate per cent share in total.

160
TABLE B1 : LIABILITIES AND ASSETS OF SCHEDULED COMMERCIAL BANKS - 2012 AND 2013 AS ON MARCH 31FOREIGN BANKS
(Amount in ` Million)
(Contd.)
Items
Hongkong & ShanghaiBanking Corporation
HSBC Bank OmanS.A.O.G.
Industrial and CommercialBank of China
2012 2013 2012 2013 2012 2013(43) (44) (45) (46) (47) (48)
1. Capital 44992 44992 1585 1585 4554 4554
(4.1) (4.2) (37.4) (42.0) (87.8) (58.5)
2. Reserves and Surplus 104545 106966 607 643 99 263
(9.6) (10.1) (14.3) (17.1) (1.9) (3.4)
2.1 Statutory Reserves 24603 29442 177 239 25 66
2.2 Capital Reserves 14993 14993 413 375 - -
2.3 Share Premium - - - - - -
2.4 Investments Fluctuations Reserves 1003 2237 17 30 - 2
2.5 Revenue and other Reserves 43063 47153 - - - -
2.6 Balance of Profit 20884 13142 - - 74 196
3. Deposits 614233 568660 1552 1488 1 1771
(56.2) (53.6) (36.6) (39.5) (0.0) (22.7)
Type-wise
3A.1. Demand deposits 170565 150506 131 288 1 475
(i) From banks 2407 3113 9 1 - -
(ii) From others 168158 147393 122 288 1 475
3A.2. Savings bank deposits 116603 119917 566 360 - 4
3A.3. Term deposits 327065 298237 855 839 - 1293
(i) From banks 16416 17242 - - - -
(ii) From others 310650 280996 855 839 - 1293
Location-wise
3B.1. Deposits of branches in India 614233 568660 1552 1488 1 1771
3B.2. Deposits of branches outside India - - - - - -
4. Borrowings 104775 177108 356 - - 1086
(9.6) (16.7) (8.4) - - (13.9)
4.1. Borrowings in India 49018 107057 51 - - -
(i) From Reserve Bank of India 49000 106270 - - - -
(ii) From other banks 18 37 51 - - -
(iii) From other institutions and agencies - 750 - - - -
4.2. Borrowings outside India 55757 70051 305 - - 1086
Secured borrowings included in 4. 49000 105000 - - - -
5. Other liabilities & provisions 223698 163979 136 55 535 113
(20.5) (15.4) (3.2) (1.5) (10.3) (1.5)
5.1. Bills Payable 3784 2927 5 4 - -
5.2. Inter-office adjustments - - - - - -
5.3. Interest accrued 7884 8100 18 35 - 47
5.4. Subordinate debt - - - - - -
5.5. Deferred Tax Liabilities - - - - - -
5.6. Others (including provisions) 212029 152951 113 17 535 66
Total Liabilities 1092243 1061704 4236 3772 5190 7788

161
TABLE B1 : LIABILITIES AND ASSETS OF SCHEDULED COMMERCIAL BANKS - 2012 AND 2013 AS ON MARCH 31FOREIGN BANKS
(Amount in ` Million)
(Contd.)
ItemsJPMorgan Chase Bank JSC VTB Bank Krung Thai Bank
2012 2013 2012 2013 2012 2013(49) (50) (51) (52) (53) (54)
1. Capital 31075 31075 1106 1106 358 358
(15.0) (12.3) (91.9) (84.4) (18.4) (15.1)
2. Reserves and Surplus 19733 26460 2 9 121 132
(9.5) (10.4) (0.2) (0.7) (6.2) (5.6)
2.1 Statutory Reserves 5134 6815 2 9 64 74
2.2 Capital Reserves - - - - - -
2.3 Share Premium - - - - - -
2.4 Investments Fluctuations Reserves 193 196 - - 22 22
2.5 Revenue and other Reserves 10658 14407 - - 8 8
2.6 Balance of Profit 3748 5042 - - 27 29
3. Deposits 88445 103687 75 99 1432 1835
(42.7) (40.9) (6.2) (7.6) (73.5) (77.1)
Type-wise
3A.1. Demand deposits 32061 27342 45 21 489 545
(i) From banks 108 2715 - - 2 2
(ii) From others 31953 24628 45 21 487 543
3A.2. Savings bank deposits - - - - 60 88
3A.3. Term deposits 56385 76345 30 78 883 1202
(i) From banks 7886 3774 - - - -
(ii) From others 48499 72571 30 78 883 1202
Location-wise
3B.1. Deposits of branches in India 88445 103687 75 99 1432 1835
3B.2. Deposits of branches outside India - - - - - -
4. Borrowings 58999 78785 - - - -
(28.5) (31.1) - - - -
4.1. Borrowings in India 46788 54500 - - - -
(i) From Reserve Bank of India 20000 54000 - - - -
(ii) From other banks 26788 - - - - -
(iii) From other institutions and agencies - 500 - - - -
4.2. Borrowings outside India 12212 24285 - - - -
Secured borrowings included in 4. 20000 54500 - - - -
5. Other liabilities & provisions 9002 13387 20 96 36 53
(4.3) (5.3) (1.7) (7.3) (1.9) (2.2)
5.1. Bills Payable 102 71 - - - -
5.2. Inter-office adjustments - - - - - -
5.3. Interest accrued 1356 1170 - 1 34 50
5.4. Subordinate debt - - - - - -
5.5. Deferred Tax Liabilities - - - - - -
5.6. Others (including provisions) 7544 12146 20 95 2 3
Total Liabilities 207255 253394 1203 1310 1948 2379
Source : Annual accounts of Banks of respective years.
Note : Figures in brackets indicate per cent share in total.Source

162
TABLE B1 : LIABILITIES AND ASSETS OF SCHEDULED COMMERCIAL BANKS - 2012 AND 2013 AS ON MARCH 31FOREIGN BANKS
(Amount in ` Million)
(Contd.)
ItemsMashreqbank Mizuho Corporate Bank National Australia Bank
2012 2013 2012 2013 2012 2013(55) (56) (57) (58) (59) (60)
1. Capital 484 484 30443 30443 1530 1530
(25.1) (19.6) (56.7) (39.9) (98.8) (47.6)
2. Reserves and Surplus 608 725 3705 5433 - -
(31.5) (29.4) (6.9) (7.1) - -
2.1 Statutory Reserves 287 316 933 1365 - -
2.2 Capital Reserves 21 21 - - - -
2.3 Share Premium - - - - - -
2.4 Investments Fluctuations Reserves - 1 - 1 - -
2.5 Revenue and other Reserves 185 185 1443 2772 - -
2.6 Balance of Profit 115 202 1328 1296 - -
3. Deposits 781 1194 6728 17434 - -
(40.4) (48.4) (12.5) (22.9) - -
Type-wise
3A.1. Demand deposits 765 1192 4945 6406 - -
(i) From banks 763 1190 10 15 - -
(ii) From others 2 2 4935 6392 - -
3A.2. Savings bank deposits 8 2 34 112 - -
3A.3. Term deposits 9 - 1749 10916 - -
(i) From banks - - - - - -
(ii) From others 9 - 1749 10916 - -
Location-wise
3B.1. Deposits of branches in India 781 1194 6728 17434 - -
3B.2. Deposits of branches outside India - - - - - -
4. Borrowings - - 12284 22040 - 1635
- - (22.9) (28.9) - (50.9)
4.1. Borrowings in India - - - 5000 - -
(i) From Reserve Bank of India - - - - - -
(ii) From other banks - - - 5000 - -
(iii) From other institutions and agencies - - - - - -
4.2. Borrowings outside India - - 12284 17040 - 1635
Secured borrowings included in 4. - - - - - -
5. Other liabilities & provisions 58 63 516 874 19 49
(3.0) (2.5) (1.0) (1.1) (1.2) (1.5)
5.1. Bills Payable - 1 28 26 - -
5.2. Inter-office adjustments - - - - - -
5.3. Interest accrued - - 9 204 - -
5.4. Subordinate debt - - - - - -
5.5. Deferred Tax Liabilities - - - - - -
5.6. Others (including provisions) 58 62 479 644 19 49
Total Liabilities 1931 2466 53677 76225 1549 3214

163
TABLE B1 : LIABILITIES AND ASSETS OF SCHEDULED COMMERCIAL BANKS - 2012 AND 2013 AS ON MARCH 31FOREIGN BANKS
(Amount in ` Million)
(Contd.)
ItemsRabobank International Royal Bank of Scotland Sberbank
2012 2013 2012 2013 2012 2013(61) (62) (63) (64) (65) (66)
1. Capital 6000 6000 1690 1690 1368 1443
(93.3) (70.4) (0.6) (0.6) (99.0) (80.9)
2. Reserves and Surplus 16 138 27731 26629 - -
(0.3) (0.8) (9.9) (10.1) - -
2.1 Statutory Reserves 4 35 6543 7099 - -
2.2 Capital Reserves - - 224 224 - -
2.3 Share Premium - - - - - -
2.4 Investments Fluctuations Reserves - - 200 206 - -
2.5 Revenue and other Reserves - - 17437 17437 - -
2.6 Balance of Profit 12 104 3327 1663 - -
3. Deposits 117 834 130395 127494 - 47
(1.8) (9.8) (46.6) (48.4) - (2.6)
Type-wise
3A.1. Demand deposits 46 156 41776 35292 - 7
(i) From banks - - 679 361 - -
(ii) From others 46 156 41098 34931 - 7
3A.2. Savings bank deposits - - 30754 28019 - -
3A.3. Term deposits 71 678 57865 64182 - 40
(i) From banks - - - 546 - -
(ii) From others 71 678 57865 63636 - 40
Location-wise
3B.1. Deposits of branches in India 117 834 130395 127494 - 47
3B.2. Deposits of branches outside India - - - - - -
4. Borrowings 1 1164 60391 71226 - 270
(0.0) (13.7) (21.6) (27.0) - (15.1)
4.1. Borrowings in India 1 - 18635 32429 - -
(i) From Reserve Bank of India - - 16100 23800 - -
(ii) From other banks 1 - 2535 8629 - -
(iii) From other institutions and agencies - - - - - -
4.2. Borrowings outside India - 1164 41756 38797 - 270
Secured borrowings included in 4. - - 16100 23800 - -
5. Other liabilities & provisions 300 384 59749 36557 13 23
(4.7) (4.5) (21.3) (13.9) (1.0) (1.3)
5.1. Bills Payable - - 1292 1422 - -
5.2. Inter-office adjustments - - - - - -
5.3. Interest accrued - 11 802 1043 - 1
5.4. Subordinate debt - - - - - -
5.5. Deferred Tax Liabilities - - - - - -
5.6. Others (including provisions) 299 373 57654 34092 13 22
Total Liabilities 6434 8521 279956 263596 1381 1783
Source : Annual accounts of Banks of respective years.
Note : Figures in brackets indicate per cent share in total.Source

164
TABLE B1 : LIABILITIES AND ASSETS OF SCHEDULED COMMERCIAL BANKS - 2012 AND 2013 AS ON MARCH 31FOREIGN BANKS
(Amount in ` Million)
(Contd.)
ItemsShinhan Bank Societe Generale Sonali Bank
2012 2013 2012 2013 2012 2013(67) (68) (69) (70) (71) (72)
1. Capital 3543 3543 7099 7099 6 6
(20.3) (14.3) (22.9) (22.3) (1.4) (1.1)
2. Reserves and Surplus 1742 2182 1315 1471 73 92
(10.0) (8.8) (4.2) (4.6) (16.5) (16.4)
2.1 Statutory Reserves 1742 2182 676 768 48 52
2.2 Capital Reserves - - 2 2 3 3
2.3 Share Premium - - - - - -
2.4 Investments Fluctuations Reserves - - 59 91 - -
2.5 Revenue and other Reserves - - 317 317 - -
2.6 Balance of Profit - - 262 293 23 37
3. Deposits 10371 14404 12807 13826 312 398
(59.4) (58.2) (41.3) (43.5) (70.2) (71.0)
Type-wise
3A.1. Demand deposits 2814 2880 1787 1201 193 276
(i) From banks 1 - 945 85 134 217
(ii) From others 2812 2880 842 1116 59 59
3A.2. Savings bank deposits 210 292 18 20 29 26
3A.3. Term deposits 7348 11232 11002 12605 90 96
(i) From banks - - - - - -
(ii) From others 7348 11232 11002 12605 90 96
Location-wise
3B.1. Deposits of branches in India 10371 14404 12807 13826 312 181
3B.2. Deposits of branches outside India - - - - - 217
4. Borrowings 1156 3673 9262 8364 - -
(6.6) (14.9) (29.8) (26.3) - -
4.1. Borrowings in India 150 1850 7415 7874 - -
(i) From Reserve Bank of India 150 100 - - - -
(ii) From other banks - 1750 4981 5560 - -
(iii) From other institutions and agencies - - 2434 2314 - -
4.2. Borrowings outside India 1006 1823 1847 490 - -
Secured borrowings included in 4. 150 100 2434 2314 - -
5. Other liabilities & provisions 646 927 549 1033 53 64
(3.7) (3.7) (1.8) (3.2) (12.0) (11.5)
5.1. Bills Payable 17 18 8 1 - -
5.2. Inter-office adjustments - - - - - -
5.3. Interest accrued 61 100 129 136 1 1
5.4. Subordinate debt - - - - - -
5.5. Deferred Tax Liabilities - - - 9 - -
5.6. Others (including provisions) 568 809 412 886 52 63
Total Liabilities 17458 24729 31032 31793 444 560
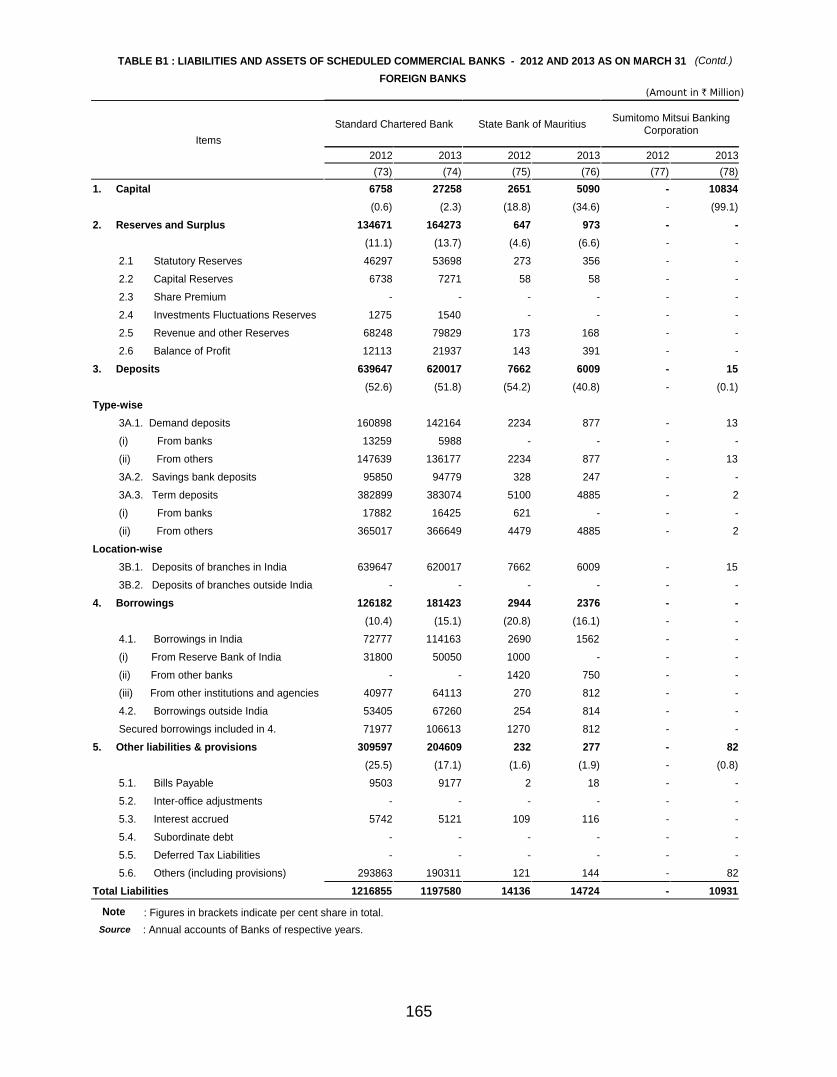
165
TABLE B1 : LIABILITIES AND ASSETS OF SCHEDULED COMMERCIAL BANKS - 2012 AND 2013 AS ON MARCH 31FOREIGN BANKS
(Amount in ` Million)
(Contd.)
ItemsStandard Chartered Bank State Bank of Mauritius Sumitomo Mitsui Banking
Corporation
2012 2013 2012 2013 2012 2013(73) (74) (75) (76) (77) (78)
1. Capital 6758 27258 2651 5090 - 10834
(0.6) (2.3) (18.8) (34.6) - (99.1)
2. Reserves and Surplus 134671 164273 647 973 - -
(11.1) (13.7) (4.6) (6.6) - -
2.1 Statutory Reserves 46297 53698 273 356 - -
2.2 Capital Reserves 6738 7271 58 58 - -
2.3 Share Premium - - - - - -
2.4 Investments Fluctuations Reserves 1275 1540 - - - -
2.5 Revenue and other Reserves 68248 79829 173 168 - -
2.6 Balance of Profit 12113 21937 143 391 - -
3. Deposits 639647 620017 7662 6009 - 15
(52.6) (51.8) (54.2) (40.8) - (0.1)
Type-wise
3A.1. Demand deposits 160898 142164 2234 877 - 13
(i) From banks 13259 5988 - - - -
(ii) From others 147639 136177 2234 877 - 13
3A.2. Savings bank deposits 95850 94779 328 247 - -
3A.3. Term deposits 382899 383074 5100 4885 - 2
(i) From banks 17882 16425 621 - - -
(ii) From others 365017 366649 4479 4885 - 2
Location-wise
3B.1. Deposits of branches in India 639647 620017 7662 6009 - 15
3B.2. Deposits of branches outside India - - - - - -
4. Borrowings 126182 181423 2944 2376 - -
(10.4) (15.1) (20.8) (16.1) - -
4.1. Borrowings in India 72777 114163 2690 1562 - -
(i) From Reserve Bank of India 31800 50050 1000 - - -
(ii) From other banks - - 1420 750 - -
(iii) From other institutions and agencies 40977 64113 270 812 - -
4.2. Borrowings outside India 53405 67260 254 814 - -
Secured borrowings included in 4. 71977 106613 1270 812 - -
5. Other liabilities & provisions 309597 204609 232 277 - 82
(25.5) (17.1) (1.6) (1.9) - (0.8)
5.1. Bills Payable 9503 9177 2 18 - -
5.2. Inter-office adjustments - - - - - -
5.3. Interest accrued 5742 5121 109 116 - -
5.4. Subordinate debt - - - - - -
5.5. Deferred Tax Liabilities - - - - - -
5.6. Others (including provisions) 293863 190311 121 144 - 82
Total Liabilities 1216855 1197580 14136 14724 - 10931
Source : Annual accounts of Banks of respective years.
Note : Figures in brackets indicate per cent share in total.Source

166
TABLE B1 : LIABILITIES AND ASSETS OF SCHEDULED COMMERCIAL BANKS - 2012 AND 2013 AS ON MARCH 31FOREIGN BANKS
(Amount in ` Million)
(Contd.)
ItemsUBS AG United Overseas Bank
LimitedWestpac Banking
Corporation
2012 2013 2012 2013 2012 2013(79) (80) (81) (82) (83) (84)
1. Capital 19102 19102 1474 1550 - 8087
(28.1) (28.0) (93.7) (74.8) - (98.2)
2. Reserves and Surplus 704 1572 4 9 - 84
(1.0) (2.3) (0.3) (0.4) - (1.0)
2.1 Statutory Reserves 225 442 4 9 - 21
2.2 Capital Reserves - - - - - -
2.3 Share Premium - - - - - -
2.4 Investments Fluctuations Reserves 1 8 - - - -
2.5 Revenue and other Reserves - - - - - -
2.6 Balance of Profit 477 1122 - - - 63
3. Deposits 6022 25575 - 62 - -
(8.8) (37.5) (0.0) (3.0) - -
Type-wise
3A.1. Demand deposits 99 215 - 12 - -
(i) From banks - - - - - -
(ii) From others 99 215 - 12 - -
3A.2. Savings bank deposits 5 12 - - - -
3A.3. Term deposits 5918 25348 - 50 - -
(i) From banks - - - - - -
(ii) From others 5918 25348 - 50 - -
Location-wise
3B.1. Deposits of branches in India 6022 25575 - 62 - -
3B.2. Deposits of branches outside India - - - - - -
4. Borrowings 17115 3124 - 360 - 2
(25.1) (4.6) - (17.4) - -
4.1. Borrowings in India 13757 549 - 150 - 1
(i) From Reserve Bank of India - - - - - -
(ii) From other banks 4700 - - 150 - 1
(iii) From other institutions and agencies 9057 549 - - - -
4.2. Borrowings outside India 3358 2575 - 210 - 1
Secured borrowings included in 4. 9057 549 - - - -
5. Other liabilities & provisions 25154 18864 95 92 - 60
(36.9) (27.6) (6.0) (4.4) - (0.7)
5.1. Bills Payable - - - - - -
5.2. Inter-office adjustments - - - - - -
5.3. Interest accrued 183 327 - - - -
5.4. Subordinate debt - - - - - -
5.5. Deferred Tax Liabilities - - - - - -
5.6. Others (including provisions) 24971 18537 95 92 - 60
Total Liabilities 68098 68238 1573 2073 - 8234

167
TABLE B1 : LIABILITIES AND ASSETS OF SCHEDULED COMMERCIAL BANKS - 2012 AND 2013 AS ON MARCH 31FOREIGN BANKS
(Amount in ` Million)
(Concld.)
ItemsWoori Bank
2012 2013(85) (86)
1. Capital 1605 1605
(98.5) (41.8)
2. Reserves and Surplus 9 31
(0.5) (0.8)
2.1 Statutory Reserves 2 8
2.2 Capital Reserves - -
2.3 Share Premium - -
2.4 Investments Fluctuations Reserves - -
2.5 Revenue and other Reserves - -
2.6 Balance of Profit 6 23
3. Deposits - 2158
- (56.3)
Type-wise
3A.1. Demand deposits - 188
(i) From banks - -
(ii) From others - 188
3A.2. Savings bank deposits - 25
3A.3. Term deposits - 1945
(i) From banks - -
(ii) From others - 1945
Location-wise
3B.1. Deposits of branches in India - 2158
3B.2. Deposits of branches outside India - -
4. Borrowings - -
- -
4.1. Borrowings in India - -
(i) From Reserve Bank of India - -
(ii) From other banks - -
(iii) From other institutions and agencies - -
4.2. Borrowings outside India - -
Secured borrowings included in 4. - -
5. Other liabilities & provisions 16 42
(1.0) (1.1)
5.1. Bills Payable - -
5.2. Inter-office adjustments - -
5.3. Interest accrued - 17
5.4. Subordinate debt - -
5.5. Deferred Tax Liabilities - -
5.6. Others (including provisions) 16 25
Total Liabilities 1630 3836
Source : Annual accounts of Banks of respective years.
Note : Figures in brackets indicate per cent share in total.Source
(Contd.)

168
TABLE B1 : LIABILITIES AND ASSETS OF SCHEDULED COMMERCIAL BANKS - 2012 AND 2013 AS ON MARCH 31FOREIGN BANKS
(Amount in ` Million)
(Contd.)
ItemsAB Bank Abu Dhabi Commercial
BankAmerican Express
Banking Corp.
2012 2013 2012 2013 2012 2013(1) (2) (3) (4) (5) (6)
1. Cash in hand 3 3 6 8 - -(0.2) (0.1) (0.1) (0.0) (0.0) (0.0)
2. Balances with RBI 17 18 312 311 579 491(1.5) (0.9) (2.6) (1.9) (2.7) (1.9)
3. Balances with banks in India 25 129 6284 7138 211 296(2.2) (6.5) (51.3) (43.6) (1.0) (1.1)
4. Money at call and short notice - - - 750 - -(0.0) (0.0) (0.0) (4.6) (0.0) (0.0)
5. Balances with banks outside India 135 722 15 121 - -(11.7) (36.4) (0.1) (0.7) (0.0) (0.0)
6. Investments 162 251 2265 2326 3412 3909(14.2) (12.7) (18.6) (14.2) (16.0) (15.4)
6.1. Investments in India 162 251 2265 2326 3412 3909 (i) Government securities 131 223 1906 2151 3412 3909 (ii) Other approved securities - - - - - - (iii) Shares - - - - - - (iv) Debentures and Bonds - - - - - - (v) Subsidiaries and/or joint ventures - - - - - - (vi) Others 31 28 359 175 - - 6.2. Investments outside India - - - - - - (i) Government securities - - - - - - (ii) Subsidiaries and/or joint ventures - - - - - - (iii) Others - - - - - -7. Advances 670 625 2892 5198 14741 17103
(58.5) (31.5) (23.6) (31.7) (69.1) (67.3)Type-wise 7A.1. Bills purchased and discounted 465 416 1244 2085 - - 7A.2. Cash credits, overdrafts & loans 27 32 763 1906 14739 17101 7A.3. Term loans 177 177 884 1207 2 2Security-wise 7B.1. Secured by tangible assets 89 33 1793 2701 2 2 7B.2. Covered by Bank/Govt. Guarantees - - 1099 2226 - - 7B.3. Unsecured 581 592 - 272 14739 17102Sector-wise 7C.I. Advances in India 670 625 2892 5198 14741 17103 (i) Priority sectors 271 254 611 1271 - - (ii) Public sectors - - - - - - (iii) Banks - - - 1000 - - (iv) others 399 371 2281 2928 14741 17103 7C.II. Advances outside India - - - - - -8. Fixed Assets 18 10 92 69 382 432
(1.6) (0.5) (0.8) (0.4) (1.8) (1.7) 8.1. Premises - - 57 44 - - 8.2. Fixed assets under construction - - 5 - - - 8.3. Other Fixed assets 18 10 31 26 382 4329. Other Assets 116 225 328 455 2012 3198
(10.1) (11.3) (2.7) (2.8) (9.4) (12.6) 9.1. Inter-office adjustments (net) - - - - - - 9.2. Interest accrued 8 18 157 150 25 26 9.3. Tax paid 2 4 106 102 4 5 9.4. Stationery and Stamps - - - - - - 9.5. Others 105 202 119 203 1982 3167Total Assets 1145 1983 12194 16378 21337 25402
Note : Figures in brackets indicate per cent share in total.
Source : Annual accounts of Banks of respective yearsSource
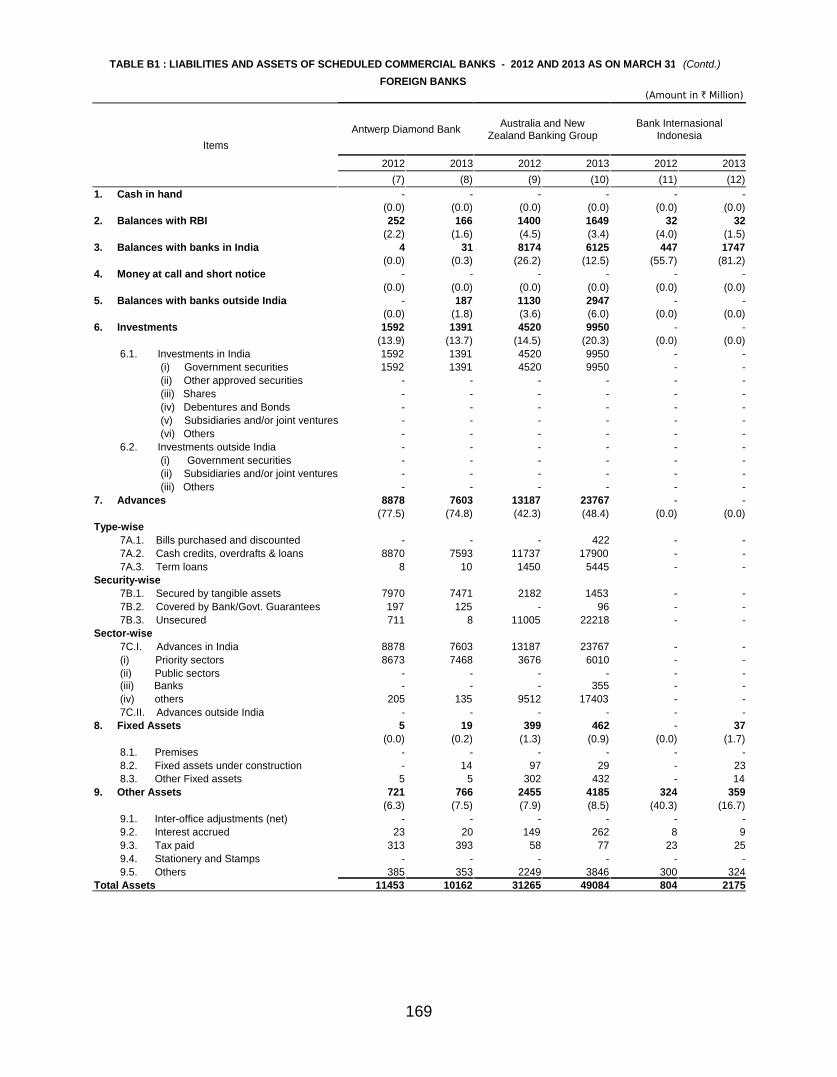
169
TABLE B1 : LIABILITIES AND ASSETS OF SCHEDULED COMMERCIAL BANKS - 2012 AND 2013 AS ON MARCH 31FOREIGN BANKS
(Amount in ` Million)
(Contd.)
ItemsAntwerp Diamond Bank Australia and New
Zealand Banking GroupBank Internasional
Indonesia
2012 2013 2012 2013 2012 2013(7) (8) (9) (10) (11) (12)
1. Cash in hand - - - - - -(0.0) (0.0) (0.0) (0.0) (0.0) (0.0)
2. Balances with RBI 252 166 1400 1649 32 32(2.2) (1.6) (4.5) (3.4) (4.0) (1.5)
3. Balances with banks in India 4 31 8174 6125 447 1747(0.0) (0.3) (26.2) (12.5) (55.7) (81.2)
4. Money at call and short notice - - - - - -(0.0) (0.0) (0.0) (0.0) (0.0) (0.0)
5. Balances with banks outside India - 187 1130 2947 - -(0.0) (1.8) (3.6) (6.0) (0.0) (0.0)
6. Investments 1592 1391 4520 9950 - -(13.9) (13.7) (14.5) (20.3) (0.0) (0.0)
6.1. Investments in India 1592 1391 4520 9950 - - (i) Government securities 1592 1391 4520 9950 - - (ii) Other approved securities - - - - - - (iii) Shares - - - - - - (iv) Debentures and Bonds - - - - - - (v) Subsidiaries and/or joint ventures - - - - - - (vi) Others - - - - - - 6.2. Investments outside India - - - - - - (i) Government securities - - - - - - (ii) Subsidiaries and/or joint ventures - - - - - - (iii) Others - - - - - -7. Advances 8878 7603 13187 23767 - -
(77.5) (74.8) (42.3) (48.4) (0.0) (0.0)Type-wise 7A.1. Bills purchased and discounted - - - 422 - - 7A.2. Cash credits, overdrafts & loans 8870 7593 11737 17900 - - 7A.3. Term loans 8 10 1450 5445 - -Security-wise 7B.1. Secured by tangible assets 7970 7471 2182 1453 - - 7B.2. Covered by Bank/Govt. Guarantees 197 125 - 96 - - 7B.3. Unsecured 711 8 11005 22218 - -Sector-wise 7C.I. Advances in India 8878 7603 13187 23767 - - (i) Priority sectors 8673 7468 3676 6010 - - (ii) Public sectors - - - - - - (iii) Banks - - - 355 - - (iv) others 205 135 9512 17403 - - 7C.II. Advances outside India - - - - - -8. Fixed Assets 5 19 399 462 - 37
(0.0) (0.2) (1.3) (0.9) (0.0) (1.7) 8.1. Premises - - - - - - 8.2. Fixed assets under construction - 14 97 29 - 23 8.3. Other Fixed assets 5 5 302 432 - 149. Other Assets 721 766 2455 4185 324 359
(6.3) (7.5) (7.9) (8.5) (40.3) (16.7) 9.1. Inter-office adjustments (net) - - - - - - 9.2. Interest accrued 23 20 149 262 8 9 9.3. Tax paid 313 393 58 77 23 25 9.4. Stationery and Stamps - - - - - - 9.5. Others 385 353 2249 3846 300 324Total Assets 11453 10162 31265 49084 804 2175
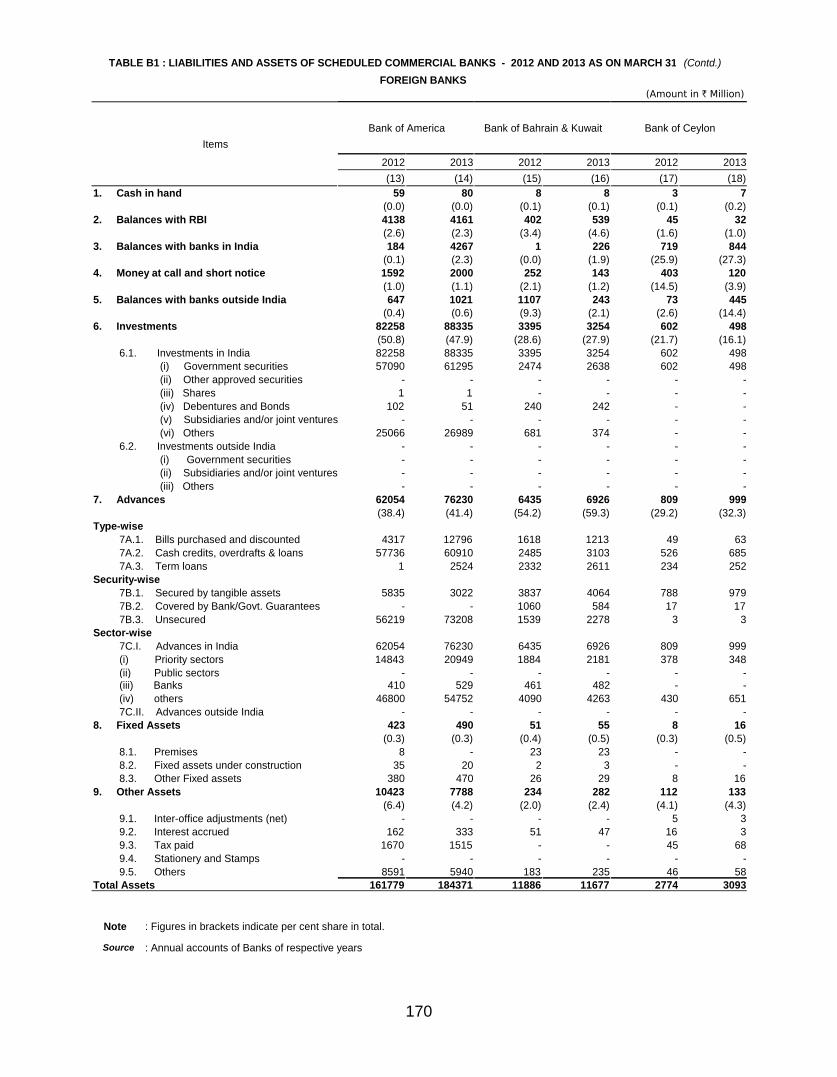
170
TABLE B1 : LIABILITIES AND ASSETS OF SCHEDULED COMMERCIAL BANKS - 2012 AND 2013 AS ON MARCH 31FOREIGN BANKS
(Amount in ` Million)
(Contd.)
ItemsBank of America Bank of Bahrain & Kuwait Bank of Ceylon
2012 2013 2012 2013 2012 2013(13) (14) (15) (16) (17) (18)
1. Cash in hand 59 80 8 8 3 7(0.0) (0.0) (0.1) (0.1) (0.1) (0.2)
2. Balances with RBI 4138 4161 402 539 45 32(2.6) (2.3) (3.4) (4.6) (1.6) (1.0)
3. Balances with banks in India 184 4267 1 226 719 844(0.1) (2.3) (0.0) (1.9) (25.9) (27.3)
4. Money at call and short notice 1592 2000 252 143 403 120(1.0) (1.1) (2.1) (1.2) (14.5) (3.9)
5. Balances with banks outside India 647 1021 1107 243 73 445(0.4) (0.6) (9.3) (2.1) (2.6) (14.4)
6. Investments 82258 88335 3395 3254 602 498(50.8) (47.9) (28.6) (27.9) (21.7) (16.1)
6.1. Investments in India 82258 88335 3395 3254 602 498 (i) Government securities 57090 61295 2474 2638 602 498 (ii) Other approved securities - - - - - - (iii) Shares 1 1 - - - - (iv) Debentures and Bonds 102 51 240 242 - - (v) Subsidiaries and/or joint ventures - - - - - - (vi) Others 25066 26989 681 374 - - 6.2. Investments outside India - - - - - - (i) Government securities - - - - - - (ii) Subsidiaries and/or joint ventures - - - - - - (iii) Others - - - - - -7. Advances 62054 76230 6435 6926 809 999
(38.4) (41.4) (54.2) (59.3) (29.2) (32.3)Type-wise 7A.1. Bills purchased and discounted 4317 12796 1618 1213 49 63 7A.2. Cash credits, overdrafts & loans 57736 60910 2485 3103 526 685 7A.3. Term loans 1 2524 2332 2611 234 252Security-wise 7B.1. Secured by tangible assets 5835 3022 3837 4064 788 979 7B.2. Covered by Bank/Govt. Guarantees - - 1060 584 17 17 7B.3. Unsecured 56219 73208 1539 2278 3 3Sector-wise 7C.I. Advances in India 62054 76230 6435 6926 809 999 (i) Priority sectors 14843 20949 1884 2181 378 348 (ii) Public sectors - - - - - - (iii) Banks 410 529 461 482 - - (iv) others 46800 54752 4090 4263 430 651 7C.II. Advances outside India - - - - - -8. Fixed Assets 423 490 51 55 8 16
(0.3) (0.3) (0.4) (0.5) (0.3) (0.5) 8.1. Premises 8 - 23 23 - - 8.2. Fixed assets under construction 35 20 2 3 - - 8.3. Other Fixed assets 380 470 26 29 8 169. Other Assets 10423 7788 234 282 112 133
(6.4) (4.2) (2.0) (2.4) (4.1) (4.3) 9.1. Inter-office adjustments (net) - - - - 5 3 9.2. Interest accrued 162 333 51 47 16 3 9.3. Tax paid 1670 1515 - - 45 68 9.4. Stationery and Stamps - - - - - - 9.5. Others 8591 5940 183 235 46 58Total Assets 161779 184371 11886 11677 2774 3093
Note : Figures in brackets indicate per cent share in total.
Source : Annual accounts of Banks of respective yearsSource

171
TABLE B1 : LIABILITIES AND ASSETS OF SCHEDULED COMMERCIAL BANKS - 2012 AND 2013 AS ON MARCH 31FOREIGN BANKS
(Amount in ` Million)
(Contd.)
ItemsBank of Nova Scotia Bank of Tokyo-Mitsubishi
UFJ Barclays Bank
2012 2013 2012 2013 2012 2013(19) (20) (21) (22) (23) (24)
1. Cash in hand 14 13 36 40 105 8(0.0) (0.0) (0.0) (0.0) (0.0) (0.0)
2. Balances with RBI 4521 3493 6360 4770 4021 3064(4.1) (2.5) (5.6) (3.6) (1.8) (1.2)
3. Balances with banks in India 40 101 11 1229 630 458(0.0) (0.1) (0.0) (0.9) (0.3) (0.2)
4. Money at call and short notice 322 5094 30 6571 - -(0.3) (3.7) (0.0) (5.0) (0.0) (0.0)
5. Balances with banks outside India 147 310 106 484 477 662(0.1) (0.2) (0.1) (0.4) (0.2) (0.3)
6. Investments 34831 48422 35867 44608 116000 138232(31.4) (34.8) (31.7) (33.9) (51.0) (56.2)
6.1. Investments in India 34831 48422 35867 44608 116000 138232 (i) Government securities 32903 47536 30676 41747 40706 78899 (ii) Other approved securities - - - - - - (iii) Shares 27 - - - 169 169 (iv) Debentures and Bonds - - - - 10449 13650 (v) Subsidiaries and/or joint ventures - - - - - - (vi) Others 1901 886 5191 2862 64675 45514 6.2. Investments outside India - - - - - - (i) Government securities - - - - - - (ii) Subsidiaries and/or joint ventures - - - - - - (iii) Others - - - - - -7. Advances 66056 77661 64525 68395 86570 84723
(59.6) (55.8) (57.1) (51.9) (38.0) (34.5)Type-wise 7A.1. Bills purchased and discounted 1854 816 - 8 17266 28386 7A.2. Cash credits, overdrafts & loans 61913 74917 51915 59224 20709 27013 7A.3. Term loans 2288 1927 12610 9163 48596 29325Security-wise 7B.1. Secured by tangible assets 15399 17543 16070 13504 24509 11027 7B.2. Covered by Bank/Govt. Guarantees 24757 32803 - - 5400 21960 7B.3. Unsecured 25900 27314 48455 54891 56662 51737Sector-wise 7C.I. Advances in India 66056 77661 64525 68395 86570 84723 (i) Priority sectors 28699 27565 29408 22470 29873 31460 (ii) Public sectors - - 5750 4193 2035 - (iii) Banks - - - - 142 - (iv) others 37357 50096 29367 41733 54520 53264 7C.II. Advances outside India - - - - - -8. Fixed Assets 97 87 303 348 436 257
(0.1) (0.1) (0.3) (0.3) (0.2) (0.1) 8.1. Premises 19 17 17 17 - - 8.2. Fixed assets under construction - - - - 44 65 8.3. Other Fixed assets 78 70 286 331 392 1929. Other Assets 4834 3898 5780 5230 19417 18414
(4.4) (2.8) (5.1) (4.0) (8.5) (7.5) 9.1. Inter-office adjustments (net) - - 1918 1385 - - 9.2. Interest accrued 1028 1641 1531 644 1425 836 9.3. Tax paid 323 454 - - 2333 3050 9.4. Stationery and Stamps - - - - - - 9.5. Others 3483 1803 2331 3201 15659 14529Total Assets 110861 139078 113018 131675 227656 245819

172
TABLE B1 : LIABILITIES AND ASSETS OF SCHEDULED COMMERCIAL BANKS - 2012 AND 2013 AS ON MARCH 31FOREIGN BANKS
(Amount in ` Million)
(Contd.)
ItemsBNP Paribas Chinatrust Commercial
Bank Citibank
2012 2013 2012 2013 2012 2013(25) (26) (27) (28) (29) (30)
1. Cash in hand 25 26 3 4 2358 1752(0.0) (0.0) (0.1) (0.1) (0.2) (0.1)
2. Balances with RBI 3378 3325 160 175 65063 46092(2.9) (2.4) (4.4) (4.0) (5.1) (3.6)
3. Balances with banks in India 70 91 34 90 45633 49682(0.1) (0.1) (0.9) (2.1) (3.6) (3.9)
4. Money at call and short notice 5750 - - - 1578 -(4.9) (0.0) (0.0) (0.0) (0.1) (0.0)
5. Balances with banks outside India 529 339 5 11 68739 92763(0.5) (0.2) (0.1) (0.3) (5.4) (7.2)
6. Investments 33866 45643 520 1197 431667 440766(28.9) (33.4) (14.4) (27.6) (33.6) (34.3)
6.1. Investments in India 33866 45643 520 1197 431667 440766 (i) Government securities 33866 35286 455 523 423698 411446 (ii) Other approved securities - - - - - - (iii) Shares - - - - 95 124 (iv) Debentures and Bonds - - - - 540 - (v) Subsidiaries and/or joint ventures - - - - - - (vi) Others - 10358 65 674 7333 29197 6.2. Investments outside India - - - - - - (i) Government securities - - - - - - (ii) Subsidiaries and/or joint ventures - - - - - - (iii) Others - - - - - -7. Advances 61842 77373 2846 2765 471030 520355
(52.7) (56.6) (78.5) (63.8) (36.7) (40.5)Type-wise 7A.1. Bills purchased and discounted 6087 14666 739 838 27045 32028 7A.2. Cash credits, overdrafts & loans 44242 49919 1866 1921 85108 86497 7A.3. Term loans 11513 12788 242 5 358877 401831Security-wise 7B.1. Secured by tangible assets 17096 13196 899 1287 179111 197647 7B.2. Covered by Bank/Govt. Guarantees 9274 14019 486 261 1279 6955 7B.3. Unsecured 35472 50158 1461 1217 290640 315754Sector-wise 7C.I. Advances in India 61842 77373 2846 2765 471030 520355 (i) Priority sectors 23039 19947 280 896 135978 138696 (ii) Public sectors 476 927 185 - 2951 6162 (iii) Banks 1 2714 - - - - (iv) others 38326 53786 2381 1868 332101 375497 7C.II. Advances outside India - - - - - -8. Fixed Assets 1502 1421 15 35 7871 17345
(1.3) (1.0) (0.4) (0.8) (0.6) (1.4) 8.1. Premises 991 953 - - 4174 4886 8.2. Fixed assets under construction 6 1 - 5 331 9597 8.3. Other Fixed assets 506 467 15 30 3366 28639. Other Assets 10334 8571 41 54 190337 115054
(8.8) (6.3) (1.1) (1.3) (14.8) (9.0) 9.1. Inter-office adjustments (net) - - - - 444 83 9.2. Interest accrued 898 951 12 17 10899 10041 9.3. Tax paid - - 11 18 13180 11829 9.4. Stationery and Stamps - - - - - - 9.5. Others 9435 7620 18 19 165815 93101Total Assets 117296 136789 3625 4330 1284275 1283810
Note : Figures in brackets indicate per cent share in total.
Source : Annual accounts of Banks of respective yearsSource
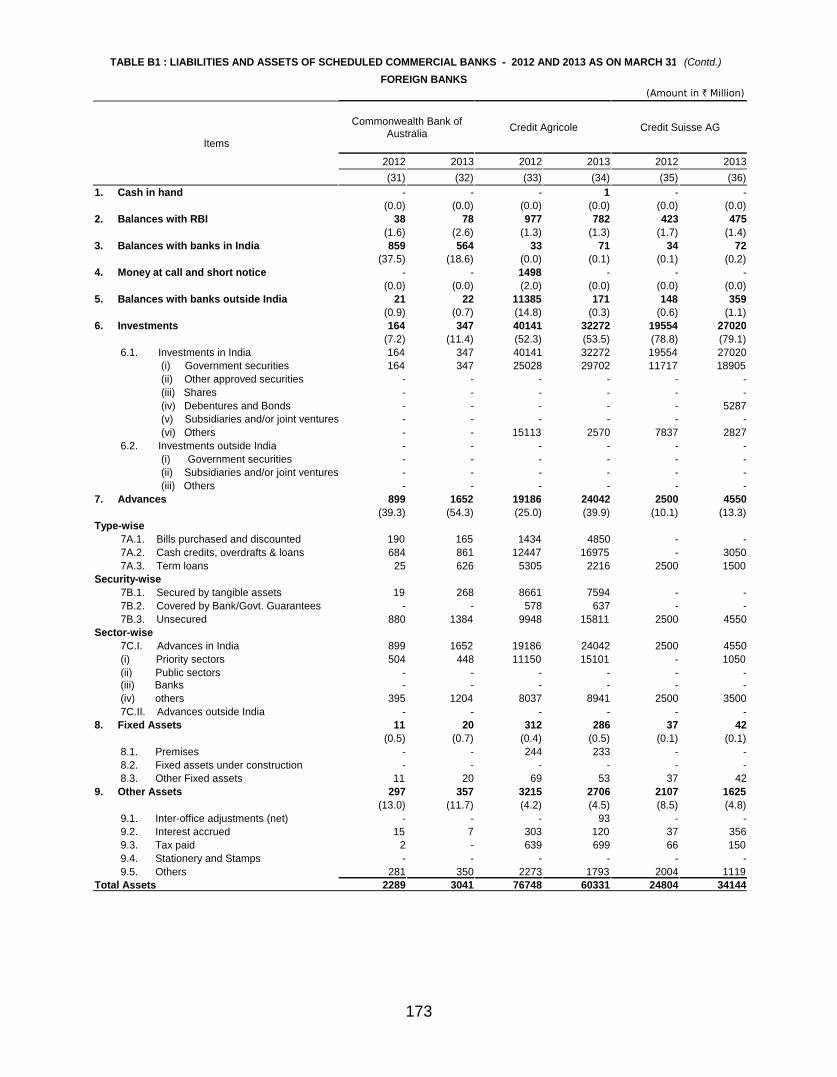
173
TABLE B1 : LIABILITIES AND ASSETS OF SCHEDULED COMMERCIAL BANKS - 2012 AND 2013 AS ON MARCH 31FOREIGN BANKS
(Amount in ` Million)
(Contd.)
Items
Commonwealth Bank ofAustralia Credit Agricole Credit Suisse AG
2012 2013 2012 2013 2012 2013(31) (32) (33) (34) (35) (36)
1. Cash in hand - - - 1 - -(0.0) (0.0) (0.0) (0.0) (0.0) (0.0)
2. Balances with RBI 38 78 977 782 423 475(1.6) (2.6) (1.3) (1.3) (1.7) (1.4)
3. Balances with banks in India 859 564 33 71 34 72(37.5) (18.6) (0.0) (0.1) (0.1) (0.2)
4. Money at call and short notice - - 1498 - - -(0.0) (0.0) (2.0) (0.0) (0.0) (0.0)
5. Balances with banks outside India 21 22 11385 171 148 359(0.9) (0.7) (14.8) (0.3) (0.6) (1.1)
6. Investments 164 347 40141 32272 19554 27020(7.2) (11.4) (52.3) (53.5) (78.8) (79.1)
6.1. Investments in India 164 347 40141 32272 19554 27020 (i) Government securities 164 347 25028 29702 11717 18905 (ii) Other approved securities - - - - - - (iii) Shares - - - - - - (iv) Debentures and Bonds - - - - - 5287 (v) Subsidiaries and/or joint ventures - - - - - - (vi) Others - - 15113 2570 7837 2827 6.2. Investments outside India - - - - - - (i) Government securities - - - - - - (ii) Subsidiaries and/or joint ventures - - - - - - (iii) Others - - - - - -7. Advances 899 1652 19186 24042 2500 4550
(39.3) (54.3) (25.0) (39.9) (10.1) (13.3)Type-wise 7A.1. Bills purchased and discounted 190 165 1434 4850 - - 7A.2. Cash credits, overdrafts & loans 684 861 12447 16975 - 3050 7A.3. Term loans 25 626 5305 2216 2500 1500Security-wise 7B.1. Secured by tangible assets 19 268 8661 7594 - - 7B.2. Covered by Bank/Govt. Guarantees - - 578 637 - - 7B.3. Unsecured 880 1384 9948 15811 2500 4550Sector-wise 7C.I. Advances in India 899 1652 19186 24042 2500 4550 (i) Priority sectors 504 448 11150 15101 - 1050 (ii) Public sectors - - - - - - (iii) Banks - - - - - - (iv) others 395 1204 8037 8941 2500 3500 7C.II. Advances outside India - - - - - -8. Fixed Assets 11 20 312 286 37 42
(0.5) (0.7) (0.4) (0.5) (0.1) (0.1) 8.1. Premises - - 244 233 - - 8.2. Fixed assets under construction - - - - - - 8.3. Other Fixed assets 11 20 69 53 37 429. Other Assets 297 357 3215 2706 2107 1625
(13.0) (11.7) (4.2) (4.5) (8.5) (4.8) 9.1. Inter-office adjustments (net) - - - 93 - - 9.2. Interest accrued 15 7 303 120 37 356 9.3. Tax paid 2 - 639 699 66 150 9.4. Stationery and Stamps - - - - - - 9.5. Others 281 350 2273 1793 2004 1119Total Assets 2289 3041 76748 60331 24804 34144

174
TABLE B1 : LIABILITIES AND ASSETS OF SCHEDULED COMMERCIAL BANKS - 2012 AND 2013 AS ON MARCH 31FOREIGN BANKS
(Amount in ` Million)
(Contd.)
ItemsDBS Bank Deutsche Bank FirstRand Bank
2012 2013 2012 2013 2012 2013(37) (38) (39) (40) (41) (42)
1. Cash in hand 36 33 182 196 - 6(0.0) (0.0) (0.1) (0.0) (0.0) (0.1)
2. Balances with RBI 8039 9695 30097 26572 121 251(2.2) (2.4) (10.5) (6.6) (1.4) (2.2)
3. Balances with banks in India 372 67 128 63 9 19(0.1) (0.0) (0.0) (0.0) (0.1) (0.2)
4. Money at call and short notice 1293 749 - 1836 - -(0.4) (0.2) (0.0) (0.5) (0.0) (0.0)
5. Balances with banks outside India 9142 13992 3440 9341 27 4(2.5) (3.4) (1.2) (2.3) (0.3) (0.0)
6. Investments 147806 181673 84215 106012 5613 7848(40.6) (44.6) (29.4) (26.2) (64.3) (68.7)
6.1. Investments in India 147806 181673 84215 106012 5613 7848 (i) Government securities 75625 108880 51207 79146 1816 3797 (ii) Other approved securities - - - - - - (iii) Shares - - 717 717 - - (iv) Debentures and Bonds 270 2355 7561 8456 - - (v) Subsidiaries and/or joint ventures - - - - - - (vi) Others 71911 70438 24730 17693 3797 4051 6.2. Investments outside India - - - - - - (i) Government securities - - - - - - (ii) Subsidiaries and/or joint ventures - - - - - - (iii) Others - - - - - -7. Advances 128443 138581 125489 223741 2416 2594
(35.3) (34.0) (43.8) (55.3) (27.7) (22.7)Type-wise 7A.1. Bills purchased and discounted 40421 36506 12226 55203 454 94 7A.2. Cash credits, overdrafts & loans 71990 86452 79987 123194 884 1128 7A.3. Term loans 16032 15623 33276 45345 1079 1372Security-wise 7B.1. Secured by tangible assets 41589 66389 40250 58929 508 563 7B.2. Covered by Bank/Govt. Guarantees 27385 13924 13038 14542 332 - 7B.3. Unsecured 59469 58268 72201 150270 1576 2031Sector-wise 7C.I. Advances in India 128443 138581 125489 223741 2416 2594 (i) Priority sectors 62175 43841 31235 50484 1423 935 (ii) Public sectors - 4550 883 5740 - - (iii) Banks - - 9183 40932 - - (iv) others 66268 90190 84189 126586 994 1658 7C.II. Advances outside India - - - - - -8. Fixed Assets 420 528 1230 1547 167 152
(0.1) (0.1) (0.4) (0.4) (1.9) (1.3) 8.1. Premises - - 782 669 - - 8.2. Fixed assets under construction 7 137 113 408 138 - 8.3. Other Fixed assets 412 391 335 471 28 1529. Other Assets 68309 61764 41476 35614 371 556
(18.8) (15.2) (14.5) (8.8) (4.3) (4.9) 9.1. Inter-office adjustments (net) - - - - - - 9.2. Interest accrued 1156 1830 2936 3118 - - 9.3. Tax paid 678 601 2416 2927 - 1 9.4. Stationery and Stamps - - - 1 - - 9.5. Others 66475 59333 36123 29569 370 555Total Assets 363859 407081 286257 404924 8724 11429
Note : Figures in brackets indicate per cent share in total.
Source : Annual accounts of Banks of respective yearsSource

175
TABLE B1 : LIABILITIES AND ASSETS OF SCHEDULED COMMERCIAL BANKS - 2012 AND 2013 AS ON MARCH 31FOREIGN BANKS
(Amount in ` Million)
(Contd.)
Items
Hongkong & ShanghaiBanking Corporation
HSBC Bank OmanS.A.O.G
Industrial andCommercial Bank of
China
2012 2013 2012 2013 2012 2013(43) (44) (45) (46) (47) (48)
1. Cash in hand 1095 993 2 3 - 1(0.1) (0.1) (0.0) (0.1) (0.0) (0.0)
2. Balances with RBI 38201 48644 94 86 4 117(3.5) (4.6) (2.2) (2.3) (0.1) (1.5)
3. Balances with banks in India 20819 21559 1302 1382 4157 3022(1.9) (2.0) (30.7) (36.6) (80.1) (38.8)
4. Money at call and short notice 43427 10750 - 200 - -(4.0) (1.0) (0.0) (5.3) (0.0) (0.0)
5. Balances with banks outside India 11933 9545 32 41 483 126(1.1) (0.9) (0.8) (1.1) (9.3) (1.6)
6. Investments 403238 451787 773 401 - 1038(36.9) (42.6) (18.2) (10.6) (0.0) (13.3)
6.1. Investments in India 403238 451787 773 401 - 1038 (i) Government securities 212476 277475 753 380 - 1038 (ii) Other approved securities - 3000 - - - - (iii) Shares 121 161 - - - - (iv) Debentures and Bonds 29836 63373 - - - - (v) Subsidiaries and/or joint ventures - - - - - - (vi) Others 160805 107778 20 21 - - 6.2. Investments outside India - - - - - - (i) Government securities - - - - - - (ii) Subsidiaries and/or joint ventures - - - - - - (iii) Others - - - - - -7. Advances 355123 357087 41 51 455 3372
(32.5) (33.6) (1.0) (1.4) (8.8) (43.3)Type-wise 7A.1. Bills purchased and discounted 62412 46436 - - 230 147 7A.2. Cash credits, overdrafts & loans 177614 178397 21 34 225 3225 7A.3. Term loans 115097 132254 20 17 - -Security-wise 7B.1. Secured by tangible assets 170069 181524 21 18 - - 7B.2. Covered by Bank/Govt. Guarantees 35930 34363 20 34 455 3362 7B.3. Unsecured 149124 141200 - - - 10Sector-wise 7C.I. Advances in India 355123 357087 41 51 455 3372 (i) Priority sectors 107425 98970 - - - 147 (ii) Public sectors - - - - - - (iii) Banks 1100 4450 - - - - (iv) others 246598 253667 41 51 455 3225 7C.II. Advances outside India - - - - - -8. Fixed Assets 8420 8981 544 487 42 31
(0.8) (0.8) (12.8) (12.9) (0.8) (0.4) 8.1. Premises 8049 8621 523 474 22 17 8.2. Fixed assets under construction - - 1 - - - 8.3. Other Fixed assets 371 361 19 13 20 149. Other Assets 209987 152358 1448 1121 49 82
(19.2) (14.4) (34.2) (29.7) (1.0) (1.0) 9.1. Inter-office adjustments (net) - - - - - - 9.2. Interest accrued 5216 7274 76 31 8 41 9.3. Tax paid 5566 5841 50 - 4 4 9.4. Stationery and Stamps 6 3 - - - - 9.5. Others 199199 139240 1322 1090 38 37Total Assets 1092243 1061704 4236 3772 5190 7788

176
TABLE B1 : LIABILITIES AND ASSETS OF SCHEDULED COMMERCIAL BANKS - 2012 AND 2013 AS ON MARCH 31FOREIGN BANKS
(Amount in ` Million)
(Contd.)
ItemsJPMorgan Chase Bank JSC VTB Bank Krung Thai Bank
2012 2013 2012 2013 2012 2013(49) (50) (51) (52) (53) (54)
1. Cash in hand - - 1 1 - 1(0.0) (0.0) (0.1) (0.1) (0.0) (0.0)
2. Balances with RBI 8761 9248 10 12 69 83(4.2) (3.6) (0.8) (0.9) (3.5) (3.5)
3. Balances with banks in India 8646 4413 292 276 1084 1284(4.2) (1.7) (24.3) (21.1) (55.6) (54.0)
4. Money at call and short notice - - - - 45 -(0.0) (0.0) (0.0) (0.0) (2.3) (0.0)
5. Balances with banks outside India 63 315 7 68 209 268(0.0) (0.1) (0.6) (5.2) (10.7) (11.3)
6. Investments 133038 176913 45 24 349 466(64.2) (69.8) (3.7) (1.8) (17.9) (19.6)
6.1. Investments in India 133038 176913 45 24 349 466 (i) Government securities 45962 89707 45 24 319 431 (ii) Other approved securities - - - - - - (iii) Shares - - - - - - (iv) Debentures and Bonds 447 - - - - - (v) Subsidiaries and/or joint ventures - - - - - - (vi) Others 86629 87206 - - 31 35 6.2. Investments outside India - - - - - - (i) Government securities - - - - - - (ii) Subsidiaries and/or joint ventures - - - - - - (iii) Others - - - - - -7. Advances 45293 53445 788 885 93 160
(21.9) (21.1) (65.5) (67.5) (4.8) (6.7)Type-wise 7A.1. Bills purchased and discounted 1598 5018 239 146 63 126 7A.2. Cash credits, overdrafts & loans 5792 13134 60 118 30 34 7A.3. Term loans 37903 35293 489 621 - -Security-wise 7B.1. Secured by tangible assets 2445 4514 633 783 89 152 7B.2. Covered by Bank/Govt. Guarantees 8617 4992 - - - - 7B.3. Unsecured 34231 43939 155 102 5 8Sector-wise 7C.I. Advances in India 45293 53445 788 885 93 160 (i) Priority sectors 16473 17584 158 254 58 71 (ii) Public sectors 2711 3410 - - - - (iii) Banks 186 4358 - - - - (iv) others 25923 28093 630 631 36 89 7C.II. Advances outside India - - - - - -8. Fixed Assets 31 20 10 9 6 4
(0.0) (0.0) (0.8) (0.7) (0.3) (0.2) 8.1. Premises - - - - - - 8.2. Fixed assets under construction - - - - - - 8.3. Other Fixed assets 31 20 10 9 6 49. Other Assets 11423 9040 51 35 92 114
(5.5) (3.6) (4.2) (2.6) (4.7) (4.8) 9.1. Inter-office adjustments (net) - - - - - - 9.2. Interest accrued 388 903 2 2 65 82 9.3. Tax paid 1943 1903 2 7 14 18 9.4. Stationery and Stamps - - - - - - 9.5. Others 9092 6233 47 26 13 14Total Assets 207255 253394 1203 1310 1948 2379
Note : Figures in brackets indicate per cent share in total.
Source : Annual accounts of Banks of respective yearsSource

177
TABLE B1 : LIABILITIES AND ASSETS OF SCHEDULED COMMERCIAL BANKS - 2012 AND 2013 AS ON MARCH 31FOREIGN BANKS
(Amount in ` Million)
(Contd.)
ItemsMashreqbank Mizuho Corporate Bank National Australia Bank
2012 2013 2012 2013 2012 2013(55) (56) (57) (58) (59) (60)
1. Cash in hand - - 2 3 - -(0.0) (0.0) (0.0) (0.0) (0.0) (0.0)
2. Balances with RBI 10 83 2350 2216 2 8(0.5) (3.4) (4.4) (2.9) (0.1) (0.2)
3. Balances with banks in India 400 500 11 526 1460 1247(20.7) (20.3) (0.0) (0.7) (94.2) (38.8)
4. Money at call and short notice 502 - 6736 2171 - -(26.0) (0.0) (12.5) (2.8) (0.0) (0.0)
5. Balances with banks outside India 47 825 911 622 - 1(2.4) (33.5) (1.7) (0.8) (0.0) (0.0)
6. Investments 400 465 6586 13835 - 117(20.7) (18.9) (12.3) (18.1) (0.0) (3.6)
6.1. Investments in India 400 465 6586 13835 - 117 (i) Government securities 306 346 4054 11962 - 117 (ii) Other approved securities - - - - - - (iii) Shares - - - - - - (iv) Debentures and Bonds - - 1568 909 - - (v) Subsidiaries and/or joint ventures - - - - - - (vi) Others 94 119 964 964 - - 6.2. Investments outside India - - - - - - (i) Government securities - - - - - - (ii) Subsidiaries and/or joint ventures - - - - - - (iii) Others - - - - - -7. Advances 523 547 35816 55188 - 1636
(27.1) (22.2) (66.7) (72.5) (0.0) (50.9)Type-wise 7A.1. Bills purchased and discounted 523 547 4 415 - 1636 7A.2. Cash credits, overdrafts & loans - - 29390 38212 - - 7A.3. Term loans - - 6422 16561 - -Security-wise 7B.1. Secured by tangible assets - - 7389 10716 - - 7B.2. Covered by Bank/Govt. Guarantees 523 547 - - - - 7B.3. Unsecured - - 28427 44473 - 1636Sector-wise 7C.I. Advances in India 523 547 35816 55188 - - (i) Priority sectors 523 547 11237 13995 - - (ii) Public sectors - - 4000 4000 - - (iii) Banks - - - - - - (iv) others - - 20578 37193 - - 7C.II. Advances outside India - - - - - 16368. Fixed Assets 16 10 132 292 32 28
(0.8) (0.4) (0.2) (0.4) (2.1) (0.9) 8.1. Premises - - - - - - 8.2. Fixed assets under construction - - - 80 - - 8.3. Other Fixed assets 16 10 132 213 32 289. Other Assets 34 35 1133 1372 55 178
(1.7) (1.4) (2.1) (1.8) (3.5) (5.5) 9.1. Inter-office adjustments (net) - - - - - - 9.2. Interest accrued 4 8 93 36 7 11 9.3. Tax paid 7 2 181 269 - - 9.4. Stationery and Stamps - - - - - - 9.5. Others 23 25 858 1068 47 167Total Assets 1931 2466 53677 76225 1549 3214

178
TABLE B1 : LIABILITIES AND ASSETS OF SCHEDULED COMMERCIAL BANKS - 2012 AND 2013 AS ON MARCH 31FOREIGN BANKS
(Amount in ` Million)
(Contd.)
ItemsRabobank International Royal Bank of Scotland Sberbank
2012 2013 2012 2013 2012 2013(61) (62) (63) (64) (65) (66)
1. Cash in hand - - 772 754 - -(0.0) (0.0) (0.3) (0.3) (0.0) (0.0)
2. Balances with RBI 34 231 11521 8298 3 88(0.5) (2.7) (4.1) (3.1) (0.2) (4.9)
3. Balances with banks in India 3 3 286 276 1318 1239(0.1) (0.0) (0.1) (0.1) (95.4) (69.5)
4. Money at call and short notice - - 7500 5250 - -(0.0) (0.0) (2.7) (2.0) (0.0) (0.0)
5. Balances with banks outside India 924 383 345 2358 - 2(14.4) (4.5) (0.1) (0.9) (0.0) (0.1)
6. Investments 1384 1242 77214 91235 - -(21.5) (14.6) (27.6) (34.6) (0.0) (0.0)
6.1. Investments in India 1384 1242 77214 91235 - - (i) Government securities 1384 1242 59583 64859 - - (ii) Other approved securities - - - - - - (iii) Shares - - - - - - (iv) Debentures and Bonds - - 975 1216 - - (v) Subsidiaries and/or joint ventures - - - - - - (vi) Others - - 16656 25161 - - 6.2. Investments outside India - - - - - - (i) Government securities - - - - - - (ii) Subsidiaries and/or joint ventures - - - - - - (iii) Others - - - - - -7. Advances 3513 5899 125345 125339 - 370
(54.6) (69.2) (44.8) (47.6) (0.0) (20.7)Type-wise 7A.1. Bills purchased and discounted - 791 22909 27755 - - 7A.2. Cash credits, overdrafts & loans 2213 4461 48244 66931 - 370 7A.3. Term loans 1300 647 54192 30654 - -Security-wise 7B.1. Secured by tangible assets 1683 2936 63650 66001 - 140 7B.2. Covered by Bank/Govt. Guarantees - - 22639 5263 - 229 7B.3. Unsecured 1830 2962 39055 54074 - -Sector-wise 7C.I. Advances in India 3513 5899 125345 125339 - 370 (i) Priority sectors 553 2198 50839 57570 - - (ii) Public sectors - - - 698 - - (iii) Banks - - 1933 4204 - - (iv) others 2960 3700 72573 62868 - 370 7C.II. Advances outside India - - - - - -8. Fixed Assets 71 63 1039 1043 34 36
(1.1) (0.7) (0.4) (0.4) (2.5) (2.0) 8.1. Premises - - 177 171 - - 8.2. Fixed assets under construction - 1 467 118 - - 8.3. Other Fixed assets 71 62 395 754 34 369. Other Assets 505 699 55935 29042 27 48
(7.9) (8.2) (20.0) (11.0) (1.9) (2.7) 9.1. Inter-office adjustments (net) - - - - - - 9.2. Interest accrued 1 24 1611 1753 1 7 9.3. Tax paid - - 1266 2656 1 1 9.4. Stationery and Stamps - - - - - - 9.5. Others 504 675 53057 24633 25 41Total Assets 6434 8521 279956 263596 1381 1783
Note : Figures in brackets indicate per cent share in total.
Source : Annual accounts of Banks of respective yearsSource

179
TABLE B1 : LIABILITIES AND ASSETS OF SCHEDULED COMMERCIAL BANKS - 2012 AND 2013 AS ON MARCH 31FOREIGN BANKS
(Amount in ` Million)
(Contd.)
ItemsShinhan Bank Societe Generale Sonali Bank
2012 2013 2012 2013 2012 2013(67) (68) (69) (70) (71) (72)
1. Cash in hand 10 11 1 1 16 14(0.1) (0.0) (0.0) (0.0) (3.7) (2.6)
2. Balances with RBI 498 1052 778 763 18 18(2.9) (4.3) (2.5) (2.4) (4.2) (3.3)
3. Balances with banks in India 4053 4868 2 2 49 88(23.2) (19.7) (0.0) (0.0) (11.0) (15.7)
4. Money at call and short notice 350 300 - - 24 -(2.0) (1.2) (0.0) (0.0) (5.4) (0.0)
5. Balances with banks outside India 208 29 146 543 56 155(1.2) (0.1) (0.5) (1.7) (12.5) (27.6)
6. Investments 2811 5906 18462 11354 55 58(16.1) (23.9) (59.5) (35.7) (12.3) (10.4)
6.1. Investments in India 2811 5906 18462 11354 55 58 (i) Government securities 2811 5906 7517 7410 55 58 (ii) Other approved securities - - - - - - (iii) Shares - - - - - - (iv) Debentures and Bonds - - - - - - (v) Subsidiaries and/or joint ventures - - - - - - (vi) Others - - 10945 3944 - - 6.2. Investments outside India - - - - - - (i) Government securities - - - - - - (ii) Subsidiaries and/or joint ventures - - - - - - (iii) Others - - - - - -7. Advances 9145 12061 10564 17569 185 184
(52.4) (48.8) (34.0) (55.3) (41.6) (32.8)Type-wise 7A.1. Bills purchased and discounted 694 1474 1691 2652 104 102 7A.2. Cash credits, overdrafts & loans 5426 7634 6800 12972 77 79 7A.3. Term loans 3025 2953 2074 1945 4 3Security-wise 7B.1. Secured by tangible assets 2463 3575 3827 3841 141 164 7B.2. Covered by Bank/Govt. Guarantees 3167 4034 1859 2179 - - 7B.3. Unsecured 3516 4453 4878 11549 44 20Sector-wise 7C.I. Advances in India 9145 12061 10564 17569 185 184 (i) Priority sectors 2056 3242 3369 3600 104 103 (ii) Public sectors - - - - - - (iii) Banks - - 765 1733 - - (iv) others 7090 8820 6430 12235 81 81 7C.II. Advances outside India - - - - - -8. Fixed Assets 48 47 256 571 5 6
(0.3) (0.2) (0.8) (1.8) (1.1) (1.0) 8.1. Premises - - 185 164 - - 8.2. Fixed assets under construction - - - - - - 8.3. Other Fixed assets 48 47 70 407 5 69. Other Assets 334 456 823 990 36 37
(1.9) (1.8) (2.7) (3.1) (8.2) (6.6) 9.1. Inter-office adjustments (net) - - - - - - 9.2. Interest accrued 218 294 182 177 4 4 9.3. Tax paid - 8 15 119 2 1 9.4. Stationery and Stamps - - - - - - 9.5. Others 116 154 625 694 30 32Total Assets 17458 24729 31032 31793 444 560

180
TABLE B1 : LIABILITIES AND ASSETS OF SCHEDULED COMMERCIAL BANKS - 2012 AND 2013 AS ON MARCH 31FOREIGN BANKS
(Amount in ` Million)
(Contd.)
ItemsStandard Chartered Bank State Bank of Mauritius Sumitomo Mitsui Banking
Corporation
2012 2013 2012 2013 2012 2013(73) (74) (75) (76) (77) (78)
1. Cash in hand 2022 2600 2 4 - 1(0.2) (0.2) (0.0) (0.0) (0.0) (0.0)
2. Balances with RBI 31331 28801 402 281 - 146(2.6) (2.4) (2.8) (1.9) (0.0) (1.3)
3. Balances with banks in India 5119 3954 3 7 - 5693(0.4) (0.3) (0.0) (0.0) (0.0) (52.2)
4. Money at call and short notice - - - 893 - 1700(0.0) (0.0) (0.0) (6.1) (0.0) (15.6)
5. Balances with banks outside India 10152 19783 186 113 - 6(0.8) (1.7) (1.3) (0.8) (0.0) (0.1)
6. Investments 273239 307471 4821 4602 - 2985(22.5) (25.7) (34.1) (31.3) (0.0) (27.3)
6.1. Investments in India 273239 307471 4821 4602 - 2985 (i) Government securities 222297 251013 4060 2919 - 2985 (ii) Other approved securities - - - - - - (iii) Shares 140 347 35 40 - - (iv) Debentures and Bonds 1603 4625 98 1 - - (v) Subsidiaries and/or joint ventures - - - - - - (vi) Others 49199 51486 628 1642 - - 6.2. Investments outside India - - - - - - (i) Government securities - - - - - - (ii) Subsidiaries and/or joint ventures - - - - - - (iii) Others - - - - - -7. Advances 555700 619543 8121 8150 - -
(45.7) (51.7) (57.5) (55.3) (0.0) (0.0)Type-wise 7A.1. Bills purchased and discounted 49278 53068 2321 1584 - - 7A.2. Cash credits, overdrafts & loans 297514 300023 2445 2909 - - 7A.3. Term loans 208908 266451 3355 3657 - -Security-wise 7B.1. Secured by tangible assets 338958 379916 - - - - 7B.2. Covered by Bank/Govt. Guarantees 9038 21703 - - - - 7B.3. Unsecured 207704 217925 - - - -Sector-wise 7C.I. Advances in India 555700 619543 8121 8150 - - (i) Priority sectors 146628 177441 - - - - (ii) Public sectors 109 174 - - - - (iii) Banks 500 79 - - - - (iv) others 408464 441850 8121 8150 - - 7C.II. Advances outside India - - - - - -8. Fixed Assets 25270 24494 320 321 - 128
(2.1) (2.0) (2.3) (2.2) (0.0) (1.2) 8.1. Premises 23270 22938 302 293 - 43 8.2. Fixed assets under construction 61 38 - 15 - 22 8.3. Other Fixed assets 1938 1519 18 14 - 629. Other Assets 313533 190932 281 354 - 273
(25.3) (15.6) (1.9) (2.4) (0.0) (2.5) 9.1. Inter-office adjustments (net) - - - - - - 9.2. Interest accrued 3666 6850 92 140 - 17 9.3. Tax paid 4556 3742 119 118 - - 9.4. Stationery and Stamps 1 1 - - - - 9.5. Others 305310 180339 70 96 - 255Total Assets 1216366 1197580 14136 14724 - 10931
Note : Figures in brackets indicate per cent share in total.
Source : Annual accounts of Banks of respective yearsSource

181
TABLE B1 : LIABILITIES AND ASSETS OF SCHEDULED COMMERCIAL BANKS - 2012 AND 2013 AS ON MARCH 31FOREIGN BANKS
(Amount in ` Million)
(Contd.)
Items
United Overseas BankLimited Woori Bank UBS AG
2012 2013 2012 2013 2012 2013(79) (80) (81) (82) (83) (84)
1. Cash in hand - - - 7 - -(0.0) (0.0) (0.0) (0.2) (0.0) (0.0)
2. Balances with RBI 9 21 2 86 454 1479(0.6) (1.0) (0.1) (2.2) (0.7) (2.2)
3. Balances with banks in India 1471 1373 1545 2316 255 14524(93.5) (66.3) (94.8) (60.4) (0.4) (21.3)
4. Money at call and short notice - 40 - 480 628 -(0.0) (1.9) (0.0) (12.5) (0.9) (0.0)
5. Balances with banks outside India - 2 - - 214 765(0.0) (0.1) (0.0) (0.0) (0.3) (1.1)
6. Investments - 148 - 491 35647 21672(0.0) (7.1) (0.0) (12.8) (52.3) (31.8)
6.1. Investments in India - 148 - 491 35647 21672 (i) Government securities - 148 - 491 15379 10630 (ii) Other approved securities - - - - - - (iii) Shares - - - - - - (iv) Debentures and Bonds - - - - 648 507 (v) Subsidiaries and/or joint ventures - - - - - - (vi) Others - - - - 19619 10535 6.2. Investments outside India - - - - - - (i) Government securities - - - - - - (ii) Subsidiaries and/or joint ventures - - - - - - (iii) Others - - - - - -7. Advances - 358 - 329 6312 9741
(0.0) (17.3) (0.0) (8.6) (9.3) (14.3)Type-wise 7A.1. Bills purchased and discounted - 210 - - - - 7A.2. Cash credits, overdrafts & loans - - - 329 6312 4941 7A.3. Term loans - 148 - - - 4800Security-wise 7B.1. Secured by tangible assets - 50 - - 2000 500 7B.2. Covered by Bank/Govt. Guarantees - 308 - 205 - - 7B.3. Unsecured - - - 124 4312 9241Sector-wise 7C.I. Advances in India - 358 - 329 6312 9741 (i) Priority sectors - 210 - - 1557 2575 (ii) Public sectors - - - - - - (iii) Banks - - - - - - (iv) others - 148 - 329 4755 7166 7C.II. Advances outside India - - - - - -8. Fixed Assets 11 16 52 60 64 35
(0.7) (0.8) (3.2) (1.6) (0.1) (0.1) 8.1. Premises - - - - - - 8.2. Fixed assets under construction 3 - - - - - 8.3. Other Fixed assets 8 16 52 60 64 359. Other Assets 82 114 31 66 24522 20021
(5.2) (5.5) (1.9) (1.7) (36.0) (29.3) 9.1. Inter-office adjustments (net) - - - 1 - - 9.2. Interest accrued 7 51 11 34 360 782 9.3. Tax paid 4 5 1 12 88 95 9.4. Stationery and Stamps - - - - - - 9.5. Others 71 59 19 19 24074 19143Total Assets 1573 2073 1630 3836 68098 68238
TABLE B1 : LIABILITIES AND ASSETS OF SCHEDULED COMMERCIAL BANKS - 2012 AND 2013 AS ON MARCH 31FOREIGN BANKS
(Amount in ` Million)
(Concld.)
Items
Westpac BankingCorporation
2012 2013(85) (86)
1. Cash in hand - -(0.0) (0.0)
2. Balances with RBI - 3(0.0) (0.0)
3. Balances with banks in India - 1086(0.0) (13.2)
4. Money at call and short notice - 2546(0.0) (30.9)
5. Balances with banks outside India - -(0.0) (0.0)
6. Investments - 4466(0.0) (54.2)
6.1. Investments in India - 4466 (i) Government securities - 4466 (ii) Other approved securities - - (iii) Shares - - (iv) Debentures and Bonds - - (v) Subsidiaries and/or joint ventures - - (vi) Others - - 6.2. Investments outside India - - (i) Government securities - - (ii) Subsidiaries and/or joint ventures - - (iii) Others - -7. Advances - -
(0.0) (0.0)Type-wise 7A.1. Bills purchased and discounted - - 7A.2. Cash credits, overdrafts & loans - - 7A.3. Term loans - -Security-wise 7B.1. Secured by tangible assets - - 7B.2. Covered by Bank/Govt. Guarantees - - 7B.3. Unsecured - -Sector-wise 7C.I. Advances in India - - (i) Priority sectors - - (ii) Public sectors - - (iii) Banks - - (iv) others - - 7C.II. Advances outside India - -8. Fixed Assets - 66
(0.0) (0.8) 8.1. Premises - - 8.2. Fixed assets under construction - 2 8.3. Other Fixed assets - 659. Other Assets - 67
(0.0) (0.8) 9.1. Inter-office adjustments (net) - - 9.2. Interest accrued - - 9.3. Tax paid - - 9.4. Stationery and Stamps - - 9.5. Others - 67Total Assets - 8234
Note : Figures in brackets indicate per cent share in total.
Source : Annual accounts of Banks of respective years
TABLE B1 : LIABILITIES AND ASSETS OF SCHEDULED COMMERCIAL BANKS - 2012 AND 2013 AS ON MARCH 31FOREIGN BANKS
(Amount in ` Million)
(Contd.)
Items
United Overseas BankLimited Woori Bank UBS AG
2012 2013 2012 2013 2012 2013(79) (80) (81) (82) (83) (84)
1. Cash in hand - - - 7 - -(0.0) (0.0) (0.0) (0.2) (0.0) (0.0)
2. Balances with RBI 9 21 2 86 454 1479(0.6) (1.0) (0.1) (2.2) (0.7) (2.2)
3. Balances with banks in India 1471 1373 1545 2316 255 14524(93.5) (66.3) (94.8) (60.4) (0.4) (21.3)
4. Money at call and short notice - 40 - 480 628 -(0.0) (1.9) (0.0) (12.5) (0.9) (0.0)
5. Balances with banks outside India - 2 - - 214 765(0.0) (0.1) (0.0) (0.0) (0.3) (1.1)
6. Investments - 148 - 491 35647 21672(0.0) (7.1) (0.0) (12.8) (52.3) (31.8)
6.1. Investments in India - 148 - 491 35647 21672 (i) Government securities - 148 - 491 15379 10630 (ii) Other approved securities - - - - - - (iii) Shares - - - - - - (iv) Debentures and Bonds - - - - 648 507 (v) Subsidiaries and/or joint ventures - - - - - - (vi) Others - - - - 19619 10535 6.2. Investments outside India - - - - - - (i) Government securities - - - - - - (ii) Subsidiaries and/or joint ventures - - - - - - (iii) Others - - - - - -7. Advances - 358 - 329 6312 9741
(0.0) (17.3) (0.0) (8.6) (9.3) (14.3)Type-wise 7A.1. Bills purchased and discounted - 210 - - - - 7A.2. Cash credits, overdrafts & loans - - - 329 6312 4941 7A.3. Term loans - 148 - - - 4800Security-wise 7B.1. Secured by tangible assets - 50 - - 2000 500 7B.2. Covered by Bank/Govt. Guarantees - 308 - 205 - - 7B.3. Unsecured - - - 124 4312 9241Sector-wise 7C.I. Advances in India - 358 - 329 6312 9741 (i) Priority sectors - 210 - - 1557 2575 (ii) Public sectors - - - - - - (iii) Banks - - - - - - (iv) others - 148 - 329 4755 7166 7C.II. Advances outside India - - - - - -8. Fixed Assets 11 16 52 60 64 35
(0.7) (0.8) (3.2) (1.6) (0.1) (0.1) 8.1. Premises - - - - - - 8.2. Fixed assets under construction 3 - - - - - 8.3. Other Fixed assets 8 16 52 60 64 359. Other Assets 82 114 31 66 24522 20021
(5.2) (5.5) (1.9) (1.7) (36.0) (29.3) 9.1. Inter-office adjustments (net) - - - 1 - - 9.2. Interest accrued 7 51 11 34 360 782 9.3. Tax paid 4 5 1 12 88 95 9.4. Stationery and Stamps - - - - - - 9.5. Others 71 59 19 19 24074 19143Total Assets 1573 2073 1630 3836 68098 68238
(79) (80) (81) (82) (83) (84)

182
TABLE B1 : LIABILITIES AND ASSETS OF SCHEDULED COMMERCIAL BANKS - 2012 AND 2013 AS ON MARCH 31FOREIGN BANKS
(Amount in ` Million)
(Concld.)
Items
Westpac BankingCorporation
2012 2013(85) (86)
1. Cash in hand - -(0.0) (0.0)
2. Balances with RBI - 3(0.0) (0.0)
3. Balances with banks in India - 1086(0.0) (13.2)
4. Money at call and short notice - 2546(0.0) (30.9)
5. Balances with banks outside India - -(0.0) (0.0)
6. Investments - 4466(0.0) (54.2)
6.1. Investments in India - 4466 (i) Government securities - 4466 (ii) Other approved securities - - (iii) Shares - - (iv) Debentures and Bonds - - (v) Subsidiaries and/or joint ventures - - (vi) Others - - 6.2. Investments outside India - - (i) Government securities - - (ii) Subsidiaries and/or joint ventures - - (iii) Others - -7. Advances - -
(0.0) (0.0)Type-wise 7A.1. Bills purchased and discounted - - 7A.2. Cash credits, overdrafts & loans - - 7A.3. Term loans - -Security-wise 7B.1. Secured by tangible assets - - 7B.2. Covered by Bank/Govt. Guarantees - - 7B.3. Unsecured - -Sector-wise 7C.I. Advances in India - - (i) Priority sectors - - (ii) Public sectors - - (iii) Banks - - (iv) others - - 7C.II. Advances outside India - -8. Fixed Assets - 66
(0.0) (0.8) 8.1. Premises - - 8.2. Fixed assets under construction - 2 8.3. Other Fixed assets - 659. Other Assets - 67
(0.0) (0.8) 9.1. Inter-office adjustments (net) - - 9.2. Interest accrued - - 9.3. Tax paid - - 9.4. Stationery and Stamps - - 9.5. Others - 67Total Assets - 8234
Note : Figures in brackets indicate per cent share in total.
Source : Annual accounts of Banks of respective years
TABLE B1 : LIABILITIES AND ASSETS OF SCHEDULED COMMERCIAL BANKS - 2012 AND 2013 AS ON MARCH 31FOREIGN BANKS
(Amount in ` Million)
(Contd.)
Items
United Overseas BankLimited Woori Bank UBS AG
2012 2013 2012 2013 2012 2013(79) (80) (81) (82) (83) (84)
1. Cash in hand - - - 7 - -(0.0) (0.0) (0.0) (0.2) (0.0) (0.0)
2. Balances with RBI 9 21 2 86 454 1479(0.6) (1.0) (0.1) (2.2) (0.7) (2.2)
3. Balances with banks in India 1471 1373 1545 2316 255 14524(93.5) (66.3) (94.8) (60.4) (0.4) (21.3)
4. Money at call and short notice - 40 - 480 628 -(0.0) (1.9) (0.0) (12.5) (0.9) (0.0)
5. Balances with banks outside India - 2 - - 214 765(0.0) (0.1) (0.0) (0.0) (0.3) (1.1)
6. Investments - 148 - 491 35647 21672(0.0) (7.1) (0.0) (12.8) (52.3) (31.8)
6.1. Investments in India - 148 - 491 35647 21672 (i) Government securities - 148 - 491 15379 10630 (ii) Other approved securities - - - - - - (iii) Shares - - - - - - (iv) Debentures and Bonds - - - - 648 507 (v) Subsidiaries and/or joint ventures - - - - - - (vi) Others - - - - 19619 10535 6.2. Investments outside India - - - - - - (i) Government securities - - - - - - (ii) Subsidiaries and/or joint ventures - - - - - - (iii) Others - - - - - -7. Advances - 358 - 329 6312 9741
(0.0) (17.3) (0.0) (8.6) (9.3) (14.3)Type-wise 7A.1. Bills purchased and discounted - 210 - - - - 7A.2. Cash credits, overdrafts & loans - - - 329 6312 4941 7A.3. Term loans - 148 - - - 4800Security-wise 7B.1. Secured by tangible assets - 50 - - 2000 500 7B.2. Covered by Bank/Govt. Guarantees - 308 - 205 - - 7B.3. Unsecured - - - 124 4312 9241Sector-wise 7C.I. Advances in India - 358 - 329 6312 9741 (i) Priority sectors - 210 - - 1557 2575 (ii) Public sectors - - - - - - (iii) Banks - - - - - - (iv) others - 148 - 329 4755 7166 7C.II. Advances outside India - - - - - -8. Fixed Assets 11 16 52 60 64 35
(0.7) (0.8) (3.2) (1.6) (0.1) (0.1) 8.1. Premises - - - - - - 8.2. Fixed assets under construction 3 - - - - - 8.3. Other Fixed assets 8 16 52 60 64 359. Other Assets 82 114 31 66 24522 20021
(5.2) (5.5) (1.9) (1.7) (36.0) (29.3) 9.1. Inter-office adjustments (net) - - - 1 - - 9.2. Interest accrued 7 51 11 34 360 782 9.3. Tax paid 4 5 1 12 88 95 9.4. Stationery and Stamps - - - - - - 9.5. Others 71 59 19 19 24074 19143Total Assets 1573 2073 1630 3836 68098 68238
TABLE B1 : LIABILITIES AND ASSETS OF SCHEDULED COMMERCIAL BANKS - 2012 AND 2013 AS ON MARCH 31FOREIGN BANKS
(Amount in ` Million)
(Concld.)
Items
Westpac BankingCorporation
2012 2013(85) (86)
1. Cash in hand - -(0.0) (0.0)
2. Balances with RBI - 3(0.0) (0.0)
3. Balances with banks in India - 1086(0.0) (13.2)
4. Money at call and short notice - 2546(0.0) (30.9)
5. Balances with banks outside India - -(0.0) (0.0)
6. Investments - 4466(0.0) (54.2)
6.1. Investments in India - 4466 (i) Government securities - 4466 (ii) Other approved securities - - (iii) Shares - - (iv) Debentures and Bonds - - (v) Subsidiaries and/or joint ventures - - (vi) Others - - 6.2. Investments outside India - - (i) Government securities - - (ii) Subsidiaries and/or joint ventures - - (iii) Others - -7. Advances - -
(0.0) (0.0)Type-wise 7A.1. Bills purchased and discounted - - 7A.2. Cash credits, overdrafts & loans - - 7A.3. Term loans - -Security-wise 7B.1. Secured by tangible assets - - 7B.2. Covered by Bank/Govt. Guarantees - - 7B.3. Unsecured - -Sector-wise 7C.I. Advances in India - - (i) Priority sectors - - (ii) Public sectors - - (iii) Banks - - (iv) others - - 7C.II. Advances outside India - -8. Fixed Assets - 66
(0.0) (0.8) 8.1. Premises - - 8.2. Fixed assets under construction - 2 8.3. Other Fixed assets - 659. Other Assets - 67
(0.0) (0.8) 9.1. Inter-office adjustments (net) - - 9.2. Interest accrued - - 9.3. Tax paid - - 9.4. Stationery and Stamps - - 9.5. Others - 67Total Assets - 8234
Note : Figures in brackets indicate per cent share in total.
Source : Annual accounts of Banks of respective years
(85) (86)
Source
TABLE B1 : LIABILITIES AND ASSETS OF SCHEDULED COMMERCIAL BANKS - 2012 AND 2013 AS ON MARCH 31FOREIGN BANKS
(Amount in ` Million)
(Concld.)
Items
Westpac BankingCorporation
2012 2013(85) (86)
1. Cash in hand - -(0.0) (0.0)
2. Balances with RBI - 3(0.0) (0.0)
3. Balances with banks in India - 1086(0.0) (13.2)
4. Money at call and short notice - 2546(0.0) (30.9)
5. Balances with banks outside India - -(0.0) (0.0)
6. Investments - 4466(0.0) (54.2)
6.1. Investments in India - 4466 (i) Government securities - 4466 (ii) Other approved securities - - (iii) Shares - - (iv) Debentures and Bonds - - (v) Subsidiaries and/or joint ventures - - (vi) Others - - 6.2. Investments outside India - - (i) Government securities - - (ii) Subsidiaries and/or joint ventures - - (iii) Others - -7. Advances - -
(0.0) (0.0)Type-wise 7A.1. Bills purchased and discounted - - 7A.2. Cash credits, overdrafts & loans - - 7A.3. Term loans - -Security-wise 7B.1. Secured by tangible assets - - 7B.2. Covered by Bank/Govt. Guarantees - - 7B.3. Unsecured - -Sector-wise 7C.I. Advances in India - - (i) Priority sectors - - (ii) Public sectors - - (iii) Banks - - (iv) others - - 7C.II. Advances outside India - -8. Fixed Assets - 66
(0.0) (0.8) 8.1. Premises - - 8.2. Fixed assets under construction - 2 8.3. Other Fixed assets - 659. Other Assets - 67
(0.0) (0.8) 9.1. Inter-office adjustments (net) - - 9.2. Interest accrued - - 9.3. Tax paid - - 9.4. Stationery and Stamps - - 9.5. Others - 67Total Assets - 8234
Note : Figures in brackets indicate per cent share in total.
Source : Annual accounts of Banks of respective years

183
TABLE B2 : EARNINGS AND EXPENSES OF SCHEDULED COMMERCIAL BANKS - 2011-12 AND 2012-13 AS ON MARCH 31STATE BANK OF INDIA & ITS ASSOCIATES
(Amount in ` Million)
Items
State Bank of India State Bank ofMysore State Bank of Patiala
2012 2013 2012 2013 2012 2013
(1) (2) (3) (4) (5) (6)IncomeI. Interest Earned 1065215 1196571 50784 59655 81211 95643 a) Interest/Discount earned on advances/bills 810777 905371 40633 47878 64304 76419 b) Income on investments 239491 272006 10002 11576 14934 17358 c) Interest on balances with RBI and other inter-bank funds 3505 5451 146 175 1790 1863 d) Others 11441 13742 3 26 183 2II. Other Income 143514 160348 5164 5956 7510 7588 a) Commission, exchange and brokerage 120909 114837 3996 3914 5854 5783 b) Net profit (loss) on sale of investments -9197 11019 386 665 711 903 c) Net profit (loss) on revaluation of investments - -38 - - - - d) Net profit (loss) on sale of land and other assets -441 -327 - -10 - - e) Net profit (loss) on exchange transactions 14322 16916 326 585 528 591 f) Miscellaneous income 17922 17941 456 802 418 311 Total (I+II) 1208729 1356919 55948 65611 88721 103231
Expenditure & ProvisionsIII. Interest Expended 632304 753258 34941 41253 57859 71134 a) Interest on deposits 556444 674645 32209 37799 52876 63925 b) Interest on RBI/ Inter - bank borrowings 38856 41241 1461 2146 512 1207 c) Others 37004 37371 1271 1308 4471 6002IV. Operating Expenses 260690 292844 10411 11048 13234 15903 a) Payments to and provisions for employees 169740 183809 6206 6402 8347 9595 b) Rent, taxes and lighting 20654 24388 927 982 1186 1433 c) Printing and stationery 2765 2970 132 143 94 108 d) Advertisement and publicity 2066 3844 61 64 121 180 e) Depreciation on bank's property 10072 11396 500 470 482 523 f) Directors' fees, allowances and expenses 5 7 2 2 5 5 g) Auditors' fees and expenses 1285 1246 106 92 113 140 h) Law charges 1173 1339 77 73 43 42 i) Postage, telegrams, telephones, etc 4333 5156 82 62 128 104 j) Repairs and maintenance 3733 3935 55 46 209 266 k) Insurance 9635 12007 397 469 620 907 l) Other expenditure 35230 42745 1866 2241 1886 2601V. Net Interest Income (I-III) 432911 443313 15843 18402 23352 24508VI. Provisions and Contingencies 198662 169767 6905 9149 9665 9526VII. Operating Profit (I+II-III-IV) 315735 310817 10596 13310 17629 16193VIII. Profit (Loss) during the year 117073 141050 3691 4161 7964 6668
Source : Annual accounts of banks.
TABLE B2 : EARNINGS AND EXPENSES OF SCHEDULED COMMERCIAL BANKS - 2011-12 AND 2012-13 AS ON MARCH 31STATE BANK OF INDIA & ITS ASSOCIATES
(Amount in ` Million)
(Contd.)
Items
State Bank ofHyderabad
State Bank ofTravancore
State Bank ofBikaner & Jaipur
2012 2013 2012 2013 2012 2013
(7) (8) (9) (10) (11) (12)IncomeI. Interest Earned 106467 124478 68961 86348 62914 74982 a) Interest/Discount earned on advances/bills 81770 95558 53986 67461 50779 59877 b) Income on investments 22632 25873 14463 18164 11655 14567 c) Interest on balances with RBI and other inter-bank funds 1341 1934 184 412 189 221 d) Others 723 1113 328 311 290 316II. Other Income 10243 9756 5809 6530 5990 7263 a) Commission, exchange and brokerage 7434 6674 3999 4358 5512 5579 b) Net profit (loss) on sale of investments 1665 1895 668 1312 286 756 c) Net profit (loss) on revaluation of investments - - - - - - d) Net profit (loss) on sale of land and other assets -20 -79 -9 -3 - - e) Net profit (loss) on exchange transactions 790 850 425 253 36 552 f) Miscellaneous income 375 416 726 610 156 376 Total (I+II) 116710 134234 74770 92879 68903 82245
Expenditure & ProvisionsIII. Interest Expended 72822 85299 49984 65066 40700 49324 a) Interest on deposits 68201 81211 43674 58640 38387 46437 b) Interest on RBI/ Inter - bank borrowings 497 286 670 646 799 938 c) Others 4123 3802 5639 5780 1513 1949IV. Operating Expenses 17358 21051 12299 14302 13308 15792 a) Payments to and provisions for employees 11513 14155 7878 8848 8198 9875 b) Rent, taxes and lighting 1704 1740 962 1201 1089 1208 c) Printing and stationery 188 202 99 122 192 199 d) Advertisement and publicity 216 235 72 99 91 127 e) Depreciation on bank's property 731 989 502 588 538 572 f) Directors' fees, allowances and expenses 2 3 4 5 4 6 g) Auditors' fees and expenses 157 112 130 122 129 111 h) Law charges 30 31 72 70 31 28 i) Postage, telegrams, telephones, etc 106 148 59 79 214 245 j) Repairs and maintenance 127 149 145 163 138 171 k) Insurance 871 1203 619 683 479 573 l) Other expenditure 1713 2085 1754 2323 2204 2677V. Net Interest Income (I-III) 33645 39179 18977 21282 22214 25658VI. Provisions and Contingencies 13547 15382 7383 7360 8376 9826VII. Operating Profit (I+II-III-IV) 26530 27884 12488 13510 14896 17129VIII. Profit (Loss) during the year 12983 12502 5105 6150 6520 7302
Source : Annual accounts of banks.
(1) (2) (3) (4) (5) (6)
Source

184
TABLE B2 : EARNINGS AND EXPENSES OF SCHEDULED COMMERCIAL BANKS - 2011-12 AND 2012-13 AS ON MARCH 31STATE BANK OF INDIA & ITS ASSOCIATES
(Amount in ` Million)
(Contd.)
Items
State Bank ofHyderabad
State Bank ofTravancore
State Bank ofBikaner & Jaipur
2012 2013 2012 2013 2012 2013
(7) (8) (9) (10) (11) (12)IncomeI. Interest Earned 106467 124478 68961 86348 62914 74982 a) Interest/Discount earned on advances/bills 81770 95558 53986 67461 50779 59877 b) Income on investments 22632 25873 14463 18164 11655 14567 c) Interest on balances with RBI and other inter-bank funds 1341 1934 184 412 189 221 d) Others 723 1113 328 311 290 316II. Other Income 10243 9756 5809 6530 5990 7263 a) Commission, exchange and brokerage 7434 6674 3999 4358 5512 5579 b) Net profit (loss) on sale of investments 1665 1895 668 1312 286 756 c) Net profit (loss) on revaluation of investments - - - - - - d) Net profit (loss) on sale of land and other assets -20 -79 -9 -3 - - e) Net profit (loss) on exchange transactions 790 850 425 253 36 552 f) Miscellaneous income 375 416 726 610 156 376 Total (I+II) 116710 134234 74770 92879 68903 82245
Expenditure & ProvisionsIII. Interest Expended 72822 85299 49984 65066 40700 49324 a) Interest on deposits 68201 81211 43674 58640 38387 46437 b) Interest on RBI/ Inter - bank borrowings 497 286 670 646 799 938 c) Others 4123 3802 5639 5780 1513 1949IV. Operating Expenses 17358 21051 12299 14302 13308 15792 a) Payments to and provisions for employees 11513 14155 7878 8848 8198 9875 b) Rent, taxes and lighting 1704 1740 962 1201 1089 1208 c) Printing and stationery 188 202 99 122 192 199 d) Advertisement and publicity 216 235 72 99 91 127 e) Depreciation on bank's property 731 989 502 588 538 572 f) Directors' fees, allowances and expenses 2 3 4 5 4 6 g) Auditors' fees and expenses 157 112 130 122 129 111 h) Law charges 30 31 72 70 31 28 i) Postage, telegrams, telephones, etc 106 148 59 79 214 245 j) Repairs and maintenance 127 149 145 163 138 171 k) Insurance 871 1203 619 683 479 573 l) Other expenditure 1713 2085 1754 2323 2204 2677V. Net Interest Income (I-III) 33645 39179 18977 21282 22214 25658VI. Provisions and Contingencies 13547 15382 7383 7360 8376 9826VII. Operating Profit (I+II-III-IV) 26530 27884 12488 13510 14896 17129VIII. Profit (Loss) during the year 12983 12502 5105 6150 6520 7302
Source : Annual accounts of banks.
TABLE B2 : EARNINGS AND EXPENSES OF SCHEDULED COMMERCIAL BANKS - 2011-12 AND 2012-13 AS ON MARCH 31STATE BANK OF INDIA & ITS ASSOCIATES
(Amount in ` Million)
Items
State Bank of India State Bank ofMysore State Bank of Patiala
2012 2013 2012 2013 2012 2013
(1) (2) (3) (4) (5) (6)IncomeI. Interest Earned 1065215 1196571 50784 59655 81211 95643 a) Interest/Discount earned on advances/bills 810777 905371 40633 47878 64304 76419 b) Income on investments 239491 272006 10002 11576 14934 17358 c) Interest on balances with RBI and other inter-bank funds 3505 5451 146 175 1790 1863 d) Others 11441 13742 3 26 183 2II. Other Income 143514 160348 5164 5956 7510 7588 a) Commission, exchange and brokerage 120909 114837 3996 3914 5854 5783 b) Net profit (loss) on sale of investments -9197 11019 386 665 711 903 c) Net profit (loss) on revaluation of investments - -38 - - - - d) Net profit (loss) on sale of land and other assets -441 -327 - -10 - - e) Net profit (loss) on exchange transactions 14322 16916 326 585 528 591 f) Miscellaneous income 17922 17941 456 802 418 311 Total (I+II) 1208729 1356919 55948 65611 88721 103231
Expenditure & ProvisionsIII. Interest Expended 632304 753258 34941 41253 57859 71134 a) Interest on deposits 556444 674645 32209 37799 52876 63925 b) Interest on RBI/ Inter - bank borrowings 38856 41241 1461 2146 512 1207 c) Others 37004 37371 1271 1308 4471 6002IV. Operating Expenses 260690 292844 10411 11048 13234 15903 a) Payments to and provisions for employees 169740 183809 6206 6402 8347 9595 b) Rent, taxes and lighting 20654 24388 927 982 1186 1433 c) Printing and stationery 2765 2970 132 143 94 108 d) Advertisement and publicity 2066 3844 61 64 121 180 e) Depreciation on bank's property 10072 11396 500 470 482 523 f) Directors' fees, allowances and expenses 5 7 2 2 5 5 g) Auditors' fees and expenses 1285 1246 106 92 113 140 h) Law charges 1173 1339 77 73 43 42 i) Postage, telegrams, telephones, etc 4333 5156 82 62 128 104 j) Repairs and maintenance 3733 3935 55 46 209 266 k) Insurance 9635 12007 397 469 620 907 l) Other expenditure 35230 42745 1866 2241 1886 2601V. Net Interest Income (I-III) 432911 443313 15843 18402 23352 24508VI. Provisions and Contingencies 198662 169767 6905 9149 9665 9526VII. Operating Profit (I+II-III-IV) 315735 310817 10596 13310 17629 16193VIII. Profit (Loss) during the year 117073 141050 3691 4161 7964 6668
Source : Annual accounts of banks.
TABLE B2 : EARNINGS AND EXPENSES OF SCHEDULED COMMERCIAL BANKS - 2011-12 AND 2012-13 AS ON MARCH 31STATE BANK OF INDIA & ITS ASSOCIATES
(Amount in ` Million)
(Contd.)
Items
State Bank ofHyderabad
State Bank ofTravancore
State Bank ofBikaner & Jaipur
2012 2013 2012 2013 2012 2013
(7) (8) (9) (10) (11) (12)IncomeI. Interest Earned 106467 124478 68961 86348 62914 74982 a) Interest/Discount earned on advances/bills 81770 95558 53986 67461 50779 59877 b) Income on investments 22632 25873 14463 18164 11655 14567 c) Interest on balances with RBI and other inter-bank funds 1341 1934 184 412 189 221 d) Others 723 1113 328 311 290 316II. Other Income 10243 9756 5809 6530 5990 7263 a) Commission, exchange and brokerage 7434 6674 3999 4358 5512 5579 b) Net profit (loss) on sale of investments 1665 1895 668 1312 286 756 c) Net profit (loss) on revaluation of investments - - - - - - d) Net profit (loss) on sale of land and other assets -20 -79 -9 -3 - - e) Net profit (loss) on exchange transactions 790 850 425 253 36 552 f) Miscellaneous income 375 416 726 610 156 376 Total (I+II) 116710 134234 74770 92879 68903 82245
Expenditure & ProvisionsIII. Interest Expended 72822 85299 49984 65066 40700 49324 a) Interest on deposits 68201 81211 43674 58640 38387 46437 b) Interest on RBI/ Inter - bank borrowings 497 286 670 646 799 938 c) Others 4123 3802 5639 5780 1513 1949IV. Operating Expenses 17358 21051 12299 14302 13308 15792 a) Payments to and provisions for employees 11513 14155 7878 8848 8198 9875 b) Rent, taxes and lighting 1704 1740 962 1201 1089 1208 c) Printing and stationery 188 202 99 122 192 199 d) Advertisement and publicity 216 235 72 99 91 127 e) Depreciation on bank's property 731 989 502 588 538 572 f) Directors' fees, allowances and expenses 2 3 4 5 4 6 g) Auditors' fees and expenses 157 112 130 122 129 111 h) Law charges 30 31 72 70 31 28 i) Postage, telegrams, telephones, etc 106 148 59 79 214 245 j) Repairs and maintenance 127 149 145 163 138 171 k) Insurance 871 1203 619 683 479 573 l) Other expenditure 1713 2085 1754 2323 2204 2677V. Net Interest Income (I-III) 33645 39179 18977 21282 22214 25658VI. Provisions and Contingencies 13547 15382 7383 7360 8376 9826VII. Operating Profit (I+II-III-IV) 26530 27884 12488 13510 14896 17129VIII. Profit (Loss) during the year 12983 12502 5105 6150 6520 7302
Source : Annual accounts of banks.
TABLE B2 : EARNINGS AND EXPENSES OF SCHEDULED COMMERCIAL BANKS - 2011-12 AND 2012-13 AS ON MARCH 31STATE BANK OF INDIA & ITS ASSOCIATES
(Amount in ` Million)
(Contd.)
Items
State Bank ofHyderabad
State Bank ofTravancore
State Bank ofBikaner & Jaipur
2012 2013 2012 2013 2012 2013
(7) (8) (9) (10) (11) (12)IncomeI. Interest Earned 106467 124478 68961 86348 62914 74982 a) Interest/Discount earned on advances/bills 81770 95558 53986 67461 50779 59877 b) Income on investments 22632 25873 14463 18164 11655 14567 c) Interest on balances with RBI and other inter-bank funds 1341 1934 184 412 189 221 d) Others 723 1113 328 311 290 316II. Other Income 10243 9756 5809 6530 5990 7263 a) Commission, exchange and brokerage 7434 6674 3999 4358 5512 5579 b) Net profit (loss) on sale of investments 1665 1895 668 1312 286 756 c) Net profit (loss) on revaluation of investments - - - - - - d) Net profit (loss) on sale of land and other assets -20 -79 -9 -3 - - e) Net profit (loss) on exchange transactions 790 850 425 253 36 552 f) Miscellaneous income 375 416 726 610 156 376 Total (I+II) 116710 134234 74770 92879 68903 82245
Expenditure & ProvisionsIII. Interest Expended 72822 85299 49984 65066 40700 49324 a) Interest on deposits 68201 81211 43674 58640 38387 46437 b) Interest on RBI/ Inter - bank borrowings 497 286 670 646 799 938 c) Others 4123 3802 5639 5780 1513 1949IV. Operating Expenses 17358 21051 12299 14302 13308 15792 a) Payments to and provisions for employees 11513 14155 7878 8848 8198 9875 b) Rent, taxes and lighting 1704 1740 962 1201 1089 1208 c) Printing and stationery 188 202 99 122 192 199 d) Advertisement and publicity 216 235 72 99 91 127 e) Depreciation on bank's property 731 989 502 588 538 572 f) Directors' fees, allowances and expenses 2 3 4 5 4 6 g) Auditors' fees and expenses 157 112 130 122 129 111 h) Law charges 30 31 72 70 31 28 i) Postage, telegrams, telephones, etc 106 148 59 79 214 245 j) Repairs and maintenance 127 149 145 163 138 171 k) Insurance 871 1203 619 683 479 573 l) Other expenditure 1713 2085 1754 2323 2204 2677V. Net Interest Income (I-III) 33645 39179 18977 21282 22214 25658VI. Provisions and Contingencies 13547 15382 7383 7360 8376 9826VII. Operating Profit (I+II-III-IV) 26530 27884 12488 13510 14896 17129VIII. Profit (Loss) during the year 12983 12502 5105 6150 6520 7302
Source : Annual accounts of banks.
(7) (8) (9) (10) (11) (12)
Source

185
TABLE B2 : EARNINGS AND EXPENSES OF SCHEDULED COMMERCIAL BANKS - 2011-12 AND 2012-13 AS ON MARCH 31NATIONALISED BANKS
(Amount in ` Million)
(Contd.)
Items
Allahabad Bank Andhra Bank Bank of Baroda
2012 2013 2012 2013 2012 2013
(1) (2) (3) (4) (5) (6)IncomeI. Interest Earned 155233 174357 113387 129097 296737 351967 a) Interest/Discount earned on advances/bills 116641 127450 92782 103271 223694 258671 b) Income on investments 37164 44733 19735 24758 61847 74834 c) Interest on balances with RBI and other inter-bank funds 1229 1594 751 892 8374 14430 d) Others 199 579 118 176 2822 4032II. Other Income 12987 14769 8599 10474 34223 36306 a) Commission, exchange and brokerage 8380 7913 2640 2729 12261 12574 b) Net profit (loss) on sale of investments 1229 3267 1209 1889 6067 6173 c) Net profit (loss) on revaluation of investments -97 739 - -100 - - d) Net profit (loss) on sale of land and other assets - 1 10 5 8 -8 e) Net profit (loss) on exchange transactions 1147 1266 613 1027 6861 8025 f) Miscellaneous income 2327 3062 4127 4925 9027 9543 Total (I+II) 168220 189126 121987 139571 330961 388273
Expenditure & ProvisionsIII. Interest Expended 103606 125693 75794 91527 193567 238814 a) Interest on deposits 97429 120481 69460 85498 177707 224457 b) Interest on RBI/ Inter - bank borrowings 1596 1693 3541 3236 6311 4611 c) Others 4582 3519 2792 2792 9548 9746IV. Operating Expenses 26914 29581 18042 20372 51587 59467 a) Payments to and provisions for employees 18345 19859 11499 12870 29856 34496 b) Rent, taxes and lighting 2314 2751 1225 1456 4157 5238 c) Printing and stationery 235 285 170 198 388 561 d) Advertisement and publicity 274 285 75 157 582 611 e) Depreciation on bank's property 735 728 939 836 2766 3006 f) Directors' fees, allowances and expenses 10 14 7 8 12 12 g) Auditors' fees and expenses 176 152 148 150 396 338 h) Law charges 201 166 145 114 221 305 i) Postage, telegrams, telephones, etc 322 379 287 312 993 1185 j) Repairs and maintenance 419 575 712 851 1689 1837 k) Insurance 1254 1343 851 978 2772 2967 l) Other expenditure 2629 3044 1984 2442 7755 8911V. Net Interest Income (I-III) 51626 48664 37593 37570 103170 113153VI. Provisions and Contingencies 19032 22000 14703 14781 35737 45184VII. Operating Profit (I+II-III-IV) 37699 33852 28150 27672 85806 89992VIII. Profit (Loss) during the year 18668 11852 13447 12891 50070 44807
Source : Annual accounts of banks.
TABLE B2 : EARNINGS AND EXPENSES OF SCHEDULED COMMERCIAL BANKS - 2011-12 AND 2012-13 AS ON MARCH 31STATE BANK OF INDIA & ITS ASSOCIATES
(Amount in ` Million)
Items
State Bank of India State Bank ofMysore State Bank of Patiala
2012 2013 2012 2013 2012 2013
(1) (2) (3) (4) (5) (6)IncomeI. Interest Earned 1065215 1196571 50784 59655 81211 95643 a) Interest/Discount earned on advances/bills 810777 905371 40633 47878 64304 76419 b) Income on investments 239491 272006 10002 11576 14934 17358 c) Interest on balances with RBI and other inter-bank funds 3505 5451 146 175 1790 1863 d) Others 11441 13742 3 26 183 2II. Other Income 143514 160348 5164 5956 7510 7588 a) Commission, exchange and brokerage 120909 114837 3996 3914 5854 5783 b) Net profit (loss) on sale of investments -9197 11019 386 665 711 903 c) Net profit (loss) on revaluation of investments - -38 - - - - d) Net profit (loss) on sale of land and other assets -441 -327 - -10 - - e) Net profit (loss) on exchange transactions 14322 16916 326 585 528 591 f) Miscellaneous income 17922 17941 456 802 418 311 Total (I+II) 1208729 1356919 55948 65611 88721 103231
Expenditure & ProvisionsIII. Interest Expended 632304 753258 34941 41253 57859 71134 a) Interest on deposits 556444 674645 32209 37799 52876 63925 b) Interest on RBI/ Inter - bank borrowings 38856 41241 1461 2146 512 1207 c) Others 37004 37371 1271 1308 4471 6002IV. Operating Expenses 260690 292844 10411 11048 13234 15903 a) Payments to and provisions for employees 169740 183809 6206 6402 8347 9595 b) Rent, taxes and lighting 20654 24388 927 982 1186 1433 c) Printing and stationery 2765 2970 132 143 94 108 d) Advertisement and publicity 2066 3844 61 64 121 180 e) Depreciation on bank's property 10072 11396 500 470 482 523 f) Directors' fees, allowances and expenses 5 7 2 2 5 5 g) Auditors' fees and expenses 1285 1246 106 92 113 140 h) Law charges 1173 1339 77 73 43 42 i) Postage, telegrams, telephones, etc 4333 5156 82 62 128 104 j) Repairs and maintenance 3733 3935 55 46 209 266 k) Insurance 9635 12007 397 469 620 907 l) Other expenditure 35230 42745 1866 2241 1886 2601V. Net Interest Income (I-III) 432911 443313 15843 18402 23352 24508VI. Provisions and Contingencies 198662 169767 6905 9149 9665 9526VII. Operating Profit (I+II-III-IV) 315735 310817 10596 13310 17629 16193VIII. Profit (Loss) during the year 117073 141050 3691 4161 7964 6668
Source : Annual accounts of banks.Source

186
TABLE B2 : EARNINGS AND EXPENSES OF SCHEDULED COMMERCIAL BANKS - 2011-12 AND 2012-13 AS ON MARCH 31NATIONALISED BANKS
(Amount in ` Million)
(Contd.)
Items
Bank of India Bank of Maharashtra Canara Bank
2012 2013 2012 2013 2012 2013
(7) (8) (9) (10) (11) (12)IncomeI. Interest Earned 284807 319089 72140 96134 308506 340779 a) Interest/Discount earned on advances/bills 202406 231392 54906 72985 234434 243799 b) Income on investments 71418 72613 17086 22313 70447 91124 c) Interest on balances with RBI and other inter-bank funds 8340 12570 15 817 3622 5852 d) Others 2643 2515 132 20 3 4II. Other Income 33212 37660 6407 9120 29276 31530 a) Commission, exchange and brokerage 12715 12632 4551 4913 7969 7981 b) Net profit (loss) on sale of investments 4088 4471 121 1440 3237 6757 c) Net profit (loss) on revaluation of investments - - - - -222 -151 d) Net profit (loss) on sale of land and other assets 8 - 1 -1 10 9 e) Net profit (loss) on exchange transactions 5894 6440 437 604 4350 4644 f) Miscellaneous income 10508 14118 1296 2164 13932 12288 Total (I+II) 318018 356750 78546 105254 337782 372309
Expenditure & ProvisionsIII. Interest Expended 201672 228849 46969 65801 231613 261989 a) Interest on deposits 179570 202383 42938 58793 219622 252503 b) Interest on RBI/ Inter - bank borrowings 11453 14886 1201 3123 4300 1633 c) Others 10649 11580 2830 3886 7691 7854IV. Operating Expenses 49407 53315 16425 17966 46737 51420 a) Payments to and provisions for employees 30693 31305 11130 11878 29731 32536 b) Rent, taxes and lighting 3435 4298 1159 1327 3973 4661 c) Printing and stationery 545 612 142 187 304 306 d) Advertisement and publicity 640 628 179 162 267 337 e) Depreciation on bank's property 1668 1839 657 739 1569 1897 f) Directors' fees, allowances and expenses 1 1 7 8 12 10 g) Auditors' fees and expenses 376 372 119 132 343 327 h) Law charges 185 188 87 99 274 240 i) Postage, telegrams, telephones, etc 435 453 225 297 371 380 j) Repairs and maintenance 459 599 337 399 1498 1523 k) Insurance 2383 2282 692 775 2856 2766 l) Other expenditure 8586 10739 1691 1964 5540 6437V. Net Interest Income (I-III) 83134 90240 25171 30333 76893 78790VI. Provisions and Contingencies 40164 47091 10844 13892 26605 30179VII. Operating Profit (I+II-III-IV) 66939 74585 15152 21487 59432 58900VIII. Profit (Loss) during the year 26775 27493 4308 7595 32827 28721
Source : Annual accounts of banks.
TABLE B2 : EARNINGS AND EXPENSES OF SCHEDULED COMMERCIAL BANKS - 2011-12 AND 2012-13 AS ON MARCH 31STATE BANK OF INDIA & ITS ASSOCIATES
(Amount in ` Million)
Items
State Bank of India State Bank ofMysore State Bank of Patiala
2012 2013 2012 2013 2012 2013
(1) (2) (3) (4) (5) (6)IncomeI. Interest Earned 1065215 1196571 50784 59655 81211 95643 a) Interest/Discount earned on advances/bills 810777 905371 40633 47878 64304 76419 b) Income on investments 239491 272006 10002 11576 14934 17358 c) Interest on balances with RBI and other inter-bank funds 3505 5451 146 175 1790 1863 d) Others 11441 13742 3 26 183 2II. Other Income 143514 160348 5164 5956 7510 7588 a) Commission, exchange and brokerage 120909 114837 3996 3914 5854 5783 b) Net profit (loss) on sale of investments -9197 11019 386 665 711 903 c) Net profit (loss) on revaluation of investments - -38 - - - - d) Net profit (loss) on sale of land and other assets -441 -327 - -10 - - e) Net profit (loss) on exchange transactions 14322 16916 326 585 528 591 f) Miscellaneous income 17922 17941 456 802 418 311 Total (I+II) 1208729 1356919 55948 65611 88721 103231
Expenditure & ProvisionsIII. Interest Expended 632304 753258 34941 41253 57859 71134 a) Interest on deposits 556444 674645 32209 37799 52876 63925 b) Interest on RBI/ Inter - bank borrowings 38856 41241 1461 2146 512 1207 c) Others 37004 37371 1271 1308 4471 6002IV. Operating Expenses 260690 292844 10411 11048 13234 15903 a) Payments to and provisions for employees 169740 183809 6206 6402 8347 9595 b) Rent, taxes and lighting 20654 24388 927 982 1186 1433 c) Printing and stationery 2765 2970 132 143 94 108 d) Advertisement and publicity 2066 3844 61 64 121 180 e) Depreciation on bank's property 10072 11396 500 470 482 523 f) Directors' fees, allowances and expenses 5 7 2 2 5 5 g) Auditors' fees and expenses 1285 1246 106 92 113 140 h) Law charges 1173 1339 77 73 43 42 i) Postage, telegrams, telephones, etc 4333 5156 82 62 128 104 j) Repairs and maintenance 3733 3935 55 46 209 266 k) Insurance 9635 12007 397 469 620 907 l) Other expenditure 35230 42745 1866 2241 1886 2601V. Net Interest Income (I-III) 432911 443313 15843 18402 23352 24508VI. Provisions and Contingencies 198662 169767 6905 9149 9665 9526VII. Operating Profit (I+II-III-IV) 315735 310817 10596 13310 17629 16193VIII. Profit (Loss) during the year 117073 141050 3691 4161 7964 6668
Source : Annual accounts of banks.Source

187
TABLE B2 : EARNINGS AND EXPENSES OF SCHEDULED COMMERCIAL BANKS - 2011-12 AND 2012-13 AS ON MARCH 31NATIONALISED BANKS
(Amount in ` Million)
(Contd.)
Items
Central Bank of India Corporation Bank Dena Bank
2012 2013 2012 2013 2012 2013
(13) (14) (15) (16) (17) (18)IncomeI. Interest Earned 191495 218607 130178 153341 67941 88994 a) Interest/Discount earned on advances/bills 144205 169225 95632 114489 51612 68190 b) Income on investments 43473 47787 30703 34317 15444 20195 c) Interest on balances with RBI and other inter-bank funds 3393 787 355 416 380 310 d) Others 423 808 3487 4118 505 300II. Other Income 13953 16673 14926 16079 5822 6555 a) Commission, exchange and brokerage 6635 8157 3949 4380 1592 1846 b) Net profit (loss) on sale of investments 3201 3829 3650 2803 347 1571 c) Net profit (loss) on revaluation of investments - - - - - - d) Net profit (loss) on sale of land and other assets -4 -7 -14 -10 -3 -8 e) Net profit (loss) on exchange transactions 1868 609 1495 1147 822 888 f) Miscellaneous income 2253 4086 5847 7759 3064 2256 Total (I+II) 205448 235280 145104 169420 73763 95549
Expenditure & ProvisionsIII. Interest Expended 139809 161231 98709 119082 46931 65163 a) Interest on deposits 129961 149399 90193 110971 45282 62344 b) Interest on RBI/ Inter - bank borrowings 1491 1746 2362 2423 178 586 c) Others 8357 10086 6154 5688 1472 2233IV. Operating Expenses 37490 42323 17836 19968 11547 12997 a) Payments to and provisions for employees 25062 28915 9132 9903 7147 7918 b) Rent, taxes and lighting 2568 2665 1606 1885 978 1196 c) Printing and stationery 265 304 156 182 125 131 d) Advertisement and publicity 352 287 213 206 83 83 e) Depreciation on bank's property 1435 1844 798 966 356 413 f) Directors' fees, allowances and expenses 9 9 8 9 17 25 g) Auditors' fees and expenses 205 108 160 150 102 84 h) Law charges 116 147 20 30 57 42 i) Postage, telegrams, telephones, etc 394 367 371 399 322 256 j) Repairs and maintenance 833 574 365 439 183 236 k) Insurance 1646 1712 973 1225 674 770 l) Other expenditure 4604 5390 4033 4574 1505 1842V. Net Interest Income (I-III) 51686 57376 31469 34258 21010 23831VI. Provisions and Contingencies 22819 21576 13499 16023 7253 9285VII. Operating Profit (I+II-III-IV) 28149 31726 28560 30370 15284 17389VIII. Profit (Loss) during the year 5330 10150 15060 14347 8031 8104
Source : Annual accounts of banks.
TABLE B2 : EARNINGS AND EXPENSES OF SCHEDULED COMMERCIAL BANKS - 2011-12 AND 2012-13 AS ON MARCH 31STATE BANK OF INDIA & ITS ASSOCIATES
(Amount in ` Million)
Items
State Bank of India State Bank ofMysore State Bank of Patiala
2012 2013 2012 2013 2012 2013
(1) (2) (3) (4) (5) (6)IncomeI. Interest Earned 1065215 1196571 50784 59655 81211 95643 a) Interest/Discount earned on advances/bills 810777 905371 40633 47878 64304 76419 b) Income on investments 239491 272006 10002 11576 14934 17358 c) Interest on balances with RBI and other inter-bank funds 3505 5451 146 175 1790 1863 d) Others 11441 13742 3 26 183 2II. Other Income 143514 160348 5164 5956 7510 7588 a) Commission, exchange and brokerage 120909 114837 3996 3914 5854 5783 b) Net profit (loss) on sale of investments -9197 11019 386 665 711 903 c) Net profit (loss) on revaluation of investments - -38 - - - - d) Net profit (loss) on sale of land and other assets -441 -327 - -10 - - e) Net profit (loss) on exchange transactions 14322 16916 326 585 528 591 f) Miscellaneous income 17922 17941 456 802 418 311 Total (I+II) 1208729 1356919 55948 65611 88721 103231
Expenditure & ProvisionsIII. Interest Expended 632304 753258 34941 41253 57859 71134 a) Interest on deposits 556444 674645 32209 37799 52876 63925 b) Interest on RBI/ Inter - bank borrowings 38856 41241 1461 2146 512 1207 c) Others 37004 37371 1271 1308 4471 6002IV. Operating Expenses 260690 292844 10411 11048 13234 15903 a) Payments to and provisions for employees 169740 183809 6206 6402 8347 9595 b) Rent, taxes and lighting 20654 24388 927 982 1186 1433 c) Printing and stationery 2765 2970 132 143 94 108 d) Advertisement and publicity 2066 3844 61 64 121 180 e) Depreciation on bank's property 10072 11396 500 470 482 523 f) Directors' fees, allowances and expenses 5 7 2 2 5 5 g) Auditors' fees and expenses 1285 1246 106 92 113 140 h) Law charges 1173 1339 77 73 43 42 i) Postage, telegrams, telephones, etc 4333 5156 82 62 128 104 j) Repairs and maintenance 3733 3935 55 46 209 266 k) Insurance 9635 12007 397 469 620 907 l) Other expenditure 35230 42745 1866 2241 1886 2601V. Net Interest Income (I-III) 432911 443313 15843 18402 23352 24508VI. Provisions and Contingencies 198662 169767 6905 9149 9665 9526VII. Operating Profit (I+II-III-IV) 315735 310817 10596 13310 17629 16193VIII. Profit (Loss) during the year 117073 141050 3691 4161 7964 6668
Source : Annual accounts of banks.Source

188
TABLE B2 : EARNINGS AND EXPENSES OF SCHEDULED COMMERCIAL BANKS - 2011-12 AND 2012-13 AS ON MARCH 31NATIONALISED BANKS
(Amount in ` Million)
(Contd.)
Items
IDBI Bank Ltd. Indian Bank Indian OverseasBank
2012 2013 2012 2013 2012 2013
(19) (20) (21) (22) (23) (24)IncomeI. Interest Earned 233699 250643 122313 138926 178891 206767 a) Interest/Discount earned on advances/bills 179715 195493 94239 106066 135819 159094 b) Income on investments 52907 53351 27903 32382 39414 43723 c) Interest on balances with RBI and other inter-bank funds 462 1561 171 479 3225 2869 d) Others 615 237 - - 433 1081II. Other Income 21122 32195 12322 12879 16810 19729 a) Commission, exchange and brokerage 15308 22373 2858 2570 8999 8953 b) Net profit (loss) on sale of investments 1880 3912 1073 2131 1714 3114 c) Net profit (loss) on revaluation of investments -392 388 - - -350 -683 d) Net profit (loss) on sale of land and other assets -15 -4 -3 -81 25 16 e) Net profit (loss) on exchange transactions 1724 1934 1738 885 2246 2882 f) Miscellaneous income 2618 3592 6656 7375 4177 5447 Total (I+II) 254821 282838 134635 151806 195702 226496
Expenditure & ProvisionsIII. Interest Expended 188251 196912 78133 93684 128729 154248 a) Interest on deposits 140277 152840 74606 90226 112343 138730 b) Interest on RBI/ Inter - bank borrowings 13688 12760 3329 3344 16385 15517 c) Others 34286 31312 198 114 1 1IV. Operating Expenses 26075 31344 21870 27509 31631 34078 a) Payments to and provisions for employees 11604 15385 14840 19739 20830 22483 b) Rent, taxes and lighting 2244 2815 1568 1745 3010 3078 c) Printing and stationery 418 394 217 224 194 236 d) Advertisement and publicity 262 126 96 83 389 298 e) Depreciation on bank's property 1161 1241 892 909 1111 1266 f) Directors' fees, allowances and expenses 3 2 6 9 14 15 g) Auditors' fees and expenses 23 27 172 192 250 232 h) Law charges 88 135 94 61 35 58 i) Postage, telegrams, telephones, etc 743 664 140 135 378 453 j) Repairs and maintenance 1383 1607 524 593 104 113 k) Insurance 1643 1473 1001 1110 1633 1904 l) Other expenditure 6501 7475 2320 2708 3682 3941V. Net Interest Income (I-III) 45448 53731 44180 45243 50162 52519VI. Provisions and Contingencies 20180 35762 17162 14802 24840 32498VII. Operating Profit (I+II-III-IV) 40496 54583 34632 30613 35341 38170VIII. Profit (Loss) during the year 20316 18821 17470 15811 10501 5672
Source : Annual accounts of banks.
TABLE B2 : EARNINGS AND EXPENSES OF SCHEDULED COMMERCIAL BANKS - 2011-12 AND 2012-13 AS ON MARCH 31STATE BANK OF INDIA & ITS ASSOCIATES
(Amount in ` Million)
Items
State Bank of India State Bank ofMysore State Bank of Patiala
2012 2013 2012 2013 2012 2013
(1) (2) (3) (4) (5) (6)IncomeI. Interest Earned 1065215 1196571 50784 59655 81211 95643 a) Interest/Discount earned on advances/bills 810777 905371 40633 47878 64304 76419 b) Income on investments 239491 272006 10002 11576 14934 17358 c) Interest on balances with RBI and other inter-bank funds 3505 5451 146 175 1790 1863 d) Others 11441 13742 3 26 183 2II. Other Income 143514 160348 5164 5956 7510 7588 a) Commission, exchange and brokerage 120909 114837 3996 3914 5854 5783 b) Net profit (loss) on sale of investments -9197 11019 386 665 711 903 c) Net profit (loss) on revaluation of investments - -38 - - - - d) Net profit (loss) on sale of land and other assets -441 -327 - -10 - - e) Net profit (loss) on exchange transactions 14322 16916 326 585 528 591 f) Miscellaneous income 17922 17941 456 802 418 311 Total (I+II) 1208729 1356919 55948 65611 88721 103231
Expenditure & ProvisionsIII. Interest Expended 632304 753258 34941 41253 57859 71134 a) Interest on deposits 556444 674645 32209 37799 52876 63925 b) Interest on RBI/ Inter - bank borrowings 38856 41241 1461 2146 512 1207 c) Others 37004 37371 1271 1308 4471 6002IV. Operating Expenses 260690 292844 10411 11048 13234 15903 a) Payments to and provisions for employees 169740 183809 6206 6402 8347 9595 b) Rent, taxes and lighting 20654 24388 927 982 1186 1433 c) Printing and stationery 2765 2970 132 143 94 108 d) Advertisement and publicity 2066 3844 61 64 121 180 e) Depreciation on bank's property 10072 11396 500 470 482 523 f) Directors' fees, allowances and expenses 5 7 2 2 5 5 g) Auditors' fees and expenses 1285 1246 106 92 113 140 h) Law charges 1173 1339 77 73 43 42 i) Postage, telegrams, telephones, etc 4333 5156 82 62 128 104 j) Repairs and maintenance 3733 3935 55 46 209 266 k) Insurance 9635 12007 397 469 620 907 l) Other expenditure 35230 42745 1866 2241 1886 2601V. Net Interest Income (I-III) 432911 443313 15843 18402 23352 24508VI. Provisions and Contingencies 198662 169767 6905 9149 9665 9526VII. Operating Profit (I+II-III-IV) 315735 310817 10596 13310 17629 16193VIII. Profit (Loss) during the year 117073 141050 3691 4161 7964 6668
Source : Annual accounts of banks.Source

189
TABLE B2 : EARNINGS AND EXPENSES OF SCHEDULED COMMERCIAL BANKS - 2011-12 AND 2012-13 AS ON MARCH 31NATIONALISED BANKS
(Amount in ` Million)
(Contd.)
Items
Oriental Bank ofCommerce
Punjab and SindBank
Punjab NationalBank
2012 2013 2012 2013 2012 2013
(25) (26) (27) (28) (29) (30)IncomeI. Interest Earned 158149 177048 64745 73401 364761 418933 a) Interest/Discount earned on advances/bills 120746 137581 49524 57095 284354 318545 b) Income on investments 36709 38538 14697 15792 77392 95300 c) Interest on balances with RBI and other inter-bank funds 342 315 306 300 2250 3249 d) Others 351 614 218 214 765 1840II. Other Income 12402 16547 4175 4172 42026 42159 a) Commission, exchange and brokerage 7258 7658 747 798 23748 23373 b) Net profit (loss) on sale of investments 1703 1685 548 630 3469 4866 c) Net profit (loss) on revaluation of investments - - - - - - d) Net profit (loss) on sale of land and other assets 28 213 - 1 42 26 e) Net profit (loss) on exchange transactions 1775 1230 421 333 5779 5811 f) Miscellaneous income 1639 5761 2459 2409 8988 8083 Total (I+II) 170551 193595 68920 77573 406787 461093
Expenditure & ProvisionsIII. Interest Expended 115991 130036 49734 56991 230617 270368 a) Interest on deposits 112130 125527 46753 54247 213965 255006 b) Interest on RBI/ Inter - bank borrowings 377 1108 1227 944 4300 4160 c) Others 3484 3402 1754 1800 12353 11202IV. Operating Expenses 23155 26652 11585 11193 70028 81651 a) Payments to and provisions for employees 13568 15761 8324 7735 47235 56747 b) Rent, taxes and lighting 2343 2640 539 678 3631 4275 c) Printing and stationery 275 298 83 72 595 682 d) Advertisement and publicity 158 229 69 81 372 311 e) Depreciation on bank's property 1042 1231 438 497 2923 3185 f) Directors' fees, allowances and expenses 7 9 2 3 12 13 g) Auditors' fees and expenses 193 175 67 71 523 335 h) Law charges 221 250 85 81 217 256 i) Postage, telegrams, telephones, etc 307 353 84 82 1056 1145 j) Repairs and maintenance 300 362 113 127 1008 1305 k) Insurance 1482 1629 561 621 3159 3564 l) Other expenditure 3258 3716 1220 1145 9296 9831V. Net Interest Income (I-III) 42158 47012 15011 16410 134144 148565VI. Provisions and Contingencies 19990 23627 3087 5996 57301 61597VII. Operating Profit (I+II-III-IV) 31406 36907 7600 9388 106143 109074VIII. Profit (Loss) during the year 11416 13279 4513 3392 48842 47477
Source : Annual accounts of banks.
TABLE B2 : EARNINGS AND EXPENSES OF SCHEDULED COMMERCIAL BANKS - 2011-12 AND 2012-13 AS ON MARCH 31STATE BANK OF INDIA & ITS ASSOCIATES
(Amount in ` Million)
Items
State Bank of India State Bank ofMysore State Bank of Patiala
2012 2013 2012 2013 2012 2013
(1) (2) (3) (4) (5) (6)IncomeI. Interest Earned 1065215 1196571 50784 59655 81211 95643 a) Interest/Discount earned on advances/bills 810777 905371 40633 47878 64304 76419 b) Income on investments 239491 272006 10002 11576 14934 17358 c) Interest on balances with RBI and other inter-bank funds 3505 5451 146 175 1790 1863 d) Others 11441 13742 3 26 183 2II. Other Income 143514 160348 5164 5956 7510 7588 a) Commission, exchange and brokerage 120909 114837 3996 3914 5854 5783 b) Net profit (loss) on sale of investments -9197 11019 386 665 711 903 c) Net profit (loss) on revaluation of investments - -38 - - - - d) Net profit (loss) on sale of land and other assets -441 -327 - -10 - - e) Net profit (loss) on exchange transactions 14322 16916 326 585 528 591 f) Miscellaneous income 17922 17941 456 802 418 311 Total (I+II) 1208729 1356919 55948 65611 88721 103231
Expenditure & ProvisionsIII. Interest Expended 632304 753258 34941 41253 57859 71134 a) Interest on deposits 556444 674645 32209 37799 52876 63925 b) Interest on RBI/ Inter - bank borrowings 38856 41241 1461 2146 512 1207 c) Others 37004 37371 1271 1308 4471 6002IV. Operating Expenses 260690 292844 10411 11048 13234 15903 a) Payments to and provisions for employees 169740 183809 6206 6402 8347 9595 b) Rent, taxes and lighting 20654 24388 927 982 1186 1433 c) Printing and stationery 2765 2970 132 143 94 108 d) Advertisement and publicity 2066 3844 61 64 121 180 e) Depreciation on bank's property 10072 11396 500 470 482 523 f) Directors' fees, allowances and expenses 5 7 2 2 5 5 g) Auditors' fees and expenses 1285 1246 106 92 113 140 h) Law charges 1173 1339 77 73 43 42 i) Postage, telegrams, telephones, etc 4333 5156 82 62 128 104 j) Repairs and maintenance 3733 3935 55 46 209 266 k) Insurance 9635 12007 397 469 620 907 l) Other expenditure 35230 42745 1866 2241 1886 2601V. Net Interest Income (I-III) 432911 443313 15843 18402 23352 24508VI. Provisions and Contingencies 198662 169767 6905 9149 9665 9526VII. Operating Profit (I+II-III-IV) 315735 310817 10596 13310 17629 16193VIII. Profit (Loss) during the year 117073 141050 3691 4161 7964 6668
Source : Annual accounts of banks.Source

190
TABLE B2 : EARNINGS AND EXPENSES OF SCHEDULED COMMERCIAL BANKS - 2011-12 AND 2012-13 AS ON MARCH 31NATIONALISED BANKS
(Amount in ` Million)
(Contd.)
Items
Syndicate Bank UCO Bank Union Bank of India
2012 2013 2012 2013 2012 2013
(31) (32) (33) (34) (35) (36)IncomeI. Interest Earned 152684 171207 146324 167517 210285 251247 a) Interest/Discount earned on advances/bills 123713 135245 113830 128576 160266 191405 b) Income on investments 27360 32312 31563 36345 45701 56710 c) Interest on balances with RBI and other inter-bank funds 1507 2870 547 1204 3309 1986 d) Others 104 780 383 1391 1008 1146II. Other Income 10759 11744 9656 9522 24482 25520 a) Commission, exchange and brokerage 5514 5464 2379 2535 3651 3640 b) Net profit (loss) on sale of investments 888 1252 1958 1421 4408 4773 c) Net profit (loss) on revaluation of investments - - - - - - d) Net profit (loss) on sale of land and other assets -2 - 9 5 -7 -17 e) Net profit (loss) on exchange transactions 1166 814 1153 1082 4888 5599 f) Miscellaneous income 3193 4213 4156 4478 11542 11525 Total (I+II) 163442 182950 155979 177039 234767 276767
Expenditure & ProvisionsIII. Interest Expended 101833 116666 107303 121702 142354 175819 a) Interest on deposits 93263 107533 99482 115064 134058 165512 b) Interest on RBI/ Inter - bank borrowings 802 761 2755 1706 1409 2742 c) Others 7769 8372 5066 4931 6887 7564IV. Operating Expenses 28141 31788 20562 21766 39875 45122 a) Payments to and provisions for employees 18915 21792 13831 13933 24793 27550 b) Rent, taxes and lighting 1675 1901 1228 1509 2641 3229 c) Printing and stationery 156 223 267 278 374 440 d) Advertisement and publicity 146 195 240 324 674 716 e) Depreciation on bank's property 660 1007 781 871 1465 1509 f) Directors' fees, allowances and expenses 9 10 8 17 19 18 g) Auditors' fees and expenses 236 201 247 255 231 212 h) Law charges 67 69 132 130 146 149 i) Postage, telegrams, telephones, etc 287 329 372 426 497 608 j) Repairs and maintenance 946 748 66 94 701 795 k) Insurance 1251 1382 1151 1127 1943 2175 l) Other expenditure 3793 3931 2239 2803 6391 7720V. Net Interest Income (I-III) 50850 54541 39021 45815 67931 75428VI. Provisions and Contingencies 20334 14452 17027 27389 34666 34248VII. Operating Profit (I+II-III-IV) 33468 34496 28114 33571 52538 55827VIII. Profit (Loss) during the year 13134 20044 11087 6182 17871 21579
Source : Annual accounts of banks.
TABLE B2 : EARNINGS AND EXPENSES OF SCHEDULED COMMERCIAL BANKS - 2011-12 AND 2012-13 AS ON MARCH 31STATE BANK OF INDIA & ITS ASSOCIATES
(Amount in ` Million)
Items
State Bank of India State Bank ofMysore State Bank of Patiala
2012 2013 2012 2013 2012 2013
(1) (2) (3) (4) (5) (6)IncomeI. Interest Earned 1065215 1196571 50784 59655 81211 95643 a) Interest/Discount earned on advances/bills 810777 905371 40633 47878 64304 76419 b) Income on investments 239491 272006 10002 11576 14934 17358 c) Interest on balances with RBI and other inter-bank funds 3505 5451 146 175 1790 1863 d) Others 11441 13742 3 26 183 2II. Other Income 143514 160348 5164 5956 7510 7588 a) Commission, exchange and brokerage 120909 114837 3996 3914 5854 5783 b) Net profit (loss) on sale of investments -9197 11019 386 665 711 903 c) Net profit (loss) on revaluation of investments - -38 - - - - d) Net profit (loss) on sale of land and other assets -441 -327 - -10 - - e) Net profit (loss) on exchange transactions 14322 16916 326 585 528 591 f) Miscellaneous income 17922 17941 456 802 418 311 Total (I+II) 1208729 1356919 55948 65611 88721 103231
Expenditure & ProvisionsIII. Interest Expended 632304 753258 34941 41253 57859 71134 a) Interest on deposits 556444 674645 32209 37799 52876 63925 b) Interest on RBI/ Inter - bank borrowings 38856 41241 1461 2146 512 1207 c) Others 37004 37371 1271 1308 4471 6002IV. Operating Expenses 260690 292844 10411 11048 13234 15903 a) Payments to and provisions for employees 169740 183809 6206 6402 8347 9595 b) Rent, taxes and lighting 20654 24388 927 982 1186 1433 c) Printing and stationery 2765 2970 132 143 94 108 d) Advertisement and publicity 2066 3844 61 64 121 180 e) Depreciation on bank's property 10072 11396 500 470 482 523 f) Directors' fees, allowances and expenses 5 7 2 2 5 5 g) Auditors' fees and expenses 1285 1246 106 92 113 140 h) Law charges 1173 1339 77 73 43 42 i) Postage, telegrams, telephones, etc 4333 5156 82 62 128 104 j) Repairs and maintenance 3733 3935 55 46 209 266 k) Insurance 9635 12007 397 469 620 907 l) Other expenditure 35230 42745 1866 2241 1886 2601V. Net Interest Income (I-III) 432911 443313 15843 18402 23352 24508VI. Provisions and Contingencies 198662 169767 6905 9149 9665 9526VII. Operating Profit (I+II-III-IV) 315735 310817 10596 13310 17629 16193VIII. Profit (Loss) during the year 117073 141050 3691 4161 7964 6668
Source : Annual accounts of banks.Source

191
TABLE B2 : EARNINGS AND EXPENSES OF SCHEDULED COMMERCIAL BANKS - 2011-12 AND 2012-13 AS ON MARCH 31NATIONALISED BANKS
(Amount in ` Million)
(Contd.)
Items
United Bank of India Vijaya Bank
2012 2013 2012 2013
(37) (38) (39) (40)IncomeI. Interest Earned 79611 92515 79881 90519 a) Interest/Discount earned on advances/bills 60337 68993 60501 68093 b) Income on investments 18784 22593 18720 21584 c) Interest on balances with RBI and other inter-bank funds 155 635 3 28 d) Others 335 294 657 814II. Other Income 7329 10666 5279 6070 a) Commission, exchange and brokerage 1830 1951 891 956 b) Net profit (loss) on sale of investments 2175 4671 981 1131 c) Net profit (loss) on revaluation of investments - - - - d) Net profit (loss) on sale of land and other assets 1 9 3 -1 e) Net profit (loss) on exchange transactions 569 1080 588 610 f) Miscellaneous income 2755 2955 2816 3373 Total (I+II) 86940 103181 85160 96589
Expenditure & ProvisionsIII. Interest Expended 54819 67642 60846 71739 a) Interest on deposits 51006 62311 58048 68489 b) Interest on RBI/ Inter - bank borrowings 839 1497 118 56 c) Others 2973 3835 2680 3194IV. Operating Expenses 13833 15039 12014 13630 a) Payments to and provisions for employees 8912 9325 7399 8486 b) Rent, taxes and lighting 938 1092 1003 1097 c) Printing and stationery 256 234 88 103 d) Advertisement and publicity 71 144 74 102 e) Depreciation on bank's property 697 608 400 415 f) Directors' fees, allowances and expenses 10 16 7 8 g) Auditors' fees and expenses 107 132 124 108 h) Law charges 27 50 6 8 i) Postage, telegrams, telephones, etc 175 183 142 174 j) Repairs and maintenance 108 156 19 33 k) Insurance 725 822 732 657 l) Other expenditure 1808 2276 2019 2438V. Net Interest Income (I-III) 24792 24873 19035 18780VI. Provisions and Contingencies 11963 16580 6491 5364VII. Operating Profit (I+II-III-IV) 18288 20499 12301 11220VIII. Profit (Loss) during the year 6325 3919 5810 5856
Source : Annual accounts of banks.
TABLE B2 : EARNINGS AND EXPENSES OF SCHEDULED COMMERCIAL BANKS - 2011-12 AND 2012-13 AS ON MARCH 31STATE BANK OF INDIA & ITS ASSOCIATES
(Amount in ` Million)
Items
State Bank of India State Bank ofMysore State Bank of Patiala
2012 2013 2012 2013 2012 2013
(1) (2) (3) (4) (5) (6)IncomeI. Interest Earned 1065215 1196571 50784 59655 81211 95643 a) Interest/Discount earned on advances/bills 810777 905371 40633 47878 64304 76419 b) Income on investments 239491 272006 10002 11576 14934 17358 c) Interest on balances with RBI and other inter-bank funds 3505 5451 146 175 1790 1863 d) Others 11441 13742 3 26 183 2II. Other Income 143514 160348 5164 5956 7510 7588 a) Commission, exchange and brokerage 120909 114837 3996 3914 5854 5783 b) Net profit (loss) on sale of investments -9197 11019 386 665 711 903 c) Net profit (loss) on revaluation of investments - -38 - - - - d) Net profit (loss) on sale of land and other assets -441 -327 - -10 - - e) Net profit (loss) on exchange transactions 14322 16916 326 585 528 591 f) Miscellaneous income 17922 17941 456 802 418 311 Total (I+II) 1208729 1356919 55948 65611 88721 103231
Expenditure & ProvisionsIII. Interest Expended 632304 753258 34941 41253 57859 71134 a) Interest on deposits 556444 674645 32209 37799 52876 63925 b) Interest on RBI/ Inter - bank borrowings 38856 41241 1461 2146 512 1207 c) Others 37004 37371 1271 1308 4471 6002IV. Operating Expenses 260690 292844 10411 11048 13234 15903 a) Payments to and provisions for employees 169740 183809 6206 6402 8347 9595 b) Rent, taxes and lighting 20654 24388 927 982 1186 1433 c) Printing and stationery 2765 2970 132 143 94 108 d) Advertisement and publicity 2066 3844 61 64 121 180 e) Depreciation on bank's property 10072 11396 500 470 482 523 f) Directors' fees, allowances and expenses 5 7 2 2 5 5 g) Auditors' fees and expenses 1285 1246 106 92 113 140 h) Law charges 1173 1339 77 73 43 42 i) Postage, telegrams, telephones, etc 4333 5156 82 62 128 104 j) Repairs and maintenance 3733 3935 55 46 209 266 k) Insurance 9635 12007 397 469 620 907 l) Other expenditure 35230 42745 1866 2241 1886 2601V. Net Interest Income (I-III) 432911 443313 15843 18402 23352 24508VI. Provisions and Contingencies 198662 169767 6905 9149 9665 9526VII. Operating Profit (I+II-III-IV) 315735 310817 10596 13310 17629 16193VIII. Profit (Loss) during the year 117073 141050 3691 4161 7964 6668
Source : Annual accounts of banks.Source

192
TABLE B2 : EARNINGS AND EXPENSES OF SCHEDULED COMMERCIAL BANKS - 2011-12 AND 2012-13 AS ON MARCH 31OLD PRIVATE SECTOR BANKS
(Amount in ` Million)
(Contd.)
Items
Catholic Syrian Bank City Union Bank Dhanlaxmi Bank
2012 2013 2012 2013 2012 2013
(1) (2) (3) (4) (5) (6)IncomeI. Interest Earned 10756 13209 16968 21888 13937 13080 a) Interest/Discount earned on advances/bills 8615 10743 13886 18122 10754 9715 b) Income on investments 2009 2263 3036 3723 3136 3251 c) Interest on balances with RBI and other inter-bank funds 74 201 46 42 44 77 d) Others 58 1 - - 3 37II. Other Income 852 946 2071 2736 1436 1143 a) Commission, exchange and brokerage 173 163 345 414 85 88 b) Net profit (loss) on sale of investments 53 229 78 171 89 248 c) Net profit (loss) on revaluation of investments - - - - - - d) Net profit (loss) on sale of land and other assets 13 5 2 3 10 4 e) Net profit (loss) on exchange transactions 114 131 152 184 119 80 f) Miscellaneous income 500 419 1495 1966 1133 723 Total (I+II) 11609 14154 19039 24624 15373 14223
Expenditure & ProvisionsIII. Interest Expended 7686 9816 11970 15647 11461 10316 a) Interest on deposits 7380 9502 11665 15045 10156 9161 b) Interest on RBI/ Inter - bank borrowings 66 73 177 249 851 420 c) Others 240 241 129 353 454 734IV. Operating Expenses 2988 3318 2798 3742 4891 3393 a) Payments to and provisions for employees 2123 2339 1223 1509 2740 1868 b) Rent, taxes and lighting 255 323 394 564 402 451 c) Printing and stationery 29 33 74 94 63 23 d) Advertisement and publicity 24 18 196 185 108 5 e) Depreciation on bank's property 86 75 136 247 295 310 f) Directors' fees, allowances and expenses 7 10 4 4 2 2 g) Auditors' fees and expenses 11 17 11 18 5 10 h) Law charges 7 7 2 5 6 8 i) Postage, telegrams, telephones, etc 49 55 60 108 157 104 j) Repairs and maintenance 59 60 149 229 33 32 k) Insurance 93 100 146 178 146 114 l) Other expenditure 244 281 405 601 927 467V. Net Interest Income (I-III) 3070 3392 4998 6240 2475 2764VI. Provisions and Contingencies 676 693 1468 2014 177 488VII. Operating Profit (I+II-III-IV) 935 1020 4271 5234 -979 514VIII. Profit (Loss) during the year 259 327 2803 3220 -1156 26
Source : Annual accounts of banks.
TABLE B2 : EARNINGS AND EXPENSES OF SCHEDULED COMMERCIAL BANKS - 2011-12 AND 2012-13 AS ON MARCH 31STATE BANK OF INDIA & ITS ASSOCIATES
(Amount in ` Million)
Items
State Bank of India State Bank ofMysore State Bank of Patiala
2012 2013 2012 2013 2012 2013
(1) (2) (3) (4) (5) (6)IncomeI. Interest Earned 1065215 1196571 50784 59655 81211 95643 a) Interest/Discount earned on advances/bills 810777 905371 40633 47878 64304 76419 b) Income on investments 239491 272006 10002 11576 14934 17358 c) Interest on balances with RBI and other inter-bank funds 3505 5451 146 175 1790 1863 d) Others 11441 13742 3 26 183 2II. Other Income 143514 160348 5164 5956 7510 7588 a) Commission, exchange and brokerage 120909 114837 3996 3914 5854 5783 b) Net profit (loss) on sale of investments -9197 11019 386 665 711 903 c) Net profit (loss) on revaluation of investments - -38 - - - - d) Net profit (loss) on sale of land and other assets -441 -327 - -10 - - e) Net profit (loss) on exchange transactions 14322 16916 326 585 528 591 f) Miscellaneous income 17922 17941 456 802 418 311 Total (I+II) 1208729 1356919 55948 65611 88721 103231
Expenditure & ProvisionsIII. Interest Expended 632304 753258 34941 41253 57859 71134 a) Interest on deposits 556444 674645 32209 37799 52876 63925 b) Interest on RBI/ Inter - bank borrowings 38856 41241 1461 2146 512 1207 c) Others 37004 37371 1271 1308 4471 6002IV. Operating Expenses 260690 292844 10411 11048 13234 15903 a) Payments to and provisions for employees 169740 183809 6206 6402 8347 9595 b) Rent, taxes and lighting 20654 24388 927 982 1186 1433 c) Printing and stationery 2765 2970 132 143 94 108 d) Advertisement and publicity 2066 3844 61 64 121 180 e) Depreciation on bank's property 10072 11396 500 470 482 523 f) Directors' fees, allowances and expenses 5 7 2 2 5 5 g) Auditors' fees and expenses 1285 1246 106 92 113 140 h) Law charges 1173 1339 77 73 43 42 i) Postage, telegrams, telephones, etc 4333 5156 82 62 128 104 j) Repairs and maintenance 3733 3935 55 46 209 266 k) Insurance 9635 12007 397 469 620 907 l) Other expenditure 35230 42745 1866 2241 1886 2601V. Net Interest Income (I-III) 432911 443313 15843 18402 23352 24508VI. Provisions and Contingencies 198662 169767 6905 9149 9665 9526VII. Operating Profit (I+II-III-IV) 315735 310817 10596 13310 17629 16193VIII. Profit (Loss) during the year 117073 141050 3691 4161 7964 6668
Source : Annual accounts of banks.Source

193
TABLE B2 : EARNINGS AND EXPENSES OF SCHEDULED COMMERCIAL BANKS - 2011-12 AND 2012-13 AS ON MARCH 31OLD PRIVATE SECTOR BANKS
(Amount in ` Million)
(Contd.)
Items
Federal Bank ING Vysya Bank Jammu & KashmirBank
2012 2013 2012 2013 2012 2013
(7) (8) (9) (10) (11) (12)IncomeI. Interest Earned 55584 61676 38568 48616 48356 61368 a) Interest/Discount earned on advances/bills 41898 46357 28678 35498 33937 43176 b) Income on investments 13157 14646 9819 13066 14033 17226 c) Interest on balances with RBI and other inter-bank funds 349 564 6 18 387 966 d) Others 180 109 65 34 - -II. Other Income 5323 6644 6698 7269 3341 4837 a) Commission, exchange and brokerage 2516 3047 4690 4794 1587 1775 b) Net profit (loss) on sale of investments 821 2058 123 308 359 1379 c) Net profit (loss) on revaluation of investments - - - - - 114 d) Net profit (loss) on sale of land and other assets 3 2 8 -1 - - e) Net profit (loss) on exchange transactions 842 794 1471 1680 220 295 f) Miscellaneous income 1142 744 406 488 1175 1275 Total (I+II) 60907 68320 45266 55885 51697 66205
Expenditure & ProvisionsIII. Interest Expended 36050 41929 26485 33230 29972 38208 a) Interest on deposits 33313 38375 21530 25791 29018 37410 b) Interest on RBI/ Inter - bank borrowings 485 779 2467 3927 415 257 c) Others 2252 2774 2487 3512 540 540IV. Operating Expenses 9793 11795 11102 12728 8022 9890 a) Payments to and provisions for employees 5439 6265 6510 7507 5214 6523 b) Rent, taxes and lighting 948 1327 978 1100 412 503 c) Printing and stationery 104 126 130 134 66 86 d) Advertisement and publicity 161 127 44 58 70 103 e) Depreciation on bank's property 567 787 498 510 440 497 f) Directors' fees, allowances and expenses 7 8 5 5 5 7 g) Auditors' fees and expenses 45 53 6 7 85 94 h) Law charges 50 58 31 29 9 20 i) Postage, telegrams, telephones, etc 276 323 214 235 59 67 j) Repairs and maintenance 373 439 313 327 93 117 k) Insurance 435 473 305 317 349 409 l) Other expenditure 1389 1810 2067 2499 1219 1466V. Net Interest Income (I-III) 19534 19747 12084 15386 18384 23160VI. Provisions and Contingencies 7297 6214 3116 3797 5671 7557VII. Operating Profit (I+II-III-IV) 15065 14596 7679 9927 13703 18108VIII. Profit (Loss) during the year 7768 8382 4563 6130 8033 10551
Source : Annual accounts of banks.
TABLE B2 : EARNINGS AND EXPENSES OF SCHEDULED COMMERCIAL BANKS - 2011-12 AND 2012-13 AS ON MARCH 31STATE BANK OF INDIA & ITS ASSOCIATES
(Amount in ` Million)
Items
State Bank of India State Bank ofMysore State Bank of Patiala
2012 2013 2012 2013 2012 2013
(1) (2) (3) (4) (5) (6)IncomeI. Interest Earned 1065215 1196571 50784 59655 81211 95643 a) Interest/Discount earned on advances/bills 810777 905371 40633 47878 64304 76419 b) Income on investments 239491 272006 10002 11576 14934 17358 c) Interest on balances with RBI and other inter-bank funds 3505 5451 146 175 1790 1863 d) Others 11441 13742 3 26 183 2II. Other Income 143514 160348 5164 5956 7510 7588 a) Commission, exchange and brokerage 120909 114837 3996 3914 5854 5783 b) Net profit (loss) on sale of investments -9197 11019 386 665 711 903 c) Net profit (loss) on revaluation of investments - -38 - - - - d) Net profit (loss) on sale of land and other assets -441 -327 - -10 - - e) Net profit (loss) on exchange transactions 14322 16916 326 585 528 591 f) Miscellaneous income 17922 17941 456 802 418 311 Total (I+II) 1208729 1356919 55948 65611 88721 103231
Expenditure & ProvisionsIII. Interest Expended 632304 753258 34941 41253 57859 71134 a) Interest on deposits 556444 674645 32209 37799 52876 63925 b) Interest on RBI/ Inter - bank borrowings 38856 41241 1461 2146 512 1207 c) Others 37004 37371 1271 1308 4471 6002IV. Operating Expenses 260690 292844 10411 11048 13234 15903 a) Payments to and provisions for employees 169740 183809 6206 6402 8347 9595 b) Rent, taxes and lighting 20654 24388 927 982 1186 1433 c) Printing and stationery 2765 2970 132 143 94 108 d) Advertisement and publicity 2066 3844 61 64 121 180 e) Depreciation on bank's property 10072 11396 500 470 482 523 f) Directors' fees, allowances and expenses 5 7 2 2 5 5 g) Auditors' fees and expenses 1285 1246 106 92 113 140 h) Law charges 1173 1339 77 73 43 42 i) Postage, telegrams, telephones, etc 4333 5156 82 62 128 104 j) Repairs and maintenance 3733 3935 55 46 209 266 k) Insurance 9635 12007 397 469 620 907 l) Other expenditure 35230 42745 1866 2241 1886 2601V. Net Interest Income (I-III) 432911 443313 15843 18402 23352 24508VI. Provisions and Contingencies 198662 169767 6905 9149 9665 9526VII. Operating Profit (I+II-III-IV) 315735 310817 10596 13310 17629 16193VIII. Profit (Loss) during the year 117073 141050 3691 4161 7964 6668
Source : Annual accounts of banks.Source

194
TABLE B2 : EARNINGS AND EXPENSES OF SCHEDULED COMMERCIAL BANKS - 2011-12 AND 2012-13 AS ON MARCH 31OLD PRIVATE SECTOR BANKS
(Amount in ` Million)
(Contd.)
Items
Karnataka Bank Karur Vysya Bank Lakshmi Vilas Bank
2012 2013 2012 2013 2012 2013
(13) (14) (15) (16) (17) (18)IncomeI. Interest Earned 31010 37643 32704 42424 15193 17605 a) Interest/Discount earned on advances/bills 23619 28177 25382 32744 11866 13935 b) Income on investments 7363 9384 7162 9504 3242 3408 c) Interest on balances with RBI and other inter-bank funds 10 37 90 162 38 8 d) Others 18 45 69 15 47 255II. Other Income 3463 3976 3501 4526 1579 1971 a) Commission, exchange and brokerage 1741 1872 2274 2785 669 798 b) Net profit (loss) on sale of investments 502 531 262 883 44 252 c) Net profit (loss) on revaluation of investments - - - - - - d) Net profit (loss) on sale of land and other assets 29 -17 3 7 -1 - e) Net profit (loss) on exchange transactions 383 333 368 210 123 107 f) Miscellaneous income 807 1258 595 640 744 815 Total (I+II) 34473 41619 36205 46950 16772 19576
Expenditure & ProvisionsIII. Interest Expended 23689 28606 23532 30840 11480 13685 a) Interest on deposits 22688 27263 22032 28197 10606 12991 b) Interest on RBI/ Inter - bank borrowings 208 526 641 1040 874 694 c) Others 793 817 860 1602 - -IV. Operating Expenses 5682 6660 5416 7622 2937 3379 a) Payments to and provisions for employees 3250 3751 2644 3436 1412 1576 b) Rent, taxes and lighting 530 606 479 733 318 383 c) Printing and stationery 49 51 65 139 29 33 d) Advertisement and publicity 55 55 230 284 56 43 e) Depreciation on bank's property 219 240 385 564 236 254 f) Directors' fees, allowances and expenses 7 7 7 7 6 6 g) Auditors' fees and expenses 16 17 14 12 8 8 h) Law charges 18 17 12 9 14 10 i) Postage, telegrams, telephones, etc 81 94 160 166 58 74 j) Repairs and maintenance 146 164 121 209 18 22 k) Insurance 303 338 253 322 117 148 l) Other expenditure 1009 1320 1046 1741 664 821V. Net Interest Income (I-III) 7321 9037 9171 11585 3712 3920VI. Provisions and Contingencies 2641 2873 2240 2985 1284 1596VII. Operating Profit (I+II-III-IV) 5102 6353 7257 8488 2354 2511VIII. Profit (Loss) during the year 2461 3481 5017 5503 1070 916
Source : Annual accounts of banks.
TABLE B2 : EARNINGS AND EXPENSES OF SCHEDULED COMMERCIAL BANKS - 2011-12 AND 2012-13 AS ON MARCH 31STATE BANK OF INDIA & ITS ASSOCIATES
(Amount in ` Million)
Items
State Bank of India State Bank ofMysore State Bank of Patiala
2012 2013 2012 2013 2012 2013
(1) (2) (3) (4) (5) (6)IncomeI. Interest Earned 1065215 1196571 50784 59655 81211 95643 a) Interest/Discount earned on advances/bills 810777 905371 40633 47878 64304 76419 b) Income on investments 239491 272006 10002 11576 14934 17358 c) Interest on balances with RBI and other inter-bank funds 3505 5451 146 175 1790 1863 d) Others 11441 13742 3 26 183 2II. Other Income 143514 160348 5164 5956 7510 7588 a) Commission, exchange and brokerage 120909 114837 3996 3914 5854 5783 b) Net profit (loss) on sale of investments -9197 11019 386 665 711 903 c) Net profit (loss) on revaluation of investments - -38 - - - - d) Net profit (loss) on sale of land and other assets -441 -327 - -10 - - e) Net profit (loss) on exchange transactions 14322 16916 326 585 528 591 f) Miscellaneous income 17922 17941 456 802 418 311 Total (I+II) 1208729 1356919 55948 65611 88721 103231
Expenditure & ProvisionsIII. Interest Expended 632304 753258 34941 41253 57859 71134 a) Interest on deposits 556444 674645 32209 37799 52876 63925 b) Interest on RBI/ Inter - bank borrowings 38856 41241 1461 2146 512 1207 c) Others 37004 37371 1271 1308 4471 6002IV. Operating Expenses 260690 292844 10411 11048 13234 15903 a) Payments to and provisions for employees 169740 183809 6206 6402 8347 9595 b) Rent, taxes and lighting 20654 24388 927 982 1186 1433 c) Printing and stationery 2765 2970 132 143 94 108 d) Advertisement and publicity 2066 3844 61 64 121 180 e) Depreciation on bank's property 10072 11396 500 470 482 523 f) Directors' fees, allowances and expenses 5 7 2 2 5 5 g) Auditors' fees and expenses 1285 1246 106 92 113 140 h) Law charges 1173 1339 77 73 43 42 i) Postage, telegrams, telephones, etc 4333 5156 82 62 128 104 j) Repairs and maintenance 3733 3935 55 46 209 266 k) Insurance 9635 12007 397 469 620 907 l) Other expenditure 35230 42745 1866 2241 1886 2601V. Net Interest Income (I-III) 432911 443313 15843 18402 23352 24508VI. Provisions and Contingencies 198662 169767 6905 9149 9665 9526VII. Operating Profit (I+II-III-IV) 315735 310817 10596 13310 17629 16193VIII. Profit (Loss) during the year 117073 141050 3691 4161 7964 6668
Source : Annual accounts of banks.Source
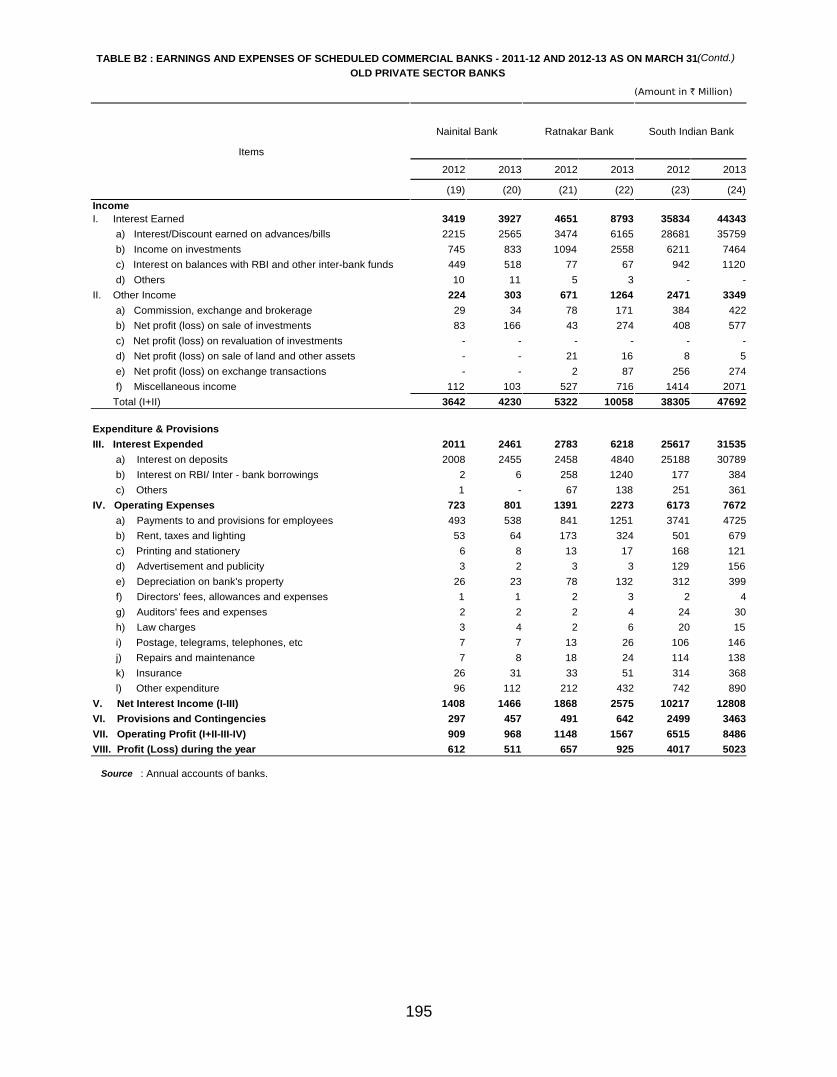
195
TABLE B2 : EARNINGS AND EXPENSES OF SCHEDULED COMMERCIAL BANKS - 2011-12 AND 2012-13 AS ON MARCH 31OLD PRIVATE SECTOR BANKS
(Amount in ` Million)
(Contd.)
Items
Nainital Bank Ratnakar Bank South Indian Bank
2012 2013 2012 2013 2012 2013
(19) (20) (21) (22) (23) (24)IncomeI. Interest Earned 3419 3927 4651 8793 35834 44343 a) Interest/Discount earned on advances/bills 2215 2565 3474 6165 28681 35759 b) Income on investments 745 833 1094 2558 6211 7464 c) Interest on balances with RBI and other inter-bank funds 449 518 77 67 942 1120 d) Others 10 11 5 3 - -II. Other Income 224 303 671 1264 2471 3349 a) Commission, exchange and brokerage 29 34 78 171 384 422 b) Net profit (loss) on sale of investments 83 166 43 274 408 577 c) Net profit (loss) on revaluation of investments - - - - - - d) Net profit (loss) on sale of land and other assets - - 21 16 8 5 e) Net profit (loss) on exchange transactions - - 2 87 256 274 f) Miscellaneous income 112 103 527 716 1414 2071 Total (I+II) 3642 4230 5322 10058 38305 47692
Expenditure & ProvisionsIII. Interest Expended 2011 2461 2783 6218 25617 31535 a) Interest on deposits 2008 2455 2458 4840 25188 30789 b) Interest on RBI/ Inter - bank borrowings 2 6 258 1240 177 384 c) Others 1 - 67 138 251 361IV. Operating Expenses 723 801 1391 2273 6173 7672 a) Payments to and provisions for employees 493 538 841 1251 3741 4725 b) Rent, taxes and lighting 53 64 173 324 501 679 c) Printing and stationery 6 8 13 17 168 121 d) Advertisement and publicity 3 2 3 3 129 156 e) Depreciation on bank's property 26 23 78 132 312 399 f) Directors' fees, allowances and expenses 1 1 2 3 2 4 g) Auditors' fees and expenses 2 2 2 4 24 30 h) Law charges 3 4 2 6 20 15 i) Postage, telegrams, telephones, etc 7 7 13 26 106 146 j) Repairs and maintenance 7 8 18 24 114 138 k) Insurance 26 31 33 51 314 368 l) Other expenditure 96 112 212 432 742 890V. Net Interest Income (I-III) 1408 1466 1868 2575 10217 12808VI. Provisions and Contingencies 297 457 491 642 2499 3463VII. Operating Profit (I+II-III-IV) 909 968 1148 1567 6515 8486VIII. Profit (Loss) during the year 612 511 657 925 4017 5023
Source : Annual accounts of banks.
TABLE B2 : EARNINGS AND EXPENSES OF SCHEDULED COMMERCIAL BANKS - 2011-12 AND 2012-13 AS ON MARCH 31STATE BANK OF INDIA & ITS ASSOCIATES
(Amount in ` Million)
Items
State Bank of India State Bank ofMysore State Bank of Patiala
2012 2013 2012 2013 2012 2013
(1) (2) (3) (4) (5) (6)IncomeI. Interest Earned 1065215 1196571 50784 59655 81211 95643 a) Interest/Discount earned on advances/bills 810777 905371 40633 47878 64304 76419 b) Income on investments 239491 272006 10002 11576 14934 17358 c) Interest on balances with RBI and other inter-bank funds 3505 5451 146 175 1790 1863 d) Others 11441 13742 3 26 183 2II. Other Income 143514 160348 5164 5956 7510 7588 a) Commission, exchange and brokerage 120909 114837 3996 3914 5854 5783 b) Net profit (loss) on sale of investments -9197 11019 386 665 711 903 c) Net profit (loss) on revaluation of investments - -38 - - - - d) Net profit (loss) on sale of land and other assets -441 -327 - -10 - - e) Net profit (loss) on exchange transactions 14322 16916 326 585 528 591 f) Miscellaneous income 17922 17941 456 802 418 311 Total (I+II) 1208729 1356919 55948 65611 88721 103231
Expenditure & ProvisionsIII. Interest Expended 632304 753258 34941 41253 57859 71134 a) Interest on deposits 556444 674645 32209 37799 52876 63925 b) Interest on RBI/ Inter - bank borrowings 38856 41241 1461 2146 512 1207 c) Others 37004 37371 1271 1308 4471 6002IV. Operating Expenses 260690 292844 10411 11048 13234 15903 a) Payments to and provisions for employees 169740 183809 6206 6402 8347 9595 b) Rent, taxes and lighting 20654 24388 927 982 1186 1433 c) Printing and stationery 2765 2970 132 143 94 108 d) Advertisement and publicity 2066 3844 61 64 121 180 e) Depreciation on bank's property 10072 11396 500 470 482 523 f) Directors' fees, allowances and expenses 5 7 2 2 5 5 g) Auditors' fees and expenses 1285 1246 106 92 113 140 h) Law charges 1173 1339 77 73 43 42 i) Postage, telegrams, telephones, etc 4333 5156 82 62 128 104 j) Repairs and maintenance 3733 3935 55 46 209 266 k) Insurance 9635 12007 397 469 620 907 l) Other expenditure 35230 42745 1866 2241 1886 2601V. Net Interest Income (I-III) 432911 443313 15843 18402 23352 24508VI. Provisions and Contingencies 198662 169767 6905 9149 9665 9526VII. Operating Profit (I+II-III-IV) 315735 310817 10596 13310 17629 16193VIII. Profit (Loss) during the year 117073 141050 3691 4161 7964 6668
Source : Annual accounts of banks.Source
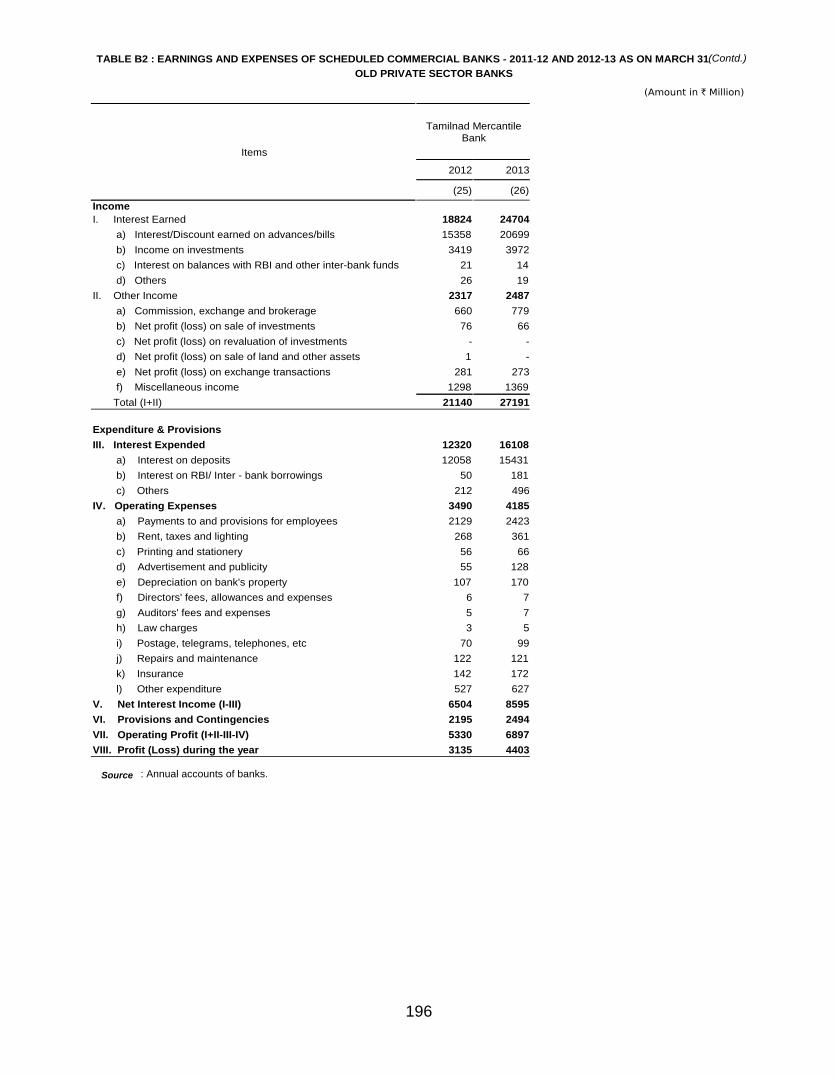
196
TABLE B2 : EARNINGS AND EXPENSES OF SCHEDULED COMMERCIAL BANKS - 2011-12 AND 2012-13 AS ON MARCH 31OLD PRIVATE SECTOR BANKS
(Amount in ` Million)
(Contd.)
Items
Tamilnad MercantileBank
2012 2013
(25) (26)IncomeI. Interest Earned 18824 24704 a) Interest/Discount earned on advances/bills 15358 20699 b) Income on investments 3419 3972 c) Interest on balances with RBI and other inter-bank funds 21 14 d) Others 26 19II. Other Income 2317 2487 a) Commission, exchange and brokerage 660 779 b) Net profit (loss) on sale of investments 76 66 c) Net profit (loss) on revaluation of investments - - d) Net profit (loss) on sale of land and other assets 1 - e) Net profit (loss) on exchange transactions 281 273 f) Miscellaneous income 1298 1369 Total (I+II) 21140 27191
Expenditure & ProvisionsIII. Interest Expended 12320 16108 a) Interest on deposits 12058 15431 b) Interest on RBI/ Inter - bank borrowings 50 181 c) Others 212 496IV. Operating Expenses 3490 4185 a) Payments to and provisions for employees 2129 2423 b) Rent, taxes and lighting 268 361 c) Printing and stationery 56 66 d) Advertisement and publicity 55 128 e) Depreciation on bank's property 107 170 f) Directors' fees, allowances and expenses 6 7 g) Auditors' fees and expenses 5 7 h) Law charges 3 5 i) Postage, telegrams, telephones, etc 70 99 j) Repairs and maintenance 122 121 k) Insurance 142 172 l) Other expenditure 527 627V. Net Interest Income (I-III) 6504 8595VI. Provisions and Contingencies 2195 2494VII. Operating Profit (I+II-III-IV) 5330 6897VIII. Profit (Loss) during the year 3135 4403
Source : Annual accounts of banks.
TABLE B2 : EARNINGS AND EXPENSES OF SCHEDULED COMMERCIAL BANKS - 2011-12 AND 2012-13 AS ON MARCH 31STATE BANK OF INDIA & ITS ASSOCIATES
(Amount in ` Million)
Items
State Bank of India State Bank ofMysore State Bank of Patiala
2012 2013 2012 2013 2012 2013
(1) (2) (3) (4) (5) (6)IncomeI. Interest Earned 1065215 1196571 50784 59655 81211 95643 a) Interest/Discount earned on advances/bills 810777 905371 40633 47878 64304 76419 b) Income on investments 239491 272006 10002 11576 14934 17358 c) Interest on balances with RBI and other inter-bank funds 3505 5451 146 175 1790 1863 d) Others 11441 13742 3 26 183 2II. Other Income 143514 160348 5164 5956 7510 7588 a) Commission, exchange and brokerage 120909 114837 3996 3914 5854 5783 b) Net profit (loss) on sale of investments -9197 11019 386 665 711 903 c) Net profit (loss) on revaluation of investments - -38 - - - - d) Net profit (loss) on sale of land and other assets -441 -327 - -10 - - e) Net profit (loss) on exchange transactions 14322 16916 326 585 528 591 f) Miscellaneous income 17922 17941 456 802 418 311 Total (I+II) 1208729 1356919 55948 65611 88721 103231
Expenditure & ProvisionsIII. Interest Expended 632304 753258 34941 41253 57859 71134 a) Interest on deposits 556444 674645 32209 37799 52876 63925 b) Interest on RBI/ Inter - bank borrowings 38856 41241 1461 2146 512 1207 c) Others 37004 37371 1271 1308 4471 6002IV. Operating Expenses 260690 292844 10411 11048 13234 15903 a) Payments to and provisions for employees 169740 183809 6206 6402 8347 9595 b) Rent, taxes and lighting 20654 24388 927 982 1186 1433 c) Printing and stationery 2765 2970 132 143 94 108 d) Advertisement and publicity 2066 3844 61 64 121 180 e) Depreciation on bank's property 10072 11396 500 470 482 523 f) Directors' fees, allowances and expenses 5 7 2 2 5 5 g) Auditors' fees and expenses 1285 1246 106 92 113 140 h) Law charges 1173 1339 77 73 43 42 i) Postage, telegrams, telephones, etc 4333 5156 82 62 128 104 j) Repairs and maintenance 3733 3935 55 46 209 266 k) Insurance 9635 12007 397 469 620 907 l) Other expenditure 35230 42745 1866 2241 1886 2601V. Net Interest Income (I-III) 432911 443313 15843 18402 23352 24508VI. Provisions and Contingencies 198662 169767 6905 9149 9665 9526VII. Operating Profit (I+II-III-IV) 315735 310817 10596 13310 17629 16193VIII. Profit (Loss) during the year 117073 141050 3691 4161 7964 6668
Source : Annual accounts of banks.Source

197
TABLE B2 : EARNINGS AND EXPENSES OF SCHEDULED COMMERCIAL BANKS - 2011-12 AND 2012-13 AS ON MARCH 31NEW PRIVATE SECTOR BANKS
(Amount in ` Million)
(Contd.)
Items
Axis Bank Development CreditBank HDFC Bank
2012 2013 2012 2013 2012 2013
(1) (2) (3) (4) (5) (6)IncomeI. Interest Earned 219946 271826 7170 9161 278742 350649 a) Interest/Discount earned on advances/bills 153794 191662 5362 7118 211244 268224 b) Income on investments 63943 77470 1725 1963 65046 78203 c) Interest on balances with RBI and other inter-bank funds 984 1113 72 68 1371 2816 d) Others 1226 1581 10 12 1080 1406II. Other Income 54202 65511 1004 1170 57836 68526 a) Commission, exchange and brokerage 43417 50251 787 893 43121 51669 b) Net profit (loss) on sale of investments 728 5863 118 139 -1062 1264 c) Net profit (loss) on revaluation of investments - - - - -897 349 d) Net profit (loss) on sale of land and other assets 203 -45 -28 -17 15 -11 e) Net profit (loss) on exchange transactions 6740 6641 69 72 12654 12318 f) Miscellaneous income 3114 2800 59 83 4005 2937 Total (I+II) 274149 337337 8173 10331 336578 419175
Expenditure & ProvisionsIII. Interest Expended 139769 175163 4893 6317 149896 192538 a) Interest on deposits 121836 150155 4081 5346 126897 163206 b) Interest on RBI/ Inter - bank borrowings 2320 4596 712 798 22529 28890 c) Others 15613 20411 100 172 470 442IV. Operating Expenses 60071 69142 2443 2753 92776 112361 a) Payments to and provisions for employees 20802 23770 1246 1379 33999 39654 b) Rent, taxes and lighting 6564 7506 327 363 7161 8407 c) Printing and stationery 935 1004 28 29 2339 3108 d) Advertisement and publicity 881 1196 13 10 1525 1841 e) Depreciation on bank's property 3422 3517 120 136 5425 6517 f) Directors' fees, allowances and expenses 8 15 6 5 4 7 g) Auditors' fees and expenses 9 11 6 6 12 15 h) Law charges 183 179 11 7 317 510 i) Postage, telegrams, telephones, etc 2587 2791 64 63 3530 4024 j) Repairs and maintenance 5295 5859 67 68 6184 7665 k) Insurance 2313 2622 60 63 2418 2878 l) Other expenditure 17071 20671 495 624 29861 37737V. Net Interest Income (I-III) 80177 96663 2277 2844 128846 158111VI. Provisions and Contingencies 31887 41237 287 241 42235 47013VII. Operating Profit (I+II-III-IV) 74309 93031 838 1261 93906 114276VIII. Profit (Loss) during the year 42422 51794 551 1021 51671 67263
Source : Annual accounts of banks.
TABLE B2 : EARNINGS AND EXPENSES OF SCHEDULED COMMERCIAL BANKS - 2011-12 AND 2012-13 AS ON MARCH 31STATE BANK OF INDIA & ITS ASSOCIATES
(Amount in ` Million)
Items
State Bank of India State Bank ofMysore State Bank of Patiala
2012 2013 2012 2013 2012 2013
(1) (2) (3) (4) (5) (6)IncomeI. Interest Earned 1065215 1196571 50784 59655 81211 95643 a) Interest/Discount earned on advances/bills 810777 905371 40633 47878 64304 76419 b) Income on investments 239491 272006 10002 11576 14934 17358 c) Interest on balances with RBI and other inter-bank funds 3505 5451 146 175 1790 1863 d) Others 11441 13742 3 26 183 2II. Other Income 143514 160348 5164 5956 7510 7588 a) Commission, exchange and brokerage 120909 114837 3996 3914 5854 5783 b) Net profit (loss) on sale of investments -9197 11019 386 665 711 903 c) Net profit (loss) on revaluation of investments - -38 - - - - d) Net profit (loss) on sale of land and other assets -441 -327 - -10 - - e) Net profit (loss) on exchange transactions 14322 16916 326 585 528 591 f) Miscellaneous income 17922 17941 456 802 418 311 Total (I+II) 1208729 1356919 55948 65611 88721 103231
Expenditure & ProvisionsIII. Interest Expended 632304 753258 34941 41253 57859 71134 a) Interest on deposits 556444 674645 32209 37799 52876 63925 b) Interest on RBI/ Inter - bank borrowings 38856 41241 1461 2146 512 1207 c) Others 37004 37371 1271 1308 4471 6002IV. Operating Expenses 260690 292844 10411 11048 13234 15903 a) Payments to and provisions for employees 169740 183809 6206 6402 8347 9595 b) Rent, taxes and lighting 20654 24388 927 982 1186 1433 c) Printing and stationery 2765 2970 132 143 94 108 d) Advertisement and publicity 2066 3844 61 64 121 180 e) Depreciation on bank's property 10072 11396 500 470 482 523 f) Directors' fees, allowances and expenses 5 7 2 2 5 5 g) Auditors' fees and expenses 1285 1246 106 92 113 140 h) Law charges 1173 1339 77 73 43 42 i) Postage, telegrams, telephones, etc 4333 5156 82 62 128 104 j) Repairs and maintenance 3733 3935 55 46 209 266 k) Insurance 9635 12007 397 469 620 907 l) Other expenditure 35230 42745 1866 2241 1886 2601V. Net Interest Income (I-III) 432911 443313 15843 18402 23352 24508VI. Provisions and Contingencies 198662 169767 6905 9149 9665 9526VII. Operating Profit (I+II-III-IV) 315735 310817 10596 13310 17629 16193VIII. Profit (Loss) during the year 117073 141050 3691 4161 7964 6668
Source : Annual accounts of banks.Source

198
TABLE B2 : EARNINGS AND EXPENSES OF SCHEDULED COMMERCIAL BANKS - 2011-12 AND 2012-13 AS ON MARCH 31NEW PRIVATE SECTOR BANKS
(Amount in ` Million)
(Contd.)
Items
ICICI Bank IndusInd Bank Kotak MahindraBank
2012 2013 2012 2013 2012 2013
(7) (8) (9) (10) (11) (12)IncomeI. Interest Earned 335427 400756 53592 69832 61802 80425 a) Interest/Discount earned on advances/bills 221299 273411 42166 56103 48674 61461 b) Income on investments 96840 110093 10782 12825 13064 18698 c) Interest on balances with RBI and other inter-bank funds 4911 5430 239 855 41 243 d) Others 12376 11822 405 49 24 22II. Other Income 75028 83457 10118 13630 9773 11607 a) Commission, exchange and brokerage 54351 54617 7029 9470 5781 7372 b) Net profit (loss) on sale of investments 3314 5651 577 644 816 1546 c) Net profit (loss) on revaluation of investments -4053 -1287 - - - - d) Net profit (loss) on sale of land and other assets -17 353 6 54 6 11 e) Net profit (loss) on exchange transactions 12590 13331 2378 3280 1194 963 f) Miscellaneous income 8843 10793 128 180 1977 1715 Total (I+II) 410454 484213 63710 83462 71576 92032
Expenditure & ProvisionsIII. Interest Expended 228085 262092 36549 47504 36677 48368 a) Interest on deposits 143041 168889 30763 40268 25041 33461 b) Interest on RBI/ Inter - bank borrowings 14692 20866 1949 2574 7749 10553 c) Others 70352 72337 3838 4662 3888 4354IV. Operating Expenses 78504 90129 13430 17564 18348 22097 a) Payments to and provisions for employees 35153 38933 4855 6615 9024 10751 b) Rent, taxes and lighting 6756 7368 1096 1664 1740 2215 c) Printing and stationery 1001 1175 245 258 273 332 d) Advertisement and publicity 1325 1892 162 133 564 708 e) Depreciation on bank's property 5245 4902 750 734 1168 1325 f) Directors' fees, allowances and expenses 4 4 7 7 2 3 g) Auditors' fees and expenses 25 29 9 12 14 15 h) Law charges 375 406 271 276 116 116 i) Postage, telegrams, telephones, etc 1903 2189 457 692 427 515 j) Repairs and maintenance 5630 6662 748 965 958 1217 k) Insurance 2235 2244 390 575 286 371 l) Other expenditure 18853 24327 4441 5633 3777 4529V. Net Interest Income (I-III) 107342 138664 17042 22329 25125 32057VI. Provisions and Contingencies 39212 48738 5704 7783 5700 7959VII. Operating Profit (I+II-III-IV) 103865 131992 13730 18395 16550 21566VIII. Profit (Loss) during the year 64653 83255 8026 10612 10851 13607
Source : Annual accounts of banks.
TABLE B2 : EARNINGS AND EXPENSES OF SCHEDULED COMMERCIAL BANKS - 2011-12 AND 2012-13 AS ON MARCH 31STATE BANK OF INDIA & ITS ASSOCIATES
(Amount in ` Million)
Items
State Bank of India State Bank ofMysore State Bank of Patiala
2012 2013 2012 2013 2012 2013
(1) (2) (3) (4) (5) (6)IncomeI. Interest Earned 1065215 1196571 50784 59655 81211 95643 a) Interest/Discount earned on advances/bills 810777 905371 40633 47878 64304 76419 b) Income on investments 239491 272006 10002 11576 14934 17358 c) Interest on balances with RBI and other inter-bank funds 3505 5451 146 175 1790 1863 d) Others 11441 13742 3 26 183 2II. Other Income 143514 160348 5164 5956 7510 7588 a) Commission, exchange and brokerage 120909 114837 3996 3914 5854 5783 b) Net profit (loss) on sale of investments -9197 11019 386 665 711 903 c) Net profit (loss) on revaluation of investments - -38 - - - - d) Net profit (loss) on sale of land and other assets -441 -327 - -10 - - e) Net profit (loss) on exchange transactions 14322 16916 326 585 528 591 f) Miscellaneous income 17922 17941 456 802 418 311 Total (I+II) 1208729 1356919 55948 65611 88721 103231
Expenditure & ProvisionsIII. Interest Expended 632304 753258 34941 41253 57859 71134 a) Interest on deposits 556444 674645 32209 37799 52876 63925 b) Interest on RBI/ Inter - bank borrowings 38856 41241 1461 2146 512 1207 c) Others 37004 37371 1271 1308 4471 6002IV. Operating Expenses 260690 292844 10411 11048 13234 15903 a) Payments to and provisions for employees 169740 183809 6206 6402 8347 9595 b) Rent, taxes and lighting 20654 24388 927 982 1186 1433 c) Printing and stationery 2765 2970 132 143 94 108 d) Advertisement and publicity 2066 3844 61 64 121 180 e) Depreciation on bank's property 10072 11396 500 470 482 523 f) Directors' fees, allowances and expenses 5 7 2 2 5 5 g) Auditors' fees and expenses 1285 1246 106 92 113 140 h) Law charges 1173 1339 77 73 43 42 i) Postage, telegrams, telephones, etc 4333 5156 82 62 128 104 j) Repairs and maintenance 3733 3935 55 46 209 266 k) Insurance 9635 12007 397 469 620 907 l) Other expenditure 35230 42745 1866 2241 1886 2601V. Net Interest Income (I-III) 432911 443313 15843 18402 23352 24508VI. Provisions and Contingencies 198662 169767 6905 9149 9665 9526VII. Operating Profit (I+II-III-IV) 315735 310817 10596 13310 17629 16193VIII. Profit (Loss) during the year 117073 141050 3691 4161 7964 6668
Source : Annual accounts of banks.Source

199
TABLE B2 : EARNINGS AND EXPENSES OF SCHEDULED COMMERCIAL BANKS - 2011-12 AND 2012-13 AS ON MARCH 31NEW PRIVATE SECTOR BANKS
(Amount in ` Million)
(Contd.)
Items
Yes Bank
2012 2013
(13) (14)IncomeI. Interest Earned 63074 82940 a) Interest/Discount earned on advances/bills 44268 53971 b) Income on investments 18470 28595 c) Interest on balances with RBI and other inter-bank funds 233 165 d) Others 103 210II. Other Income 8571 12574 a) Commission, exchange and brokerage 7677 10762 b) Net profit (loss) on sale of investments 379 1557 c) Net profit (loss) on revaluation of investments - - d) Net profit (loss) on sale of land and other assets -14 -5 e) Net profit (loss) on exchange transactions 268 667 f) Miscellaneous income 262 -406 Total (I+II) 71645 95514
Expenditure & ProvisionsIII. Interest Expended 46917 60752 a) Interest on deposits 38434 45636 b) Interest on RBI/ Inter - bank borrowings 8224 14935 c) Others 259 180IV. Operating Expenses 9325 13345 a) Payments to and provisions for employees 4751 6555 b) Rent, taxes and lighting 1255 1812 c) Printing and stationery 81 113 d) Advertisement and publicity 103 322 e) Depreciation on bank's property 408 517 f) Directors' fees, allowances and expenses 5 6 g) Auditors' fees and expenses 6 7 h) Law charges 11 19 i) Postage, telegrams, telephones, etc 124 159 j) Repairs and maintenance 76 91 k) Insurance 382 449 l) Other expenditure 2123 3295V. Net Interest Income (I-III) 16156 22188VI. Provisions and Contingencies 5632 8410VII. Operating Profit (I+II-III-IV) 15402 21417VIII. Profit (Loss) during the year 9770 13007
Source : Annual accounts of banks.
TABLE B2 : EARNINGS AND EXPENSES OF SCHEDULED COMMERCIAL BANKS - 2011-12 AND 2012-13 AS ON MARCH 31STATE BANK OF INDIA & ITS ASSOCIATES
(Amount in ` Million)
Items
State Bank of India State Bank ofMysore State Bank of Patiala
2012 2013 2012 2013 2012 2013
(1) (2) (3) (4) (5) (6)IncomeI. Interest Earned 1065215 1196571 50784 59655 81211 95643 a) Interest/Discount earned on advances/bills 810777 905371 40633 47878 64304 76419 b) Income on investments 239491 272006 10002 11576 14934 17358 c) Interest on balances with RBI and other inter-bank funds 3505 5451 146 175 1790 1863 d) Others 11441 13742 3 26 183 2II. Other Income 143514 160348 5164 5956 7510 7588 a) Commission, exchange and brokerage 120909 114837 3996 3914 5854 5783 b) Net profit (loss) on sale of investments -9197 11019 386 665 711 903 c) Net profit (loss) on revaluation of investments - -38 - - - - d) Net profit (loss) on sale of land and other assets -441 -327 - -10 - - e) Net profit (loss) on exchange transactions 14322 16916 326 585 528 591 f) Miscellaneous income 17922 17941 456 802 418 311 Total (I+II) 1208729 1356919 55948 65611 88721 103231
Expenditure & ProvisionsIII. Interest Expended 632304 753258 34941 41253 57859 71134 a) Interest on deposits 556444 674645 32209 37799 52876 63925 b) Interest on RBI/ Inter - bank borrowings 38856 41241 1461 2146 512 1207 c) Others 37004 37371 1271 1308 4471 6002IV. Operating Expenses 260690 292844 10411 11048 13234 15903 a) Payments to and provisions for employees 169740 183809 6206 6402 8347 9595 b) Rent, taxes and lighting 20654 24388 927 982 1186 1433 c) Printing and stationery 2765 2970 132 143 94 108 d) Advertisement and publicity 2066 3844 61 64 121 180 e) Depreciation on bank's property 10072 11396 500 470 482 523 f) Directors' fees, allowances and expenses 5 7 2 2 5 5 g) Auditors' fees and expenses 1285 1246 106 92 113 140 h) Law charges 1173 1339 77 73 43 42 i) Postage, telegrams, telephones, etc 4333 5156 82 62 128 104 j) Repairs and maintenance 3733 3935 55 46 209 266 k) Insurance 9635 12007 397 469 620 907 l) Other expenditure 35230 42745 1866 2241 1886 2601V. Net Interest Income (I-III) 432911 443313 15843 18402 23352 24508VI. Provisions and Contingencies 198662 169767 6905 9149 9665 9526VII. Operating Profit (I+II-III-IV) 315735 310817 10596 13310 17629 16193VIII. Profit (Loss) during the year 117073 141050 3691 4161 7964 6668
Source : Annual accounts of banks.Source

200
TABLE B2 : EARNINGS AND EXPENSES OF SCHEDULED COMMERCIAL BANKS - 2011-12 AND 2012-13 AS ON MARCH 31FOREIGN BANKS
(Amount in ` Million)
(Contd.)
Items
AB Bank Abu Dhabi CommercialBank
American ExpressBanking Corp.
2012 2013 2012 2013 2012 2013
(1) (2) (3) (4) (5) (6)IncomeI. Interest Earned 51 69 760 1176 783 886 a) Interest/Discount earned on advances/bills 31 38 234 365 565 599 b) Income on investments 10 17 166 192 218 287 c) Interest on balances with RBI and other inte 9 14 355 618 1 - d) Others - - 5 - - -II. Other Income 187 183 47 67 5046 5576 a) Commission, exchange and brokerage 177 175 21 25 4528 5122 b) Net profit (loss) on sale of investments - - - - - - c) Net profit (loss) on revaluation of investment - - - - - - d) Net profit (loss) on sale of land and other as - - - - 4 4 e) Net profit (loss) on exchange transactions 4 3 26 38 - - f) Miscellaneous income 6 5 - 3 515 449 Total (I+II) 238 252 807 1242 5829 6462
Expenditure & ProvisionsIII. Interest Expended 6 13 403 694 807 1173 a) Interest on deposits 4 12 310 505 462 519 b) Interest on RBI/ Inter - bank borrowings 1 1 93 189 345 654 c) Others - - - - - -IV. Operating Expenses 94 101 176 245 4825 5602 a) Payments to and provisions for employees 12 13 96 139 1075 1081 b) Rent, taxes and lighting 10 11 23 18 170 159 c) Printing and stationery 1 1 1 1 41 44 d) Advertisement and publicity 2 1 - 1 1151 1405 e) Depreciation on bank's property 9 7 8 22 168 161 f) Directors' fees, allowances and expenses - - - - - - g) Auditors' fees and expenses 1 1 - - 3 3 h) Law charges - - 1 4 1 7 i) Postage, telegrams, telephones, etc 5 5 4 5 137 132 j) Repairs and maintenance 1 1 12 17 94 112 k) Insurance - - 5 6 8 8 l) Other expenditure 53 62 25 31 1976 2490V. Net Interest Income (I-III) 45 56 358 482 -24 -287VI. Provisions and Contingencies 56 58 65 121 158 414VII. Operating Profit (I+II-III-IV) 138 137 228 303 198 -314VIII. Profit (Loss) during the year 82 80 163 182 40 -727
Source : Annual accounts of banks.
TABLE B2 : EARNINGS AND EXPENSES OF SCHEDULED COMMERCIAL BANKS - 2011-12 AND 2012-13 AS ON MARCH 31STATE BANK OF INDIA & ITS ASSOCIATES
(Amount in ` Million)
Items
State Bank of India State Bank ofMysore State Bank of Patiala
2012 2013 2012 2013 2012 2013
(1) (2) (3) (4) (5) (6)IncomeI. Interest Earned 1065215 1196571 50784 59655 81211 95643 a) Interest/Discount earned on advances/bills 810777 905371 40633 47878 64304 76419 b) Income on investments 239491 272006 10002 11576 14934 17358 c) Interest on balances with RBI and other inter-bank funds 3505 5451 146 175 1790 1863 d) Others 11441 13742 3 26 183 2II. Other Income 143514 160348 5164 5956 7510 7588 a) Commission, exchange and brokerage 120909 114837 3996 3914 5854 5783 b) Net profit (loss) on sale of investments -9197 11019 386 665 711 903 c) Net profit (loss) on revaluation of investments - -38 - - - - d) Net profit (loss) on sale of land and other assets -441 -327 - -10 - - e) Net profit (loss) on exchange transactions 14322 16916 326 585 528 591 f) Miscellaneous income 17922 17941 456 802 418 311 Total (I+II) 1208729 1356919 55948 65611 88721 103231
Expenditure & ProvisionsIII. Interest Expended 632304 753258 34941 41253 57859 71134 a) Interest on deposits 556444 674645 32209 37799 52876 63925 b) Interest on RBI/ Inter - bank borrowings 38856 41241 1461 2146 512 1207 c) Others 37004 37371 1271 1308 4471 6002IV. Operating Expenses 260690 292844 10411 11048 13234 15903 a) Payments to and provisions for employees 169740 183809 6206 6402 8347 9595 b) Rent, taxes and lighting 20654 24388 927 982 1186 1433 c) Printing and stationery 2765 2970 132 143 94 108 d) Advertisement and publicity 2066 3844 61 64 121 180 e) Depreciation on bank's property 10072 11396 500 470 482 523 f) Directors' fees, allowances and expenses 5 7 2 2 5 5 g) Auditors' fees and expenses 1285 1246 106 92 113 140 h) Law charges 1173 1339 77 73 43 42 i) Postage, telegrams, telephones, etc 4333 5156 82 62 128 104 j) Repairs and maintenance 3733 3935 55 46 209 266 k) Insurance 9635 12007 397 469 620 907 l) Other expenditure 35230 42745 1866 2241 1886 2601V. Net Interest Income (I-III) 432911 443313 15843 18402 23352 24508VI. Provisions and Contingencies 198662 169767 6905 9149 9665 9526VII. Operating Profit (I+II-III-IV) 315735 310817 10596 13310 17629 16193VIII. Profit (Loss) during the year 117073 141050 3691 4161 7964 6668
Source : Annual accounts of banks.Source

201
TABLE B2 : EARNINGS AND EXPENSES OF SCHEDULED COMMERCIAL BANKS - 2011-12 AND 2012-13 AS ON MARCH 31FOREIGN BANKS
(Amount in ` Million)
(Contd.)
Items
Antwerp Diamond Bank Australia and NewZealand Banking Group
Bank InternasionalIndonesia
2012 2013 2012 2013 2012 2013
(7) (8) (9) (10) (11) (12)IncomeI. Interest Earned 437 572 944 2813 27 33 a) Interest/Discount earned on advances/bills 255 445 231 1192 - - b) Income on investments 176 117 254 811 - - c) Interest on balances with RBI and other inte 1 - 459 808 27 33 d) Others 4 10 - 2 - -II. Other Income 179 241 705 496 - 1 a) Commission, exchange and brokerage 139 189 279 209 - - b) Net profit (loss) on sale of investments - - -27 8 - - c) Net profit (loss) on revaluation of investment - - - - - - d) Net profit (loss) on sale of land and other as - - - -3 - - e) Net profit (loss) on exchange transactions 21 32 130 -263 - - f) Miscellaneous income 18 20 322 545 - 1 Total (I+II) 615 814 1649 3309 27 33
Expenditure & ProvisionsIII. Interest Expended 198 214 405 1627 - - a) Interest on deposits 9 18 369 1485 - - b) Interest on RBI/ Inter - bank borrowings 76 68 36 63 - - c) Others 113 128 1 79 - -IV. Operating Expenses 141 175 1106 1235 22 54 a) Payments to and provisions for employees 79 87 506 637 - 23 b) Rent, taxes and lighting 8 13 238 257 16 18 c) Printing and stationery 1 1 5 3 - - d) Advertisement and publicity 1 1 29 5 - - e) Depreciation on bank's property 3 2 84 84 - 4 f) Directors' fees, allowances and expenses - - - - - - g) Auditors' fees and expenses 1 1 1 1 - 1 h) Law charges 13 18 46 52 - - i) Postage, telegrams, telephones, etc 5 6 6 7 - - j) Repairs and maintenance 3 4 2 3 - - k) Insurance - 1 6 22 - - l) Other expenditure 28 42 183 162 6 8V. Net Interest Income (I-III) 239 358 539 1186 27 33VI. Provisions and Contingencies 139 281 128 404 1 -1VII. Operating Profit (I+II-III-IV) 277 424 137 447 5 -21VIII. Profit (Loss) during the year 137 143 9 43 4 -20
Source : Annual accounts of banks.
TABLE B2 : EARNINGS AND EXPENSES OF SCHEDULED COMMERCIAL BANKS - 2011-12 AND 2012-13 AS ON MARCH 31STATE BANK OF INDIA & ITS ASSOCIATES
(Amount in ` Million)
Items
State Bank of India State Bank ofMysore State Bank of Patiala
2012 2013 2012 2013 2012 2013
(1) (2) (3) (4) (5) (6)IncomeI. Interest Earned 1065215 1196571 50784 59655 81211 95643 a) Interest/Discount earned on advances/bills 810777 905371 40633 47878 64304 76419 b) Income on investments 239491 272006 10002 11576 14934 17358 c) Interest on balances with RBI and other inter-bank funds 3505 5451 146 175 1790 1863 d) Others 11441 13742 3 26 183 2II. Other Income 143514 160348 5164 5956 7510 7588 a) Commission, exchange and brokerage 120909 114837 3996 3914 5854 5783 b) Net profit (loss) on sale of investments -9197 11019 386 665 711 903 c) Net profit (loss) on revaluation of investments - -38 - - - - d) Net profit (loss) on sale of land and other assets -441 -327 - -10 - - e) Net profit (loss) on exchange transactions 14322 16916 326 585 528 591 f) Miscellaneous income 17922 17941 456 802 418 311 Total (I+II) 1208729 1356919 55948 65611 88721 103231
Expenditure & ProvisionsIII. Interest Expended 632304 753258 34941 41253 57859 71134 a) Interest on deposits 556444 674645 32209 37799 52876 63925 b) Interest on RBI/ Inter - bank borrowings 38856 41241 1461 2146 512 1207 c) Others 37004 37371 1271 1308 4471 6002IV. Operating Expenses 260690 292844 10411 11048 13234 15903 a) Payments to and provisions for employees 169740 183809 6206 6402 8347 9595 b) Rent, taxes and lighting 20654 24388 927 982 1186 1433 c) Printing and stationery 2765 2970 132 143 94 108 d) Advertisement and publicity 2066 3844 61 64 121 180 e) Depreciation on bank's property 10072 11396 500 470 482 523 f) Directors' fees, allowances and expenses 5 7 2 2 5 5 g) Auditors' fees and expenses 1285 1246 106 92 113 140 h) Law charges 1173 1339 77 73 43 42 i) Postage, telegrams, telephones, etc 4333 5156 82 62 128 104 j) Repairs and maintenance 3733 3935 55 46 209 266 k) Insurance 9635 12007 397 469 620 907 l) Other expenditure 35230 42745 1866 2241 1886 2601V. Net Interest Income (I-III) 432911 443313 15843 18402 23352 24508VI. Provisions and Contingencies 198662 169767 6905 9149 9665 9526VII. Operating Profit (I+II-III-IV) 315735 310817 10596 13310 17629 16193VIII. Profit (Loss) during the year 117073 141050 3691 4161 7964 6668
Source : Annual accounts of banks.Source

202
TABLE B2 : EARNINGS AND EXPENSES OF SCHEDULED COMMERCIAL BANKS - 2011-12 AND 2012-13 AS ON MARCH 31FOREIGN BANKS
(Amount in ` Million)
(Contd.)
Items
Bank of America Bank of Bahrain & Kuwait Bank of Ceylon
2012 2013 2012 2013 2012 2013
(13) (14) (15) (16) (17) (18)IncomeI. Interest Earned 11131 13352 760 947 183 242 a) Interest/Discount earned on advances/bills 6736 5916 544 668 79 95 b) Income on investments 4325 7128 210 268 49 83 c) Interest on balances with RBI and other inte 21 185 3 4 - - d) Others 50 122 3 7 55 65II. Other Income 5079 4735 107 105 44 50 a) Commission, exchange and brokerage 467 390 59 46 27 25 b) Net profit (loss) on sale of investments 292 1278 1 2 -1 3 c) Net profit (loss) on revaluation of investment - - - - - - d) Net profit (loss) on sale of land and other as -1 411 - - - - e) Net profit (loss) on exchange transactions 3624 1836 15 22 9 15 f) Miscellaneous income 697 821 31 35 8 8 Total (I+II) 16210 18087 866 1051 227 292
Expenditure & ProvisionsIII. Interest Expended 4239 5731 289 421 44 56 a) Interest on deposits 3000 2576 200 382 44 55 b) Interest on RBI/ Inter - bank borrowings 406 440 48 39 - - c) Others 832 2716 40 - - -IV. Operating Expenses 4055 4307 186 191 40 54 a) Payments to and provisions for employees 2119 2434 88 87 14 16 b) Rent, taxes and lighting 186 278 40 46 6 9 c) Printing and stationery 45 47 2 2 1 1 d) Advertisement and publicity - 55 1 1 1 - e) Depreciation on bank's property 112 165 15 14 4 9 f) Directors' fees, allowances and expenses - - - - - - g) Auditors' fees and expenses 3 3 1 1 - - h) Law charges 3 13 1 1 - - i) Postage, telegrams, telephones, etc 206 197 4 3 7 8 j) Repairs and maintenance 58 92 8 9 3 4 k) Insurance 67 63 7 8 - - l) Other expenditure 1255 958 19 21 5 6V. Net Interest Income (I-III) 6892 7620 471 525 139 186VI. Provisions and Contingencies 2662 3355 185 265 66 46VII. Operating Profit (I+II-III-IV) 7916 8049 392 439 143 183VIII. Profit (Loss) during the year 5255 4693 207 175 77 136
Source : Annual accounts of banks.
TABLE B2 : EARNINGS AND EXPENSES OF SCHEDULED COMMERCIAL BANKS - 2011-12 AND 2012-13 AS ON MARCH 31STATE BANK OF INDIA & ITS ASSOCIATES
(Amount in ` Million)
Items
State Bank of India State Bank ofMysore State Bank of Patiala
2012 2013 2012 2013 2012 2013
(1) (2) (3) (4) (5) (6)IncomeI. Interest Earned 1065215 1196571 50784 59655 81211 95643 a) Interest/Discount earned on advances/bills 810777 905371 40633 47878 64304 76419 b) Income on investments 239491 272006 10002 11576 14934 17358 c) Interest on balances with RBI and other inter-bank funds 3505 5451 146 175 1790 1863 d) Others 11441 13742 3 26 183 2II. Other Income 143514 160348 5164 5956 7510 7588 a) Commission, exchange and brokerage 120909 114837 3996 3914 5854 5783 b) Net profit (loss) on sale of investments -9197 11019 386 665 711 903 c) Net profit (loss) on revaluation of investments - -38 - - - - d) Net profit (loss) on sale of land and other assets -441 -327 - -10 - - e) Net profit (loss) on exchange transactions 14322 16916 326 585 528 591 f) Miscellaneous income 17922 17941 456 802 418 311 Total (I+II) 1208729 1356919 55948 65611 88721 103231
Expenditure & ProvisionsIII. Interest Expended 632304 753258 34941 41253 57859 71134 a) Interest on deposits 556444 674645 32209 37799 52876 63925 b) Interest on RBI/ Inter - bank borrowings 38856 41241 1461 2146 512 1207 c) Others 37004 37371 1271 1308 4471 6002IV. Operating Expenses 260690 292844 10411 11048 13234 15903 a) Payments to and provisions for employees 169740 183809 6206 6402 8347 9595 b) Rent, taxes and lighting 20654 24388 927 982 1186 1433 c) Printing and stationery 2765 2970 132 143 94 108 d) Advertisement and publicity 2066 3844 61 64 121 180 e) Depreciation on bank's property 10072 11396 500 470 482 523 f) Directors' fees, allowances and expenses 5 7 2 2 5 5 g) Auditors' fees and expenses 1285 1246 106 92 113 140 h) Law charges 1173 1339 77 73 43 42 i) Postage, telegrams, telephones, etc 4333 5156 82 62 128 104 j) Repairs and maintenance 3733 3935 55 46 209 266 k) Insurance 9635 12007 397 469 620 907 l) Other expenditure 35230 42745 1866 2241 1886 2601V. Net Interest Income (I-III) 432911 443313 15843 18402 23352 24508VI. Provisions and Contingencies 198662 169767 6905 9149 9665 9526VII. Operating Profit (I+II-III-IV) 315735 310817 10596 13310 17629 16193VIII. Profit (Loss) during the year 117073 141050 3691 4161 7964 6668
Source : Annual accounts of banks.Source

203
TABLE B2 : EARNINGS AND EXPENSES OF SCHEDULED COMMERCIAL BANKS - 2011-12 AND 2012-13 AS ON MARCH 31FOREIGN BANKS
(Amount in ` Million)
(Contd.)
Items
Bank of Nova Scotia Bank of Tokyo-MitsubishiUFJ Barclays Bank
2012 2013 2012 2013 2012 2013
(19) (20) (21) (22) (23) (24)IncomeI. Interest Earned 6626 8002 6019 8217 12913 15086 a) Interest/Discount earned on advances/bills 4124 4597 3927 4663 8326 5998 b) Income on investments 2307 3338 1848 3463 8456 10268 c) Interest on balances with RBI and other inte 8 16 100 80 27 31 d) Others 186 51 144 11 -3896 -1211II. Other Income 2289 2405 1613 1733 -874 2554 a) Commission, exchange and brokerage 394 442 878 793 1600 768 b) Net profit (loss) on sale of investments -41 4 - - -117 934 c) Net profit (loss) on revaluation of investment - - - - - - d) Net profit (loss) on sale of land and other as - - -2 - 1 -68 e) Net profit (loss) on exchange transactions 1223 1069 721 671 -2009 887 f) Miscellaneous income 713 890 17 270 -348 34 Total (I+II) 8915 10407 7632 9950 12038 17640
Expenditure & ProvisionsIII. Interest Expended 3757 4554 1676 2922 6190 9808 a) Interest on deposits 2989 2981 1435 1848 3624 2639 b) Interest on RBI/ Inter - bank borrowings 759 1572 78 143 4712 6385 c) Others 8 2 164 931 -2146 784IV. Operating Expenses 780 841 1308 1685 5330 5193 a) Payments to and provisions for employees 267 311 562 752 3235 2720 b) Rent, taxes and lighting 113 121 117 130 663 583 c) Printing and stationery 6 6 14 13 29 12 d) Advertisement and publicity 1 2 2 2 42 1 e) Depreciation on bank's property 29 26 104 127 307 199 f) Directors' fees, allowances and expenses - - - - - - g) Auditors' fees and expenses 3 4 1 1 4 4 h) Law charges 1 2 7 18 6 20 i) Postage, telegrams, telephones, etc 26 27 16 20 166 140 j) Repairs and maintenance 47 75 38 57 181 200 k) Insurance 31 46 27 39 69 53 l) Other expenditure 257 220 420 527 626 1260V. Net Interest Income (I-III) 2869 3448 4342 5295 6723 5278VI. Provisions and Contingencies 1908 2147 2523 2662 2348 3202VII. Operating Profit (I+II-III-IV) 4377 5013 4648 5344 518 2638VIII. Profit (Loss) during the year 2469 2866 2124 2681 -1830 -564
Source : Annual accounts of banks.
TABLE B2 : EARNINGS AND EXPENSES OF SCHEDULED COMMERCIAL BANKS - 2011-12 AND 2012-13 AS ON MARCH 31STATE BANK OF INDIA & ITS ASSOCIATES
(Amount in ` Million)
Items
State Bank of India State Bank ofMysore State Bank of Patiala
2012 2013 2012 2013 2012 2013
(1) (2) (3) (4) (5) (6)IncomeI. Interest Earned 1065215 1196571 50784 59655 81211 95643 a) Interest/Discount earned on advances/bills 810777 905371 40633 47878 64304 76419 b) Income on investments 239491 272006 10002 11576 14934 17358 c) Interest on balances with RBI and other inter-bank funds 3505 5451 146 175 1790 1863 d) Others 11441 13742 3 26 183 2II. Other Income 143514 160348 5164 5956 7510 7588 a) Commission, exchange and brokerage 120909 114837 3996 3914 5854 5783 b) Net profit (loss) on sale of investments -9197 11019 386 665 711 903 c) Net profit (loss) on revaluation of investments - -38 - - - - d) Net profit (loss) on sale of land and other assets -441 -327 - -10 - - e) Net profit (loss) on exchange transactions 14322 16916 326 585 528 591 f) Miscellaneous income 17922 17941 456 802 418 311 Total (I+II) 1208729 1356919 55948 65611 88721 103231
Expenditure & ProvisionsIII. Interest Expended 632304 753258 34941 41253 57859 71134 a) Interest on deposits 556444 674645 32209 37799 52876 63925 b) Interest on RBI/ Inter - bank borrowings 38856 41241 1461 2146 512 1207 c) Others 37004 37371 1271 1308 4471 6002IV. Operating Expenses 260690 292844 10411 11048 13234 15903 a) Payments to and provisions for employees 169740 183809 6206 6402 8347 9595 b) Rent, taxes and lighting 20654 24388 927 982 1186 1433 c) Printing and stationery 2765 2970 132 143 94 108 d) Advertisement and publicity 2066 3844 61 64 121 180 e) Depreciation on bank's property 10072 11396 500 470 482 523 f) Directors' fees, allowances and expenses 5 7 2 2 5 5 g) Auditors' fees and expenses 1285 1246 106 92 113 140 h) Law charges 1173 1339 77 73 43 42 i) Postage, telegrams, telephones, etc 4333 5156 82 62 128 104 j) Repairs and maintenance 3733 3935 55 46 209 266 k) Insurance 9635 12007 397 469 620 907 l) Other expenditure 35230 42745 1866 2241 1886 2601V. Net Interest Income (I-III) 432911 443313 15843 18402 23352 24508VI. Provisions and Contingencies 198662 169767 6905 9149 9665 9526VII. Operating Profit (I+II-III-IV) 315735 310817 10596 13310 17629 16193VIII. Profit (Loss) during the year 117073 141050 3691 4161 7964 6668
Source : Annual accounts of banks.Source

204
TABLE B2 : EARNINGS AND EXPENSES OF SCHEDULED COMMERCIAL BANKS - 2011-12 AND 2012-13 AS ON MARCH 31FOREIGN BANKS
(Amount in ` Million)
(Contd.)
Items
BNP Paribas Chinatrust CommercialBank Citibank
2012 2013 2012 2013 2012 2013
(25) (26) (27) (28) (29) (30)IncomeI. Interest Earned 8424 8646 363 382 77676 89161 a) Interest/Discount earned on advances/bills 4935 5229 324 326 42444 48465 b) Income on investments 3450 3324 38 46 30595 36005 c) Interest on balances with RBI and other inte 31 11 1 9 4305 4371 d) Others 8 82 - 1 332 320II. Other Income 730 2820 59 53 13933 19972 a) Commission, exchange and brokerage 1186 1175 35 30 9534 9919 b) Net profit (loss) on sale of investments -123 -19 - - -4644 -2054 c) Net profit (loss) on revaluation of investment - - - - - - d) Net profit (loss) on sale of land and other as -42 -2 - - -6 425 e) Net profit (loss) on exchange transactions -622 1242 19 19 8572 11588 f) Miscellaneous income 330 424 5 3 477 95 Total (I+II) 9154 11466 422 435 91609 109134
Expenditure & ProvisionsIII. Interest Expended 4038 4008 149 124 28875 37382 a) Interest on deposits 3458 3309 56 92 19457 25250 b) Interest on RBI/ Inter - bank borrowings 580 699 94 32 6231 7136 c) Others - - - - 3187 4997IV. Operating Expenses 3580 3956 147 201 28014 28948 a) Payments to and provisions for employees 1283 1362 64 84 10609 10624 b) Rent, taxes and lighting 570 581 10 13 1419 1569 c) Printing and stationery 15 15 1 1 458 471 d) Advertisement and publicity 34 91 - - 1194 1155 e) Depreciation on bank's property 115 121 8 9 988 937 f) Directors' fees, allowances and expenses - - - - - - g) Auditors' fees and expenses 3 3 1 1 10 14 h) Law charges 3 12 3 4 219 134 i) Postage, telegrams, telephones, etc 38 51 2 3 3280 3722 j) Repairs and maintenance 82 106 11 13 820 875 k) Insurance 54 57 1 2 589 679 l) Other expenditure 1382 1556 47 71 8429 8767V. Net Interest Income (I-III) 4386 4639 214 258 48802 51780VI. Provisions and Contingencies 722 1628 127 242 15500 15621VII. Operating Profit (I+II-III-IV) 1536 3503 126 110 34720 42804VIII. Profit (Loss) during the year 814 1874 -1 -131 19220 27183
Source : Annual accounts of banks.
TABLE B2 : EARNINGS AND EXPENSES OF SCHEDULED COMMERCIAL BANKS - 2011-12 AND 2012-13 AS ON MARCH 31STATE BANK OF INDIA & ITS ASSOCIATES
(Amount in ` Million)
Items
State Bank of India State Bank ofMysore State Bank of Patiala
2012 2013 2012 2013 2012 2013
(1) (2) (3) (4) (5) (6)IncomeI. Interest Earned 1065215 1196571 50784 59655 81211 95643 a) Interest/Discount earned on advances/bills 810777 905371 40633 47878 64304 76419 b) Income on investments 239491 272006 10002 11576 14934 17358 c) Interest on balances with RBI and other inter-bank funds 3505 5451 146 175 1790 1863 d) Others 11441 13742 3 26 183 2II. Other Income 143514 160348 5164 5956 7510 7588 a) Commission, exchange and brokerage 120909 114837 3996 3914 5854 5783 b) Net profit (loss) on sale of investments -9197 11019 386 665 711 903 c) Net profit (loss) on revaluation of investments - -38 - - - - d) Net profit (loss) on sale of land and other assets -441 -327 - -10 - - e) Net profit (loss) on exchange transactions 14322 16916 326 585 528 591 f) Miscellaneous income 17922 17941 456 802 418 311 Total (I+II) 1208729 1356919 55948 65611 88721 103231
Expenditure & ProvisionsIII. Interest Expended 632304 753258 34941 41253 57859 71134 a) Interest on deposits 556444 674645 32209 37799 52876 63925 b) Interest on RBI/ Inter - bank borrowings 38856 41241 1461 2146 512 1207 c) Others 37004 37371 1271 1308 4471 6002IV. Operating Expenses 260690 292844 10411 11048 13234 15903 a) Payments to and provisions for employees 169740 183809 6206 6402 8347 9595 b) Rent, taxes and lighting 20654 24388 927 982 1186 1433 c) Printing and stationery 2765 2970 132 143 94 108 d) Advertisement and publicity 2066 3844 61 64 121 180 e) Depreciation on bank's property 10072 11396 500 470 482 523 f) Directors' fees, allowances and expenses 5 7 2 2 5 5 g) Auditors' fees and expenses 1285 1246 106 92 113 140 h) Law charges 1173 1339 77 73 43 42 i) Postage, telegrams, telephones, etc 4333 5156 82 62 128 104 j) Repairs and maintenance 3733 3935 55 46 209 266 k) Insurance 9635 12007 397 469 620 907 l) Other expenditure 35230 42745 1866 2241 1886 2601V. Net Interest Income (I-III) 432911 443313 15843 18402 23352 24508VI. Provisions and Contingencies 198662 169767 6905 9149 9665 9526VII. Operating Profit (I+II-III-IV) 315735 310817 10596 13310 17629 16193VIII. Profit (Loss) during the year 117073 141050 3691 4161 7964 6668
Source : Annual accounts of banks.Source
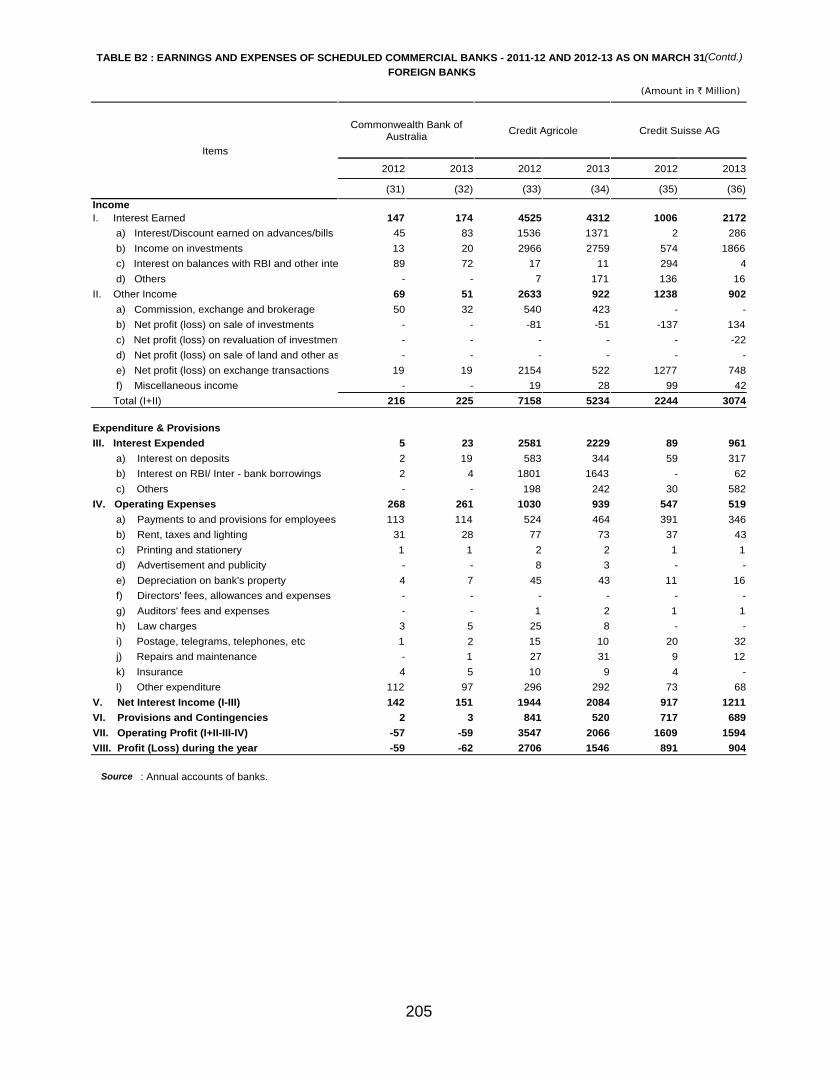
205
TABLE B2 : EARNINGS AND EXPENSES OF SCHEDULED COMMERCIAL BANKS - 2011-12 AND 2012-13 AS ON MARCH 31FOREIGN BANKS
(Amount in ` Million)
(Contd.)
Items
Commonwealth Bank ofAustralia Credit Agricole Credit Suisse AG
2012 2013 2012 2013 2012 2013
(31) (32) (33) (34) (35) (36)IncomeI. Interest Earned 147 174 4525 4312 1006 2172 a) Interest/Discount earned on advances/bills 45 83 1536 1371 2 286 b) Income on investments 13 20 2966 2759 574 1866 c) Interest on balances with RBI and other inte 89 72 17 11 294 4 d) Others - - 7 171 136 16II. Other Income 69 51 2633 922 1238 902 a) Commission, exchange and brokerage 50 32 540 423 - - b) Net profit (loss) on sale of investments - - -81 -51 -137 134 c) Net profit (loss) on revaluation of investment - - - - - -22 d) Net profit (loss) on sale of land and other as - - - - - - e) Net profit (loss) on exchange transactions 19 19 2154 522 1277 748 f) Miscellaneous income - - 19 28 99 42 Total (I+II) 216 225 7158 5234 2244 3074
Expenditure & ProvisionsIII. Interest Expended 5 23 2581 2229 89 961 a) Interest on deposits 2 19 583 344 59 317 b) Interest on RBI/ Inter - bank borrowings 2 4 1801 1643 - 62 c) Others - - 198 242 30 582IV. Operating Expenses 268 261 1030 939 547 519 a) Payments to and provisions for employees 113 114 524 464 391 346 b) Rent, taxes and lighting 31 28 77 73 37 43 c) Printing and stationery 1 1 2 2 1 1 d) Advertisement and publicity - - 8 3 - - e) Depreciation on bank's property 4 7 45 43 11 16 f) Directors' fees, allowances and expenses - - - - - - g) Auditors' fees and expenses - - 1 2 1 1 h) Law charges 3 5 25 8 - - i) Postage, telegrams, telephones, etc 1 2 15 10 20 32 j) Repairs and maintenance - 1 27 31 9 12 k) Insurance 4 5 10 9 4 - l) Other expenditure 112 97 296 292 73 68V. Net Interest Income (I-III) 142 151 1944 2084 917 1211VI. Provisions and Contingencies 2 3 841 520 717 689VII. Operating Profit (I+II-III-IV) -57 -59 3547 2066 1609 1594VIII. Profit (Loss) during the year -59 -62 2706 1546 891 904
Source : Annual accounts of banks.
TABLE B2 : EARNINGS AND EXPENSES OF SCHEDULED COMMERCIAL BANKS - 2011-12 AND 2012-13 AS ON MARCH 31STATE BANK OF INDIA & ITS ASSOCIATES
(Amount in ` Million)
Items
State Bank of India State Bank ofMysore State Bank of Patiala
2012 2013 2012 2013 2012 2013
(1) (2) (3) (4) (5) (6)IncomeI. Interest Earned 1065215 1196571 50784 59655 81211 95643 a) Interest/Discount earned on advances/bills 810777 905371 40633 47878 64304 76419 b) Income on investments 239491 272006 10002 11576 14934 17358 c) Interest on balances with RBI and other inter-bank funds 3505 5451 146 175 1790 1863 d) Others 11441 13742 3 26 183 2II. Other Income 143514 160348 5164 5956 7510 7588 a) Commission, exchange and brokerage 120909 114837 3996 3914 5854 5783 b) Net profit (loss) on sale of investments -9197 11019 386 665 711 903 c) Net profit (loss) on revaluation of investments - -38 - - - - d) Net profit (loss) on sale of land and other assets -441 -327 - -10 - - e) Net profit (loss) on exchange transactions 14322 16916 326 585 528 591 f) Miscellaneous income 17922 17941 456 802 418 311 Total (I+II) 1208729 1356919 55948 65611 88721 103231
Expenditure & ProvisionsIII. Interest Expended 632304 753258 34941 41253 57859 71134 a) Interest on deposits 556444 674645 32209 37799 52876 63925 b) Interest on RBI/ Inter - bank borrowings 38856 41241 1461 2146 512 1207 c) Others 37004 37371 1271 1308 4471 6002IV. Operating Expenses 260690 292844 10411 11048 13234 15903 a) Payments to and provisions for employees 169740 183809 6206 6402 8347 9595 b) Rent, taxes and lighting 20654 24388 927 982 1186 1433 c) Printing and stationery 2765 2970 132 143 94 108 d) Advertisement and publicity 2066 3844 61 64 121 180 e) Depreciation on bank's property 10072 11396 500 470 482 523 f) Directors' fees, allowances and expenses 5 7 2 2 5 5 g) Auditors' fees and expenses 1285 1246 106 92 113 140 h) Law charges 1173 1339 77 73 43 42 i) Postage, telegrams, telephones, etc 4333 5156 82 62 128 104 j) Repairs and maintenance 3733 3935 55 46 209 266 k) Insurance 9635 12007 397 469 620 907 l) Other expenditure 35230 42745 1866 2241 1886 2601V. Net Interest Income (I-III) 432911 443313 15843 18402 23352 24508VI. Provisions and Contingencies 198662 169767 6905 9149 9665 9526VII. Operating Profit (I+II-III-IV) 315735 310817 10596 13310 17629 16193VIII. Profit (Loss) during the year 117073 141050 3691 4161 7964 6668
Source : Annual accounts of banks.Source

206
TABLE B2 : EARNINGS AND EXPENSES OF SCHEDULED COMMERCIAL BANKS - 2011-12 AND 2012-13 AS ON MARCH 31FOREIGN BANKS
(Amount in ` Million)
(Contd.)
Items
DBS Bank Deutsche Bank FirstRand Bank
2012 2013 2012 2013 2012 2013
(37) (38) (39) (40) (41) (42)IncomeI. Interest Earned 17971 25592 23982 27031 629 767 a) Interest/Discount earned on advances/bills 7589 11066 17599 20091 133 186 b) Income on investments 10333 14385 6314 6908 496 578 c) Interest on balances with RBI and other inte 49 140 23 31 - 1 d) Others - - 47 - - 1II. Other Income 3110 1288 7530 9364 223 292 a) Commission, exchange and brokerage 4487 3479 5867 5275 30 79 b) Net profit (loss) on sale of investments -555 126 -879 1004 -4 4 c) Net profit (loss) on revaluation of investment - - - - - - d) Net profit (loss) on sale of land and other as - - -1 -25 - - e) Net profit (loss) on exchange transactions -860 -2364 1659 2650 42 -25 f) Miscellaneous income 37 46 884 460 154 234 Total (I+II) 21081 26879 31512 36395 852 1059
Expenditure & ProvisionsIII. Interest Expended 10450 15359 5898 7069 265 286 a) Interest on deposits 6347 9062 3727 4591 7 50 b) Interest on RBI/ Inter - bank borrowings 4103 6297 2169 2444 200 201 c) Others - - 1 34 59 34IV. Operating Expenses 4121 4881 10552 11108 616 1103 a) Payments to and provisions for employees 1943 2120 4949 5121 414 550 b) Rent, taxes and lighting 473 699 380 574 30 161 c) Printing and stationery 13 15 77 91 - 7 d) Advertisement and publicity 37 70 79 39 1 14 e) Depreciation on bank's property 196 198 280 261 32 54 f) Directors' fees, allowances and expenses - - - - - - g) Auditors' fees and expenses 3 3 4 7 - 2 h) Law charges 85 33 13 116 1 2 i) Postage, telegrams, telephones, etc 36 40 245 254 1 3 j) Repairs and maintenance 81 61 355 449 13 42 k) Insurance 104 177 288 284 7 12 l) Other expenditure 1150 1463 3881 3913 116 258V. Net Interest Income (I-III) 7522 10233 18084 19962 363 481VI. Provisions and Contingencies 3156 3754 6829 7887 -27 264VII. Operating Profit (I+II-III-IV) 6511 6639 15062 18218 -29 -331VIII. Profit (Loss) during the year 3355 2885 8233 10330 -2 -595
Source : Annual accounts of banks.
TABLE B2 : EARNINGS AND EXPENSES OF SCHEDULED COMMERCIAL BANKS - 2011-12 AND 2012-13 AS ON MARCH 31STATE BANK OF INDIA & ITS ASSOCIATES
(Amount in ` Million)
Items
State Bank of India State Bank ofMysore State Bank of Patiala
2012 2013 2012 2013 2012 2013
(1) (2) (3) (4) (5) (6)IncomeI. Interest Earned 1065215 1196571 50784 59655 81211 95643 a) Interest/Discount earned on advances/bills 810777 905371 40633 47878 64304 76419 b) Income on investments 239491 272006 10002 11576 14934 17358 c) Interest on balances with RBI and other inter-bank funds 3505 5451 146 175 1790 1863 d) Others 11441 13742 3 26 183 2II. Other Income 143514 160348 5164 5956 7510 7588 a) Commission, exchange and brokerage 120909 114837 3996 3914 5854 5783 b) Net profit (loss) on sale of investments -9197 11019 386 665 711 903 c) Net profit (loss) on revaluation of investments - -38 - - - - d) Net profit (loss) on sale of land and other assets -441 -327 - -10 - - e) Net profit (loss) on exchange transactions 14322 16916 326 585 528 591 f) Miscellaneous income 17922 17941 456 802 418 311 Total (I+II) 1208729 1356919 55948 65611 88721 103231
Expenditure & ProvisionsIII. Interest Expended 632304 753258 34941 41253 57859 71134 a) Interest on deposits 556444 674645 32209 37799 52876 63925 b) Interest on RBI/ Inter - bank borrowings 38856 41241 1461 2146 512 1207 c) Others 37004 37371 1271 1308 4471 6002IV. Operating Expenses 260690 292844 10411 11048 13234 15903 a) Payments to and provisions for employees 169740 183809 6206 6402 8347 9595 b) Rent, taxes and lighting 20654 24388 927 982 1186 1433 c) Printing and stationery 2765 2970 132 143 94 108 d) Advertisement and publicity 2066 3844 61 64 121 180 e) Depreciation on bank's property 10072 11396 500 470 482 523 f) Directors' fees, allowances and expenses 5 7 2 2 5 5 g) Auditors' fees and expenses 1285 1246 106 92 113 140 h) Law charges 1173 1339 77 73 43 42 i) Postage, telegrams, telephones, etc 4333 5156 82 62 128 104 j) Repairs and maintenance 3733 3935 55 46 209 266 k) Insurance 9635 12007 397 469 620 907 l) Other expenditure 35230 42745 1866 2241 1886 2601V. Net Interest Income (I-III) 432911 443313 15843 18402 23352 24508VI. Provisions and Contingencies 198662 169767 6905 9149 9665 9526VII. Operating Profit (I+II-III-IV) 315735 310817 10596 13310 17629 16193VIII. Profit (Loss) during the year 117073 141050 3691 4161 7964 6668
Source : Annual accounts of banks.Source

207
TABLE B2 : EARNINGS AND EXPENSES OF SCHEDULED COMMERCIAL BANKS - 2011-12 AND 2012-13 AS ON MARCH 31FOREIGN BANKS
(Amount in ` Million)
(Contd.)
Items
Hongkong & ShanghaiBanking Corporation
HSBC Bank OmanS.A.O.G.
Industrial andCommercial Bank of
China
2012 2013 2012 2013 2012 2013
(43) (44) (45) (46) (47) (48)IncomeI. Interest Earned 62626 70332 175 173 247 578 a) Interest/Discount earned on advances/bills 27497 35402 4 5 12 280 b) Income on investments 32128 33266 54 38 - 51 c) Interest on balances with RBI and other inte 2981 987 117 130 235 247 d) Others 320 677 - - - -II. Other Income 22008 17242 230 315 30 36 a) Commission, exchange and brokerage 10341 8237 4 3 30 15 b) Net profit (loss) on sale of investments -1819 548 -22 -30 - 2 c) Net profit (loss) on revaluation of investment - - - - - - d) Net profit (loss) on sale of land and other as 234 6 - - - - e) Net profit (loss) on exchange transactions 12746 8088 11 7 - 19 f) Miscellaneous income 507 365 237 335 - - Total (I+II) 84633 87574 405 488 277 614
Expenditure & ProvisionsIII. Interest Expended 25168 30006 95 94 - 74 a) Interest on deposits 23279 27232 90 91 - 33 b) Interest on RBI/ Inter - bank borrowings 1828 2752 5 3 - 23 c) Others 61 22 - - - 18IV. Operating Expenses 24183 24646 79 96 101 234 a) Payments to and provisions for employees 9551 10903 27 37 35 151 b) Rent, taxes and lighting 1346 1425 5 6 24 40 c) Printing and stationery 125 118 1 1 1 1 d) Advertisement and publicity 651 518 1 - 2 4 e) Depreciation on bank's property 503 366 14 18 7 12 f) Directors' fees, allowances and expenses - - - - - - g) Auditors' fees and expenses 4 4 1 1 1 1 h) Law charges 529 163 11 6 - - i) Postage, telegrams, telephones, etc 464 403 2 3 4 8 j) Repairs and maintenance 567 495 4 3 - 1 k) Insurance 792 823 2 2 - 1 l) Other expenditure 9651 9429 14 20 28 16V. Net Interest Income (I-III) 37458 40325 80 79 247 504VI. Provisions and Contingencies 15406 13564 63 50 77 141VII. Operating Profit (I+II-III-IV) 35282 32921 232 299 176 305VIII. Profit (Loss) during the year 19877 19357 168 249 99 164
Source : Annual accounts of banks.
TABLE B2 : EARNINGS AND EXPENSES OF SCHEDULED COMMERCIAL BANKS - 2011-12 AND 2012-13 AS ON MARCH 31STATE BANK OF INDIA & ITS ASSOCIATES
(Amount in ` Million)
Items
State Bank of India State Bank ofMysore State Bank of Patiala
2012 2013 2012 2013 2012 2013
(1) (2) (3) (4) (5) (6)IncomeI. Interest Earned 1065215 1196571 50784 59655 81211 95643 a) Interest/Discount earned on advances/bills 810777 905371 40633 47878 64304 76419 b) Income on investments 239491 272006 10002 11576 14934 17358 c) Interest on balances with RBI and other inter-bank funds 3505 5451 146 175 1790 1863 d) Others 11441 13742 3 26 183 2II. Other Income 143514 160348 5164 5956 7510 7588 a) Commission, exchange and brokerage 120909 114837 3996 3914 5854 5783 b) Net profit (loss) on sale of investments -9197 11019 386 665 711 903 c) Net profit (loss) on revaluation of investments - -38 - - - - d) Net profit (loss) on sale of land and other assets -441 -327 - -10 - - e) Net profit (loss) on exchange transactions 14322 16916 326 585 528 591 f) Miscellaneous income 17922 17941 456 802 418 311 Total (I+II) 1208729 1356919 55948 65611 88721 103231
Expenditure & ProvisionsIII. Interest Expended 632304 753258 34941 41253 57859 71134 a) Interest on deposits 556444 674645 32209 37799 52876 63925 b) Interest on RBI/ Inter - bank borrowings 38856 41241 1461 2146 512 1207 c) Others 37004 37371 1271 1308 4471 6002IV. Operating Expenses 260690 292844 10411 11048 13234 15903 a) Payments to and provisions for employees 169740 183809 6206 6402 8347 9595 b) Rent, taxes and lighting 20654 24388 927 982 1186 1433 c) Printing and stationery 2765 2970 132 143 94 108 d) Advertisement and publicity 2066 3844 61 64 121 180 e) Depreciation on bank's property 10072 11396 500 470 482 523 f) Directors' fees, allowances and expenses 5 7 2 2 5 5 g) Auditors' fees and expenses 1285 1246 106 92 113 140 h) Law charges 1173 1339 77 73 43 42 i) Postage, telegrams, telephones, etc 4333 5156 82 62 128 104 j) Repairs and maintenance 3733 3935 55 46 209 266 k) Insurance 9635 12007 397 469 620 907 l) Other expenditure 35230 42745 1866 2241 1886 2601V. Net Interest Income (I-III) 432911 443313 15843 18402 23352 24508VI. Provisions and Contingencies 198662 169767 6905 9149 9665 9526VII. Operating Profit (I+II-III-IV) 315735 310817 10596 13310 17629 16193VIII. Profit (Loss) during the year 117073 141050 3691 4161 7964 6668
Source : Annual accounts of banks.Source

208
TABLE B2 : EARNINGS AND EXPENSES OF SCHEDULED COMMERCIAL BANKS - 2011-12 AND 2012-13 AS ON MARCH 31FOREIGN BANKS
(Amount in ` Million)
(Contd.)
Items
JPMorgan Chase Bank JSC VTB Bank Krung Thai Bank
2012 2013 2012 2013 2012 2013
(49) (50) (51) (52) (53) (54)IncomeI. Interest Earned 11928 15451 120 134 129 166 a) Interest/Discount earned on advances/bills 2815 3244 91 115 11 11 b) Income on investments 8956 11975 1 2 23 30 c) Interest on balances with RBI and other inte 157 211 27 18 95 124 d) Others - 20 - - - -II. Other Income 3468 5620 9 24 20 15 a) Commission, exchange and brokerage 1242 1331 5 15 5 4 b) Net profit (loss) on sale of investments -31 1043 - - - - c) Net profit (loss) on revaluation of investment - - - - - - d) Net profit (loss) on sale of land and other as - - -1 - - - e) Net profit (loss) on exchange transactions 2231 3212 5 6 14 12 f) Miscellaneous income 25 34 - 2 - - Total (I+II) 15396 21072 128 158 148 181
Expenditure & ProvisionsIII. Interest Expended 4440 7423 2 3 48 78 a) Interest on deposits 3129 5762 2 3 47 78 b) Interest on RBI/ Inter - bank borrowings 1021 1433 - - - - c) Others 290 228 - - - -IV. Operating Expenses 2093 2137 98 102 34 37 a) Payments to and provisions for employees 1286 1269 43 47 8 10 b) Rent, taxes and lighting 132 157 30 33 15 15 c) Printing and stationery 6 6 1 1 - - d) Advertisement and publicity 1 - - - - - e) Depreciation on bank's property 27 20 3 1 3 3 f) Directors' fees, allowances and expenses - - - - - - g) Auditors' fees and expenses 2 2 1 1 - - h) Law charges 11 6 2 3 - - i) Postage, telegrams, telephones, etc 66 66 1 1 1 1 j) Repairs and maintenance 78 79 2 1 3 4 k) Insurance 67 94 - - - - l) Other expenditure 417 439 16 14 4 4V. Net Interest Income (I-III) 7488 8029 118 131 81 88VI. Provisions and Contingencies 3901 4785 19 27 30 29VII. Operating Profit (I+II-III-IV) 8863 11512 28 53 67 67VIII. Profit (Loss) during the year 4962 6727 9 26 36 38
Source : Annual accounts of banks.
TABLE B2 : EARNINGS AND EXPENSES OF SCHEDULED COMMERCIAL BANKS - 2011-12 AND 2012-13 AS ON MARCH 31STATE BANK OF INDIA & ITS ASSOCIATES
(Amount in ` Million)
Items
State Bank of India State Bank ofMysore State Bank of Patiala
2012 2013 2012 2013 2012 2013
(1) (2) (3) (4) (5) (6)IncomeI. Interest Earned 1065215 1196571 50784 59655 81211 95643 a) Interest/Discount earned on advances/bills 810777 905371 40633 47878 64304 76419 b) Income on investments 239491 272006 10002 11576 14934 17358 c) Interest on balances with RBI and other inter-bank funds 3505 5451 146 175 1790 1863 d) Others 11441 13742 3 26 183 2II. Other Income 143514 160348 5164 5956 7510 7588 a) Commission, exchange and brokerage 120909 114837 3996 3914 5854 5783 b) Net profit (loss) on sale of investments -9197 11019 386 665 711 903 c) Net profit (loss) on revaluation of investments - -38 - - - - d) Net profit (loss) on sale of land and other assets -441 -327 - -10 - - e) Net profit (loss) on exchange transactions 14322 16916 326 585 528 591 f) Miscellaneous income 17922 17941 456 802 418 311 Total (I+II) 1208729 1356919 55948 65611 88721 103231
Expenditure & ProvisionsIII. Interest Expended 632304 753258 34941 41253 57859 71134 a) Interest on deposits 556444 674645 32209 37799 52876 63925 b) Interest on RBI/ Inter - bank borrowings 38856 41241 1461 2146 512 1207 c) Others 37004 37371 1271 1308 4471 6002IV. Operating Expenses 260690 292844 10411 11048 13234 15903 a) Payments to and provisions for employees 169740 183809 6206 6402 8347 9595 b) Rent, taxes and lighting 20654 24388 927 982 1186 1433 c) Printing and stationery 2765 2970 132 143 94 108 d) Advertisement and publicity 2066 3844 61 64 121 180 e) Depreciation on bank's property 10072 11396 500 470 482 523 f) Directors' fees, allowances and expenses 5 7 2 2 5 5 g) Auditors' fees and expenses 1285 1246 106 92 113 140 h) Law charges 1173 1339 77 73 43 42 i) Postage, telegrams, telephones, etc 4333 5156 82 62 128 104 j) Repairs and maintenance 3733 3935 55 46 209 266 k) Insurance 9635 12007 397 469 620 907 l) Other expenditure 35230 42745 1866 2241 1886 2601V. Net Interest Income (I-III) 432911 443313 15843 18402 23352 24508VI. Provisions and Contingencies 198662 169767 6905 9149 9665 9526VII. Operating Profit (I+II-III-IV) 315735 310817 10596 13310 17629 16193VIII. Profit (Loss) during the year 117073 141050 3691 4161 7964 6668
Source : Annual accounts of banks.Source

209
TABLE B2 : EARNINGS AND EXPENSES OF SCHEDULED COMMERCIAL BANKS - 2011-12 AND 2012-13 AS ON MARCH 31FOREIGN BANKS
(Amount in ` Million)
(Contd.)
Items
Mashreqbank Mizuho Corporate Bank National Australia Bank
2012 2013 2012 2013 2012 2013
(55) (56) (57) (58) (59) (60)IncomeI. Interest Earned 52 98 2876 4248 31 124 a) Interest/Discount earned on advances/bills 11 23 2101 3103 - - b) Income on investments 27 30 613 1005 - 5 c) Interest on balances with RBI and other inte 11 43 162 139 31 118 d) Others 2 2 1 1 - -II. Other Income 222 206 1075 959 - 14 a) Commission, exchange and brokerage 174 182 478 581 - 14 b) Net profit (loss) on sale of investments - - - - - - c) Net profit (loss) on revaluation of investment - - - - - - d) Net profit (loss) on sale of land and other as - - - - - - e) Net profit (loss) on exchange transactions 41 21 596 377 - - f) Miscellaneous income 7 2 - - - - Total (I+II) 274 304 3951 5207 31 137
Expenditure & ProvisionsIII. Interest Expended 1 1 163 603 - - a) Interest on deposits 1 - 144 507 - - b) Interest on RBI/ Inter - bank borrowings - 1 18 96 - - c) Others - - - - - -IV. Operating Expenses 115 110 663 776 54 218 a) Payments to and provisions for employees 35 28 308 377 40 136 b) Rent, taxes and lighting 11 12 138 139 5 26 c) Printing and stationery - - 3 3 - 1 d) Advertisement and publicity - - - - - 3 e) Depreciation on bank's property 5 6 71 71 2 8 f) Directors' fees, allowances and expenses - - - - - - g) Auditors' fees and expenses - - 1 1 1 1 h) Law charges 2 1 10 16 - 3 i) Postage, telegrams, telephones, etc 5 5 5 7 - 13 j) Repairs and maintenance 2 2 17 19 2 4 k) Insurance - - 8 11 - - l) Other expenditure 53 54 103 131 5 22V. Net Interest Income (I-III) 51 97 2714 3644 31 123VI. Provisions and Contingencies 62 77 1355 2100 - 8VII. Operating Profit (I+II-III-IV) 158 193 3126 3828 -24 -81VIII. Profit (Loss) during the year 96 116 1771 1728 -24 -88
Source : Annual accounts of banks.
TABLE B2 : EARNINGS AND EXPENSES OF SCHEDULED COMMERCIAL BANKS - 2011-12 AND 2012-13 AS ON MARCH 31STATE BANK OF INDIA & ITS ASSOCIATES
(Amount in ` Million)
Items
State Bank of India State Bank ofMysore State Bank of Patiala
2012 2013 2012 2013 2012 2013
(1) (2) (3) (4) (5) (6)IncomeI. Interest Earned 1065215 1196571 50784 59655 81211 95643 a) Interest/Discount earned on advances/bills 810777 905371 40633 47878 64304 76419 b) Income on investments 239491 272006 10002 11576 14934 17358 c) Interest on balances with RBI and other inter-bank funds 3505 5451 146 175 1790 1863 d) Others 11441 13742 3 26 183 2II. Other Income 143514 160348 5164 5956 7510 7588 a) Commission, exchange and brokerage 120909 114837 3996 3914 5854 5783 b) Net profit (loss) on sale of investments -9197 11019 386 665 711 903 c) Net profit (loss) on revaluation of investments - -38 - - - - d) Net profit (loss) on sale of land and other assets -441 -327 - -10 - - e) Net profit (loss) on exchange transactions 14322 16916 326 585 528 591 f) Miscellaneous income 17922 17941 456 802 418 311 Total (I+II) 1208729 1356919 55948 65611 88721 103231
Expenditure & ProvisionsIII. Interest Expended 632304 753258 34941 41253 57859 71134 a) Interest on deposits 556444 674645 32209 37799 52876 63925 b) Interest on RBI/ Inter - bank borrowings 38856 41241 1461 2146 512 1207 c) Others 37004 37371 1271 1308 4471 6002IV. Operating Expenses 260690 292844 10411 11048 13234 15903 a) Payments to and provisions for employees 169740 183809 6206 6402 8347 9595 b) Rent, taxes and lighting 20654 24388 927 982 1186 1433 c) Printing and stationery 2765 2970 132 143 94 108 d) Advertisement and publicity 2066 3844 61 64 121 180 e) Depreciation on bank's property 10072 11396 500 470 482 523 f) Directors' fees, allowances and expenses 5 7 2 2 5 5 g) Auditors' fees and expenses 1285 1246 106 92 113 140 h) Law charges 1173 1339 77 73 43 42 i) Postage, telegrams, telephones, etc 4333 5156 82 62 128 104 j) Repairs and maintenance 3733 3935 55 46 209 266 k) Insurance 9635 12007 397 469 620 907 l) Other expenditure 35230 42745 1866 2241 1886 2601V. Net Interest Income (I-III) 432911 443313 15843 18402 23352 24508VI. Provisions and Contingencies 198662 169767 6905 9149 9665 9526VII. Operating Profit (I+II-III-IV) 315735 310817 10596 13310 17629 16193VIII. Profit (Loss) during the year 117073 141050 3691 4161 7964 6668
Source : Annual accounts of banks.Source

210
TABLE B2 : EARNINGS AND EXPENSES OF SCHEDULED COMMERCIAL BANKS - 2011-12 AND 2012-13 AS ON MARCH 31FOREIGN BANKS
(Amount in ` Million)
(Contd.)
Items
Rabobank International Royal Bank of Scotland Sberbank
2012 2013 2012 2013 2012 2013
(61) (62) (63) (64) (65) (66)IncomeI. Interest Earned 253 720 17907 18904 103 117 a) Interest/Discount earned on advances/bills 63 491 9778 10430 - 1 b) Income on investments 156 192 7427 7656 - - c) Interest on balances with RBI and other inte 8 - 702 779 103 116 d) Others 25 37 - 38 - -II. Other Income 225 209 8180 5470 - 3 a) Commission, exchange and brokerage 143 95 4586 2821 - 3 b) Net profit (loss) on sale of investments - 1 -414 45 - - c) Net profit (loss) on revaluation of investment - - - - - - d) Net profit (loss) on sale of land and other as - - 354 2 - - e) Net profit (loss) on exchange transactions 81 113 2861 2073 - - f) Miscellaneous income - - 793 530 - - Total (I+II) 478 929 26087 24374 103 120
Expenditure & ProvisionsIII. Interest Expended 1 95 8658 9325 - 1 a) Interest on deposits 1 62 6545 6848 - - b) Interest on RBI/ Inter - bank borrowings - 8 2114 2477 - 1 c) Others - 25 - - - -IV. Operating Expenses 352 578 9033 10274 117 133 a) Payments to and provisions for employees 160 304 3291 3464 58 71 b) Rent, taxes and lighting 11 14 1073 1372 26 27 c) Printing and stationery 1 1 92 93 - - d) Advertisement and publicity 12 7 64 60 - - e) Depreciation on bank's property 6 16 295 369 5 12 f) Directors' fees, allowances and expenses - - - - - - g) Auditors' fees and expenses 2 2 8 12 2 2 h) Law charges - - 8 13 - - i) Postage, telegrams, telephones, etc 1 3 412 362 2 4 j) Repairs and maintenance - - 937 1209 1 4 k) Insurance - 5 151 135 - - l) Other expenditure 159 226 2704 3186 23 13V. Net Interest Income (I-III) 252 625 9249 9579 103 116VI. Provisions and Contingencies 109 133 3598 2550 - 1VII. Operating Profit (I+II-III-IV) 125 255 8395 4775 -13 -14VIII. Profit (Loss) during the year 16 122 4798 2226 -13 -16
Source : Annual accounts of banks.
TABLE B2 : EARNINGS AND EXPENSES OF SCHEDULED COMMERCIAL BANKS - 2011-12 AND 2012-13 AS ON MARCH 31STATE BANK OF INDIA & ITS ASSOCIATES
(Amount in ` Million)
Items
State Bank of India State Bank ofMysore State Bank of Patiala
2012 2013 2012 2013 2012 2013
(1) (2) (3) (4) (5) (6)IncomeI. Interest Earned 1065215 1196571 50784 59655 81211 95643 a) Interest/Discount earned on advances/bills 810777 905371 40633 47878 64304 76419 b) Income on investments 239491 272006 10002 11576 14934 17358 c) Interest on balances with RBI and other inter-bank funds 3505 5451 146 175 1790 1863 d) Others 11441 13742 3 26 183 2II. Other Income 143514 160348 5164 5956 7510 7588 a) Commission, exchange and brokerage 120909 114837 3996 3914 5854 5783 b) Net profit (loss) on sale of investments -9197 11019 386 665 711 903 c) Net profit (loss) on revaluation of investments - -38 - - - - d) Net profit (loss) on sale of land and other assets -441 -327 - -10 - - e) Net profit (loss) on exchange transactions 14322 16916 326 585 528 591 f) Miscellaneous income 17922 17941 456 802 418 311 Total (I+II) 1208729 1356919 55948 65611 88721 103231
Expenditure & ProvisionsIII. Interest Expended 632304 753258 34941 41253 57859 71134 a) Interest on deposits 556444 674645 32209 37799 52876 63925 b) Interest on RBI/ Inter - bank borrowings 38856 41241 1461 2146 512 1207 c) Others 37004 37371 1271 1308 4471 6002IV. Operating Expenses 260690 292844 10411 11048 13234 15903 a) Payments to and provisions for employees 169740 183809 6206 6402 8347 9595 b) Rent, taxes and lighting 20654 24388 927 982 1186 1433 c) Printing and stationery 2765 2970 132 143 94 108 d) Advertisement and publicity 2066 3844 61 64 121 180 e) Depreciation on bank's property 10072 11396 500 470 482 523 f) Directors' fees, allowances and expenses 5 7 2 2 5 5 g) Auditors' fees and expenses 1285 1246 106 92 113 140 h) Law charges 1173 1339 77 73 43 42 i) Postage, telegrams, telephones, etc 4333 5156 82 62 128 104 j) Repairs and maintenance 3733 3935 55 46 209 266 k) Insurance 9635 12007 397 469 620 907 l) Other expenditure 35230 42745 1866 2241 1886 2601V. Net Interest Income (I-III) 432911 443313 15843 18402 23352 24508VI. Provisions and Contingencies 198662 169767 6905 9149 9665 9526VII. Operating Profit (I+II-III-IV) 315735 310817 10596 13310 17629 16193VIII. Profit (Loss) during the year 117073 141050 3691 4161 7964 6668
Source : Annual accounts of banks.Source
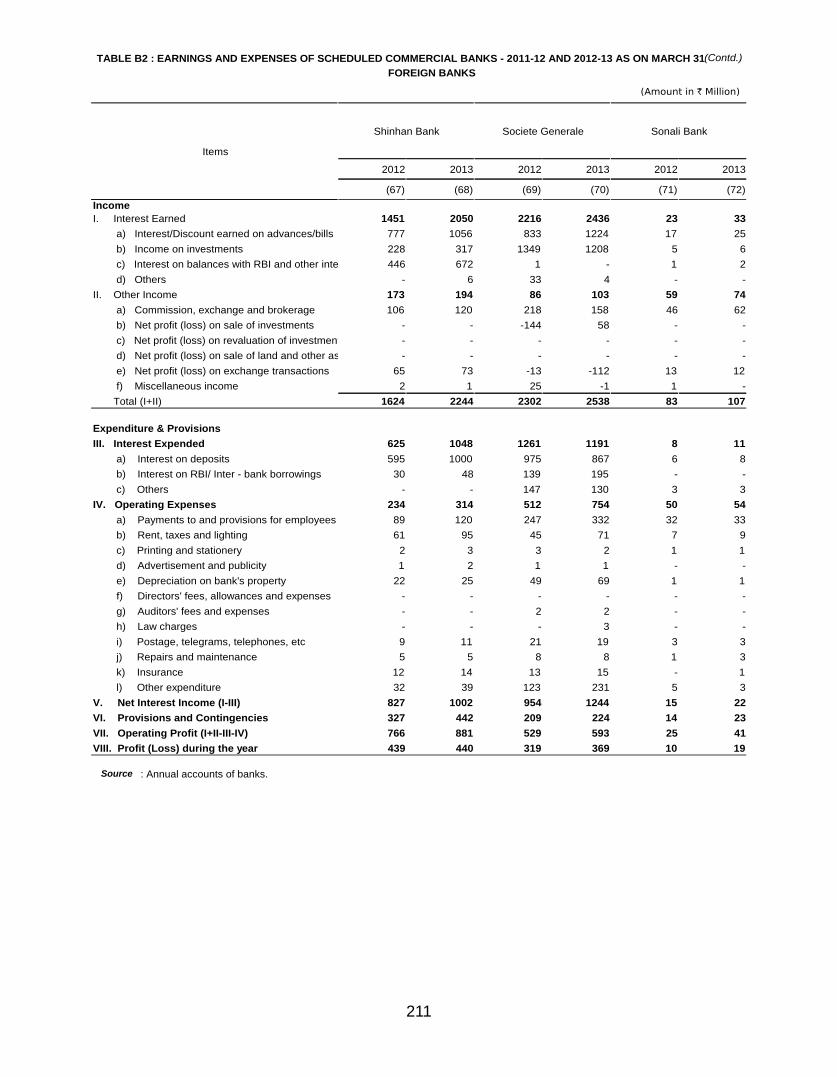
211
TABLE B2 : EARNINGS AND EXPENSES OF SCHEDULED COMMERCIAL BANKS - 2011-12 AND 2012-13 AS ON MARCH 31FOREIGN BANKS
(Amount in ` Million)
(Contd.)
Items
Shinhan Bank Societe Generale Sonali Bank
2012 2013 2012 2013 2012 2013
(67) (68) (69) (70) (71) (72)IncomeI. Interest Earned 1451 2050 2216 2436 23 33 a) Interest/Discount earned on advances/bills 777 1056 833 1224 17 25 b) Income on investments 228 317 1349 1208 5 6 c) Interest on balances with RBI and other inte 446 672 1 - 1 2 d) Others - 6 33 4 - -II. Other Income 173 194 86 103 59 74 a) Commission, exchange and brokerage 106 120 218 158 46 62 b) Net profit (loss) on sale of investments - - -144 58 - - c) Net profit (loss) on revaluation of investment - - - - - - d) Net profit (loss) on sale of land and other as - - - - - - e) Net profit (loss) on exchange transactions 65 73 -13 -112 13 12 f) Miscellaneous income 2 1 25 -1 1 - Total (I+II) 1624 2244 2302 2538 83 107
Expenditure & ProvisionsIII. Interest Expended 625 1048 1261 1191 8 11 a) Interest on deposits 595 1000 975 867 6 8 b) Interest on RBI/ Inter - bank borrowings 30 48 139 195 - - c) Others - - 147 130 3 3IV. Operating Expenses 234 314 512 754 50 54 a) Payments to and provisions for employees 89 120 247 332 32 33 b) Rent, taxes and lighting 61 95 45 71 7 9 c) Printing and stationery 2 3 3 2 1 1 d) Advertisement and publicity 1 2 1 1 - - e) Depreciation on bank's property 22 25 49 69 1 1 f) Directors' fees, allowances and expenses - - - - - - g) Auditors' fees and expenses - - 2 2 - - h) Law charges - - - 3 - - i) Postage, telegrams, telephones, etc 9 11 21 19 3 3 j) Repairs and maintenance 5 5 8 8 1 3 k) Insurance 12 14 13 15 - 1 l) Other expenditure 32 39 123 231 5 3V. Net Interest Income (I-III) 827 1002 954 1244 15 22VI. Provisions and Contingencies 327 442 209 224 14 23VII. Operating Profit (I+II-III-IV) 766 881 529 593 25 41VIII. Profit (Loss) during the year 439 440 319 369 10 19
Source : Annual accounts of banks.
TABLE B2 : EARNINGS AND EXPENSES OF SCHEDULED COMMERCIAL BANKS - 2011-12 AND 2012-13 AS ON MARCH 31STATE BANK OF INDIA & ITS ASSOCIATES
(Amount in ` Million)
Items
State Bank of India State Bank ofMysore State Bank of Patiala
2012 2013 2012 2013 2012 2013
(1) (2) (3) (4) (5) (6)IncomeI. Interest Earned 1065215 1196571 50784 59655 81211 95643 a) Interest/Discount earned on advances/bills 810777 905371 40633 47878 64304 76419 b) Income on investments 239491 272006 10002 11576 14934 17358 c) Interest on balances with RBI and other inter-bank funds 3505 5451 146 175 1790 1863 d) Others 11441 13742 3 26 183 2II. Other Income 143514 160348 5164 5956 7510 7588 a) Commission, exchange and brokerage 120909 114837 3996 3914 5854 5783 b) Net profit (loss) on sale of investments -9197 11019 386 665 711 903 c) Net profit (loss) on revaluation of investments - -38 - - - - d) Net profit (loss) on sale of land and other assets -441 -327 - -10 - - e) Net profit (loss) on exchange transactions 14322 16916 326 585 528 591 f) Miscellaneous income 17922 17941 456 802 418 311 Total (I+II) 1208729 1356919 55948 65611 88721 103231
Expenditure & ProvisionsIII. Interest Expended 632304 753258 34941 41253 57859 71134 a) Interest on deposits 556444 674645 32209 37799 52876 63925 b) Interest on RBI/ Inter - bank borrowings 38856 41241 1461 2146 512 1207 c) Others 37004 37371 1271 1308 4471 6002IV. Operating Expenses 260690 292844 10411 11048 13234 15903 a) Payments to and provisions for employees 169740 183809 6206 6402 8347 9595 b) Rent, taxes and lighting 20654 24388 927 982 1186 1433 c) Printing and stationery 2765 2970 132 143 94 108 d) Advertisement and publicity 2066 3844 61 64 121 180 e) Depreciation on bank's property 10072 11396 500 470 482 523 f) Directors' fees, allowances and expenses 5 7 2 2 5 5 g) Auditors' fees and expenses 1285 1246 106 92 113 140 h) Law charges 1173 1339 77 73 43 42 i) Postage, telegrams, telephones, etc 4333 5156 82 62 128 104 j) Repairs and maintenance 3733 3935 55 46 209 266 k) Insurance 9635 12007 397 469 620 907 l) Other expenditure 35230 42745 1866 2241 1886 2601V. Net Interest Income (I-III) 432911 443313 15843 18402 23352 24508VI. Provisions and Contingencies 198662 169767 6905 9149 9665 9526VII. Operating Profit (I+II-III-IV) 315735 310817 10596 13310 17629 16193VIII. Profit (Loss) during the year 117073 141050 3691 4161 7964 6668
Source : Annual accounts of banks.Source

212
TABLE B2 : EARNINGS AND EXPENSES OF SCHEDULED COMMERCIAL BANKS - 2011-12 AND 2012-13 AS ON MARCH 31FOREIGN BANKS
(Amount in ` Million)
(Contd.)
Items
Standard Chartered Bank State Bank of Mauritius Sumitomo Mitsui BankingCorporation
2012 2013 2012 2013 2012 2013
(73) (74) (75) (76) (77) (78)IncomeI. Interest Earned 79432 90835 1241 1460 - 102 a) Interest/Discount earned on advances/bills 59158 66877 727 754 - - b) Income on investments 19884 23417 381 362 - 6 c) Interest on balances with RBI and other inte 337 258 10 4 - 96 d) Others 53 283 123 340 - -II. Other Income 29882 28072 125 202 - - a) Commission, exchange and brokerage 20752 19937 10 13 - - b) Net profit (loss) on sale of investments -2578 1218 4 48 - - c) Net profit (loss) on revaluation of investment 1532 610 - - - - d) Net profit (loss) on sale of land and other as 643 133 - - - - e) Net profit (loss) on exchange transactions 5237 4981 58 55 - - f) Miscellaneous income 4296 1194 52 86 - - Total (I+II) 109315 118907 1366 1662 - 102
Expenditure & ProvisionsIII. Interest Expended 36904 40692 850 787 - - a) Interest on deposits 30165 32235 615 417 - - b) Interest on RBI/ Inter - bank borrowings 1934 2214 123 130 - - c) Others 4805 6244 112 240 - -IV. Operating Expenses 27408 29041 168 164 - 257 a) Payments to and provisions for employees 13387 12899 83 80 - 95 b) Rent, taxes and lighting 1204 1135 9 12 - 29 c) Printing and stationery 347 324 1 1 - - d) Advertisement and publicity 3099 4116 - - - - e) Depreciation on bank's property 939 1045 10 10 - 17 f) Directors' fees, allowances and expenses - - - - - - g) Auditors' fees and expenses 7 8 1 - - 2 h) Law charges 380 529 13 7 - 37 i) Postage, telegrams, telephones, etc 794 774 5 5 - 5 j) Repairs and maintenance 940 910 5 4 - 44 k) Insurance 657 629 9 6 - 3 l) Other expenditure 5654 6671 32 39 - 24V. Net Interest Income (I-III) 42529 50143 391 673 - 102VI. Provisions and Contingencies 27645 19572 236 380 - 9VII. Operating Profit (I+II-III-IV) 45003 49174 348 711 - -155VIII. Profit (Loss) during the year 17358 29602 112 331 - -163
Source : Annual accounts of banks.
TABLE B2 : EARNINGS AND EXPENSES OF SCHEDULED COMMERCIAL BANKS - 2011-12 AND 2012-13 AS ON MARCH 31STATE BANK OF INDIA & ITS ASSOCIATES
(Amount in ` Million)
Items
State Bank of India State Bank ofMysore State Bank of Patiala
2012 2013 2012 2013 2012 2013
(1) (2) (3) (4) (5) (6)IncomeI. Interest Earned 1065215 1196571 50784 59655 81211 95643 a) Interest/Discount earned on advances/bills 810777 905371 40633 47878 64304 76419 b) Income on investments 239491 272006 10002 11576 14934 17358 c) Interest on balances with RBI and other inter-bank funds 3505 5451 146 175 1790 1863 d) Others 11441 13742 3 26 183 2II. Other Income 143514 160348 5164 5956 7510 7588 a) Commission, exchange and brokerage 120909 114837 3996 3914 5854 5783 b) Net profit (loss) on sale of investments -9197 11019 386 665 711 903 c) Net profit (loss) on revaluation of investments - -38 - - - - d) Net profit (loss) on sale of land and other assets -441 -327 - -10 - - e) Net profit (loss) on exchange transactions 14322 16916 326 585 528 591 f) Miscellaneous income 17922 17941 456 802 418 311 Total (I+II) 1208729 1356919 55948 65611 88721 103231
Expenditure & ProvisionsIII. Interest Expended 632304 753258 34941 41253 57859 71134 a) Interest on deposits 556444 674645 32209 37799 52876 63925 b) Interest on RBI/ Inter - bank borrowings 38856 41241 1461 2146 512 1207 c) Others 37004 37371 1271 1308 4471 6002IV. Operating Expenses 260690 292844 10411 11048 13234 15903 a) Payments to and provisions for employees 169740 183809 6206 6402 8347 9595 b) Rent, taxes and lighting 20654 24388 927 982 1186 1433 c) Printing and stationery 2765 2970 132 143 94 108 d) Advertisement and publicity 2066 3844 61 64 121 180 e) Depreciation on bank's property 10072 11396 500 470 482 523 f) Directors' fees, allowances and expenses 5 7 2 2 5 5 g) Auditors' fees and expenses 1285 1246 106 92 113 140 h) Law charges 1173 1339 77 73 43 42 i) Postage, telegrams, telephones, etc 4333 5156 82 62 128 104 j) Repairs and maintenance 3733 3935 55 46 209 266 k) Insurance 9635 12007 397 469 620 907 l) Other expenditure 35230 42745 1866 2241 1886 2601V. Net Interest Income (I-III) 432911 443313 15843 18402 23352 24508VI. Provisions and Contingencies 198662 169767 6905 9149 9665 9526VII. Operating Profit (I+II-III-IV) 315735 310817 10596 13310 17629 16193VIII. Profit (Loss) during the year 117073 141050 3691 4161 7964 6668
Source : Annual accounts of banks.Source
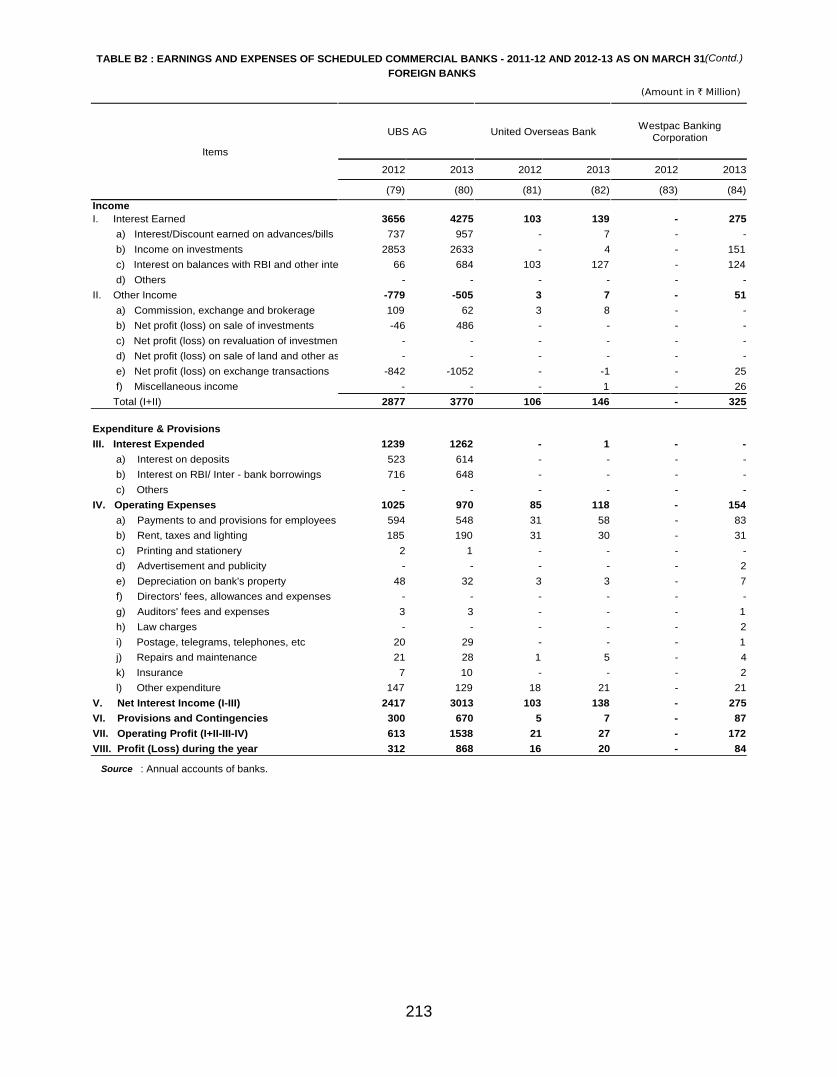
213
TABLE B2 : EARNINGS AND EXPENSES OF SCHEDULED COMMERCIAL BANKS - 2011-12 AND 2012-13 AS ON MARCH 31FOREIGN BANKS
(Amount in ` Million)
(Contd.)
Items
UBS AG United Overseas Bank Westpac BankingCorporation
2012 2013 2012 2013 2012 2013
(79) (80) (81) (82) (83) (84)IncomeI. Interest Earned 3656 4275 103 139 - 275 a) Interest/Discount earned on advances/bills 737 957 - 7 - - b) Income on investments 2853 2633 - 4 - 151 c) Interest on balances with RBI and other inte 66 684 103 127 - 124 d) Others - - - - - -II. Other Income -779 -505 3 7 - 51 a) Commission, exchange and brokerage 109 62 3 8 - - b) Net profit (loss) on sale of investments -46 486 - - - - c) Net profit (loss) on revaluation of investment - - - - - - d) Net profit (loss) on sale of land and other as - - - - - - e) Net profit (loss) on exchange transactions -842 -1052 - -1 - 25 f) Miscellaneous income - - - 1 - 26 Total (I+II) 2877 3770 106 146 - 325
Expenditure & ProvisionsIII. Interest Expended 1239 1262 - 1 - - a) Interest on deposits 523 614 - - - - b) Interest on RBI/ Inter - bank borrowings 716 648 - - - - c) Others - - - - - -IV. Operating Expenses 1025 970 85 118 - 154 a) Payments to and provisions for employees 594 548 31 58 - 83 b) Rent, taxes and lighting 185 190 31 30 - 31 c) Printing and stationery 2 1 - - - - d) Advertisement and publicity - - - - - 2 e) Depreciation on bank's property 48 32 3 3 - 7 f) Directors' fees, allowances and expenses - - - - - - g) Auditors' fees and expenses 3 3 - - - 1 h) Law charges - - - - - 2 i) Postage, telegrams, telephones, etc 20 29 - - - 1 j) Repairs and maintenance 21 28 1 5 - 4 k) Insurance 7 10 - - - 2 l) Other expenditure 147 129 18 21 - 21V. Net Interest Income (I-III) 2417 3013 103 138 - 275VI. Provisions and Contingencies 300 670 5 7 - 87VII. Operating Profit (I+II-III-IV) 613 1538 21 27 - 172VIII. Profit (Loss) during the year 312 868 16 20 - 84
Source : Annual accounts of banks.
TABLE B2 : EARNINGS AND EXPENSES OF SCHEDULED COMMERCIAL BANKS - 2011-12 AND 2012-13 AS ON MARCH 31STATE BANK OF INDIA & ITS ASSOCIATES
(Amount in ` Million)
Items
State Bank of India State Bank ofMysore State Bank of Patiala
2012 2013 2012 2013 2012 2013
(1) (2) (3) (4) (5) (6)IncomeI. Interest Earned 1065215 1196571 50784 59655 81211 95643 a) Interest/Discount earned on advances/bills 810777 905371 40633 47878 64304 76419 b) Income on investments 239491 272006 10002 11576 14934 17358 c) Interest on balances with RBI and other inter-bank funds 3505 5451 146 175 1790 1863 d) Others 11441 13742 3 26 183 2II. Other Income 143514 160348 5164 5956 7510 7588 a) Commission, exchange and brokerage 120909 114837 3996 3914 5854 5783 b) Net profit (loss) on sale of investments -9197 11019 386 665 711 903 c) Net profit (loss) on revaluation of investments - -38 - - - - d) Net profit (loss) on sale of land and other assets -441 -327 - -10 - - e) Net profit (loss) on exchange transactions 14322 16916 326 585 528 591 f) Miscellaneous income 17922 17941 456 802 418 311 Total (I+II) 1208729 1356919 55948 65611 88721 103231
Expenditure & ProvisionsIII. Interest Expended 632304 753258 34941 41253 57859 71134 a) Interest on deposits 556444 674645 32209 37799 52876 63925 b) Interest on RBI/ Inter - bank borrowings 38856 41241 1461 2146 512 1207 c) Others 37004 37371 1271 1308 4471 6002IV. Operating Expenses 260690 292844 10411 11048 13234 15903 a) Payments to and provisions for employees 169740 183809 6206 6402 8347 9595 b) Rent, taxes and lighting 20654 24388 927 982 1186 1433 c) Printing and stationery 2765 2970 132 143 94 108 d) Advertisement and publicity 2066 3844 61 64 121 180 e) Depreciation on bank's property 10072 11396 500 470 482 523 f) Directors' fees, allowances and expenses 5 7 2 2 5 5 g) Auditors' fees and expenses 1285 1246 106 92 113 140 h) Law charges 1173 1339 77 73 43 42 i) Postage, telegrams, telephones, etc 4333 5156 82 62 128 104 j) Repairs and maintenance 3733 3935 55 46 209 266 k) Insurance 9635 12007 397 469 620 907 l) Other expenditure 35230 42745 1866 2241 1886 2601V. Net Interest Income (I-III) 432911 443313 15843 18402 23352 24508VI. Provisions and Contingencies 198662 169767 6905 9149 9665 9526VII. Operating Profit (I+II-III-IV) 315735 310817 10596 13310 17629 16193VIII. Profit (Loss) during the year 117073 141050 3691 4161 7964 6668
Source : Annual accounts of banks.Source

214
TABLE B2 : EARNINGS AND EXPENSES OF SCHEDULED COMMERCIAL BANKS - 2011-12 AND 2012-13 AS ON MARCH 31FOREIGN BANKS
(Amount in ` Million)
(Concld.)
Items
Woori Bank
2012 2013
(85) (86)IncomeI. Interest Earned 42 206 a) Interest/Discount earned on advances/bills - 29 b) Income on investments - 25 c) Interest on balances with RBI and other inte 42 153 d) Others - -II. Other Income - 10 a) Commission, exchange and brokerage - 3 b) Net profit (loss) on sale of investments - 2 c) Net profit (loss) on revaluation of investment - - d) Net profit (loss) on sale of land and other as - - e) Net profit (loss) on exchange transactions - 5 f) Miscellaneous income - - Total (I+II) 42 216
Expenditure & ProvisionsIII. Interest Expended - 56 a) Interest on deposits - 56 b) Interest on RBI/ Inter - bank borrowings - - c) Others - -IV. Operating Expenses 26 118 a) Payments to and provisions for employees 7 39 b) Rent, taxes and lighting 8 23 c) Printing and stationery - 1 d) Advertisement and publicity 1 2 e) Depreciation on bank's property 1 12 f) Directors' fees, allowances and expenses - - g) Auditors' fees and expenses 1 - h) Law charges 1 2 i) Postage, telegrams, telephones, etc 1 6 j) Repairs and maintenance - - k) Insurance - - l) Other expenditure 7 33V. Net Interest Income (I-III) 42 149VI. Provisions and Contingencies 7 19VII. Operating Profit (I+II-III-IV) 15 41VIII. Profit (Loss) during the year 9 22
Source : Annual accounts of banks.
TABLE B2 : EARNINGS AND EXPENSES OF SCHEDULED COMMERCIAL BANKS - 2011-12 AND 2012-13 AS ON MARCH 31STATE BANK OF INDIA & ITS ASSOCIATES
(Amount in ` Million)
Items
State Bank of India State Bank ofMysore State Bank of Patiala
2012 2013 2012 2013 2012 2013
(1) (2) (3) (4) (5) (6)IncomeI. Interest Earned 1065215 1196571 50784 59655 81211 95643 a) Interest/Discount earned on advances/bills 810777 905371 40633 47878 64304 76419 b) Income on investments 239491 272006 10002 11576 14934 17358 c) Interest on balances with RBI and other inter-bank funds 3505 5451 146 175 1790 1863 d) Others 11441 13742 3 26 183 2II. Other Income 143514 160348 5164 5956 7510 7588 a) Commission, exchange and brokerage 120909 114837 3996 3914 5854 5783 b) Net profit (loss) on sale of investments -9197 11019 386 665 711 903 c) Net profit (loss) on revaluation of investments - -38 - - - - d) Net profit (loss) on sale of land and other assets -441 -327 - -10 - - e) Net profit (loss) on exchange transactions 14322 16916 326 585 528 591 f) Miscellaneous income 17922 17941 456 802 418 311 Total (I+II) 1208729 1356919 55948 65611 88721 103231
Expenditure & ProvisionsIII. Interest Expended 632304 753258 34941 41253 57859 71134 a) Interest on deposits 556444 674645 32209 37799 52876 63925 b) Interest on RBI/ Inter - bank borrowings 38856 41241 1461 2146 512 1207 c) Others 37004 37371 1271 1308 4471 6002IV. Operating Expenses 260690 292844 10411 11048 13234 15903 a) Payments to and provisions for employees 169740 183809 6206 6402 8347 9595 b) Rent, taxes and lighting 20654 24388 927 982 1186 1433 c) Printing and stationery 2765 2970 132 143 94 108 d) Advertisement and publicity 2066 3844 61 64 121 180 e) Depreciation on bank's property 10072 11396 500 470 482 523 f) Directors' fees, allowances and expenses 5 7 2 2 5 5 g) Auditors' fees and expenses 1285 1246 106 92 113 140 h) Law charges 1173 1339 77 73 43 42 i) Postage, telegrams, telephones, etc 4333 5156 82 62 128 104 j) Repairs and maintenance 3733 3935 55 46 209 266 k) Insurance 9635 12007 397 469 620 907 l) Other expenditure 35230 42745 1866 2241 1886 2601V. Net Interest Income (I-III) 432911 443313 15843 18402 23352 24508VI. Provisions and Contingencies 198662 169767 6905 9149 9665 9526VII. Operating Profit (I+II-III-IV) 315735 310817 10596 13310 17629 16193VIII. Profit (Loss) during the year 117073 141050 3691 4161 7964 6668
Source : Annual accounts of banks.
(Amount in ` Million)
Source

215
TABLE B3: BANK-WISE CAPITAL ADEQUACY RATIO (CRAR) OF SCHEDULED COMMERCIAL BANKS - 2012 AND 2013
2012 2013Bank Name Basel-I Basel-II Basel-I Basel-II
Tier-I Tier-II Total Tier-I Tier-II Total Tier-I Tier-II Total Tier-I Tier-II Total
(1) (2) (3) (4) (5) (6) (7) (8) (9) (10) (11) (12)
SBI and its Associates
State Bank of India 8.50 3.55 12.05 9.79 4.07 13.86 8.23 2.99 11.22 9.49 3.43 12.92
State Bank of Bikaner & Jaipur 9.09 3.72 12.81 9.76 4.00 13.76 8.85 2.96 11.81 9.11 3.05 12.16
State Bank of Hyderabad 8.79 3.60 12.39 9.62 3.94 13.56 8.88 3.00 11.88 9.25 3.11 12.36
State Bank of Mysore 8.17 3.05 11.22 9.18 3.37 12.55 8.41 2.78 11.19 8.87 2.92 11.79
State Bank of Patiala 7.54 3.25 10.79 8.60 3.70 12.30 7.15 2.77 9.92 8.02 3.10 11.12
State Bank of Travancore 7.72 3.46 11.18 9.35 4.20 13.55 6.83 2.61 9.44 8.46 3.24 11.70
Nationalised Banks $
Allahabad Bank .. .. .. 9.13 3.70 12.83 .. .. .. 8.05 2.98 11.03
Andhra Bank 8.45 3.89 12.34 9.03 4.15 13.18 8.16 3.10 11.26 8.52 3.24 11.76
Bank of Baroda .. .. .. 10.83 3.84 14.67 .. .. .. 10.13 3.17 13.30
Bank of India 8.29 3.28 11.57 8.59 3.36 11.95 8.42 2.93 11.35 8.20 2.82 11.02
Bank of Maharashtra 7.50 3.75 11.25 8.31 4.12 12.43 7.03 4.69 11.72 7.57 5.02 12.59
Canara Bank .. .. .. 10.35 3.41 13.76 .. .. .. 9.77 2.63 12.40
Central Bank of India 7.50 4.46 11.96 7.79 4.61 12.40 7.95 3.38 11.33 8.09 3.40 11.49
Corporation Bank 7.65 4.29 11.94 8.33 4.67 13.00 7.69 3.69 11.38 8.33 4.00 12.33
Dena Bank .. .. .. 8.86 2.65 11.51 .. .. .. 7.26 3.77 11.03
IDBI Bank Ltd. 7.37 5.47 12.84 8.38 6.20 14.58 7.06 5.03 12.09 7.68 5.45 13.13
Indian Bank 10.47 2.20 12.67 11.13 2.34 13.47 9.64 1.95 11.59 10.88 2.20 13.08
Indian Overseas Bank 7.49 4.46 11.95 8.35 4.97 13.32 7.07 3.67 10.74 7.80 4.05 11.85
Oriental Bank of Commerce 8.78 2.23 11.01 10.12 2.57 12.69 8.20 2.55 10.75 9.18 2.86 12.04
Punjab and Sind Bank 8.26 4.55 12.81 8.55 4.71 13.26 8.25 4.46 12.71 8.38 4.53 12.91
Punjab National Bank 8.52 3.07 11.59 9.28 3.35 12.63 9.42 2.86 12.28 9.76 2.96 12.72
Syndicate Bank .. .. 10.81 8.94 3.30 12.24 .. .. 11.12 8.96 3.63 12.59
UCO Bank 7.23 3.80 11.03 8.09 4.26 12.35 7.96 4.47 12.43 9.06 5.09 14.15
Union Bank of India .. .. .. 8.37 3.48 11.85 .. .. .. 8.23 3.22 11.45
United Bank of India 7.26 3.22 10.48 8.79 3.90 12.69 7.04 2.73 9.77 8.40 3.26 11.66
Vijaya Bank 8.13 2.83 10.96 9.68 3.38 13.06 7.23 2.35 9.58 8.54 2.78 11.32
Old Private Sector Banks
Catholic Syrian Bank .. .. .. 8.83 2.25 11.08 .. .. .. 9.62 2.67 12.29
City Union Bank 10.06 0.75 10.81 11.69 0.88 12.57 10.88 0.58 11.46 13.27 0.71 13.98
Dhanlaxmi Bank 6.88 1.91 8.79 7.42 2.07 9.49 7.20 2.69 9.89 8.05 3.01 11.06
(Per cent)
CRAR (as on March 31)
Note : $ includes IDBI Bank Ltd.Source : Annual accounts of banks.
TABLE B3: BANK-WISE CAPITAL ADEQUACY RATIO (CRAR) OF SCHEDULED COMMERCIAL BANKS - 2012 AND 2013
2012 2013Bank Name Basel-I Basel-II Basel-I Basel-II
Tier-I Tier-II Total Tier-I Tier-II Total Tier-I Tier-II Total Tier-I Tier-II Total
(1) (2) (3) (4) (5) (6) (7) (8) (9) (10) (11) (12)
SBI and its Associates
State Bank of India 8.50 3.55 12.05 9.79 4.07 13.86 8.23 2.99 11.22 9.49 3.43 12.92
State Bank of Bikaner & Jaipur 9.09 3.72 12.81 9.76 4.00 13.76 8.85 2.96 11.81 9.11 3.05 12.16
State Bank of Hyderabad 8.79 3.60 12.39 9.62 3.94 13.56 8.88 3.00 11.88 9.25 3.11 12.36
State Bank of Mysore 8.17 3.05 11.22 9.18 3.37 12.55 8.41 2.78 11.19 8.87 2.92 11.79
State Bank of Patiala 7.54 3.25 10.79 8.60 3.70 12.30 7.15 2.77 9.92 8.02 3.10 11.12
State Bank of Travancore 7.72 3.46 11.18 9.35 4.20 13.55 6.83 2.61 9.44 8.46 3.24 11.70
Nationalised Banks $
Allahabad Bank .. .. .. 9.13 3.70 12.83 .. .. .. 8.05 2.98 11.03
Andhra Bank 8.45 3.89 12.34 9.03 4.15 13.18 8.16 3.10 11.26 8.52 3.24 11.76
Bank of Baroda .. .. .. 10.83 3.84 14.67 .. .. .. 10.13 3.17 13.30
Bank of India 8.29 3.28 11.57 8.59 3.36 11.95 8.42 2.93 11.35 8.20 2.82 11.02
Bank of Maharashtra 7.50 3.75 11.25 8.31 4.12 12.43 7.03 4.69 11.72 7.57 5.02 12.59
Canara Bank .. .. .. 10.35 3.41 13.76 .. .. .. 9.77 2.63 12.40
Central Bank of India 7.50 4.46 11.96 7.79 4.61 12.40 7.95 3.38 11.33 8.09 3.40 11.49
Corporation Bank 7.65 4.29 11.94 8.33 4.67 13.00 7.69 3.69 11.38 8.33 4.00 12.33
Dena Bank .. .. .. 8.86 2.65 11.51 .. .. .. 7.26 3.77 11.03
IDBI Bank Ltd. 7.37 5.47 12.84 8.38 6.20 14.58 7.06 5.03 12.09 7.68 5.45 13.13
Indian Bank 10.47 2.20 12.67 11.13 2.34 13.47 9.64 1.95 11.59 10.88 2.20 13.08
Indian Overseas Bank 7.49 4.46 11.95 8.35 4.97 13.32 7.07 3.67 10.74 7.80 4.05 11.85
Oriental Bank of Commerce 8.78 2.23 11.01 10.12 2.57 12.69 8.20 2.55 10.75 9.18 2.86 12.04
Punjab and Sind Bank 8.26 4.55 12.81 8.55 4.71 13.26 8.25 4.46 12.71 8.38 4.53 12.91
Punjab National Bank 8.52 3.07 11.59 9.28 3.35 12.63 9.42 2.86 12.28 9.76 2.96 12.72
Syndicate Bank .. .. 10.81 8.94 3.30 12.24 .. .. 11.12 8.96 3.63 12.59
UCO Bank 7.23 3.80 11.03 8.09 4.26 12.35 7.96 4.47 12.43 9.06 5.09 14.15
Union Bank of India .. .. .. 8.37 3.48 11.85 .. .. .. 8.23 3.22 11.45
United Bank of India 7.26 3.22 10.48 8.79 3.90 12.69 7.04 2.73 9.77 8.40 3.26 11.66
Vijaya Bank 8.13 2.83 10.96 9.68 3.38 13.06 7.23 2.35 9.58 8.54 2.78 11.32
Old Private Sector Banks
Catholic Syrian Bank .. .. .. 8.83 2.25 11.08 .. .. .. 9.62 2.67 12.29
City Union Bank 10.06 0.75 10.81 11.69 0.88 12.57 10.88 0.58 11.46 13.27 0.71 13.98
Dhanlaxmi Bank 6.88 1.91 8.79 7.42 2.07 9.49 7.20 2.69 9.89 8.05 3.01 11.06
(Per cent)
CRAR (as on March 31)
Note : $ includes IDBI Bank Ltd.Source : Annual accounts of banks.Source

216
TABLE B3: BANK-WISE CAPITAL ADEQUACY RATIO (CRAR) OF SCHEDULED COMMERCIAL BANKS - 2012 AND 2013 (Contd.)
2012 2013Bank Name Basel-I Basel-II Basel-I Basel-II
Tier-I Tier-II Total Tier-I Tier-II Total Tier-I Tier-II Total Tier-I Tier-II Total
(1) (2) (3) (4) (5) (6) (7) (8) (9) (10) (11) (12)
Federal Bank 12.74 1.09 13.83 15.86 0.78 16.64 12.13 0.96 13.09 14.09 0.64 14.73
ING Vysya Bank .. .. .. 11.23 2.77 14.00 .. .. .. 10.49 2.75 13.24
Jammu & Kashmir Bank 10.43 2.10 12.53 11.12 2.24 13.36 10.44 1.90 12.34 10.86 1.97 12.83
Karnataka Bank .. .. .. 10.86 1.98 12.84 .. .. .. 10.51 2.71 13.22
Karur Vysya Bank .. .. 11.64 13.12 1.21 14.33 .. .. .. 13.10 1.31 14.41
Lakshmi Vilas Bank 8.17 3.91 12.08 8.86 4.24 13.10 7.75 2.68 10.43 9.15 3.17 12.32
Nainital Bank 13.79 0.44 14.23 14.62 0.47 15.09 13.90 0.44 14.34 13.99 0.44 14.43
Ratnakar Bank 22.33 0.36 22.69 22.83 0.37 23.20 16.13 0.29 16.42 16.82 0.29 17.11
South Indian Bank 9.60 2.04 11.64 11.54 2.46 14.00 9.94 1.52 11.46 12.05 1.86 13.91
Tamilnad Mercantile Bank 12.13 0.62 12.75 13.98 0.71 14.69 12.94 0.61 13.55 14.33 0.68 15.01
New Private Sector Banks
Axis Bank .. .. .. 9.45 4.21 13.66 .. .. .. 12.23 4.77 17.00
Development Credit Bank 13.27 1.53 14.80 13.81 1.60 15.41 12.14 0.95 13.09 12.62 0.99 13.61
HDFC Bank 11.04 4.67 15.71 11.60 4.92 16.52 10.51 5.43 15.94 11.08 5.72 16.80
ICICI Bank 11.09 5.17 16.26 12.68 5.84 18.52 11.50 5.40 16.90 12.80 5.94 18.74
IndusInd Bank .. .. .. 11.37 2.48 13.85 .. .. 13.00 13.78 1.58 15.36
Kotak Mahindra Bank 14.84 1.67 16.51 15.74 1.78 17.52 13.90 1.26 15.16 14.71 1.34 16.05
Yes Bank .. .. .. 9.90 8.00 17.90 .. .. .. 9.50 8.80 18.30
Foreign Banks
AB Bank 46.27 1.05 47.32 33.60 0.76 34.36 37.84 0.32 38.16 18.94 0.16 19.10
Abu Dhabi Commercial Bank .. .. .. 80.00 0.88 80.88 .. .. .. 65.91 0.91 66.82
American Express Banking Corp. .. .. .. 18.70 0.60 19.30 .. .. .. 17.61 0.56 18.17
Antwerp Diamond Bank 20.71 9.64 30.35 17.47 8.13 25.60 26.41 10.93 37.34 23.14 9.58 32.72
Australia and New Zealand Banking Group 28.20 0.37 28.57 25.17 0.33 25.50 27.72 0.40 28.12 26.02 0.37 26.39
Bank Internasional Indonesia 457.82 .. 457.82 .. .. .. 439.31 .. 439.31 .. .. ..
Bank of America 18.71 0.41 19.12 17.21 0.38 17.59 19.53 0.42 19.95 18.02 0.38 18.40
Bank of Bahrain & Kuwait .. .. .. 38.18 0.42 38.60 .. .. .. 34.25 0.45 34.70
Bank of Ceylon .. .. .. 95.31 1.27 96.58 .. .. .. 70.20 1.25 71.45
Bank of Nova Scotia 16.44 7.56 24.00 10.23 4.70 14.93 16.40 5.00 21.40 9.16 2.79 11.95
Bank of Tokyo-Mitsubishi UFJ .. .. .. 44.83 6.77 51.60 .. .. .. 33.76 10.77 44.53
BNP Paribas 11.91 3.87 15.78 11.09 3.61 14.70 12.43 3.27 15.70 10.94 2.88 13.82
Barclays Bank .. .. .. 14.45 0.54 14.99 .. .. .. 18.44 0.65 19.09
(Per cent)CRAR (as on March 31)
: Annual accounts of banks.SourceSource

217
TABLE B3: BANK-WISE CAPITAL ADEQUACY RATIO (CRAR) OF SCHEDULED COMMERCIAL BANKS - 2012 AND 2013 (Concld.)
2012 2013Bank Name Basel-I Basel-II Basel-I Basel-II
Tier-I Tier-II Total Tier-I Tier-II Total Tier-I Tier-II Total Tier-I Tier-II Total
(1) (2) (3) (4) (5) (6) (7) (8) (9) (10) (11) (12)
Chinatrust Commercial Bank 53.05 0.52 53.57 44.34 0.44 44.78 40.26 0.45 40.71 34.74 0.38 35.12
Citibank .. .. 16.58 15.15 0.88 16.03 .. .. 16.10 14.81 1.09 15.90
Commonwealth Bank of Australia 86.76 0.21 86.97 78.10 0.19 78.29 68.68 0.33 69.01 63.47 0.30 63.77
Credit Agricole .. .. 17.82 10.48 3.86 14.34 .. .. 21.94 13.06 4.21 17.27
Credit Suisse AG 157.65 0.71 158.36 117.49 0.53 118.02 65.39 0.47 65.86 59.64 0.43 60.07
DBS Bank 8.43 4.58 13.01 9.32 5.06 14.38 8.57 3.47 12.04 9.25 3.74 12.99
Deutsche Bank .. .. 15.10 13.27 0.85 14.12 .. .. 15.33 13.39 0.69 14.08
FirstRand Bank .. .. .. 61.22 0.25 61.47 .. .. .. 47.50 0.34 47.84
Hongkong & Shanghai Banking Corporation .. .. .. 14.83 1.21 16.04 .. .. .. 15.70 1.40 17.10
HSBC Bank Oman S.A.O.G .. .. .. 37.23 14.78 52.01 .. .. .. 44.49 11.27 55.76
Industrial and Commercial Bank of China 240.92 0.09 241.01 240.92 0.09 241.01 80.31 0.23 80.54 69.24 0.19 69.43
JPMorgan Chase Bank .. .. .. 23.41 0.55 23.96 .. .. .. 26.32 0.57 26.89
JSC VTB Bank .. .. .. 86.52 0.44 86.96 .. .. .. 65.97 0.48 66.45
Krung Thai Bank 76.42 5.19 81.61 61.32 1.25 62.57 58.40 4.26 62.66 53.32 1.25 54.57
Mashreqbank .. .. .. 54.81 0.56 55.37 .. .. .. 49.20 0.42 49.62
Mizuho Corporate Bank 66.63 0.37 67.00 59.94 0.33 60.27 .. .. .. 47.68 0.43 48.11
National Australia Bank .. .. .. 423.74 .. 423.74 .. .. .. 95.57 0.51 96.08
Rabobank International 116.92 0.37 117.29 123.47 0.39 123.86 65.49 0.34 65.83 69.97 0.37 70.34
Royal Bank of Scotland .. .. .. 9.38 3.08 12.46 .. .. .. 10.99 3.51 14.50
Sberbank .. .. .. 329.86 0.00 329.86 .. .. .. 193.98 .. 193.98
Shinhan Bank 55.73 1.25 56.98 39.35 0.91 40.26 47.82 1.25 49.07 33.52 0.96 34.48
Societe Generale 39.69 0.88 40.57 35.82 0.79 36.61 30.17 0.90 31.07 28.50 0.85 29.35
Sonali Bank .. .. .. 16.50 0.31 16.81 .. .. .. 12.69 0.22 12.91
Standard Chartered Bank 9.48 3.33 12.81 8.19 2.86 11.05 12.88 3.17 16.05 10.45 2.55 13.00
State Bank of Mauritius 35.06 1.43 36.49 37.52 1.50 39.02 52.14 1.28 53.42 53.71 1.30 55.01
Sumitomo Mitsui Banking Corporation .. .. .. .. .. .. .. .. .. 625.69 .. 625.69
UBS AG 49.70 0.13 49.83 53.61 0.14 53.75 48.71 0.31 49.02 52.53 0.33 52.86
United Overseas Bank .. .. .. 205.80 .. 205.80 .. .. .. 154.60 0.16 154.76
Westpac Banking Corporation .. .. .. .. .. .. .. .. .. 280.02 0.04 280.06
Woori Bank .. .. .. 421.70 .. 421.70 .. .. .. 163.28 .. 163.28
(Per cent)CRAR (as on March 31)
: Annual accounts of banks.SourceSource

218
TABLE B4 : PROVISIONS AND CONTINGENCIES OF SCHEDULED COMMERCIAL BANKS - 2013(Amount in ` Million)
Provisions and Contingencies as on March 31
Bank NameTaxation NPA Investments Others Total
(1) (2) (3) (4) (5)
SBI and its Associates
State Bank of India 58459 106570 -9613 14352 169767
State Bank of Bikaner & Jaipur 2507 5617 76 1627 9826
State Bank of Hyderabad 2625 10416 -183 2524 15382
State Bank of Mysore 2790 4128 360 1872 9149
State Bank of Patiala 3180 2479 -380 4246 9526
State Bank of Travancore 2807 2881 120 1552 7360
Nationalised Banks
Allahabad Bank 3675 14812 -1758 5271 22000
Andhra Bank 4819 6151 974 2837 14781
Bank of Baroda 3505 30670 2255 8755 45184
Bank of India 2584 37266 767 6475 47092
Bank of Maharashtra 5836 5857 - 2199 13892
Canara Bank 8000 18610 -3713 7282 30179
Central Bank of India 3050 13580 -1620 6570 21580
Corporation Bank 2509 9281 -53 4285 16023
Dena Bank 2220 3733 532 2799 9285
IDBI Bank Ltd. 7397 16129 1454 10781 35762
Indian Bank 2451 9530 252 2570 14802
Indian Overseas Bank 1803 21988 1751 6956 32498
Oriental Bank of Commerce 2081 15824 -757 6478 23627
Punjab and Sind Bank 1475 3064 -182 1640 5996
Punjab National Bank 17741 33364 1036 9456 61597
Syndicate Bank -4410 11354 -258 7765 14452
UCO Bank 3792 17890 -1208 6915 27389
Union Bank of India 9063 15555 1975 7655 34248
United Bank of India -104 10105 275 6304 16580
Vijaya Bank -91 4284 -484 1655 5364
Old Private Sector Banks
Catholic Syrian Bank 92 392 13 196 693
City Union Bank 810 970 3 232 2014
Dhanlaxmi Bank -259 740 35 -28 488
Federal Bank 3556 1940 -415 1133 6214
Source : Annual accounts of Banks.Source

219
TABLE B4 : PROVISIONS AND CONTINGENCIES OF SCHEDULED COMMERCIAL BANKS - 2013(Amount in ` Million)
(Contd.)
Provisions and Contingencies as on March 31
Bank NameTaxation NPA Investments Others Total
(1) (2) (3) (4) (5)
ING Vysya Bank 2885 843 87 -18 3797
Jammu & Kashmir Bank 4715 1893 149 799 7557
Karnataka Bank 1161 1723 -314 303 2873
Karur Vysya Bank 1751 - -413 1647 2985
Lakshmi Vilas Bank 462 645 92 396 1596
Nainital Bank 252 247 - -42 458
Ratnakar Bank 416 121 3 102 642
South Indian Bank 1536 1319 112 496 3463
Tamilnad Mercantile Bank 1971 382 33 109 2494
New Private Sector Banks
Axis Bank 23736 11792 -1039 6748 41237
Development Credit Bank 0 164 -4 80 241
HDFC Bank 30249 12864 - 3900 47013
ICICI Bank 30712 13948 1262 2815 48738
IndusInd Bank 5152 2196 13 422 7783
Kotak Mahindra Bank 6113 1634 -211 422 7959
Yes Bank 6251 1455 -30 734 8410
Foreign Banks
AB Bank 56 - - 2 58
Abu Dhabi Commercial Bank 146 -31 -3 10 121
American Express Banking Corp. -153 68 - 498 414
Antwerp Diamond Bank 114 174 - -7 281
Australia and New Zealand Banking Group 48 281 0 75 404
Bank Internasional Indonesia -1 - - - -1
Bank of America 3418 - -63 1 3355
Bank of Bahrain & Kuwait 83 188 -9 3 265
Bank of Ceylon 40 0 - 7 46
Bank of Nova Scotia 1950 229 - -32 2147
Bank of Tokyo-Mitsubishi UFJ 2767 5 -86 -24 2662
Barclays Bank 912 -148 - 1481 2245
BNP Paribas 2051 15 -434 -4 1629
Chinatrust Commercial Bank 60 183 -1 0 242
Citibank 18704 3882 -5582 -1384 15621
Source : Annual accounts of Banks.Source

220
TABLE B4 : PROVISIONS AND CONTINGENCIES OF SCHEDULED COMMERCIAL BANKS - 2013(Amount in ` Million)
(Concld.)
Provisions and Contingencies as on March 31
Bank NameTaxation NPA Investments Others Total
(1) (2) (3) (4) (5)
Commonwealth Bank of Australia - - - 3 3
Credit Agricole 1067 - -134 -413 520
Credit Suisse AG 651 - - 38 689
DBS Bank 2080 1692 -125 107 3754
Deutsche Bank 7773 23 103 -11 7887
FirstRand Bank 37 220 - 7 264
Hongkong & Shanghai Banking Corporation 14935 1333 -2838 134 13564
HSBC Bank Oman S.A.O.G 81 - - -31 50
Industrial and Commercial Bank of China 129 - - 12 141
JPMorgan Chase Bank 4763 -25 -7 54 4785
JSC VTB Bank 21 - - 6 27
Krung Thai Bank 29 - - - 29
Mashreqbank 80 - -1 -2 77
Mizuho Corporate Bank 1656 313 -1 132 2100
National Australia Bank - - - 8 8
Rabobank International 121 - - 13 133
Royal Bank of Scotland 1972 -101 -14 692 2550
Sberbank - - - 1 1
Shinhan Bank 356 - - 85 442
Societe Generale 280 -4 -75 23 224
Sonali Bank 17 5 - - 23
Standard Chartered Bank 17062 2138 356 15 19572
State Bank of Mauritius 257 38 1 83 380
Sumitomo Mitsui Banking Corporation 9 - - - 9
UBS AG 618 - -14 66 670
United Overseas Bank 5 - - 2 7
Westpac Banking Corporation 86 - - 1 87
Woori Bank 16 - - 3 19
Source : Annual accounts of Banks.
Source
(Contd.)

221
TABLE B5 : CONTINGENT LIABILITIES OF SCHEDULED COMMERCIAL BANKS - 2012 AND 2013 AS ON MARCH 31
Bank Name
Liability on account ofoutstanding forwardexchange contacts *
Guarantees given on behalf of constituents
Bank Name In India Outside India
2012 2013 2012 2013 2012 2013
(1) (2) (3) (4) (5) (6)
SBI and its Associates SBI and its Associates
State Bank of India 4049157 4719132 868533 954283 840726 774816 State Bank of India
State Bank of Bikaner & Jaipur 68072 128174 24034 32167 - - State Bank of Bikaner & Jaipur
State Bank of Hyderabad 205650 285912 62917 73065 4302 6124 State Bank of Hyderabad
State Bank of Mysore 112637 102053 18751 18820 2561 5054 State Bank of Mysore
State Bank of Patiala 77335 254993 52833 62746 2354 16734 State Bank of Patiala
State Bank of Travancore 136605 109210 36037 38582 186 6976 State Bank of Travancore
Total 4649456 5599474 1063105 1179663 850129 809704 Total
Nationalised Banks Nationalised Banks
Allahabad Bank 458577 332722 72042 88774 8662 19925 Allahabad Bank
Andhra Bank 202867 90915 103786 103183 - - Andhra Bank
Bank of Baroda 930319 1360247 137659 142715 99797 141811 Bank of Baroda
Bank of India 1280015 1628299 165682 167396 112338 128253 Bank of India
Bank of Maharashtra 98652 136289 48348 56566 7406 11772 Bank of Maharashtra
Canara Bank 1387060 1962491 233012 234578 332 394 Canara Bank
Central Bank of India 416475 357697 70631 92484 5519 8313 Central Bank of India
Corporation Bank 256782 219220 111197 114850 12577 13800 Corporation Bank
Dena Bank 309659 413485 34873 44352 - - Dena Bank
IDBI Bank Ltd. 641054 897416 538366 589176 38454 47460 IDBI Bank Ltd.
Indian Bank 331925 204345 92449 103291 1326 1338 Indian Bank
Indian Overseas Bank 211167 241786 140481 174235 7464 9676 Indian Overseas Bank
Oriental Bank of Commerce 381389 495288 137396 141236 7744 13393 Oriental Bank of Commerce
Punjab and Sind Bank 75740 50456 18097 22682 - - Punjab and Sind Bank
Punjab National Bank 1298151 1383480 242085 251737 180556 153991 Punjab National Bank
Syndicate Bank 370594 569525 83610 98179 8 3 Syndicate Bank
UCO Bank 305507 475715 76877 106224 1874 1570 UCO Bank
Union Bank of India 2037783 2844077 145398 179986 2088 4614 Union Bank of India
United Bank of India 56844 71805 29860 38154 5629 1248 United Bank of India
Vijaya Bank 85518 73446 45000 49662 - - Vijaya Bank
Total 11136077 13808704 2526848 2799457 491773 557561 Total
(Amount in ` Million)
Source : Annual accounts of banks.
Source

222
TABLE B5 : CONTINGENT LIABILITIES OF SCHEDULED COMMERCIAL BANKS - 2012 AND 2013 AS ON MARCH 31 (Contd.)
Bank Name
Acceptances,endorsements andother obligations
Others @ Total
2012 2013 2012 2013 2012 2013
(7) (8) (9) (10) (11) (12)
SBI and its Associates
State Bank of India 1345406 1266726 1222231 1548833 8326053 9263789
State Bank of Bikaner & Jaipur 30004 38945 5098 6765 127209 206051
State Bank of Hyderabad 87251 73127 5237 6406 365356 444634
State Bank of Mysore 34564 31053 11185 13720 179698 170699
State Bank of Patiala 62164 54470 2466 1943 197152 390886
State Bank of Travancore 49072 48296 3806 4969 225706 208033
Total 1608462 1512617 1250023 1582635 9421175 10684092
Nationalised Banks
Allahabad Bank 60661 77556 13397 11696 613339 530672
Andhra Bank 62425 55784 38734 32886 407812 282769
Bank of Baroda 179503 189959 177751 211557 1525028 2046289
Bank of India 259566 271428 93696 21492 1911297 2216868
Bank of Maharashtra 17727 27176 15756 11815 187889 243618
Canara Bank 236364 246572 71944 53040 1928712 2497075
Central Bank of India 85063 126372 16225 10324 593913 595190
Corporation Bank 128075 152906 2775 2967 511406 503743
Dena Bank 36436 45290 19144 19059 400112 522185
IDBI Bank Ltd. 259550 260278 11778 12290 1489201 1806620
Indian Bank 43513 33634 11300 20522 480513 363131
Indian Overseas Bank 165906 182555 66906 101761 591925 710012
Oriental Bank of Commerce 140821 197643 13287 20734 680638 868295
Punjab and Sind Bank 11310 4334 133 2644 105280 80117
Punjab National Bank 342678 337689 16897 15894 2080366 2142791
Syndicate Bank 34069 42523 67670 113222 555951 823453
UCO Bank 65811 65184 35203 10133 485272 658824
Union Bank of India 142911 177245 38037 40030 2366218 3245952
United Bank of India 26748 19082 895 1088 119976 131377
Vijaya Bank 18346 15946 8123 12091 156987 151145
Total 2317486 2529158 719652 725246 17191837 20420126
(Amount in ` Million)
Source : Annual accounts of banks.
Source

223
TABLE B5 : CONTINGENT LIABILITIES OF SCHEDULED COMMERCIAL BANKS - 2012 AND 2013 AS ON MARCH 31(Contd.)
Bank Name
Liability on account ofoutstanding forwardexchange contacts *
Guarantees given on behalf of constituents
Bank Name In India Outside India
2012 2013 2012 2013 2012 2013
(1) (2) (3) (4) (5) (6)
PRIVATE SECTOR BANKS PRIVATE SECTOR BANKS
Axis Bank 3892289 4610933 467506 517037 98613 111222 Axis Bank
Catholic Syrian Bank 6537 5294 2169 2496 - - Catholic Syrian Bank
City Union Bank 82832 44964 7977 9370 94 41 City Union Bank
Development Credit Bank 21343 31504 6123 6206 2038 4646 Development Credit Bank
Dhanlaxmi Bank 26650 5891 5384 3491 - - Dhanlaxmi Bank
Federal Bank 304316 245320 35336 36966 - - Federal Bank
HDFC Bank 8275155 6760074 133170 162355 436 3994 HDFC Bank
ICICI Bank 7538467 6259916 720946 717848 234069 226321 ICICI Bank
IndusInd Bank 892109 1089788 72924 193810 - - IndusInd Bank
ING Vysya Bank 1140900 1113495 54539 76139 9744 6164 ING Vysya Bank
Jammu & Kashmir Bank 94910 199623 14299 15699 273 261 Jammu & Kashmir Bank
Karnataka Bank 61874 40278 13018 15617 - - Karnataka Bank
Karur Vysya Bank 46179 63119 18632 20029 - - Karur Vysya Bank
Kotak Mahindra Bank 274343 275856 52859 68208 - - Kotak Mahindra Bank
Lakshmi Vilas Bank 21362 11857 4887 4956 789 819 Lakshmi Vilas Bank
Nainital Bank - - 456 531 - - Nainital Bank
Ratnakar Bank 103 42775 3685 6392 12 9958 Ratnakar Bank
South Indian Bank 33051 72584 15516 25339 - - South Indian Bank
Tamilnad Mercantile Bank 27089 33252 13810 17748 - - Tamilnad Mercantile Bank
Yes Bank 1395695 2208068 91830 118378 - - Yes Bank
Total 24135204 23114592 1735067 2018617 346068 363425 Total
All Scheduled Commercial Banks 126348006 111390612 5943369 6710000 1921241 1982295 All Scheduled Commercial Banks
(Amount in ` Million)
Source : Annual accounts of banks.
TABLE B5 : CONTINGENT LIABILITIES OF SCHEDULED COMMERCIAL BANKS - 2012 AND 2013 AS ON MARCH 31(Contd.)
Bank Name
Liability on account ofoutstanding forwardexchange contacts *
Guarantees given on behalf of constituents
Bank Name In India Outside India
2012 2013 2012 2013 2012 2013
(1) (2) (3) (4) (5) (6)
PRIVATE SECTOR BANKS PRIVATE SECTOR BANKS
Axis Bank 3892289 4610933 467506 517037 98613 111222 Axis Bank
Catholic Syrian Bank 6537 5294 2169 2496 - - Catholic Syrian Bank
City Union Bank 82832 44964 7977 9370 94 41 City Union Bank
Development Credit Bank 21343 31504 6123 6206 2038 4646 Development Credit Bank
Dhanlaxmi Bank 26650 5891 5384 3491 - - Dhanlaxmi Bank
Federal Bank 304316 245320 35336 36966 - - Federal Bank
HDFC Bank 8275155 6760074 133170 162355 436 3994 HDFC Bank
ICICI Bank 7538467 6259916 720946 717848 234069 226321 ICICI Bank
IndusInd Bank 892109 1089788 72924 193810 - - IndusInd Bank
ING Vysya Bank 1140900 1113495 54539 76139 9744 6164 ING Vysya Bank
Jammu & Kashmir Bank 94910 199623 14299 15699 273 261 Jammu & Kashmir Bank
Karnataka Bank 61874 40278 13018 15617 - - Karnataka Bank
Karur Vysya Bank 46179 63119 18632 20029 - - Karur Vysya Bank
Kotak Mahindra Bank 274343 275856 52859 68208 - - Kotak Mahindra Bank
Lakshmi Vilas Bank 21362 11857 4887 4956 789 819 Lakshmi Vilas Bank
Nainital Bank - - 456 531 - - Nainital Bank
Ratnakar Bank 103 42775 3685 6392 12 9958 Ratnakar Bank
South Indian Bank 33051 72584 15516 25339 - - South Indian Bank
Tamilnad Mercantile Bank 27089 33252 13810 17748 - - Tamilnad Mercantile Bank
Yes Bank 1395695 2208068 91830 118378 - - Yes Bank
Total 24135204 23114592 1735067 2018617 346068 363425 Total
All Scheduled Commercial Banks 126348006 111390612 5943369 6710000 1921241 1982295 All Scheduled Commercial Banks
(Amount in ` Million)
Source : Annual accounts of banks.Source

224
TABLE B5 : CONTINGENT LIABILITIES OF SCHEDULED COMMERCIAL BANKS - 2012 AND 2013 AS ON MARCH 31(Contd.)
Bank Name
Acceptances,endorsements andother obligations
Others @ Total
2012 2013 2012 2013 2012 2013
(7) (8) (9) (10) (11) (12)
PRIVATE SECTOR BANKS
Axis Bank 302613 228016 41353 13951 4802374 5481159
Catholic Syrian Bank 850 622 207 155 9763 8567
City Union Bank 6100 6006 14 53 97017 60434
Development Credit Bank 1931 1801 1297 607 32732 44765
Dhanlaxmi Bank 1182 1027 399 400 33616 10810
Federal Bank 11885 12338 6957 7835 358494 302459
HDFC Bank 209182 220595 34985 54207 8652928 7201224
ICICI Bank 568857 621181 92313 74627 9154651 7899893
IndusInd Bank 36667 43622 30202 21809 1031903 1349029
ING Vysya Bank 17801 18886 1063 982 1224048 1215666
Jammu & Kashmir Bank 39846 105439 1333 1806 150661 322828
Karnataka Bank 6003 5812 281 287 81175 61994
Karur Vysya Bank 14631 14633 64 66 79505 97847
Kotak Mahindra Bank 45893 45570 11663 12406 384759 402040
Lakshmi Vilas Bank 8471 9297 2121 1537 37630 28468
Nainital Bank 26 29 15 6 498 566
Ratnakar Bank 700 2852 1249 1505 5749 63482
South Indian Bank 5921 7539 93 371 54581 105834
Tamilnad Mercantile Bank 5943 7500 84 121 46927 58621
Yes Bank 104494 119953 22252 31644 1614271 2478044
Total 1388996 1472718 247944 224377 27853280 27193729
All Scheduled Commercial Banks 5928334 6133738 5821814 6366421 145962765 132583066
(Amount in ` Million)
Notes : 1. * Includes all derivative products (including interest rate swaps) as admissible.2. @ includes inter alia items like (a) claims against the bank not acknowledged as debt, (b) liability for party paid investments (c) bills re-discounted and (d) letters of credit.
Source : Annual accounts of banks.Source

225
(Contd.)TABLE B5 : CONTINGENT LIABILITIES OF SCHEDULED COMMERCIAL BANKS - 2012 AND 2013 AS ON MARCH 31
Bank Name
Liability on account ofoutstanding forwardexchange contacts *
Guarantees given on behalf of constituents
In India Outside India
2012 2013 2012 2013 2012 2013
(1) (2) (3) (4) (5) (6)
Foreign BanksAB Bank - - 1 - - -
Abu Dhabi Commercial Bank 1644 2830 484 499 269 273
American Express Banking Corp. - - - - - -
Antwerp Diamond Bank 5364 7024 - - - -
Australia and New Zealand Banking Group 141831 309262 5149 7377 - -
Bank Internasional Indonesia - - - - - -
Bank of America 5428269 4217888 10286 11729 3153 10728
Bank of Bahrain & Kuwait 5114 356 311 218 515 793
Bank of Ceylon 401 325 59 86 - -
Bank of Nova Scotia 191491 296778 7744 11690 6359 8388
Bank of Tokyo-Mitsubishi UFJ 377468 459969 7560 9005 - -
Barclays Bank 6763914 4833867 5929 5016 3069 1400
BNP Paribas 985678 2239013 10865 10305 35789 39426
Chinatrust Commercial Bank - 68 763 1168 91 171
Citibank 11264193 9576328 104177 94525 22825 33370
Commonwealth Bank of Australia 140 912 439 98 - -
Credit Agricole 6075754 3777759 10662 14049 38323 38206
Credit Suisse AG 377724 743151 - - - -
DBS Bank 5475640 4978137 37833 37943 13168 10385
Deutsche Bank 9675222 6640449 62353 73135 15361 16411
FirstRand Bank 27949 50054 3586 3492 - -
Hongkong & Shanghai Banking Corporation 9746404 9338880 143510 213400 19957 28026
HSBC Bank Oman S.A.O.G 1551 384 174 159 - -
Industrial and Commercial Bank of China - 1086 393 2016 - -
JPMorgan Chase Bank 8194684 5798775 3437 7866 15034 10436
JSC VTB Bank 30 1306 546 555 - -
Krung Thai Bank 18 17 1 98 - -
Mashreqbank 277 177 - - 72 227
Mizuho Corporate Bank 65892 66861 8635 9519 - -
National Australia Bank - - - - - -
Rabobank International 16389 29063 4 401 - -
Royal Bank of Scotland 2081053 1646764 44826 50967 9251 4777
Sberbank - - - - - -
Shinhan Bank - 332 6044 6709 - -
Societe Generale 732374 844742 7079 11916 - -
Sonali Bank - - 517 601 3 1
Standard Chartered Bank 16404493 11597231 134882 127562 49988 48488
State Bank of Mauritius 14872 17252 99 155 17 70
Sumitomo Mitsui Banking Corporation - 5 - - - -
UBS AG 2371435 1386158 - - - -
United Overseas Bank - - - - 26 30
Westpac Banking Corporation - 4641 - - - -
Woori Bank - - - 5 - -
Total 86427269 68867843 618348 712263 233272 251605
Source : Annual accounts of banks.
(Amount in ` Million)
Source

226
(Concld.)TABLE B5 : CONTINGENT LIABILITIES OF SCHEDULED COMMERCIAL BANKS - 2012 AND 2013 AS ON MARCH 31
Bank Name
Acceptances,endorsements andother obligations
Others @ Total
2013 2012 2013 2012 2013 2012 2013
(6) (7) (8) (9) (10) (11) (12)
Foreign Banks- AB Bank 67 218 87 1422 156 1639
273 Abu Dhabi Commercial Bank 56 80 274 253 2728 3935
- American Express Banking Corp. - - 59 43 59 43
- Antwerp Diamond Bank - - 10 27 5374 7051
- Australia and New Zealand Banking Group 716 7272 - - 147696 323911
- Bank Internasional Indonesia - 5 - - - 5
10728 Bank of America 9534 7243 12122 9442 5463364 4257030
793 Bank of Bahrain & Kuwait 377 581 78 75 6395 2023
- Bank of Ceylon 88 169 - - 548 580
8388 Bank of Nova Scotia 2016 2329 656 496 208266 319680
- Bank of Tokyo-Mitsubishi UFJ 1314 1637 2220 3260 388561 473872
1400 Barclays Bank 6548 2060 23 102 6779482 4842446
39426 BNP Paribas 2019 4690 3428091 3585863 4462442 5879297
171 Chinatrust Commercial Bank 262 470 6 9 1122 1885
33370 Citibank 124458 110701 13850 15170 11529502 9830094
- Commonwealth Bank of Australia 10 64 - - 590 1073
38206 Credit Agricole 3511 9718 10943 8246 6139194 3847978
- Credit Suisse AG - - 11 310 377735 743461
10385 DBS Bank 13269 12371 4212 39 5544122 5038874
16411 Deutsche Bank 102149 130606 52197 121800 9907283 6982401
- FirstRand Bank - - 31 467 31565 54013
28026 Hongkong & Shanghai Banking Corporation 137797 76325 49187 64876 10096856 9721507
- HSBC Bank Oman S.A.O.G 54 - 266 235 2044 778
- Industrial and Commercial Bank of China - - - 159 393 3261
10436 JPMorgan Chase Bank 3436 5168 858 990 8217448 5823235
- JSC VTB Bank 15 1307 - - 591 3168
- Krung Thai Bank 11 5 - - 30 120
227 Mashreqbank 1793 1892 105 103 2248 2399
- Mizuho Corporate Bank 874 978 - - 75401 77358
- National Australia Bank - - - 2 - 2
- Rabobank International 20 476 - - 16413 29940
4777 Royal Bank of Scotland 13106 13593 3733 3054 2151968 1719155
- Sberbank - - - - - -
- Shinhan Bank 104 123 - - 6149 7164
- Societe Generale 464 1731 1592 2201 741509 860590
1 Sonali Bank 1 11 - - 522 613
48488 Standard Chartered Bank 188202 226718 9908 14902 16787474 12014900
70 State Bank of Mauritius 1121 704 - - 16109 18180
- Sumitomo Mitsui Banking Corporation - - - - - 5
- UBS AG - - 13675 600 2385110 1386758
30 United Overseas Bank - - - - 26 30
- Westpac Banking Corporation - - - 16 - 4657
- Woori Bank - - - - - 5
251605 Total 613389 619245 3604195 3834163 91496474 74285119
Source : Annual accounts of banks.
(Amount in ` Million)
TABLE B5 : CONTINGENT LIABILITIES OF SCHEDULED COMMERCIAL BANKS - 2012 AND 2013 AS ON MARCH 31(Contd.)
Bank Name
Acceptances,endorsements andother obligations
Others @ Total
2012 2013 2012 2013 2012 2013
(7) (8) (9) (10) (11) (12)
PRIVATE SECTOR BANKS
Axis Bank 302613 228016 41353 13951 4802374 5481159
Catholic Syrian Bank 850 622 207 155 9763 8567
City Union Bank 6100 6006 14 53 97017 60434
Development Credit Bank 1931 1801 1297 607 32732 44765
Dhanlaxmi Bank 1182 1027 399 400 33616 10810
Federal Bank 11885 12338 6957 7835 358494 302459
HDFC Bank 209182 220595 34985 54207 8652928 7201224
ICICI Bank 568857 621181 92313 74627 9154651 7899893
IndusInd Bank 36667 43622 30202 21809 1031903 1349029
ING Vysya Bank 17801 18886 1063 982 1224048 1215666
Jammu & Kashmir Bank 39846 105439 1333 1806 150661 322828
Karnataka Bank 6003 5812 281 287 81175 61994
Karur Vysya Bank 14631 14633 64 66 79505 97847
Kotak Mahindra Bank 45893 45570 11663 12406 384759 402040
Lakshmi Vilas Bank 8471 9297 2121 1537 37630 28468
Nainital Bank 26 29 15 6 498 566
Ratnakar Bank 700 2852 1249 1505 5749 63482
South Indian Bank 5921 7539 93 371 54581 105834
Tamilnad Mercantile Bank 5943 7500 84 121 46927 58621
Yes Bank 104494 119953 22252 31644 1614271 2478044
Total 1388996 1472718 247944 224377 27853280 27193729
All Scheduled Commercial Banks 5928334 6133738 5821814 6366421 145962765 132583066
(Amount in ` Million)
Notes : 1. * Includes all derivative products (including interest rate swaps) as admissible.2. @ includes inter alia items like (a) claims against the bank not acknowledged as debt, (b) liability for party paid investments (c) bills re-discounted and (d) letters of credit.
Source : Annual accounts of banks.Source

227
TABLE B6: MOVEMENT OF NON-PERFORMING ASSETS (NPAs) OF
(Amount in ` Million)SCHEDULED COMMERCIAL BANKS - 2012 AND 2013
Bank Name
Gross NPAs Net NPAsAs on
March 31,2012
Additionduring the
year
Reductionduring the
year
Write-offduring the
year
As onMarch 31,
2013
As onMarch 31,
2012
As onMarch 31,
2013
(1) (2) (3) (4) (5) (6) (7)
SBI and its Associates
State Bank of India 396765 319934 148857 55948 511894 158189 219565
State Bank of Bikaner & Jaipur 16515 16279 6966 4633 21195 9454 13041
State Bank of Hyderabad 20074 28168 16381 - 31860 10020 14487
State Bank of Mysore 15026 16584 10804 - 20806 7684 12088
State Bank of Patiala 18878 20338 14685 - 24530 8484 11942
State Bank of Travancore 14888 24066 21454 - 17499 8536 9886
Nationalised Banks
Allahabad Bank 20590 58919 28139 - 51370 10917 41268
Andhra Bank 17980 27417 8252 - 37145 7559 24092
Bank of Baroda 44648 68438 33260 - 79826 15436 41920
Bank of India 64709 75781 47394 - 93095 38425 60326
Bank of Maharashtra 12970 8076 9670 - 11376 4696 3929
Canara Bank 40318 58193 35909 - 62602 33863 52781
Central Bank of India 72730 51250 39420 - 84560 46000 49880
Corporation Bank 12742 17973 10233 - 20482 8694 14109
Dena Bank 9565 11198 6238 - 14525 5717 9172
IDBI Bank Ltd. 45514 27397 8411 - 64500 29109 31004
Indian Bank 18508 28925 11778 - 35655 11968 23843
Indian Overseas Bank 39201 56006 29127 - 66080 19074 40272
Oriental Bank of Commerce 35805 32133 26098 - 41840 24590 29027
Punjab and Sind Bank 7634 10936 3201 - 15369 5476 11104
Punjab National Bank 87196 86470 39009 - 134658 44542 72365
Syndicate Bank 31827 21420 23462 - 29785 11854 11248
UCO Bank 40862 51616 15005 6172 71301 22639 40693
Union Bank of India 54499 39738 19809 11288 63138 30250 33534
United Bank of India 21764 24848 16974 - 29638 10756 19700
Vijaya Bank 17185 16014 17869 - 15329 9980 9097
Old Private Sector Banks
Catholic Syrian Bank 1829 1713 1434 - 2109 842 993
City Union Bank 1235 2234 1739 - 1731 540 964
Dhanlaxmi Bank 1043 5048 2288 - 3803 580 2610
Source : Annual accounts of Banks.Source

228
TABLE B6: MOVEMENT OF NON-PERFORMING ASSETS (NPAs) OF
(Amount in ` Million)(Contd.)SCHEDULED COMMERCIAL BANKS - 2012 AND 2013
Bank Name
Gross NPAs Net NPAsAs on
March 31,2012
Additionduring the
year
Reductionduring the
year
Write-offduring the
year
As onMarch 31,
2013
As onMarch 31,
2012
As onMarch 31,
2013
(1) (2) (3) (4) (5) (6) (7)
Federal Bank 13008 8070 5424 115 15540 1990 4319
ING Vysya Bank 1495 1939 1531 689 1214 525 91
Jammu & Kashmir Bank 5166 4550 2408 870 6438 493 553
Karnataka Bank 6847 4135 4593 - 6389 4352 3778
Karur Vysya Bank 3210 2005 2357 - 2859 788 1087
Lakshmi Vilas Bank 3077 4002 2480 - 4599 1771 2838
Nainital Bank 310 574 212 - 673 - -
Ratnakar Bank 331 409 481 - 259 84 69
South Indian Bank 2672 5301 3634 - 4339 765 2495
Tamilnad Mercantile Bank 1775 1854 1484 - 2145 626 1068
New Private Sector Banks
Axis Bank 18063 20234 5843 8520 23934 4726 7041
Development Credit Bank 2418 753 1021 - 2150 302 491
HDFC Bank 19994 18592 3720 11520 23346 3523 4690
ICICI Bank 94753 35871 18088 16459 96078 18608 22306
IndusInd Bank 3471 4466 1919 1440 4578 947 1368
Kotak Mahindra Bank 6142 4643 1870 1334 7581 2374 3114
Yes Bank 839 2437 1259 1074 943 175 70
Foreign Banks
AB Bank - 57 - - 57 - 44
Abu Dhabi Commercial Bank 31 0 31 - - - -
American Express Banking Corp. 234 681 469 - 446 176 319
Antwerp Diamond Bank 996 - 494 - 503 174 -
Australia and New Zealand Banking Group - 281 - - 281 - -
Bank Internasional Indonesia - - - - - - -
Bank of America 7 - 7 - - - -
Bank of Bahrain & Kuwait 277 491 245 - 523 176 234
Bank of Ceylon 15 - 0 - 15 - -
Bank of Nova Scotia 96 668 185 - 579 - 350
Bank of Tokyo-Mitsubishi UFJ 82 5 - - 87 8 8
Barclays Bank 5471 2769 2698 - 5543 1254 1473
BNP Paribas 275 - 26 86 163 41 -
Source : Annual accounts of Banks.Source

229
TABLE B6: MOVEMENT OF NON-PERFORMING ASSETS (NPAs) OF
(Amount in ` Million)(Concld.)SCHEDULED COMMERCIAL BANKS - 2012 AND 2013
Bank Name
Gross NPAs Net NPAsAs on
March 31,2012
Additionduring the
year
Reductionduring the
year
Write-offduring the
year
As onMarch 31,
2013
As onMarch 31,
2012
As onMarch 31,
2013
(1) (2) (3) (4) (5) (6) (7)
Chinatrust Commercial Bank 163 393 34 - 522 92 268
Citibank 8464 10421 5298 - 13587 4238 7667
Commonwealth Bank of Australia - - - - - - -
Credit Agricole 9 - 3 - 6 - -
Credit Suisse AG - - - - - - -
DBS Bank 2147 4236 148 415 5820 774 3290
Deutsche Bank 1348 371 175 - 1544 114 287
FirstRand Bank - 220 - - 220 - -
Hongkong & Shanghai Banking Corporation 7201 1929 2722 - 6408 2203 1190
HSBC Bank oman S.A.O.G. - - - - - - -
Industrial and Commercial Bank of China - - - - - - -
JPMorgan Chase Bank 269 - 25 - 244 - -
JSC VTB Bank - - - - - - -
Krung Thai Bank - - - - - - -
Mashreqbank - - - - - -
Mizuho Corporate Bank 63 1190 - - 1253 - 877
National Australia Bank - - - - - - -
Rabobank International - - - - - - -
Royal Bank of Scotland 3465 535 1204 - 2796 933 365
Sberbank - - - - - - -
Shinhan Bank - - - - - - -
Societe Generale 12 - 4 - 7 - -
Sonali Bank 7 9 2 - 15 2 4
Standard Chartered Bank 32122 17020 10341 - 38801 3868 10098
State Bank of Mauritius 210 166 26 - 350 71 154
Sumitomo Mitsui Banking Corporation - - - - - - -
UBS AG - - - - - - -
United Overseas Bank - - - - - - -
Westpac Banking Corporation - - - - - - -
Woori Bank - - - - - - -
Source : Annual accounts of Banks.Source

230
TABLE B7 : BANK WISE AND BANK GROUP-WISE GROSS NON-PERFORMING ASSETS, GROSS ADVANCES AND GROSS NPA RATIO OF SCHEDULED COMMERCIAL BANKS - 2013
(Amount in ` Million)
As on March 31, 2013
BanksGross NPAs Gross Advances Gross NPAs to Gross
Advances Ratio (%)
(1) (2) (3)
Public Sector Banks
State Bank of India 511894 10785571 4.75
State Bank of Bikaner and Jaipur 21195 584737 3.62
State Bank of Hyderabad 31860 920231 3.46
State Bank of Mysore 20806 459805 4.52
State Bank of Patiala 24530 754598 3.25
State Bank of Travancore 17499 683885 2.56
SBI and its Associates 627784 14188827 4.42
Allahabad Bank 51370 1309363 3.92
Andhra Bank 37145 1001378 3.71
Bank of Baroda 79826 3328113 2.40
Bank of India 87653 2929679 2.99
Bank of Maharashtra 11376 763972 1.49
Canara Bank 62602 2439358 2.57
Central Bank of India 84562 1762337 4.80
Corporation Bank 20482 1193540 1.72
Dena Bank 14525 664569 2.19
IDBI Bank Limited 64500 2001347 3.22
Indian Bank 35655 1071559 3.33
Indian Overseas Bank 66080 1643665 4.02
Oriental Bank of Commerce 41840 1301862 3.21
Punjab and Sind Bank 15369 518434 2.96
Punjab National Bank 134658 3152440 4.27
Syndicate Bank 29785 1494227 1.99
UCO Bank 71301 1315691 5.42
Union Bank of India 63138 2119111 2.98
United Bank of India 29638 697081 4.25
Vijaya Bank 15329 705135 2.17
Nationalised Banks $ 1016834 31412861 3.24
Public Sector Banks 1644618 45601688 3.61
Notes : $ Includes IDBI Bank Ltd.
Source :Department of Banking Supervision, RBI.Source

231
TABLE B7 : BANK WISE AND BANK GROUP-WISE GROSS NON-PERFORMING ASSETS, GROSS ADVANCES AND GROSS NPA RATIO OF SCHEDULED COMMERCIAL BANKS - 2013
(Amount in ` Million)
As on March 31, 2013
(Contd.)
Banks Gross NPAs Gross Advances Gross NPAs to GrossAdvances Ratio (%)
(1) (2) (3)
Private Sector Banks
Catholic Syrian Bank 2109 89760 2.35
City Union Bank 1731 153429 1.13
Dhanalakshmi Bank 3803 78963 4.82
Federal Bank 15540 451946 3.44
ING Vysya Bank 1214 318916 0.38
Jammu & Kashmir Bank 6438 398537 1.62
Karnataka Bank 6389 254165 2.51
Karur Vysya Bank 2859 297059 0.96
Lakshmi Vilas Bank 4599 118923 3.87
Nainital Bank 673 21746 3.09
Ratnakar Bank 259 63952 0.40
South Indian Bank 4339 320140 1.36
Tamilnad Mercantile Bank 2145 163661 1.31
Old Private Sector Banks 52098 2731197 1.91
Axis Bank 23714 1989007 1.19
Development Credit Bank 2150 67530 3.18
HDFC Bank 20481 2413061 0.85
ICICI Bank 96078 2984164 3.22
Indusind Bank 4578 446416 1.03
Kotak Mahindra Bank 7581 489186 1.55
Yes Bank 943 470869 0.20
New Private Sector Banks 155525 8860233 1.76
Private Sector Banks 207623 11591430 1.79
Source : Department of Banking Supervision, RBI.Source

232
TABLE B7 : BANK WISE AND BANK GROUP-WISE GROSS NON-PERFORMING ASSETS, GROSS ADVANCES AND GROSS NPA RATIO OF SCHEDULED COMMERCIAL BANKS - 2013
(Amount in ` Million)
As on March 31, 2013
(Concld.)
Banks Gross NPAs Gross Advances Gross NPAs to GrossAdvances Ratio (%)
(1) (2) (3)
Foreign Banks
Ab Bank Limited 57 638 8.93Abu Dhabi Commercial Bank Ltd - 5199 -American Express Banking Corp. 446 17230 2.59Antwerp Diamond Bank Nv 503 8106 6.21Australia and New Zealand Banking Group Limited 281 24048 1.17BNP Paribas 163 77536 0.21Bank of America N.t. and S.a. - 76230 -Bank of Bahrain & Kuwait B.s.c. 523 7215 7.25Bank of Ceylon 15 1014 1.48Bank of Nova Scotia 579 77890 0.74Barclays Bank 5543 88793 6.24Chinatrust Commercial Bank 522 3019 17.29Citibank N.a 13587 526288 2.58Commonwealth Bank of Australia - 1652 -Credit Agricole 6 24048 0.02Credit Suisse Ag - 4550 -DBS Bank Ltd. 5820 141111 4.12Deutsche Bank 1544 224999 0.69Firstrand Bank Ltd 237 2831 8.37Hongkong and Shanghai Banking Corpn.ltd. 6408 362305 1.77HSBC Bank Oman S.A.O.G. - 51 -Industrial and Commercial Bank of China - 3372 -JP Morgan Chase Bank 244 53689 0.45JSC VTB Bank - 885 -Krung Thai Bank Public Company Limited - 160 -Mashreq Bank Psc - 547 -Mizuho Corporate Bank Ltd 1253 55565 2.26National Australia Bank - 1636 -Rabobank International - 5899 -Sberbank - 370 -Shinhan Bank - 12062 -Societe Generale 7 17576 0.04Sonali Bank 15 199 7.54Standard Chartered Bank 38801 648317 5.98State Bank of Mauritius Ltd 350 8380 4.18The Bank of Tokyo-mitsubishi Ufj Ltd - 68395 -The Royal Bank of Scotland N.v. 2796 127770 2.19UBS AG - 9741 -United Overseas Bank Ltd - 358 -
Foreign Banks 79700 2689674 2.96
All Scheduled Commercial Banks 1931941 59882792 3.23
Source : Department of Banking Supervision, RBI.Source

233
TABLE B8 : APPROPRIATION OF PROFIT OF SCHEDULED COMMERCIALBANKS - 2011 - 12 AND 2012 - 13
(Amount in ` Million)
AS ON MARCH 31
Name of the BankNet profit for the year Profit brought forward Profit available for
appropriationTransfer to statutory
reserves
2012 2013 2012 2013 2012 2013 2012 2013(1) (2) (3) (4) (5) (6) (7) (8)
SBI and its Associates
State Bank of India 117073 141050 61 3 117133 141053 35170 44179
State Bank of Bikaner & Jaipur 6520 7302 - - 6520 7302 1956 2191
State Bank of Hyderabad 12983 12502 - - 12983 12502 3895 3753
State Bank of Mysore 3691 4161 - - 3691 4161 923 1040
State Bank of Patiala 7964 6668 - - 7964 6668 1991 1667
State Bank of Travancore 5105 6150 34 69 5139 6219 1276 1538
Total 153336 177833 95 72 153431 177905 45211 54367
Nationalised Banks
Allahabad Bank 18668 11852 1064 1839 19732 13691 4700 2970
Andhra Bank 13447 12891 2927 991 16374 13882 3362 3223
Bank of Baroda 50070 44807 - - 50070 44807 12517 11202
Bank of India 26775 27493 - - 26775 27493 6694 6873
Bank of Maharashtra 4308 7595 3654 4454 7963 12049 1077 1899
Canara Bank 32827 28721 - - 32827 28721 8250 7200
Central Bank of India 5330 10150 15 15 5345 10164 1333 2537
Corporation Bank 15060 14347 - - 15060 14347 3850 3587
Dena Bank 8031 8104 - - 8031 8104 2409 2431
IDBI Bank Ltd. 20316 18821 6150 6726 26466 25547 5079 4708
Indian Bank 17470 15811 887 892 18357 16703 4368 3960
Indian Overseas Bank 10501 5672 - - 10501 5672 3160 1419
Oriental Bank of Commerce 11416 13279 8 5 11424 13284 2860 3320
Punjab and Sind Bank 4513 3392 11729 14225 16242 17617 1130 850
Punjab National Bank 48842 47477 - - 48842 47477 12211 11869
Syndicate Bank 13134 20044 - - 13134 20044 3283 5011
UCO Bank 11087 6182 16852 21111 27938 27293 2772 1545
Union Bank of India 17871 21579 2 6 17873 21585 5370 6480
United Bank of India 6325 3919 - - 6325 3919 1581 980
Vijaya Bank 5810 5856 8670 9350 14480 15206 1452 1464
Total 341802 327994 51958 59612 393760 387606 87458 83529
Public Sector Banks 495138 505827 52052 59684 547191 565512 132669 137896
Source : Annual accounts of banks.Source
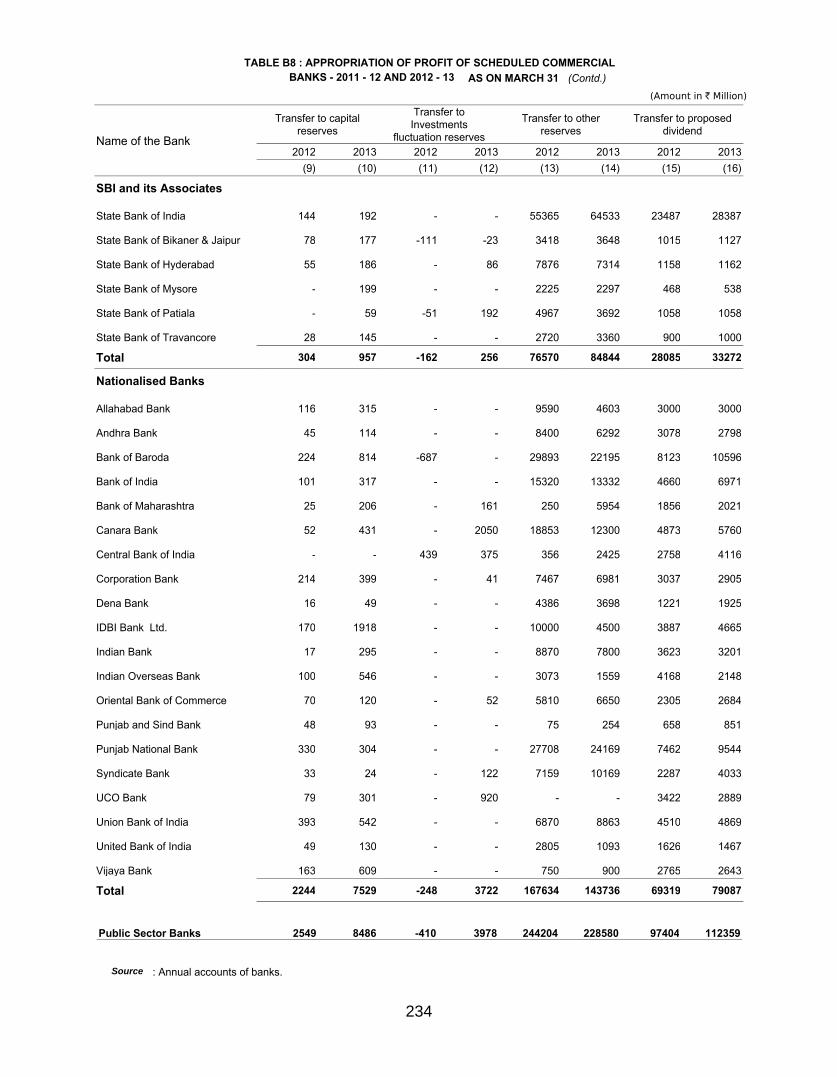
234
TABLE B8 : APPROPRIATION OF PROFIT OF SCHEDULED COMMERCIALBANKS - 2011 - 12 AND 2012 - 13 (Contd.)
(Amount in ` Million)
AS ON MARCH 31
Name of the Bank
Transfer to capitalreserves
Transfer toInvestments
fluctuation reserves
Transfer to otherreserves
Transfer to proposeddividend
2012 2013 2012 2013 2012 2013 2012 2013(9) (10) (11) (12) (13) (14) (15) (16)
SBI and its Associates
State Bank of India 144 192 - - 55365 64533 23487 28387
State Bank of Bikaner & Jaipur 78 177 -111 -23 3418 3648 1015 1127
State Bank of Hyderabad 55 186 - 86 7876 7314 1158 1162
State Bank of Mysore - 199 - - 2225 2297 468 538
State Bank of Patiala - 59 -51 192 4967 3692 1058 1058
State Bank of Travancore 28 145 - - 2720 3360 900 1000
Total 304 957 -162 256 76570 84844 28085 33272
Nationalised Banks
Allahabad Bank 116 315 - - 9590 4603 3000 3000
Andhra Bank 45 114 - - 8400 6292 3078 2798
Bank of Baroda 224 814 -687 - 29893 22195 8123 10596
Bank of India 101 317 - - 15320 13332 4660 6971
Bank of Maharashtra 25 206 - 161 250 5954 1856 2021
Canara Bank 52 431 - 2050 18853 12300 4873 5760
Central Bank of India - - 439 375 356 2425 2758 4116
Corporation Bank 214 399 - 41 7467 6981 3037 2905
Dena Bank 16 49 - - 4386 3698 1221 1925
IDBI Bank Ltd. 170 1918 - - 10000 4500 3887 4665
Indian Bank 17 295 - - 8870 7800 3623 3201
Indian Overseas Bank 100 546 - - 3073 1559 4168 2148
Oriental Bank of Commerce 70 120 - 52 5810 6650 2305 2684
Punjab and Sind Bank 48 93 - - 75 254 658 851
Punjab National Bank 330 304 - - 27708 24169 7462 9544
Syndicate Bank 33 24 - 122 7159 10169 2287 4033
UCO Bank 79 301 - 920 - - 3422 2889
Union Bank of India 393 542 - - 6870 8863 4510 4869
United Bank of India 49 130 - - 2805 1093 1626 1467
Vijaya Bank 163 609 - - 750 900 2765 2643
Total 2244 7529 -248 3722 167634 143736 69319 79087
Public Sector Banks 2549 8486 -410 3978 244204 228580 97404 112359
Source : Annual accounts of banks.Source

235
TABLE B8 : APPROPRIATION OF PROFIT OF SCHEDULED COMMERCIALBANKS - 2011 - 12 AND 2012 - 13 (Contd.)
(Amount in ` Million)
AS ON MARCH 31
Name of the Bank
Transfer to tax ondividend
Balance carried overto Balance sheet
2012 2013 2012 2013(17) (18) (19) (20)
SBI and its Associates
State Bank of India 2965 3760 3 3
State Bank of Bikaner & Jaipur 165 183 - -
State Bank of Hyderabad - - - -
State Bank of Mysore 76 87 - -
State Bank of Patiala - - - -
State Bank of Travancore 146 162 69 14
Total 3352 4192 72 17
Nationalised Banks
Allahabad Bank 487 510 1839 2293
Andhra Bank 499 476 991 980
Bank of Baroda - - - -
Bank of India - - - -
Bank of Maharashtra 301 344 4454 1464
Canara Bank 800 980 - -
Central Bank of India 445 695 15 16
Corporation Bank 493 434 - -
Dena Bank - - - -
IDBI Bank Ltd. 603 718 6726 9039
Indian Bank 588 544 892 902
Indian Overseas Bank - - - -
Oriental Bank of Commerce 374 456 5 2
Punjab and Sind Bank 105 138 14225 15431
Punjab National Bank 1132 1591 - -
Syndicate Bank 371 685 - -
UCO Bank 555 491 21111 21146
Union Bank of India 724 827 6 4
United Bank of India 264 249 - -
Vijaya Bank - - 9350 9590
Total 7739 9138 59612 60867
Public Sector Banks 11091 13330 59684 60884
Source : Annual accounts of banks.Source

236
TABLE B8 : APPROPRIATION OF PROFIT OF SCHEDULED COMMERCIALBANKS - 2011 - 12 AND 2012 - 13 (Contd.)
(Amount in ` Million)
AS ON MARCH 31
Name of the BankNet profit for the year Profit brought forward Profit available for
appropriationTransfer to statutory
reserves
2012 2013 2012 2013 2012 2013 2012 2013(1) (2) (3) (4) (5) (6) (7) (8)
Old Private Sector Banks
Catholic Syrian Bank 259 327 - 1 259 327 65 82
City Union Bank 2803 3220 56 66 2858 3286 710 820
Dhanlaxmi Bank -1156 26 - -1202 -1156 -1176 - -
Federal Bank 7768 8382 258 2967 8026 11348 1942 2096
ING Vysya Bank 4563 6130 5175 7654 9738 13784 1141 1532
Jammu & Kashmir Bank 8033 10551 - - 8033 10551 2008 2638
Karnataka Bank 2461 3481 - - 2461 3481 1100 1600
Karur Vysya Bank 5017 5503 199 18 5216 5521 1505 1650
Lakshmi Vilas Bank 1070 916 3 1 1074 917 280 290
Nainital Bank 612 511 - - 612 511 153 128
Ratnakar Bank 657 925 4 1 661 925 165 240
South Indian Bank 4017 5023 185 232 4201 5255 1004 1256
Tamilnad Mercantile Bank 3135 4403 10 5 3144 4408 941 1321
Total 39237 49396 5889 9742 45126 59138 11014 13652
New Private Sector Banks
Axis Bank 42422 51794 49698 73294 92120 125089 10606 12949
Development Credit Bank 551 1021 -3645 -3234 -3095 -2213 138 255
HDFC Bank 51671 67263 61742 83996 113413 151259 12918 16816
ICICI Bank 64653 83255 50182 70542 114834 153797 16170 20820
IndusInd Bank 8026 10612 7144 11876 15170 22488 2007 2653
Kotak Mahindra Bank 10851 13607 14945 21628 25796 35235 2713 3402
Yes Bank 9770 13007 11151 16584 20921 29591 2442 3252
Total 187943 240558 191216 274687 379159 515246 46993 60146
Source : Annual accounts of banks.Source

237
TABLE B8 : APPROPRIATION OF PROFIT OF SCHEDULED COMMERCIALBANKS - 2011 - 12 AND 2012 - 13 (Contd.)
(Amount in ` Million)
AS ON MARCH 31
Name of the Bank
Transfer to capitalreserves
Transfer toInvestments
fluctuation reserves
Transfer to otherreserves
Transfer to proposeddividend
2012 2013 2012 2013 2012 2013 2012 2013(9) (10) (11) (12) (13) (14) (15) (16)
Old Private Sector Banks
Catholic Syrian Bank 4 81 3 -6 132 97 47 63
City Union Bank - 19 7 3 1600 1820 408 474
Dhanlaxmi Bank 46 13 - - - - - -
Federal Bank 54 230 - - 1274 2058 1539 1540
ING Vysya Bank 4 16 2 -2 140 160 687 852
Jammu & Kashmir Bank - - - 50 4137 5028 1624 2424
Karnataka Bank - 33 - 115 595 851 659 754
Karur Vysya Bank 31 165 - 210 1918 1730 1501 1501
Lakshmi Vilas Bank 8 34 - - 388 249 341 293
Nainital Bank - - - - 286 210 149 149
Ratnakar Bank 14 20 2 - 405 485 64 152
South Indian Bank 5 62 -71 -57 2240 2530 681 938
Tamilnad Mercantile Bank - - 32 40 1720 2505 426 497
Total 168 674 -26 352 14834 17724 8126 9635
New Private Sector Banks
Axis Bank 519 1415 - 535 - 26 7701 9872
Development Credit Bank 1 23 - 4 - - - -
HDFC Bank - 858 -417 177 5167 6726 10112 13136
ICICI Bank 380 330 - - 6514 7628 19025 23075
IndusInd Bank 86 84 5 4 - - 1029 1571
Kotak Mahindra Bank - - 145 105 793 965 445 524
Yes Bank 253 349 - 97 - - 1412 2161
Total 1240 3058 -266 921 12474 15346 39723 50338
Source : Annual accounts of banks.Source

238
TABLE B8 : APPROPRIATION OF PROFIT OF SCHEDULED COMMERCIALBANKS - 2011 - 12 AND 2012 - 13 (Contd.)
(Amount in ` Million)
AS ON MARCH 31
Name of the Bank
Transfer to tax ondividend
Balance carried overto Balance sheet
2012 2013 2012 2013(17) (18) (19) (20)
Old Private Sector Banks
Catholic Syrian Bank 8 11 - -
City Union Bank 67 81 66 69
Dhanlaxmi Bank - - -1202 -1189
Federal Bank 250 262 2967 5164
ING Vysya Bank 109 138 7654 11088
Jammu & Kashmir Bank 264 412 - -
Karnataka Bank 107 128 - 1
Karur Vysya Bank 243 255 18 10
Lakshmi Vilas Bank 55 50 1 1
Nainital Bank 24 24 - -
Ratnakar Bank 10 26 1 2
South Indian Bank 110 156 232 370
Tamilnad Mercantile Bank 21 34 5 11
Total 1268 1575 9742 15527
New Private Sector Banks
Axis Bank - - 73294 100293
Development Credit Bank - - -3234 -2495
HDFC Bank 1637 2225 83996 111322
ICICI Bank 2204 2922 70542 99023
IndusInd Bank 167 267 11876 17909
Kotak Mahindra Bank 72 73 21628 30166
Yes Bank 229 349 16584 23384
Total 4309 5835 274687 379602
Source : Annual accounts of banks.Source

239
TABLE B8 : APPROPRIATION OF PROFIT OF SCHEDULED COMMERCIALBANKS - 2011 - 12 AND 2012 - 13 (Contd.)
(Amount in ` Million)
AS ON MARCH 31
Name of the Bank
Net profit for theyear
Profit broughtforward
Profit available forappropriation
Transfer to statutoryreserves
2012 2013 2012 2013 2012 2013 2012 2013(1) (2) (3) (4) (5) (6) (7) (8)
Foreign BanksAB Bank 82 80 109 169 190 249 20 12Abu Dhabi Commercial Bank 163 182 - - 163 182 41 45American Express Banking Corp. 40 -727 -1351 -1321 -1311 -2049 10 -Antwerp Diamond Bank 137 143 -136 -33 1 109 34 36Australia and New Zealand Banking Group 9 43 -129 -122 -120 -79 2 11Bank Internasional Indonesia 4 -20 -284 -281 -280 -301 1 -Bank of America 5255 4693 - 3941 5255 8634 1314 1173Bank of Bahrain & Kuwait 207 175 23 - 230 175 52 44Bank of Ceylon 77 136 398 299 475 435 19 34Bank of Nova Scotia 2469 2866 2897 4749 5366 7614 617 716Bank of Tokyo-Mitsubishi UFJ 2124 2681 1312 1593 3436 4275 531 670Barclays Bank -1830 -564 -4536 -6366 -6366 -6930 - -BNP Paribas 814 1874 2748 - 3561 1874 203 469Chinatrust Commercial Bank -1 -131 53 52 52 -80 - -Citibank 19220 27183 - - 19220 27183 4805 6796Commonwealth Bank of Australia -59 -62 -187 -247 -247 -308 - -Credit Agricole 2706 1546 156 1484 2861 3031 676 387Credit Suisse AG 891 904 -80 589 812 1493 223 226DBS Bank 3355 2885 1166 2660 4521 5546 839 721Deutsche Bank 8233 10330 5554 7572 13787 17902 2058 2583FirstRand Bank -2 -595 -462 -464 -464 -1059 - -Hongkong & Shanghai Banking Corporation 19877 19357 18616 20884 38493 40241 4969 4839HSBC Bank oman S.A.O.G. 168 249 -1348 -1238 -1180 -989 42 62Industrial and Commercial Bank of China 99 164 - - 99 164 25 41JPMorgan Chase Bank 4962 6727 3588 3748 8550 10475 1240 1682JSC VTB Bank 9 26 -29 -22 -20 4 2 7Krung Thai Bank 36 38 19 27 56 65 9 10Mashreqbank 96 116 43 115 139 232 24 29Mizuho Corporate Bank 1771 1728 548 1328 2319 3056 443 432National Australia Bank -24 -88 - -24 -24 -112 - -Rabobank International 16 122 - - 16 122 4 30Royal Bank of Scotland 4798 2226 - - 4798 2226 1199 556Sberbank -13 -16 -5 -19 -19 -35 - -Shinhan Bank 439 440 - - 439 440 439 440Societe Generale 319 369 199 262 518 631 80 92Sonali Bank 10 19 16 23 26 41 3 5Standard Chartered Bank 17358 29602 14758 12113 32116 41715 4339 7401State Bank of Mauritius 112 331 59 143 171 474 28 83Sumitomo Mitsui Banking Corporation - -163 - - - -163 - -UBS AG 312 868 234 478 547 1345 78 217United Overseas Bank 16 20 -56 -44 -40 -24 4 5Westpac Banking Corporation - 84 - - - 84 - 21Woori Bank 9 22 - 6 9 29 2 6
Total 94264 115865 43892 52055 138157 167920 24379 29880All Scheduled Commercial Banks 816583 911647 293049 396169 1109632 1307816 215054 241573
Source : Annual accounts of banks.Source

240
TABLE B8 : APPROPRIATION OF PROFIT OF SCHEDULED COMMERCIALBANKS - 2011 - 12 AND 2012 - 13 (Contd.)
(Amount in ` Million)
AS ON MARCH 31
Name of the Bank
Transfer to capitalreserves
Transfer toInvestments
fluctuation reserves
Transfer to otherreserves
Transfer toproposed dividend
2012 2013 2012 2013 2012 2013 2012 2013(9) (10) (11) (12) (13) (14) (15) (16)
Foreign BanksAB Bank - - 1 - - - - -Abu Dhabi Commercial Bank - - - 1 122 135 - -American Express Banking Corp. - - - - - - - -Antwerp Diamond Bank - - - - - 33 - -Australia and New Zealand Banking Group - - - - - - - -Bank Internasional Indonesia - - - - - - - -Bank of America - 179 - 27 - - - -Bank of Bahrain & Kuwait - - - 4 178 127 - -Bank of Ceylon - - - - - - - -Bank of Nova Scotia - - - - - - - -Bank of Tokyo-Mitsubishi UFJ 1312 1593 - 28 - - - -Barclays Bank - - - - - - - -BNP Paribas - - 230 189 3128 1217 - -Chinatrust Commercial Bank - - - -16 - - - -Citibank - 191 1193 2376 56 747 - -Commonwealth Bank of Australia - - - - - - - -Credit Agricole - - 25 59 676 2585 - -Credit Suisse AG - - - - - 589 - -DBS Bank - - 182 54 840 1800 - -Deutsche Bank - - 238 -45 3919 5937 - -FirstRand Bank - - - - - - - -Hongkong & Shanghai Banking Corporation 236 - 705 1234 11699 21026 - -HSBC Bank oman S.A.O.G. - - 16 13 - - - -Industrial and Commercial Bank of China - - - 2 - - - -JPMorgan Chase Bank - - -27 3 3588 3748 - -JSC VTB Bank - - - - - - - -Krung Thai Bank - - - - 19 27 - -Mashreqbank - - - 1 - - - -Mizuho Corporate Bank - - - 1 548 1328 - -National Australia Bank - - - - - - - -Rabobank International - - - - - - - -Royal Bank of Scotland 154 - 117 6 - - - -Sberbank - - - - - - - -Shinhan Bank - - - - - - - -Societe Generale - - 26 33 151 213 - -Sonali Bank - - - - - - - -Standard Chartered Bank 239 - 666 265 14758 12113 - -State Bank of Mauritius - - - - - - - -Sumitomo Mitsui Banking Corporation - - - - - - - -UBS AG - - -9 6 - - - -United Overseas Bank - - - - - - - -Westpac Banking Corporation - - - - - - - -Woori Bank - - - - - - - -
Total 1940 1963 3363 4241 39682 51626 - -All Scheduled Commercial Banks 5897 14181 2661 9493 311194 313275 145253 172332
Source : Annual accounts of banks.Source

241
TABLE B8 : APPROPRIATION OF PROFIT OF SCHEDULED COMMERCIALBANKS - 2011 - 12 AND 2012 - 13 (Concld.)
(Amount in ` Million)
AS ON MARCH 31
Name of the Bank
Transfer to tax ondividend
Balance carried overto Balance sheet
2012 2013 2012 2013(17) (18) (19) (20)
Foreign BanksAB Bank - - 169 237Abu Dhabi Commercial Bank - - - -American Express Banking Corp. - - -1321 -2049Antwerp Diamond Bank - - -33 40Australia and New Zealand Banking Group - - -122 -90Bank Internasional Indonesia - - -281 -301Bank of America - - 3941 7254Bank of Bahrain & Kuwait - - - -Bank of Ceylon - - 455 401Bank of Nova Scotia - - 4749 6898Bank of Tokyo-Mitsubishi UFJ - - 1593 1983Barclays Bank - - -6366 -6930BNP Paribas - - - -Chinatrust Commercial Bank - - 52 -64Citibank - - 13167 17075Commonwealth Bank of Australia - - -247 -308Credit Agricole - - 1484 -Credit Suisse AG - - 589 678DBS Bank - - 2660 2970Deutsche Bank - - 7572 9427FirstRand Bank - - -464 -1059Hongkong & Shanghai Banking Corporation - - 20884 13142HSBC Bank oman S.A.O.G. - - -1238 -1065Industrial and Commercial Bank of China - - 74 122JPMorgan Chase Bank - - 3748 5042JSC VTB Bank - - -22 -2Krung Thai Bank - - 27 29Mashreqbank - - 115 202Mizuho Corporate Bank - - 1328 1296National Australia Bank - - -24 -112Rabobank International - - 12 91Royal Bank of Scotland - - 3327 1663Sberbank - - -19 -35Shinhan Bank - - - -Societe Generale - - 262 293Sonali Bank - - 23 37Standard Chartered Bank - - 12113 21937State Bank of Mauritius - - 143 391Sumitomo Mitsui Banking Corporation - - - -163UBS AG - - 478 1122United Overseas Bank - - -44 -29Westpac Banking Corporation - - - 63Woori Bank - - 6 23
Total - - 68792 80210All Scheduled Commercial Banks 16667 20740 412906 536222
Source : Annual accounts of banks.
TABLE B8 : APPROPRIATION OF PROFIT OF SCHEDULED COMMERCIALBANKS - 2011 - 12 AND 2012 - 13 (Concld.)
(Amount in ` Million)
AS ON MARCH 31
Name of the Bank
Transfer to tax ondividend
Balance carried overto Balance sheet
2012 2013 2012 2013(17) (18) (19) (20)
Foreign BanksAB Bank - - 169 237Abu Dhabi Commercial Bank - - - -American Express Banking Corp. - - -1321 -2049Antwerp Diamond Bank - - -33 40Australia and New Zealand Banking Group - - -122 -90Bank Internasional Indonesia - - -281 -301Bank of America - - 3941 7254Bank of Bahrain & Kuwait - - - -Bank of Ceylon - - 455 401Bank of Nova Scotia - - 4749 6898Bank of Tokyo-Mitsubishi UFJ - - 1593 1983Barclays Bank - - -6366 -6930BNP Paribas - - - -Chinatrust Commercial Bank - - 52 -64Citibank - - 13167 17075Commonwealth Bank of Australia - - -247 -308Credit Agricole - - 1484 -Credit Suisse AG - - 589 678DBS Bank - - 2660 2970Deutsche Bank - - 7572 9427FirstRand Bank - - -464 -1059Hongkong & Shanghai Banking Corporation - - 20884 13142HSBC Bank oman S.A.O.G. - - -1238 -1065Industrial and Commercial Bank of China - - 74 122JPMorgan Chase Bank - - 3748 5042JSC VTB Bank - - -22 -2Krung Thai Bank - - 27 29Mashreqbank - - 115 202Mizuho Corporate Bank - - 1328 1296National Australia Bank - - -24 -112Rabobank International - - 12 91Royal Bank of Scotland - - 3327 1663Sberbank - - -19 -35Shinhan Bank - - - -Societe Generale - - 262 293Sonali Bank - - 23 37Standard Chartered Bank - - 12113 21937State Bank of Mauritius - - 143 391Sumitomo Mitsui Banking Corporation - - - -163UBS AG - - 478 1122United Overseas Bank - - -44 -29Westpac Banking Corporation - - - 63Woori Bank - - 6 23
Total - - 68792 80210All Scheduled Commercial Banks 16667 20740 412906 536222
Source : Annual accounts of banks. Source

242
TABLE B9 : EXPOSURE TO SENSITIVE SECTORS OF SCHEDULEDCOMMERCIAL BANKS - 2012 AND 2013 AS ON MARCH 31
(Amount in ` Million)
Bank Name
Advances to sensitive sectors
Capital Market Sector Real Estate Sector Total
2012 2013 2012 2013 2012 2013
(1) (2) (3) (4) (5) (6)
SBI and its Associates
State Bank of India 35703 72094 1446684 1836015 1482386 1908108
State Bank of Bikaner & Jaipur 1155 1413 58341 71577 59495 72990
State Bank of Hyderabad 2678 2490 105157 124780 107836 127270
State Bank of Mysore 1166 1080 55253 66820 56419 67900
State Bank of Patiala 3572 2142 69229 85197 72801 87339
State Bank of Travancore 2217 1836 108501 106942 110718 108779
Nationalised Banks
Allahabad Bank 6878 17461 118510 132606 125387 150067
Andhra Bank 9822 4396 91291 128814 101114 133211
Bank of Baroda 29394 38828 271574 308615 300968 347443
Bank of India 33421 33211 240496 266281 273917 299492
Bank of Maharashtra 2689 2180 102140 145320 104829 147500
Canara Bank 37781 33915 176850 157702 214631 191617
Central Bank of India 21665 19041 187803 236390 209468 255431
Corporation Bank 14085 11985 149849 156730 163934 168715
Dena Bank 1437 1412 61729 70968 63166 72380
IDBI Bank Ltd. 38776 33963 367845 386369 406620 420332
Indian Bank 8117 7110 123100 119404 131217 126514
Indian Overseas Bank 21663 21000 174852 183334 196516 204334
Oriental Bank of Commerce 13102 12215 145396 177039 158498 189254
Punjab and Sind Bank 1925 2160 71554 76817 73479 78977
Punjab National Bank 40427 37201 484746 524140 525173 561340
Syndicate Bank 13854 10623 167735 217246 181590 227869
UCO Bank 8329 7618 111125 97002 119454 104619
Union Bank of India 23886 21499 205807 259288 229693 280787
United Bank of India 4130 3938 76476 81963 80606 85901
Vijaya Bank 4637 3148 112919 117204 117557 120352
Old Private Sector Banks
Catholic Syrian Bank 8 9 6285 6796 6293 6805
City Union Bank 2260 1723 12342 15507 14602 17230
Dhanlaxmi Bank 628 454 18615 12192 19244 12646
Notes : 1. Exposure to capital market is inclusive of both investments and advances. 2. Exposure to real estate sector is inclusive of both direct and indirect lending.
Source : Annual accounts of banks.Source

243
TABLE B9 : EXPOSURE TO SENSITIVE SECTORS OF SCHEDULEDCOMMERCIAL BANKS - 2012 AND 2013 AS ON MARCH 31 (Contd.)
(Amount in ` Million)
Bank Name
Advances to sensitive sectors
Capital Market Sector Real Estate Sector Total
2012 2013 2012 2013 2012 2013
(1) (2) (3) (4) (5) (6)
Federal Bank 3772 3636 68543 77565 72314 81201
ING Vysya Bank 3957 3511 60287 73612 64244 77124
Jammu & Kashmir Bank 3611 1776 44516 46767 48128 48543
Karnataka Bank 2432 2462 26071 32795 28502 35257
Karur Vysya Bank 4884 4581 16996 24176 21880 28756
Lakshmi Vilas Bank 774 1182 5269 4298 6044 5480
Nainital Bank 305 145 3973 4100 4278 4245
Ratnakar Bank 456 1502 2532 5676 2988 7178
South Indian Bank 1609 1907 16596 17419 18205 19326
Tamilnad Mercantile Bank 1466 1364 12312 14235 13778 15599
New Private Sector Banks
Axis Bank 47469 63648 527304 620207 574772 683855
Development Credit Bank 477 860 9067 11309 9544 12169
HDFC Bank 73075 75098 250203 301215 323278 376313
ICICI Bank 203409 192454 814217 964313 1017626 1156767
IndusInd Bank 11877 17976 17369 41565 29246 59542
Kotak Mahindra Bank 10521 12819 98324 123150 108845 135969
Yes Bank 7291 14826 35909 83773 43200 98599
Foreign Banks
AB Bank - - - - - -
Abu Dhabi Commercial Bank 93 53 201 225 294 278
American Express Banking Corp. - - - - - -
Antwerp Diamond Bank - - - - - -
Australia and New Zealand Banking Group - - - - - -
Bank Internasional Indonesia - - - - - -
Bank of America 509 1 14861 10665 15370 10666
Bank of Bahrain & Kuwait 6 2 247 67 253 69
Bank of Ceylon - - 23 86 23 86
Bank of Nova Scotia - - 6700 8250 6700 8250
Bank of Tokyo-Mitsubishi UFJ - - - - - -
Barclays Bank 4587 4649 15720 7666 20307 12315
BNP Paribas 3610 2407 5743 3583 9354 5990
Notes : 1. Exposure to capital market is inclusive of both investments and advances. 2. Exposure to real estate sector is inclusive of both direct and indirect lending.
Source : Annual accounts of banks.Source
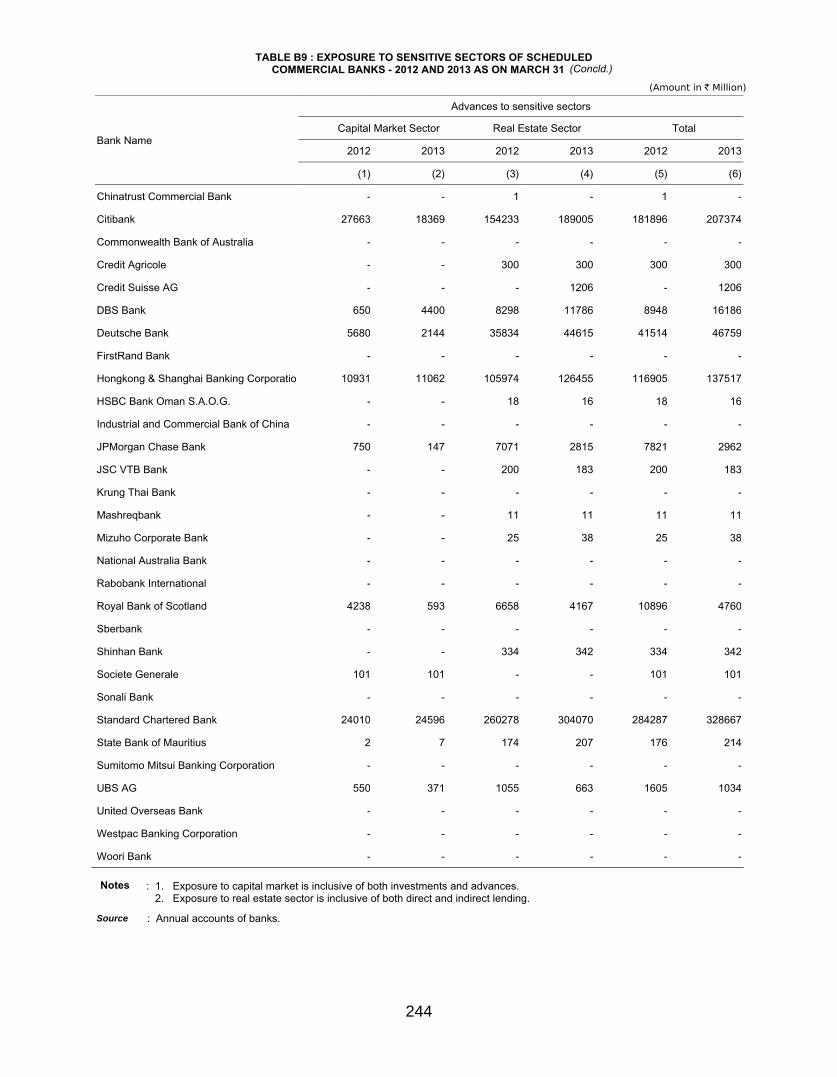
244
TABLE B9 : EXPOSURE TO SENSITIVE SECTORS OF SCHEDULEDCOMMERCIAL BANKS - 2012 AND 2013 AS ON MARCH 31 (Concld.)
(Amount in ` Million)
Bank Name
Advances to sensitive sectors
Capital Market Sector Real Estate Sector Total
2012 2013 2012 2013 2012 2013
(1) (2) (3) (4) (5) (6)
Chinatrust Commercial Bank - - 1 - 1 -
Citibank 27663 18369 154233 189005 181896 207374
Commonwealth Bank of Australia - - - - - -
Credit Agricole - - 300 300 300 300
Credit Suisse AG - - - 1206 - 1206
DBS Bank 650 4400 8298 11786 8948 16186
Deutsche Bank 5680 2144 35834 44615 41514 46759
FirstRand Bank - - - - - -
Hongkong & Shanghai Banking Corporation 10931 11062 105974 126455 116905 137517
HSBC Bank Oman S.A.O.G. - - 18 16 18 16
Industrial and Commercial Bank of China - - - - - -
JPMorgan Chase Bank 750 147 7071 2815 7821 2962
JSC VTB Bank - - 200 183 200 183
Krung Thai Bank - - - - - -
Mashreqbank - - 11 11 11 11
Mizuho Corporate Bank - - 25 38 25 38
National Australia Bank - - - - - -
Rabobank International - - - - - -
Royal Bank of Scotland 4238 593 6658 4167 10896 4760
Sberbank - - - - - -
Shinhan Bank - - 334 342 334 342
Societe Generale 101 101 - - 101 101
Sonali Bank - - - - - -
Standard Chartered Bank 24010 24596 260278 304070 284287 328667
State Bank of Mauritius 2 7 174 207 176 214
Sumitomo Mitsui Banking Corporation - - - - - -
UBS AG 550 371 1055 663 1605 1034
United Overseas Bank - - - - - -
Westpac Banking Corporation - - - - - -
Woori Bank - - - - - -
Notes : 1. Exposure to capital market is inclusive of both investments and advances. 2. Exposure to real estate sector is inclusive of both direct and indirect lending.
Source : Annual accounts of banks.
TABLE B9 : EXPOSURE TO SENSITIVE SECTORS OF SCHEDULEDCOMMERCIAL BANKS - 2012 AND 2013 AS ON MARCH 31 (Concld.)
(Amount in ` Million)
Bank Name
Advances to sensitive sectors
Capital Market Sector Real Estate Sector Total
2012 2013 2012 2013 2012 2013
(1) (2) (3) (4) (5) (6)
Chinatrust Commercial Bank - - 1 - 1 -
Citibank 27663 18369 154233 189005 181896 207374
Commonwealth Bank of Australia - - - - - -
Credit Agricole - - 300 300 300 300
Credit Suisse AG - - - 1206 - 1206
DBS Bank 650 4400 8298 11786 8948 16186
Deutsche Bank 5680 2144 35834 44615 41514 46759
FirstRand Bank - - - - - -
Hongkong & Shanghai Banking Corporation 10931 11062 105974 126455 116905 137517
HSBC Bank Oman S.A.O.G. - - 18 16 18 16
Industrial and Commercial Bank of China - - - - - -
JPMorgan Chase Bank 750 147 7071 2815 7821 2962
JSC VTB Bank - - 200 183 200 183
Krung Thai Bank - - - - - -
Mashreqbank - - 11 11 11 11
Mizuho Corporate Bank - - 25 38 25 38
National Australia Bank - - - - - -
Rabobank International - - - - - -
Royal Bank of Scotland 4238 593 6658 4167 10896 4760
Sberbank - - - - - -
Shinhan Bank - - 334 342 334 342
Societe Generale 101 101 - - 101 101
Sonali Bank - - - - - -
Standard Chartered Bank 24010 24596 260278 304070 284287 328667
State Bank of Mauritius 2 7 174 207 176 214
Sumitomo Mitsui Banking Corporation - - - - - -
UBS AG 550 371 1055 663 1605 1034
United Overseas Bank - - - - - -
Westpac Banking Corporation - - - - - -
Woori Bank - - - - - -
Notes : 1. Exposure to capital market is inclusive of both investments and advances. 2. Exposure to real estate sector is inclusive of both direct and indirect lending.
Source : Annual accounts of banks.Source

245
TABLE B10 : MATURITY PROFILE OF SELECTED ITEMS OF LIABILITIES AND ASSETS OF SCHEDULEDCOMMERCIAL BANKS - 2012 AND 2013
(Amount in ` Million)STATE BANK OF INDIA & ITS ASSOCIATES
AS ON MARCH 31
ItemsState Bank of India State Bank of Bikaner &
JaipurState Bank of
Hyderabad State Bank of Mysore
2012 2013 2012 2013 2012 2013 2012 2013(1) (2) (3) (4) (5) (6) (7) (8)
Deposits 10436474 12027396 615721 721162 984442 1130790 501863 569690
a) 1 - 14 days 722647 894285 31961 19112 26484 44768 15748 17520
b) 15 - 28 days 173092 247148 5070 5979 7166 14942 16547 15450
c) 29 days to 3 months 548300 493998 58186 72882 82399 103608 47137 47450
d) Over 3 months to 6 months 1003306 883259 41493 33523 79088 99809 32003 45650
e) Over 6 months to 1 year 1377764 1801168 86525 35594 183091 170357 87452 94800
f) Over 1 year to 3 years 3060736 3367983 191420 255069 372509 401794 119832 138490
g) Over 3 years to 5 years 1789712 2240940 109554 152427 12721 15170 71031 84380
h) Over 5 years 1760918 2098617 91513 146577 220985 280343 112114 125950
Borrowings 1270056 1691827 29550 58420 43995 39746 44256 38550
a) 1 - 14 days 175197 224268 - 22082 2 2 9666 280
b) 15 - 28 days 67489 105909 763 1629 1500 - 254 3910
c) 29 days to 3 months 212029 376644 4044 7929 150 - 6649 2150
d) Over 3 months to 6 months 97657 180068 2035 2714 1000 - 3102 1520
e) Over 6 months to 1 year 51070 75527 458 489 1643 2544 5311 11220
f) Over 1 year to 3 years 125246 276667 5750 5750 2250 5750 7745 10460
g) Over 3 years to 5 years 180520 88613 5000 5000 10500 10600 2530 1610
h) Over 5 years 360848 364131 11500 12829 26950 20850 9000 7400
Loans and Advances 8675789 10456166 492443 575350 768208 904669 406686 449320
a) 1 - 14 days 633349 1165460 15049 27177 58209 49747 18649 20700
b) 15 - 28 days 101410 86203 9574 3389 808 3752 5628 3660
c) 29 days to 3 months 470810 472313 25962 12328 15343 43886 41321 32970
d) Over 3 months to 6 months 380412 431155 11757 12121 12144 41193 15996 18440
e) Over 6 months to 1 year 432316 417535 28149 31366 23083 70625 28651 39330
f) Over 1 year to 3 years 4084619 5021346 260691 345854 358944 491887 191726 208630
g) Over 3 years to 5 years 812342 1155935 68801 34674 72062 81916 44780 58380
h) Over 5 years 1760530 1706218 72461 108442 227615 121664 59935 67210
Source : Annual accounts of banks.Source

246
TABLE B10 : MATURITY PROFILE OF SELECTED ITEMS OF LIABILITIES AND ASSETS OF SCHEDULEDCOMMERCIAL BANKS - 2012 AND 2013 (Contd.)
(Amount in ` Million)STATE BANK OF INDIA & ITS ASSOCIATES
AS ON MARCH 31
ItemsState Bank of Patiala State Bank of
Travancore
2012 2013 2012 2013(9) (10) (11) (12)
Deposits 794170 886720 714698 846237
a) 1 - 14 days 35500 28230 21025 35766
b) 15 - 28 days 16930 14340 9656 23164
c) 29 days to 3 months 83270 113990 40679 39264
d) Over 3 months to 6 months 116880 100820 41072 19738
e) Over 6 months to 1 year 203560 274550 89810 72343
f) Over 1 year to 3 years 248620 245790 185952 239565
g) Over 3 years to 5 years 5310 8140 127577 155772
h) Over 5 years 84100 100860 198927 260626
Borrowings 108100 88410 76073 87472
a) 1 - 14 days 37230 1290 3781 6714
b) 15 - 28 days 5840 - - -
c) 29 days to 3 months 11000 3530 17369 21663
d) Over 3 months to 6 months 9870 21570 13976 4071
e) Over 6 months to 1 year 18280 24040 3621 12708
f) Over 1 year to 3 years 10930 20320 15252 18931
g) Over 3 years to 5 years 14810 17610 6574 4134
h) Over 5 years 140 50 15501 19251
Loans and Advances 629340 738000 553460 674836
a) 1 - 14 days 17510 44050 14199 15608
b) 15 - 28 days 1170 2450 32975 28842
c) 29 days to 3 months 33320 36040 89635 133311
d) Over 3 months to 6 months 13740 18020 56903 79345
e) Over 6 months to 1 year 32440 34050 126843 133476
f) Over 1 year to 3 years 347300 413110 68308 86964
g) Over 3 years to 5 years 73310 73410 43522 51964
h) Over 5 years 110550 116870 121074 145326
Source : Annual accounts of banks.
TABLE B10 : MATURITY PROFILE OF SELECTED ITEMS OF LIABILITIES AND ASSETS OF SCHEDULEDCOMMERCIAL BANKS - 2012 AND 2013 (Contd.)
(Amount in ` Million)STATE BANK OF INDIA & ITS ASSOCIATES
AS ON MARCH 31
ItemsState Bank of Patiala State Bank of
Travancore
2012 2013 2012 2013(9) (10) (11) (12)
Deposits 794170 886720 714698 846237
a) 1 - 14 days 35500 28230 21025 35766
b) 15 - 28 days 16930 14340 9656 23164
c) 29 days to 3 months 83270 113990 40679 39264
d) Over 3 months to 6 months 116880 100820 41072 19738
e) Over 6 months to 1 year 203560 274550 89810 72343
f) Over 1 year to 3 years 248620 245790 185952 239565
g) Over 3 years to 5 years 5310 8140 127577 155772
h) Over 5 years 84100 100860 198927 260626
Borrowings 108100 88410 76073 87472
a) 1 - 14 days 37230 1290 3781 6714
b) 15 - 28 days 5840 - - -
c) 29 days to 3 months 11000 3530 17369 21663
d) Over 3 months to 6 months 9870 21570 13976 4071
e) Over 6 months to 1 year 18280 24040 3621 12708
f) Over 1 year to 3 years 10930 20320 15252 18931
g) Over 3 years to 5 years 14810 17610 6574 4134
h) Over 5 years 140 50 15501 19251
Loans and Advances 629340 738000 553460 674836
a) 1 - 14 days 17510 44050 14199 15608
b) 15 - 28 days 1170 2450 32975 28842
c) 29 days to 3 months 33320 36040 89635 133311
d) Over 3 months to 6 months 13740 18020 56903 79345
e) Over 6 months to 1 year 32440 34050 126843 133476
f) Over 1 year to 3 years 347300 413110 68308 86964
g) Over 3 years to 5 years 73310 73410 43522 51964
h) Over 5 years 110550 116870 121074 145326
Source : Annual accounts of banks.Source

247
TABLE B10 : MATURITY PROFILE OF SELECTED ITEMS OF LIABILITIES AND ASSETS OF SCHEDULEDCOMMERCIAL BANKS - 2012 AND 2013
(Amount in ` Million)STATE BANK OF INDIA & ITS ASSOCIATESAS ON MARCH 31
ItemsState Bank of India State Bank of Bikaner &
JaipurState Bank of
Hyderabad State Bank of Mysore
2012 2013 2012 2013 2012 2013 2012 2013(1) (2) (3) (4) (5) (6) (7) (8)
Investments (at book value) 3121976 3509273 166695 201459 293664 339680 147861 168650
a) 1 - 14 days 26627 67912 2748 1003 15429 8669 9228 1070
b) 15 - 28 days 35149 43134 20 989 4002 1527 2581 2040
c) 29 days to 3 months 191090 233005 5189 17065 15186 17707 13151 9100
d) Over 3 months to 6 months 86647 159738 3024 8244 13073 13508 9770 4210
e) Over 6 months to 1 year 119026 118993 681 1517 1183 6076 17663 1720
f) Over 1 year to 3 years 485532 471025 30354 41874 29867 37013 30452 31070
g) Over 3 years to 5 years 549350 657361 36704 52497 58275 86294 16959 34850
h) Over 5 years 1628555 1758106 87974 78269 156649 168885 48060 84590
Foreign Currency Assets 1732053 2226958 8542 12079 14911 15561 12859 9340
a) 1 - 14 days 328040 719091 1806 2046 179 1233 4256 1770
b) 15 - 28 days 60024 61575 667 742 311 664 1508 960
c) 29 days to 3 months 249175 207689 4070 4142 1597 1379 3471 1770
d) Over 3 months to 6 months 203448 209611 923 3519 5705 2721 3549 4590
e) Over 6 months to 1 year 138687 99902 150 214 5561 8366 - 60
f) Over 1 year to 3 years 241875 314144 927 1218 619 1200 76 180
g) Over 3 years to 5 years 280230 287141 - 199 939 - - -
h) Over 5 years 230574 327807 - - - - - 10
Foreign Currency Liabilities 1619839 1984565 7215 9448 19666 17191 11552 6080
a) 1 - 14 days 319272 381451 103 1269 633 1031 4093 2450
b) 15 - 28 days 91682 149762 776 1634 1050 16 294 3260
c) 29 days to 3 months 302765 350359 2649 1831 9403 8365 3086 50
d) Over 3 months to 6 months 209773 240804 2319 3181 7061 6308 2968 70
e) Over 6 months to 1 year 226451 242466 1112 1261 946 837 776 90
f) Over 1 year to 3 years 238173 409325 229 261 529 574 300 120
g) Over 3 years to 5 years 191694 163208 24 10 44 61 35 40
h) Over 5 years 40030 47191 3 2 - - - -
Source : Annual accounts of banks.Source

248
TABLE B10 : MATURITY PROFILE OF SELECTED ITEMS OF LIABILITIES AND ASSETS OF SCHEDULEDCOMMERCIAL BANKS - 2012 AND 2013 (Contd.)
(Amount in ` Million)STATE BANK OF INDIA & ITS ASSOCIATES
AS ON MARCH 31
ItemsState Bank of Patiala State Bank of
Travancore
2012 2013 2012 2013(9) (10) (11) (12)
Investments (at book value) 220430 239570 224376 269555
a) 1 - 14 days 4810 3290 4484 5165
b) 15 - 28 days 1660 590 980 3189
c) 29 days to 3 months 10910 18940 8750 17435
d) Over 3 months to 6 months 5830 6120 9542 3828
e) Over 6 months to 1 year 2600 2540 7577 1861
f) Over 1 year to 3 years 24850 31130 27787 35837
g) Over 3 years to 5 years 54480 43870 4297 37141
h) Over 5 years 115290 133090 160959 165099
Foreign Currency Assets 12280 16330 26185 25218
a) 1 - 14 days 2120 1890 4577 9345
b) 15 - 28 days 340 1360 321 396
c) 29 days to 3 months 5550 5470 2700 5241
d) Over 3 months to 6 months 3260 7510 6483 6233
e) Over 6 months to 1 year - 10 3849 2157
f) Over 1 year to 3 years 650 30 4281 1087
g) Over 3 years to 5 years 110 60 2815 758
h) Over 5 years 250 - 1158 -
Foreign Currency Liabilities 5660 4370 36182 31623
a) 1 - 14 days 1440 230 4215 3838
b) 15 - 28 days 160 110 730 290
c) 29 days to 3 months 460 440 9630 10446
d) Over 3 months to 6 months 660 530 10575 5731
e) Over 6 months to 1 year 1770 1920 7382 4002
f) Over 1 year to 3 years 880 1110 3020 5503
g) Over 3 years to 5 years 290 30 630 1658
h) Over 5 years - - - 155
Source : Annual accounts of banks.
TABLE B10 : MATURITY PROFILE OF SELECTED ITEMS OF LIABILITIES AND ASSETS OF SCHEDULEDCOMMERCIAL BANKS - 2012 AND 2013 (Contd.)
(Amount in ` Million)STATE BANK OF INDIA & ITS ASSOCIATES
AS ON MARCH 31
ItemsState Bank of Patiala State Bank of
Travancore
2012 2013 2012 2013(9) (10) (11) (12)
Investments (at book value) 220430 239570 224376 269555
a) 1 - 14 days 4810 3290 4484 5165
b) 15 - 28 days 1660 590 980 3189
c) 29 days to 3 months 10910 18940 8750 17435
d) Over 3 months to 6 months 5830 6120 9542 3828
e) Over 6 months to 1 year 2600 2540 7577 1861
f) Over 1 year to 3 years 24850 31130 27787 35837
g) Over 3 years to 5 years 54480 43870 4297 37141
h) Over 5 years 115290 133090 160959 165099
Foreign Currency Assets 12280 16330 26185 25218
a) 1 - 14 days 2120 1890 4577 9345
b) 15 - 28 days 340 1360 321 396
c) 29 days to 3 months 5550 5470 2700 5241
d) Over 3 months to 6 months 3260 7510 6483 6233
e) Over 6 months to 1 year - 10 3849 2157
f) Over 1 year to 3 years 650 30 4281 1087
g) Over 3 years to 5 years 110 60 2815 758
h) Over 5 years 250 - 1158 -
Foreign Currency Liabilities 5660 4370 36182 31623
a) 1 - 14 days 1440 230 4215 3838
b) 15 - 28 days 160 110 730 290
c) 29 days to 3 months 460 440 9630 10446
d) Over 3 months to 6 months 660 530 10575 5731
e) Over 6 months to 1 year 1770 1920 7382 4002
f) Over 1 year to 3 years 880 1110 3020 5503
g) Over 3 years to 5 years 290 30 630 1658
h) Over 5 years - - - 155
Source : Annual accounts of banks.Source

249
TABLE B10 : MATURITY PROFILE OF SELECTED ITEMS OF LIABILITIES AND ASSETS OF SCHEDULEDCOMMERCIAL BANKS - 2012 AND 2013 (Contd.)
(Amount in ` Million)NATIONALISED BANKS
AS ON MARCH 31
ItemsAllahabad Bank Andhra Bank Bank of Baroda Bank of India
2012 2013 2012 2013 2012 2013 2012 2013(1) (2) (3) (4) (5) (6) (7) (8)
Deposits 1595931 1787416 1058512 1237956 3848711 4738813 3182160 3818126
a) 1 - 14 days 80383 146276 28697 54026 351686 438422 325774 423113
b) 15 - 28 days 16359 45747 13895 17121 143297 181264 156172 223902
c) 29 days to 3 months 292462 235235 104618 138060 575250 648893 427216 475355
d) Over 3 months to 6 months 165753 120354 125257 122037 468997 528906 468224 433360
e) Over 6 months to 1 year 232169 294138 329780 379871 1011861 1316814 391172 486984
f) Over 1 year to 3 years 585550 794653 427411 506849 697829 828630 426545 518140
g) Over 3 years to 5 years 98163 76371 23478 13138 144808 180951 338515 430592
h) Over 5 years 125093 74641 5376 6854 454983 614932 648542 826682
Borrowings 90945 100976 82406 111193 235731 265793 321142 353676
a) 1 - 14 days 8649 7131 763 30541 6092 12307 97277 24174
b) 15 - 28 days 204 7131 10429 3308 254 5491 6656 14345
c) 29 days to 3 months 15995 16426 8404 12407 17511 23858 21779 15374
d) Over 3 months to 6 months 19317 21344 13323 21495 23870 35062 10299 75937
e) Over 6 months to 1 year 2743 5059 3650 2034 20428 18807 1054 11979
f) Over 1 year to 3 years 14338 8172 13488 11804 13997 51127 35107 71080
g) Over 3 years to 5 years 4596 13853 3802 1176 47297 59692 59996 22621
h) Over 5 years 25104 21860 28546 28430 106283 59450 88973 118167
Loans and Advances 1111451 1294896 836418 983733 2873773 3281858 2488333 2893675
a) 1 - 14 days 22672 49938 34858 28182 164987 237844 287634 377172
b) 15 - 28 days 19258 21990 18415 14544 67693 92250 68065 96355
c) 29 days to 3 months 170544 101854 94121 97001 379700 442329 596242 761357
d) Over 3 months to 6 months 192055 124207 48387 67617 312382 365422 349320 346853
e) Over 6 months to 1 year 144148 99960 95928 105812 309093 302673 149444 185005
f) Over 1 year to 3 years 248723 546547 323543 407504 895502 952967 269321 300804
g) Over 3 years to 5 years 122783 150366 96943 111909 312983 367054 303868 308082
h) Over 5 years 191269 200034 124224 151166 431434 521320 464440 518048
Source : Annual accounts of banks.Source

250
TABLE B10 : MATURITY PROFILE OF SELECTED ITEMS OF LIABILITIES AND ASSETS OF SCHEDULEDCOMMERCIAL BANKS - 2012 AND 2013 (Contd.)
(Amount in ` Million)NATIONALISED BANKS
AS ON MARCH 31
ItemsBank of Maharashtra Canara Bank Central Bank of India Corporation Bank
2012 2013 2012 2013 2012 2013 2012 2013(9) (10) (11) (12) (13) (14) (15) (16)
Deposits 765287 943369 3270537 3558560 1953612 2252076 1361422 1660055
a) 1 - 14 days 40620 58616 155914 234661 68736 141988 78321 102449
b) 15 - 28 days 11666 20363 42469 60401 36675 53673 40928 46769
c) 29 days to 3 months 119086 52376 340558 431945 316482 150963 186981 137103
d) Over 3 months to 6 months 75978 102355 294915 212814 241330 201639 123960 206571
e) Over 6 months to 1 year 109302 185133 931067 798239 460215 379039 334984 484851
f) Over 1 year to 3 years 392970 500315 473848 577295 371968 811069 281811 313019
g) Over 3 years to 5 years 10433 15776 379999 486274 231212 246177 63065 70389
h) Over 5 years 5232 8435 651768 756931 226995 267528 251372 298904
Borrowings 11434 48885 155254 202834 39941 102194 142481 128989
a) 1 - 14 days 2841 26755 - 37673 26 56205 57147 48005
b) 15 - 28 days - 16455 5181 9113 - - - 6669
c) 29 days to 3 months 230 5675 16132 21495 3152 4344 2035 13696
d) Over 3 months to 6 months 730 - 12861 11846 2492 15791 16960 4764
e) Over 6 months to 1 year 5793 - 257 12240 10933 6385 5700 1661
f) Over 1 year to 3 years 1435 - 25111 21999 19909 6948 7190 3604
g) Over 3 years to 5 years 163 - 49566 49322 3428 12520 3033 5104
h) Over 5 years 244 - 46146 39146 2 - 50416 45486
Loans and Advances 569789 763972 2324898 2421766 1486077 1691082 1004690 1187167
a) 1 - 14 days 22764 26935 233320 193014 43815 48167 72774 89748
b) 15 - 28 days 10609 11156 70280 90220 20890 17888 27140 23903
c) 29 days to 3 months 34793 68361 269967 226680 109537 83208 173610 111195
d) Over 3 months to 6 months 37269 48187 210040 203933 60263 60230 94372 106136
e) Over 6 months to 1 year 49281 73413 322228 397288 113407 109774 98672 123183
f) Over 1 year to 3 years 302619 408653 574030 654157 734636 854699 340157 454793
g) Over 3 years to 5 years 56492 100084 247908 232892 183996 256190 115574 153056
h) Over 5 years 55962 27183 397126 423583 219533 260925 82392 125153
Source : Annual accounts of banks.Source

251
TABLE B10 : MATURITY PROFILE OF SELECTED ITEMS OF LIABILITIES AND ASSETS OF SCHEDULEDCOMMERCIAL BANKS - 2012 AND 2013 (Contd.)
(Amount in ` Million)NATIONALISED BANKS
AS ON MARCH 31
ItemsDena Bank IDBI Bank Ltd. Indian Bank Indian Overseas Bank
2012 2013 2012 2013 2012 2013 2012 2013(17) (18) (19) (20) (21) (22) (23) (24)
Deposits 771668 972072 2104926 2271165 1208038 1419802 1784342 2021354
a) 1 - 14 days 26263 79870 186592 169102 80970 97465 122646 168794
b) 15 - 28 days 9391 15827 96230 44326 37927 35422 30145 35010
c) 29 days to 3 months 95031 85744 289301 303469 154806 152420 223857 233365
d) Over 3 months to 6 months 52747 69927 214698 282344 156919 128151 309327 235024
e) Over 6 months to 1 year 193731 221373 460544 506312 195289 176047 414592 501077
f) Over 1 year to 3 years 345869 436381 641908 684321 360297 575586 189718 263084
g) Over 3 years to 5 years 40373 55325 78680 101313 26153 237823 55552 93023
h) Over 5 years 8263 7624 136973 179978 195677 16890 438506 491976
Borrowings 38810 84137 534776 658089 48729 28626 236139 233229
a) 1 - 14 days 18048 51001 8609 17630 7356 1564 77170 19189
b) 15 - 28 days 101 201 18118 5075 763 543 2550 8303
c) 29 days to 3 months 2144 3979 26318 16948 4553 7329 19611 17417
d) Over 3 months to 6 months 2592 5968 38628 60132 11962 8270 14884 18492
e) Over 6 months to 1 year 14 828 72171 140025 12178 4 13081 30634
f) Over 1 year to 3 years 4350 2100 118938 147695 1916 915 19282 25433
g) Over 3 years to 5 years - - 100729 71712 - - 49338 73293
h) Over 5 years 11560 20060 151266 198871 10000 10001 40223 40468
Loans and Advances 566926 657817 1811584 1963065 903236 1056425 1432726 1643665
a) 1 - 14 days 19411 49315 68947 64808 56893 83075 85272 100327
b) 15 - 28 days 6915 5815 46438 24547 30993 33285 25236 49807
c) 29 days to 3 months 14041 43683 93287 127154 81170 86441 135433 181129
d) Over 3 months to 6 months 17559 41013 102893 70220 75074 77280 105742 146102
e) Over 6 months to 1 year 23419 41781 142535 113676 124141 172532 166550 194019
f) Over 1 year to 3 years 326622 371891 768966 821493 307016 323806 514000 565167
g) Over 3 years to 5 years 71125 51412 230137 253303 110056 134510 189766 193204
h) Over 5 years 87835 52907 358382 487864 117895 145496 210727 213910
Source : Annual accounts of banks.Source

252
TABLE B10 : MATURITY PROFILE OF SELECTED ITEMS OF LIABILITIES AND ASSETS OF SCHEDULEDCOMMERCIAL BANKS - 2012 AND 2013 (Contd.)
(Amount in ` Million)NATIONALISED BANKS
AS ON MARCH 31
Items
Oriental Bank ofCommerce Punjab and Sind Bank Punjab National Bank Syndicate Bank
2012 2013 2012 2013 2012 2013 2012 2013(25) (26) (27) (28) (29) (30) (31) (32)
Deposits 1559649 1758975 631240 706415 3795885 3915601 1579411 1853559
a) 1 - 14 days 69266 124278 32301 21558 181548 156083 80312 146566
b) 15 - 28 days 73995 77010 22094 14098 45944 44563 35410 64109
c) 29 days to 3 months 230236 293059 128627 100739 316859 259772 265610 296622
d) Over 3 months to 6 months 230146 270186 60861 71886 388951 284057 238774 284435
e) Over 6 months to 1 year 336338 489471 154537 234894 562383 342491 226106 319012
f) Over 1 year to 3 years 242310 172653 116774 119022 1430449 1580317 644246 656614
g) Over 3 years to 5 years 69437 64478 21835 48105 32117 23965 67504 64354
h) Over 5 years 307922 267842 94211 96114 837634 1224353 21448 21848
Borrowings 7591 76793 33823 25401 372643 396209 105899 128138
a) 1 - 14 days 4000 1086 12984 6035 130286 44502 2 -
b) 15 - 28 days - 1629 - - 14215 15589 2441 814
c) 29 days to 3 months - 22859 763 894 2908 101238 11047 10807
d) Over 3 months to 6 months 189 6787 1119 1015 56863 77706 5128 5097
e) Over 6 months to 1 year 8 3 750 - 10328 43215 10984 3442
f) Over 1 year to 3 years 1506 2178 1150 441 51661 10732 12270 16913
g) Over 3 years to 5 years 764 10002 1583 1583 19693 43742 42175 35258
h) Over 5 years 1124 32250 15474 15433 86691 59486 21853 55806
Loans and Advances 1130498 1301856 461514 514308 2937748 3118544 1236202 1475690
a) 1 - 14 days 98211 88445 18905 23138 245126 249700 80093 103945
b) 15 - 28 days 50768 62170 18797 18691 61512 30519 32032 28719
c) 29 days to 3 months 99260 118288 57356 87216 120003 221955 102841 201683
d) Over 3 months to 6 months 96037 92035 29237 31420 93102 174790 84853 101896
e) Over 6 months to 1 year 118161 79767 42142 34445 500707 788865 101395 175231
f) Over 1 year to 3 years 223206 245592 137747 154702 1348085 616588 458500 496448
g) Over 3 years to 5 years 148831 181317 86987 66604 278425 300796 167200 133029
h) Over 5 years 296025 434242 70344 98092 290787 735332 209289 234739
Source : Annual accounts of banks.Source

253
TABLE B10 : MATURITY PROFILE OF SELECTED ITEMS OF LIABILITIES AND ASSETS OF SCHEDULEDCOMMERCIAL BANKS - 2012 AND 2013 (Contd.)
(Amount in ` Million)NATIONALISED BANKS
AS ON MARCH 31
ItemsUCO Bank Union Bank of India United Bank of India Vijaya Bank
2012 2013 2012 2013 2012 2013 2012 2013(33) (34) (35) (36) (37) (38) (39) (40)
Deposits 1540035 1734310 2228690 2637616 891163 1006515 830555 970172
a) 1 - 14 days 88631 107142 159456 160913 41443 46276 56426 60780
b) 15 - 28 days 46441 47667 52603 46929 16264 20765 30243 24536
c) 29 days to 3 months 392793 241099 225936 195200 83437 103496 115485 204581
d) Over 3 months to 6 months 120865 253611 126260 132008 41980 54792 66102 93099
e) Over 6 months to 1 year 405652 385284 305729 438734 109475 105897 290414 316049
f) Over 1 year to 3 years 139855 301582 444584 548387 153660 184496 93817 70022
g) Over 3 years to 5 years 24427 25309 194631 223825 82513 104150 175257 197424
h) Over 5 years 321372 372618 719492 891619 362391 386645 2811 3683
Borrowings 129014 94924 179095 237973 49202 49427 54184 63915
a) 1 - 14 days 73425 29800 21098 32858 4043 4 28878 46180
b) 15 - 28 days 1526 - 3639 9459 - - - -
c) 29 days to 3 months 5088 4090 20592 37488 1128 11677 400 400
d) Over 3 months to 6 months 1708 8218 25665 36507 6758 4366 6 4
e) Over 6 months to 1 year 983 1718 850 1368 6624 2964 7164 1407
f) Over 1 year to 3 years 7829 6714 15401 12880 7896 10782 2730 3423
g) Over 3 years to 5 years 6609 2562 46950 54514 10822 6134 5006 4501
h) Over 5 years 31846 41822 44901 52900 11931 13501 10000 8000
Loans and Advances 1175040 1315691 1778821 2081022 630433 689087 579037 697658
a) 1 - 14 days 49429 78085 48657 125497 69518 52823 8991 9056
b) 15 - 28 days 14947 32029 56334 80188 2753 11414 7663 7384
c) 29 days to 3 months 94804 135953 292613 240027 51234 59887 22776 28452
d) Over 3 months to 6 months 89928 97606 165390 221149 42295 51383 26943 29252
e) Over 6 months to 1 year 125560 92977 237618 281039 43370 40940 40792 45282
f) Over 1 year to 3 years 326976 362526 533324 709204 241224 261861 339628 412756
g) Over 3 years to 5 years 129423 126316 175888 210036 80762 96921 64062 72822
h) Over 5 years 343973 390200 268998 213883 99279 113858 68183 92654
Source : Annual accounts of banks.Source

254
TABLE B10 : MATURITY PROFILE OF SELECTED ITEMS OF LIABILITIES AND ASSETS OF SCHEDULEDCOMMERCIAL BANKS - 2012 AND 2013 (Contd.)
(Amount in ` Million)NATIONALISED BANKS
AS ON MARCH 31
ItemsAllahabad Bank Andhra Bank Bank of Baroda Bank of India
2012 2013 2012 2013 2012 2013 2012 2013(1) (2) (3) (4) (5) (6) (7) (8)
Investments (at book value) 542832 583059 296558 377955 832094 1213996 867536 946134
a) 1 - 14 days 5443 92302 5923 7450 18969 52568 20305 36779
b) 15 - 28 days 11329 4978 1779 4208 7645 5884 12908 25638
c) 29 days to 3 months 31653 68672 18210 19197 57374 96098 65109 46341
d) Over 3 months to 6 months 18466 27354 1978 8885 12315 33956 37053 25484
e) Over 6 months to 1 year 19717 25395 2395 6222 16331 27647 31604 7349
f) Over 1 year to 3 years 54881 77880 30796 44077 128283 166149 62966 93133
g) Over 3 years to 5 years 93866 85854 43510 45904 105933 138009 135581 186177
h) Over 5 years 307479 200624 191968 242011 485245 693684 502009 525233
Foreign Currency Assets 61761 76181 16310 25490 1331328 1728163 910646 1054174
a) 1 - 14 days 6640 7532 2955 4811 236412 271224 133976 124261
b) 15 - 28 days 4832 7532 1197 2258 60545 125026 47808 74067
c) 29 days to 3 months 14401 15847 4341 6515 291647 389472 222313 355880
d) Over 3 months to 6 months 19553 21777 7816 11370 238269 333955 209329 178136
e) Over 6 months to 1 year 2806 7437 - 535 151198 156762 57609 81433
f) Over 1 year to 3 years 1356 2698 - - 180484 218429 60055 80814
g) Over 3 years to 5 years 2448 3727 - - 121708 164578 74945 55750
h) Over 5 years 9725 9630 - - 51064 68716 104610 103833
Foreign Currency Liabilities 53515 74500 26892 32125 1333329 1599720 951594 1152117
a) 1 - 14 days 11326 7728 1518 1686 252545 293707 124815 195724
b) 15 - 28 days 208 7728 2088 2213 58521 114637 97037 115633
c) 29 days to 3 months 16693 17939 8288 9735 271060 300890 275727 269359
d) Over 3 months to 6 months 14809 23500 13345 16795 226907 248975 210324 196801
e) Over 6 months to 1 year 4318 10166 1138 1228 219380 304264 86875 188682
f) Over 1 year to 3 years 2148 2564 200 363 49976 111080 55645 91638
g) Over 3 years to 5 years 2541 2714 314 105 165675 188370 58809 20524
h) Over 5 years 1473 2161 - - 89267 37797 42361 73756
Source : Annual accounts of banks.Source

255
TABLE B10 : MATURITY PROFILE OF SELECTED ITEMS OF LIABILITIES AND ASSETS OF SCHEDULEDCOMMERCIAL BANKS - 2012 AND 2013 (Contd.)
(Amount in ` Million)NATIONALISED BANKS
AS ON MARCH 31
ItemsBank of Maharashtra Canara Bank Central Bank of India Corporation Bank
2012 2013 2012 2013 2012 2013 2012 2013(9) (10) (11) (12) (13) (14) (15) (16)
Investments (at book value) 261983 314977 1020574 1211328 592433 726038 474746 581645
a) 1 - 14 days 2966 1018 43192 17092 27305 6418 75604 129854
b) 15 - 28 days 2183 - 19675 20723 2517 957 9237 10355
c) 29 days to 3 months 11687 3534 64853 89871 12168 27154 49302 34150
d) Over 3 months to 6 months 548 9191 9835 15577 15065 37126 31739 45389
e) Over 6 months to 1 year 4997 10472 15505 16136 10921 12913 87848 110427
f) Over 1 year to 3 years 43203 32189 37152 76726 102080 93908 98136 111960
g) Over 3 years to 5 years 42013 44757 128381 186992 89951 88051 40336 43969
h) Over 5 years 154386 213816 701982 788212 332426 459512 82545 95541
Foreign Currency Assets 58089 80719 193222 253494 26810 28277 49932 47062
a) 1 - 14 days 15391 5563 28196 36955 4980 1114 13151 15131
b) 15 - 28 days 7151 2563 8762 23049 628 3335 3169 2620
c) 29 days to 3 months 17478 41877 59948 67224 5517 12247 13441 13246
d) Over 3 months to 6 months 12654 11506 44473 50748 15394 9337 9879 11851
e) Over 6 months to 1 year 5415 19142 9112 27933 85 172 1135 988
f) Over 1 year to 3 years - 68 11756 13810 178 805 5189 1210
g) Over 3 years to 5 years - - 11431 15653 29 475 2746 2007
h) Over 5 years - - 19545 18123 - 791 1221 10
Foreign Currency Liabilities 56355 81250 193222 253494 8122 7308 49932 36762
a) 1 - 14 days 15009 5765 16823 19992 2003 1073 16044 5567
b) 15 - 28 days 10334 948 12226 26006 150 113 244 6735
c) 29 days to 3 months 11887 41542 59762 81363 1093 608 5500 12810
d) Over 3 months to 6 months 13775 16997 38193 42194 978 746 16042 3968
e) Over 6 months to 1 year 5077 15668 12516 27582 2351 2303 4394 3851
f) Over 1 year to 3 years 186 234 15043 6429 1368 2209 6885 3013
g) Over 3 years to 5 years 87 96 31078 37896 179 256 823 819
h) Over 5 years - - 7580 12033 - - - -
Source : Annual accounts of banks.Source

256
TABLE B10 : MATURITY PROFILE OF SELECTED ITEMS OF LIABILITIES AND ASSETS OF SCHEDULEDCOMMERCIAL BANKS - 2012 AND 2013 (Contd.)
(Amount in ` Million)NATIONALISED BANKS
AS ON MARCH 31
ItemsDena Bank IDBI Bank Ltd. Indian Bank Indian Overseas Bank
2012 2013 2012 2013 2012 2013 2012 2013(17) (18) (19) (20) (21) (22) (23) (24)
Investments (at book value) 230277 343431 831754 988009 412073 449183 559298 619879
a) 1 - 14 days 4387 41022 202383 209712 23636 22397 93128 63181
b) 15 - 28 days 1888 245 248 349 9645 15920 8301 8895
c) 29 days to 3 months 8869 6152 31640 40049 58061 77036 43723 61707
d) Over 3 months to 6 months 2070 2936 6088 13549 45021 47445 65704 60053
e) Over 6 months to 1 year 2390 4462 16520 17609 74676 75818 111637 122623
f) Over 1 year to 3 years 17973 27052 66394 127001 97265 116567 62312 115537
g) Over 3 years to 5 years 42175 52923 95796 124728 8344 6834 25253 50878
h) Over 5 years 150526 208640 412685 455012 95426 87167 149242 137005
Foreign Currency Assets 20940 27818 334438 446113 74570 94794 307901 246377
a) 1 - 14 days 1523 6437 48948 81622 3084 26220 44698 30483
b) 15 - 28 days 1267 575 3835 3388 3279 4685 19762 19012
c) 29 days to 3 months 4643 3161 106050 87953 18081 21380 82304 53558
d) Over 3 months to 6 months 13331 15948 56351 68974 17357 20033 63178 43592
e) Over 6 months to 1 year 175 1678 59168 70607 5748 989 24645 9025
f) Over 1 year to 3 years - 20 30553 55137 14701 11403 27910 40280
g) Over 3 years to 5 years - - 20955 32988 5819 3660 27883 27465
h) Over 5 years 1 1 8578 45444 6500 6423 17522 22963
Foreign Currency Liabilities 9482 8800 340250 451638 87825 95183 287709 227002
a) 1 - 14 days 1429 863 42953 45838 13268 16795 45830 22683
b) 15 - 28 days 63 239 10274 10319 7094 12044 7257 11844
c) 29 days to 3 months 2175 1952 94512 93006 19763 33920 76847 31923
d) Over 3 months to 6 months 2039 2293 58605 72103 20196 13803 52386 42073
e) Over 6 months to 1 year 1741 1570 64061 76074 24200 11241 30782 24796
f) Over 1 year to 3 years 1724 1227 46403 93055 2885 4661 41462 35330
g) Over 3 years to 5 years 311 646 18925 28246 419 2719 33085 58353
h) Over 5 years 1 11 4518 32999 - - 61 -
Source : Annual accounts of banks.Source

257
TABLE B10 : MATURITY PROFILE OF SELECTED ITEMS OF LIABILITIES AND ASSETS OF SCHEDULEDCOMMERCIAL BANKS - 2012 AND 2013 (Contd.)
(Amount in ` Million)NATIONALISED BANKS
AS ON MARCH 31
Items
Oriental Bank ofCommerce Punjab and Sind Bank Punjab National Bank Syndicate Bank
2012 2013 2012 2013 2012 2013 2012 2013(25) (26) (27) (28) (29) (30) (31) (32)
Investments (at book value) 524602 587192 200641 225425 1231473 1304357 408151 456477
a) 1 - 14 days 11845 24370 2831 2812 10215 6327 10962 1363
b) 15 - 28 days 5381 - 1464 2945 2486 2410 841 2021
c) 29 days to 3 months 12388 29400 9286 18571 113551 48600 11856 12400
d) Over 3 months to 6 months 6519 8238 257 2096 30209 50845 4569 13233
e) Over 6 months to 1 year 14708 8863 5726 5810 33782 33624 1494 19593
f) Over 1 year to 3 years 81019 73180 22442 31456 132086 164983 48839 50688
g) Over 3 years to 5 years 89595 84268 21046 20681 184922 199330 54715 90543
h) Over 5 years 303148 358873 137589 141054 724223 798238 274875 266636
Foreign Currency Assets 284387 386928 7521 7563 388895 482434 158303 263191
a) 1 - 14 days 87548 135013 1895 3706 59081 42893 40600 70215
b) 15 - 28 days 4496 12014 546 404 19609 21857 12666 24794
c) 29 days to 3 months 87116 115551 2256 2031 98719 148277 27957 77334
d) Over 3 months to 6 months 60116 60663 2825 1423 101853 144054 20923 50822
e) Over 6 months to 1 year 42848 61436 - - 35687 69043 2449 28366
f) Over 1 year to 3 years 324 2251 - - 43349 23427 12703 4155
g) Over 3 years to 5 years 1940 - - - 18232 16053 18027 4530
h) Over 5 years - - - - 12365 16829 22979 2975
Foreign Currency Liabilities 285849 387621 5591 4287 293202 436487 153825 253922
a) 1 - 14 days 82749 131554 1011 742 40863 55355 25165 34497
b) 15 - 28 days 7749 16882 97 59 13205 35416 15588 31338
c) 29 days to 3 months 88994 116217 1041 1192 89632 118830 41908 76206
d) Over 3 months to 6 months 60873 59837 1469 629 73353 125609 24902 32414
e) Over 6 months to 1 year 44368 62218 1142 859 34833 66911 10986 17026
f) Over 1 year to 3 years 917 652 793 792 31093 15132 4754 4011
g) Over 3 years to 5 years 201 261 38 14 2975 4561 30521 31283
h) Over 5 years - 1 - - 7247 14673 - 27147
Source : Annual accounts of banks.Source

258
TABLE B10 : MATURITY PROFILE OF SELECTED ITEMS OF LIABILITIES AND ASSETS OF SCHEDULEDCOMMERCIAL BANKS - 2012 AND 2013 (Contd.)
(Amount in ` Million)NATIONALISED BANKS
AS ON MARCH 31
ItemsUCO Bank Union Bank of India United Bank of India Vijaya Bank
2012 2013 2012 2013 2012 2013 2012 2013(33) (34) (35) (36) (37) (38) (39) (40)
Investments (at book value) 461854 525152 623636 808305 290588 334634 286438 312850
a) 1 - 14 days 69965 5778 25219 19602 3796 4112 6476 4342
b) 15 - 28 days 10706 7018 4648 1250 2397 1809 97 2554
c) 29 days to 3 months 89745 3123 11815 19098 9495 16508 13576 6306
d) Over 3 months to 6 months 24486 12818 6486 24070 3890 14684 590 4792
e) Over 6 months to 1 year 98267 30301 19345 21270 9215 7778 3254 6771
f) Over 1 year to 3 years 50488 61822 57153 114544 38911 45953 42083 64445
g) Over 3 years to 5 years 12966 70996 102544 112906 39771 30165 70926 82855
h) Over 5 years 105231 333297 396427 495563 183114 213626 149437 140785
Foreign Currency Assets 164812 216630 161916 239736 80493 128940 7059 5580
a) 1 - 14 days 27787 41048 25986 38451 20399 22770 3239 1405
b) 15 - 28 days 5883 17225 13169 24490 798 962 79 141
c) 29 days to 3 months 41016 53596 36441 51247 32878 63037 1859 1167
d) Over 3 months to 6 months 24368 63224 32016 56507 14005 31128 1689 2769
e) Over 6 months to 1 year 37578 1464 10619 13931 12413 10888 193 98
f) Over 1 year to 3 years 13481 15354 13501 16957 - - - -
g) Over 3 years to 5 years 3282 9525 14313 22426 - - - -
h) Over 5 years 11417 15194 15870 15728 - 155 - -
Foreign Currency Liabilities 164812 216630 143952 193217 80486 128927 7059 5580
a) 1 - 14 days 22977 23610 20976 25267 19677 21688 5275 3943
b) 15 - 28 days 5583 21480 3803 12795 649 570 90 30
c) 29 days to 3 months 35402 55886 28473 26786 33389 64722 157 174
d) Over 3 months to 6 months 27657 68655 28551 46076 14999 30567 525 243
e) Over 6 months to 1 year 14269 13366 12906 22166 11710 11191 629 744
f) Over 1 year to 3 years 33587 25304 13347 5218 31 149 334 419
g) Over 3 years to 5 years 2912 - 34819 53102 32 39 50 27
h) Over 5 years 22426 8329 1076 1809 - - - -
Source : Annual accounts of banks.Source

259
TABLE B10 : MATURITY PROFILE OF SELECTED ITEMS OF LIABILITIES AND ASSETS OF SCHEDULEDCOMMERCIAL BANKS - 2012 AND 2013 (Contd.)
(Amount in ` Million)OLD PRIVATE SECTOR BANKS
AS ON MARCH 31
ItemsCatholic Syrian Bank City Union Bank Dhanlaxmi Bank Federal Bank
2012 2013 2012 2013 2012 2013 2012 2013(1) (2) (3) (4) (5) (6) (7) (8)
Deposits 106049 123416 163408 203048 118044 112021 489371 576149
a) 1 - 14 days 1819 2547 7835 11478 10300 6279 11271 18766
b) 15 - 28 days 2155 2006 1303 1228 4982 2422 5802 17418
c) 29 days to 3 months 4579 4237 9564 10986 17674 13427 46566 69885
d) Over 3 months to 6 months 8557 8220 7904 6112 23156 13183 81380 66823
e) Over 6 months to 1 year 8360 12491 16369 25370 26762 29303 110705 133516
f) Over 1 year to 3 years 26852 31789 113559 138604 32017 43410 214357 242010
g) Over 3 years to 5 years 1176 1915 6113 8470 2887 3752 13743 16671
h) Over 5 years 52549 60212 761 800 267 248 5547 11060
Borrowings 5755 1994 3487 4767 17678 15921 42410 51870
a) 1 - 14 days 2980 - - - 8032 7682 2998 5233
b) 15 - 28 days - - - - - - 1050 3300
c) 29 days to 3 months 160 - - 543 1755 679 610 5809
d) Over 3 months to 6 months 128 128 312 151 1485 1486 15696 8410
e) Over 6 months to 1 year 128 137 2762 2139 1156 1408 2407 7650
f) Over 1 year to 3 years 1904 1311 12 555 2584 2828 9928 15267
g) Over 3 years to 5 years 37 - 300 1380 2292 387 4006 6201
h) Over 5 years 418 418 100 - 375 1452 5716 -
Loans and Advances 76636 88515 121375 152461 87598 77771 377560 440967
a) 1 - 14 days 4625 4295 16778 19384 6262 3486 23161 35518
b) 15 - 28 days 2578 2284 1254 2323 1571 846 8569 10573
c) 29 days to 3 months 4590 6599 2860 8278 7597 6611 28143 31603
d) Over 3 months to 6 months 7480 13374 1712 9770 6894 7847 28535 33728
e) Over 6 months to 1 year 13615 15756 3741 30789 10475 12539 47574 59919
f) Over 1 year to 3 years 33120 36359 74716 58703 32676 28829 170695 182249
g) Over 3 years to 5 years 6216 5192 9551 11044 8390 8121 31286 33420
h) Over 5 years 4411 4656 10763 12169 13734 9492 39597 53957
Source : Annual accounts of banks.Source

260
TABLE B10 : MATURITY PROFILE OF SELECTED ITEMS OF LIABILITIES AND ASSETS OF SCHEDULEDCOMMERCIAL BANKS - 2012 AND 2013 (Contd.)
(Amount in ` Million)OLD PRIVATE SECTOR BANKS
AS ON MARCH 31
ItemsING Vysya Bank Jammu & Kashmir
Bank Karnataka Bank Karur Vysya Bank
2012 2013 2012 2013 2012 2013 2012 2013(9) (10) (11) (12) (13) (14) (15) (16)
Deposits 351954 413340 533469 642206 316083 360562 321116 386530
a) 1 - 14 days 46361 54874 24311 38923 10040 13202 15606 24892
b) 15 - 28 days 32399 35227 7876 23246 4533 4916 5059 7834
c) 29 days to 3 months 78785 90627 40335 64788 15291 16754 60370 66261
d) Over 3 months to 6 months 37130 50441 42435 26052 15162 20895 34141 39252
e) Over 6 months to 1 year 51993 60648 41799 55114 45168 64922 56015 81688
f) Over 1 year to 3 years 43514 58182 304244 346001 130836 122935 103318 80944
g) Over 3 years to 5 years 39856 39379 68078 83827 37138 48537 19075 43723
h) Over 5 years 21917 23962 4392 4255 57915 68402 27532 41937
Borrowings 56965 65113 12410 10750 11471 15798 19726 39993
a) 1 - 14 days 4100 2155 5481 4750 1603 3505 9040 26417
b) 15 - 28 days - 4328 750 - - - 346 -
c) 29 days to 3 months 7153 16020 100 - 229 1466 3109 4528
d) Over 3 months to 6 months 17612 15025 79 - 799 1179 2286 3956
e) Over 6 months to 1 year 12637 3688 - - 543 745 3408 3593
f) Over 1 year to 3 years 6057 6929 - - 2120 2499 36 -
g) Over 3 years to 5 years 2100 6962 - - 2676 1609 - -
h) Over 5 years 7306 10006 6000 6000 3500 4795 1500 1500
Loans and Advances 287214 317720 330776 392004 207207 252077 242051 297059
a) 1 - 14 days 38387 51365 10706 15697 8898 10178 10495 13929
b) 15 - 28 days 25401 27520 4354 5520 1903 2945 2260 2463
c) 29 days to 3 months 37233 33223 27738 20804 11063 16204 14005 12629
d) Over 3 months to 6 months 25874 31102 33236 36055 15186 17196 7905 8844
e) Over 6 months to 1 year 49245 46372 35035 39102 24227 35551 68675 98004
f) Over 1 year to 3 years 47053 52711 145105 183662 98699 113769 98963 112423
g) Over 3 years to 5 years 22148 28051 42481 55539 19694 26181 21487 25074
h) Over 5 years 41872 47377 32122 35625 27537 30052 18261 23693
Source : Annual accounts of banks.Source

261
TABLE B10 : MATURITY PROFILE OF SELECTED ITEMS OF LIABILITIES AND ASSETS OF SCHEDULEDCOMMERCIAL BANKS - 2012 AND 2013 (Contd.)
(Amount in ` Million)OLD PRIVATE SECTOR BANKS
AS ON MARCH 31
ItemsLakshmi Vilas Bank Nainital Bank Ratnakar Bank South Indian Bank
2012 2013 2012 2013 2012 2013 2012 2013(17) (18) (19) (20) (21) (22) (23) (24)
Deposits 141141 156190 34775 37236 47393 83405 365005 442623
a) 1 - 14 days 5161 6091 1916 2592 8631 8682 26337 27168
b) 15 - 28 days 3202 2480 677 968 2969 4090 13590 12814
c) 29 days to 3 months 14089 12059 4115 2839 8064 23555 78057 89237
d) Over 3 months to 6 months 14030 18089 4958 4767 4404 8705 45124 46202
e) Over 6 months to 1 year 26376 37055 7905 9243 9661 16392 82377 91664
f) Over 1 year to 3 years 72465 52972 9590 10614 13210 21485 108286 161040
g) Over 3 years to 5 years 5302 7811 5488 6090 371 304 7154 7529
h) Over 5 years 517 19634 127 124 84 192 4080 6970
Borrowings 5800 4800 81 74 11853 26145 5882 12846
a) 1 - 14 days - - - - 4400 13506 888 2208
b) 15 - 28 days - - - - - 1000 - 651
c) 29 days to 3 months - 1000 - - 1760 1000 509 815
d) Over 3 months to 6 months - - 7 - 895 2015 184 2964
e) Over 6 months to 1 year 2000 - - - 1405 3002 184 1280
f) Over 1 year to 3 years - 1000 2 16 1620 4000 1385 1647
g) Over 3 years to 5 years 1300 2295 29 29 1573 1453 732 1281
h) Over 5 years 2500 505 43 29 200 170 2000 2000
Loans and Advances 101887 117028 19260 21757 41190 62265 272807 318155
a) 1 - 14 days 5189 7125 1305 1563 2617 3328 12022 16400
b) 15 - 28 days 3195 5371 1214 1478 1122 1800 5824 7858
c) 29 days to 3 months 11406 19310 1288 1531 5450 6068 45386 41141
d) Over 3 months to 6 months 6833 7170 397 416 2631 3399 40680 44496
e) Over 6 months to 1 year 19839 20768 1234 901 5701 6663 73735 93018
f) Over 1 year to 3 years 42684 44567 9647 11608 12606 20662 34843 45808
g) Over 3 years to 5 years 5536 6104 1754 1849 4010 13224 25555 31980
h) Over 5 years 7205 6613 2421 2412 7054 7120 34762 37453
Source : Annual accounts of banks.
TABLE B10 : MATURITY PROFILE OF SELECTED ITEMS OF LIABILITIES AND ASSETS OF SCHEDULEDCOMMERCIAL BANKS - 2012 AND 2013 (Contd.)
(Amount in ` Million)OLD PRIVATE SECTOR BANKS
AS ON MARCH 31
ItemsLakshmi Vilas Bank Nainital Bank Ratnakar Bank South Indian Bank
2012 2013 2012 2013 2012 2013 2012 2013(17) (18) (19) (20) (21) (22) (23) (24)
Deposits 141141 156190 34775 37236 47393 83405 365005 442623
a) 1 - 14 days 5161 6091 1916 2592 8631 8682 26337 27168
b) 15 - 28 days 3202 2480 677 968 2969 4090 13590 12814
c) 29 days to 3 months 14089 12059 4115 2839 8064 23555 78057 89237
d) Over 3 months to 6 months 14030 18089 4958 4767 4404 8705 45124 46202
e) Over 6 months to 1 year 26376 37055 7905 9243 9661 16392 82377 91664
f) Over 1 year to 3 years 72465 52972 9590 10614 13210 21485 108286 161040
g) Over 3 years to 5 years 5302 7811 5488 6090 371 304 7154 7529
h) Over 5 years 517 19634 127 124 84 192 4080 6970
Borrowings 5800 4800 81 74 11853 26145 5882 12846
a) 1 - 14 days - - - - 4400 13506 888 2208
b) 15 - 28 days - - - - - 1000 - 651
c) 29 days to 3 months - 1000 - - 1760 1000 509 815
d) Over 3 months to 6 months - - 7 - 895 2015 184 2964
e) Over 6 months to 1 year 2000 - - - 1405 3002 184 1280
f) Over 1 year to 3 years - 1000 2 16 1620 4000 1385 1647
g) Over 3 years to 5 years 1300 2295 29 29 1573 1453 732 1281
h) Over 5 years 2500 505 43 29 200 170 2000 2000
Loans and Advances 101887 117028 19260 21757 41190 62265 272807 318155
a) 1 - 14 days 5189 7125 1305 1563 2617 3328 12022 16400
b) 15 - 28 days 3195 5371 1214 1478 1122 1800 5824 7858
c) 29 days to 3 months 11406 19310 1288 1531 5450 6068 45386 41141
d) Over 3 months to 6 months 6833 7170 397 416 2631 3399 40680 44496
e) Over 6 months to 1 year 19839 20768 1234 901 5701 6663 73735 93018
f) Over 1 year to 3 years 42684 44567 9647 11608 12606 20662 34843 45808
g) Over 3 years to 5 years 5536 6104 1754 1849 4010 13224 25555 31980
h) Over 5 years 7205 6613 2421 2412 7054 7120 34762 37453
Source : Annual accounts of banks.Source

262
TABLE B10 : MATURITY PROFILE OF SELECTED ITEMS OF LIABILITIES AND ASSETS OF SCHEDULEDCOMMERCIAL BANKS - 2012 AND 2013 (Contd.)
(Amount in ` Million)OLD PRIVATE SECTOR BANKS
AS ON MARCH 31
Items
Tamilnad MercantileBank
2012 2013(25) (26)
Deposits 171104 202238
a) 1 - 14 days 5601 8739
b) 15 - 28 days 2202 4241
c) 29 days to 3 months 14178 16578
d) Over 3 months to 6 months 18217 17078
e) Over 6 months to 1 year 45052 46215
f) Over 1 year to 3 years 66753 91450
g) Over 3 years to 5 years 10745 9229
h) Over 5 years 8357 8708
Borrowings 4607 2506
a) 1 - 14 days 400 162
b) 15 - 28 days - -
c) 29 days to 3 months 147 -
d) Over 3 months to 6 months - -
e) Over 6 months to 1 year 2440 1454
f) Over 1 year to 3 years 920 690
g) Over 3 years to 5 years 400 200
h) Over 5 years 300 -
Loans and Advances 137789 162560
a) 1 - 14 days 4565 5207
b) 15 - 28 days 4356 4375
c) 29 days to 3 months 18401 23370
d) Over 3 months to 6 months 25391 33079
e) Over 6 months to 1 year 32984 40499
f) Over 1 year to 3 years 30251 32141
g) Over 3 years to 5 years 12129 13071
h) Over 5 years 9712 10819
Source : Annual accounts of banks.
TABLE B10 : MATURITY PROFILE OF SELECTED ITEMS OF LIABILITIES AND ASSETS OF SCHEDULEDCOMMERCIAL BANKS - 2012 AND 2013 (Contd.)
(Amount in ` Million)OLD PRIVATE SECTOR BANKS
AS ON MARCH 31
Items
Tamilnad MercantileBank
2012 2013(25) (26)
Deposits 171104 202238
a) 1 - 14 days 5601 8739
b) 15 - 28 days 2202 4241
c) 29 days to 3 months 14178 16578
d) Over 3 months to 6 months 18217 17078
e) Over 6 months to 1 year 45052 46215
f) Over 1 year to 3 years 66753 91450
g) Over 3 years to 5 years 10745 9229
h) Over 5 years 8357 8708
Borrowings 4607 2506
a) 1 - 14 days 400 162
b) 15 - 28 days - -
c) 29 days to 3 months 147 -
d) Over 3 months to 6 months - -
e) Over 6 months to 1 year 2440 1454
f) Over 1 year to 3 years 920 690
g) Over 3 years to 5 years 400 200
h) Over 5 years 300 -
Loans and Advances 137789 162560
a) 1 - 14 days 4565 5207
b) 15 - 28 days 4356 4375
c) 29 days to 3 months 18401 23370
d) Over 3 months to 6 months 25391 33079
e) Over 6 months to 1 year 32984 40499
f) Over 1 year to 3 years 30251 32141
g) Over 3 years to 5 years 12129 13071
h) Over 5 years 9712 10819
Source : Annual accounts of banks.Source

263
TABLE B10 : MATURITY PROFILE OF SELECTED ITEMS OF LIABILITIES AND ASSETS OF SCHEDULEDCOMMERCIAL BANKS - 2012 AND 2013 (Contd.)
(Amount in ` Million)OLD PRIVATE SECTOR BANKS
AS ON MARCH 31
ItemsCatholic Syrian Bank City Union Bank Dhanlaxmi Bank Federal Bank
2012 2013 2012 2013 2012 2013 2012 2013(1) (2) (3) (4) (5) (6) (7) (8)
Investments (at book value) 31452 33011 45862 52668 43016 47049 174025 211546
a) 1 - 14 days 1572 497 1268 479 3937 3743 3525 20923
b) 15 - 28 days 490 - 2571 3526 2937 726 2690 5327
c) 29 days to 3 months 589 1425 7674 8493 5684 2270 14899 26650
d) Over 3 months to 6 months 659 100 7153 7590 - 398 7056 15648
e) Over 6 months to 1 year 219 225 11472 14311 187 174 2181 32796
f) Over 1 year to 3 years 4085 5135 11040 13062 1535 2373 8980 48191
g) Over 3 years to 5 years 3501 2610 710 1310 5985 6773 14239 7434
h) Over 5 years 20338 23018 3976 3897 22751 30591 120455 54577
Foreign Currency Assets 1512 1724 42869 24396 13058 4814 15148 12416
a) 1 - 14 days 448 523 6169 870 1569 2177 4457 4318
b) 15 - 28 days - 74 250 274 38 7 2481 18
c) 29 days to 3 months 519 628 11620 12242 6614 1086 2179 626
d) Over 3 months to 6 months 282 296 11155 6189 3125 751 2420 4328
e) Over 6 months to 1 year 93 4 13668 4817 1705 793 359 965
f) Over 1 year to 3 years 1 1 5 5 - - 2965 1217
g) Over 3 years to 5 years 1 19 - - - - 229 516
h) Over 5 years 168 179 - - 6 - 58 428
Foreign Currency Liabilities 1185 1097 42921 24414 12943 4662 25660 24359
a) 1 - 14 days 70 129 4999 442 1337 2182 1403 1641
b) 15 - 28 days 27 11 169 11 24 1 414 101
c) 29 days to 3 months 172 55 13273 12792 6418 1071 3250 7045
d) Over 3 months to 6 months 232 138 11237 5093 3185 559 13107 5496
e) Over 6 months to 1 year 308 302 13192 5886 1885 721 4742 6719
f) Over 1 year to 3 years 318 350 47 156 55 114 2218 2435
g) Over 3 years to 5 years 58 113 4 34 40 11 526 923
h) Over 5 years - - - - - 4 - -
Source : Annual accounts of banks.Source

264
TABLE B10 : MATURITY PROFILE OF SELECTED ITEMS OF LIABILITIES AND ASSETS OF SCHEDULEDCOMMERCIAL BANKS - 2012 AND 2013 (Contd.)
(Amount in ` Million)OLD PRIVATE SECTOR BANKS
AS ON MARCH 31
ItemsING Vysya Bank Jammu & Kashmir
Bank Karnataka Bank Karur Vysya Bank
2012 2013 2012 2013 2012 2013 2012 2013(9) (10) (11) (12) (13) (14) (15) (16)
Investments (at book value) 127155 182782 216243 257411 128412 134325 105813 138688
a) 1 - 14 days 15877 40770 3869 4772 2459 4857 22960 49343
b) 15 - 28 days 7782 11035 1040 4290 - - 1596 2955
c) 29 days to 3 months 22354 28465 36042 36302 4737 1456 13965 13553
d) Over 3 months to 6 months 8574 13357 6227 19494 1952 1353 9560 9978
e) Over 6 months to 1 year 18774 21005 20049 24024 1100 2163 13935 17101
f) Over 1 year to 3 years 17838 28685 31935 47521 11199 15198 30866 23609
g) Over 3 years to 5 years 21606 21837 39041 33650 16910 15152 4986 11199
h) Over 5 years 14349 17628 78041 87358 90055 94146 7946 10951
Foreign Currency Assets 16901 20579 51469 98219 33559 25468 42349 2123
a) 1 - 14 days 5594 4122 3009 4757 5835 6547 7286 727
b) 15 - 28 days 1260 2742 269 10676 1032 1096 175 95
c) 29 days to 3 months 6133 8328 17256 50594 17485 10082 6863 515
d) Over 3 months to 6 months 3699 5213 24705 23713 6028 4078 15627 786
e) Over 6 months to 1 year 25 44 6230 8479 3120 3492 12367 -
f) Over 1 year to 3 years - - - - 34 174 31 -
g) Over 3 years to 5 years 122 130 - - 26 - - -
h) Over 5 years 67 - - - - - - -
Foreign Currency Liabilities 31963 39633 51547 98246 33533 25438 23590 12886
a) 1 - 14 days 472 2651 3393 4228 5528 5279 5727 471
b) 15 - 28 days 30 4206 795 11160 241 129 135 1
c) 29 days to 3 months 7393 13038 16322 50004 18428 11275 4826 4589
d) Over 3 months to 6 months 7970 9334 24461 24106 5584 3893 6960 3902
e) Over 6 months to 1 year 7957 4091 6521 8725 3383 4285 5942 3712
f) Over 1 year to 3 years 2164 951 43 13 241 418 - 32
g) Over 3 years to 5 years 553 376 12 10 128 159 - 168
h) Over 5 years 5424 4987 - - - 1 - 11
Source : Annual accounts of banks.Source
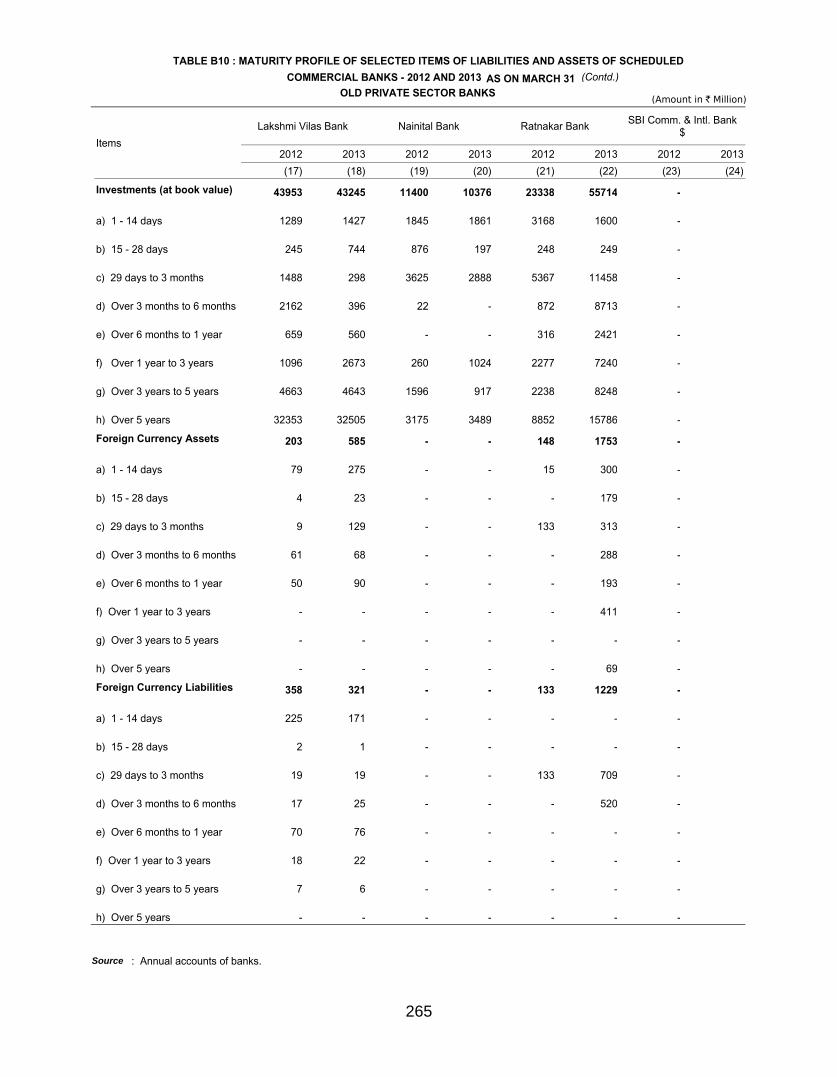
265
TABLE B10 : MATURITY PROFILE OF SELECTED ITEMS OF LIABILITIES AND ASSETS OF SCHEDULEDCOMMERCIAL BANKS - 2012 AND 2013 (Contd.)
(Amount in ` Million)OLD PRIVATE SECTOR BANKS
AS ON MARCH 31
ItemsLakshmi Vilas Bank Nainital Bank Ratnakar Bank SBI Comm. & Intl. Bank
$
2012 2013 2012 2013 2012 2013 2012 2013(17) (18) (19) (20) (21) (22) (23) (24)
Investments (at book value) 43953 43245 11400 10376 23338 55714 -
a) 1 - 14 days 1289 1427 1845 1861 3168 1600 -
b) 15 - 28 days 245 744 876 197 248 249 -
c) 29 days to 3 months 1488 298 3625 2888 5367 11458 -
d) Over 3 months to 6 months 2162 396 22 - 872 8713 -
e) Over 6 months to 1 year 659 560 - - 316 2421 -
f) Over 1 year to 3 years 1096 2673 260 1024 2277 7240 -
g) Over 3 years to 5 years 4663 4643 1596 917 2238 8248 -
h) Over 5 years 32353 32505 3175 3489 8852 15786 -
Foreign Currency Assets 203 585 - - 148 1753 -
a) 1 - 14 days 79 275 - - 15 300 -
b) 15 - 28 days 4 23 - - - 179 -
c) 29 days to 3 months 9 129 - - 133 313 -
d) Over 3 months to 6 months 61 68 - - - 288 -
e) Over 6 months to 1 year 50 90 - - - 193 -
f) Over 1 year to 3 years - - - - - 411 -
g) Over 3 years to 5 years - - - - - - -
h) Over 5 years - - - - - 69 -
Foreign Currency Liabilities 358 321 - - 133 1229 -
a) 1 - 14 days 225 171 - - - - -
b) 15 - 28 days 2 1 - - - - -
c) 29 days to 3 months 19 19 - - 133 709 -
d) Over 3 months to 6 months 17 25 - - - 520 -
e) Over 6 months to 1 year 70 76 - - - - -
f) Over 1 year to 3 years 18 22 - - - - -
g) Over 3 years to 5 years 7 6 - - - - -
h) Over 5 years - - - - - - -
Source : Annual accounts of banks.Source

266
TABLE B10 : MATURITY PROFILE OF SELECTED ITEMS OF LIABILITIES AND ASSETS OF SCHEDULEDCOMMERCIAL BANKS - 2012 AND 2013 (Contd.)
(Amount in ` Million)OLD PRIVATE SECTOR BANKS
AS ON MARCH 31
ItemsSouth Indian Bank Tamilnad Mercantile
Bank
2012 2013 2012 2013(25) (26) (27) (28)
Investments (at book value) 93999 125235 48903 53483
a) 1 - 14 days 4310 5777 906 1745
b) 15 - 28 days 647 1008 805 198
c) 29 days to 3 months 3785 9000 2680 1769
d) Over 3 months to 6 months 1130 6133 1306 558
e) Over 6 months to 1 year 3151 6744 907 78
f) Over 1 year to 3 years 9933 18941 2778 5829
g) Over 3 years to 5 years 18058 23107 8898 12787
h) Over 5 years 52985 54525 30623 30518
Foreign Currency Assets 6568 5072 598 541
a) 1 - 14 days 2993 3245 214 305
b) 15 - 28 days 171 214 24 21
c) 29 days to 3 months 1189 - 140 49
d) Over 3 months to 6 months 930 1380 96 19
e) Over 6 months to 1 year 205 234 15 19
f) Over 1 year to 3 years 1080 - 34 5
g) Over 3 years to 5 years - - - 8
h) Over 5 years - - 75 114
Foreign Currency Liabilities 6470 10232 457 437
a) 1 - 14 days 1921 2622 172 278
b) 15 - 28 days 113 63 3 2
c) 29 days to 3 months 1098 1115 169 9
d) Over 3 months to 6 months 912 3219 44 39
e) Over 6 months to 1 year 1324 1865 39 51
f) Over 1 year to 3 years 649 862 30 44
g) Over 3 years to 5 years 453 486 1 14
h) Over 5 years - - - -
Source : Annual accounts of banks.Source

267
TABLE B10 : MATURITY PROFILE OF SELECTED ITEMS OF LIABILITIES AND ASSETS OF SCHEDULEDCOMMERCIAL BANKS - 2012 AND 2013 (Contd.)
(Amount in ` Million)NEW PRIVATE SECTOR BANKS
AS ON MARCH 31
ItemsAxis Bank Development Credit
Bank HDFC Bank ICICI Bank
2012 2013 2012 2013 2012 2013 2012 2013(1) (2) (3) (4) (5) (6) (7) (8)
Deposits 2201043 2526136 63356 83638 2467065 2962470 2555000 2926136
a) 1 - 14 days 166915 181501 5943 8288 152685 227039 119150 180426
b) 15 - 28 days 76814 65905 1933 3888 67076 72881 97134 78776
c) 29 days to 3 months 237750 262583 8518 16274 211921 189571 273132 303018
d) Over 3 months to 6 months 258084 285364 7123 11247 198131 208870 288255 265481
e) Over 6 months to 1 year 533592 353264 10083 14932 96237 179595 452113 459086
f) Over 1 year to 3 years 182319 332166 28909 27096 1099660 1265685 690127 442489
g) Over 3 years to 5 years 138447 224442 668 1762 8646 52243 228550 600624
h) Over 5 years 607122 820911 179 152 632710 766585 406539 596237
Borrowings 340717 439511 11235 15256 238465 330066 1401649 1453415
a) 1 - 14 days 23717 10203 2024 4029 30809 21790 177087 188230
b) 15 - 28 days 14202 7867 76 271 1680 5651 26841 8271
c) 29 days to 3 months 28007 39185 600 500 46239 29806 80938 84904
d) Over 3 months to 6 months 43171 40500 2607 3201 17360 40296 141607 126686
e) Over 6 months to 1 year 22217 66050 2097 2689 10175 9991 223622 158589
f) Over 1 year to 3 years 35049 76059 3181 2067 24744 40289 173521 208659
g) Over 3 years to 5 years 65979 93708 650 2500 25019 64745 197146 232054
h) Over 5 years 108375 105940 - - 82438 117499 380888 446022
Loans and Advances 1697595 1969660 52844 65861 1954200 2397206 2537277 2902494
a) 1 - 14 days 50791 60540 2679 2347 119243 145489 33971 41275
b) 15 - 28 days 15322 24380 1178 1509 56029 69394 39002 56985
c) 29 days to 3 months 93629 101973 3679 3658 216890 226731 142209 185649
d) Over 3 months to 6 months 109888 112203 2408 2339 156799 226766 188829 204593
e) Over 6 months to 1 year 114775 123489 3144 6965 211024 257008 336379 319463
f) Over 1 year to 3 years 390024 453120 24058 26404 877363 1105695 1043884 1185746
g) Over 3 years to 5 years 237917 261462 4015 5853 150870 181464 388469 493900
h) Over 5 years 685250 832492 11684 16787 165983 184660 364534 414884
Source : Annual accounts of banks.Source

268
TABLE B10 : MATURITY PROFILE OF SELECTED ITEMS OF LIABILITIES AND ASSETS OF SCHEDULEDCOMMERCIAL BANKS - 2012 AND 2013 (Contd.)
(Amount in ` Million)NEW PRIVATE SECTOR BANKS
AS ON MARCH 31
ItemsIndusInd Bank Kotak Mahindra Bank Yes Bank
2012 2013 2012 2013 2012 2013(9) (10) (11) (12) (13) (14)
Deposits 423615 541167 385365 510288 491517 669556
a) 1 - 14 days 29377 52514 60389 77715 67084 86356
b) 15 - 28 days 7319 33078 23486 26826 29252 34130
c) 29 days to 3 months 121969 145056 60294 114506 90056 128802
d) Over 3 months to 6 months 33868 58782 43795 67030 91222 98147
e) Over 6 months to 1 year 91727 62523 53975 62092 136501 192640
f) Over 1 year to 3 years 128854 169132 128261 145733 24048 35536
g) Over 3 years to 5 years 5324 10455 12858 12258 52319 89478
h) Over 5 years 5177 9627 2307 4128 1035 4466
Borrowings 86820 94596 165955 204106 141565 209221
a) 1 - 14 days 17417 17373 72341 97166 44645 65019
b) 15 - 28 days 1272 4864 7494 6414 3300 12926
c) 29 days to 3 months 3832 7965 16495 25197 10837 15103
d) Over 3 months to 6 months 15539 18192 12031 14434 14290 24551
e) Over 6 months to 1 year 27684 11959 21967 29528 8929 10021
f) Over 1 year to 3 years 11994 31153 20341 21664 10818 14750
g) Over 3 years to 5 years 5993 - 8980 4043 3413 2463
h) Over 5 years 3089 3089 6306 5661 45333 64389
Loans and Advances 350640 443206 390664 484556 379886 469996
a) 1 - 14 days 35598 39031 25156 34647 17709 15145
b) 15 - 28 days 10387 3552 10437 10949 5267 10089
c) 29 days to 3 months 45890 30289 31213 44174 51593 43069
d) Over 3 months to 6 months 30784 30377 30652 40583 45472 37437
e) Over 6 months to 1 year 56887 151756 52087 49149 39000 51191
f) Over 1 year to 3 years 139411 134214 146692 189776 129371 193094
g) Over 3 years to 5 years 18267 25212 35356 45848 51164 61577
h) Over 5 years 13416 28774 59073 69430 40310 58394
Source : Annual accounts of banks.Source

269
TABLE B10 : MATURITY PROFILE OF SELECTED ITEMS OF LIABILITIES AND ASSETS OF SCHEDULEDCOMMERCIAL BANKS - 2012 AND 2013 (Contd.)
(Amount in ` Million)NEW PRIVATE SECTOR BANKS
AS ON MARCH 31
ItemsAxis Bank Development Credit
Bank HDFC Bank ICICI Bank
2012 2013 2012 2013 2012 2013 2012 2013(1) (2) (3) (4) (5) (6) (7) (8)
Investments (at book value) 931921 1137375 25178 33587 974829 1116136 1595600 1713936
a) 1 - 14 days 104746 190367 649 662 234300 206930 302520 331852
b) 15 - 28 days 58746 24965 - 69 21205 26921 95724 117813
c) 29 days to 3 months 135060 82492 2070 6039 45892 75661 77392 98700
d) Over 3 months to 6 months 74634 93280 1230 2121 61180 71830 87628 77242
e) Over 6 months to 1 year 151728 117800 784 571 54041 77526 149467 158406
f) Over 1 year to 3 years 137432 202640 2021 5170 302832 343477 245244 241872
g) Over 3 years to 5 years 69971 90498 7983 5524 38223 50511 152923 212552
h) Over 5 years 199604 335333 10441 13431 217156 263280 484703 475500
Foreign Currency Assets 324788 478485 282 1955 177462 252330 970494 1025475
a) 1 - 14 days 40181 51103 196 1572 45784 77517 110715 130877
b) 15 - 28 days 6706 43888 21 8 10749 12887 21210 29492
c) 29 days to 3 months 29498 76791 - 267 36497 58552 67039 84485
d) Over 3 months to 6 months 24974 40632 - 16 38926 51195 73970 71475
e) Over 6 months to 1 year 21391 30131 - 1 7305 11179 95327 59533
f) Over 1 year to 3 years 60678 67439 16 39 21470 25888 172330 206040
g) Over 3 years to 5 years 59435 71947 - - 13402 14046 147925 194086
h) Over 5 years 81926 96553 50 53 3330 1065 281978 249487
Foreign Currency Liabilities 371703 476082 1445 1098 133416 214461 1047889 1136241
a) 1 - 14 days 67723 26659 545 552 23214 19183 19216 86482
b) 15 - 28 days 22893 14262 81 273 4140 7776 25492 25584
c) 29 days to 3 months 53578 48232 11 17 26323 36831 114906 107712
d) Over 3 months to 6 months 42651 54233 725 15 20758 46363 129865 151527
e) Over 6 months to 1 year 48824 123618 19 94 17351 22247 241781 199375
f) Over 1 year to 3 years 27820 74963 65 148 32732 30054 197466 212433
g) Over 3 years to 5 years 61656 90707 - - 3811 46239 140533 163473
h) Over 5 years 46558 43406 - - 5088 5767 178630 189654
Source : Annual accounts of banks.Source

270
TABLE B10 : MATURITY PROFILE OF SELECTED ITEMS OF LIABILITIES AND ASSETS OF SCHEDULEDCOMMERCIAL BANKS - 2012 AND 2013 (Contd.)
(Amount in ` Million)NEW PRIVATE SECTOR BANKS
AS ON MARCH 31
ItemsIndusInd Bank Kotak Mahindra Bank Yes Bank
2012 2013 2012 2013 2012 2013(9) (10) (11) (12) (13) (14)
Investments (at book value) 145720 214542 215668 288734 277573 429760
a) 1 - 14 days 3000 4300 91853 120868 102 368
b) 15 - 28 days 397 - 8040 7961 - -
c) 29 days to 3 months 2576 25315 18810 41227 26309 43169
d) Over 3 months to 6 months 8523 6150 18370 19935 18681 19476
e) Over 6 months to 1 year 15183 4716 20767 21119 19044 31694
f) Over 1 year to 3 years 9875 20415 40855 55591 36603 56155
g) Over 3 years to 5 years 13979 17578 7045 8980 48335 85004
h) Over 5 years 92188 136067 9928 13053 128500 193894
Foreign Currency Assets 27254 31986 13983 19841 11110 24947
a) 1 - 14 days 9005 4353 5594 6484 1547 8109
b) 15 - 28 days 570 414 854 532 1105 2782
c) 29 days to 3 months 6596 3084 2661 4338 4976 8269
d) Over 3 months to 6 months 614 2361 3936 7478 3393 5692
e) Over 6 months to 1 year 307 8607 145 321 - -
f) Over 1 year to 3 years 9496 7264 213 128 - -
g) Over 3 years to 5 years 46 5387 69 13 - -
h) Over 5 years 621 516 511 546 89 95
Foreign Currency Liabilities 27295 47434 47507 52034 39453 48904
a) 1 - 14 days 2191 8147 4855 2895 2285 2268
b) 15 - 28 days 1464 5290 6444 2383 63 1067
c) 29 days to 3 months 2899 7902 10932 13876 8122 6419
d) Over 3 months to 6 months 10417 18297 5603 9288 9198 18166
e) Over 6 months to 1 year 8066 4965 10588 15207 1479 1886
f) Over 1 year to 3 years 1719 2406 6769 5788 7925 9316
g) Over 3 years to 5 years 540 363 22 154 1341 175
h) Over 5 years - 64 2293 2443 9039 9606
Source : Annual accounts of banks.Source

271
TABLE B10 : MATURITY PROFILE OF SELECTED ITEMS OF LIABILITIES AND ASSETS OF SCHEDULEDCOMMERCIAL BANKS - 2012 AND 2013 (Contd.)
(Amount in ` Million)FOREIGN BANKS
AS ON MARCH 31
ItemsAB Bank Abu Dhabi Commercial
BankAmerican Express
Banking Corp. Antwerp Diamond Bank
2012 2013 2012 2013 2012 2013 2012 2013(1) (2) (3) (4) (5) (6) (7) (8)
Deposits 145 231 6234 7043 5013 6747 768 795
a) 1 - 14 days 25 35 333 1109 400 402 88 165
b) 15 - 28 days 24 23 45 39 300 327 9 1
c) 29 days to 3 months 78 158 1233 432 1242 1718 1 3
d) Over 3 months to 6 months 2 6 406 1441 1679 2411 153 29
e) Over 6 months to 1 year 5 3 2097 996 1392 1889 517 598
f) Over 1 year to 3 years 12 6 2112 3013 - - - -
g) Over 3 years to 5 years - - 6 12 - - - -
h) Over 5 years - - 1 - - - - -
Borrowings - - 2544 5545 5633 4715 8299 6807
a) 1 - 14 days - - 340 1010 17 974 1250 1066
b) 15 - 28 days - - 254 1151 1000 470 1075 628
c) 29 days to 3 months - - 1000 2151 2616 3272 3484 2858
d) Over 3 months to 6 months - - 950 1233 - - 1562 1264
e) Over 6 months to 1 year - - - - 2000 - - -
f) Over 1 year to 3 years - - - - - - - -
g) Over 3 years to 5 years - - - - - - - -
h) Over 5 years - - - - - - 928 991
Loans and Advances 684 638 2892 5198 14741 17103 8878 7603
a) 1 - 14 days 73 84 377 180 5521 6633 737 970
b) 15 - 28 days 48 30 156 1164 6050 6633 821 874
c) 29 days to 3 months 186 212 900 629 2392 2405 5592 4454
d) Over 3 months to 6 months 268 194 206 1141 263 182 1548 1297
e) Over 6 months to 1 year 60 71 240 1422 232 497 2 2
f) Over 1 year to 3 years 45 43 884 568 105 432 2 4
g) Over 3 years to 5 years - - 119 55 176 319 - -
h) Over 5 years 4 4 11 39 2 2 176 2
Source : Annual accounts of banks.Source

272
TABLE B10 : MATURITY PROFILE OF SELECTED ITEMS OF LIABILITIES AND ASSETS OF SCHEDULEDCOMMERCIAL BANKS - 2012 AND 2013 (Contd.)
(Amount in ` Million)FOREIGN BANKS
AS ON MARCH 31
Items
Australia and NewZealand Banking Group
Bank InternasionalIndonesia Bank of America Bank of Bahrain &
Kuwait
2012 2013 2012 2013 2012 2013 2012 2013(9) (10) (11) (12) (13) (14) (15) (16)
Deposits 17350 25092 - - 59650 73780 6719 6958
a) 1 - 14 days 3405 966 - - 18600 24140 557 476
b) 15 - 28 days 2835 712 - - 3260 4970 168 289
c) 29 days to 3 months 5230 11867 - - 3870 4640 726 1044
d) Over 3 months to 6 months 2130 2531 - - 8630 1050 582 702
e) Over 6 months to 1 year 3360 8500 - - 440 410 2153 1798
f) Over 1 year to 3 years 390 516 - - 24830 38550 2517 2602
g) Over 3 years to 5 years - - - - 10 20 16 46
h) Over 5 years - - - - 10 - - -
Borrowings 5947 7866 - - 53140 57130 2212 1557
a) 1 - 14 days - 2000 - - 50910 57130 1361 1397
b) 15 - 28 days 865 - - - 2050 - - -
c) 29 days to 3 months 1089 4451 - - 80 - 761 160
d) Over 3 months to 6 months 3994 1414 - - - - 90 -
e) Over 6 months to 1 year - - - - 100 - - -
f) Over 1 year to 3 years - - - - - - - -
g) Over 3 years to 5 years - - - - - - - -
h) Over 5 years - - - - - - - -
Loans and Advances 13187 23767 - - 62050 76230 6436 6926
a) 1 - 14 days 3541 2131 - - 11080 25660 530 716
b) 15 - 28 days 2551 1210 - - 5810 14930 1146 485
c) 29 days to 3 months 3105 10383 - - 20410 13810 634 2051
d) Over 3 months to 6 months 3371 3299 - - 4590 6820 793 1304
e) Over 6 months to 1 year 620 3620 - - 18530 1620 860 779
f) Over 1 year to 3 years - 2388 - - 1630 12130 2209 1325
g) Over 3 years to 5 years - 738 - - - 1250 227 237
h) Over 5 years - - - - - 10 36 28
Source : Annual accounts of banks.Source

273
TABLE B10 : MATURITY PROFILE OF SELECTED ITEMS OF LIABILITIES AND ASSETS OF SCHEDULEDCOMMERCIAL BANKS - 2012 AND 2013 (Contd.)
(Amount in ` Million)FOREIGN BANKS
AS ON MARCH 31
ItemsBank of Ceylon Bank of Nova Scotia Bank of Tokyo-
Mitsubishi UFJ Barclays Bank
2012 2013 2012 2013 2012 2013 2012 2013(17) (18) (19) (20) (21) (22) (23) (24)
Deposits 1023 1156 46816 60556 32842 41464 53826 50632
a) 1 - 14 days 65 87 20265 25942 11117 12774 14546 13326
b) 15 - 28 days 11 - 7781 8173 2924 5087 3541 10519
c) 29 days to 3 months 119 145 10524 17292 4099 6651 8598 12721
d) Over 3 months to 6 months 62 42 4457 4747 1015 866 8016 4127
e) Over 6 months to 1 year 86 101 740 706 752 1517 6323 5277
f) Over 1 year to 3 years 541 570 3017 3653 12935 14568 10318 2929
g) Over 3 years to 5 years 139 211 33 43 - - 2430 1709
h) Over 5 years - - - - - - 55 24
Borrowings - 84 46833 58567 40217 52729 107904 122641
a) 1 - 14 days - 84 11726 21786 10055 10317 47804 79263
b) 15 - 28 days - - 3445 6619 865 6891 5432 1086
c) 29 days to 3 months - - 8457 14940 15396 11501 9162 32462
d) Over 3 months to 6 months - - 14875 9793 7720 4017 4883 9830
e) Over 6 months to 1 year - - 698 - 5113 4886 6393 -
f) Over 1 year to 3 years - - 2544 - 1068 977 34230 -
g) Over 3 years to 5 years - - 5088 5429 - 14141 - -
h) Over 5 years - - - - - - - -
Loans and Advances 809 999 66056 77661 64525 68395 86570 84723
a) 1 - 14 days 131 16 10836 10036 17101 25035 18501 18092
b) 15 - 28 days 34 152 10046 18793 2106 5209 3911 8072
c) 29 days to 3 months 112 135 21547 29179 19521 12705 7747 7006
d) Over 3 months to 6 months 124 41 20966 18132 10836 10623 7215 14218
e) Over 6 months to 1 year 80 99 1073 133 8221 9411 18164 20163
f) Over 1 year to 3 years 271 429 1412 826 4144 4870 20813 14762
g) Over 3 years to 5 years 28 76 40 394 2518 524 3553 1520
h) Over 5 years 30 52 136 169 80 18 6667 892
Source : Annual accounts of banks.Source

274
TABLE B10 : MATURITY PROFILE OF SELECTED ITEMS OF LIABILITIES AND ASSETS OF SCHEDULEDCOMMERCIAL BANKS - 2012 AND 2013 (Contd.)
(Amount in ` Million)FOREIGN BANKS
AS ON MARCH 31
ItemsBNP Paribas Chinatrust Commercial
Bank Citibank Commonwealth Bank ofAustralia
2012 2013 2012 2013 2012 2013 2012 2013(25) (26) (27) (28) (29) (30) (31) (32)
Deposits 59004 55797 1466 1927 646977 665594 109 513
a) 1 - 14 days 9767 17116 376 708 112709 102957 15 61
b) 15 - 28 days 5776 3453 306 287 31319 34386 4 11
c) 29 days to 3 months 13295 7664 110 361 48709 76379 11 61
d) Over 3 months to 6 months 5978 9271 62 49 37918 43158 1 24
e) Over 6 months to 1 year 4048 3799 107 173 76677 66076 26 166
f) Over 1 year to 3 years 20139 11780 507 344 336659 335436 52 190
g) Over 3 years to 5 years - 2714 - 6 2370 6743 - -
h) Over 5 years - - - - 616 460 - -
Borrowings 20653 35453 361 661 289246 318560 411 756
a) 1 - 14 days 14593 28593 280 609 183534 185649 23 116
b) 15 - 28 days - - - - - - 7 -
c) 29 days to 3 months - - 81 47 15306 8184 176 521
d) Over 3 months to 6 months - 800 - 5 10732 9265 206 119
e) Over 6 months to 1 year - 683 - - 52615 54395 - -
f) Over 1 year to 3 years 683 778 - - 26965 61053 - -
g) Over 3 years to 5 years 1777 3256 - - 94 15 - -
h) Over 5 years 3599 1342 - - - - - -
Loans and Advances 61842 77373 2846 2765 471030 520355 899 1652
a) 1 - 14 days 15107 6320 368 547 26282 41272 22 247
b) 15 - 28 days 1968 5795 382 302 18087 35501 12 25
c) 29 days to 3 months 5798 11213 1599 1503 61616 65981 598 1026
d) Over 3 months to 6 months 1558 5720 200 143 68617 48976 242 155
e) Over 6 months to 1 year 2772 6008 42 - 50806 47299 8 24
f) Over 1 year to 3 years 9709 35712 253 269 103671 134913 15 96
g) Over 3 years to 5 years 8155 6549 1 1 30205 42718 3 77
h) Over 5 years 16775 57 1 - 111748 103696 - 3
Source : Annual accounts of banks.Source

275
TABLE B10 : MATURITY PROFILE OF SELECTED ITEMS OF LIABILITIES AND ASSETS OF SCHEDULEDCOMMERCIAL BANKS - 2012 AND 2013 (Contd.)
(Amount in ` Million)FOREIGN BANKS
AS ON MARCH 31
ItemsCredit Agricole Credit Suisse AG DBS Bank Deutsche Bank
2012 2013 2012 2013 2012 2013 2012 2013(33) (34) (35) (36) (37) (38) (39) (40)
Deposits 9131 5963 3484 4187 129220 154876 168427 207943
a) 1 - 14 days 2628 2625 1202 1283 44331 59018 32786 33670
b) 15 - 28 days 1120 466 - 130 13845 19258 3850 8334
c) 29 days to 3 months 1404 943 1900 1710 17778 31408 7448 14450
d) Over 3 months to 6 months 621 705 - 1002 9930 12821 7742 15193
e) Over 6 months to 1 year 2244 491 - - 28411 13760 18252 21394
f) Over 1 year to 3 years 1114 733 383 62 10932 14579 98274 111402
g) Over 3 years to 5 years - - - - 2771 2800 73 3500
h) Over 5 years - - - - 1222 1232 1 -
Borrowings 47978 35291 8783 16502 148239 168474 12702 81128
a) 1 - 14 days 37650 26551 6239 13470 58562 99562 4895 69080
b) 15 - 28 days - 679 - 2000 20698 11828 - -
c) 29 days to 3 months 3307 2198 2544 - 18457 25788 - 4343
d) Over 3 months to 6 months - - - 1031 3309 1146 1027 885
e) Over 6 months to 1 year 1526 - - - 7367 8349 - 6200
f) Over 1 year to 3 years - - - - 19495 21801 6781 620
g) Over 3 years to 5 years 1272 1357 - - 20350 - - -
h) Over 5 years 4223 4506 - - - - - -
Loans and Advances 19186 24042 2500 4550 128443 138581 125489 223741
a) 1 - 14 days 1530 1347 - 1250 19689 34814 57174 44738
b) 15 - 28 days 377 5605 - 750 27291 11381 1495 14391
c) 29 days to 3 months 6720 6512 - 1500 28099 38106 3951 45618
d) Over 3 months to 6 months 4427 5982 - 1050 20400 20368 2705 22848
e) Over 6 months to 1 year 2526 1719 1000 - 11672 9365 5170 19284
f) Over 1 year to 3 years 3079 2454 1500 - 12918 12591 33897 45692
g) Over 3 years to 5 years 30 357 - - 5221 10581 3786 6998
h) Over 5 years 499 65 - - 3155 1375 17310 24173
Source : Annual accounts of banks.Source

276
TABLE B10 : MATURITY PROFILE OF SELECTED ITEMS OF LIABILITIES AND ASSETS OF SCHEDULEDCOMMERCIAL BANKS - 2012 AND 2013 (Contd.)
(Amount in ` Million)FOREIGN BANKS
AS ON MARCH 31
ItemsFirstRand Bank Hongkong & Shanghai
Banking CorporationHSBC Bank Oman
S.A.O.G.
Industrial andCommercial Bank of
China2012 2013 2012 2013 2012 2013 2012 2013(41) (42) (43) (44) (45) (46) (47) (48)
Deposits 373 713 614233 568660 1552 1488 1 1771
a) 1 - 14 days 11 62 146206 135747 71 103 1 938
b) 15 - 28 days 7 224 36952 22960 22 44 - 1
c) 29 days to 3 months 7 15 79795 69416 128 168 - 40
d) Over 3 months to 6 months 238 151 38599 25072 188 145 - 385
e) Over 6 months to 1 year 34 66 80800 64713 445 436 - -
f) Over 1 year to 3 years 69 195 16457 24273 699 593 - 407
g) Over 3 years to 5 years - - 215423 226480 - - - -
h) Over 5 years 7 - - - - - - -
Borrowings 4509 6937 104775 177108 356 - - 1086
a) 1 - 14 days 2220 4909 94600 125266 51 - - -
b) 15 - 28 days 71 - - 10857 - - - -
c) 29 days to 3 months 1951 1962 7631 40985 305 - - 1086
d) Over 3 months to 6 months 267 56 - - - - - -
e) Over 6 months to 1 year - 10 2544 - - - - -
f) Over 1 year to 3 years - - - - - - - -
g) Over 3 years to 5 years - - - - - - - -
h) Over 5 years - - - - - - - -
Loans and Advances 2183 2594 355123 357087 41 51 455 3372
a) 1 - 14 days 28 129 66710 74196 - - - -
b) 15 - 28 days 92 8 53964 31932 - - 227 -
c) 29 days to 3 months 1149 1431 57869 68392 - 34 - 147
d) Over 3 months to 6 months 494 495 59838 63185 - - 3 1100
e) Over 6 months to 1 year 250 350 29446 26076 21 1 - 1025
f) Over 1 year to 3 years 170 180 45757 40335 6 8 225 1100
g) Over 3 years to 5 years - - 19431 25139 5 1 - -
h) Over 5 years - - 22109 27834 8 6 - -
Source : Annual accounts of banks.Source
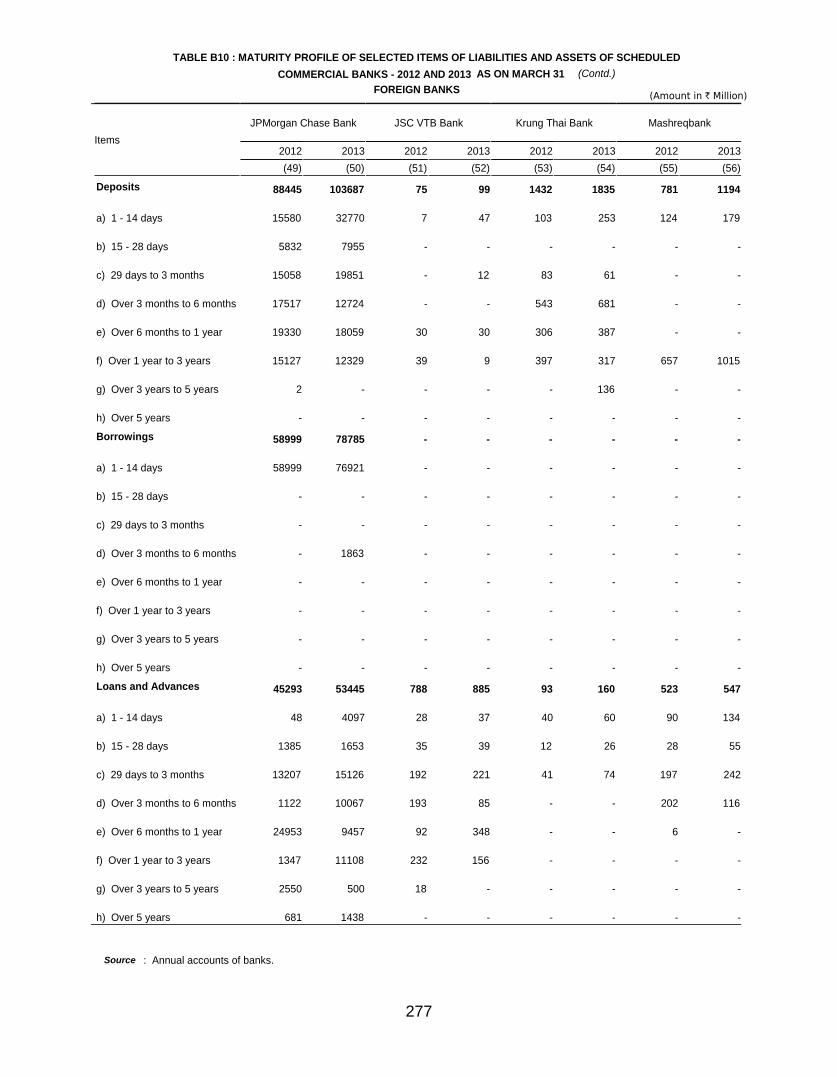
277
TABLE B10 : MATURITY PROFILE OF SELECTED ITEMS OF LIABILITIES AND ASSETS OF SCHEDULEDCOMMERCIAL BANKS - 2012 AND 2013 (Contd.)
(Amount in ` Million)FOREIGN BANKS
AS ON MARCH 31
ItemsJPMorgan Chase Bank JSC VTB Bank Krung Thai Bank Mashreqbank
2012 2013 2012 2013 2012 2013 2012 2013(49) (50) (51) (52) (53) (54) (55) (56)
Deposits 88445 103687 75 99 1432 1835 781 1194
a) 1 - 14 days 15580 32770 7 47 103 253 124 179
b) 15 - 28 days 5832 7955 - - - - - -
c) 29 days to 3 months 15058 19851 - 12 83 61 - -
d) Over 3 months to 6 months 17517 12724 - - 543 681 - -
e) Over 6 months to 1 year 19330 18059 30 30 306 387 - -
f) Over 1 year to 3 years 15127 12329 39 9 397 317 657 1015
g) Over 3 years to 5 years 2 - - - - 136 - -
h) Over 5 years - - - - - - - -
Borrowings 58999 78785 - - - - - -
a) 1 - 14 days 58999 76921 - - - - - -
b) 15 - 28 days - - - - - - - -
c) 29 days to 3 months - - - - - - - -
d) Over 3 months to 6 months - 1863 - - - - - -
e) Over 6 months to 1 year - - - - - - - -
f) Over 1 year to 3 years - - - - - - - -
g) Over 3 years to 5 years - - - - - - - -
h) Over 5 years - - - - - - - -
Loans and Advances 45293 53445 788 885 93 160 523 547
a) 1 - 14 days 48 4097 28 37 40 60 90 134
b) 15 - 28 days 1385 1653 35 39 12 26 28 55
c) 29 days to 3 months 13207 15126 192 221 41 74 197 242
d) Over 3 months to 6 months 1122 10067 193 85 - - 202 116
e) Over 6 months to 1 year 24953 9457 92 348 - - 6 -
f) Over 1 year to 3 years 1347 11108 232 156 - - - -
g) Over 3 years to 5 years 2550 500 18 - - - - -
h) Over 5 years 681 1438 - - - - - -
Source : Annual accounts of banks.Source

278
TABLE B10 : MATURITY PROFILE OF SELECTED ITEMS OF LIABILITIES AND ASSETS OF SCHEDULEDCOMMERCIAL BANKS - 2012 AND 2013 (Contd.)
(Amount in ` Million)FOREIGN BANKS
AS ON MARCH 31
ItemsMizuho Corporate Bank National Australia Bank Rabobank International Royal Bank of Scotland
2012 2013 2012 2013 2012 2013 2012 2013(57) (58) (59) (60) (61) (62) (63) (64)
Deposits 6728 17434 - - 117 834 130395 127494
a) 1 - 14 days 1388 5296 - - 60 682 25215 29917
b) 15 - 28 days 420 481 - - - - 4836 7693
c) 29 days to 3 months 301 1816 - - 18 19 21520 12609
d) Over 3 months to 6 months 102 1374 - - - - 7694 7577
e) Over 6 months to 1 year 92 648 - - - - 6362 10672
f) Over 1 year to 3 years 4424 7818 - - 39 133 64566 58836
g) Over 3 years to 5 years - - - - - - 187 182
h) Over 5 years - - - - - - 14 7
Borrowings 12284 22040 - 1635 1 1164 60391 71226
a) 1 - 14 days 3561 4660 - 1635 1 521 40145 52679
b) 15 - 28 days 2137 12228 - - - - 763 6709
c) 29 days to 3 months 4271 60 - - - 643 3632 1581
d) Over 3 months to 6 months 229 - - - - - - -
e) Over 6 months to 1 year - 3529 - - - - - -
f) Over 1 year to 3 years - 1563 - - - - 5592 -
g) Over 3 years to 5 years 2086 - - - - - 1974 3100
h) Over 5 years - - - - - - 8285 7157
Loans and Advances 35816 55188 - 1636 3513 5899 125345 125339
a) 1 - 14 days 7403 13309 - 1636 210 1781 14957 16565
b) 15 - 28 days 6551 10340 - - 330 1093 8296 12762
c) 29 days to 3 months 5927 5736 - - 1122 1828 67155 46489
d) Over 3 months to 6 months 6332 7253 - - 551 599 10269 17251
e) Over 6 months to 1 year 4246 4045 - - 1000 225 1871 3905
f) Over 1 year to 3 years 3196 7176 - - 300 374 19115 25784
g) Over 3 years to 5 years 2120 4830 - - - - 641 553
h) Over 5 years 42 2501 - - - - 3041 2031
Source : Annual accounts of banks.Source

279
TABLE B10 : MATURITY PROFILE OF SELECTED ITEMS OF LIABILITIES AND ASSETS OF SCHEDULEDCOMMERCIAL BANKS - 2012 AND 2013 (Contd.)
(Amount in ` Million)FOREIGN BANKS
AS ON MARCH 31
ItemsSberbank Shinhan Bank Societe Generale Sonali Bank
2012 2013 2012 2013 2012 2013 2012 2013(65) (66) (67) (68) (69) (70) (71) (72)
Deposits - 47 10371 14404 12807 13826 312 398
a) 1 - 14 days - 7 2410 5707 2768 3552 43 54
b) 15 - 28 days - - 593 1116 2537 2322 10 13
c) 29 days to 3 months - 40 2946 1361 5806 6596 5 6
d) Over 3 months to 6 months - - 1562 3131 421 545 11 14
e) Over 6 months to 1 year - - 502 467 718 375 20 26
f) Over 1 year to 3 years - - 2315 2569 545 347 220 281
g) Over 3 years to 5 years - - 13 36 11 80 1 1
h) Over 5 years - - 31 17 - 9 2 3
Borrowings - 270 1156 3673 9262 8364 - -
a) 1 - 14 days - - 150 1986 9262 8255 - -
b) 15 - 28 days - - 102 663 - - - -
c) 29 days to 3 months - 43 904 916 - 109 - -
d) Over 3 months to 6 months - 227 - 109 - - - -
e) Over 6 months to 1 year - - - - - - - -
f) Over 1 year to 3 years - - - - - - - -
g) Over 3 years to 5 years - - - - - - - -
h) Over 5 years - - - - - - - -
Loans and Advances - 370 9145 12061 10564 17569 185 184
a) 1 - 14 days - - 682 1204 967 3001 63 62
b) 15 - 28 days - - 346 286 231 82 70 70
c) 29 days to 3 months - 43 1066 2144 1655 2176 - -
d) Over 3 months to 6 months - 227 1062 2144 316 1371 11 11
e) Over 6 months to 1 year - - 3931 4183 510 188 22 22
f) Over 1 year to 3 years - 100 649 1458 6231 10604 - -
g) Over 3 years to 5 years - - 1386 563 641 133 7 7
h) Over 5 years - - 24 79 14 14 11 11
Source : Annual accounts of banks.Source

280
TABLE B10 : MATURITY PROFILE OF SELECTED ITEMS OF LIABILITIES AND ASSETS OF SCHEDULEDCOMMERCIAL BANKS - 2012 AND 2013 (Contd.)
(Amount in ` Million)FOREIGN BANKS
AS ON MARCH 31
Items
Standard CharteredBank State Bank of Mauritius Sumitomo Mitsui
Banking Corporation UBS AG
2012 2013 2012 2013 2012 2013 2012 2013(73) (74) (75) (76) (77) (78) (79) (80)
Deposits 639647 620017 7662 6009 - 15 6022 25575
a) 1 - 14 days 148658 121488 1996 2895 - 2 282 747
b) 15 - 28 days 57136 55715 32 176 - - 361 -
c) 29 days to 3 months 123070 127495 1740 76 - 2 3798 5904
d) Over 3 months to 6 months 57369 57207 502 210 - - 6 3152
e) Over 6 months to 1 year 55569 65698 982 1216 - - 1505 13499
f) Over 1 year to 3 years 191204 177103 2411 1290 - 11 70 2273
g) Over 3 years to 5 years 6476 15298 - 145 - - - -
h) Over 5 years 164 14 - 3 - - - -
Borrowings 126182 181423 2944 2376 - - 17115 3124
a) 1 - 14 days 41657 86774 2274 2376 - - 16047 549
b) 15 - 28 days 15219 11279 - - - - - 1086
c) 29 days to 3 months 15602 38000 670 - - - 1068 -
d) Over 3 months to 6 months 9544 12229 - - - - - 1490
e) Over 6 months to 1 year 5922 - - - - - - -
f) Over 1 year to 3 years 12800 6000 - - - - - -
g) Over 3 years to 5 years - 13571 - - - - - -
h) Over 5 years 25438 13571 - - - - - -
Loans and Advances 555700 619543 8122 8150 - - 6312 9741
a) 1 - 14 days 97316 115095 1147 1008 - - 1574 400
b) 15 - 28 days 24718 31527 604 385 - - 555 1722
c) 29 days to 3 months 115257 92909 2015 1251 - - 1633 830
d) Over 3 months to 6 months 65185 70209 1957 1596 - - 2000 1990
e) Over 6 months to 1 year 37451 34536 785 1468 - - 550 -
f) Over 1 year to 3 years 80508 92942 1396 1689 - - - 4800
g) Over 3 years to 5 years 30327 61875 63 287 - - - -
h) Over 5 years 104939 120450 156 466 - - - -
Source : Annual accounts of banks.Source
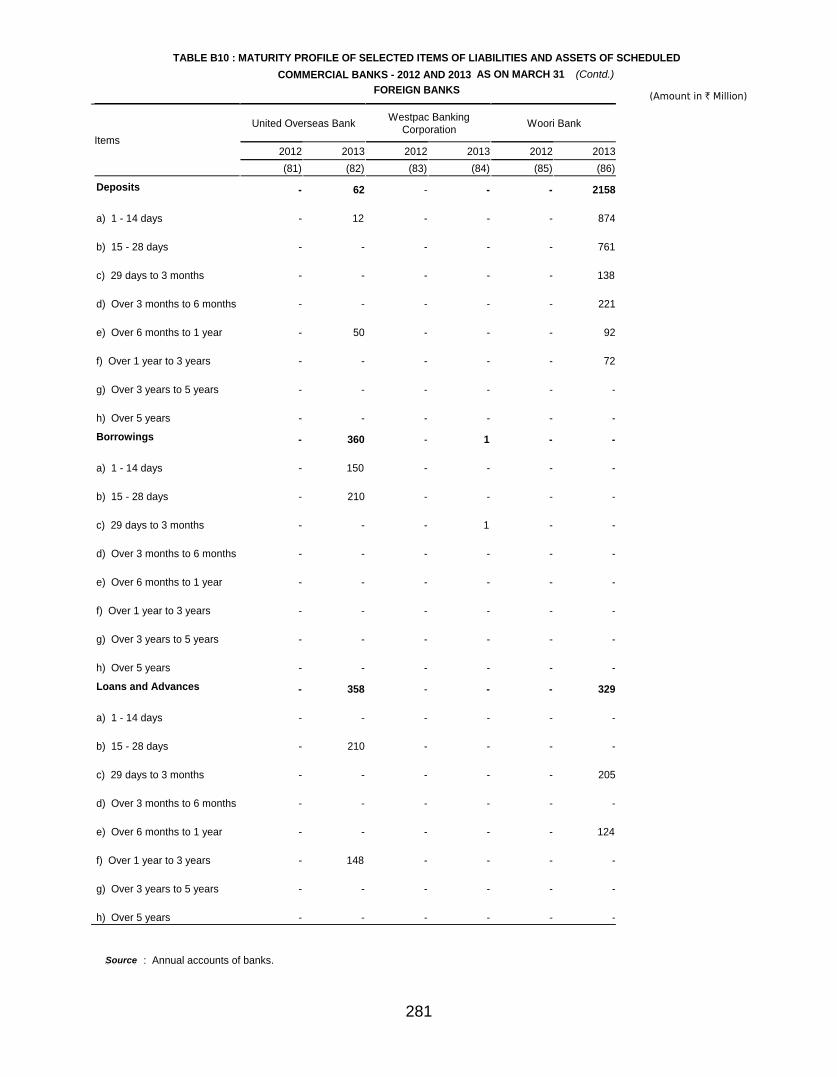
281
TABLE B10 : MATURITY PROFILE OF SELECTED ITEMS OF LIABILITIES AND ASSETS OF SCHEDULEDCOMMERCIAL BANKS - 2012 AND 2013 (Concld.)
(Amount in ` Million)FOREIGN BANKS
AS ON MARCH 31
ItemsUnited Overseas Bank Westpac Banking
Corporation Woori Bank
2012 2013 2012 2013 2012 2013(81) (82) (83) (84) (85) (86)
Deposits - 62 - - - 2158
a) 1 - 14 days - 12 - - - 874
b) 15 - 28 days - - - - - 761
c) 29 days to 3 months - - - - - 138
d) Over 3 months to 6 months - - - - - 221
e) Over 6 months to 1 year - 50 - - - 92
f) Over 1 year to 3 years - - - - - 72
g) Over 3 years to 5 years - - - - - -
h) Over 5 years - - - - - -
Borrowings - 360 - 1 - -
a) 1 - 14 days - 150 - - - -
b) 15 - 28 days - 210 - - - -
c) 29 days to 3 months - - - 1 - -
d) Over 3 months to 6 months - - - - - -
e) Over 6 months to 1 year - - - - - -
f) Over 1 year to 3 years - - - - - -
g) Over 3 years to 5 years - - - - - -
h) Over 5 years - - - - - -
Loans and Advances - 358 - - - 329
a) 1 - 14 days - - - - - -
b) 15 - 28 days - 210 - - - -
c) 29 days to 3 months - - - - - 205
d) Over 3 months to 6 months - - - - - -
e) Over 6 months to 1 year - - - - - 124
f) Over 1 year to 3 years - 148 - - - -
g) Over 3 years to 5 years - - - - - -
h) Over 5 years - - - - - -
Source : Annual accounts of banks.
(Contd.)
Source

282
TABLE B10 : MATURITY PROFILE OF SELECTED ITEMS OF LIABILITIES AND ASSETS OF SCHEDULEDCOMMERCIAL BANKS - 2012 AND 2013 (Contd.)
(Amount in ` Million)FOREIGN BANKSAS ON MARCH 31
ItemsAB Bank Abu Dhabi Commercial
BankAmerican Express
Banking Corp. Antwerp Diamond Bank
2012 2013 2012 2013 2012 2013 2012 2013(1) (2) (3) (4) (5) (6) (7) (8)
Investments (at book value) 162 251 2265 2326 3412 3909 1592 1391
a) 1 - 14 days - - 442 150 1526 1132 - 175
b) 15 - 28 days - - 29 72 237 652 - -
c) 29 days to 3 months 20 65 317 99 418 577 68 11
d) Over 3 months to 6 months 84 65 109 87 311 916 1300 993
e) Over 6 months to 1 year 57 93 702 105 716 337 224 212
f) Over 1 year to 3 years - 28 490 188 128 188 - -
g) Over 3 years to 5 years 1 - 176 492 - 5 - -
h) Over 5 years - - - 1133 77 103 - -
Foreign Currency Assets 135 883 89 1108 251 395 8518 7724
a) 1 - 14 days 90 442 63 157 4 215 560 1049
b) 15 - 28 days 45 265 2 11 247 107 821 874
c) 29 days to 3 months - 177 7 13 - 74 5591 4453
d) Over 3 months to 6 months - - 3 636 - - 1547 1296
e) Over 6 months to 1 year - - - 276 - - - -
f) Over 1 year to 3 years - - 15 15 - - - -
g) Over 3 years to 5 years - - - - - - - -
h) Over 5 years - - - - - - - 53
Foreign Currency Liabilities 302 990 1217 3023 462 608 8731 7210
a) 1 - 14 days 202 495 77 787 98 12 1299 1101
b) 15 - 28 days 101 297 264 660 364 450 1079 518
c) 29 days to 3 months - 198 100 620 - - 3492 2834
d) Over 3 months to 6 months - - 210 220 - 145 1565 1402
e) Over 6 months to 1 year - - 361 376 - - 366 365
f) Over 1 year to 3 years - - 204 360 - 1 - -
g) Over 3 years to 5 years - - - - - - - -
h) Over 5 years - - - - - - 928 991
Source : Annual accounts of banks.Source

283
TABLE B10 : MATURITY PROFILE OF SELECTED ITEMS OF LIABILITIES AND ASSETS OF SCHEDULEDCOMMERCIAL BANKS - 2012 AND 2013 (Contd.)
(Amount in ` Million)FOREIGN BANKSAS ON MARCH 31
Items
Australia and NewZealand Banking Group
Bank InternasionalIndonesia Bank of America Bank of Bahrain &
Kuwait
2012 2013 2012 2013 2012 2013 2012 2013(9) (10) (11) (12) (13) (14) (15) (16)
Investments (at book value) 4520 9950 - - 82260 88340 3395 3254
a) 1 - 14 days 737 3363 - - 68700 73040 345 738
b) 15 - 28 days 712 447 - - 370 7010 50 473
c) 29 days to 3 months 673 2007 - - 9840 1000 1099 832
d) Over 3 months to 6 months 758 2526 - - 980 380 182 175
e) Over 6 months to 1 year 1484 1460 - - 50 480 745 419
f) Over 1 year to 3 years 132 119 - - 2230 6280 955 598
g) Over 3 years to 5 years - - - - - 20 5 20
h) Over 5 years 23 27 - - 90 130 15 -
Foreign Currency Assets 4961 11016 - - 11490 19860 3136 2567
a) 1 - 14 days 1132 3218 - - 2900 300 1364 413
b) 15 - 28 days 957 - - - 590 6530 466 54
c) 29 days to 3 months 1109 3447 - - 5220 6650 322 857
d) Over 3 months to 6 months 1610 2341 - - 2680 5470 417 851
e) Over 6 months to 1 year - 1847 - - 100 910 85 214
f) Over 1 year to 3 years - - - - - - 425 107
g) Over 3 years to 5 years - - - - - - 17 -
h) Over 5 years 153 163 - - - - 41 73
Foreign Currency Liabilities 6176 24101 - - 16120 20160 3820 1744
a) 1 - 14 days 210 695 - - 10300 15500 843 684
b) 15 - 28 days 866 235 - - 60 - 41 21
c) 29 days to 3 months 1092 14525 - - 80 - 896 145
d) Over 3 months to 6 months 4008 2702 - - - - 335 245
e) Over 6 months to 1 year - 5944 - - 100 - 542 333
f) Over 1 year to 3 years - - - - 5580 4660 1164 289
g) Over 3 years to 5 years - - - - - - - 28
h) Over 5 years - - - - - - - -
Source : Annual accounts of banks.Source

284
TABLE B10 : MATURITY PROFILE OF SELECTED ITEMS OF LIABILITIES AND ASSETS OF SCHEDULEDCOMMERCIAL BANKS - 2012 AND 2013 (Contd.)
(Amount in ` Million)FOREIGN BANKSAS ON MARCH 31
ItemsBank of Ceylon Bank of Nova Scotia Bank of Tokyo-
Mitsubishi UFJ Barclays Bank
2012 2013 2012 2013 2012 2013 2012 2013(17) (18) (19) (20) (21) (22) (23) (24)
Investments (at book value) 602 498 34831 48422 35867 44608 116000 138232
a) 1 - 14 days 10 - 16736 29788 2483 499 101626 96986
b) 15 - 28 days - - 2948 3677 497 335 818 13327
c) 29 days to 3 months - - 4985 8013 6609 5079 1848 6287
d) Over 3 months to 6 months 3 - 5393 3775 5125 8500 1642 5467
e) Over 6 months to 1 year 281 186 1323 656 9603 13014 2129 6775
f) Over 1 year to 3 years - - 2101 1153 2527 3646 6996 7349
g) Over 3 years to 5 years 145 162 1345 1360 8066 8330 370 344
h) Over 5 years 164 150 - - 957 5206 570 1695
Foreign Currency Assets 281 466 47136 59757 31175 27233 29904 33116
a) 1 - 14 days 271 448 6929 11529 5756 4407 13198 16697
b) 15 - 28 days - - 8201 12932 865 990 3629 6378
c) 29 days to 3 months - - 13490 21609 13921 9757 5105 3270
d) Over 3 months to 6 months - - 17212 13345 6245 7397 3479 5873
e) Over 6 months to 1 year - - - - 3816 4071 2874 325
f) Over 1 year to 3 years - - - - - - 48 39
g) Over 3 years to 5 years - - - - - - 676 141
h) Over 5 years 10 18 1304 342 572 611 895 392
Foreign Currency Liabilities 56 - 47266 59630 45419 48692 54668 55029
a) 1 - 14 days 56 - 8587 9432 8197 8438 24089 15677
b) 15 - 28 days - - 4447 10863 877 2905 4994 1129
c) 29 days to 3 months - - 10900 23190 15405 11502 8429 32851
d) Over 3 months to 6 months - - 13838 9035 7724 4019 6976 276
e) Over 6 months to 1 year - - 121 401 5278 5101 4469 4370
f) Over 1 year to 3 years - - 4286 1258 2850 2586 5622 726
g) Over 3 years to 5 years - - 5088 5429 5088 14141 90 -
h) Over 5 years - - - 24 - - - -
Source : Annual accounts of banks.Source

285
TABLE B10 : MATURITY PROFILE OF SELECTED ITEMS OF LIABILITIES AND ASSETS OF SCHEDULEDCOMMERCIAL BANKS - 2012 AND 2013 (Contd.)
(Amount in ` Million)FOREIGN BANKSAS ON MARCH 31
ItemsBNP Paribas Chinatrust Commercial
Bank Citibank Commonwealth Bank ofAustralia
2012 2013 2012 2013 2012 2013 2012 2013(25) (26) (27) (28) (29) (30) (31) (32)
Investments (at book value) 33866 45643 520 1197 431667 440766 164 347
a) 1 - 14 days 15072 13825 189 265 315402 217743 3 19
b) 15 - 28 days 2977 2451 84 - 6053 30959 48 113
c) 29 days to 3 months 3311 6516 - 74 12898 32644 49 34
d) Over 3 months to 6 months 2024 5554 - 51 4656 11590 48 107
e) Over 6 months to 1 year 993 7751 - 2 13043 19411 5 36
f) Over 1 year to 3 years 5108 2963 114 805 69731 80935 10 38
g) Over 3 years to 5 years 3376 4747 135 - 395 12400 - -
h) Over 5 years 1005 1835 - - 9491 35084 - -
Foreign Currency Assets 2954 20494 90 553 202817 237020 429 385
a) 1 - 14 days 1100 1735 9 24 75761 103561 21 28
b) 15 - 28 days 46 283 - 13 11236 20619 - 3
c) 29 days to 3 months 373 4357 81 388 31324 36258 172 216
d) Over 3 months to 6 months 181 2983 - 128 45638 31581 236 138
e) Over 6 months to 1 year 19 4 - - 13981 26766 - -
f) Over 1 year to 3 years 19 8243 - - 3912 7100 - -
g) Over 3 years to 5 years 5 2727 - - 6949 10070 - -
h) Over 5 years 1212 162 - - 14015 1065 - -
Foreign Currency Liabilities 13561 20579 91 534 254812 268224 433 939
a) 1 - 14 days 2277 10475 10 483 34413 21923 23 122
b) 15 - 28 days 9 14 - - 2138 2400 7 -
c) 29 days to 3 months 689 69 82 47 28978 26228 176 530
d) Over 3 months to 6 months 427 44 - 5 30420 22629 206 132
e) Over 6 months to 1 year 311 1276 - - 77798 87403 20 124
f) Over 1 year to 3 years 3585 3269 - - 80261 106106 1 30
g) Over 3 years to 5 years 2189 3996 - - 803 1535 - -
h) Over 5 years 4075 1436 - - 1 - - -
Source : Annual accounts of banks.Source

286
TABLE B10 : MATURITY PROFILE OF SELECTED ITEMS OF LIABILITIES AND ASSETS OF SCHEDULEDCOMMERCIAL BANKS - 2012 AND 2013 (Contd.)
(Amount in ` Million)FOREIGN BANKSAS ON MARCH 31
ItemsCredit Agricole Credit Suisse AG DBS Bank Deutsche Bank
2012 2013 2012 2013 2012 2013 2012 2013(33) (34) (35) (36) (37) (38) (39) (40)
Investments (at book value) 40141 32272 19554 27020 147806 181673 84357 106257
a) 1 - 14 days 28991 19447 19309 2035 48136 78062 18038 53968
b) 15 - 28 days 264 386 2 996 7611 4303 2235 2208
c) 29 days to 3 months 1380 1133 202 5168 8749 7286 7526 4237
d) Over 3 months to 6 months 207 241 - 3292 2205 4062 1945 4045
e) Over 6 months to 1 year 877 169 1 5676 56013 64769 22982 8972
f) Over 1 year to 3 years 2829 2816 39 3758 10209 8343 24288 28353
g) Over 3 years to 5 years 298 449 - 3369 700 546 5706 1937
h) Over 5 years 5295 7631 2 2725 14181 14302 1636 2537
Foreign Currency Assets 19891 13784 451 1627 69322 55836 23707 57759
a) 1 - 14 days 12529 419 149 359 22411 27157 6008 19292
b) 15 - 28 days 301 4497 - - 19417 6099 1620 7118
c) 29 days to 3 months 4041 3839 99 - 13880 11146 3481 10137
d) Over 3 months to 6 months 2824 3686 - 1051 12769 10041 7044 17309
e) Over 6 months to 1 year - 1134 - - 244 751 5552 3903
f) Over 1 year to 3 years 196 209 - - - - 2 -
g) Over 3 years to 5 years - - - - - - - -
h) Over 5 years - - 204 217 601 641 - -
Foreign Currency Liabilities 19408 14267 2763 2572 134053 89102 35450 76740
a) 1 - 14 days 8067 2565 76 1357 15860 7963 23070 44710
b) 15 - 28 days - 689 - - 20885 11843 215 6
c) 29 days to 3 months 3448 992 2544 42 19265 30723 276 5108
d) Over 3 months to 6 months 16 59 - 1172 5591 4754 1917 2747
e) Over 6 months to 1 year 1695 141 143 - 31563 11332 4335 4282
f) Over 1 year to 3 years 333 26 - - 20539 22483 5636 19886
g) Over 3 years to 5 years 1293 1357 - - 20350 4 - -
h) Over 5 years 4555 8439 - - - - - -
Source : Annual accounts of banks.Source

287
TABLE B10 : MATURITY PROFILE OF SELECTED ITEMS OF LIABILITIES AND ASSETS OF SCHEDULEDCOMMERCIAL BANKS - 2012 AND 2013 (Contd.)
(Amount in ` Million)FOREIGN BANKSAS ON MARCH 31
ItemsFirstRand Bank Hongkong & Shanghai
Banking CorporationHSBC Bank Oman
S.A.O.G.
Industrial andCommercial Bank of
China2012 2013 2012 2013 2012 2013 2012 2013(41) (42) (43) (44) (45) (46) (47) (48)
Investments (at book value) 5613 7848 403238 451787 773 401 - 1038
a) 1 - 14 days 349 3116 94709 157056 - - - -
b) 15 - 28 days 249 252 4432 44160 - - - -
c) 29 days to 3 months 1976 1263 72348 41996 450 79 - -
d) Over 3 months to 6 months 407 995 34977 42283 1 202 - -
e) Over 6 months to 1 year 2632 2188 57760 53343 8 4 - -
f) Over 1 year to 3 years - 28 63245 34192 315 116 - -
g) Over 3 years to 5 years - 2 38965 8108 - - - -
h) Over 5 years - 3 36802 70649 - - - 1038
Foreign Currency Assets 1060 1094 215470 192458 82 62 483 126
a) 1 - 14 days 40 19 76459 21405 32 41 483 126
b) 15 - 28 days 71 8 15342 9573 - - - -
c) 29 days to 3 months 624 752 28268 28655 35 1 - -
d) Over 3 months to 6 months 270 255 29403 42857 - - - -
e) Over 6 months to 1 year - - 17807 12496 - - - -
f) Over 1 year to 3 years - - 23383 29838 - - - -
g) Over 3 years to 5 years - - 10241 24830 - - - -
h) Over 5 years 55 59 14567 22804 15 20 - -
Foreign Currency Liabilities 2305 2628 264917 191448 745 316 - 1086
a) 1 - 14 days 1 571 64620 42753 64 11 - -
b) 15 - 28 days 71 - 2550 12191 8 46 - -
c) 29 days to 3 months 1961 1962 39051 67557 357 66 - 1086
d) Over 3 months to 6 months 268 56 28624 12550 109 165 - -
e) Over 6 months to 1 year - 10 40811 18980 202 28 - -
f) Over 1 year to 3 years 5 29 30231 14801 5 - - -
g) Over 3 years to 5 years - - 35654 8407 - - - -
h) Over 5 years - - 23375 14208 - - - -
Source : Annual accounts of banks.Source
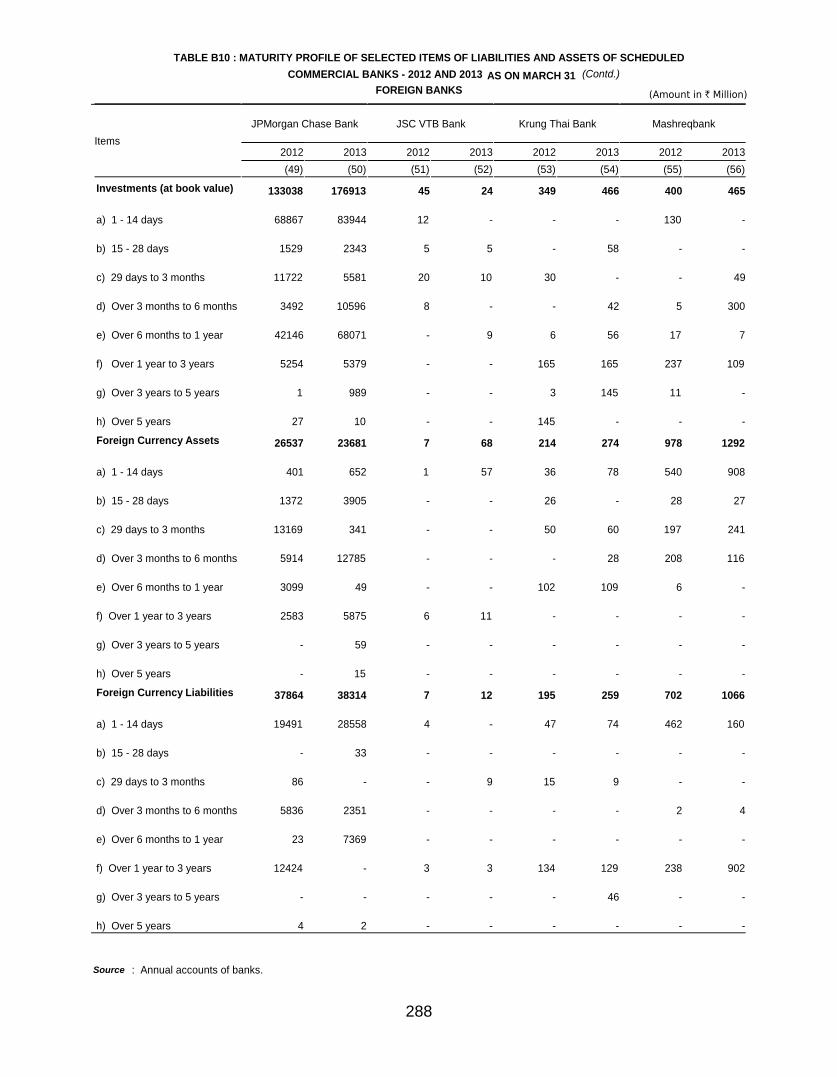
288
TABLE B10 : MATURITY PROFILE OF SELECTED ITEMS OF LIABILITIES AND ASSETS OF SCHEDULEDCOMMERCIAL BANKS - 2012 AND 2013 (Contd.)
(Amount in ` Million)FOREIGN BANKSAS ON MARCH 31
ItemsJPMorgan Chase Bank JSC VTB Bank Krung Thai Bank Mashreqbank
2012 2013 2012 2013 2012 2013 2012 2013(49) (50) (51) (52) (53) (54) (55) (56)
Investments (at book value) 133038 176913 45 24 349 466 400 465
a) 1 - 14 days 68867 83944 12 - - - 130 -
b) 15 - 28 days 1529 2343 5 5 - 58 - -
c) 29 days to 3 months 11722 5581 20 10 30 - - 49
d) Over 3 months to 6 months 3492 10596 8 - - 42 5 300
e) Over 6 months to 1 year 42146 68071 - 9 6 56 17 7
f) Over 1 year to 3 years 5254 5379 - - 165 165 237 109
g) Over 3 years to 5 years 1 989 - - 3 145 11 -
h) Over 5 years 27 10 - - 145 - - -
Foreign Currency Assets 26537 23681 7 68 214 274 978 1292
a) 1 - 14 days 401 652 1 57 36 78 540 908
b) 15 - 28 days 1372 3905 - - 26 - 28 27
c) 29 days to 3 months 13169 341 - - 50 60 197 241
d) Over 3 months to 6 months 5914 12785 - - - 28 208 116
e) Over 6 months to 1 year 3099 49 - - 102 109 6 -
f) Over 1 year to 3 years 2583 5875 6 11 - - - -
g) Over 3 years to 5 years - 59 - - - - - -
h) Over 5 years - 15 - - - - - -
Foreign Currency Liabilities 37864 38314 7 12 195 259 702 1066
a) 1 - 14 days 19491 28558 4 - 47 74 462 160
b) 15 - 28 days - 33 - - - - - -
c) 29 days to 3 months 86 - - 9 15 9 - -
d) Over 3 months to 6 months 5836 2351 - - - - 2 4
e) Over 6 months to 1 year 23 7369 - - - - - -
f) Over 1 year to 3 years 12424 - 3 3 134 129 238 902
g) Over 3 years to 5 years - - - - - 46 - -
h) Over 5 years 4 2 - - - - - -
Source : Annual accounts of banks.Source

289
TABLE B10 : MATURITY PROFILE OF SELECTED ITEMS OF LIABILITIES AND ASSETS OF SCHEDULEDCOMMERCIAL BANKS - 2012 AND 2013 (Contd.)
(Amount in ` Million)FOREIGN BANKSAS ON MARCH 31
ItemsMizuho Corporate Bank National Australia Bank Rabobank International Royal Bank of Scotland
2012 2013 2012 2013 2012 2013 2012 2013(57) (58) (59) (60) (61) (62) (63) (64)
Investments (at book value) 6586 13835 - 117 1384 1242 77214 91235
a) 1 - 14 days 150 3143 - - - 471 197 -
b) 15 - 28 days 497 2352 - - - - 100 995
c) 29 days to 3 months 3419 6476 - 117 1384 - 18661 23495
d) Over 3 months to 6 months - - - - - 292 2317 11516
e) Over 6 months to 1 year - - - - - 473 4743 6316
f) Over 1 year to 3 years 964 964 - - - - 12060 12575
g) Over 3 years to 5 years 1556 899 - - - 6 19196 21196
h) Over 5 years - - - - - - 19940 15143
Foreign Currency Assets 10608 15098 - - 1624 2305 44897 48000
a) 1 - 14 days 10608 5517 - - 924 704 5975 7481
b) 15 - 28 days - 1357 - - - 149 4423 4060
c) 29 days to 3 months - 2795 - - 250 1249 27235 29370
d) Over 3 months to 6 months - 5429 - - 451 204 6578 6626
e) Over 6 months to 1 year - - - - - - - 7
f) Over 1 year to 3 years - - - - - - 224 49
g) Over 3 years to 5 years - - - - - - - -
h) Over 5 years - - - - - - 461 408
Foreign Currency Liabilities 5578 17162 - - 103 1278 57648 55854
a) 1 - 14 days 4782 2752 - - 1 521 27106 23170
b) 15 - 28 days - 9228 - - - - 1203 6796
c) 29 days to 3 months 568 60 - - - 644 4377 1847
d) Over 3 months to 6 months 228 - - - 100 1 301 3695
e) Over 6 months to 1 year 1 3529 - - - 110 639 3720
f) Over 1 year to 3 years - 1593 - - 3 2 13745 6370
g) Over 3 years to 5 years - - - - - - 1991 3100
h) Over 5 years - - - - - - 8285 7157
Source : Annual accounts of banks.Source
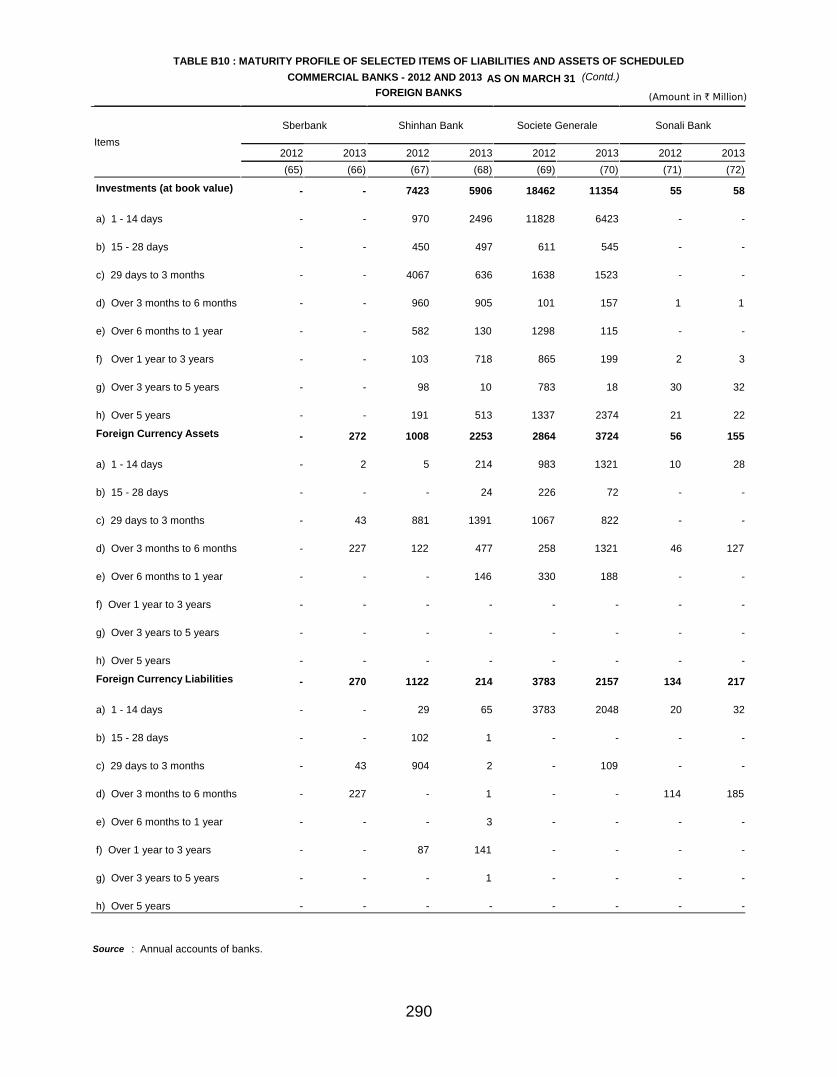
290
TABLE B10 : MATURITY PROFILE OF SELECTED ITEMS OF LIABILITIES AND ASSETS OF SCHEDULEDCOMMERCIAL BANKS - 2012 AND 2013 (Contd.)
(Amount in ` Million)FOREIGN BANKSAS ON MARCH 31
ItemsSberbank Shinhan Bank Societe Generale Sonali Bank
2012 2013 2012 2013 2012 2013 2012 2013(65) (66) (67) (68) (69) (70) (71) (72)
Investments (at book value) - - 7423 5906 18462 11354 55 58
a) 1 - 14 days - - 970 2496 11828 6423 - -
b) 15 - 28 days - - 450 497 611 545 - -
c) 29 days to 3 months - - 4067 636 1638 1523 - -
d) Over 3 months to 6 months - - 960 905 101 157 1 1
e) Over 6 months to 1 year - - 582 130 1298 115 - -
f) Over 1 year to 3 years - - 103 718 865 199 2 3
g) Over 3 years to 5 years - - 98 10 783 18 30 32
h) Over 5 years - - 191 513 1337 2374 21 22
Foreign Currency Assets - 272 1008 2253 2864 3724 56 155
a) 1 - 14 days - 2 5 214 983 1321 10 28
b) 15 - 28 days - - - 24 226 72 - -
c) 29 days to 3 months - 43 881 1391 1067 822 - -
d) Over 3 months to 6 months - 227 122 477 258 1321 46 127
e) Over 6 months to 1 year - - - 146 330 188 - -
f) Over 1 year to 3 years - - - - - - - -
g) Over 3 years to 5 years - - - - - - - -
h) Over 5 years - - - - - - - -
Foreign Currency Liabilities - 270 1122 214 3783 2157 134 217
a) 1 - 14 days - - 29 65 3783 2048 20 32
b) 15 - 28 days - - 102 1 - - - -
c) 29 days to 3 months - 43 904 2 - 109 - -
d) Over 3 months to 6 months - 227 - 1 - - 114 185
e) Over 6 months to 1 year - - - 3 - - - -
f) Over 1 year to 3 years - - 87 141 - - - -
g) Over 3 years to 5 years - - - 1 - - - -
h) Over 5 years - - - - - - - -
Source : Annual accounts of banks.Source

291
TABLE B10 : MATURITY PROFILE OF SELECTED ITEMS OF LIABILITIES AND ASSETS OF SCHEDULEDCOMMERCIAL BANKS - 2012 AND 2013 (Contd.)
(Amount in ` Million)FOREIGN BANKSAS ON MARCH 31
Items
Standard CharteredBank State Bank of Mauritius Sumitomo Mitsui
Banking Corporation UBS AG
2012 2013 2012 2013 2012 2013 2012 2013(73) (74) (75) (76) (77) (78) (79) (80)
Investments (at book value) 270803 302579 4821 4602 - 2985 35667 21679
a) 1 - 14 days 85235 113556 1637 1839 - 999 26141 13951
b) 15 - 28 days 13141 14186 211 61 - - 557 26
c) 29 days to 3 months 40631 43538 1117 860 - 1986 1658 2515
d) Over 3 months to 6 months 15995 17684 192 73 - - 62 1035
e) Over 6 months to 1 year 39334 42993 611 1238 - - 957 3295
f) Over 1 year to 3 years 47227 47232 923 449 - - 659 814
g) Over 3 years to 5 years 21833 14968 98 50 - - 330 43
h) Over 5 years 7407 8421 32 32 - - 5303 1
Foreign Currency Assets 355998 173614 2282 7761 - 6 882 3411
a) 1 - 14 days 27428 41346 347 543 - 6 214 779
b) 15 - 28 days 12474 17531 84 71 - - 40 1086
c) 29 days to 3 months 120253 54875 577 1216 - - 576 2
d) Over 3 months to 6 months 89857 34697 1020 3344 - - - 1490
e) Over 6 months to 1 year 34696 7170 254 2478 - - - -
f) Over 1 year to 3 years 36255 8694 - 109 - - - -
g) Over 3 years to 5 years 18322 6557 - - - - - -
h) Over 5 years 16714 2743 - - - - 51 54
Foreign Currency Liabilities 430033 251186 462 7676 - - 3432 23702
a) 1 - 14 days 34613 41968 261 3 - - 2318 552
b) 15 - 28 days 17561 9024 - - - - - 1086
c) 29 days to 3 months 101559 61442 - 2124 - - 1115 3904
d) Over 3 months to 6 months 83002 24572 22 2828 - - - 4667
e) Over 6 months to 1 year 76342 50450 169 2719 - - - 13494
f) Over 1 year to 3 years 53256 25379 10 3 - - - -
g) Over 3 years to 5 years 16821 21768 - - - - - -
h) Over 5 years 46879 16582 - - - - - -
Source : Annual accounts of banks.Source

292
TABLE B10 : MATURITY PROFILE OF SELECTED ITEMS OF LIABILITIES AND ASSETS OF SCHEDULEDCOMMERCIAL BANKS - 2012 AND 2013 (Concld.)
(Amount in ` Million)FOREIGN BANKSAS ON MARCH 31
ItemsUnited Overseas Bank Westpac Banking
Corporation Woori Bank
2012 2013 2012 2013 2012 2013(81) (82) (83) (84) (85) (86)
Investments (at book value) - 148 - 4466 - 491
a) 1 - 14 days - - - 12 - 98
b) 15 - 28 days - 45 - - - 147
c) 29 days to 3 months - 54 - 3029 - 246
d) Over 3 months to 6 months - 49 - - - -
e) Over 6 months to 1 year - - - 1425 - -
f) Over 1 year to 3 years - - - - - -
g) Over 3 years to 5 years - - - - - -
h) Over 5 years - - - - - -
Foreign Currency Assets 4 219 - 3565 - 5
a) 1 - 14 days - 2 - 3529 - 5
b) 15 - 28 days - 210 - 36 - -
c) 29 days to 3 months 3 7 - - - -
d) Over 3 months to 6 months - - - - - -
e) Over 6 months to 1 year - - - - - -
f) Over 1 year to 3 years - - - - - -
g) Over 3 years to 5 years - - - - - -
h) Over 5 years - - - - - -
Foreign Currency Liabilities 16 226 - 8 - 2
a) 1 - 14 days - 1 - 7 - 2
b) 15 - 28 days - 210 - - - -
c) 29 days to 3 months - - - 1 - -
d) Over 3 months to 6 months - - - - - -
e) Over 6 months to 1 year - - - - - -
f) Over 1 year to 3 years - - - - - -
g) Over 3 years to 5 years - - - - - -
h) Over 5 years 16 14 - - - -
Source : Annual accounts of banks.Source

293
TABLE B11 : LOAN SUBJECTED TO RESTRUCTURING & CORPORATE
(Amount in ` Million)DEBT RESTRUCTURED - 2012 - 13 AS ON MARCH 31
Name of the Bank
Loan subjected to Restructuring Corporate Debt RestructuredStandar
d Assetsduring
the year
Sub-Standard
Assetsduring
the year
DoubtfulAssetsduring
the year
Total 1[(1)+(2)
+(3)]
Standard Assets
duringthe year
Sub-Standar
d Assetsduring
the year
DoubtfulAssetsduring
the year
Total 2[(5)+(6)
+(7)]
Total[(4)+(8)]
(1) (2) (3) (4) (5) (6) (7) (8) (9)SBI and its AssociatesState Bank of India 173134 23657 58115 254905 149143 5864 21196 176204 431109State Bank of Bikaner & Jaipur 28019 1189 2742 31951 9689 401 218 10309 42259State Bank of Hyderabad 10367 3046 1588 15000 19310 2237 1042 22589 37589State Bank of Mysore 18383 1560 507 20450 11288 634 0 11922 32371State Bank of Patiala 20217 695 298 21210 27690 - 453 28143 49353State Bank of Travancore 10809 809 300 11919 10331 1113 552 11996 23915Nationalised BanksAllahabad Bank 95624 17280 1001 113905 23457 792 - 24249 138154Andhra Bank 72682 - - 72682 24143 - 100 24244 96926Bank of Baroda 153722 13925 13068 180715 38897 2361 4202 45459 226174Bank of India 123201 4493 3412 131106 49520 10737 392 60649 191755Bank of Maharashtra 41953 320 290 42563 3294 461 - 3755 46318Canara Bank 146704 11612 10853 169170 35113 2243 4808 42164 211334Central Bank of India 156908 3195 17516 177619 44516 2693 1981 49190 226809Corporation Bank 56413 2263 1397 60073 14429 497 415 15341 75414Dena Bank 37633 1461 979 40073 9846 - 1 9847 49920IDBI Bank Ltd. 57085 3976 13044 74105 58628 690 2221 61539 135644Indian Bank 76419 6190 3989 86598 9316 - 1165 10481 97079Indian Overseas Bank 107147 2636 1932 111714 39659 - 835 40494 152208Oriental Bank of Commerce 95553 2545 5379 103477 27487 7446 893 35826 139303Punjab and Sind Bank 58354 - - 58354 1208 - - 1208 59563Punjab National Bank 206263 9551 1188 217001 99012 3498 1924 104433 321434Syndicate Bank 57188 2367 6270 65826 24704 68 662 25433 91259UCO Bank 59948 212 - 60161 27477 897 375 28748 88909Union Bank of India 66007 7091 8205 81303 31463 511 2981 34954 116257United Bank of India 23667 3465 1970 29102 15503 668 273 16445 45546Vijaya Bank 31890 982 2639 35510 8249 - 262 8512 44022Old Private Sector BanksCatholic Syrian Bank 2787 29 22 2838 2715 - - 2715 5554City Union Bank 1621 343 71 2035 317 - - 317 2351Dhanlaxmi Bank 1642 547 87 2276 116 - - 116 2391Federal Bank 16177 253 3216 19646 3376 356 708 4440 24086ING Vysya Bank 9 - 427 436 2704 - - 2704 3140Jammu & Kashmir Bank 9665 111 1001 10777 3487 241 400 4128 14905Karnataka Bank 7425 316 658 8399 8030 480 122 8631 17030Karur Vysya Bank 9093 72 1025 10190 1787 - 33 1820 12010Lakshmi Vilas Bank 4529 266 467 5262 993 979 - 1972 7234Nainital Bank 22 - - 22 - - - - 22Ratnakar Bank 232 - 17 249 - - - - 249South Indian Bank 11583 227 1626 13436 1175 73 24 1272 14709Tamilnad Mercantile Bank 3528 66 128 3722 - - - - 3722New Private Sector BanksAxis Bank 19855 172 736 20763 25103 1111 1711 27925 48688Development Credit Bank 274 50 175 499 5 211 - 216 715HDFC Bank 76 - 285 361 735 476 3709 4920 5281ICICI Bank 22895 1856 6000 30751 35357 - 3321 38678 69429IndusInd Bank 43 - 50 92 1360 13 132 1506 1598Kotak Mahindra Bank 107 161 309 577 - - - - 577Yes Bank 108 105 1 214 1320 214 97 1631 1845

294
TABLE B11 : LOAN SUBJECTED TO RESTRUCTURING & CORPORATE(Concld.)
(Amount in ` Million)DEBT RESTRUCTURED - 2012 - 13 AS ON MARCH 31
Name of the Bank
Loan subjected to Restructuring Corporate Debt RestructuredStandar
d Assetsduring
the year
Sub-Standard
Assetsduring
the year
DoubtfulAssetsduring
the year
Total 1[(1)+(2)
+(3)]
Standard Assets
duringthe year
Sub-Standar
d Assetsduring
the year
DoubtfulAssetsduring
the year
Total 2[(5)+(6)
+(7)]
Total[(4)+(8)]
(1) (2) (3) (4) (5) (6) (7) (8) (9)Foreign BanksAB Bank - - - - - - - - -Abu Dhabi Commercial Bank - - - - - - - - -American Express Banking Corp. - - - - - - - - -Antwerp Diamond Bank - - - - - - - - -Australia and New Zealand Banking Group - - - - - - - - -Bank Internasional Indonesia - - - - - - - - -Bank of America - - - - - - - - -Bank of Bahrain & Kuwait - - - - - - - - -Bank of Ceylon - - 3 3 - - - - 3Bank of Nova Scotia - - - - - - - - -Bank of Tokyo-Mitsubishi UFJ - - - - - - - - -Barclays Bank 102 - 555 657 - - - - 657BNP Paribas - - - - - - - - -Chinatrust Commercial Bank 4 - - 4 - - - - 4Citibank 344 135 282 761 - - - - 761Commonwealth Bank of Australia - - - - - - - - -Credit Agricole - - - - - - - - -Credit Suisse AG - - - - - - - - -DBS Bank - - - - - 300 - 300 300Deutsche Bank - 1 4 5 - - - - 5FirstRand Bank - - - - - - - - -Hongkong & Shanghai Banking Corporation - - 122 122 - - 269 269 390HSBC Bank Oman S.A.O.G - - - - - - - - -Industrial and Commercial Bank of China - - - - - - - - -JPMorgan Chase Bank - - - - - - - - -JSC VTB Bank 141 - - 141 - - - - 141Krung Thai Bank - - - - - - - - -Mashreqbank - - - - - - - - -Mizuho Corporate Bank - 1190 - 1190 - - - - 1190National Australia Bank - - - - - - - - -Rabobank International - - - - - - - - -Royal Bank of Scotland 1 - 50 52 - - - - 52Sberbank - - - - - - - - -Shinhan Bank 120 - - 120 - - - - 120Societe Generale - - - - - - - - -Sonali Bank - - - - - - - - -Standard Chartered Bank 182 998 1367 2546 2160 - 852 3012 5559State Bank of Mauritius 943 - - 943 67 - - 67 1010Sumitomo Mitsui Banking Corporation - - - - - - - - -UBS AG - - - - - - - - -United Overseas Bank - - - - - - - - -Westpac Banking Corporation - - - - - - - - -Woori Bank - - - - - - - - -
Source : Annual accounts of banks.Source

295
TABLE B12 : SELECTED RATIOS OF SCHEDULED COMMERCIAL BANKS - 2012 AND 2013 AS ON MARCH 31STATE BANK OF INDIA & ITS ASSOCIATES (In per cent)
Items
State Bank ofBikaner & Jaipur
State Bank ofHyderabad State Bank of India State Bank of
Mysore
2012 2013 2012 2013 2012 2013 2012 2013(1) (2) (3) (4) (5) (6) (7) (8)
1. Cash - Deposit Ratio 7.04 8.54 5.81 5.63 5.18 5.47 6.03 4.22
2. Credit - Deposit Ratio 79.98 79.78 78.04 79.29 83.13 86.94 79.37 78.87
3. Investment - Deposit Ratio 27.07 27.94 29.62 29.97 29.91 29.18 29.36 29.45
4. (Credit + Investment) - Deposit Ratio 107.05 107.72 107.66 109.27 113.04 116.11 108.73 108.32
5. Ratio of deposits to total liabilities 84.89 83.84 83.45 83.28 78.15 76.79 83.08 84.73
6. Ratio of demand & savings bank deposits to total deposits
37.35 35.88 27.87 28.86 44.81 44.82 32.21 31.55
7. Ratio of priority sector advances to total advances 35.35 35.31 34.53 33.72 28.84 25.28 28.26 29.86
8. Ratio of term loans to total advances 53.91 50.81 56.37 55.36 47.98 47.01 55.22 56.71
9. Ratio of secured advances to total advances 85.84 89.84 88.08 87.85 81.04 82.64 86.51 89.52
10. Ratio of investments in non-approved securities to total investments
2.91 12.25 7.61 6.53 18.05 23.27 11.95 13.80
11. Ratio of interest income to total assets 9.29 9.46 9.46 9.79 8.32 8.25 9.03 9.35
12. Ratio of net interest income to total assets (Net Interest Margin)
3.28 3.24 2.99 3.08 3.38 3.06 2.82 2.88
13. Ratio of non-interest income to total assets 0.88 0.92 0.91 0.77 1.12 1.11 0.92 0.93
14. Ratio of intermediation cost to total assets 1.96 1.99 1.54 1.65 2.04 2.02 1.85 1.73
15. Ratio of wage bills to intermediation cost 61.61 62.53 66.33 67.24 65.11 62.77 59.61 57.95
16. Ratio of wage bills to total expense 15.18 15.17 12.77 13.31 19.01 17.57 13.68 12.24
17. Ratio of wage bills to total income 11.90 12.01 9.86 10.54 14.04 13.55 11.09 9.76
18. Ratio of burden to total assets 1.08 1.08 0.63 0.89 0.92 0.91 0.93 0.80
19. Ratio of burden to interest income 11.63 11.38 6.68 9.07 11.00 11.07 10.33 8.54
20. Ratio of operating profits to total assets 2.20 2.16 2.36 2.19 2.47 2.14 1.88 2.09
21. Return on assets 0.99 0.96 1.15 0.99 0.88 0.91 0.67 0.66
22. Return on equity 18.59 16.36 21.98 17.70 15.72 15.43 9.62 10.00
23. Cost of deposits 6.65 6.95 7.28 7.66 5.63 6.01 6.90 7.05
24. Cost of borrowings 7.75 6.56 8.20 7.16 6.15 5.31 7.07 8.34
25. Cost of funds 6.46 6.65 6.92 7.29 5.35 5.63 6.66 6.92
26. Return on advances 11.23 11.22 11.54 11.45 9.98 9.46 11.00 11.30
27. Return on investments 7.72 7.91 7.85 8.19 7.88 8.20 7.23 7.35
28. Return on advances adjusted to cost of funds 4.77 4.57 4.62 4.16 4.63 3.83 4.34 4.38
29. Return on investments adjusted to cost of funds 1.27 1.26 0.93 0.89 2.53 2.57 0.57 0.43
30. Business per employee (in Rupees Million) 82.70 90.00 116.87 138.79 79.84 94.39 88.10 95.50
31. Profit per employee (in Rupees Million) 0.50 0.60 0.86 0.83 0.53 0.65 0.40 0.40
32. Capital adequacy ratio 13.76 12.16 13.56 12.36 13.86 12.92 12.55 11.79
33. Capital adequacy ratio - Tier I 9.76 9.11 9.62 9.25 9.79 9.49 9.18 8.87
34. Capital adequacy ratio - Tier II 4.00 3.05 3.94 3.11 4.07 3.43 3.37 2.92
35. Ratio of net NPA to net advances 1.92 2.27 1.30 1.61 1.82 2.10 1.93 2.69
Source : Annual accounts of Banks.Source

296
TABLE B12 : SELECTED RATIOS OF SCHEDULED COMMERCIAL BANKS - 2012 AND 2013 AS ON MARCH 31STATE BANK OF INDIA & ITS ASSOCIATES (In per cent)
(Contd.)
ItemsState Bank of Patiala State Bank of
Travancore
2012 2013 2012 2013(9) (10) (11) (12)
1. Cash - Deposit Ratio 8.98 4.52 6.68 5.37
2. Credit - Deposit Ratio 79.25 83.23 77.44 79.75
3. Investment - Deposit Ratio 27.76 27.02 31.39 32.17
4. (Credit + Investment) - Deposit Ratio 107.00 110.24 108.83 111.92
5. Ratio of deposits to total liabilities 80.60 81.69 83.12 83.31
6. Ratio of demand & savings bank deposits to total deposits
24.55 25.13 27.34 25.79
7. Ratio of priority sector advances to total advances 32.23 31.33 36.21 36.30
8. Ratio of term loans to total advances 51.80 50.43 47.90 49.76
9. Ratio of secured advances to total advances 95.15 94.54 83.62 87.33
10. Ratio of investments in non-approved securities to total investments
12.61 16.34 18.93 14.19
11. Ratio of interest income to total assets 9.03 9.24 8.79 9.21
12. Ratio of net interest income to total assets (Net Interest Margin)
2.60 2.37 2.42 2.27
13. Ratio of non-interest income to total assets 0.84 0.73 0.74 0.70
14. Ratio of intermediation cost to total assets 1.47 1.54 1.57 1.53
15. Ratio of wage bills to intermediation cost 63.08 60.33 64.06 61.86
16. Ratio of wage bills to total expense 11.74 11.02 12.65 11.15
17. Ratio of wage bills to total income 9.41 9.29 10.54 9.53
18. Ratio of burden to total assets 0.64 0.80 0.83 0.83
19. Ratio of burden to interest income 7.05 8.69 9.41 9.00
20. Ratio of operating profits to total assets 1.96 1.56 1.59 1.44
21. Return on assets 0.93 0.68 0.65 0.66
22. Return on equity 17.95 13.17 13.93 14.94
23. Cost of deposits 7.17 7.61 6.74 7.51
24. Cost of borrowings 6.27 7.34 9.46 7.86
25. Cost of funds 6.54 6.94 6.20 6.88
26. Return on advances 11.25 11.18 10.65 10.98
27. Return on investments 7.60 7.55 7.17 7.31
28. Return on advances adjusted to cost of funds 4.71 4.24 4.45 4.11
29. Return on investments adjusted to cost of funds 1.06 0.61 0.96 0.44
30. Business per employee (in Rupees Million) 105.57 113.50 106.60 125.90
31. Profit per employee (in Rupees Million) 0.59 0.46 0.42 0.50
32. Capital adequacy ratio 12.30 11.12 13.55 11.70
33. Capital adequacy ratio - Tier I 8.60 8.02 9.35 8.46
34. Capital adequacy ratio - Tier II 3.70 3.10 4.20 3.24
35. Ratio of net NPA to net advances 1.35 1.62 1.54 1.46
Source : Annual accounts of Banks.
TABLE B12 : SELECTED RATIOS OF SCHEDULED COMMERCIAL BANKS - 2012 AND 2013 AS ON MARCH 31STATE BANK OF INDIA & ITS ASSOCIATES (In per cent)
(Contd.)
ItemsState Bank of Patiala State Bank of
Travancore
2012 2013 2012 2013(9) (10) (11) (12)
1. Cash - Deposit Ratio 8.98 4.52 6.68 5.37
2. Credit - Deposit Ratio 79.25 83.23 77.44 79.75
3. Investment - Deposit Ratio 27.76 27.02 31.39 32.17
4. (Credit + Investment) - Deposit Ratio 107.00 110.24 108.83 111.92
5. Ratio of deposits to total liabilities 80.60 81.69 83.12 83.31
6. Ratio of demand & savings bank deposits to total deposits
24.55 25.13 27.34 25.79
7. Ratio of priority sector advances to total advances 32.23 31.33 36.21 36.30
8. Ratio of term loans to total advances 51.80 50.43 47.90 49.76
9. Ratio of secured advances to total advances 95.15 94.54 83.62 87.33
10. Ratio of investments in non-approved securities to total investments
12.61 16.34 18.93 14.19
11. Ratio of interest income to total assets 9.03 9.24 8.79 9.21
12. Ratio of net interest income to total assets (Net Interest Margin)
2.60 2.37 2.42 2.27
13. Ratio of non-interest income to total assets 0.84 0.73 0.74 0.70
14. Ratio of intermediation cost to total assets 1.47 1.54 1.57 1.53
15. Ratio of wage bills to intermediation cost 63.08 60.33 64.06 61.86
16. Ratio of wage bills to total expense 11.74 11.02 12.65 11.15
17. Ratio of wage bills to total income 9.41 9.29 10.54 9.53
18. Ratio of burden to total assets 0.64 0.80 0.83 0.83
19. Ratio of burden to interest income 7.05 8.69 9.41 9.00
20. Ratio of operating profits to total assets 1.96 1.56 1.59 1.44
21. Return on assets 0.93 0.68 0.65 0.66
22. Return on equity 17.95 13.17 13.93 14.94
23. Cost of deposits 7.17 7.61 6.74 7.51
24. Cost of borrowings 6.27 7.34 9.46 7.86
25. Cost of funds 6.54 6.94 6.20 6.88
26. Return on advances 11.25 11.18 10.65 10.98
27. Return on investments 7.60 7.55 7.17 7.31
28. Return on advances adjusted to cost of funds 4.71 4.24 4.45 4.11
29. Return on investments adjusted to cost of funds 1.06 0.61 0.96 0.44
30. Business per employee (in Rupees Million) 105.57 113.50 106.60 125.90
31. Profit per employee (in Rupees Million) 0.59 0.46 0.42 0.50
32. Capital adequacy ratio 12.30 11.12 13.55 11.70
33. Capital adequacy ratio - Tier I 8.60 8.02 9.35 8.46
34. Capital adequacy ratio - Tier II 3.70 3.10 4.20 3.24
35. Ratio of net NPA to net advances 1.35 1.62 1.54 1.46
Source : Annual accounts of Banks.Source

297
TABLE B12 : SELECTED RATIOS OF SCHEDULED COMMERCIAL BANKS - 2012 AND 2013 AS ON MARCH 31NATIONALISED BANKS (In per cent)
(Contd.)
ItemsAllahabad Bank Andhra Bank Bank of Baroda Bank of India
2012 2013 2012 2013 2012 2013 2012 2013(1) (2) (3) (4) (5) (6) (7) (8)
1. Cash - Deposit Ratio 5.46 4.37 5.26 4.86 5.63 2.84 4.71 5.75
2. Credit - Deposit Ratio 69.64 72.45 78.62 79.46 74.67 69.25 78.20 75.78
3. Investment - Deposit Ratio 34.01 32.62 27.99 30.40 21.62 25.62 27.26 24.78
4. (Credit + Investment) - Deposit Ratio 103.66 105.07 106.61 109.86 96.29 94.87 105.46 100.56
5. Ratio of deposits to total liabilities 87.24 87.46 84.99 84.62 86.04 86.61 82.75 84.37
6. Ratio of demand & savings bank deposits to total deposits
30.49 30.73 26.40 25.65 26.90 25.32 26.65 25.64
7. Ratio of priority sector advances to total advances 33.65 30.43 33.24 35.19 22.59 24.21 22.56 22.45
8. Ratio of term loans to total advances 51.16 50.57 46.46 46.52 44.14 43.10 40.03 39.85
9. Ratio of secured advances to total advances 89.45 88.58 87.55 93.25 83.67 87.28 78.94 85.92
10. Ratio of investments in non-approved securities to total investments
16.58 21.42 9.76 12.36 16.65 15.83 17.42 15.98
11. Ratio of interest income to total assets 9.29 9.00 9.71 9.53 7.37 7.08 7.74 7.62
12. Ratio of net interest income to total assets (Net Interest Margin)
3.09 2.51 3.22 2.77 2.56 2.28 2.26 2.16
13. Ratio of non-interest income to total assets 0.78 0.76 0.74 0.77 0.85 0.73 0.90 0.90
14. Ratio of intermediation cost to total assets 1.61 1.53 1.55 1.50 1.28 1.20 1.34 1.27
15. Ratio of wage bills to intermediation cost 68.16 67.14 63.73 63.17 57.87 58.01 62.12 58.72
16. Ratio of wage bills to total expense 14.06 12.79 12.25 11.50 12.18 11.57 12.22 11.09
17. Ratio of wage bills to total income 10.91 10.50 9.43 9.22 9.02 8.88 9.65 8.78
18. Ratio of burden to total assets 0.83 0.76 0.81 0.73 0.43 0.47 0.44 0.37
19. Ratio of burden to interest income 8.97 8.50 8.33 7.67 5.85 6.58 5.69 4.91
20. Ratio of operating profits to total assets 2.26 1.75 2.41 2.04 2.13 1.81 1.82 1.78
21. Return on assets 1.02 0.64 1.19 0.99 1.24 0.90 0.72 0.65
22. Return on equity 19.64 10.84 19.25 16.19 20.64 15.07 14.00 12.25
23. Cost of deposits 6.69 7.12 7.02 7.45 5.15 5.23 5.82 5.78
24. Cost of borrowings 7.72 5.43 7.98 6.23 6.91 5.73 8.17 7.84
25. Cost of funds 6.44 6.83 6.83 7.13 5.00 5.04 5.69 5.66
26. Return on advances 11.39 10.59 12.00 11.37 8.67 8.40 8.76 8.60
27. Return on investments 7.62 7.95 7.33 7.36 8.00 7.32 8.27 8.01
28. Return on advances adjusted to cost of funds 4.95 3.76 5.17 4.25 3.67 3.36 3.07 2.94
29. Return on investments adjusted to cost of funds 1.18 1.11 0.51 0.23 3.00 2.27 2.58 2.35
30. Business per employee (in Rupees Million) 121.70 137.30 126.20 135.50 146.60 168.90 136.00 158.20
31. Profit per employee (in Rupees Million) 0.84 0.53 0.90 0.90 1.20 1.00 0.64 0.64
32. Capital adequacy ratio 12.83 11.03 13.18 11.76 14.67 13.30 11.95 11.02
33. Capital adequacy ratio - Tier I 9.13 8.05 9.03 8.52 10.83 10.13 8.59 8.20
34. Capital adequacy ratio - Tier II 3.70 2.98 4.15 3.24 3.84 3.17 3.36 2.82
35. Ratio of net NPA to net advances 0.98 3.19 0.91 2.45 0.54 1.28 1.47 2.06
Source : Annual accounts of Banks.Source

298
TABLE B12 : SELECTED RATIOS OF SCHEDULED COMMERCIAL BANKS - 2012 AND 2013 AS ON MARCH 31NATIONALISED BANKS (In per cent)
(Contd.)
ItemsBank of Maharashtra Canara Bank Central Bank of India Corporation Bank
2012 2013 2012 2013 2012 2013 2012 2013(9) (10) (11) (12) (13) (14) (15) (16)
1. Cash - Deposit Ratio 5.93 5.58 5.44 4.33 6.68 6.00 6.82 5.33
2. Credit - Deposit Ratio 73.25 80.00 71.09 68.05 75.20 76.06 73.80 71.51
3. Investment - Deposit Ratio 34.02 33.32 31.21 34.04 30.20 32.12 34.87 35.04
4. (Credit + Investment) - Deposit Ratio 107.27 113.32 102.29 102.09 105.39 108.19 108.67 106.55
5. Ratio of deposits to total liabilities 83.97 80.66 87.41 86.30 85.37 84.30 83.24 85.82
6. Ratio of demand & savings bank deposits to total deposits
41.33 40.79 24.34 24.18 33.27 32.55 22.12 21.68
7. Ratio of priority sector advances to total advances 33.63 32.25 29.80 33.88 26.11 29.10 29.19 31.35
8. Ratio of term loans to total advances 62.59 60.51 50.58 53.53 65.21 62.17 52.90 49.36
9. Ratio of secured advances to total advances 81.09 85.48 75.47 82.59 75.40 87.43 72.26 84.01
10. Ratio of investments in non-approved securities to total investments
20.70 19.27 13.02 15.80 14.28 17.12 21.98 19.87
11. Ratio of interest income to total assets 8.61 9.24 8.69 8.67 8.71 8.78 8.48 8.59
12. Ratio of net interest income to total assets (Net Interest Margin)
3.00 2.92 2.17 2.00 2.35 2.30 2.05 1.92
13. Ratio of non-interest income to total assets 0.76 0.88 0.82 0.80 0.63 0.67 0.97 0.90
14. Ratio of intermediation cost to total assets 1.96 1.73 1.32 1.31 1.71 1.70 1.16 1.12
15. Ratio of wage bills to intermediation cost 67.76 66.11 63.61 63.27 66.85 68.32 51.20 49.60
16. Ratio of wage bills to total expense 17.56 14.18 10.68 10.38 14.14 14.21 7.84 7.12
17. Ratio of wage bills to total income 14.17 11.29 8.80 8.74 12.20 12.29 6.29 5.85
18. Ratio of burden to total assets 1.20 0.85 0.49 0.51 1.07 1.03 0.19 0.22
19. Ratio of burden to interest income 13.89 9.20 5.66 5.84 12.29 11.73 2.23 2.54
20. Ratio of operating profits to total assets 1.81 2.07 1.67 1.50 1.28 1.27 1.86 1.70
21. Return on assets 0.55 0.74 0.95 0.77 0.26 0.44 1.06 0.88
22. Return on equity 9.91 13.66 15.36 12.08 4.57 7.31 19.54 16.08
23. Cost of deposits 5.99 6.88 7.08 7.39 6.92 7.08 7.13 7.35
24. Cost of borrowings 8.04 7.07 8.05 5.30 7.63 7.58 5.64 5.98
25. Cost of funds 5.75 6.49 6.89 7.07 6.55 6.67 6.54 6.89
26. Return on advances 10.67 11.10 10.57 10.27 10.40 10.59 10.21 10.45
27. Return on investments 7.04 7.77 7.59 8.17 7.64 7.25 6.75 6.50
28. Return on advances adjusted to cost of funds 4.91 4.60 3.68 3.20 3.85 3.93 3.67 3.56
29. Return on investments adjusted to cost of funds 1.29 1.27 0.70 1.09 1.09 0.58 0.21 -0.39
30. Business per employee (in Rupees Million) 96.70 125.60 137.44 142.02 86.16 97.30 171.30 192.13
31. Profit per employee (in Rupees Million) 0.31 0.56 0.82 0.70 0.15 0.28 1.09 0.97
32. Capital adequacy ratio 12.43 12.59 13.76 12.40 12.40 11.49 13.00 12.33
33. Capital adequacy ratio - Tier I 8.31 7.57 10.35 9.77 7.79 8.09 8.33 8.33
34. Capital adequacy ratio - Tier II 4.12 5.02 3.41 2.63 4.61 3.40 4.67 4.00
35. Ratio of net NPA to net advances 0.84 0.52 1.46 2.18 3.09 2.90 0.87 1.19
Source : Annual accounts of Banks.Source

299
TABLE B12 : SELECTED RATIOS OF SCHEDULED COMMERCIAL BANKS - 2012 AND 2013 AS ON MARCH 31NATIONALISED BANKS (In per cent)
(Contd.)
ItemsDena Bank IDBI Bank Ltd. Indian Bank Indian Overseas
Bank
2012 2013 2012 2013 2012 2013 2012 2013(17) (18) (19) (20) (21) (22) (23) (24)
1. Cash - Deposit Ratio 6.73 8.89 7.17 4.64 5.23 4.98 5.72 4.87
2. Credit - Deposit Ratio 73.47 67.67 85.79 86.43 74.77 74.41 78.87 79.34
3. Investment - Deposit Ratio 29.84 35.33 39.51 43.50 31.44 29.44 31.14 30.38
4. (Credit + Investment) - Deposit Ratio 103.31 103.00 125.30 129.94 106.20 103.85 110.01 109.72
5. Ratio of deposits to total liabilities 88.30 85.69 72.50 70.37 85.42 87.20 81.24 82.62
6. Ratio of demand & savings bank deposits to total deposits
34.55 28.96 24.10 25.12 30.55 27.60 26.42 26.51
7. Ratio of priority sector advances to total advances 30.26 28.15 26.82 17.53 32.98 34.17 30.03 31.07
8. Ratio of term loans to total advances 50.36 53.44 72.75 71.73 57.54 55.16 51.84 49.70
9. Ratio of secured advances to total advances 82.68 87.16 92.59 92.74 80.51 84.65 85.81 89.50
10. Ratio of investments in non-approved securities to total investments
15.65 22.08 22.09 27.95 21.68 25.53 9.97 11.55
11. Ratio of interest income to total assets 8.59 8.86 8.60 8.18 9.30 9.13 8.98 8.91
12. Ratio of net interest income to total assets (Net Interest Margin)
2.66 2.37 1.67 1.75 3.36 2.97 2.52 2.26
13. Ratio of non-interest income to total assets 0.74 0.65 0.78 1.05 0.94 0.85 0.84 0.85
14. Ratio of intermediation cost to total assets 1.46 1.29 0.96 1.02 1.66 1.81 1.59 1.47
15. Ratio of wage bills to intermediation cost 61.89 60.92 44.50 49.08 67.85 71.76 65.85 65.98
16. Ratio of wage bills to total expense 12.22 10.13 5.41 6.74 14.84 16.29 12.99 11.94
17. Ratio of wage bills to total income 9.69 8.29 4.55 5.44 11.02 13.00 10.64 9.93
18. Ratio of burden to total assets 0.72 0.64 0.18 -0.03 0.73 0.96 0.74 0.62
19. Ratio of burden to interest income 8.43 7.24 2.12 -0.34 7.81 10.53 8.28 6.94
20. Ratio of operating profits to total assets 1.93 1.73 1.49 1.78 2.63 2.01 1.77 1.64
21. Return on assets 1.08 0.86 0.83 0.72 1.31 1.02 0.52 0.24
22. Return on equity 19.75 15.83 11.95 9.26 17.19 13.89 9.88 4.47
23. Cost of deposits 6.41 7.15 7.18 6.99 6.58 6.87 6.94 7.29
24. Cost of borrowings 5.92 4.59 9.13 7.39 10.12 8.94 7.63 6.61
25. Cost of funds 6.19 6.74 6.21 5.95 6.67 6.92 7.02 7.22
26. Return on advances 10.17 11.14 10.64 10.37 11.38 10.82 10.76 10.57
27. Return on investments 7.39 7.04 6.99 5.86 7.67 8.12 7.57 7.48
28. Return on advances adjusted to cost of funds 3.98 4.39 4.44 4.43 4.71 3.91 3.73 3.35
29. Return on investments adjusted to cost of funds 1.20 0.30 0.78 -0.08 1.00 1.20 0.54 0.26
30. Business per employee (in Rupees Million) 128.40 143.10 238.33 256.44 111.40 130.10 117.60 128.80
31. Profit per employee (in Rupees Million) 0.79 0.73 1.32 1.22 0.93 0.84 0.38 0.20
32. Capital adequacy ratio 11.51 11.03 14.58 13.13 13.47 13.08 13.32 11.85
33. Capital adequacy ratio - Tier I 8.86 7.26 8.38 7.68 11.13 10.88 8.35 7.80
34. Capital adequacy ratio - Tier II 2.65 3.77 6.20 5.45 2.34 2.20 4.97 4.05
35. Ratio of net NPA to net advances 1.01 1.39 1.61 1.58 1.33 2.26 1.35 2.50
Source : Annual accounts of Banks.Source

300
TABLE B12 : SELECTED RATIOS OF SCHEDULED COMMERCIAL BANKS - 2012 AND 2013 AS ON MARCH 31NATIONALISED BANKS (In per cent)
(Contd.)
Items
Oriental Bank ofCommerce
Punjab and SindBank
Punjab NationalBank Syndicate Bank
2012 2013 2012 2013 2012 2013 2012 2013(25) (26) (27) (28) (29) (30) (31) (32)
1. Cash - Deposit Ratio 5.43 4.65 5.77 4.60 4.87 4.57 5.58 4.37
2. Credit - Deposit Ratio 71.80 73.31 73.11 72.81 77.39 78.84 78.27 79.61
3. Investment - Deposit Ratio 33.41 33.29 31.79 31.91 32.33 33.17 25.84 24.63
4. (Credit + Investment) - Deposit Ratio 105.20 106.60 104.90 104.72 109.72 112.02 104.11 104.24
5. Ratio of deposits to total liabilities 87.85 87.64 86.58 87.78 82.84 81.77 86.56 86.16
6. Ratio of demand & savings bank deposits to total deposits
24.13 24.55 23.93 22.28 35.34 39.16 29.45 28.03
7. Ratio of priority sector advances to total advances 35.75 35.86 28.01 27.20 31.33 30.04 29.46 26.63
8. Ratio of term loans to total advances 56.20 55.21 68.74 67.86 48.59 46.45 79.93 79.11
9. Ratio of secured advances to total advances 92.68 93.58 81.28 88.26 91.61 92.11 77.85 83.22
10. Ratio of investments in non-approved securities to total investments
24.35 24.62 14.78 16.97 18.52 17.00 10.51 11.97
11. Ratio of interest income to total assets 9.33 9.36 9.15 9.57 8.72 8.94 9.01 8.61
12. Ratio of net interest income to total assets (Net Interest Margin)
2.49 2.49 2.12 2.14 3.21 3.17 3.00 2.74
13. Ratio of non-interest income to total assets 0.73 0.87 0.59 0.54 1.00 0.90 0.63 0.59
14. Ratio of intermediation cost to total assets 1.37 1.41 1.64 1.46 1.67 1.74 1.66 1.60
15. Ratio of wage bills to intermediation cost 58.60 59.14 71.85 69.11 67.45 69.50 67.21 68.55
16. Ratio of wage bills to total expense 9.75 10.06 13.58 11.34 15.71 16.12 14.55 14.68
17. Ratio of wage bills to total income 7.96 8.14 12.08 9.97 11.61 12.31 11.57 11.91
18. Ratio of burden to total assets 0.63 0.53 1.05 0.92 0.67 0.84 1.03 1.01
19. Ratio of burden to interest income 6.80 5.71 11.45 9.57 7.68 9.43 11.38 11.71
20. Ratio of operating profits to total assets 1.85 1.95 1.07 1.22 2.54 2.33 1.97 1.74
21. Return on assets 0.67 0.71 0.65 0.44 1.19 1.00 0.81 1.07
22. Return on equity 9.91 10.74 11.21 7.66 19.80 15.70 16.32 20.47
23. Cost of deposits 7.60 7.56 7.61 8.11 6.18 6.61 6.35 6.26
24. Cost of borrowings 7.09 6.97 9.51 9.27 4.84 4.00 8.52 7.80
25. Cost of funds 7.36 7.35 7.43 7.90 5.73 6.11 6.00 5.91
26. Return on advances 11.62 11.42 11.16 11.70 10.61 10.57 10.74 9.97
27. Return on investments 7.22 6.97 7.59 7.41 7.10 7.55 7.21 7.47
28. Return on advances adjusted to cost of funds 4.26 4.08 3.72 3.80 4.88 4.46 4.74 4.07
29. Return on investments adjusted to cost of funds -0.13 -0.38 0.16 -0.49 1.37 1.43 1.21 1.57
30. Business per employee (in Rupees Million) 146.22 162.03 130.20 137.00 113.20 116.51 107.41 125.70
31. Profit per employee (in Rupees Million) 0.62 0.70 0.60 0.40 0.84 0.81 0.53 0.81
32. Capital adequacy ratio 12.69 12.04 13.26 12.91 12.63 12.72 12.24 12.59
33. Capital adequacy ratio - Tier I 10.12 9.18 8.55 8.38 9.28 9.76 8.94 8.96
34. Capital adequacy ratio - Tier II 2.57 2.86 4.71 4.53 3.35 2.96 3.30 3.63
35. Ratio of net NPA to net advances 2.21 2.27 1.19 2.16 1.52 2.35 0.96 0.76
Source : Annual accounts of Banks.Source

301
TABLE B12 : SELECTED RATIOS OF SCHEDULED COMMERCIAL BANKS - 2012 AND 2013 AS ON MARCH 31NATIONALISED BANKS (In per cent)
(Contd.)
ItemsUCO Bank Union Bank of India United Bank of India Vijaya Bank
2012 2013 2012 2013 2012 2013 2012 2013(33) (34) (35) (36) (37) (38) (39) (40)
1. Cash - Deposit Ratio 5.07 3.29 5.22 4.08 5.71 3.82 5.47 4.04
2. Credit - Deposit Ratio 75.02 73.97 79.81 78.90 70.74 68.46 69.72 71.91
3. Investment - Deposit Ratio 29.72 30.12 27.98 30.65 32.61 33.25 34.49 32.25
4. (Credit + Investment) - Deposit Ratio 104.75 104.09 107.80 109.54 103.35 101.71 104.20 104.16
5. Ratio of deposits to total liabilities 85.32 87.30 85.00 84.58 87.36 87.82 86.73 87.42
6. Ratio of demand & savings bank deposits to total deposits
22.34 32.14 31.28 30.95 40.77 39.65 22.02 20.97
7. Ratio of priority sector advances to total advances 25.03 25.98 23.87 26.60 35.15 36.49 29.56 27.54
8. Ratio of term loans to total advances 63.86 60.44 43.71 46.45 69.10 69.93 53.47 52.38
9. Ratio of secured advances to total advances 76.08 89.43 78.57 85.74 80.49 86.74 74.25 78.53
10. Ratio of investments in non-approved securities to total investments
12.80 17.02 19.05 23.59 21.87 23.30 17.24 16.69
11. Ratio of interest income to total assets 8.51 8.84 8.44 8.75 8.29 8.54 8.99 8.76
12. Ratio of net interest income to total assets (Net Interest Margin)
2.27 2.42 2.73 2.63 2.58 2.30 2.14 1.82
13. Ratio of non-interest income to total assets 0.56 0.50 0.98 0.89 0.76 0.98 0.59 0.59
14. Ratio of intermediation cost to total assets 1.20 1.15 1.60 1.57 1.44 1.39 1.35 1.32
15. Ratio of wage bills to intermediation cost 67.26 64.01 62.18 61.06 64.42 62.01 61.59 62.26
16. Ratio of wage bills to total expense 10.82 9.71 13.61 12.47 12.98 11.28 10.16 9.94
17. Ratio of wage bills to total income 8.87 7.87 10.56 9.95 10.25 9.04 8.69 8.79
18. Ratio of burden to total assets 0.63 0.65 0.62 0.68 0.68 0.40 0.76 0.73
19. Ratio of burden to interest income 7.45 7.31 7.32 7.80 8.17 4.73 8.43 8.35
20. Ratio of operating profits to total assets 1.64 1.77 2.11 1.94 1.90 1.89 1.38 1.09
21. Return on assets 0.69 0.33 0.79 0.79 0.70 0.38 0.66 0.59
22. Return on equity 13.83 6.76 13.05 13.52 11.93 6.84 11.54 10.83
23. Cost of deposits 6.65 7.03 6.30 6.80 6.11 6.57 7.43 7.61
24. Cost of borrowings 8.51 5.93 5.31 4.94 8.17 10.81 7.52 5.50
25. Cost of funds 6.44 6.68 5.93 6.37 5.88 6.39 7.10 7.14
26. Return on advances 10.61 10.55 9.75 9.92 10.35 10.46 11.35 10.67
27. Return on investments 7.12 7.42 7.57 7.92 6.79 7.23 6.96 7.20
28. Return on advances adjusted to cost of funds 4.17 3.87 3.81 3.55 4.47 4.06 4.24 3.52
29. Return on investments adjusted to cost of funds 0.68 0.74 1.63 1.55 0.91 0.83 -0.14 0.06
30. Business per employee (in Rupees Million) 116.40 118.90 107.00 121.50 97.10 108.30 112.80 124.00
31. Profit per employee (in Rupees Million) 0.51 0.27 0.60 0.70 0.41 0.25 0.50 0.50
32. Capital adequacy ratio 12.35 14.15 11.85 11.45 12.69 11.66 13.06 11.32
33. Capital adequacy ratio - Tier I 8.09 9.06 8.37 8.23 8.79 8.40 9.68 8.54
34. Capital adequacy ratio - Tier II 4.26 5.09 3.48 3.22 3.90 3.26 3.38 2.78
35. Ratio of net NPA to net advances 1.96 3.17 1.70 1.61 1.72 2.87 1.72 1.30
Source : Annual accounts of Banks.Source

302
TABLE B12 : SELECTED RATIOS OF SCHEDULED COMMERCIAL BANKS - 2012 AND 2013 AS ON MARCH 31OLD PRIVATE SECTOR BANKS (In per cent)
(Contd.)
ItemsCatholic Syrian Bank City Union Bank Dhanlaxmi Bank Federal Bank
2012 2013 2012 2013 2012 2013 2012 2013(1) (2) (3) (4) (5) (6) (7) (8)
1. Cash - Deposit Ratio 6.47 5.10 4.99 5.01 7.35 4.55 4.95 4.76
2. Credit - Deposit Ratio 72.26 71.72 74.28 75.09 74.19 69.42 77.15 76.54
3. Investment - Deposit Ratio 29.66 26.75 28.07 25.94 36.94 41.82 35.56 36.72
4. (Credit + Investment) - Deposit Ratio 101.92 98.47 102.34 101.02 111.13 111.24 112.71 113.25
5. Ratio of deposits to total liabilities 88.01 90.61 89.05 88.37 80.43 81.06 80.72 81.09
6. Ratio of demand & savings bank deposits to total deposits
19.32 17.53 18.19 16.77 19.35 22.46 27.54 27.17
7. Ratio of priority sector advances to total advances 33.78 21.62 36.23 37.65 32.09 28.93 32.28 26.07
8. Ratio of term loans to total advances 31.05 25.18 35.33 32.67 80.09 77.28 37.66 36.48
9. Ratio of secured advances to total advances 96.07 96.48 96.81 98.06 89.59 90.23 77.19 83.40
10. Ratio of investments in non-approved securities to total investments
11.26 10.49 16.11 13.34 4.51 7.02 33.74 31.10
11. Ratio of interest income to total assets 9.83 10.29 10.30 10.59 9.63 9.18 9.92 9.37
12. Ratio of net interest income to total assets (Net Interest Margin)
2.81 2.64 3.03 3.02 1.71 1.94 3.49 3.00
13. Ratio of non-interest income to total assets 0.78 0.74 1.26 1.32 0.99 0.80 0.95 1.01
14. Ratio of intermediation cost to total assets 2.73 2.59 1.70 1.81 3.38 2.38 1.75 1.79
15. Ratio of wage bills to intermediation cost 71.07 70.49 43.71 40.32 56.03 55.04 55.54 53.11
16. Ratio of wage bills to total expense 19.89 17.81 8.28 7.78 16.75 13.62 11.86 11.66
17. Ratio of wage bills to total income 18.29 16.53 6.42 6.13 17.82 13.13 8.93 9.17
18. Ratio of burden to total assets 1.95 1.85 0.44 0.49 2.39 1.58 0.80 0.78
19. Ratio of burden to interest income 19.85 17.96 4.28 4.59 24.78 17.20 8.04 8.35
20. Ratio of operating profits to total assets 0.85 0.79 2.59 2.53 -0.68 0.36 2.69 2.22
21. Return on assets 0.24 0.25 1.71 1.58 -0.73 0.02 1.41 1.35
22. Return on equity 4.66 4.94 24.91 22.33 -14.70 0.35 14.37 13.89
23. Cost of deposits 7.64 8.28 7.97 8.21 8.35 7.96 7.25 7.20
24. Cost of borrowings 6.81 8.11 11.43 14.59 11.12 6.97 8.93 7.54
25. Cost of funds 7.36 8.07 7.95 8.16 8.25 7.28 6.89 6.75
26. Return on advances 12.41 13.01 12.98 13.24 12.07 11.75 12.02 11.33
27. Return on investments 6.88 7.02 7.40 7.56 7.84 7.19 8.24 7.60
28. Return on advances adjusted to cost of funds 5.05 4.94 5.03 5.07 3.82 4.47 5.13 4.57
29. Return on investments adjusted to cost of funds -0.48 -1.05 -0.55 -0.61 -0.41 -0.09 1.35 0.85
30. Business per employee (in Rupees Million) 67.50 73.60 84.70 93.80 59.29 72.97 101.10 107.50
31. Profit per employee (in Rupees Million) 0.10 0.12 0.80 0.90 -0.33 0.01 0.90 0.90
32. Capital adequacy ratio 11.08 12.29 12.57 13.98 9.49 11.06 16.64 14.73
33. Capital adequacy ratio - Tier I 8.83 9.62 11.69 13.27 7.42 8.05 15.86 14.09
34. Capital adequacy ratio - Tier II 2.25 2.67 0.88 0.71 2.07 3.01 0.78 0.64
35. Ratio of net NPA to net advances 1.10 1.12 0.44 0.63 0.66 3.36 0.53 0.98
Source : Annual accounts of Banks.Source

303
TABLE B12 : SELECTED RATIOS OF SCHEDULED COMMERCIAL BANKS - 2012 AND 2013 AS ON MARCH 31OLD PRIVATE SECTOR BANKS (In per cent)
(Contd.)
ItemsING Vysya Bank Jammu & Kashmir
Bank Karnataka Bank Karur Vysya Bank
2012 2013 2012 2013 2012 2013 2012 2013(9) (10) (11) (12) (13) (14) (15) (16)
1. Cash - Deposit Ratio 5.63 4.70 5.22 4.20 5.39 4.76 5.98 4.21
2. Credit - Deposit Ratio 81.61 76.87 62.00 61.04 65.55 69.91 74.58 76.27
3. Investment - Deposit Ratio 36.13 44.22 40.54 40.08 40.63 37.25 32.72 35.80
4. (Credit + Investment) - Deposit Ratio 117.73 121.09 102.54 101.12 106.18 107.17 107.30 112.07
5. Ratio of deposits to total liabilities 74.91 75.38 88.51 89.51 87.02 86.83 85.32 82.71
6. Ratio of demand & savings bank deposits to total deposits
34.28 32.50 40.71 39.23 24.56 24.91 19.16 19.25
7. Ratio of priority sector advances to total advances 33.06 34.47 30.11 29.20 36.53 37.14 31.27 34.43
8. Ratio of term loans to total advances 56.55 49.33 74.32 72.64 45.05 44.75 22.54 16.73
9. Ratio of secured advances to total advances 88.75 93.04 83.56 82.61 93.52 95.96 94.45 96.21
10. Ratio of investments in non-approved securities to total investments
29.46 31.55 46.57 45.35 36.68 34.01 11.93 8.73
11. Ratio of interest income to total assets 8.97 9.55 8.73 9.30 9.12 9.67 9.93 10.06
12. Ratio of net interest income to total assets (Net Interest Margin)
2.81 3.02 3.32 3.51 2.15 2.32 2.79 2.75
13. Ratio of non-interest income to total assets 1.56 1.43 0.60 0.73 1.02 1.02 1.06 1.07
14. Ratio of intermediation cost to total assets 2.58 2.50 1.45 1.50 1.67 1.71 1.64 1.81
15. Ratio of wage bills to intermediation cost 58.64 58.98 65.00 65.95 57.19 56.32 48.82 45.08
16. Ratio of wage bills to total expense 17.32 16.33 13.72 13.56 11.06 10.64 9.13 8.93
17. Ratio of wage bills to total income 14.38 13.43 10.09 9.85 9.43 9.01 7.30 7.32
18. Ratio of burden to total assets 1.02 1.07 0.84 0.77 0.65 0.69 0.58 0.73
19. Ratio of burden to interest income 11.42 11.23 9.68 8.23 7.16 7.13 5.85 7.30
20. Ratio of operating profits to total assets 1.79 1.95 2.47 2.74 1.50 1.63 2.20 2.01
21. Return on assets 1.09 1.26 1.56 1.70 0.73 0.89 1.56 1.35
22. Return on equity 13.82 14.24 21.22 23.56 9.79 12.76 20.81 19.00
23. Cost of deposits 6.59 6.74 5.92 6.36 7.70 8.06 7.75 7.97
24. Cost of borrowings 10.07 12.19 8.14 6.88 8.96 9.85 11.99 8.85
25. Cost of funds 6.38 6.70 5.86 6.28 7.49 7.90 7.64 7.62
26. Return on advances 10.96 11.74 11.45 11.95 12.41 12.27 12.16 12.26
27. Return on investments 8.26 8.43 6.79 7.27 6.05 7.14 7.85 7.81
28. Return on advances adjusted to cost of funds 4.58 5.04 5.59 5.66 4.92 4.37 4.51 4.64
29. Return on investments adjusted to cost of funds 1.88 1.73 0.93 0.99 -1.44 -0.75 0.21 0.19
30. Business per employee (in Rupees Million) 55.98 64.43 88.60 104.90 85.90 96.60 98.40 101.40
31. Profit per employee (in Rupees Million) 0.46 0.63 0.90 1.10 0.40 0.50 0.88 0.82
32. Capital adequacy ratio 14.00 13.24 13.36 12.83 12.84 13.22 14.33 14.41
33. Capital adequacy ratio - Tier I 11.23 10.49 11.12 10.86 10.86 10.51 13.12 13.10
34. Capital adequacy ratio - Tier II 2.77 2.75 2.24 1.97 1.98 2.71 1.21 1.31
35. Ratio of net NPA to net advances 0.18 0.03 0.15 0.14 2.11 1.51 0.33 0.37
Source : Annual accounts of Banks.Source

304
TABLE B12 : SELECTED RATIOS OF SCHEDULED COMMERCIAL BANKS - 2012 AND 2013 AS ON MARCH 31OLD PRIVATE SECTOR BANKS (In per cent)
(Contd.)
ItemsLakshmi Vilas Bank Nainital Bank Ratnakar Bank South Indian Bank
2012 2013 2012 2013 2012 2013 2012 2013(17) (18) (19) (20) (21) (22) (23) (24)
1. Cash - Deposit Ratio 5.74 4.66 6.17 4.95 5.56 3.49 4.31 3.83
2. Credit - Deposit Ratio 72.19 74.93 55.07 57.88 87.19 76.45 74.74 71.88
3. Investment - Deposit Ratio 31.14 27.69 32.58 27.81 49.24 66.80 25.75 28.29
4. (Credit + Investment) - Deposit Ratio 103.33 102.61 87.66 85.69 136.43 143.25 100.49 100.17
5. Ratio of deposits to total liabilities 87.32 88.41 87.81 86.23 65.78 64.34 90.41 88.89
6. Ratio of demand & savings bank deposits to total deposits
14.91 14.49 36.76 39.40 21.51 19.72 19.67 18.60
7. Ratio of priority sector advances to total advances 34.33 38.03 49.52 50.11 20.42 20.62 18.76 26.13
8. Ratio of term loans to total advances 39.19 29.73 47.25 44.42 71.35 77.59 37.52 41.38
9. Ratio of secured advances to total advances 87.36 91.92 94.82 94.66 89.35 89.90 93.16 92.81
10. Ratio of investments in non-approved securities to total investments
19.04 12.10 36.73 29.91 38.69 41.44 12.62 20.29
11. Ratio of interest income to total assets 10.31 10.41 9.43 9.49 8.91 8.72 9.79 9.84
12. Ratio of net interest income to total assets (Net Interest Margin)
2.52 2.32 3.88 3.54 3.58 2.55 2.79 2.84
13. Ratio of non-interest income to total assets 1.07 1.17 0.62 0.73 1.29 1.25 0.68 0.74
14. Ratio of intermediation cost to total assets 1.99 2.00 1.99 1.93 2.67 2.25 1.69 1.70
15. Ratio of wage bills to intermediation cost 48.09 46.64 68.21 67.18 60.50 55.02 60.61 61.59
16. Ratio of wage bills to total expense 9.80 9.24 18.03 16.49 20.16 14.73 11.77 12.05
17. Ratio of wage bills to total income 8.42 8.05 13.53 12.72 15.81 12.43 9.77 9.91
18. Ratio of burden to total assets 0.92 0.83 1.38 1.20 1.38 1.00 1.01 0.96
19. Ratio of burden to interest income 8.94 8.00 14.60 12.68 15.47 11.47 10.33 9.75
20. Ratio of operating profits to total assets 1.60 1.48 2.51 2.34 2.20 1.55 1.78 1.88
21. Return on assets 0.73 0.54 1.75 1.30 1.38 1.06 1.12 1.17
22. Return on equity 11.56 9.28 17.74 13.31 5.90 6.73 19.99 19.41
23. Cost of deposits 8.40 8.74 6.37 6.82 7.25 7.40 7.61 7.62
24. Cost of borrowings 13.40 13.10 5.04 7.94 5.38 7.00 9.76 7.96
25. Cost of funds 8.64 8.89 6.37 6.82 6.80 7.15 7.56 7.54
26. Return on advances 12.98 12.73 12.33 12.60 11.51 11.73 12.01 12.10
27. Return on investments 8.19 7.82 7.74 7.68 6.78 6.47 6.78 6.81
28. Return on advances adjusted to cost of funds 4.34 3.84 5.96 5.78 4.71 4.59 4.45 4.56
29. Return on investments adjusted to cost of funds -0.45 -1.07 1.37 0.86 -0.02 -0.68 -0.78 -0.74
30. Business per employee (in Rupees Million) 78.70 86.30 65.60 74.80 60.70 73.90 107.90 120.10
31. Profit per employee (in Rupees Million) 0.35 0.29 0.80 0.70 0.50 0.50 0.70 0.80
32. Capital adequacy ratio 13.10 12.32 15.09 14.43 23.20 17.11 14.00 13.91
33. Capital adequacy ratio - Tier I 8.86 9.15 14.62 13.99 22.83 16.82 11.54 12.05
34. Capital adequacy ratio - Tier II 4.24 3.17 0.47 0.44 0.37 0.29 2.46 1.86
35. Ratio of net NPA to net advances 1.74 2.43 - - 0.20 0.11 0.28 0.78
Source : Annual accounts of Banks.Source

305
TABLE B12 : SELECTED RATIOS OF SCHEDULED COMMERCIAL BANKS - 2012 AND 2013 AS ON MARCH 31OLD PRIVATE SECTOR BANKS (In per cent)
(Contd.)
Items
Tamilnad MercantileBank
2012 2013(25) (26)
1. Cash - Deposit Ratio 4.07 4.54
2. Credit - Deposit Ratio 80.53 80.38
3. Investment - Deposit Ratio 28.58 26.45
4. (Credit + Investment) - Deposit Ratio 109.11 106.83
5. Ratio of deposits to total liabilities 84.25 85.39
6. Ratio of demand & savings bank deposits to total deposits
20.63 18.86
7. Ratio of priority sector advances to total advances 42.73 45.42
8. Ratio of term loans to total advances 37.76 36.22
9. Ratio of secured advances to total advances 96.73 97.32
10. Ratio of investments in non-approved securities to total investments
9.93 7.97
11. Ratio of interest income to total assets 10.34 11.23
12. Ratio of net interest income to total assets (Net Interest Margin)
3.57 3.91
13. Ratio of non-interest income to total assets 1.27 1.13
14. Ratio of intermediation cost to total assets 1.92 1.90
15. Ratio of wage bills to intermediation cost 61.00 57.88
16. Ratio of wage bills to total expense 13.47 11.94
17. Ratio of wage bills to total income 10.07 8.91
18. Ratio of burden to total assets 0.64 0.77
19. Ratio of burden to interest income 6.24 6.87
20. Ratio of operating profits to total assets 2.93 3.14
21. Return on assets 1.75 2.00
22. Return on equity 20.89 24.08
23. Cost of deposits 7.80 8.27
24. Cost of borrowings 10.28 19.04
25. Cost of funds 7.71 8.21
26. Return on advances 12.52 13.78
27. Return on investments 7.90 7.76
28. Return on advances adjusted to cost of funds 4.81 5.58
29. Return on investments adjusted to cost of funds 0.19 -0.45
30. Business per employee (in Rupees Million) 106.88 113.32
31. Profit per employee (in Rupees Million) 1.10 1.39
32. Capital adequacy ratio 14.69 15.01
33. Capital adequacy ratio - Tier I 13.98 14.33
34. Capital adequacy ratio - Tier II 0.71 0.68
35. Ratio of net NPA to net advances 0.45 0.66
Source : Annual accounts of Banks.Source

306
TABLE B12 : SELECTED RATIOS OF SCHEDULED COMMERCIAL BANKS - 2012 AND 2013 AS ON MARCH 31NEW PRIVATE SECTOR BANKS (In per cent)
(Contd.)
ItemsAxis Bank Development Credit
Bank HDFC Bank ICICI Bank
2012 2013 2012 2013 2012 2013 2012 2013(1) (2) (3) (4) (5) (6) (7) (8)
1. Cash - Deposit Ratio 4.86 5.86 6.43 4.53 6.08 4.94 8.01 6.51
2. Credit - Deposit Ratio 77.13 77.97 83.41 78.74 79.21 80.92 99.31 99.19
3. Investment - Deposit Ratio 42.34 45.02 39.74 40.16 39.51 37.68 62.45 58.57
4. (Credit + Investment) - Deposit Ratio 119.47 123.00 123.15 118.90 118.73 118.60 161.76 157.77
5. Ratio of deposits to total liabilities 77.06 74.18 73.02 74.16 73.01 74.00 52.24 54.51
6. Ratio of demand & savings bank deposits to total deposits
41.54 44.38 32.12 27.16 48.40 47.43 43.45 41.89
7. Ratio of priority sector advances to total advances 28.56 24.62 36.33 32.18 32.68 32.01 23.37 20.60
8. Ratio of term loans to total advances 70.09 69.41 59.67 64.21 58.63 55.40 84.88 82.34
9. Ratio of secured advances to total advances 86.44 82.84 86.94 95.34 75.54 76.24 84.82 85.91
10. Ratio of investments in non-approved securities to total investments
37.32 36.48 19.70 27.55 21.81 23.93 45.51 46.10
11. Ratio of interest income to total assets 8.33 8.68 8.91 9.18 9.06 9.50 7.49 7.81
12. Ratio of net interest income to total assets (Net Interest Margin)
3.04 3.09 2.83 2.85 4.19 4.28 2.40 2.70
13. Ratio of non-interest income to total assets 2.05 2.09 1.25 1.17 1.88 1.86 1.68 1.63
14. Ratio of intermediation cost to total assets 2.27 2.21 3.04 2.76 3.02 3.04 1.75 1.76
15. Ratio of wage bills to intermediation cost 34.63 34.38 51.01 50.09 36.65 35.29 44.78 43.20
16. Ratio of wage bills to total expense 10.41 9.73 16.98 15.20 14.01 13.01 11.47 11.05
17. Ratio of wage bills to total income 7.59 7.05 15.24 13.35 10.10 9.46 8.56 8.04
18. Ratio of burden to total assets 0.22 0.12 1.79 1.59 1.14 1.19 0.08 0.13
19. Ratio of burden to interest income 2.67 1.34 20.07 17.28 12.53 12.50 1.04 1.66
20. Ratio of operating profits to total assets 2.81 2.97 1.04 1.26 3.05 3.10 2.32 2.57
21. Return on assets 1.68 1.70 0.68 1.06 1.77 1.90 1.50 1.70
22. Return on equity 20.29 18.53 7.43 10.95 18.69 20.34 11.20 13.10
23. Cost of deposits 5.95 6.35 6.83 7.27 5.57 6.01 5.95 6.16
24. Cost of borrowings 5.94 6.41 8.18 7.33 12.03 10.32 6.81 6.53
25. Cost of funds 5.29 5.62 6.88 7.08 6.06 6.41 4.32 4.55
26. Return on advances 9.85 10.45 11.21 11.99 11.89 12.33 9.42 10.05
27. Return on investments 7.74 7.49 7.17 6.68 7.72 7.48 6.58 6.65
28. Return on advances adjusted to cost of funds 4.57 4.83 4.33 4.91 5.83 5.92 5.10 5.50
29. Return on investments adjusted to cost of funds 2.46 1.87 0.29 -0.40 1.67 1.07 2.27 2.10
30. Business per employee (in Rupees Million) 127.60 121.50 51.40 67.40 65.40 75.00 70.80 73.50
31. Profit per employee (in Rupees Million) 1.40 1.50 0.20 0.50 0.80 1.00 1.10 1.40
32. Capital adequacy ratio 13.66 17.00 15.41 13.61 16.52 16.80 18.52 18.74
33. Capital adequacy ratio - Tier I 9.45 12.23 13.81 12.62 11.60 11.08 12.68 12.80
34. Capital adequacy ratio - Tier II 4.21 4.77 1.60 0.99 4.92 5.72 5.84 5.94
35. Ratio of net NPA to net advances 0.27 0.36 0.57 0.75 0.18 0.20 0.73 0.77
Source : Annual accounts of Banks.Source

307
TABLE B12 : SELECTED RATIOS OF SCHEDULED COMMERCIAL BANKS - 2012 AND 2013 AS ON MARCH 31NEW PRIVATE SECTOR BANKS (In per cent)
(Contd.)
ItemsIndusInd Bank Kotak Mahindra
Bank Yes Bank
2012 2013 2012 2013 2012 2013(9) (10) (11) (12) (13) (14)
1. Cash - Deposit Ratio 6.85 6.01 5.23 4.33 4.75 4.99
2. Credit - Deposit Ratio 82.77 81.90 101.41 94.98 77.29 70.20
3. Investment - Deposit Ratio 34.40 36.32 55.96 56.58 56.47 64.19
4. (Credit + Investment) - Deposit Ratio 117.17 118.22 157.37 151.57 133.76 134.38
5. Ratio of deposits to total liabilities 73.55 73.82 58.68 60.97 66.76 67.56
6. Ratio of demand & savings bank deposits to total deposits
27.30 29.32 32.18 29.24 15.04 18.95
7. Ratio of priority sector advances to total advances 35.67 32.32 31.47 28.92 25.92 22.39
8. Ratio of term loans to total advances 73.37 73.09 76.92 77.01 74.69 71.58
9. Ratio of secured advances to total advances 91.86 90.50 83.37 85.46 72.94 67.63
10. Ratio of investments in non-approved securities to total investments
18.32 28.22 23.09 25.32 41.71 45.23
11. Ratio of interest income to total assets 10.38 10.67 10.61 10.77 9.51 9.60
12. Ratio of net interest income to total assets (Net Interest Margin)
3.30 3.41 4.31 4.29 2.44 2.57
13. Ratio of non-interest income to total assets 1.96 2.08 1.68 1.55 1.29 1.46
14. Ratio of intermediation cost to total assets 2.60 2.68 3.15 2.96 1.41 1.55
15. Ratio of wage bills to intermediation cost 36.15 37.66 49.18 48.65 50.95 49.12
16. Ratio of wage bills to total expense 9.71 10.17 16.40 15.26 8.45 8.85
17. Ratio of wage bills to total income 7.62 7.93 12.61 11.68 6.63 6.86
18. Ratio of burden to total assets 0.64 0.60 1.47 1.40 0.11 0.09
19. Ratio of burden to interest income 6.18 5.63 13.87 13.04 1.20 0.93
20. Ratio of operating profits to total assets 2.66 2.81 2.84 2.89 2.32 2.48
21. Return on assets 1.57 1.63 1.83 1.81 1.57 1.57
22. Return on equity 18.26 17.15 14.65 15.60 23.07 24.81
23. Cost of deposits 8.02 8.35 7.39 7.47 8.08 7.86
24. Cost of borrowings 8.15 7.98 8.22 8.06 8.14 8.62
25. Cost of funds 7.19 7.48 6.82 6.95 8.05 8.01
26. Return on advances 13.77 14.13 14.23 14.04 12.24 12.70
27. Return on investments 7.67 7.49 6.75 7.41 7.93 8.09
28. Return on advances adjusted to cost of funds 6.58 6.66 7.41 7.09 4.19 4.69
29. Return on investments adjusted to cost of funds 0.47 0.02 -0.07 0.46 -0.12 0.07
30. Business per employee (in Rupees Million) 78.84 84.05 61.30 68.60 174.77 177.42
31. Profit per employee (in Rupees Million) 0.86 0.92 0.90 1.00 2.04 2.10
32. Capital adequacy ratio 13.85 15.36 17.52 16.05 17.90 18.30
33. Capital adequacy ratio - Tier I 11.37 13.78 15.74 14.71 9.90 9.50
34. Capital adequacy ratio - Tier II 2.48 1.58 1.78 1.34 8.00 8.80
35. Ratio of net NPA to net advances 0.27 0.31 0.61 0.64 0.05 0.01
Source : Annual accounts of Banks.Source

308
TABLE B12 : SELECTED RATIOS OF SCHEDULED COMMERCIAL BANKS - 2012 AND 2013 AS ON MARCH 31FOREIGN BANKS (In per cent)
(Contd.)
ItemsAB Bank Abu Dhabi
Commercial BankAmerican Express
Banking Corp.Antwerp Diamond
Bank
2012 2013 2012 2013 2012 2013 2012 2013(1) (2) (3) (4) (5) (6) (7) (8)
1. Cash - Deposit Ratio 4.35 1.74 5.11 4.54 11.54 7.27 32.84 20.87
2. Credit - Deposit Ratio 149.92 51.46 46.39 73.81 294.05 253.50 1156.39 956.28
3. Investment - Deposit Ratio 36.27 20.71 36.33 33.03 68.07 57.94 207.38 174.89
4. (Credit + Investment) - Deposit Ratio 186.19 72.17 82.72 106.84 362.12 311.44 1363.77 1131.17
5. Ratio of deposits to total liabilities 39.04 61.23 51.12 43.00 23.50 26.56 6.70 7.82
6. Ratio of demand & savings bank deposits to total deposits
78.42 92.70 24.32 27.80 - - 59.96 67.68
7. Ratio of priority sector advances to total advances 40.40 40.60 21.14 24.44 - - 97.69 98.22
8. Ratio of term loans to total advances 26.48 28.32 30.58 23.22 0.02 0.01 0.09 0.14
9. Ratio of secured advances to total advances 13.32 5.23 100.00 94.77 0.01 0.01 91.99 99.90
10. Ratio of investments in non-approved securities to total investments
19.12 11.26 15.85 7.52 - - - -
11. Ratio of interest income to total assets 4.38 4.42 7.01 8.23 4.04 3.79 4.26 5.30
12. Ratio of net interest income to total assets (Net Interest Margin)
3.90 3.56 3.30 3.37 -0.12 -1.23 2.33 3.31
13. Ratio of non-interest income to total assets 16.13 11.72 0.43 0.47 26.06 23.86 1.74 2.23
14. Ratio of intermediation cost to total assets 8.11 6.49 1.62 1.71 24.92 23.97 1.37 1.62
15. Ratio of wage bills to intermediation cost 13.16 12.50 54.75 56.71 22.29 19.30 56.20 49.60
16. Ratio of wage bills to total expense 12.43 11.04 16.63 14.79 19.09 15.96 23.33 22.33
17. Ratio of wage bills to total income 5.21 5.03 11.92 11.18 18.45 16.74 12.84 10.70
18. Ratio of burden to total assets -8.02 -5.23 1.19 1.25 -1.14 0.11 -0.37 -0.61
19. Ratio of burden to interest income -183.06 -118.33 16.97 15.18 -28.27 2.98 -8.71 -11.49
20. Ratio of operating profits to total assets 11.92 8.79 2.11 2.12 1.02 -1.34 2.70 3.92
21. Return on assets 7.05 5.03 1.87 1.40 0.20 -3.23 1.20 1.31
22. Return on equity 12.96 11.24 7.28 5.72 0.64 -10.50 6.57 6.39
23. Cost of deposits 0.83 1.47 5.21 7.61 9.05 8.83 1.43 2.31
24. Cost of borrowings - - 3.97 4.68 9.34 12.65 2.59 2.60
25. Cost of funds 1.10 1.61 4.86 6.50 9.17 10.61 1.07 1.04
26. Return on advances 4.43 5.86 9.97 9.03 4.42 3.76 3.43 5.40
27. Return on investments 6.99 8.08 7.43 8.37 7.51 7.83 10.86 7.87
28. Return on advances adjusted to cost of funds 3.33 4.25 5.11 2.53 -4.75 -6.85 2.35 4.36
29. Return on investments adjusted to cost of funds 5.89 6.46 2.57 1.87 -1.66 -2.78 9.78 6.83
30. Business per employee (in Rupees Million) 44.26 26.13 163.51 271.80 30.12 33.03 387.45 287.20
31. Profit per employee (in Rupees Million) 3.02 2.50 3.40 3.57 0.06 -1.12 5.72 5.09
32. Capital adequacy ratio 34.36 19.10 80.88 66.82 19.30 18.17 25.60 32.72
33. Capital adequacy ratio - Tier I 33.60 18.94 80.00 65.91 18.70 17.61 17.47 23.14
34. Capital adequacy ratio - Tier II 0.76 0.16 0.88 0.91 0.60 0.56 8.13 9.58
35. Ratio of net NPA to net advances - 8.98 - - 1.19 1.87 1.96 -
Source : Annual accounts of Banks.Source

309
TABLE B12 : SELECTED RATIOS OF SCHEDULED COMMERCIAL BANKS - 2012 AND 2013 AS ON MARCH 31FOREIGN BANKS (In per cent)
(Contd.)
Items
Australia and NewZealand Banking
Group
Bank InternasionalIndonesia Bank of America Bank of Bahrain &
Kuwait
2012 2013 2012 2013 2012 2013 2012 2013(9) (10) (11) (12) (13) (14) (15) (16)
1. Cash - Deposit Ratio 8.07 6.57 - - 7.04 5.75 6.11 7.87
2. Credit - Deposit Ratio 76.01 94.72 - - 104.03 103.32 95.78 99.54
3. Investment - Deposit Ratio 26.05 39.65 - - 137.90 119.73 50.52 46.77
4. (Credit + Investment) - Deposit Ratio 102.06 134.37 - - 241.94 223.05 146.31 146.31
5. Ratio of deposits to total liabilities 55.49 51.12 - - 36.87 40.02 56.53 59.59
6. Ratio of demand & savings bank deposits to total deposits
2.64 4.97 - - 52.54 58.38 35.27 21.81
7. Ratio of priority sector advances to total advances 27.87 25.29 - - 23.92 27.48 29.28 31.49
8. Ratio of term loans to total advances 11.00 22.91 - - - 3.31 36.24 37.69
9. Ratio of secured advances to total advances 16.55 6.52 - - 9.40 3.96 76.09 67.11
10. Ratio of investments in non-approved securities to total investments
- - - - 30.60 30.61 27.13 18.93
11. Ratio of interest income to total assets 3.02 7.00 3.42 2.19 7.85 7.71 7.85 8.03
12. Ratio of net interest income to total assets (Net Interest Margin)
1.72 2.95 3.42 2.19 4.86 4.40 4.87 4.46
13. Ratio of non-interest income to total assets 2.25 1.23 - 0.05 3.58 2.74 1.10 0.89
14. Ratio of intermediation cost to total assets 3.54 3.07 2.80 3.64 2.86 2.49 1.92 1.62
15. Ratio of wage bills to intermediation cost 45.78 51.59 - 42.32 51.73 56.52 47.34 45.43
16. Ratio of wage bills to total expense 33.50 22.26 - 42.32 25.29 24.25 18.53 14.17
17. Ratio of wage bills to total income 30.71 19.25 - 68.89 12.94 13.46 10.15 8.25
18. Ratio of burden to total assets 1.28 1.84 2.80 3.60 -0.72 -0.25 0.82 0.73
19. Ratio of burden to interest income 42.50 26.27 82.07 164.08 -9.20 -3.21 10.42 9.11
20. Ratio of operating profits to total assets 0.44 1.11 0.61 -1.40 5.58 4.65 4.05 3.73
21. Return on assets 0.05 0.10 0.48 -0.93 3.62 2.57 2.14 1.48
22. Return on equity 0.15 0.50 0.49 -1.38 13.89 10.96 10.98 6.24
23. Cost of deposits 2.13 7.00 - - 5.03 3.86 3.38 5.59
24. Cost of borrowings 0.61 2.05 - - 3.41 5.72 5.58 2.06
25. Cost of funds 1.74 5.50 - - 3.55 2.47 3.31 4.83
26. Return on advances 1.75 6.45 - - 11.17 8.56 10.61 10.00
27. Return on investments 5.61 11.21 - - 6.61 8.36 7.32 8.06
28. Return on advances adjusted to cost of funds 0.01 0.95 - - 7.62 6.08 7.30 5.17
29. Return on investments adjusted to cost of funds 3.87 5.71 - - 3.06 5.88 4.01 3.24
30. Business per employee (in Rupees Million) 362.21 617.75 - - 339.93 380.70 133.60 146.00
31. Profit per employee (in Rupees Million) 0.12 0.55 - -2.25 14.89 12.07 2.10 1.80
32. Capital adequacy ratio 25.50 26.39 457.82 439.31 17.59 18.40 38.60 34.70
33. Capital adequacy ratio - Tier I 25.17 26.02 457.82 439.31 17.21 18.02 38.18 34.25
34. Capital adequacy ratio - Tier II 0.33 0.37 - - 0.38 0.38 0.42 0.45
35. Ratio of net NPA to net advances - - - - - - 2.49 3.16
Source : Annual accounts of Banks.Source

310
TABLE B12 : SELECTED RATIOS OF SCHEDULED COMMERCIAL BANKS - 2012 AND 2013 AS ON MARCH 31FOREIGN BANKS (In per cent)
(Contd.)
ItemsBank of Ceylon Bank of Nova Scotia Bank of Tokyo-
Mitsubishi UFJ Barclays Bank
2012 2013 2012 2013 2012 2013 2012 2013(17) (18) (19) (20) (21) (22) (23) (24)
1. Cash - Deposit Ratio 4.58 3.27 9.69 5.79 19.48 11.60 7.67 6.07
2. Credit - Deposit Ratio 77.20 83.63 141.10 128.25 196.47 164.95 160.83 167.33
3. Investment - Deposit Ratio 57.45 41.67 74.40 79.96 109.21 107.58 215.51 273.01
4. (Credit + Investment) - Deposit Ratio 134.65 125.30 215.50 208.21 305.68 272.53 376.34 440.34
5. Ratio of deposits to total liabilities 37.76 38.61 42.23 43.54 29.06 31.49 23.64 20.60
6. Ratio of demand & savings bank deposits to total deposits
40.08 42.89 9.91 8.52 48.83 46.40 8.47 7.86
7. Ratio of priority sector advances to total advances 46.79 34.81 43.45 35.49 45.58 32.85 34.51 37.13
8. Ratio of term loans to total advances 28.98 25.18 3.46 2.48 19.54 13.40 56.13 34.61
9. Ratio of secured advances to total advances 99.65 99.69 60.79 64.83 24.90 19.74 34.55 38.93
10. Ratio of investments in non-approved securities to total investments
- - 5.54 1.83 14.47 6.42 64.91 42.92
11. Ratio of interest income to total assets 7.73 8.25 6.46 6.40 6.59 6.72 5.54 6.37
12. Ratio of net interest income to total assets (Net Interest Margin)
5.87 6.35 2.80 2.76 4.76 4.33 2.88 2.23
13. Ratio of non-interest income to total assets 1.84 1.71 2.23 1.92 1.77 1.42 -0.38 1.08
14. Ratio of intermediation cost to total assets 1.70 1.84 0.76 0.67 1.43 1.38 2.29 2.19
15. Ratio of wage bills to intermediation cost 34.97 30.45 34.19 37.02 42.97 44.64 60.70 52.39
16. Ratio of wage bills to total expense 16.72 15.01 5.88 5.77 18.83 16.33 28.08 18.14
17. Ratio of wage bills to total income 6.22 5.63 2.99 2.99 7.36 7.56 26.88 15.42
18. Ratio of burden to total assets -0.14 0.13 -1.47 -1.25 -0.33 -0.04 2.66 1.11
19. Ratio of burden to interest income -1.82 1.57 -22.77 -19.55 -5.07 -0.59 48.05 17.49
20. Ratio of operating profits to total assets 6.01 6.22 4.27 4.01 5.09 4.37 0.22 1.11
21. Return on assets 3.08 4.26 2.24 2.24 2.26 2.06 -0.91 -0.27
22. Return on equity 6.04 8.07 17.96 17.45 7.02 8.20 -3.30 -1.02
23. Cost of deposits 4.35 4.94 7.17 5.55 5.81 4.97 5.98 5.05
24. Cost of borrowings 0.69 0.27 1.70 2.99 0.72 2.19 2.38 6.22
25. Cost of funds 4.24 4.66 4.32 4.28 2.60 2.31 4.95 5.39
26. Return on advances 10.72 10.49 6.39 6.40 6.70 7.02 9.81 7.00
27. Return on investments 9.99 15.01 7.79 8.02 8.23 8.61 7.00 8.08
28. Return on advances adjusted to cost of funds 6.49 5.83 2.07 2.12 4.10 4.71 4.87 1.62
29. Return on investments adjusted to cost of funds 5.75 10.34 3.47 3.74 5.62 6.30 2.06 2.69
30. Business per employee (in Rupees Million) 61.90 73.10 543.06 576.45 356.60 334.90 183.14 275.48
31. Profit per employee (in Rupees Million) 2.50 4.50 12.66 14.70 7.80 8.20 -2.31 -1.13
32. Capital adequacy ratio 96.58 71.45 14.93 11.95 51.60 44.53 14.99 19.09
33. Capital adequacy ratio - Tier I 95.31 70.20 10.23 9.16 44.83 33.76 14.45 18.44
34. Capital adequacy ratio - Tier II 1.27 1.25 4.70 2.79 6.77 10.77 0.54 0.65
35. Ratio of net NPA to net advances - - - 0.45 - - 1.45 1.74
Source : Annual accounts of Banks.Source

311
TABLE B12 : SELECTED RATIOS OF SCHEDULED COMMERCIAL BANKS - 2012 AND 2013 AS ON MARCH 31FOREIGN BANKS (In per cent)
(Contd.)
ItemsBNP Paribas Chinatrust
Commercial Bank Citibank CommonwealthBank of Australia
2012 2013 2012 2013 2012 2013 2012 2013(25) (26) (27) (28) (29) (30) (31) (32)
1. Cash - Deposit Ratio 5.77 6.01 11.11 9.24 10.42 7.19 34.74 15.26
2. Credit - Deposit Ratio 104.81 138.67 194.11 143.46 72.80 78.18 821.86 321.97
3. Investment - Deposit Ratio 57.40 81.80 35.48 62.10 66.72 66.22 149.70 67.58
4. (Credit + Investment) - Deposit Ratio 162.21 220.47 229.59 205.55 139.53 144.40 971.56 389.55
5. Ratio of deposits to total liabilities 50.30 40.79 40.45 44.51 50.38 51.85 4.78 16.87
6. Ratio of demand & savings bank deposits to total deposits
39.67 24.69 37.31 19.51 54.52 52.88 47.27 23.85
7. Ratio of priority sector advances to total advances 37.25 25.78 9.85 32.42 28.87 26.65 56.07 27.10
8. Ratio of term loans to total advances 18.62 16.53 8.49 0.19 76.19 77.22 2.75 37.89
9. Ratio of secured advances to total advances 42.64 35.17 48.68 55.98 38.30 39.32 2.16 16.20
10. Ratio of investments in non-approved securities to total investments
- 22.69 12.51 56.32 1.85 6.65 - -
11. Ratio of interest income to total assets 7.51 6.81 11.13 9.60 6.47 6.94 7.02 6.54
12. Ratio of net interest income to total assets (Net Interest Margin)
3.91 3.65 6.56 6.49 4.07 4.03 6.79 5.68
13. Ratio of non-interest income to total assets 0.65 2.22 1.79 1.33 1.16 1.56 3.31 1.91
14. Ratio of intermediation cost to total assets 3.19 3.11 4.49 5.06 2.33 2.25 12.83 9.79
15. Ratio of wage bills to intermediation cost 35.82 34.44 43.37 41.91 37.87 36.70 42.20 43.61
16. Ratio of wage bills to total expense 16.83 17.11 21.50 25.94 18.65 16.02 41.46 40.09
17. Ratio of wage bills to total income 14.01 11.88 15.08 19.37 11.58 9.74 52.40 50.55
18. Ratio of burden to total assets 2.54 0.89 2.70 3.72 1.17 0.70 9.52 7.88
19. Ratio of burden to interest income 33.84 13.14 24.27 38.76 18.13 10.07 135.56 120.56
20. Ratio of operating profits to total assets 1.37 2.76 3.86 2.77 2.89 3.33 -2.73 -2.20
21. Return on assets 0.73 1.70 -0.02 -3.26 1.64 2.12 -2.99 -2.56
22. Return on equity 3.95 8.56 -0.06 -7.87 12.42 16.30 -3.62 -3.66
23. Cost of deposits 6.56 5.77 4.57 5.42 3.21 3.85 3.51 6.01
24. Cost of borrowings 2.39 2.49 18.32 6.24 3.79 3.99 0.81 0.72
25. Cost of funds 5.24 4.69 8.63 5.61 3.00 3.37 1.28 2.56
26. Return on advances 8.48 7.51 12.49 11.61 9.68 9.78 7.74 6.50
27. Return on investments 9.59 8.36 9.06 5.32 8.32 8.25 10.80 7.69
28. Return on advances adjusted to cost of funds 3.24 2.82 3.87 6.00 6.68 6.40 6.46 3.94
29. Return on investments adjusted to cost of funds 4.35 3.67 0.43 -0.29 5.31 4.88 9.52 5.13
30. Business per employee (in Rupees Million) 351.90 390.50 128.90 117.80 197.50 212.40 37.35 74.19
31. Profit per employee (in Rupees Million) 2.40 5.60 -0.03 -3.10 3.60 5.02 -2.20 -2.13
32. Capital adequacy ratio 14.70 13.82 44.78 35.12 16.03 15.90 78.29 63.77
33. Capital adequacy ratio - Tier I 11.09 10.94 44.34 34.74 15.15 14.81 78.10 63.47
34. Capital adequacy ratio - Tier II 3.61 2.88 0.44 0.38 0.88 1.09 0.19 0.30
35. Ratio of net NPA to net advances 0.07 - 3.24 9.71 0.90 1.47 - -
Source : Annual accounts of Banks.Source
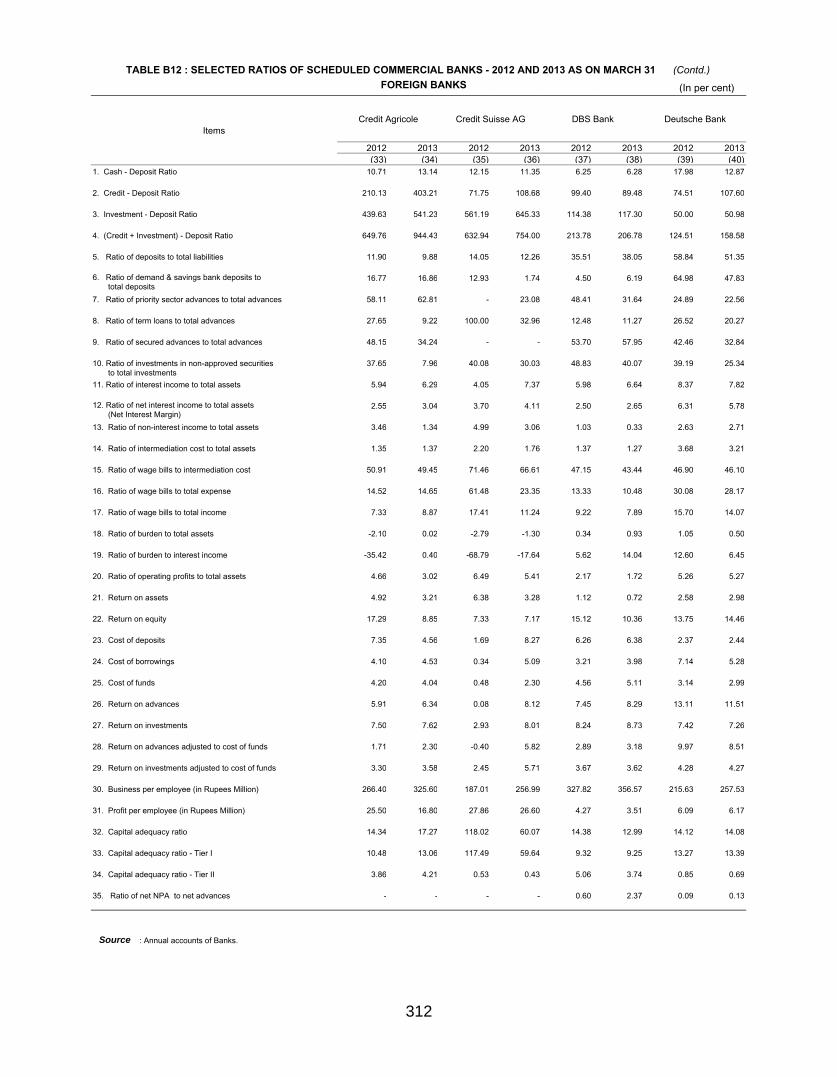
312
TABLE B12 : SELECTED RATIOS OF SCHEDULED COMMERCIAL BANKS - 2012 AND 2013 AS ON MARCH 31FOREIGN BANKS (In per cent)
(Contd.)
ItemsCredit Agricole Credit Suisse AG DBS Bank Deutsche Bank
2012 2013 2012 2013 2012 2013 2012 2013(33) (34) (35) (36) (37) (38) (39) (40)
1. Cash - Deposit Ratio 10.71 13.14 12.15 11.35 6.25 6.28 17.98 12.87
2. Credit - Deposit Ratio 210.13 403.21 71.75 108.68 99.40 89.48 74.51 107.60
3. Investment - Deposit Ratio 439.63 541.23 561.19 645.33 114.38 117.30 50.00 50.98
4. (Credit + Investment) - Deposit Ratio 649.76 944.43 632.94 754.00 213.78 206.78 124.51 158.58
5. Ratio of deposits to total liabilities 11.90 9.88 14.05 12.26 35.51 38.05 58.84 51.35
6. Ratio of demand & savings bank deposits to total deposits
16.77 16.86 12.93 1.74 4.50 6.19 64.98 47.83
7. Ratio of priority sector advances to total advances 58.11 62.81 - 23.08 48.41 31.64 24.89 22.56
8. Ratio of term loans to total advances 27.65 9.22 100.00 32.96 12.48 11.27 26.52 20.27
9. Ratio of secured advances to total advances 48.15 34.24 - - 53.70 57.95 42.46 32.84
10. Ratio of investments in non-approved securities to total investments
37.65 7.96 40.08 30.03 48.83 40.07 39.19 25.34
11. Ratio of interest income to total assets 5.94 6.29 4.05 7.37 5.98 6.64 8.37 7.82
12. Ratio of net interest income to total assets (Net Interest Margin)
2.55 3.04 3.70 4.11 2.50 2.65 6.31 5.78
13. Ratio of non-interest income to total assets 3.46 1.34 4.99 3.06 1.03 0.33 2.63 2.71
14. Ratio of intermediation cost to total assets 1.35 1.37 2.20 1.76 1.37 1.27 3.68 3.21
15. Ratio of wage bills to intermediation cost 50.91 49.45 71.46 66.61 47.15 43.44 46.90 46.10
16. Ratio of wage bills to total expense 14.52 14.65 61.48 23.35 13.33 10.48 30.08 28.17
17. Ratio of wage bills to total income 7.33 8.87 17.41 11.24 9.22 7.89 15.70 14.07
18. Ratio of burden to total assets -2.10 0.02 -2.79 -1.30 0.34 0.93 1.05 0.50
19. Ratio of burden to interest income -35.42 0.40 -68.79 -17.64 5.62 14.04 12.60 6.45
20. Ratio of operating profits to total assets 4.66 3.02 6.49 5.41 2.17 1.72 5.26 5.27
21. Return on assets 4.92 3.21 6.38 3.28 1.12 0.72 2.58 2.98
22. Return on equity 17.29 8.85 7.33 7.17 15.12 10.36 13.75 14.46
23. Cost of deposits 7.35 4.56 1.69 8.27 6.26 6.38 2.37 2.44
24. Cost of borrowings 4.10 4.53 0.34 5.09 3.21 3.98 7.14 5.28
25. Cost of funds 4.20 4.04 0.48 2.30 4.56 5.11 3.14 2.99
26. Return on advances 5.91 6.34 0.08 8.12 7.45 8.29 13.11 11.51
27. Return on investments 7.50 7.62 2.93 8.01 8.24 8.73 7.42 7.26
28. Return on advances adjusted to cost of funds 1.71 2.30 -0.40 5.82 2.89 3.18 9.97 8.51
29. Return on investments adjusted to cost of funds 3.30 3.58 2.45 5.71 3.67 3.62 4.28 4.27
30. Business per employee (in Rupees Million) 266.40 325.60 187.01 256.99 327.82 356.57 215.63 257.53
31. Profit per employee (in Rupees Million) 25.50 16.80 27.86 26.60 4.27 3.51 6.09 6.17
32. Capital adequacy ratio 14.34 17.27 118.02 60.07 14.38 12.99 14.12 14.08
33. Capital adequacy ratio - Tier I 10.48 13.06 117.49 59.64 9.32 9.25 13.27 13.39
34. Capital adequacy ratio - Tier II 3.86 4.21 0.53 0.43 5.06 3.74 0.85 0.69
35. Ratio of net NPA to net advances - - - - 0.60 2.37 0.09 0.13
Source : Annual accounts of Banks.Source

313
TABLE B12 : SELECTED RATIOS OF SCHEDULED COMMERCIAL BANKS - 2012 AND 2013 AS ON MARCH 31FOREIGN BANKS (In per cent)
(Contd.)
ItemsFirstRand Bank
Hongkong &Shanghai Banking
Corporation
HSBC Bank omanS.A.O.G.
Industrial andCommercial Bank of
China
2012 2013 2012 2013 2012 2013 2012 2013(41) (42) (43) (44) (45) (46) (47) (48)
1. Cash - Deposit Ratio 33.14 36.08 6.40 8.73 6.16 5.94 330.03 6.64
2. Credit - Deposit Ratio 660.06 363.58 57.82 62.79 2.65 3.44 37510.07 190.41
3. Investment - Deposit Ratio 1533.32 1100.09 65.65 79.45 49.80 26.94 - 58.60
4. (Credit + Investment) - Deposit Ratio 2193.37 1463.67 123.46 142.24 52.44 30.38 37510.07 249.00
5. Ratio of deposits to total liabilities 4.20 6.24 56.24 53.56 36.65 39.45 0.02 22.74
6. Ratio of demand & savings bank deposits to total deposits
19.03 23.50 46.75 47.55 44.90 43.60 100.00 27.01
7. Ratio of priority sector advances to total advances 58.88 36.06 30.25 27.72 - - - 4.36
8. Ratio of term loans to total advances 44.64 52.91 32.41 37.04 49.65 32.98 - -
9. Ratio of secured advances to total advances 34.79 21.69 58.01 60.46 100.00 100.00 100.00 99.69
10. Ratio of investments in non-approved securities to total investments
67.64 51.62 47.31 37.92 2.54 5.14 - -
11. Ratio of interest income to total assets 7.78 7.61 6.25 6.53 4.27 4.32 4.76 8.91
12. Ratio of net interest income to total assets (Net Interest Margin)
4.50 4.77 3.74 3.74 1.95 1.98 4.76 7.77
13. Ratio of non-interest income to total assets 2.76 2.90 2.20 1.60 5.61 7.88 0.58 0.56
14. Ratio of intermediation cost to total assets 7.62 10.95 2.41 2.29 1.92 2.39 1.94 3.61
15. Ratio of wage bills to intermediation cost 67.28 49.81 39.49 44.24 33.95 38.49 35.97 64.34
16. Ratio of wage bills to total expense 47.01 39.55 19.35 19.95 15.40 19.41 35.97 48.84
17. Ratio of wage bills to total income 48.62 51.92 11.28 12.45 6.60 7.53 13.09 24.56
18. Ratio of burden to total assets 4.86 8.05 0.22 0.69 -3.69 -5.49 1.37 3.06
19. Ratio of burden to interest income 62.44 105.85 3.47 10.53 -86.58 -127.02 28.69 34.31
20. Ratio of operating profits to total assets -0.36 -3.29 3.52 3.06 5.65 7.47 3.39 4.71
21. Return on assets -0.03 -6.09 1.97 1.81 6.09 8.80 2.05 2.45
22. Return on equity -0.06 -17.86 13.88 12.84 8.61 11.24 2.13 3.47
23. Cost of deposits 2.30 9.31 4.03 4.60 5.58 5.97 - 3.76
24. Cost of borrowings 6.93 4.12 2.44 1.97 1.23 1.74 - 7.56
25. Cost of funds 5.13 4.02 3.83 4.09 4.66 5.53 - 3.96
26. Return on advances 6.92 7.42 8.74 9.94 11.30 10.72 2.58 14.63
27. Return on investments 9.40 8.59 8.28 7.78 6.38 6.54 - 9.89
28. Return on advances adjusted to cost of funds 1.80 3.40 4.91 5.85 6.64 5.19 - 10.67
29. Return on investments adjusted to cost of funds 4.27 4.57 4.45 3.69 1.72 1.02 - 5.93
30. Business per employee (in Rupees Million) 35.80 37.30 165.89 188.99 46.37 48.11 26.71 205.73
31. Profit per employee (in Rupees Million) -0.03 -6.76 3.47 4.04 4.43 7.53 6.19 6.58
32. Capital adequacy ratio 61.47 47.84 16.04 17.10 52.01 55.76 241.01 69.43
33. Capital adequacy ratio - Tier I 61.22 47.50 14.83 15.70 37.23 44.49 240.92 69.24
34. Capital adequacy ratio - Tier II 0.25 0.34 1.21 1.40 14.78 11.27 0.09 0.19
35. Ratio of net NPA to net advances - - 0.62 0.33 - - - -
Source : Annual accounts of Banks.Source

314
TABLE B12 : SELECTED RATIOS OF SCHEDULED COMMERCIAL BANKS - 2012 AND 2013 AS ON MARCH 31FOREIGN BANKS (In per cent)
(Contd.)
Items
JPMorgan ChaseBank JSC VTB Bank Krung Thai Bank Mashreqbank
2012 2013 2012 2013 2012 2013 2012 2013(49) (50) (51) (52) (53) (54) (55) (56)
1. Cash - Deposit Ratio 9.91 8.92 14.24 13.16 4.84 4.53 1.25 6.95
2. Credit - Deposit Ratio 51.21 51.54 1050.88 890.31 6.53 8.72 66.93 45.83
3. Investment - Deposit Ratio 150.42 170.62 59.36 24.34 24.40 25.39 51.23 38.94
4. (Credit + Investment) - Deposit Ratio 201.63 222.17 1110.24 914.66 30.93 34.11 118.16 84.76
5. Ratio of deposits to total liabilities 42.67 40.92 6.23 7.59 73.50 77.14 40.45 48.44
6. Ratio of demand & savings bank deposits to total deposits
36.25 26.37 60.44 21.14 38.36 34.48 98.91 99.96
7. Ratio of priority sector advances to total advances 36.37 32.90 20.05 28.67 61.84 44.46 99.99 100.00
8. Ratio of term loans to total advances 83.68 66.04 62.00 70.13 - - 0.01 -
9. Ratio of secured advances to total advances 24.42 17.79 80.35 88.51 95.00 95.19 100.00 100.00
10. Ratio of investments in non-approved securities to total investments
65.45 49.29 - - 8.76 7.40 23.44 25.50
11. Ratio of interest income to total assets 6.68 6.71 9.98 10.67 7.06 7.66 2.91 4.47
12. Ratio of net interest income to total assets (Net Interest Margin)
4.20 3.49 9.82 10.44 4.45 4.08 2.85 4.42
13. Ratio of non-interest income to total assets 1.94 2.44 0.73 1.89 1.09 0.71 12.45 9.37
14. Ratio of intermediation cost to total assets 1.17 0.93 8.18 8.10 1.87 1.69 6.44 4.99
15. Ratio of wage bills to intermediation cost 61.43 59.36 44.07 46.39 23.64 25.97 30.61 25.11
16. Ratio of wage bills to total expense 19.68 13.27 43.23 45.10 9.87 8.33 30.34 24.88
17. Ratio of wage bills to total income 8.35 6.02 33.66 29.93 5.43 5.25 12.84 9.06
18. Ratio of burden to total assets -0.77 -1.51 7.45 6.21 0.78 0.98 -6.01 -4.37
19. Ratio of burden to interest income -11.53 -22.54 74.66 58.25 11.11 12.79 -206.71 -97.93
20. Ratio of operating profits to total assets 4.97 5.00 2.37 4.22 3.66 3.10 8.86 8.80
21. Return on assets 2.90 3.07 0.76 2.01 2.12 1.82 5.76 5.61
22. Return on equity 11.02 12.42 0.81 2.36 7.71 7.85 9.23 10.12
23. Cost of deposits 4.11 6.00 2.61 3.34 3.65 4.75 0.12 -
24. Cost of borrowings 2.68 2.41 - - 0.90 - - -
25. Cost of funds 3.32 4.36 2.61 3.34 3.60 4.75 0.15 0.10
26. Return on advances 7.04 6.57 13.70 13.72 9.41 8.90 2.45 4.22
27. Return on investments 7.71 7.73 4.88 4.93 6.92 7.42 7.17 7.03
28. Return on advances adjusted to cost of funds 3.72 2.21 11.09 10.39 5.81 4.15 2.31 4.12
29. Return on investments adjusted to cost of funds 4.39 3.37 2.27 1.59 3.32 2.68 7.02 6.93
30. Business per employee (in Rupees Million) 472.94 632.68 47.94 51.81 138.46 181.15 55.76 67.83
31. Profit per employee (in Rupees Million) 19.38 27.68 0.50 1.38 3.30 3.46 6.88 9.70
32. Capital adequacy ratio 23.96 26.89 86.96 66.45 62.57 54.57 55.37 49.62
33. Capital adequacy ratio - Tier I 23.41 26.32 86.52 65.97 61.32 53.32 54.81 49.20
34. Capital adequacy ratio - Tier II 0.55 0.57 0.44 0.48 1.25 1.25 0.56 0.42
35. Ratio of net NPA to net advances - - - - - - - -
Source : Annual accounts of Banks.Source

315
TABLE B12 : SELECTED RATIOS OF SCHEDULED COMMERCIAL BANKS - 2012 AND 2013 AS ON MARCH 31FOREIGN BANKS (In per cent)
(Contd.)
Items
Mizuho CorporateBank
National AustraliaBank
RabobankInternational
Royal Bank ofScotland
2012 2013 2012 2013 2012 2013 2012 2013(57) (58) (59) (60) (61) (62) (63) (64)
1. Cash - Deposit Ratio 34.96 12.73 - - 28.77 27.75 9.43 7.10
2. Credit - Deposit Ratio 532.33 316.56 - - 3005.28 707.38 96.13 98.31
3. Investment - Deposit Ratio 97.88 79.36 - - 1184.27 148.98 59.22 71.56
4. (Credit + Investment) - Deposit Ratio 630.22 395.92 - - 4189.55 856.35 155.34 169.87
5. Ratio of deposits to total liabilities 12.53 22.87 - - 1.82 9.79 46.58 48.37
6. Ratio of demand & savings bank deposits to total deposits
74.01 37.39 - - 39.08 18.75 55.62 49.66
7. Ratio of priority sector advances to total advances 31.38 25.36 - - 15.73 37.27 40.56 45.93
8. Ratio of term loans to total advances 17.93 30.01 - - 37.01 10.97 43.23 24.46
9. Ratio of secured advances to total advances 20.63 19.42 - - 47.90 49.78 68.84 56.86
10. Ratio of investments in non-approved securities to total investments
38.44 13.54 - - - - 22.83 28.91
11. Ratio of interest income to total assets 6.18 6.54 1.98 5.19 3.93 9.63 7.16 6.96
12. Ratio of net interest income to total assets (Net Interest Margin)
5.83 5.61 1.98 5.18 3.92 8.36 3.70 3.52
13. Ratio of non-interest income to total assets 2.31 1.48 - 0.57 3.49 2.79 3.27 2.01
14. Ratio of intermediation cost to total assets 1.42 1.19 3.50 9.14 5.47 7.73 3.61 3.78
15. Ratio of wage bills to intermediation cost 46.48 48.60 74.15 62.46 45.51 52.66 36.43 33.71
16. Ratio of wage bills to total expense 37.32 27.34 74.15 62.41 45.42 45.22 18.60 17.67
17. Ratio of wage bills to total income 7.79 7.24 131.07 99.12 33.51 32.79 12.62 14.21
18. Ratio of burden to total assets -0.89 -0.28 3.50 8.57 1.97 4.94 0.34 1.77
19. Ratio of burden to interest income -14.33 -4.32 176.76 165.13 50.22 51.32 4.76 25.41
20. Ratio of operating profits to total assets 6.72 5.89 -1.52 -3.39 1.95 3.42 3.36 1.76
21. Return on assets 4.00 3.90 -1.54 -5.41 0.40 1.42 1.96 0.96
22. Return on equity 5.32 4.94 -1.54 -5.76 0.27 2.01 17.75 7.71
23. Cost of deposits 2.15 4.19 - - 0.59 13.12 4.85 5.31
24. Cost of borrowings 0.30 0.56 - 0.02 0.18 5.63 4.11 3.76
25. Cost of funds 1.26 2.06 - 0.01 0.59 6.65 4.65 4.79
26. Return on advances 6.89 6.82 - 0.05 1.81 10.43 8.47 8.32
27. Return on investments 11.62 9.84 - 8.77 11.30 14.63 8.94 9.09
28. Return on advances adjusted to cost of funds 5.63 4.76 - 0.04 1.22 3.78 3.82 3.53
29. Return on investments adjusted to cost of funds 10.36 7.78 - 8.75 10.71 7.98 4.29 4.30
30. Business per employee (in Rupees Million) 248.80 419.78 - 86.10 84.41 132.01 130.73 162.11
31. Profit per employee (in Rupees Million) 10.36 9.99 -1.57 -4.64 0.38 2.39 2.46 1.43
32. Capital adequacy ratio 60.27 48.11 423.74 96.08 123.86 70.34 12.46 14.50
33. Capital adequacy ratio - Tier I 59.94 47.68 423.74 95.57 123.47 69.97 9.38 10.99
34. Capital adequacy ratio - Tier II 0.33 0.43 - 0.51 0.39 0.37 3.08 3.51
35. Ratio of net NPA to net advances - 1.59 - - - - 0.74 0.29
Source : Annual accounts of Banks.Source
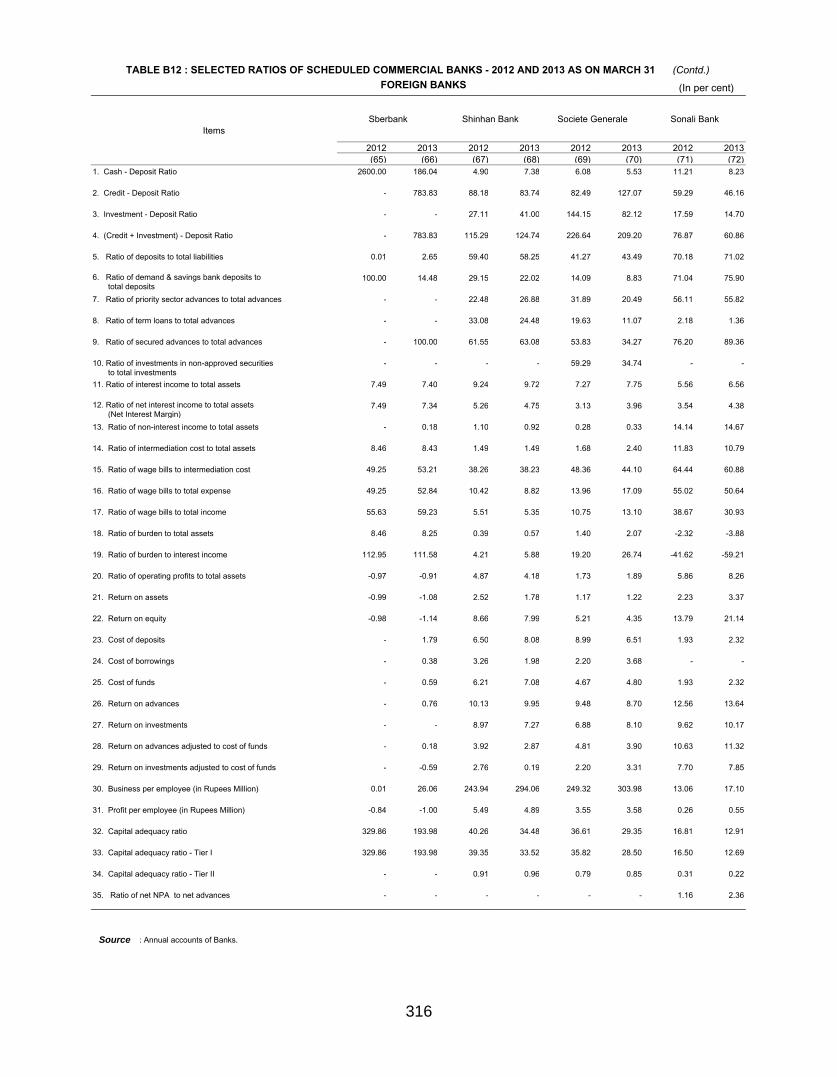
316
TABLE B12 : SELECTED RATIOS OF SCHEDULED COMMERCIAL BANKS - 2012 AND 2013 AS ON MARCH 31FOREIGN BANKS (In per cent)
(Contd.)
ItemsSberbank Shinhan Bank Societe Generale Sonali Bank
2012 2013 2012 2013 2012 2013 2012 2013(65) (66) (67) (68) (69) (70) (71) (72)
1. Cash - Deposit Ratio 2600.00 186.04 4.90 7.38 6.08 5.53 11.21 8.23
2. Credit - Deposit Ratio - 783.83 88.18 83.74 82.49 127.07 59.29 46.16
3. Investment - Deposit Ratio - - 27.11 41.00 144.15 82.12 17.59 14.70
4. (Credit + Investment) - Deposit Ratio - 783.83 115.29 124.74 226.64 209.20 76.87 60.86
5. Ratio of deposits to total liabilities 0.01 2.65 59.40 58.25 41.27 43.49 70.18 71.02
6. Ratio of demand & savings bank deposits to total deposits
100.00 14.48 29.15 22.02 14.09 8.83 71.04 75.90
7. Ratio of priority sector advances to total advances - - 22.48 26.88 31.89 20.49 56.11 55.82
8. Ratio of term loans to total advances - - 33.08 24.48 19.63 11.07 2.18 1.36
9. Ratio of secured advances to total advances - 100.00 61.55 63.08 53.83 34.27 76.20 89.36
10. Ratio of investments in non-approved securities to total investments
- - - - 59.29 34.74 - -
11. Ratio of interest income to total assets 7.49 7.40 9.24 9.72 7.27 7.75 5.56 6.56
12. Ratio of net interest income to total assets (Net Interest Margin)
7.49 7.34 5.26 4.75 3.13 3.96 3.54 4.38
13. Ratio of non-interest income to total assets - 0.18 1.10 0.92 0.28 0.33 14.14 14.67
14. Ratio of intermediation cost to total assets 8.46 8.43 1.49 1.49 1.68 2.40 11.83 10.79
15. Ratio of wage bills to intermediation cost 49.25 53.21 38.26 38.23 48.36 44.10 64.44 60.88
16. Ratio of wage bills to total expense 49.25 52.84 10.42 8.82 13.96 17.09 55.02 50.64
17. Ratio of wage bills to total income 55.63 59.23 5.51 5.35 10.75 13.10 38.67 30.93
18. Ratio of burden to total assets 8.46 8.25 0.39 0.57 1.40 2.07 -2.32 -3.88
19. Ratio of burden to interest income 112.95 111.58 4.21 5.88 19.20 26.74 -41.62 -59.21
20. Ratio of operating profits to total assets -0.97 -0.91 4.87 4.18 1.73 1.89 5.86 8.26
21. Return on assets -0.99 -1.08 2.52 1.78 1.17 1.22 2.23 3.37
22. Return on equity -0.98 -1.14 8.66 7.99 5.21 4.35 13.79 21.14
23. Cost of deposits - 1.79 6.50 8.08 8.99 6.51 1.93 2.32
24. Cost of borrowings - 0.38 3.26 1.98 2.20 3.68 - -
25. Cost of funds - 0.59 6.21 7.08 4.67 4.80 1.93 2.32
26. Return on advances - 0.76 10.13 9.95 9.48 8.70 12.56 13.64
27. Return on investments - - 8.97 7.27 6.88 8.10 9.62 10.17
28. Return on advances adjusted to cost of funds - 0.18 3.92 2.87 4.81 3.90 10.63 11.32
29. Return on investments adjusted to cost of funds - -0.59 2.76 0.19 2.20 3.31 7.70 7.85
30. Business per employee (in Rupees Million) 0.01 26.06 243.94 294.06 249.32 303.98 13.06 17.10
31. Profit per employee (in Rupees Million) -0.84 -1.00 5.49 4.89 3.55 3.58 0.26 0.55
32. Capital adequacy ratio 329.86 193.98 40.26 34.48 36.61 29.35 16.81 12.91
33. Capital adequacy ratio - Tier I 329.86 193.98 39.35 33.52 35.82 28.50 16.50 12.69
34. Capital adequacy ratio - Tier II - - 0.91 0.96 0.79 0.85 0.31 0.22
35. Ratio of net NPA to net advances - - - - - - 1.16 2.36
Source : Annual accounts of Banks.Source

317
TABLE B12 : SELECTED RATIOS OF SCHEDULED COMMERCIAL BANKS - 2012 AND 2013 AS ON MARCH 31FOREIGN BANKS (In per cent)
(Contd.)
Items
Standard CharteredBank
State Bank ofMauritius
SumitomoMitsuiBanking
Corporation UBS AG
UnitedOverseas Bank
2012 2013 2012 20132013
2012 2013 2012(73) (74) (75) (76) (77) (78) (79) (80)
1. Cash - Deposit Ratio 5.21 5.06 5.27 4.74 964.85 7.54 5.78 88420.00
2. Credit - Deposit Ratio 86.88 99.92 106.00 135.64 - 104.83 38.09 -
3. Investment - Deposit Ratio 42.72 49.59 62.92 76.59 19623.01 591.97 84.74 -
4. (Credit + Investment) - Deposit Ratio 129.59 149.51 168.91 212.22 19623.01 696.79 122.83 -
5. Ratio of deposits to total liabilities 52.57 51.77 54.20 40.81 0.14 8.84 37.48 -
6. Ratio of demand & savings bank deposits to total deposits
40.14 38.22 33.44 18.70 86.85 1.73 0.89 100.00
7. Ratio of priority sector advances to total advances 26.39 28.64 - - - 24.67 26.44 -
8. Ratio of term loans to total advances 37.59 43.01 41.31 44.87 - - 49.27 -
9. Ratio of secured advances to total advances 62.62 64.82 - - - 31.68 5.13 -
10. Ratio of investments in non-approved securities to total investments
18.64 18.36 15.78 36.57 - 56.86 50.95 -
11. Ratio of interest income to total assets 6.97 7.53 9.71 10.12 0.94 5.89 6.27 7.00
12. Ratio of net interest income to total assets (Net Interest Margin)
3.73 4.15 3.06 4.66 0.94 3.89 4.42 7.00
13. Ratio of non-interest income to total assets 2.62 2.33 0.98 1.40 - -1.26 -0.74 0.19
14. Ratio of intermediation cost to total assets 2.40 2.41 1.31 1.14 2.35 1.65 1.42 5.76
15. Ratio of wage bills to intermediation cost 48.84 44.42 49.70 48.54 37.12 57.90 56.48 36.47
16. Ratio of wage bills to total expense 20.81 18.50 8.19 8.37 37.12 26.22 24.54 36.47
17. Ratio of wage bills to total income 12.25 10.85 6.11 4.79 93.16 20.63 14.53 29.22
18. Ratio of burden to total assets -0.22 0.08 0.33 -0.26 2.35 2.91 2.16 5.57
19. Ratio of burden to interest income -3.11 1.07 3.43 -2.60 251.04 49.36 34.50 79.56
20. Ratio of operating profits to total assets 3.95 4.07 2.72 4.93 -1.41 0.99 2.26 1.43
21. Return on assets 1.49 2.43 0.81 2.53 -5.06 0.78 1.33 1.21
22. Return on equity 12.76 17.78 3.45 7.07 -1.51 1.59 4.29 1.18
23. Cost of deposits 4.93 5.12 9.71 6.11 0.03 8.48 3.89 -
24. Cost of borrowings 5.74 5.50 7.91 13.90 - 3.82 6.40 -
25. Cost of funds 4.40 4.40 7.93 5.76 0.03 4.98 4.87 -
26. Return on advances 11.29 11.38 10.32 9.27 - 11.20 11.93 -
27. Return on investments 7.89 8.07 8.48 7.68 0.22 7.75 9.19 -
28. Return on advances adjusted to cost of funds 6.89 6.99 2.39 3.51 - 6.23 7.06 -
29. Return on investments adjusted to cost of funds 3.49 3.67 0.55 1.91 0.19 2.77 4.32 -
30. Business per employee (in Rupees Million) 154.67 168.77 335.80 289.00 0.23 216.39 608.91 0.00
31. Profit per employee (in Rupees Million) 2.31 4.11 2.40 6.80 -2.51 5.48 14.96 1.81
32. Capital adequacy ratio 11.05 13.00 39.02 55.01 625.69 53.75 52.86 205.80
33. Capital adequacy ratio - Tier I 8.19 10.45 37.52 53.71 625.69 53.61 52.53 205.80
34. Capital adequacy ratio - Tier II 2.86 2.55 1.50 1.30 - 0.14 0.33 -
35. Ratio of net NPA to net advances 0.70 1.63 0.87 1.88 - - - -
Source : Annual accounts of Banks.Source

318
TABLE B12 : SELECTED RATIOS OF SCHEDULED COMMERCIAL BANKS - 2012 AND 2013 AS ON MARCH 31FOREIGN BANKS (In per cent)
(Concld.)
Items
UnitedOverseas Bank
WestpacBankingCorporati
on
Woori Bank
2013 2013 2012 2013(81) (82) (83) (84)
1. Cash - Deposit Ratio 34.59 1476.04 - 4.31
2. Credit - Deposit Ratio 579.91 - - 15.26
3. Investment - Deposit Ratio 239.84 2058082.03
- 22.77
4. (Credit + Investment) - Deposit Ratio 819.75 2058082.03
- 38.03
5. Ratio of deposits to total liabilities 2.98 - - 56.26
6. Ratio of demand & savings bank deposits to total deposits
18.97 100.00 - 9.86
7. Ratio of priority sector advances to total advances 58.70 - - -
8. Ratio of term loans to total advances 41.30 - - -
9. Ratio of secured advances to total advances 100.00 - - 62.36
10. Ratio of investments in non-approved securities to total investments
0.10 - - -
11. Ratio of interest income to total assets 7.61 3.34 2.56 7.54
12. Ratio of net interest income to total assets (Net Interest Margin)
7.58 3.33 2.56 5.47
13. Ratio of non-interest income to total assets 0.40 0.61 - 0.36
14. Ratio of intermediation cost to total assets 6.49 1.86 1.61 4.31
15. Ratio of wage bills to intermediation cost 49.00 54.29 26.13 33.00
16. Ratio of wage bills to total expense 48.76 54.26 26.13 22.31
17. Ratio of wage bills to total income 39.73 25.63 16.48 18.03
18. Ratio of burden to total assets 6.10 1.25 1.61 3.95
19. Ratio of burden to interest income 80.10 37.48 63.05 52.48
20. Ratio of operating profits to total assets 1.48 2.08 0.95 1.51
21. Return on assets 1.21 1.03 - 0.90
22. Return on equity 1.32 1.03 0.53 1.38
23. Cost of deposits 0.68 1.84 - 5.23
24. Cost of borrowings 0.21 4.02 - -
25. Cost of funds 0.28 3.83 - 5.23
26. Return on advances 3.94 - - 17.45
27. Return on investments 6.03 3.38 - 10.04
28. Return on advances adjusted to cost of funds 3.66 - - 12.22
29. Return on investments adjusted to cost of funds 5.75 -0.45 - 4.81
30. Business per employee (in Rupees Million) 32.27 0.01 - 113.07
31. Profit per employee (in Rupees Million) 1.54 3.52 - 1.02
32. Capital adequacy ratio 154.76 280.06 421.70 163.28
33. Capital adequacy ratio - Tier I 154.60 280.02 421.70 163.28
34. Capital adequacy ratio - Tier II 0.16 0.04 - -
35. Ratio of net NPA to net advances - - - -
Source : Annual accounts of Banks.
Bank
TABLE B12 : SELECTED RATIOS OF SCHEDULED COMMERCIAL BANKS - 2012 AND 2013 AS ON MARCH 31FOREIGN BANKS (In per cent)
(Concld.)
Items
UnitedOverseas Bank
WestpacBankingCorporati
on
Woori Bank
2013 2013 2012 2013(81) (82) (83) (84)
1. Cash - Deposit Ratio 34.59 1476.04 - 4.31
2. Credit - Deposit Ratio 579.91 - - 15.26
3. Investment - Deposit Ratio 239.84 2058082.03
- 22.77
4. (Credit + Investment) - Deposit Ratio 819.75 2058082.03
- 38.03
5. Ratio of deposits to total liabilities 2.98 - - 56.26
6. Ratio of demand & savings bank deposits to total deposits
18.97 100.00 - 9.86
7. Ratio of priority sector advances to total advances 58.70 - - -
8. Ratio of term loans to total advances 41.30 - - -
9. Ratio of secured advances to total advances 100.00 - - 62.36
10. Ratio of investments in non-approved securities to total investments
0.10 - - -
11. Ratio of interest income to total assets 7.61 3.34 2.56 7.54
12. Ratio of net interest income to total assets (Net Interest Margin)
7.58 3.33 2.56 5.47
13. Ratio of non-interest income to total assets 0.40 0.61 - 0.36
14. Ratio of intermediation cost to total assets 6.49 1.86 1.61 4.31
15. Ratio of wage bills to intermediation cost 49.00 54.29 26.13 33.00
16. Ratio of wage bills to total expense 48.76 54.26 26.13 22.31
17. Ratio of wage bills to total income 39.73 25.63 16.48 18.03
18. Ratio of burden to total assets 6.10 1.25 1.61 3.95
19. Ratio of burden to interest income 80.10 37.48 63.05 52.48
20. Ratio of operating profits to total assets 1.48 2.08 0.95 1.51
21. Return on assets 1.21 1.03 - 0.90
22. Return on equity 1.32 1.03 0.53 1.38
23. Cost of deposits 0.68 1.84 - 5.23
24. Cost of borrowings 0.21 4.02 - -
25. Cost of funds 0.28 3.83 - 5.23
26. Return on advances 3.94 - - 17.45
27. Return on investments 6.03 3.38 - 10.04
28. Return on advances adjusted to cost of funds 3.66 - - 12.22
29. Return on investments adjusted to cost of funds 5.75 -0.45 - 4.81
30. Business per employee (in Rupees Million) 32.27 0.01 - 113.07
31. Profit per employee (in Rupees Million) 1.54 3.52 - 1.02
32. Capital adequacy ratio 154.76 280.06 421.70 163.28
33. Capital adequacy ratio - Tier I 154.60 280.02 421.70 163.28
34. Capital adequacy ratio - Tier II 0.16 0.04 - -
35. Ratio of net NPA to net advances - - - -
Source : Annual accounts of Banks.
TABLE B12 : SELECTED RATIOS OF SCHEDULED COMMERCIAL BANKS - 2012 AND 2013 AS ON MARCH 31FOREIGN BANKS (In per cent)
(Concld.)
Items
UnitedOverseas Bank
WestpacBankingCorporati
on
Woori Bank
2013 2013 2012 2013(81) (82) (83) (84)
1. Cash - Deposit Ratio 34.59 1476.04 - 4.31
2. Credit - Deposit Ratio 579.91 - - 15.26
3. Investment - Deposit Ratio 239.84 2058082.03
- 22.77
4. (Credit + Investment) - Deposit Ratio 819.75 2058082.03
- 38.03
5. Ratio of deposits to total liabilities 2.98 - - 56.26
6. Ratio of demand & savings bank deposits to total deposits
18.97 100.00 - 9.86
7. Ratio of priority sector advances to total advances 58.70 - - -
8. Ratio of term loans to total advances 41.30 - - -
9. Ratio of secured advances to total advances 100.00 - - 62.36
10. Ratio of investments in non-approved securities to total investments
0.10 - - -
11. Ratio of interest income to total assets 7.61 3.34 2.56 7.54
12. Ratio of net interest income to total assets (Net Interest Margin)
7.58 3.33 2.56 5.47
13. Ratio of non-interest income to total assets 0.40 0.61 - 0.36
14. Ratio of intermediation cost to total assets 6.49 1.86 1.61 4.31
15. Ratio of wage bills to intermediation cost 49.00 54.29 26.13 33.00
16. Ratio of wage bills to total expense 48.76 54.26 26.13 22.31
17. Ratio of wage bills to total income 39.73 25.63 16.48 18.03
18. Ratio of burden to total assets 6.10 1.25 1.61 3.95
19. Ratio of burden to interest income 80.10 37.48 63.05 52.48
20. Ratio of operating profits to total assets 1.48 2.08 0.95 1.51
21. Return on assets 1.21 1.03 - 0.90
22. Return on equity 1.32 1.03 0.53 1.38
23. Cost of deposits 0.68 1.84 - 5.23
24. Cost of borrowings 0.21 4.02 - -
25. Cost of funds 0.28 3.83 - 5.23
26. Return on advances 3.94 - - 17.45
27. Return on investments 6.03 3.38 - 10.04
28. Return on advances adjusted to cost of funds 3.66 - - 12.22
29. Return on investments adjusted to cost of funds 5.75 -0.45 - 4.81
30. Business per employee (in Rupees Million) 32.27 0.01 - 113.07
31. Profit per employee (in Rupees Million) 1.54 3.52 - 1.02
32. Capital adequacy ratio 154.76 280.06 421.70 163.28
33. Capital adequacy ratio - Tier I 154.60 280.02 421.70 163.28
34. Capital adequacy ratio - Tier II 0.16 0.04 - -
35. Ratio of net NPA to net advances - - - -
Source : Annual accounts of Banks.Source

319
TABLE B13 : BANK-WISE, BANK GROUP-WISE AND POPULATION GROUP-WISE NUMBER OF BRANCHES OF SCHEDULED COMMERCIAL BANK - 2012 AND 2013
Number of branches as on March 31, 2012
Banks / Bank Groups Rural Semi-urban Urban Metropolitan GrandTotal
(1) (2) (3) (4) (5)SBI and its AssociatesState Bank Of Bikaner And Jaipur 333 272 169 182 956State Bank Of Hyderabad 392 458 314 298 1462State Bank Of India 5343 4001 2492 2258 14094State Bank Of Mysore 220 159 157 203 739State Bank Of Patiala 351 284 264 163 1062State Bank Of Travancore 58 537 199 87 881Total 6697 5711 3595 3191 19194Nationalised BanksAllahabad Bank 1016 493 511 460 2480Andhra Bank 433 440 456 381 1710Bank Of Baroda 1265 1038 716 872 3891Bank Of India 1483 1054 679 732 3948Bank Of Maharashtra 547 300 312 402 1561Canara Bank 999 1007 796 811 3613Central Bank Of India 1462 1047 779 729 4017Corporation Bank 304 405 381 371 1461Dena Bank 397 271 265 313 1246IDBI Bank Ltd. 90 238 360 275 963Indian Bank 504 542 511 372 1929Indian Overseas Bank 719 727 618 573 2637Oriental Bank Of Commerce 364 449 522 445 1780Punjab And Sind Bank 324 169 252 267 1012Punjab National Bank 2171 1284 1034 850 5339Syndicate Bank 856 688 624 555 2723UCO Bank 843 549 504 475 2371Union Bank Of India 954 875 741 672 3242United Bank Of India 644 295 368 309 1616Vijaya Bank 276 299 383 325 1283Total 15651 12170 10812 10189 48822New Private Sector BanksAxis Bank 134 521 484 476 1615Development Credit Bank 5 16 11 54 86HDFC Bank 184 917 665 773 2539ICICI Bank 284 903 725 835 2747IndusInd Bank 36 95 140 132 403Kotak Mahindra Bank 32 68 85 171 356Yes Bank 31 133 87 106 357Total 706 2653 2197 2547 8103Old Private Sector BanksCatholic Syrian Bank Ltd 18 203 98 50 369City Union Bank Limited 42 99 100 61 302Federal Bank Ltd 63 527 197 161 948Ing Vysya Bank Ltd 81 96 167 185 529Jammu & Kashmir Bank Ltd 297 107 139 64 607Karnataka Bank Ltd 94 113 148 153 508Karur Vysya Bank Ltd 41 159 145 106 451Lakshmi Vilas Bank Ltd 42 103 88 57 290Nainital Bank Ltd 24 30 26 22 102
Note : 1. Data2. Population group classification based on 2001 census.3. Data on branches exclude administrative offices.
S ource: Master Office File system, Department of Statistics & Information Management, RBI, updated as on October 5, 2013.
are as per information reported by banks.
Source

320
TABLE B13 : BANK-WISE, BANK GROUP-WISE AND POPULATION GROUP-WISE NUMBER OF BRANCHES OF SCHEDULED COMMERCIAL BANK - 2012 AND 2013
Number of branches as on March 31, 2012
(C ontd.)
Banks / Bank Groups Rural Semi-urban Urban Metropolitan GrandTotal
(1) (2) (3) (4) (5)Ratnakar Bank Ltd 25 30 20 26 101South Indian Bank Ltd 83 329 162 116 690Tamilnad Mercantile Bank Ltd 62 123 59 34 278The Dhanalaxmi Bank Ltd 24 106 82 61 273Total 896 2025 1431 1096 5448Foreign BanksAb Bank Limited - - - 1 1Abu Dhabi Commercial Bank Ltd - - - 2 2American Express Banking Corp. - - - 1 1Antwerp Diamond Bank Nv - - - 1 1Australia And New Zealand Banking Group Limited - - - 1 1Bank Internasional Indonesia - - - 1 1Bank Of America N.T. And S.A. - - - 5 5Bank Of Bahrain & Kuwait B.S.C. - - - 2 2Bank Of Ceylon - - - 1 1Bank Of Nova Scotia - - 1 4 5Barclays Bank Plc - 1 4 4 9BNP Paribas - - - 9 9Chinatrust Commercial Bank - - - 1 1Citibank N.A - 2 12 29 43Commonwealth Bank Of Australia - - - 1 1Credit Agricole - - - 6 6Credit Suisse Ag - - - 1 1DBS Bank Ltd. 3 3 - 6 12Deutsche Bank Ag 1 - 6 8 15FirstRand Bank Ltd - - - 1 1Hongkong And Shanghai Banking Corpn.Ltd. 1 1 10 38 50HSBC Bank Oman S.A.O.G. - - 1 1 2Industrial And Commercial Bank Of China - - - 1 1JPMorgan Chase Bank National Association - - - 1 1JSC VTB Bank - - - 1 1Krung Thai Bank - - - 1 1Mashreqbank - - - 1 1Mizuho Corporate Bank - - - 2 2National Australia Bank - - - 1 1Rabobank International - - - 1 1Sberbank - - - 1 1Shinhan Bank - 1 - 2 3Societe Generale - - - 2 2Sonali Bank - - 1 1 2Standard Chartered Bank - - 16 78 94State Bank Of Mauritius Ltd - - - 3 3The Bank Of Tokyo-Mitsubishi Ufj Ltd - - - 3 3The Royal Bank Of Scotland N.V. 2 - 10 19 31UBS Ag - - - 1 1United Overseas Bank Ltd - - - 1 1Woori Bank - - - 1 1Total 7 8 61 245 321Regional Rural Banks
Note : 1. Data as per information reported by banks.2. Population group classification based on 2001 census.3. Data on branches exclude administrative offices.
S ource: Master Office File system,Department of Statistics & Information Management, RBI, updated as on October 5, 2013.
are
Source
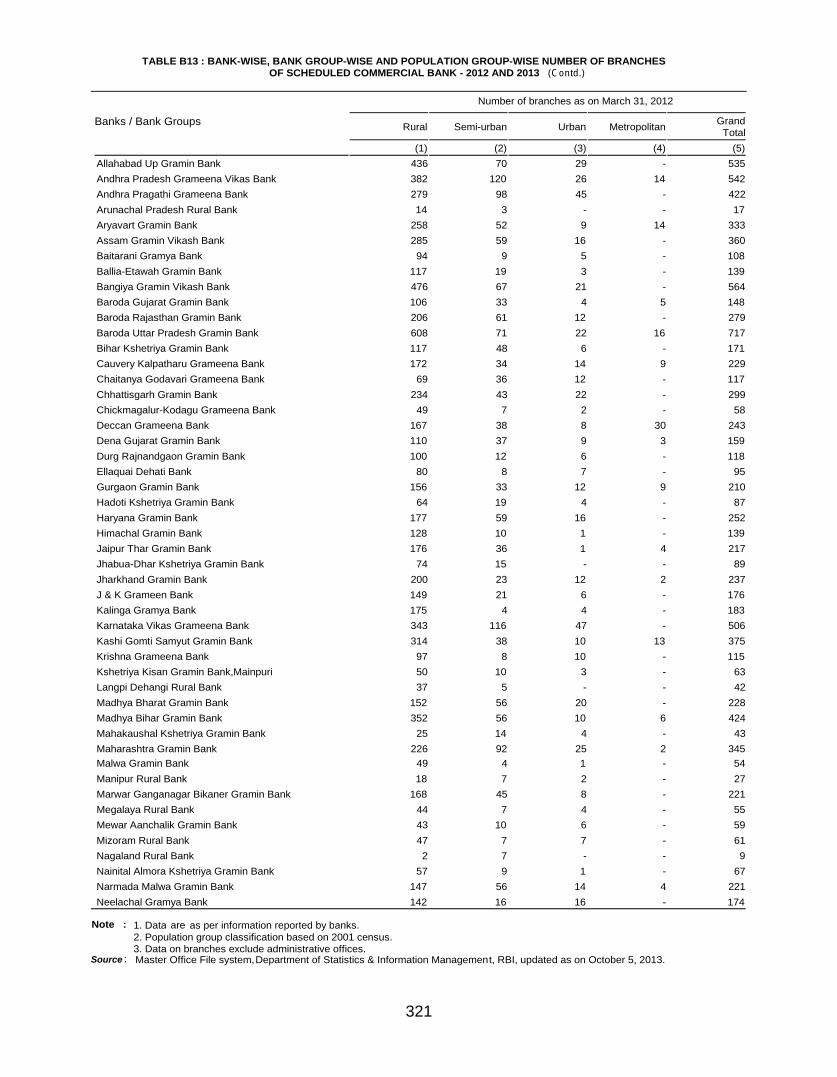
321
TABLE B13 : BANK-WISE, BANK GROUP-WISE AND POPULATION GROUP-WISE NUMBER OF BRANCHES OF SCHEDULED COMMERCIAL BANK - 2012 AND 2013
Number of branches as on March 31, 2012
(C ontd.)
Banks / Bank Groups Rural Semi-urban Urban Metropolitan GrandTotal
(1) (2) (3) (4) (5)Allahabad Up Gramin Bank 436 70 29 - 535Andhra Pradesh Grameena Vikas Bank 382 120 26 14 542Andhra Pragathi Grameena Bank 279 98 45 - 422Arunachal Pradesh Rural Bank 14 3 - - 17Aryavart Gramin Bank 258 52 9 14 333Assam Gramin Vikash Bank 285 59 16 - 360Baitarani Gramya Bank 94 9 5 - 108Ballia-Etawah Gramin Bank 117 19 3 - 139Bangiya Gramin Vikash Bank 476 67 21 - 564Baroda Gujarat Gramin Bank 106 33 4 5 148Baroda Rajasthan Gramin Bank 206 61 12 - 279Baroda Uttar Pradesh Gramin Bank 608 71 22 16 717Bihar Kshetriya Gramin Bank 117 48 6 - 171Cauvery Kalpatharu Grameena Bank 172 34 14 9 229Chaitanya Godavari Grameena Bank 69 36 12 - 117Chhattisgarh Gramin Bank 234 43 22 - 299Chickmagalur-Kodagu Grameena Bank 49 7 2 - 58Deccan Grameena Bank 167 38 8 30 243Dena Gujarat Gramin Bank 110 37 9 3 159Durg Rajnandgaon Gramin Bank 100 12 6 - 118Ellaquai Dehati Bank 80 8 7 - 95Gurgaon Gramin Bank 156 33 12 9 210Hadoti Kshetriya Gramin Bank 64 19 4 - 87Haryana Gramin Bank 177 59 16 - 252Himachal Gramin Bank 128 10 1 - 139Jaipur Thar Gramin Bank 176 36 1 4 217Jhabua-Dhar Kshetriya Gramin Bank 74 15 - - 89Jharkhand Gramin Bank 200 23 12 2 237J & K Grameen Bank 149 21 6 - 176Kalinga Gramya Bank 175 4 4 - 183Karnataka Vikas Grameena Bank 343 116 47 - 506Kashi Gomti Samyut Gramin Bank 314 38 10 13 375Krishna Grameena Bank 97 8 10 - 115Kshetriya Kisan Gramin Bank,Mainpuri 50 10 3 - 63Langpi Dehangi Rural Bank 37 5 - - 42Madhya Bharat Gramin Bank 152 56 20 - 228Madhya Bihar Gramin Bank 352 56 10 6 424Mahakaushal Kshetriya Gramin Bank 25 14 4 - 43Maharashtra Gramin Bank 226 92 25 2 345Malwa Gramin Bank 49 4 1 - 54Manipur Rural Bank 18 7 2 - 27Marwar Ganganagar Bikaner Gramin Bank 168 45 8 - 221Megalaya Rural Bank 44 7 4 - 55Mewar Aanchalik Gramin Bank 43 10 6 - 59Mizoram Rural Bank 47 7 7 - 61Nagaland Rural Bank 2 7 - - 9Nainital Almora Kshetriya Gramin Bank 57 9 1 - 67Narmada Malwa Gramin Bank 147 56 14 4 221Neelachal Gramya Bank 142 16 16 - 174
Note : 1. Data as per information reported by banks.2. Population group classification based on 2001 census.3. Data on branches exclude administrative offices.
S ource: Master Office File system,Department of Statistics & Information Management, RBI, updated as on October 5, 2013.
are
Source

322
TABLE B13 : BANK-WISE, BANK GROUP-WISE AND POPULATION GROUP-WISE NUMBER OF BRANCHES OF SCHEDULED COMMERCIAL BANK - 2012 AND 2013
Number of branches as on March 31, 2012
(C ontd.)
Banks / Bank Groups Rural Semi-urban Urban Metropolitan GrandTotal
(1) (2) (3) (4) (5)North Malabar Gramin Bank 32 163 12 - 207Pallavan Grama Bank 65 57 8 - 130Pandyan Grama Bank 119 78 16 - 213Parvatiya Gramin Bank 34 1 - - 35Paschim Banga Gramin Bank 195 16 3 2 216Pragathi Gramin Bank 317 56 31 - 404Prathama Bank 195 32 15 - 242Puduvai Bharathiar Grama Bank 13 6 9 - 28Punjab Gramin Bank 146 34 14 2 196Purvanchal Gramin Bank 343 31 13 - 387Rajasthan Gramin Bank 171 54 11 - 236Rewa-Sidhi Gramin Bank 76 8 16 - 100Rushikulya Gramya Bank 69 13 9 - 91Samastipur Kshetriya Gramin Bank 58 14 - - 72Saptagiri Grameena Bank 106 31 15 - 152Sarva U.P. Gramin Bank 224 69 21 1 315Satpura Narmada Kshetriya Gramin Bank 226 101 22 - 349Saurashtra Gramin Bank 119 42 15 6 182Sharda Gramin Bank 52 7 4 - 63Shreyas Gramin Bank 143 50 17 10 220South Malabar Gramin Bank 36 204 19 - 259Surguja Kshetriya Gramin Bank 93 7 - - 100Sutlej Gramin Bank 20 9 1 - 30Tripura Gramin Bank 79 25 9 - 113Utkal Gramya Bank 294 34 4 - 332Uttaranchal Gramin Bank 125 20 12 - 157Uttar Banga Kshetriya Gramin Bank 87 28 7 - 122Uttar Bihar Gramin Bank 705 166 27 - 898Vananchal Gramin Bank 160 26 - - 186Vidharbha Kshetriya Gramin Bank 50 44 7 - 101Vidisha-Bhopal Kshetriya Gramin Bank 17 6 2 4 29Visveshvaraya Grameena Bank 26 5 2 - 33Wainganga Krishna Gramin Bank 129 51 8 1 189Total 12495 3196 871 157 16719
Grand Total 36452 25763 18967 17425 98607
Note : 1. Data as per information reported by banks.2. Population group classification based on 2001 census.3. Data on branches exclude administrative offices.
S ource: Master Office File system,Department of Statistics & Information Management, RBI, updated as on October 5, 2013.
are
Source

323
TABLE B13 : BANK-WISE, BANK GROUP-WISE AND POPULATION GROUP-WISE NUMBER OF BRANCHES OF SCHEDULED COMMERCIAL BANK - 2012 AND 2013
Number of branches as on March 31, 2013
(C ontd.)
Banks / Bank Groups Rural Semi-urban Urban Metropolitan GrandTotal
(1) (2) (3) (4) (5)SBI and its AssociatesState Bank Of Bikaner And Jaipur 365 296 192 186 1039State Bank Of Hyderabad 434 488 319 299 1540State Bank Of India 5589 4153 2601 2357 14700State Bank Of Mysore 245 173 159 203 780State Bank Of Patiala 376 296 275 176 1123State Bank Of Travancore 79 609 214 98 1000Total 7088 6015 3760 3319 20182Nationalised BanksAllahabad Bank 1087 553 543 489 2672Andhra Bank 501 493 473 397 1864Bank Of Baroda 1434 1157 765 907 4263Bank Of India 1594 1156 714 769 4233Bank Of Maharashtra 592 355 339 414 1700Canara Bank 1064 1040 815 824 3743Central Bank Of India 1529 1180 821 759 4289Corporation Bank 351 526 396 390 1663Dena Bank 447 308 291 325 1371IDBI Bank Ltd. 126 278 376 286 1066Indian Bank 557 578 531 389 2055Indian Overseas Bank 833 796 670 607 2906Oriental Bank Of Commerce 437 532 532 472 1973Punjab And Sind Bank 379 195 260 272 1106Punjab National Bank 2255 1343 1055 862 5515Syndicate Bank 901 789 664 577 2931UCO Bank 949 620 523 489 2581Union Bank Of India 1052 1005 786 708 3551United Bank Of India 655 310 380 318 1663Vijaya Bank 294 326 385 330 1335Total 17037 13540 11319 10584 52480New Private Sector BanksAxis Bank 242 617 532 542 1933Development Credit Bank 6 22 12 55 95HDFC Bank 428 1106 705 793 3032ICICI Bank 436 989 786 884 3095IndusInd Bank 95 116 151 139 501Kotak Mahindra Bank 40 104 94 201 439Yes Bank 46 159 88 135 428Total 1293 3113 2368 2749 9523Old Private Sector BanksCatholic Syrian Bank Ltd 18 212 106 51 387City Union Bank Limited 48 146 115 67 376Federal Bank Ltd 98 635 202 161 1096Ing Vysya Bank Ltd 87 105 167 185 544Jammu & Kashmir Bank Ltd 356 118 148 64 686Karnataka Bank Ltd 105 127 162 161 555Karur Vysya Bank Ltd 67 201 162 118 548Lakshmi Vilas Bank Ltd 43 103 88 57 291
Note : 1. Data as per information reported by banks.2. Population group classification based on 2001 census.3. Data on branches exclude administrative offices.
S ource: Master Office File systems, Department of Statistics & Information Management, RBI, updated as on October 5, 2013.
are
Source

324
TABLE B13 : BANK-WISE, BANK GROUP-WISE AND POPULATION GROUP-WISE NUMBER OF BRANCHES OF SCHEDULED COMMERCIAL BANK - 2012 AND 2013
Number of branches as on March 31, 2013
(Contd.)
Banks / Bank Groups Rural Semi-urban Urban Metropolitan GrandTotal
(1) (2) (3) (4) (5)Nainital Bank Ltd 27 32 27 22 108Ratnakar Bank Ltd 25 45 25 29 124South Indian Bank Ltd 95 352 171 122 740Tamilnad Mercantile Bank Ltd 76 151 59 34 320The Dhanalaxmi Bank Ltd 24 106 82 61 273Total 1069 2333 1514 1132 6048Foreign BanksAB Bank Limited - - - 1 1Abu Dhabi Commercial Bank Ltd - - - 2 2American Express Banking Corp. - - - 1 1Antwerp Diamond Bank Nv - - - 1 1Australia And New Zealand Banking Group Limited - - - 1 1Bank Internasional Indonesia - - - 1 1Bank of America N.T. And S.A. - - - 5 5Bank of Bahrain & Kuwait B.S.C. - - - 2 2Bank of Ceylon - - - 1 1Bank of Nova Scotia - - 1 4 5Barclays Bank Plc - 1 4 4 9BNP Paribas - - - 9 9Chinatrust Commercial Bank - 1 - 1 2Citibank N.A. - 2 12 29 43Commonwealth Bank of Australia - - - 1 1Credit Agricole - - - 5 5Credit Suisse AG - - - 1 1DBS Bank Ltd. 3 3 - 6 12Deutsche Bank Ag 1 - 6 10 17FirstRand Bank - - - 1 1Hongkong and Shanghai Banking Corpn.Ltd. 1 1 10 38 50HSBC Bank Oman S.A.O.G. - - 1 1 2Industrial and Commercial Bank Of China - - - 1 1JPMorgan Chase Bank National Association - - - 1 1JSC VTB Bank - - - 1 1Krung Thai Bank - - - 1 1Mashreqbank - - - 1 1Mizuho Corporate Bank Ltd - - - 2 2National Australia Bank - - - 1 1Rabobank International - - - 1 1Sberbank - - - 1 1Shinhan Bank - 1 - 2 3Societe Generale - 1 - 2 3Sonali Bank - - 1 1 2Standard Chartered Bank - - 20 79 99State Bank of Mauritius Ltd. - - - 3 3Sumitomo Mitsui Banking Corporation - - - 1 1The Bank of Tokyo-Mitsubishi UFJ 1 - - 3 4The Royal Bank of Scotland N.V. 2 - 10 19 31UBS AG - - - 1 1United Overseas Bank Ltd. - - - 1 1Westpac Banking Corporation - - - 1 1
Note : 1. Data as per information reported by banks.2. Population group classification based on 2001 census.3. Data on branches exclude administrative offices.
Source: Master Office File systems, Department of Statistics & Information Management, RBI, updated as on October 5, 2013.
are
Woori Bank - - - 1 1Total 8 10 65 249 332
Source

325
TABLE B13 : BANK-WISE, BANK GROUP-WISE AND POPULATION GROUP-WISE NUMBER OF BRANCHES OF SCHEDULED COMMERCIAL BANK - 2012 AND 2013
Number of branches as on March 31, 2013
(Contd.)
Banks / Bank Groups Rural Semi-urban Urban Metropolitan GrandTotal
(1) (2) (3) (4) (5)
Regional Rural BanksAllahabad Up Gramin Bank 446 70 29 - 545Andhra Pradesh Grameena Vikas Bank 382 120 26 14 542Andhra Pragathi Grameena Bank 292 98 46 - 436Arunachal Pradesh Rural Bank 14 3 - - 17Aryavrat Kshetriya Gramin Bank 318 62 12 14 406Assam Gramin Vikash Bank 285 59 16 - 360Ballia-Etawah Gramin Bank 121 19 3 - 143Bangiya Gramin Vikash Bank 476 67 21 - 564Baroda Gujarat Gramin Bank 109 33 4 5 151Baroda Rajasthan Kshetriya Gramin Bank 470 139 29 - 638Baroda Uttar Pradesh Gramin Bank 627 72 22 16 737Bihar Gramin Bank 175 62 6 - 243Central Madhya Pradesh Gramin Bank 271 121 28 4 424Chaitanya Godavari Grameena Bank 78 37 13 - 128Chhattisgarh Gramin Bank 235 43 22 - 300Deccan Grameena Bank 184 42 8 30 264Dena Gujarat Gramin Bank 119 38 9 4 170Durg Rajnandgaon Gramin Bank 109 12 9 - 130Ellaquai Dehati Bank 80 8 7 - 95Gurgaon Gramin Bank 175 33 13 10 231Haryana Gramin Bank 195 63 19 - 277Himachal Pradesh Gramin Bank 174 12 1 - 187Jharkhand Gramin Bank 203 25 12 3 243J & K Grameen Bank 149 21 6 - 176Karnataka Vikas Grameena Bank 360 118 52 - 530Kashi Gomti Samyut Gramin Bank 329 40 10 22 401Kaveri Grameena Bank 248 46 19 9 322Krishna Grameena Bank 97 8 10 - 115Langpi Dehangi Rural Bank 37 5 - - 42Madhya Bihar Gramin Bank 352 56 10 6 424Madhyanchal Gramin Bank 281 72 42 - 395Maharashtra Gramin Bank 236 93 25 3 357Malwa Gramin Bank 49 4 1 - 54Manipur Rural Bank 18 7 2 - 27Marudhara Gramin Bank 362 81 9 4 456Megalaya Rural Bank 44 7 4 - 55Mewar Aanchalik Gramin Bank 43 10 6 - 59Mizoram Rural Bank 49 7 7 - 63Nagaland Rural Bank 2 7 - - 9Narmada Jhabua Gramin Bank 223 71 14 4 312North Malabar Gramin Bank 33 177 12 - 222Odisha Gramya Bank 419 29 26 - 474Pallavan Grama Bank 75 61 9 - 145Pandyan Grama Bank 120 79 16 - 215Paschim Banga Gramin Bank 196 17 3 2 218Pragathi Gramin Bank 340 57 36 - 433
Note : 1. Data as per information reported by banks.2. Population group classification based on 2001 census.3. Data on branches exclude administrative offices.
Source : Master Office File systems, Department of Statistics & Information Management, RBI, updated as on October 5, 2013.
are

326
TABLE B13 : BANK-WISE, BANK GROUP-WISE AND POPULATION GROUP-WISE NUMBER OF BRANCHES OF SCHEDULED COMMERCIAL BANK - 2012 AND 2013
Number of branches as on March 31, 2013
(Concld.)
Banks / Bank Groups Rural Semi-urban Urban Metropolitan GrandTotal
(1) (2) (3) (4) (5)Prathama Bank 197 32 15 - 244Puduvai Bharathiar Grama Bank 14 6 9 - 29Punjab Gramin Bank 165 34 14 2 215Purvanchal Gramin Bank 382 31 13 - 426Saptagiri Grameena Bank 109 31 15 - 155Sarva U.P. Gramin Bank 224 69 21 2 316Saurashtra Gramin Bank 123 51 20 8 202Shreyas Gramin Bank 160 52 18 11 241South Malabar Gramin Bank 39 227 19 - 285Surguja Kshetriya Gramin Bank 96 7 - - 103Sutlej Gramin Bank 20 9 1 - 30Tripura Gramin Bank 79 25 9 - 113Utkal Grameen Bank 363 47 13 - 423Uttarakhand Gramin Bank 186 29 15 - 230Uttar Banga Kshetriya Gramin Bank 87 28 7 - 122Uttar Bihar Gramin Bank 706 166 27 - 899Vananchal Gramin Bank 160 26 - - 186Vidharbha Konkan Gramin Bank 182 96 15 1 294Total 12892 3277 905 174 17248
Grand Total 39387 28288 19931 18207 105813
Note : 1. Data is as per information reported by banks.2. Population group classification based on 2001 census.3. Data on branches exclude administrative offices.
Source: Master Office File (Latest updated version) on banks, Department of Statistics & Information Management, RBI.
TABLE B13 : BANK-WISE, BANK GROUP-WISE AND POPULATION GROUP-WISE NUMBER OF BRANCHES OF SCHEDULED COMMERCIAL BANK - 2012 AND 2013
Number of branches as on March 31, 2013
(Contd.)
Banks / Bank Groups Rural Semi-urban Urban Metropolitan GrandTotal
(1) (2) (3) (4) (5)
Regional Rural BanksAllahabad Up Gramin Bank 446 70 29 - 545Andhra Pradesh Grameena Vikas Bank 382 120 26 14 542Andhra Pragathi Grameena Bank 292 98 46 - 436Arunachal Pradesh Rural Bank 14 3 - - 17Aryavrat Kshetriya Gramin Bank 318 62 12 14 406Assam Gramin Vikash Bank 285 59 16 - 360Ballia-Etawah Gramin Bank 121 19 3 - 143Bangiya Gramin Vikash Bank 476 67 21 - 564Baroda Gujarat Gramin Bank 109 33 4 5 151Baroda Rajasthan Kshetriya Gramin Bank 470 139 29 - 638Baroda Uttar Pradesh Gramin Bank 627 72 22 16 737Bihar Gramin Bank 175 62 6 - 243Central Madhya Pradesh Gramin Bank 271 121 28 4 424Chaitanya Godavari Grameena Bank 78 37 13 - 128Chhattisgarh Gramin Bank 235 43 22 - 300Deccan Grameena Bank 184 42 8 30 264Dena Gujarat Gramin Bank 119 38 9 4 170Durg Rajnandgaon Gramin Bank 109 12 9 - 130Ellaquai Dehati Bank 80 8 7 - 95Gurgaon Gramin Bank 175 33 13 10 231Haryana Gramin Bank 195 63 19 - 277Himachal Pradesh Gramin Bank 174 12 1 - 187Jharkhand Gramin Bank 203 25 12 3 243J & K Grameen Bank 149 21 6 - 176Karnataka Vikas Grameena Bank 360 118 52 - 530Kashi Gomti Samyut Gramin Bank 329 40 10 22 401Kaveri Grameena Bank 248 46 19 9 322Krishna Grameena Bank 97 8 10 - 115Langpi Dehangi Rural Bank 37 5 - - 42Madhya Bihar Gramin Bank 352 56 10 6 424Madhyanchal Gramin Bank 281 72 42 - 395Maharashtra Gramin Bank 236 93 25 3 357Malwa Gramin Bank 49 4 1 - 54Manipur Rural Bank 18 7 2 - 27Marudhara Gramin Bank 362 81 9 4 456Megalaya Rural Bank 44 7 4 - 55Mewar Aanchalik Gramin Bank 43 10 6 - 59Mizoram Rural Bank 49 7 7 - 63Nagaland Rural Bank 2 7 - - 9Narmada Jhabua Gramin Bank 223 71 14 4 312North Malabar Gramin Bank 33 177 12 - 222Odisha Gramya Bank 419 29 26 - 474Pallavan Grama Bank 75 61 9 - 145Pandyan Grama Bank 120 79 16 - 215Paschim Banga Gramin Bank 196 17 3 2 218Pragathi Gramin Bank 340 57 36 - 433
Note : 1. Data as per information reported by banks.2. Population group classification based on 2001 census.3. Data on branches exclude administrative offices.
Source : Master Office File systems, Department of Statistics & Information Management, RBI, updated as on October 5, 2013.
are
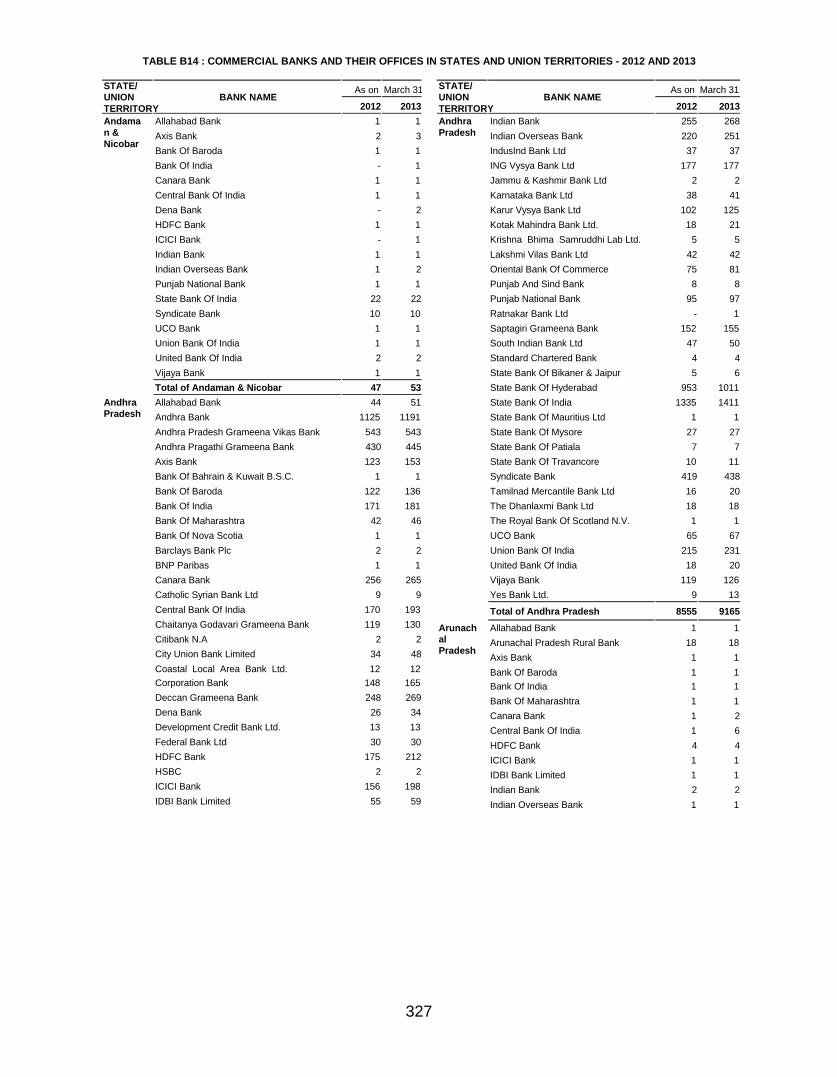
327
TABLE B14 : COMMERCIAL BANKS AND THEIR OFFICES IN STATES AND UNION TERRITORIES - 2012 AND 2013
(contd.)STATE/UNIONTERRITORY
BANK NAMEAs on March 31
2012 2013ArunachalPradesh
Oriental Bank Of Commerce 1 1Punjab National Bank 1 1State Bank Of India 49 51Syndicate Bank 1 1UCO Bank 2 2Union Bank Of India 1 1United Bank Of India 3 3Vijaya Bank 5 5Yes Bank Ltd. 1 1Total of Arunachal Pradesh 98 106
Assam Allahabad Bank 67 68Andhra Bank 5 7Assam Gramin Vikash Bank 367 367Axis Bank 30 34Bank Of Baroda 23 24Bank Of India 22 39Bank Of Maharashtra 7 8Canara Bank 28 35Central Bank Of India 122 128Corporation Bank 6 8Dena Bank 6 6Federal Bank Ltd 10 12HDFC Bank 32 40HSBC 1 1ICICI Bank 32 37IDBI Bank Limited 9 14Indian Bank 32 34Indian Overseas Bank 24 26IndusInd Bank Ltd 6 8ING Vysya Bank Ltd 1 1Karnataka Bank Ltd 1 1Kotak Mahindra Bank Ltd. 3 3Langpi Dehangi Rural Bank 42 42Oriental Bank Of Commerce 7 8Punjab And Sind Bank 8 8Punjab National Bank 64 65South Indian Bank Ltd 2 2Standard Chartered Bank 1 1State Bank Of Bikaner & Jaipur 1 1State Bank Of India 292 300Syndicate Bank 14 19UCO Bank 109 130Union Bank Of India 63 63United Bank Of India 191 195Vijaya Bank 15 15Yes Bank Ltd. 4 4Total of Assam 1647 1754
Bihar Allahabad Bank 187 200Andhra Bank 13 16Axis Bank 35 50Bank Of Baroda 132 155
STATE/UNIONTERRITORY
BANK NAMEAs on March 31
2012 2013Bihar Bank Of India 260 287
Bank Of Maharashtra 5 10Bihar Gramin Bank - 246Bihar Kshetriya Gramin Bank 172 -Canara Bank 126 127Central Bank Of India 392 416Corporation Bank 12 17Dena Bank 14 25Federal Bank Ltd 3 5HDFC Bank 36 61HSBC 1 1ICICI Bank 36 49IDBI Bank Limited 24 30Indian Bank 42 46Indian Overseas Bank 34 41IndusInd Bank Ltd 3 6ING Vysya Bank Ltd 2 2Jammu & Kashmir Bank Ltd 1 1Karnataka Bank Ltd 1 1Kotak Mahindra Bank Ltd. 1 2Madhya Bihar Gramin Bank 427 427Oriental Bank Of Commerce 31 36Punjab And Sind Bank 7 8Punjab National Bank 516 532Samastipur Kshetriya Gramin Bank 74 -South Indian Bank Ltd 1 1Standard Chartered Bank 1 1State Bank Of Bikaner & Jaipur 7 10State Bank Of Hyderabad - 1State Bank Of India 780 841State Bank Of Patiala 1 1Syndicate Bank 43 46UCO Bank 198 210Union Bank Of India 85 99United Bank Of India 84 86Uttar Bihar Gramin Bank 903 904Vijaya Bank 10 10Yes Bank Ltd. 1 1Total of Bihar 4701 5008
Chandigarh Allahabad Bank 7 8Andhra Bank 4 4Axis Bank 9 10Bank Of Baroda 8 9Bank Of India 11 11Bank Of Maharashtra 5 5Canara Bank 17 17
TABLE B14 : COMMERCIAL BANKS AND THEIR OFFICES IN STATES AND UNION TERRITORIES - 2012 AND 2013
STATE/UNIONTERRITORY
BANK NAMEAs on March 31
2012 2013Andaman &Nicobar
Allahabad Bank 1 1Axis Bank 2 3Bank Of Baroda 1 1Bank Of India - 1Canara Bank 1 1Central Bank Of India 1 1Dena Bank - 2HDFC Bank 1 1ICICI Bank - 1Indian Bank 1 1Indian Overseas Bank 1 2Punjab National Bank 1 1State Bank Of India 22 22Syndicate Bank 10 10UCO Bank 1 1Union Bank Of India 1 1United Bank Of India 2 2Vijaya Bank 1 1Total of Andaman & Nicobar 47 53
AndhraPradesh
Allahabad Bank 44 51Andhra Bank 1125 1191Andhra Pradesh Grameena Vikas Bank 543 543Andhra Pragathi Grameena Bank 430 445Axis Bank 123 153Bank Of Bahrain & Kuwait B.S.C. 1 1Bank Of Baroda 122 136Bank Of India 171 181Bank Of Maharashtra 42 46Bank Of Nova Scotia 1 1Barclays Bank Plc 2 2BNP Paribas 1 1Canara Bank 256 265Catholic Syrian Bank Ltd 9 9Central Bank Of India 170 193Chaitanya Godavari Grameena Bank 119 130Citibank N.A 2 2City Union Bank Limited 34 48Coastal Local Area Bank Ltd. 12 12Corporation Bank 148 165Deccan Grameena Bank 248 269Dena Bank 26 34Development Credit Bank Ltd. 13 13Federal Bank Ltd 30 30HDFC Bank 175 212HSBC 2 2ICICI Bank 156 198IDBI Bank Limited 55 59
STATE/UNIONTERRITORY
BANK NAMEAs on March 31
2012 2013AndhraPradesh
Indian Bank 255 268Indian Overseas Bank 220 251IndusInd Bank Ltd 37 37ING Vysya Bank Ltd 177 177Jammu & Kashmir Bank Ltd 2 2Karnataka Bank Ltd 38 41Karur Vysya Bank Ltd 102 125Kotak Mahindra Bank Ltd. 18 21Krishna Bhima Samruddhi Lab Ltd. 5 5Lakshmi Vilas Bank Ltd 42 42Oriental Bank Of Commerce 75 81Punjab And Sind Bank 8 8Punjab National Bank 95 97Ratnakar Bank Ltd - 1Saptagiri Grameena Bank 152 155South Indian Bank Ltd 47 50Standard Chartered Bank 4 4State Bank Of Bikaner & Jaipur 5 6State Bank Of Hyderabad 953 1011State Bank Of India 1335 1411State Bank Of Mauritius Ltd 1 1State Bank Of Mysore 27 27State Bank Of Patiala 7 7State Bank Of Travancore 10 11Syndicate Bank 419 438Tamilnad Mercantile Bank Ltd 16 20The Dhanlaxmi Bank Ltd 18 18The Royal Bank Of Scotland N.V. 1 1UCO Bank 65 67Union Bank Of India 215 231United Bank Of India 18 20Vijaya Bank 119 126Yes Bank Ltd. 9 13
Total of Andhra Pradesh 8555 9165
ArunachalPradesh
Allahabad Bank 1 1Arunachal Pradesh Rural Bank 18 18Axis Bank 1 1Bank Of Baroda 1 1Bank Of India 1 1Bank Of Maharashtra 1 1Canara Bank 1 2Central Bank Of India 1 6HDFC Bank 4 4ICICI Bank 1 1IDBI Bank Limited 1 1Indian Bank 2 2Indian Overseas Bank 1 1
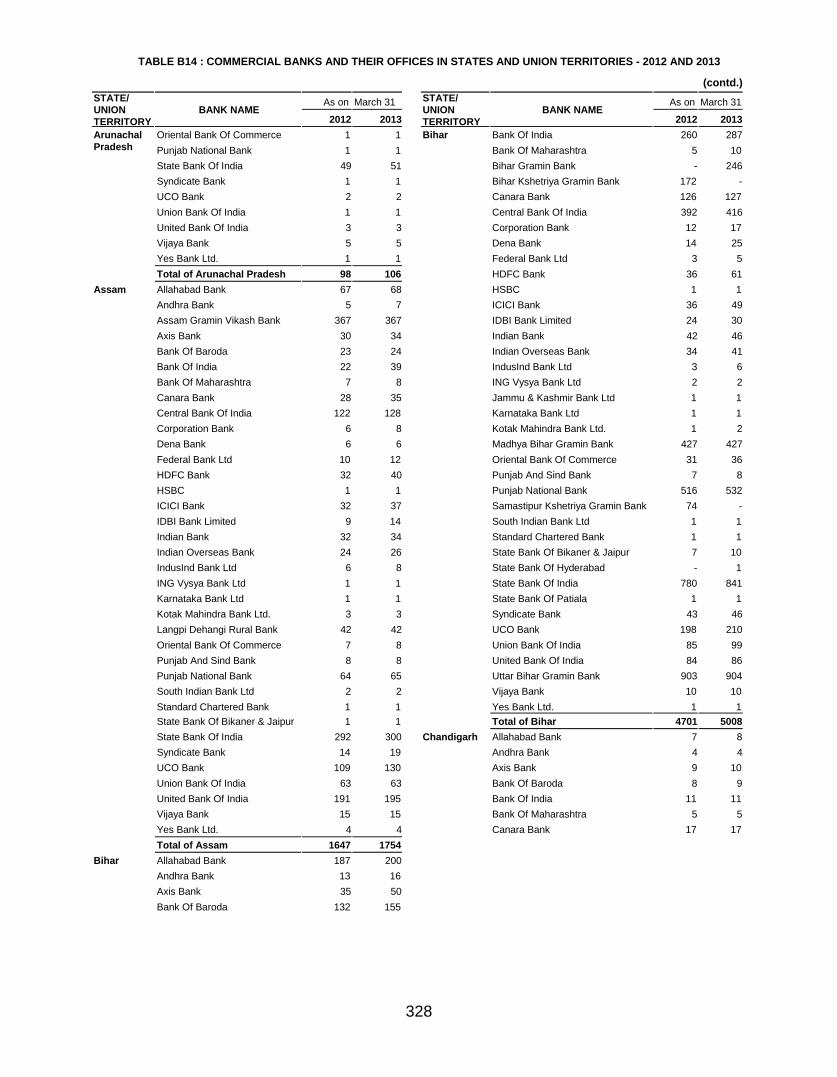
328
TABLE B14 : COMMERCIAL BANKS AND THEIR OFFICES IN STATES AND UNION TERRITORIES - 2012 AND 2013
(contd.)STATE/UNIONTERRITORY
BANK NAMEAs on March 31
2012 2013ArunachalPradesh
Oriental Bank Of Commerce 1 1Punjab National Bank 1 1State Bank Of India 49 51Syndicate Bank 1 1UCO Bank 2 2Union Bank Of India 1 1United Bank Of India 3 3Vijaya Bank 5 5Yes Bank Ltd. 1 1Total of Arunachal Pradesh 98 106
Assam Allahabad Bank 67 68Andhra Bank 5 7Assam Gramin Vikash Bank 367 367Axis Bank 30 34Bank Of Baroda 23 24Bank Of India 22 39Bank Of Maharashtra 7 8Canara Bank 28 35Central Bank Of India 122 128Corporation Bank 6 8Dena Bank 6 6Federal Bank Ltd 10 12HDFC Bank 32 40HSBC 1 1ICICI Bank 32 37IDBI Bank Limited 9 14Indian Bank 32 34Indian Overseas Bank 24 26IndusInd Bank Ltd 6 8ING Vysya Bank Ltd 1 1Karnataka Bank Ltd 1 1Kotak Mahindra Bank Ltd. 3 3Langpi Dehangi Rural Bank 42 42Oriental Bank Of Commerce 7 8Punjab And Sind Bank 8 8Punjab National Bank 64 65South Indian Bank Ltd 2 2Standard Chartered Bank 1 1State Bank Of Bikaner & Jaipur 1 1State Bank Of India 292 300Syndicate Bank 14 19UCO Bank 109 130Union Bank Of India 63 63United Bank Of India 191 195Vijaya Bank 15 15Yes Bank Ltd. 4 4Total of Assam 1647 1754
Bihar Allahabad Bank 187 200Andhra Bank 13 16Axis Bank 35 50Bank Of Baroda 132 155
STATE/UNIONTERRITORY
BANK NAMEAs on March 31
2012 2013Bihar Bank Of India 260 287
Bank Of Maharashtra 5 10Bihar Gramin Bank - 246Bihar Kshetriya Gramin Bank 172 -Canara Bank 126 127Central Bank Of India 392 416Corporation Bank 12 17Dena Bank 14 25Federal Bank Ltd 3 5HDFC Bank 36 61HSBC 1 1ICICI Bank 36 49IDBI Bank Limited 24 30Indian Bank 42 46Indian Overseas Bank 34 41IndusInd Bank Ltd 3 6ING Vysya Bank Ltd 2 2Jammu & Kashmir Bank Ltd 1 1Karnataka Bank Ltd 1 1Kotak Mahindra Bank Ltd. 1 2Madhya Bihar Gramin Bank 427 427Oriental Bank Of Commerce 31 36Punjab And Sind Bank 7 8Punjab National Bank 516 532Samastipur Kshetriya Gramin Bank 74 -South Indian Bank Ltd 1 1Standard Chartered Bank 1 1State Bank Of Bikaner & Jaipur 7 10State Bank Of Hyderabad - 1State Bank Of India 780 841State Bank Of Patiala 1 1Syndicate Bank 43 46UCO Bank 198 210Union Bank Of India 85 99United Bank Of India 84 86Uttar Bihar Gramin Bank 903 904Vijaya Bank 10 10Yes Bank Ltd. 1 1Total of Bihar 4701 5008
Chandigarh Allahabad Bank 7 8Andhra Bank 4 4Axis Bank 9 10Bank Of Baroda 8 9Bank Of India 11 11Bank Of Maharashtra 5 5Canara Bank 17 17

329
TABLE B14 : COMMERCIAL BANKS AND THEIR OFFICES IN STATES AND UNION TERRITORIES - 2012 AND 2013(contd.)
STATE/UNIONTERRITORY
BANK NAMEAs on March 31
2012 2013Chandigarh Catholic Syrian Bank Ltd 1 1
Central Bank Of India 12 12Citibank N.A 1 1City Union Bank Limited - 1Corporation Bank 5 5Dena Bank 2 2Development Credit Bank Ltd. 1 1Federal Bank Ltd 4 4HDFC Bank 21 21HSBC 1 1ICICI Bank 16 17IDBI Bank Limited 3 3Indian Bank 7 9Indian Overseas Bank 10 10IndusInd Bank Ltd 2 2ING Vysya Bank Ltd 2 2Jammu & Kashmir Bank Ltd 1 1Karnataka Bank Ltd 1 1Karur Vysya Bank Ltd 1 1Kotak Mahindra Bank Ltd. 3 3Oriental Bank Of Commerce 16 16Punjab And Sind Bank 27 28Punjab National Bank 37 38South Indian Bank Ltd 1 1Standard Chartered Bank 1 1State Bank Of Bikaner & Jaipur 2 2State Bank Of Hyderabad 1 1State Bank Of India 48 48State Bank Of Patiala 39 41State Bank Of Travancore 1 1Syndicate Bank 5 5The Dhanlaxmi Bank Ltd 1 1UCO Bank 12 13Union Bank Of India 12 12United Bank Of India 4 4Vijaya Bank 6 6Yes Bank Ltd. 2 3Total of Chandigarh 370 383
Chhattisgarh Allahabad Bank 31 34Andhra Bank 14 14Axis Bank 34 42Bank Of Baroda 53 58Bank Of India 45 47Bank Of Maharashtra 22 29Canara Bank 14 16Central Bank Of India 103 110Chhattisgarh Gramin Bank 305 306City Union Bank Limited 1 1Corporation Bank 14 17Dena Bank 77 86Durg Rajnandgaon Gramin Bank 121 133
STATE/UNIONTERRITORY
BANK NAMEAs on March 31
2012 2013Chhattisgarh Federal Bank Ltd 3 3
HDFC Bank 30 34HSBC 1 1ICICI Bank 24 35IDBI Bank Limited 16 39Indian Bank 9 9Indian Overseas Bank 15 33IndusInd Bank Ltd 7 14ING Vysya Bank Ltd 4 4Jammu & Kashmir Bank Ltd 1 1Karnataka Bank Ltd 4 4Karur Vysya Bank Ltd 1 1Kotak Mahindra Bank Ltd. 3 6Lakshmi Vilas Bank Ltd 1 1Oriental Bank Of Commerce 19 23Punjab And Sind Bank 5 9Punjab National Bank 105 114South Indian Bank Ltd 3 3State Bank Of Hyderabad 2 2State Bank Of India 352 361State Bank Of Patiala 1 1State Bank Of Travancore - 1Surguja Kshetriya Gramin Bank 103 106Syndicate Bank 9 12UCO Bank 36 41Union Bank Of India 44 53United Bank Of India 17 18Vijaya Bank 15 17Yes Bank Ltd. 2 2
Total of Chhattisgarh 1666 1841
Dadra &Nagar Haveli
Allahabad Bank 1 1Andhra Bank 1 1Axis Bank 1 1Bank Of Baroda 2 3Canara Bank 3 3Catholic Syrian Bank Ltd - 2Central Bank Of India 1 1Corporation Bank 1 1Dena Bank 7 7Development Credit Bank Ltd. 1 1Federal Bank Ltd - 1HDFC Bank 3 3ICICI Bank 4 4IDBI Bank Limited 1 1Indian Bank 1 1Indian Overseas Bank 1 1IndusInd Bank Ltd 1 2ING Vysya Bank Ltd 1 1Kotak Mahindra Bank Ltd. 1 1Oriental Bank Of Commerce 1 1

330
TABLE B14 : COMMERCIAL BANKS AND THEIR OFFICES IN STATES AND UNION TERRITORIES - 2012 AND 2013 (contd.)
STATE/UNIONTERRITORY
BANK NAMEAs on March 31
2012 2013Dadra &Nagar Haveli
Punjab National Bank 1 1Ratnakar Bank Ltd 1 1State Bank Of India 3 3Tamilnad Mercantile Bank Ltd 1 1UCO Bank 1 1Union Bank Of India 1 1Vijaya Bank - 1Yes Bank Ltd. 1 1Total of Dadra & Nagar Haveli 41 47
Daman & Diu Axis Bank 2 2Bank Of Baroda 3 3Bank Of India 2 2Canara Bank 1 1Central Bank Of India 1 2Corporation Bank 1 1Dena Bank 2 2Development Credit Bank Ltd. 1 1Federal Bank Ltd - 1HDFC Bank 3 4ICICI Bank 2 2IDBI Bank Limited 1 1Indian Bank 1 1Indian Overseas Bank 1 1Oriental Bank Of Commerce 1 1Punjab National Bank 1 1Ratnakar Bank Ltd - 1State Bank Of India 10 10UCO Bank 1 1Union Bank Of India 1 1Yes Bank Ltd. 1 1Total of Daman & Diu 36 40
Goa Allahabad Bank 5 5Andhra Bank 4 4Axis Bank 8 8Bank Of Baroda 29 29Bank Of India 46 47Bank Of Maharashtra 18 18Canara Bank 33 33Catholic Syrian Bank Ltd 3 3Central Bank Of India 29 30Corporation Bank 48 49Dena Bank 16 16Development Credit Bank Ltd. 4 4Federal Bank Ltd 6 6HDFC Bank 41 56ICICI Bank 19 26IDBI Bank Limited 6 6Indian Bank 6 7Indian Overseas Bank 19 25IndusInd Bank Ltd 5 5ING Vysya Bank Ltd 3 3
STATE/UNIONTERRITORY
BANK NAMEAs on March 31
2012 2013Goa Jammu & Kashmir Bank Ltd 1 1
Karnataka Bank Ltd 5 6Karur Vysya Bank Ltd 1 1Kotak Mahindra Bank Ltd. 2 3Oriental Bank Of Commerce 7 7Punjab And Sind Bank 1 1Punjab National Bank 5 5Ratnakar Bank Ltd 4 4South Indian Bank Ltd 5 5State Bank Of India 83 86State Bank Of Mysore 3 3State Bank Of Patiala 1 1State Bank Of Travancore 1 1Syndicate Bank 24 25The Dhanlaxmi Bank Ltd 1 1UCO Bank 8 10Union Bank Of India 16 16United Bank Of India 3 3Vijaya Bank 7 8Yes Bank Ltd. 7 7Total of Goa 533 574
Gujarat Allahabad Bank 48 54Andhra Bank 21 23Axis Bank 144 158Bank Of Baroda 833 886Bank Of India 342 358Bank Of Maharashtra 55 61Barclays Bank Plc 1 1Baroda Gujarat Gramin Bank 151 154BNP Paribas 1 1Canara Bank 87 92Catholic Syrian Bank Ltd 4 6Central Bank Of India 266 271Citibank N.A 4 4City Union Bank Limited 6 6Corporation Bank 82 106Credit Agricole 1 -DBS Bank Ltd. 1 1Dena Bank 506 541Dena Gujarat Gramin Bank 163 174Deutsche Bank Ag - 2Development Credit Bank Ltd. 19 22Federal Bank Ltd 29 35HDFC Bank 201 267HSBC 3 3ICICI Bank 163 200IDBI Bank Limited 63 65Indian Bank 55 57Indian Overseas Bank 93 113IndusInd Bank Ltd 30 34ING Vysya Bank Ltd 13 13

331
TABLE B14 : COMMERCIAL BANKS AND THEIR OFFICES IN STATES AND UNION TERRITORIES - 2012 AND 2013( contd.)
STATE/UNIONTERRITORY
BANK NAMEAs on March 31
2012 2013Gujarat Jammu & Kashmir Bank Ltd 4 4
Karnataka Bank Ltd 5 5Karur Vysya Bank Ltd 15 17Kotak Mahindra Bank Ltd. 56 69Lakshmi Vilas Bank Ltd 10 10Oriental Bank Of Commerce 60 63Punjab And Sind Bank 8 8Punjab National Bank 137 149Ratnakar Bank Ltd 1 4Saurashtra Gramin Bank 185 205Societe Generale - 1South Indian Bank Ltd 6 10Standard Chartered Bank 4 4State Bank Of Bikaner & Jaipur 10 15State Bank Of Hyderabad 8 8State Bank Of India 1212 1214State Bank Of Mysore 5 5State Bank Of Patiala 11 12State Bank Of Travancore 3 4Syndicate Bank 72 81Tamilnad Mercantile Bank Ltd 5 5The Dhanlaxmi Bank Ltd 6 6The Royal Bank Of Scotland N.V. 3 3UCO Bank 91 107Union Bank Of India 243 255United Bank Of India 19 21Vijaya Bank 66 69Yes Bank Ltd. 28 32Total of Gujarat 5658 6094
Haryana Allahabad Bank 70 76American Express Banking Corp. 1 1Andhra Bank 26 30Axis Bank 59 90Bank Of Baroda 60 67Bank Of India 48 53Bank Of Maharashtra 20 25Canara Bank 108 112Catholic Syrian Bank Ltd 2 2Central Bank Of India 127 133Citibank N.A 2 2City Union Bank Limited - 1Corporation Bank 50 65Dena Bank 26 27Deutsche Bank Ag 1 1Development Credit Bank Ltd. 1 1Federal Bank Ltd 11 12Gurgaon Gramin Bank 215 236Haryana Gramin Bank 256 281HDFC Bank 126 180HSBC 1 1ICICI Bank 96 101IDBI Bank Limited 34 36
STATE/UNIONTERRITORY
BANK NAMEAs on March 31
2012 2013Haryana Indian Bank 28 40
Indian Overseas Bank 46 49IndusInd Bank Ltd 17 27ING Vysya Bank Ltd 5 5Jammu & Kashmir Bank Ltd 9 10Karnataka Bank Ltd 4 7Karur Vysya Bank Ltd 4 4Kotak Mahindra Bank Ltd. 17 22Lakshmi Vilas Bank Ltd 4 4Nainital Bank Ltd 3 3Oriental Bank Of Commerce 197 210Punjab And Sind Bank 66 73Punjab National Bank 465 484Ratnakar Bank Ltd - 2South Indian Bank Ltd 4 4Standard Chartered Bank 2 2State Bank Of Bikaner And Jaipur 13 16State Bank Of Hyderabad 10 10State Bank Of India 288 322State Bank Of Mysore 1 1State Bank Of Patiala 208 219State Bank Of Travancore 6 8Syndicate Bank 103 116The Dhanlaxmi Bank Ltd 2 2The Royal Bank Of Scotland N.V. 2 2UCO Bank 63 75Union Bank Of India 80 91United Bank Of India 17 17Vijaya Bank 23 23Yes Bank Ltd. 43 50
Total of Haryana 3070 3431
HimachalPradesh
Allahabad Bank 11 13Andhra Bank 1 1Axis Bank 4 5Bank Of Baroda 17 17Bank Of India 15 18Bank Of Maharashtra 3 4Canara Bank 21 21Catholic Syrian Bank Ltd - 1Central Bank Of India 48 49Corporation Bank 13 13Dena Bank 4 4HDFC Bank 24 35Himachal Gramin Bank 141 -Himachal Pradesh Gramin Bank - 189ICICI Bank 18 18IDBI Bank Limited 11 12Indian Bank 8 8Indian Overseas Bank 7 7IndusInd Bank Ltd 2 2ING Vysya Bank Ltd 1 1
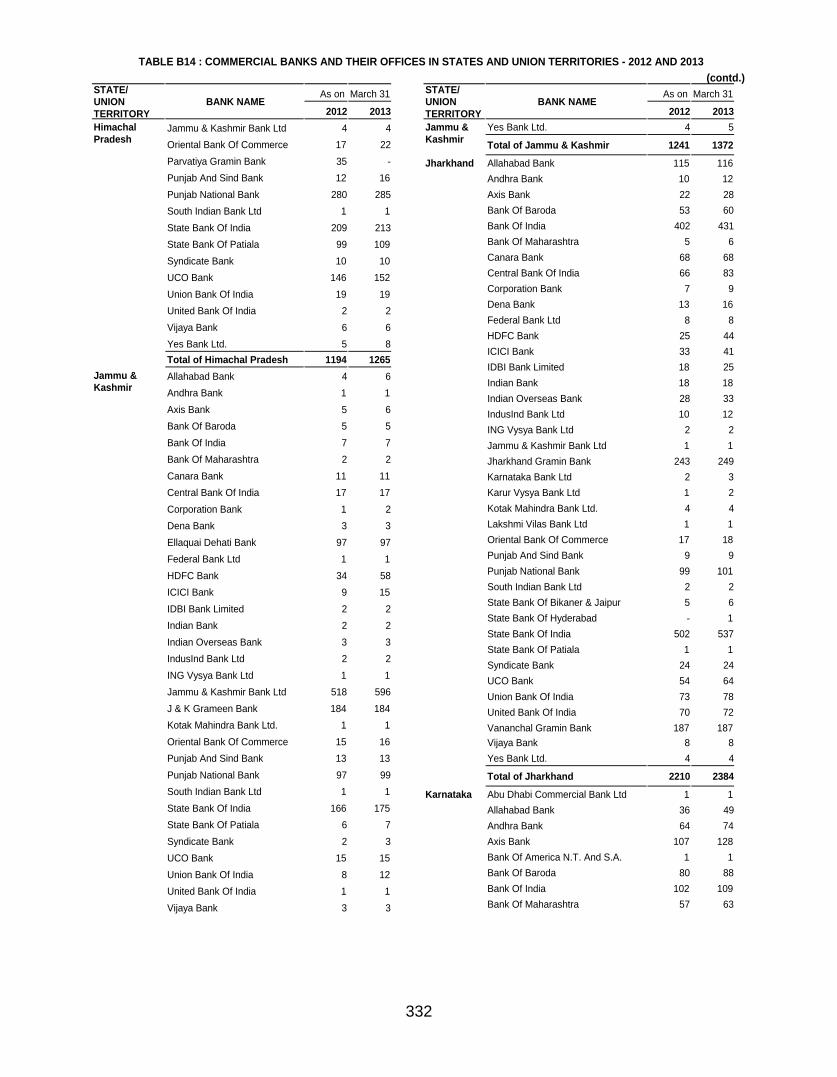
332
TABLE B14 : COMMERCIAL BANKS AND THEIR OFFICES IN STATES AND UNION TERRITORIES - 2012 AND 2013(contd.)
STATE/UNIONTERRITORY
BANK NAMEAs on March 31
2012 2013HimachalPradesh
Jammu & Kashmir Bank Ltd 4 4Oriental Bank Of Commerce 17 22Parvatiya Gramin Bank 35 -
Punjab And Sind Bank 12 16Punjab National Bank 280 285South Indian Bank Ltd 1 1State Bank Of India 209 213State Bank Of Patiala 99 109Syndicate Bank 10 10UCO Bank 146 152Union Bank Of India 19 19United Bank Of India 2 2Vijaya Bank 6 6Yes Bank Ltd. 5 8Total of Himachal Pradesh 1194 1265
Jammu &Kashmir
Allahabad Bank 4 6Andhra Bank 1 1Axis Bank 5 6Bank Of Baroda 5 5Bank Of India 7 7Bank Of Maharashtra 2 2Canara Bank 11 11Central Bank Of India 17 17Corporation Bank 1 2Dena Bank 3 3Ellaquai Dehati Bank 97 97Federal Bank Ltd 1 1HDFC Bank 34 58ICICI Bank 9 15IDBI Bank Limited 2 2Indian Bank 2 2Indian Overseas Bank 3 3IndusInd Bank Ltd 2 2ING Vysya Bank Ltd 1 1Jammu & Kashmir Bank Ltd 518 596J & K Grameen Bank 184 184Kotak Mahindra Bank Ltd. 1 1Oriental Bank Of Commerce 15 16Punjab And Sind Bank 13 13Punjab National Bank 97 99South Indian Bank Ltd 1 1State Bank Of India 166 175State Bank Of Patiala 6 7Syndicate Bank 2 3UCO Bank 15 15Union Bank Of India 8 12United Bank Of India 1 1Vijaya Bank 3 3
STATE/UNIONTERRITORY
BANK NAMEAs on March 31
2012 2013Jammu &Kashmir
Yes Bank Ltd. 4 5
Total of Jammu & Kashmir 1241 1372
Jharkhand Allahabad Bank 115 116Andhra Bank 10 12Axis Bank 22 28Bank Of Baroda 53 60Bank Of India 402 431Bank Of Maharashtra 5 6Canara Bank 68 68Central Bank Of India 66 83Corporation Bank 7 9Dena Bank 13 16Federal Bank Ltd 8 8HDFC Bank 25 44ICICI Bank 33 41IDBI Bank Limited 18 25Indian Bank 18 18Indian Overseas Bank 28 33IndusInd Bank Ltd 10 12ING Vysya Bank Ltd 2 2Jammu & Kashmir Bank Ltd 1 1Jharkhand Gramin Bank 243 249Karnataka Bank Ltd 2 3Karur Vysya Bank Ltd 1 2Kotak Mahindra Bank Ltd. 4 4Lakshmi Vilas Bank Ltd 1 1Oriental Bank Of Commerce 17 18Punjab And Sind Bank 9 9Punjab National Bank 99 101South Indian Bank Ltd 2 2State Bank Of Bikaner & Jaipur 5 6State Bank Of Hyderabad - 1State Bank Of India 502 537State Bank Of Patiala 1 1Syndicate Bank 24 24UCO Bank 54 64Union Bank Of India 73 78United Bank Of India 70 72Vananchal Gramin Bank 187 187Vijaya Bank 8 8Yes Bank Ltd. 4 4
Total of Jharkhand 2210 2384
Karnataka Abu Dhabi Commercial Bank Ltd 1 1Allahabad Bank 36 49Andhra Bank 64 74Axis Bank 107 128Bank Of America N.T. And S.A. 1 1Bank Of Baroda 80 88Bank Of India 102 109Bank Of Maharashtra 57 63

333
TABLE B14 : COMMERCIAL BANKS AND THEIR OFFICES IN STATES AND UNION TERRITORIES - 2012 AND 2013
(contd.)STATE/UNIONTERRITORY
BANK NAMEAs on March 31
2012 2013Karnataka Bank Of Nova Scotia 1 1
Barclays Bank Plc 1 1BNP Paribas 1 1Canara Bank 697 721Catholic Syrian Bank Ltd 15 15Cauvery Kalpatharu Grameena Bank 229 -Central Bank Of India 109 118Chickmagalur-Kodagu Grameena Bank 60 -Citibank N.A 2 2City Union Bank Limited 20 24Corporation Bank 383 419Credit Agricole 1 1DBS Bank Ltd. 1 1Dena Bank 36 39Deutsche Bank Ag 1 1Development Credit Bank Ltd. 6 6Federal Bank Ltd 70 85HDFC Bank 145 157HSBC 3 3ICICI Bank 144 160IDBI Bank Limited 49 53Indian Bank 87 93Indian Overseas Bank 146 195IndusInd Bank Ltd 22 22ING Vysya Bank Ltd 124 129Jammu & Kashmir Bank Ltd 5 5Karnataka Bank Ltd 318 350Karnataka Vikas Grameena Bank 512 536Karur Vysya Bank Ltd 34 41Kaveri Grameena Bank - 324Kotak Mahindra Bank Ltd. 18 20Krishna Bhima Samruddhi Lab Ltd. 10 10Krishna Grameena Bank 115 115Lakshmi Vilas Bank Ltd 28 28Oriental Bank Of Commerce 39 44Pragathi Gramin Bank 414 443Punjab And Sind Bank 7 8Punjab National Bank 71 72Ratnakar Bank Ltd 14 17South Indian Bank Ltd 40 41Standard Chartered Bank 4 4State Bank Of Bikaner And Jaipur 3 4State Bank Of Hyderabad 158 167State Bank Of India 597 646State Bank Of Mysore 632 674State Bank Of Patiala 10 10State Bank Of Travancore 25 29Subhadra Local Area Bank Ltd. 1 1Syndicate Bank 678 712Tamilnad Mercantile Bank Ltd 9 9The Dhanlaxmi Bank Ltd 15 15
STATE/UNIONTERRITORY
BANK NAMEAs on March 31
2012 2013Karnataka The Royal Bank Of Scotland N.V. 2 2
UCO Bank 47 50Union Bank Of India 141 151United Bank Of India 16 18Vijaya Bank 500 511Visveshvaraya Grameena Bank 33 -Yes Bank Ltd. 8 10Total of Karnataka 7305 7827
Kerala Allahabad Bank 13 19Andhra Bank 24 24Axis Bank 47 54Bank Of Baroda 80 88Bank Of India 95 97Bank Of Maharashtra 7 8Canara Bank 333 339Catholic Syrian Bank Ltd 252 254Central Bank Of India 99 109Citibank N.A 1 1City Union Bank Limited 10 10Corporation Bank 84 97Dena Bank 15 15Development Credit Bank Ltd. - 1Federal Bank Ltd 536 592HDFC Bank 138 139HSBC 2 2HSBC Bank Oman S.A.O.G. 1 1ICICI Bank 101 121IDBI Bank Limited 31 32Indian Bank 105 110Indian Overseas Bank 163 176IndusInd Bank Ltd 20 22ING Vysya Bank Ltd 24 24Jammu & Kashmir Bank Ltd 2 2Karnataka Bank Ltd 11 12Karur Vysya Bank Ltd 11 14Kotak Mahindra Bank Ltd. 5 6Lakshmi Vilas Bank Ltd 6 6North Malabar Gramin Bank 213 229Oriental Bank Of Commerce 16 16Punjab And Sind Bank 3 3Punjab National Bank 154 165South Indian Bank Ltd 393 420South Malabar Gramin Bank 274 300Standard Chartered Bank 2 3State Bank Of Bikaner And Jaipur 1 1State Bank Of Hyderabad 6 7State Bank Of India 415 416State Bank Of Mysore 10 10State Bank Of Patiala 1 1State Bank Of Travancore 697 772Syndicate Bank 183 201

334
TABLE B14 : COMMERCIAL BANKS AND THEIR OFFICES IN STATES AND UNION TERRITORIES - 2012 AND 2013
(contd.)STATE/UNIONTERRITORY
BANK NAMEAs on March 31
2012 2013Kerala Tamilnad Mercantile Bank Ltd 8 9
The Dhanlaxmi Bank Ltd 161 161UCO Bank 34 37Union Bank Of India 208 221United Bank Of India 7 8Vijaya Bank 92 93Yes Bank Ltd. 2 4Total of Kerala 5096 5452
Lakshadweep State Bank Of India 2 2Syndicate Bank 9 9UCO Bank 1 1Total of Lakshadweep 12 12
MadhyaPradesh
Allahabad Bank 172 178Andhra Bank 14 17Axis Bank 74 84Bank Of Baroda 124 150Bank Of India 358 380Bank Of Maharashtra 128 136Canara Bank 63 66Catholic Syrian Bank Ltd - 1Central Bank Of India 423 443Central Madhya Pradesh Gramin Bank - 432Citibank N.A 2 2City Union Bank Limited 1 1Corporation Bank 31 40Dena Bank 47 53Development Credit Bank Ltd. 1 3Federal Bank Ltd 3 3HDFC Bank 78 80HSBC 1 1ICICI Bank 105 129IDBI Bank Limited 33 34Indian Bank 23 25Indian Overseas Bank 37 51IndusInd Bank Ltd 16 29ING Vysya Bank Ltd 3 3Jammu & Kashmir Bank Ltd 2 2Jhabua-Dhar Kshetriya Gramin Bank 90 -Karnataka Bank Ltd 4 5Karur Vysya Bank Ltd 3 3Kotak Mahindra Bank Ltd. 4 9Lakshmi Vilas Bank Ltd 1 1Madhya Bharat Gramin Bank 233 -Madhyanchal Gramin Bank - 402Mahakaushal Kshetriya Gramin Bank 44 -Narmada Jhabua Gramin Bank - 319Narmada Malwa Gramin Bank 227 -Oriental Bank Of Commerce 56 62Punjab And Sind Bank 28 30Punjab National Bank 269 272Ratnakar Bank Ltd - 3
STATE/UNIONTERRITORY
BANK NAMEAs on March 31
2012 2013MadhyaPradesh
Rewa-Sidhi Gramin Bank 102 -Satpura Narmada Kshetriya Gramin Bank 355 -Sharda Gramin Bank 63 -South Indian Bank Ltd 2 2Standard Chartered Bank 2 3State Bank Of Bikaner And Jaipur 8 8State Bank Of Hyderabad 4 4State Bank Of India 1079 1104State Bank Of Mysore 2 2State Bank Of Patiala 6 6State Bank Of Travancore 2 2Syndicate Bank 65 69Tamilnad Mercantile Bank Ltd - 1The Dhanlaxmi Bank Ltd 1 1UCO Bank 133 145Union Bank Of India 234 255United Bank Of India 12 12Vidisha-Bhopal Kshetriya Gramin Bank 30 -Vijaya Bank 30 34Yes Bank Ltd. 8 8
Total of Madhya Pradesh 4836 5105
Maharashtra
Ab Bank Limited 1 1Abu Dhabi Commercial Bank Ltd 1 1Allahabad Bank 106 118Andhra Bank 69 71Antwerp Diamond Bank Nv 1 1Australia And New Zealand Banking Group Limited 1 1Axis Bank 232 262Bank Internasional Indonesia 1 1Bank Of America N.T. And S.A. 1 1Bank Of Bahrain & Kuwait B.S.C. 1 1Bank Of Baroda 448 480Bank Of India 775 814Bank Of Maharashtra 1046 1117Bank Of Nova Scotia 1 1Barclays Bank Plc 3 3BNP Paribas 3 3Canara Bank 278 279Catholic Syrian Bank Ltd 24 28Central Bank Of India 571 615Citibank N.A 12 12City Union Bank Limited 16 16Commonwealth Bank Of Australia 1 1Corporation Bank 152 160Credit Agricole 2 2Credit Suisse Ag 1 1DBS Bank Ltd. 4 4Dena Bank 263 283Deutsche Bank Ag 5 5Development Credit Bank Ltd. 46 45Federal Bank Ltd 87 94

335
TABLE B14 : COMMERCIAL BANKS AND THEIR OFFICES IN STATES AND UNION TERRITORIES - 2012 AND 2013
(contd.)STATE/UNIONTERRITORY
BANK NAMEAs on March 31
2012 2013Maharashtra Firstrand Bank Ltd 1 1
HDFC Bank 329 369HSBC 14 14HSBC Bank Oman S.A.O.G. 1 1ICICI Bank 496 536IDBI Bank Limited 280 289Indian Bank 108 116Indian Overseas Bank 145 177IndusInd Bank Ltd 51 61Industrial and Commercial Bank Of China 1 1ING Vysya Bank Ltd 53 53Jammu & Kashmir Bank Ltd 16 16JP Morgan Chase Bank 1 1Karnataka Bank Ltd 40 41Karur Vysya Bank Ltd 24 28Kotak Mahindra Bank Ltd. 88 109Krung Thai Bank Public Company Limited 1 1Lakshmi Vilas Bank Ltd 15 15Maharashtra Gramin Bank 348 360Mashreq Bank Psc 1 1Mizuho Corporate Bank Ltd 1 1National Australia Bank 1 1Oriental Bank Of Commerce 132 142Punjab And Sind Bank 30 31Punjab National Bank 199 204Rabobank International 1 1Ratnakar Bank Ltd 81 87Shinhan Bank 1 1Societe Generale 1 1South Indian Bank Ltd 27 28Standard Chartered Bank 22 22State Bank Of Bikaner & Jaipur 27 28State Bank Of Hyderabad 254 256State Bank Of India 1296 1337State Bank Of Mauritius Ltd 1 1State Bank Of Mysore 29 29State Bank Of Patiala 30 39State Bank Of Travancore 25 32Subhadra Local Area Bank Ltd. 4 4Syndicate Bank 190 198Tamilnad Mercantile Bank Ltd 13 18The Bank Of Tokyo-Mitsubishi Ufj Ltd 1 1The Dhanlaxmi Bank Ltd 26 26The Royal Bank Of Scotland N.V. 6 6UBS Ag 1 1UCO Bank 161 168Union Bank Of India 460 496United Bank Of India 42 45United Overseas Bank Ltd 1 1Vidharbha Konkan Gramin Bank - 299Vidharbha Kshetriya Gramin Bank 101 -
STATE/UNIONTERRITORY
BANK NAMEAs on March 31
2012 2013Maharashtra Vijaya Bank 116 119
Wainganga Krishna Gramin Bank 194 -Westpac Banking Corporation - 1Yes Bank Ltd. 65 79Total of Maharashtra 9704 10314
Manipur Allahabad Bank 1 1Axis Bank 2 4Bank Of Baroda 3 3Bank Of India 1 2Bank Of Maharashtra - 1Canara Bank - 1Central Bank Of India 4 5HDFC Bank 3 3ICICI Bank 2 5IDBI Bank Limited - 1Indian Overseas Bank 1 2Manipur Rural Bank 28 28Punjab And Sind Bank 2 4Punjab National Bank 2 2State Bank Of India 28 29UCO Bank 2 4United Bank Of India 16 16Vijaya Bank 3 4Total of Manipur 98 115
Meghalaya Allahabad Bank 2 2Andhra Bank 1 1Axis Bank 4 4Bank Of Baroda 3 5Bank Of India 3 4Bank Of Maharashtra 1 1Canara Bank 3 4Central Bank Of India 6 9Corporation Bank 1 1Dena Bank 1 1Federal Bank Ltd 2 2HDFC Bank 9 13ICICI Bank 3 4IDBI Bank Limited 1 2Indian Bank 2 2Indian Overseas Bank 1 1IndusInd Bank Ltd - 1Kotak Mahindra Bank Ltd. 1 1Megalaya Rural Bank 55 55Oriental Bank Of Commerce 1 1Punjab And Sind Bank - 1Punjab National Bank 9 9South Indian Bank Ltd 1 1State Bank Of India 96 96Syndicate Bank 5 5UCO Bank 5 5

336
TABLE B14 : COMMERCIAL BANKS AND THEIR OFFICES IN STATES AND UNION TERRITORIES - 2012 AND 2013
(contd.)STATE/UNIONTERRITORY
BANK NAMEAs on March 31
2012 2013Meghalaya Union Bank Of India 5 5
United Bank Of India 14 15Vijaya Bank 4 4Yes Bank Ltd. 1 1
Total of Meghalaya 240 256
Mizoram Axis Bank 1 1Bank Of Baroda 1 1Bank Of India 1 2Bank Of Maharashtra 1 1Canara Bank 1 1Central Bank Of India 1 2Federal Bank Ltd 1 1HDFC Bank 4 6ICICI Bank 1 1IDBI Bank Limited 1 1Indian Overseas Bank - 1IndusInd Bank Ltd 1 1Mizoram Rural Bank 62 64Punjab And Sind Bank - 1Punjab National Bank 1 1South Indian Bank Ltd - 1State Bank Of India 32 32Syndicate Bank 1 1UCO Bank 1 2Union Bank Of India - 1United Bank Of India 2 2Vijaya Bank 2 2Yes Bank Ltd. 1 1
Total of Mizoram 116 127
Nagaland Allahabad Bank 4 4Axis Bank 4 6Bank Of Baroda 4 5Bank Of India 1 2Bank Of Maharashtra - 1Canara Bank 1 1Central Bank Of India 2 5Federal Bank Ltd 1 2HDFC Bank 3 3ICICI Bank 4 6IDBI Bank Limited 2 3Indian Bank 1 1IndusInd Bank Ltd - 1Nagaland Rural Bank 10 10Punjab And Sind Bank 1 1Punjab National Bank 1 1South Indian Bank Ltd 1 1State Bank Of India 56 58Syndicate Bank 1 1UCO Bank 3 4
STATE/UNIONTERRITORY
BANK NAMEAs on March 31
2012 2013Nagaland Union Bank Of India 1 1
United Bank Of India 2 2Vijaya Bank 5 5Total of Nagaland 108 124
NCT of Delhi Allahabad Bank 72 85American Express Banking Corp. 1 1Andhra Bank 43 44Axis Bank 91 101Bank Of America N.T. And S.A. 1 1Bank Of Baroda 115 121Bank Of India 91 93Bank Of Maharashtra 35 37Bank Of Nova Scotia 1 1Barclays Bank Plc 1 1BNP Paribas 1 1Canara Bank 132 135Catholic Syrian Bank Ltd 6 6Central Bank Of India 112 114Chinatrust Commercial Bank 1 1Citibank N.A 5 5City Union Bank Limited 4 6Corporation Bank 79 88Credit Agricole 1 1DBS Bank Ltd. 1 1Dena Bank 39 46Deutsche Bank Ag 1 1Development Credit Bank Ltd. 7 7Federal Bank Ltd 24 24HDFC Bank 178 179HSBC 5 5ICICI Bank 143 149IDBI Bank Limited 31 35Indian Bank 51 58Indian Overseas Bank 85 88IndusInd Bank Ltd 27 27ING Vysya Bank Ltd 23 23Jammu & Kashmir Bank Ltd 25 25JSC VTB Bank 1 1Karnataka Bank Ltd 20 21Karur Vysya Bank Ltd 12 15Kotak Mahindra Bank Ltd. 46 49Lakshmi Vilas Bank Ltd 4 4Mizuho Corporate Bank Ltd 1 1Nainital Bank Ltd 14 15Oriental Bank Of Commerce 112 127Punjab And Sind Bank 105 108Punjab National Bank 229 233Ratnakar Bank Ltd 2 2Sberbank 1 1Shinhan Bank 1 1

337
TABLE B14 : COMMERCIAL BANKS AND THEIR OFFICES IN STATES AND UNION TERRITORIES - 2012 AND 2013 (contd.)
STATE/UNIONTERRITORY
BANK NAMEAs on March 31
2012 2013NCT of Delhi Societe Generale 1 1
South Indian Bank Ltd 22 26Standard Chartered Bank 16 16State Bank Of Bikaner & Jaipur 35 35State Bank Of Hyderabad 26 26State Bank Of India 312 331State Bank Of Mysore 18 18State Bank Of Patiala 55 56State Bank Of Travancore 16 18Sumitomo Mitsui Banking Corp. - 1Syndicate Bank 136 142Tamilnad Mercantile Bank Ltd 3 3The Bank Of Tokyo-Mitsubishi Ufj Ltd 1 1The Dhanlaxmi Bank Ltd 9 9The Royal Bank Of Scotland N.V. 4 4UCO Bank 60 62Union Bank Of India 81 91United Bank Of India 36 36Vijaya Bank 47 48Yes Bank Ltd. 35 45Total of Nct of Delhi 2893 3057
Odisha Allahabad Bank 76 78Andhra Bank 118 127Axis Bank 60 72Baitarani Gramya Bank 112 -Bank Of Baroda 74 93Bank Of India 175 191Bank Of Maharashtra 3 5Canara Bank 81 83Catholic Syrian Bank Ltd 1 1Central Bank Of India 85 98Citibank N.A 1 1City Union Bank Limited 1 1Corporation Bank 13 16Dena Bank 8 12Development Credit Bank Ltd. 1 3Federal Bank Ltd 7 11HDFC Bank 59 70ICICI Bank 52 69IDBI Bank Limited 32 33Indian Bank 70 73Indian Overseas Bank 112 119IndusInd Bank Ltd 20 22ING Vysya Bank Ltd 7 7Kalinga Gramya Bank 186 -Karnataka Bank Ltd 6 7Karur Vysya Bank Ltd 4 5Kotak Mahindra Bank Ltd. 6 7Lakshmi Vilas Bank Ltd 1 1Neelachal Gramya Bank 178 -Odisha Gramya Bank - 484
STATE/UNIONTERRITORY
BANK NAMEAs on March 31
2012 2013Odisha Oriental Bank Of Commerce 36 44
Punjab And Sind Bank 5 6Punjab National Bank 117 132Rushikulya Gramya Bank 93 -South Indian Bank Ltd 2 2Standard Chartered Bank 1 1State Bank Of Bikaner And Jaipur 3 3State Bank Of Hyderabad 10 10State Bank Of India 703 735State Bank Of Mysore 1 1State Bank Of Patiala - 1State Bank Of Travancore 1 1Syndicate Bank 65 71Tamilnad Mercantile Bank Ltd 1 1UCO Bank 209 217Union Bank Of India 84 87United Bank Of India 121 129Utkal Grameen Bank - 426Utkal Gramya Bank 333 -Vijaya Bank 9 9Yes Bank Ltd. 3 3
Total of Odisha 3346 3568
Puducherry Allahabad Bank 1 1Andhra Bank 3 3Axis Bank 2 2Bank Of Baroda 1 2Bank Of India 5 5Bank Of Maharashtra 1 1Canara Bank 5 8Catholic Syrian Bank Ltd 1 1Central Bank Of India 3 3Citibank N.A 1 1City Union Bank Limited 2 2Corporation Bank 2 2Dena Bank 1 1Federal Bank Ltd 2 2HDFC Bank 4 4ICICI Bank 5 5IDBI Bank Limited 1 1Indian Bank 27 29Indian Overseas Bank 16 19IndusInd Bank Ltd 1 1ING Vysya Bank Ltd 1 1Karnataka Bank Ltd 1 1Karur Vysya Bank Ltd 3 5Kotak Mahindra Bank Ltd. 1 1Lakshmi Vilas Bank Ltd 3 3Oriental Bank Of Commerce 1 2Puduvai Bharathiar Grama Bank 28 29Punjab National Bank 2 2South Indian Bank Ltd 2 2State Bank Of Hyderabad 1 1State Bank Of India 23 25

338
TABLE B14 : COMMERCIAL BANKS AND THEIR OFFICES IN STATES AND UNION TERRITORIES - 2012 AND 2013
(contd.)STATE/UNIONTERRITORY
BANK NAMEAs on March 31
2012 2013Puducherry State Bank Of Mysore 1 1
State Bank Of Travancore 2 2Syndicate Bank 4 4Tamilnad Mercantile Bank Ltd 2 2UCO Bank 7 7Union Bank Of India 3 3United Bank Of India 1 2Vijaya Bank 2 2Total of Puducherry 172 188
Punjab Allahabad Bank 99 120Andhra Bank 19 29Axis Bank 100 151Bank Of Baroda 78 83Bank Of India 129 138Bank Of Maharashtra 25 27Canara Bank 140 143Capital Local Area Bank Ltd. 25 30Catholic Syrian Bank Ltd 3 3Central Bank Of India 120 127Citibank N.A 2 2City Union Bank Limited 2 3Corporation Bank 41 56Dena Bank 22 23Deutsche Bank Ag 1 1Development Credit Bank Ltd. - 1Federal Bank Ltd 16 26HDFC Bank 219 326HSBC 1 1ICICI Bank 107 113IDBI Bank Limited 43 45Indian Bank 45 49Indian Overseas Bank 93 99IndusInd Bank Ltd 25 31ING Vysya Bank Ltd 13 23Jammu & Kashmir Bank Ltd 16 16Karnataka Bank Ltd 4 4Karur Vysya Bank Ltd 5 7Kotak Mahindra Bank Ltd. 16 19Malwa Gramin Bank 54 54Oriental Bank Of Commerce 329 366Punjab And Sind Bank 445 481Punjab Gramin Bank 203 222Punjab National Bank 655 674South Indian Bank Ltd 4 4Standard Chartered Bank 3 3State Bank Of Bikaner & Jaipur 10 12State Bank Of Hyderabad 7 7State Bank Of India 401 427State Bank Of Patiala 505 526State Bank Of Travancore - 3
STATE/UNIONTERRITORY
BANK NAMEAs on March 31
2012 2013Punjab Sutlej Gramin Bank 31 31
Syndicate Bank 35 36Tamilnad Mercantile Bank Ltd 1 1The Dhanlaxmi Bank Ltd 1 1The Royal Bank Of Scotland N.V. 1 1UCO Bank 131 138Union Bank Of India 113 135United Bank Of India 11 11Vijaya Bank 29 31Yes Bank Ltd. 40 45Total of Punjab 4418 4905
Rajasthan Allahabad Bank 65 67Andhra Bank 14 20Axis Bank 80 87Bank Of Baroda 442 491Bank Of India 87 101Bank Of Maharashtra 29 32Baroda Rajasthan Gramin Bank 283 -Baroda Rajasthan Kshetriya Gramin Bank - 648Canara Bank 78 82Catholic Syrian Bank Ltd 2 3Central Bank Of India 153 161Citibank N.A 1 1City Union Bank Limited 2 2Corporation Bank 35 42Dena Bank 25 29Development Credit Bank Ltd. 3 3Federal Bank Ltd 7 7Hadoti Kshetriya Gramin Bank 89 -HDFC Bank 95 100HSBC 2 2ICICI Bank 378 400IDBI Bank Limited 39 40Indian Bank 20 22Indian Overseas Bank 57 58IndusInd Bank Ltd 20 34ING Vysya Bank Ltd 4 4Jaipur Thar Gramin Bank 222 -Jammu & Kashmir Bank Ltd 1 1Karnataka Bank Ltd 3 3Karur Vysya Bank Ltd 2 2Kotak Mahindra Bank Ltd. 20 30Lakshmi Vilas Bank Ltd 1 1Marudhara Gramin Bank - 467Marwar Ganganagar Bikaner Gramin Bank 226 -Mewar Aanchalik Gramin Bank 60 60Nainital Bank Ltd 1 2Oriental Bank Of Commerce 145 167Punjab And Sind Bank 34 38Punjab National Bank 397 414

339
TABLE B14 : COMMERCIAL BANKS AND THEIR OFFICES IN STATES AND UNION TERRITORIES - 2012 AND 2013
(contd.)STATE/UNIONTERRITORY
BANK NAMEAs on March 31
2012 2013Rajasthan Rajasthan Gramin Bank 240 -
Ratnakar Bank Ltd - 2South Indian Bank Ltd 2 2Standard Chartered Bank 1 3State Bank Of Bikaner & Jaipur 857 923State Bank Of Hyderabad 3 4State Bank Of India 327 360State Bank Of Mysore 1 1State Bank Of Patiala 36 39State Bank Of Travancore 2 3Syndicate Bank 49 61Tamilnad Mercantile Bank Ltd 2 2The Bank Of Tokyo-Mitsubishi Ufj Ltd - 1The Dhanlaxmi Bank Ltd 2 2The Royal Bank Of Scotland N.V. 2 2UCO Bank 169 191Union Bank Of India 84 99United Bank Of India 12 17Vijaya Bank 22 23Yes Bank Ltd. 25 33
Total of Rajasthan 4958 5389
Sikkim Allahabad Bank 1 1Andhra Bank 1 1Axis Bank 3 3Bank Of Baroda 1 1Bank Of India 1 1Bank Of Maharashtra 1 1Canara Bank 4 4Central Bank Of India 15 16Corporation Bank 1 1Dena Bank 1 2HDFC Bank 4 4ICICI Bank 2 3IDBI Bank Limited 2 3Indian Bank 1 1Indian Overseas Bank 1 2IndusInd Bank Ltd 1 2Oriental Bank Of Commerce 2 2Punjab National Bank 1 1State Bank Of India 32 32Syndicate Bank 1 1UCO Bank 4 4Union Bank Of India 7 8United Bank Of India 2 2Vijaya Bank 1 1Yes Bank Ltd. 1 1
Total of Sikkim 91 98
TamilNadu
Allahabad Bank 54 56Andhra Bank 85 94
STATE/UNIONTERRITORY
BANK NAMEAs on March 31
2012 2013TamilNadu
Axis Bank 167 180Bank Of America N.T. And S.A. 1 1Bank Of Baroda 162 172Bank Of Ceylon 1 1Bank Of India 191 201Bank Of Maharashtra 30 31Bank Of Nova Scotia 1 1Barclays Bank Plc 1 1BNP Paribas 1 1Canara Bank 618 648Catholic Syrian Bank Ltd 57 60Central Bank Of India 206 211Chinatrust Commercial Bank - 1Citibank N.A 3 3City Union Bank Limited 200 251Corporation Bank 159 165Credit Agricole 1 1DBS Bank Ltd. 3 3Dena Bank 29 32Deutsche Bank Ag 3 3Development Credit Bank Ltd. 6 6Federal Bank Ltd 85 124HDFC Bank 180 183HSBC 3 3ICICI Bank 289 325IDBI Bank Limited 65 74Indian Bank 822 870Indian Overseas Bank 1047 1087IndusInd Bank Ltd 40 40Ing Vysya Bank Ltd 42 42Jammu & Kashmir Bank Ltd 4 4Karnataka Bank Ltd 36 37Karur Vysya Bank Ltd 247 300Kotak Mahindra Bank Ltd. 21 26Lakshmi Vilas Bank Ltd 189 190Oriental Bank Of Commerce 48 52Pallavan Grama Bank 132 147Pandyan Grama Bank 217 219Punjab And Sind Bank 12 12Punjab National Bank 148 155Ratnakar Bank Ltd - 1Shinhan Bank 1 1South Indian Bank Ltd 122 131Standard Chartered Bank 7 7State Bank Of Bikaner & Jaipur 7 7State Bank Of Hyderabad 33 38State Bank Of India 881 916State Bank Of Mauritius Ltd 1 1State Bank Of Mysore 45 45State Bank Of Patiala 15 16

340
TABLE B14 : COMMERCIAL BANKS AND THEIR OFFICES IN STATES AND UNION TERRITORIES - 2012 AND 2013
(contd.)STATE/UNIONTERRITORY
BANK NAMEAs on March 31
2012 2013TamilNadu
State Bank Of Travancore 108 129Syndicate Bank 192 211Tamilnad Mercantile Bank Ltd 233 266The Bank Of Tokyo-Mitsubishi Ufj Ltd 1 1The Dhanlaxmi Bank Ltd 39 39The Royal Bank Of Scotland N.V. 3 3UCO Bank 95 108Union Bank Of India 207 215United Bank Of India 24 25Vijaya Bank 85 96Woori Bank 1 1Yes Bank Ltd. 8 11Total of Tamil Nadu 7714 8281
Tripura Allahabad Bank 1 2Andhra Bank 1 1Axis Bank 4 5Bank Of Baroda 3 3Bank Of India 4 6Bank Of Maharashtra 1 1Canara Bank 5 7Central Bank Of India 4 6Corporation Bank 1 1Federal Bank Ltd - 1HDFC Bank 3 3ICICI Bank 5 5IDBI Bank Limited 1 2Indian Bank 2 3Indian Overseas Bank 3 4IndusInd Bank Ltd 2 2Kotak Mahindra Bank Ltd. - 1Oriental Bank Of Commerce 1 1Punjab And Sind Bank 1 2Punjab National Bank 1 2South Indian Bank Ltd 1 1State Bank Of India 45 49Syndicate Bank 1 3Tripura Gramin Bank 116 116UCO Bank 12 13Union Bank Of India 6 7United Bank Of India 51 53Vijaya Bank 2 2Yes Bank Ltd. 1 1Total of Tripura 278 303
UttarPradesh
Allahabad Bank 764 818Allahabad UP Gramin Bank 545 555Andhra Bank 38 60Aryavart Gramin Bank 340 -
Aryavrat Kshetriya Gramin Bank -
STATE/UNIONTERRITORY
BANK NAMEAs on March 31
2012 2013UttarPradesh
Axis Bank 100 119Ballia-Etawah Gramin Bank 142 146Bank Of Baroda 787 868Bank Of India 382 414Bank Of Maharashtra 47 56Baroda Uttar Pradesh Gramin Bank 725 745Canara Bank 309 324Catholic Syrian Bank Ltd 2 4Central Bank Of India 533 565Citibank N.A 2 2City Union Bank Limited 2 2Corporation Bank 106 129Dbs Bank Ltd. 1 1Dena Bank 53 56Deutsche Bank Ag 2 2Development Credit Bank Ltd. - 1Federal Bank Ltd 12 14HDFC Bank 211 238HSBC 2 2ICICI Bank 174 178IDBI Bank Limited 59 66Indian Bank 80 90Indian Overseas Bank 160 190IndusInd Bank Ltd 22 39ING Vysya Bank Ltd 22 22Jammu & Kashmir Bank Ltd 13 13Karnataka Bank Ltd 9 9Karur Vysya Bank Ltd 5 6Kashi Gomti Samyut Gramin Bank 385 411Kotak Mahindra Bank Ltd. 16 19Kshetriya Kisan Gramin Bank,Mainpuri 63 -Lakshmi Vilas Bank Ltd 2 2Nainital Bank Ltd 25 26Oriental Bank Of Commerce 309 338Prathama Bank 248 250Punjab And Sind Bank 150 162Punjab National Bank 1146 1180Purvanchal Gramin Bank 395 434Ratnakar Bank Ltd - 1Sarva U.P. Gramin Bank 325 326Shreyas Gramin Bank 228 250South Indian Bank Ltd 9 9Standard Chartered Bank 6 7State Bank Of Bikaner & Jaipur 23 24State Bank Of Hyderabad 9 9State Bank Of India 1845 1931State Bank Of Mysore 2 2State Bank Of Patiala 65 67State Bank Of Travancore 5 7Syndicate Bank 360 403Tamilnad Mercantile Bank Ltd 1 1413
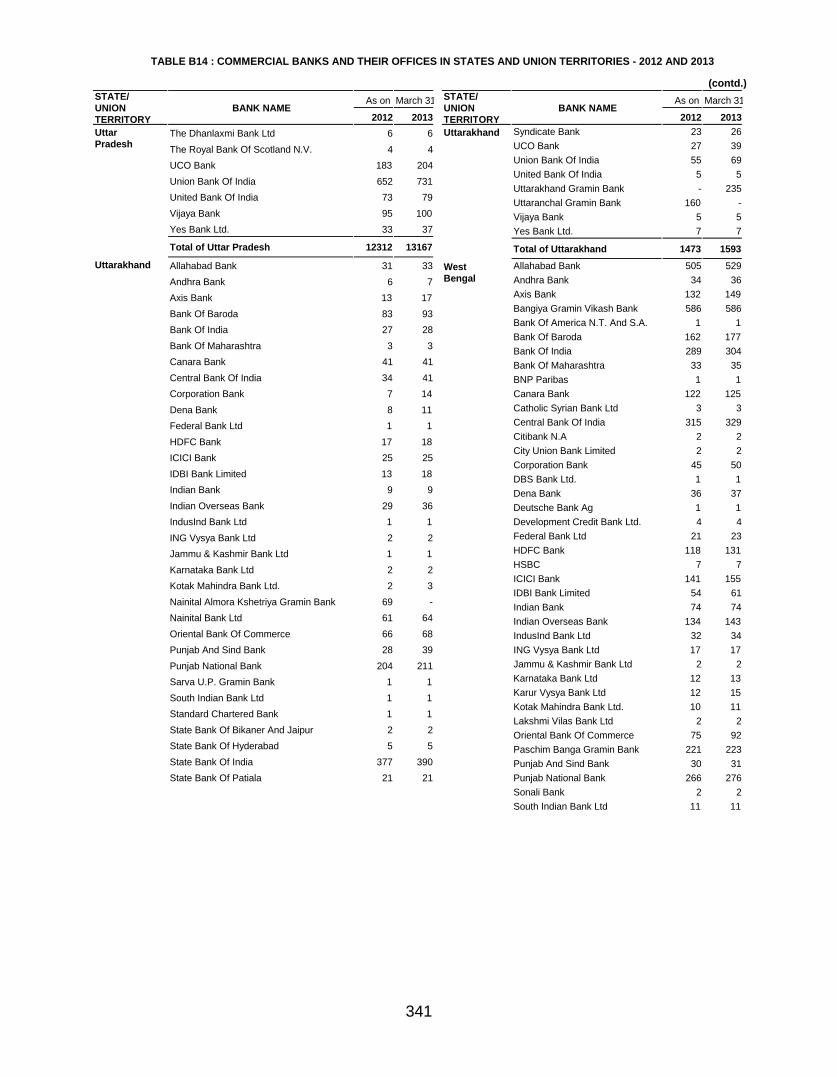
341
TABLE B14 : COMMERCIAL BANKS AND THEIR OFFICES IN STATES AND UNION TERRITORIES - 2012 AND 2013
(contd.)STATE/UNIONTERRITORY
BANK NAMEAs on March 31
2012 2013Uttarakhand Syndicate Bank 23 26
UCO Bank 27 39Union Bank Of India 55 69United Bank Of India 5 5Uttarakhand Gramin Bank - 235Uttaranchal Gramin Bank 160 -Vijaya Bank 5 5Yes Bank Ltd. 7 7
Total of Uttarakhand 1473 1593
WestBengal
Allahabad Bank 505 529Andhra Bank 34 36Axis Bank 132 149Bangiya Gramin Vikash Bank 586 586Bank Of America N.T. And S.A. 1 1Bank Of Baroda 162 177Bank Of India 289 304Bank Of Maharashtra 33 35BNP Paribas 1 1Canara Bank 122 125Catholic Syrian Bank Ltd 3 3Central Bank Of India 315 329Citibank N.A 2 2City Union Bank Limited 2 2Corporation Bank 45 50DBS Bank Ltd. 1 1Dena Bank 36 37Deutsche Bank Ag 1 1Development Credit Bank Ltd. 4 4Federal Bank Ltd 21 23HDFC Bank 118 131HSBC 7 7ICICI Bank 141 155IDBI Bank Limited 54 61Indian Bank 74 74Indian Overseas Bank 134 143IndusInd Bank Ltd 32 34ING Vysya Bank Ltd 17 17Jammu & Kashmir Bank Ltd 2 2Karnataka Bank Ltd 12 13Karur Vysya Bank Ltd 12 15Kotak Mahindra Bank Ltd. 10 11Lakshmi Vilas Bank Ltd 2 2Oriental Bank Of Commerce 75 92Paschim Banga Gramin Bank 221 223Punjab And Sind Bank 30 31Punjab National Bank 266 276Sonali Bank 2 2South Indian Bank Ltd 11 11
STATE/UNIONTERRITORY
BANK NAMEAs on March 31
2012 2013UttarPradesh
The Dhanlaxmi Bank Ltd 6 6The Royal Bank Of Scotland N.V. 4 4UCO Bank 183 204Union Bank Of India 652 731United Bank Of India 73 79Vijaya Bank 95 100Yes Bank Ltd. 33 37
Total of Uttar Pradesh 12312 13167
Uttarakhand Allahabad Bank 31 33Andhra Bank 6 7Axis Bank 13 17Bank Of Baroda 83 93Bank Of India 27 28Bank Of Maharashtra 3 3Canara Bank 41 41Central Bank Of India 34 41Corporation Bank 7 14Dena Bank 8 11Federal Bank Ltd 1 1HDFC Bank 17 18ICICI Bank 25 25IDBI Bank Limited 13 18Indian Bank 9 9Indian Overseas Bank 29 36IndusInd Bank Ltd 1 1ING Vysya Bank Ltd 2 2Jammu & Kashmir Bank Ltd 1 1Karnataka Bank Ltd 2 2Kotak Mahindra Bank Ltd. 2 3Nainital Almora Kshetriya Gramin Bank 69 -
Nainital Bank Ltd 61 64Oriental Bank Of Commerce 66 68Punjab And Sind Bank 28 39Punjab National Bank 204 211Sarva U.P. Gramin Bank 1 1South Indian Bank Ltd 1 1Standard Chartered Bank 1 1State Bank Of Bikaner And Jaipur 2 2State Bank Of Hyderabad 5 5State Bank Of India 377 390State Bank Of Patiala 21 21

342
TABLE B14 : COMMERCIAL BANKS AND THEIR OFFICES IN STATES AND UNION TERRITORIES - 2012 AND 2013 (concld.)STATE/UNIONTERRITORY
BANK NAMEAs on March 31
2012 2013WestBengal
Standard Chartered Bank 17 17State Bank Of Bikaner & Jaipur 17 17State Bank Of Hyderabad 9 9State Bank Of India 1008 1064State Bank Of Mysore 11 11State Bank Of Patiala 3 3State Bank Of Travancore 6 6Syndicate Bank 95 99Tamilnad Mercantile Bank Ltd 1 1The Dhanlaxmi Bank Ltd 6 6The Royal Bank Of Scotland N.V. 3 3UCO Bank 350 363Union Bank Of India 142 154United Bank Of India 781 785Uttar Banga Kshetriya Gramin Bank 123 123Vijaya Bank 46 47Yes Bank Ltd. 7 10Total of West Bengal 6140 6413Grand Total 102377 109811
Note : 1. Data are as per information reported by banks.2. Data on number of offices include administrative offices.
: Master Office File System, DSIM, RBI updated as on October 05,2013.Source

343
TABLE B15 : BANK-WISE AND CATEGORY-WISE EMPLOYEES OF SCHEDULED COMMERCIAL BANKS - 2012 AND 2013
Bank NameOfficers Clerks Sub-staff Total
2012 2013 2012 2013 2012 2013 2012 2013(1) (2) (3) (4) (5) (6) (7) (8)
State Bank of India 80404 80796 95715 109686 39362 37814 215481 228296State Bank of Bikaner & Jaipur 4684 5396 5027 4439 3155 2996 12866 12831State Bank of Hyderabad 6085 7142 6453 5670 2505 2278 15043 15090State Bank of Mysore 3187 3661 4914 4899 2148 2224 10249 10784State Bank of Patiala 4915 5678 6017 5630 2641 3131 13573 14439State Bank of Travancore 4460 5093 5969 5351 2168 2081 12597 12525Total of SBI & its Associates 103735 107766 124095 135675 51979 50524 279809 293965Allahabad Bank 9682 11407 8279 6829 4373 4321 22334 22557Andhra Bank 8209 8487 3903 4854 2987 3182 15099 16523Bank of Baroda 16953 17933 16448 16869 8046 8306 41447 43108Bank of India 16849 17127 16833 17332 7855 7889 41537 42348Bank of Maharashtra 5179 4988 6090 6057 2534 2548 13803 13593Canara Bank 17419 17835 15802 16095 9051 8763 42272 42693Central Bank of India 12375 14043 15167 13475 8359 9595 35901 37113Corporation Bank 6208 6741 5687 6053 1918 2025 13813 14819Dena Bank 4501 4585 3776 4398 1925 2110 10202 11093IDBI Bank Ltd. 12991 13124 1333 1269 1111 1072 15435 15465Indian Bank 7877 8476 8454 8159 2379 2158 18710 18793Indian Overseas Bank 11083 11895 11559 11937 4559 4448 27201 28280Oriental Bank of Commerce 9440 9905 5949 5601 2982 3385 18371 18891Punjab and Sind Bank 5587 5932 1460 1640 994 961 8041 8533Punjab National Bank 22933 23610 25380 25449 13814 14233 62127 63292Syndicate Bank 10829 10394 10221 10360 5854 5852 26904 26606UCO Bank 9059 10821 9171 8768 4917 4520 23147 24109Union Bank of India 14806 16405 9444 9399 6588 5994 30838 31798United Bank of India 6305 6445 6228 6056 2967 2978 15500 15479Vijaya Bank 5258 5652 4051 4255 2529 2694 11838 12601Total of Nationalised banks $ 213543 225805 185235 184855 95742 97034 494520 507694Total of Public Sector Banks 317278 333571 309330 320530 147721 147558 774329 801659Catholic Syrian Bank 1324 1523 1146 1126 181 168 2651 2817City Union Bank 1053 1290 1906 2124 388 371 3347 3785Dhanlaxmi Bank 2773 1942 636 603 59 56 3468 2601Federal Bank 4864 5664 2642 2986 1239 1409 8745 10059ING Vysya Bank 7584 7443 1463 1371 595 567 9642 9381Jammu & Kashmir Bank 4888 5118 2959 2540 1411 1742 9258 9400Karnataka Bank 2177 2300 2637 2728 1273 1311 6087 6339Karur Vysya Bank 2595 3392 2383 2620 695 718 5673 6730Lakshmi Vilas Bank 1288 1321 1375 1252 391 576 3054 3149Nainital Bank 365 346 281 282 205 202 851 830Ratnakar Bank 947 1517 251 222 130 120 1328 1859South Indian Bank 2678 2981 2395 2567 557 539 5630 6087Tamilnad Mercantile Bank 1020 1127 1399 1566 436 478 2855 3171Total of Old Private Sector banks 33556 35964 21473 21987 7560 8257 62589 66208Axis Bank 31738 37901 - - - - 31738 37901Development Credit Bank 1991 2150 31 39 31 31 2053 2220HDFC Bank 65760 69098 154 150 162 153 66076 69401ICICI Bank 25503 28078 32535 33732 238 255 58276 62065IndusInd Bank 9370 11502 - - - - 9370 11502Kotak Mahindra Bank 12532 13612 - - 8 8 12540 13620
Note : $ includes IDBI Bank Ltd.Source : Respective Banks.

344
TABLE B15 : BANK-WISE AND CATEGORY-WISE EMPLOYEES OF SCHEDULED COMMERCIAL BANKS - 2012 AND 2013 (Concld.)
Bank NameOfficers Clerks Sub-staff Total
2012 2013 2012 2013 2012 2013 2012 2013(1) (2) (3) (4) (5) (6) (7) (8)
Yes Bank 5642 7024 - - - - 5642 7024Total of New Private Sector Banks 152536 169365 32720 33921 439 447 185695 203733Total of Private Sector Banks 186092 205329 54193 55908 7999 8704 248284 269941AB Bank 2 2 - - 25 30 27 32Abu Dhabi Commercial Bank 45 49 - - 2 2 47 51American Express Banking Corp. 623 648 - - - - 623 648Antwerp Diamond Bank 23 27 - - 1 1 24 28Australia and New Zealand Banking Group 76 79 - - - - 76 79Bank Internasional Indonesia - 9 - - - - - 9Bank of America 364 379 18 16 - - 382 395Bank of Bahrain & Kuwait 89 86 9 9 - - 98 95Bank of Ceylon 14 13 16 15 - - 30 28Bank of Nova Scotia 187 187 - - 8 8 195 195Bank of Tokyo-Mitsubishi UFJ 248 290 12 12 13 13 273 315Barclays Bank 610 391 - - - - 610 391BNP Paribas 321 312 8 8 13 13 342 333Chinatrust Commercial Bank 32 39 - - 2 3 34 42Citibank 4858 5080 297 301 21 21 5176 5402Commonwealth Bank of Australia 27 29 - - - - 27 29Credit Agricole 88 77 - - 18 15 106 92Credit Suisse AG 32 34 - - - - 32 34DBS Bank 786 823 - - - - 786 823Deutsche Bank 1351 1675 - - - - 1351 1675FirstRand Bank 77 88 - - - - 77 88Hongkong & Shanghai Banking Corporation 4334 3914 643 626 189 186 5166 4726HSBC Bank Oman S.A.O.G. 19 19 19 14 - - 38 33Industrial and Commercial Bank of China 15 25 - - - - 15 25JPMorgan Chase Bank 174 177 82 66 - - 256 243JSC VTB Bank 18 19 - - 8 7 26 26Krung Thai Bank 10 10 - - - - 10 10Mashreqbank 14 12 - - - - 14 12Mizuho Corporate Bank 168 198 - - 6 6 174 204National Australia Bank 16 20 - - - - 16 20Rabobank International 43 55 - - - - 43 55Royal Bank of Scotland 1917 1521 12 11 22 22 1951 1554Sberbank 16 16 - - - - 16 16Shinhan Bank 72 86 - - 4 5 76 91Societe Generale 94 99 - - - - 94 99Sonali Bank 6 6 18 18 10 10 34 34Standard Chartered Bank 7145 6840 241 235 141 137 7527 7212State Bank of Mauritius 47 49 - - - - 47 49Sumitomo Mitsui Banking Corporation - 71 - - - - - 71UBS AG 58 58 - - - - 58 58United Overseas Bank 8 12 1 1 - - 9 13Westpac Banking Corporation - 24 - - - - - 24Woori Bank 20 24 - - 1 1 21 25Total of Foreign Banks 24047 23572 1376 1332 484 480 25907 25384Total of All Scheduled Commercial Banks 527417 562472 364899 377770 156204 156742 1048520 1096984
Note : $ includes IDBI Bank Ltd.Source : Respective Banks.

345
B16 : UNCLAIMED DEPOSITS WITH SCHEDULED COMMERCIAL BANKS - 2012
Bank Group / Bank
As on December 31Current Account Savings Account Fixed Deposits
No ofAccounts
AmountOutstanding
No ofAccounts
AmountOutstanding
No ofAccounts
AmountOutstanding
(1) (2) (3) (4) (5) (6)
PUBLIC SECTOR BANKS
A. SBI and its Associates
State Bank of India 49085 500 1250882 4650 24433 176
State Bank of Bikaner & Jaipur 1088 2 210669 743 10265 186
State Bank of Hyderabad 15037 25 59080 75 20393 120
State Bank of Mysore 4717 18 113334 267 19378 78
State Bank of Patiala 913 3 30870 88 306 2
State Bank of Travancore 12684 18 37084 22 14657 47
Total of SBI and its Associates 83524 566 1701919 5845 89432 609
B. Nationalised Banks
Allahabad Bank 11350 45 1331989 - 34870 495
Andhra Bank 2793 9 57133 96 22360 111
Bank of Baroda 4205 130 281229 1849 4288 28
Bank of India 11857 20 95435 95 5274 70
Bank of Maharashtra 2396 31 224807 261 6876 42
Canara Bank 22145 325 1681484 4248 30263 127
Central Bank of India 11750 29 218407 230 53872 231
Corporation Bank 22704 15 395976 42 42974 54
Dena Bank 3397 54 229909 763 30846 282
IDBI Bank Ltd. 2896 39 64349 248 4965 37
Indian Bank 4665 27 167616 100 10345 32
Indian Overseas Bank 80423 170 678656 1346 69266 108
Oriental Bank of Commerce 3972 111 139886 551 30086 745
Punjab and Sind Bank 3797 40 54313 133 3335 81
Punjab National Bank 6698 101 1138918 2854 899 24
Syndicate Bank 8344 24 94333 131 44285 83
UCO Bank 11131 34 71583 156 11570 92
Union Bank of India 17695 299 944893 2863 62427 639
United Bank of India 22351 21 238831 233 22097 24
Vijaya Bank 3374 11 71825 191 78463 201
Total of Nationalised Banks 257943 1534 8181572 16390 569361 3503
Total of Public Sector Banks 341467 2100 9883491 22235 658793 4112
Source : Department of Banking Operations and Development, RBI.
(Amount in ̀Million)

346
B16 : UNCLAIMED DEPOSITS WITH SCHEDULED COMMERCIAL BANKS - 2012 (Contd.)
(Amount in ` Million)
Bank Group / Bank
As on December 31
Other Deposits Total Unclaimed Deposits
No ofAccounts
AmountOutstanding
InterestCredited
IncidentalCharges
No ofAccounts
AmountOutstanding
(7) (8) (9) (10) (11) (12)
PUBLIC SECTOR BANKS
A. SBI and its Associates
State Bank of India 2019 7 57 1 1326419 5391
State Bank of Bikaner & Jaipur 919 10 13 - 222941 955
State Bank of Hyderabad - - 1 - 94510 220
State Bank of Mysore 12057 24 6 1 149486 392
State Bank of Patiala 630 - - - 32719 94
State Bank of Travancore 570 4 - - 64995 90
Total of SBI and its Associates 16195 45 78 2 1891070 7141
B. Nationalised Banks
Allahabad Bank 7146 8 - 2 1385355 547
Andhra Bank 59965 227 3 8 142251 439
Bank of Baroda 233 2 71 2 289955 2077
Bank of India 5421 11 2 - 117987 198
Bank of Maharashtra 2162 8 7 - 236241 349
Canara Bank 276655 557 - - 2010547 5258
Central Bank of India - - 2 1 284029 491
Corporation Bank 9332 4 - - 470986 115
Dena Bank - - - - 264152 1100
IDBI Bank Ltd. 79628 880 - - 151838 1203
Indian Bank 66751 411 - 2 249377 568
Indian Overseas Bank - - 54 23 828345 1654
Oriental Bank of Commerce - - 6 67 173944 1347
Punjab and Sind Bank 28852 161 1 - 90297 416
Punjab National Bank 1871 775 114 17 1148386 3852
Syndicate Bank 463525 528 - 21 610487 745
UCO Bank 4062 15 1 12 98346 285
Union Bank of India - - 107 8 1025015 3899
United Bank of India - - - - 283279 278
Vijaya Bank 5308 5 - 2 158970 406
Total of Nationalised Banks 1010911 3593 369 163 10019787 25226
Total of Public Sector Banks 1027106 3638 446 165 11910857 32367
Source : Department of Banking Operations and Development, RBI.Source

347
B16 : UNCLAIMED DEPOSITS WITH SCHEDULED COMMERCIAL BANKS - 2012 (Contd.)
Bank Group / Bank
As on December 31Current Account Savings Account Fixed Deposits
No ofAccounts
AmountOutstanding
No ofAccounts
AmountOutstanding
No ofAccounts
AmountOutstanding
(1) (2) (3) (4) (5) (6)
PRIVATE SECTOR BANKS
Axis Bank 107 3 2639 32 5 -
Catholic Syrian Bank 12622 2 159177 25 11691 19
City Union Bank 5122 6 54657 13 3564 8
Development Credit Bank 2279 28 14533 139 2003 31
Dhanlaxmi Bank 212 5 467 3 43 -
Federal Bank 3413 46 90402 383 3126 14
HDFC Bank 2475 47 8138 97 233 -
ICICI Bank 14970 154 204576 688 14413 161
IndusInd Bank 348 10 725 20 967 15
ING Vysya Bank 4399 41 102359 196 28977 172
Jammu & Kashmir Bank 3608 19 13565 25 2010 12
Karnataka Bank 1690 11 71040 141 4916 52
Karur Vysya Bank 6479 7 42157 15 15121 32
Kotak Mahindra Bank - - - - 383 4
Lakshmi Vilas Bank 570 6 10682 20 1508 22
Nainital Bank 572 1 11519 10 1274 2
Ratnakar Bank 1220 6 4607 13 879 14
South Indian Bank 703 9 16420 87 2545 11
Tamilnad Mercantile Bank 17963 47 200177 179 85386 26
Yes Bank - - - - - -
Total of Private Sector Banks 78752 447 1007840 2086 179044 596
Source : Department of Banking Operations and Development, RBI.
(Amount in ̀ Million)

348
B16 : UNCLAIMED DEPOSITS WITH SCHEDULED COMMERCIAL BANKS - 2012 (Contd.)
Bank Group / Bank
As on December 31Other Deposits Total Unclaimed Deposits
No ofAccounts
AmountOutstanding
InterestCredited
IncidentalCharges
No ofAccounts
AmountOutstanding
(7) (8) (9) (10) (11) (12)
PRIVATE SECTOR BANKS
Axis Bank - - - - 2751 35
Catholic Syrian Bank 12147 4 1 1 195637 49
City Union Bank - - 1 - 63343 28
Development Credit Bank - - 6 - 18815 204
Dhanlaxmi Bank - - - - 722 8
Federal Bank 8050 33 15 1 104991 490
HDFC Bank 7 - 2 7 10853 138
ICICI Bank - - 52 38 233959 1017
IndusInd Bank - - 1 1 2040 46
ING Vysya Bank 43905 105 11 - 179640 526
Jammu & Kashmir Bank 13743 13 1 - 32926 70
Karnataka Bank 6077 6 5 - 83723 214
Karur Vysya Bank 27895 14 - - 91652 67
Kotak Mahindra Bank - - - - 383 4
Lakshmi Vilas Bank 2516 6 2 3 15276 53
Nainital Bank 653 2 - - 14018 15
Ratnakar Bank - - 1 - 6706 33
South Indian Bank 14690 41 7 - 34358 155
Tamilnad Mercantile Bank - - 6 1 303526 258
Yes Bank - - - - - -
Total of Private Sector Banks 129683 223 110 52 1395319 3409
Source : Department of Banking Operations and Development, RBI.
(Amount in ` Million)

349
B16 : UNCLAIMED DEPOSITS WITH SCHEDULED COMMERCIAL BANKS - 2012(Contd.)
Bank Group / Bank
As on December 31Current Account Savings Account Fixed Deposits
No ofAccounts
AmountOutstanding
No ofAccounts
AmountOutstanding
No ofAccounts
AmountOutstanding
(1) (2) (3) (4) (5) (6)FOREIGN BANKSAB Bank - - - - - -Abu Dhabi Commercial Bank 40 1 - - 7 -American Express Banking Corp. - - - - - -Antwerp Diamond Bank - - - - - -Australia and New Zealand Banking Group - - - - - -Bank Internasional Indonesia - - - - - -Bank of America 192 11 37 7 301 26Bank of Bahrain & Kuwait 17 1 388 3 - -Bank of Ceylon 69 - 313 3 - -Bank of Nova Scotia 40 3 57 2 - -Bank of Tokyo-Mitsubishi UFJ 47 2 106 5 15 2Barclays Bank 5 - 8 - - -BNP Paribas 24 7 3 - 15 1Chinatrust Commercial Bank 4 - 13 - - -Citibank 1597 27 9365 101 162 15Commonwealth Bank of Australia - - - - - -Credit Agricole 5 - 6 - - -Credit Suisse AG - - - - - -DBS Bank - - - - - -Deutsche Bank 116 6 59 3 2 -FirstRand Bank - - - - - -Hongkong & Shanghai Banking Corporation 114 24 518 20 1306 41HSBC Bank Oman S.A.O.G. 86 5 242 4 - -Industrial and Commercial Bank of China - - - - - -JPMorgan Chase Bank - - - - - -JSC VTB Bank - - - - - -Krung Thai Bank - - - - - -Mashreqbank 13 - 65 - 3 1Mizuho Corporate Bank - - - - - -National Australia Bank - - - - - -Rabobank International - - - - - -Royal Bank of Scotland 381 10 1022 25 - -Sberbank - - - - - -Shinhan Bank - - - - - -Societe Generale - - - - 3 -Sonali Bank - - - - - -Standard Chartered Bank 19476 107 35186 246 2775 29State Bank of Mauritius - - - - - -UBS AG - - - - - -United Overseas Bank - - - - - -Woori Bank - - - - - -
Total of Foreign Banks 22226 204 47388 418 4589 114
Source : Department of Banking Operations and Development, RBI.
All Scheduled Commercial Banks 442445 2751 10938719 24739 842426 4822
(Amount in ̀ Million)

350
B16 : UNCLAIMED DEPOSITS WITH SCHEDULED COMMERCIAL BANKS - 2012(Concld.)
Bank Group / Bank
As on December 31Other Deposits Total Unclaimed Deposits
No ofAccounts
AmountOutstanding
InterestCredited
IncidentalCharges
No ofAccounts
AmountOutstanding
(7) (8) (9) (10) (11) (12)FOREIGN BANKSAB Bank - - - - - -Abu Dhabi Commercial Bank - - - - 47 1American Express Banking Corp. - - - - - -Antwerp Diamond Bank - - - - - -Australia and New Zealand Banking Group - - - - - -Bank Internasional Indonesia - - - - - -Bank of America - - - - 530 44Bank of Bahrain & Kuwait - - - - 405 4Bank of Ceylon - - - - 382 3Bank of Nova Scotia - - - - 97 5Bank of Tokyo-Mitsubishi UFJ 173 1 - - 341 10Barclays Bank - - - - 13 -BNP Paribas - - - - 42 7Chinatrust Commercial Bank - - - - 17 -Citibank - - 7 - 11124 149Commonwealth Bank of Australia - - - - - -Credit Agricole - - - - 11 -Credit Suisse AG - - - - - -DBS Bank - - - - - -Deutsche Bank - - - - 177 9FirstRand Bank - - - - - -Hongkong & Shanghai Banking Corporation - - 1 - 1938 86HSBC Bank Oman S.A.O.G. - - - - 328 9Industrial and Commercial Bank of China - - - - - -JPMorgan Chase Bank - - - - - -JSC VTB Bank - - - - - -Krung Thai Bank - - - - - -Mashreqbank 199 2 - - 280 3Mizuho Corporate Bank - - - - - -National Australia Bank - - - - - -Rabobank International - - - - - -Royal Bank of Scotland - - 1 - 1403 35Sberbank - - - - - -Shinhan Bank - - - - - -Societe Generale - - - - 3 -Sonali Bank - - - - - -Standard Chartered Bank 101 2 3 5 57538 381State Bank of Mauritius - - - - - -UBS AG - - - - - -United Overseas Bank - - - - - -Woori Bank - - - - - -
Total of Foreign Banks 473 5 12 5 74676 747
Source : Department of Banking Operations and Development, RBI.
All Scheduled Commercial Banks 1157262 3866 568 222 13380852 36523
(Amount in ̀ Million)

351
(As on September 02, 2013)State Sponsor Bank Name of new Names of amalgamated
Regional Rural Bank Regional Rural Banks(1) (2) (3) (4)
1. Andhra Pradesh Andhra Bank Chaitanya Godavari GB Chaitanya GBGodavari GB
2. ---------do---------- Indian Bank Saptagiri GB Kanakdurga GBShri Venkateswara GB
3. ---------do---------- State Bank of Hyderabad Deccan GB Golconda GBSri Rama GBSri Saraswathi GBSri Sathavahana GB
4. ---------do---------- State Bank of India Andhra Pradesh Grameena Kakathiya GBVikas Bank Manjira GB
Nagarjuna GBSangameshwara GBSri Visakha GB
5. ---------do---------- Syndicate Bank Andhra Pragathi GB Pinakini GBRayalseema GBSree Anantha GB
6. Assam United Bank of India Assam Gramin Vikash Bank Cachar GBLakhimi Gaonlia GBPragjyotish Gaonlia GBSubansiri Gaonlia GB
7. Bihar Central Bank of India Uttar Bihar KGB Champaran KGBGopalganj KGBMadhubani KGBMithila KGBSaran KGBSiwan KGBVaishali KGB
8. ---------do---------- Punjab National Bank Madhya Bihar GB Bhojpur Rohtas GBMagadh GBNalanda GBPatliputra GB
9. ---------do---------- UCO Bank Bihar KGB Begusarai KGBBhagalpur-Banka KGBMonghyr KGB
10. ---------do---------- Central Bank of India Uttar Bihar GB Kosi KGBUttar Bihar KGB
11. ---------do---------- State Bank of India Bihar GB Samastipur KGBUCO Bank Bihar KGB
12. Chhattisgarh State Bank of India Chhattisgarh GB Bastar KGBBilaspur Raipur GBRaigarh KGB
13 ---------do---------- Dena Bank Chhattisgarh Rajya GB Chhattisgarh GBSurguja KGBDurg Rajnandgaon GB
14. Chennai Indian Bank Puduvai Bharathiar GB New RRB
15. Gujarat Bank of Baroda Baroda Gujarat GB Panchmahal Vadodara GBSurat Bharuch GBValsad Dangs GB
16 ---------do---------- Dena Bank Dena Gujarat GB Banaskantha-Mehsana GBKutch GBSabarkantha Gandhinagar GB
17 ---------do---------- State Bank of Saurashtra Saurashtra GB Jamnagar Rajkot GBJunagadh Amreli GBSurendranagar Bhavnagar GB
18. Haryana Punjab National Bank Haryana GB Ambala Kurukshetriya GBHaryana KGBHissar-Sirsa KGB
Notes : GB : Gramin Bank KGB: Kshetriya Gramin BankSource : Rural Planning and Credit Department, RBI.
Sr. No.
TABLE B17 : LIST OF AMALGAMATED REGIONAL RURAL BANKS

352
(As on September 02, 2013)State Sponsor Bank Name of new Names of amalgamated
Regional Rural Bank Regional Rural Banks(1) (2) (3) (4)
19 Himachal Pradesh State Bank of India Himachal Pradesh GB Himachal GBPunjab National Bank Parvatiya GB
20. Jammu & Kashmir Jammu & Kashmir Bank J & K GB Kamraz Rural BankJammu Rural Bank
21 Jharkhand Bank of India Jharkhand GB Giridih KGBHazaribagh KGBRanchi KGBSinghbhum KGB
22 ---------do---------- State Bank of India Vananchal GB Palamau KGBSanthal Paraganas GB
23 Karnataka Canara Bank Pragathi GB Chitradurga GBKolar GBSahyadri GBTungbhadra GB
24. ---------do---------- State Bank of Mysore Cauvery Kalpatharu GB Cauvery GBKalpatharu GB
25. ---------do---------- Syndicate Bank Karnataka Vikas GB Bijapur GBMalaprabha GBNetravati GBVarada GB
26 ---------do---------- Corporation Bank Kaveri GB Chikmagalur Kodagu GBVijaya Bank Visveshvaraya GBState Bank of Mysore Cauvery Kalpataru GB
27 ---------do---------- Govt. of Karnataka Pragathi Krishna GB Pragathi GBCanara Bank Krishna GB
28 Kerala Syndicate Bank Kerala GB North Malabar GBCanara Bank South Malabar GB
29 Madhya Pradesh Bank of India Narmada Malwa GB Dewas-Shajapur GBIndore-Ujjain KGBNimar KGBRajgarh-Sehore KGB
30 ---------do---------- Central Bank of India Chambal-Gwalior KGB Chambal KGBGwalior-Datia KGB
31 ---------do---------- Central Bank of India Satpura KGB Chhindwara-Seoni KGBHoshangabad KGBMandla-Balaghat KGBShahdol KGB
32 ---------do---------- Central Bank of India Satpura Narmada KGB Satpura KGBChambal-Gwalior KGBRatlam Mandsaur KGB
33 ---------do---------- State Bank of India Madhya Bharath GB Bundelkhand KGBDamoh-Panna Sagar GBShivpuri-Guna KGB
34 ---------do---------- State Bank of India Madhyanchal Grameen Bank Madhya Bharath GBAllahabad Bank & Sharda GBUnion Bank of india Rewa Sidhi GB
35 ---------do---------- State Bank of India Central Madhya Pradesh GB Satpura Narmada KGBCentral Bank of India Vidisha Bhopal KGBUCO Bank Mahakaushal KGB
36 ---------do---------- Bank of India Narmada Jhabua GB Narmada Malwan GBBank of Baroda Jhabua Dhar KGB
37 Maharashtra Central Bank of India Vidharbha KGB Akola KGBBuldhana GBYavatmal KGB
Notes : GB : Gramin Bank KGB: Kshetriya Gramin BankSource : Rural Planning and Credit Department, RBI.
Sr. No.
TABLE B17: LIST OF AMALGAMATED REGIONAL RURAL BANKS (Contd. )

353
(As on September 02, 2013)State Sponsor Bank Name of new Names of amalgamated
Regional Rural Bank Regional Rural Banks(1) (2) (3) (4)
38 ---------do---------- Bank of India Wainganga KGB Bhandara GBChandrapur Gadchiroli GB
39 ---------do---------- Bank of Maharashtra Maharashtra Godavari GB Aurangabad Jalna GBThane GB
40 ---------do---------- Bank of India Wainganga Krishna GB Ratnagiri Sindhudurg GBSolapur GBWainganga GBThane GB
41 ---------do---------- Bank of Maharashtra Maharashtra GB Marathwada GBMaharashtra Godavari GB
42 ---------do---------- Govt. of Maharashtra Vidhrabha Konkan GB Vidhrabha KGBCentral Bank of India Wainganga Krishna GB
43 Orissa Indian Overseas Bank Neelachal Gramya Bank Puri GBDhenkanal GB
44 ---------do---------- UCO Bank Kalinga Gramya Bank Balasore GBCuttack GB
45 ---------do---------- State Bank of India Utkal Gramya Bank Bolangir Anchalik GBKalahandi Anchalik GBKoraput Panchabati GB
46 ---------do---------- State Bank of India Utkal GB Utkal Gramya BankAndhra Bank Rushikulaya GB
47 ---------do---------- Indian Overseas Bank Odisha Gramya Bank Baitarani GBBank of India kalinga GBUCO Bank Neelachal GB
48 Punjab Punjab National Bank Punjab GB Gurdaspur-Amritsar KGBKapurthala-Ferozpur KGBShivalik KGB
49 Rajasthan Bank of Baroda Baroda Rajasthan GB Aravali KGBBhilwara-Ajmer KGBBundi-Chittorgarh KGB Dungarpur-Banswara KGB Marudhar KGB
50 ---------do---------- Punjab National Bank Rajasthan GB Alwar Bharatpur Anchalik GBShekhawati GB
51 ---------do---------- State Bank of Bikaner & Jaipur Marwar Ganganagar Bikaner GB Bikaner KGBMarwar GBSriganganagar KGB
52 ---------do---------- UCO Bank Jaipur Thar GB Jaipur Nagaur Anchalik GBThar Anchalik GB
53 ---------do---------- Central Bank of India Baroda Rajasthan KGB Baroda Rajasthan GBBank of Baroda Hadoti KGBPunjab National Bank Rajasthan GB
54 ---------do---------- State Bank of Bikaner & Jaipur Marudhara GB Marwar Ganganagar Bikaner GBUCO Bank Jaipur Thar GB
55 Tamil Nadu Indian Bank Pallavan Grama Bank Adhiyaman Grama BankVallar Grama Bank
56 Uttarakhand State Bank of India Uttaranchal GB Alaknanda GBGanga-Yamuna GBPithoragarh KGB
57 ---------do---------- State Bank of India Uttarakhand GB Uttaranchal GBBank of Baroda Nainital Almora KGB
58 Uttar Pradesh Allahabad Bank Lucknow KGB Bhagirath GBSarayu GBShravasti GB
Notes : GB : Gramin Bank KGB: Kshetriya Gramin Bank
Source : Rural Planning and Credit Department, RBI.
Sr. No.
TABLE B17 : LIST OF AMALGAMATED REGIONAL RURAL BANKS (Contd. )

354
(As on September 02, 2013)State Sponsor Bank Name of new Names of amalgamated
Regional Rural Bank Regional Rural Banks(1) (2) (3) (4)
59 ---------do---------- Allahabad Bank Triveni KGB Chattrasal GBTulsi GBVindhyavasini GB
60 ---------do---------- Bank of Baroda Baroda Eastern Uttar Pradesh GB Allahabad KGBFaizabad KGBFatehpur KGBKanpur KGBPratapgarh KGBRaebareli KGBSultanpur KGB
61 ---------do---------- Bank of Baroda Baroda Western Uttar Pradesh GB Bareilly KGBShahjahanpur KGB
62 ---------do---------- Canara Bank Shreyas GB Aligarh GBEtah GBJamuna GB
63 ---------do---------- Punjab National Bank Uttar Pradesh GB Hindon GBMuzaffarnagar KGBVidur GB
64 ---------do---------- State Bank of India Purvanchal GB Basti GBGorakhpur KGB
65 ---------do---------- Union Bank of India Kashi Gomti Samyut GB Gomti GBKashi GBSamyut KGB
66 ---------do---------- Punjab National Bank Sarva U.P. GB Uttar Pradesh GBRani Lakshimibai KGBDevi Patan KGBKisan GB
67 ---------do---------- Bank of India Aryavart GB Avadh GBBarabanki GBFarrukhabad GB
68 ---------do---------- Bank of Baroda Baroda Uttar Pradesh GB Baroda Eastern UP GBBaroda Western UP GB
69 ---------do---------- Central Bank of India Ballia - Etawah GB Ballia KGBEtawah KGB
70 ---------do---------- Allahabad Bank Allahabad U.P. GB Triveni KGBLucknow KGB
71 ---------do---------- Bank of India Aryavart KGB Aryavart GBUP State Co-Op. Bank Kshetriya Kisan GB
72 ---------do---------- Bank of India Gramin Bank of Aryavart Aryavart KGBCanara Bank Shreyas GB
73 ---------do---------- State Bank of India Purvanchal Bank Purvanchal GBCentral Bank of India Ballia - Etawah GB
74 West Bengal UCO Bank Paschim Banga GB Howrah GBBardhaman GBMayurakshi GB
75 ---------do--------- United Bank of India Bangiya Gramin Vikash Gaur GBBank Mallabhum GB
Murshidabad GBNadia GBSagar GB
Notes : GB : Gramin Bank KGB: Kshetriya Gramin Bank
Source : Rural Planning and Credit Department, RBI.
Sr. No.
TABLE B17 : LIST OF AMALGAMATED REGIONAL RURAL BANKS (Concld.)
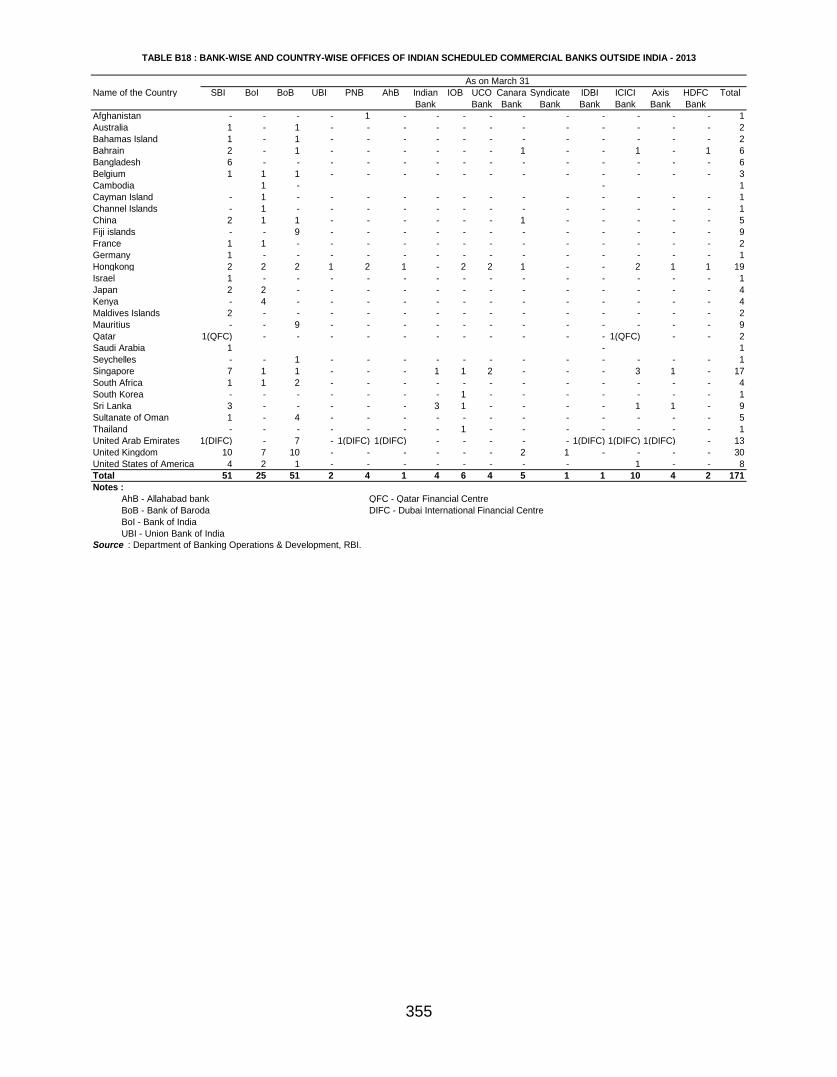
355
Name of the Country SBI BoI BoB UBI PNB AhB Indian IOB UCO Canara Syndicate IDBI ICICI Axis HDFC TotalBank Bank Bank Bank Bank Bank Bank Bank
Afghanistan - - - - 1 - - - - - - - - - - 1Australia 1 - 1 - - - - - - - - - - - - 2Bahamas Island 1 - 1 - - - - - - - - - - - - 2Bahrain 2 - 1 - - - - - - 1 - - 1 - 1 6Bangladesh 6 - - - - - - - - - - - - - - 6Belgium 1 1 1 - - - - - - - - - - - - 3Cambodia 1 - - 1Cayman Island - 1 - - - - - - - - - - - - - 1Channel Islands - 1 - - - - - - - - - - - - - 1China 2 1 1 - - - - - - 1 - - - - - 5Fiji islands - - 9 - - - - - - - - - - - - 9France 1 1 - - - - - - - - - - - - - 2Germany 1 - - - - - - - - - - - - - - 1Hongkong 2 2 2 1 2 1 - 2 2 1 - - 2 1 1 19Israel 1 - - - - - - - - - - - - - - 1Japan 2 2 - - - - - - - - - - - - - 4Kenya - 4 - - - - - - - - - - - - - 4Maldives Islands 2 - - - - - - - - - - - - - - 2Mauritius - - 9 - - - - - - - - - - - - 9Qatar 1(QFC) - - - - - - - - - - - 1(QFC) - - 2Saudi Arabia 1 - 1Seychelles - - 1 - - - - - - - - - - - - 1Singapore 7 1 1 - - - 1 1 2 - - - 3 1 - 17South Africa 1 1 2 - - - - - - - - - - - - 4South Korea - - - - - - - 1 - - - - - - - 1Sri Lanka 3 - - - - - 3 1 - - - - 1 1 - 9Sultanate of Oman 1 - 4 - - - - - - - - - - - - 5Thailand - - - - - - - 1 - - - - - - - 1United Arab Emirates 1(DIFC) - 7 - 1(DIFC) 1(DIFC) - - - - - 1(DIFC) 1(DIFC) 1(DIFC) - 13United Kingdom 10 7 10 - - - - - - 2 1 - - - - 30United States of America 4 2 1 - - - - - - - - 1 - - 8Total 51 25 51 2 4 1 4 6 4 5 1 1 10 4 2 171Notes : AhB - Allahabad bank QFC - Qatar Financial Centre BoB - Bank of Baroda DIFC - Dubai International Financial Centre BoI - Bank of India UBI - Union Bank of IndiaSource : Department of Banking Operations & Development, RBI.
As on March 31
TABLE B18 : BANK-WISE AND COUNTRY-WISE OFFICES OF INDIAN SCHEDULED COMMERCIAL BANKS OUTSIDE INDIA - 2013