Embed Size (px)
Citation preview

Prof. B. Ould Bouamama Polytech Lille « Integrated Design of Mechatronic Systems using Bond Graphs» 1
Research Director at Ecole Polytechnique de Lille http://www.polytech-lille.fr/Head of the research group “Bond Graphs”, CRIStAL UMR CNRS9189»
Contact : [email protected] Web site : https://wikis.univ‐lille1.fr/ci2s/membres/belkacem‐ould‐bouamama

Prof. B. Ould Bouamama Polytech Lille « Integrated Design of Mechatronic Systems using Bond Graphs»
SKILLS and OBJECTIVES Systemic approach for global analysis of complex multiphysic
systems .
Dynamic modelling and simulation of complex systems
Training with new software's tools for integrated design and simulation of industrial systems.
Managing of multidisciplinary teams.
Keywords : Bond Graphs, Mechatronics, Integrated design, Simulation,
Dynamic Modelling, Automatic Control
2

Prof. B. Ould Bouamama Polytech Lille « Integrated Design of Mechatronic Systems using Bond Graphs»
Complexity associated with design of new systems Exchange of information and energy flows for control Complex Multiphysic Energetic Systems (complexity du of coupling of
several energies ): nedd of unified approach
Scientific and economical context Need of accurate model for virtual prototyping Energetic approach for design and monitoring of innovate systems
Economical challenge
3

Prof. B. Ould Bouamama Polytech Lille « Integrated Design of Mechatronic Systems using Bond Graphs»
ORGANISATION OF THE LECTURE Lecture
Illustrated by pedagogical examples and real systems Case Studies : Dynamic vehicle Simulation, Active suspension active, Robotics, Power
station, Hydraulic platform, …).
Case Study Integrated design of simulation platform of multiphysical system using specific
software's (Symbols2000, Matlab-Simulink..)
Required Knowledge : Physics :
• Conservative laws of mass, energy and momentum, thermal transfer, basis of mechanics, hydraulic, electricity, ….
Basis of simulation : • notion of causality, numerical simulation, …
Differential calculus and integral
4

Prof. B. Ould Bouamama Polytech Lille « Integrated Design of Mechatronic Systems using Bond Graphs»
Some References of the lecturer1. Bond graphs for modelling
J. Thoma et B. Ould Bouamama « Modelling and simulation in thermal and chemical engineering » Bond graph Approach , Springer Verlag, 2000.
B. Ould Bouamama et G. Dauphin-Tanguy. « Modélisation par Bond Graph. Eléments de Base pour l'énergétique ». Techniques de l'Ingénieurs, 16 pages BE8280
B. Ould Bouamama et G. Dauphin-Tanguy. « Modélisation par Bond Graph. Application aux systèmes énergétiques ». Techniques de l'Ingénieurs, 16 pages BE8281.
B. Ould-Bouamama. La conception intégrée pour la surveillance robuste des systemes. Approche Bond Graph. Techniques de l'Ingénieurs AG3550. 24 pages 2013.
B. Ould-Bouamama. Contrôle en ligne d'une installation de générateur de vapeur par Bond Graph. Techniques de l'Ingénieurs AG3551. 28 p., 2014
2. Bond graphs for Supervision Systems Design A.K. Samantaray and B. Ould Bouamama « Model-based Process Supervision. A Bond Graph Approach» . Springer Verlag, Series: Advances
in Industrial Control, 490 p. ISBN: 978-1-84800-158-9, Berlin 2008. B. Ould Bouamama et al.. «Model builder using Functional and bond graph tools for FDI design». Control Engineering Practice, CEP, Vol.
13/7 pp. 875-891. B. Ould Bouamama et al.. "Supervision of an industrial steam generator. Part I: Bond graph modelling". Control Engineering Practice, CEP,
Vol 14/1 pp 71-83, 2005. Part II: On line implementation, CEP, Vol 14/1 pp 85-96, 2005.. B. Ould Bouamama et al. « Software for Supervision System Design In Process Engineering Industry. » 6th IFAC, SAFEPROCESS, , pp.
691-695.Beijing, China, 29-1 sept. 2006.
5

Publications and co publications in the BG and FDI domain
6

Prof. B. Ould Bouamama Polytech Lille « Integrated Design of Mechatronic Systems using Bond Graphs»
CONTENTS (1/2) CHAPTER 1: Introduction to integrated design of engineering systems
Definitions, context Why an unified language and systemic approach Different representations of complex systems, Levels of Modelling Modeling tools for mechatronics Why bond graph ? What we can do with bond graphs. Methodology of Fast prototyping , Hardware in the Loop (HIL), Software in the Loop (SIL) Interest of Bond graph for Prototyping
CHAPTER 2: Bond Graph Theory Historic of bond graphs, Definition, representation Power variables, Energy Variables True and pseudo bond graph Bond graph and block diagram Basic elements of bond graph (R, C, I, TF, GY, Se, Sf, Junctions,….) Model Structure Knowledge Construction of Bond Graph Models in different domains (electrical, mechanical, hydraulic, …)
7

Prof. B. Ould Bouamama Polytech Lille « Integrated Design of Mechatronic Systems using Bond Graphs»
CONTENTS (2/2)
CHAPTER 3: Causalities and dynamic model Definitions and causality principle Sequential Causality Assignment Procedure (SCAP) Bicausal Bond Graph From Bond Graph to bloc diagram, State-Space equations generation Examples
CHAPTER 4: Coupled energy bond graph Representation and complexity Thermofluid sources , Thermofluid Multiport R, C Examples
CHAPTER 5: Automated Modeling and Structural analysis Bond Graph Software's for dynamic model generation Integrated Design for Engineering systems Bond Graph for Structural analysis (Diagnosis, Control, …) Application
8

Prof. B. Ould Bouamama Polytech Lille « Integrated Design of Mechatronic Systems using Bond Graphs»
Chapter 1
Introduction to integrated design of engineering systems
9

Prof. B. Ould Bouamama Polytech Lille « Integrated Design of Mechatronic Systems using Bond Graphs»
Motivations
Complexity of systems are due of coupling of multi energies (mechanical, electrical, thermal, hydraulic, …). Example : Power station :
Why dynamic modeling ? Design, Analysis , Decision, Control, diagnosis, ….
Which skills for this task Multidisciplinary project management
Which kind of tool I is needed ? Structured, unified, generic,
10

Prof. B. Ould Bouamama Polytech Lille « Integrated Design of Mechatronic Systems using Bond Graphs»
What is Mechatronic Systems
Mecatronics (« Meca »+ « Tronics » Engineering systems putting in evidence multiple skills
• Mechanics : Hydraulics, Thermal engineering, Mechanism, pneumatic• Electronics : power electronics, Networks, converters AN/NA, Micro controllers, • Automatic control : Linear and nonlinear control, Advanced control, Stability, … • Computer Engineering : Real time implementation
Why Mechatronics ? Integrating harmoniously those technologies , mechatronics allows to design new
and innovative industrial products simpler, more economical, reliable and versatile (flexible) systems.
Définition : « Utilisation simultanée et en étroite symbiose des techniques du génie mécanique, de l'électronique, de l'automatisme et de la micro-informatique pour envisager de nouvelles façons de concevoir et de produire, créer de nouveaux produits plus performants et de nouvelles machines ».
11

Prof. B. Ould Bouamama Polytech Lille « Integrated Design of Mechatronic Systems using Bond Graphs»
Mechatronics ; Synergetic Effects
Informationtechnology
System theoryAutomatic controlComputer engineeringDiagnosisArtificial IntelligenceSoftware
ElectronicsPower electronics,Networks, converters AN/NA,Micro controllersActuators,Sensors
MechanicsHydraulics, Thermal engineering,MechanismPneumaticMechanical elelentsPrecision mechanics
MECHATRONICS
12

Prof. B. Ould Bouamama Polytech Lille « Integrated Design of Mechatronic Systems using Bond Graphs»
Examples of Mechatronic systems Examples of Mechatronic systems include:
Remotely controlled vehicles such as the Mars Rover• A rover is a space exploration vehicle designed to move across the surface of a planet or other
astronomical body.– Control of Take- off and up to exploration of Mars planet– Remote control– Embeded supervision,, net work communication– Virtual simulation ….;
design of Hybrid vehicle• Electrical part;• Mechanical energy• Electrochemical part• Control (software, sensor, …)• Network
13

Prof. B. Ould Bouamama Polytech Lille « Integrated Design of Mechatronic Systems using Bond Graphs»
From Electromecanical to Mechatronic systems
Before 1950 Complex systems are studied as electromechanical sub systems
Around 1950 Emergence of semi conductors, electronic control and power
electronics. 1960-1970 Design of microcontrollers because of appearance of computer
engineering. Possibility to design embedded control systems more efficient
1969 : “Mechatronics” was first introduced in Japan YaskawaElectric Corporation
14

Prof. B. Ould Bouamama Polytech Lille « Integrated Design of Mechatronic Systems using Bond Graphs»
Methodology for Fast prototyping
15
Development of generic models and Control algorithms
Industrial validation
Validation using HiL
Test
Validation using SiL
Test
Test
Validation using MiL

Prof. B. Ould Bouamama Polytech Lille « Integrated Design of Mechatronic Systems using Bond Graphs»
Tests in Mechatronic systems (1/2) Tests can be executed using
Dynamic models (Model-in-the-Loop, MiL), Existing function (Software-in-the-Loop, SiL), Or a real industrial computer (Hardware-in-the-Loop, HiL)
MiL (Model in the Loop)• Test object : model• Input signals are simulated• Output signal values are saved to be compared to the expected values• Automatic test execution through:
– – The development environment used for modeling– Specific software's (MATLAB/Simulink)
16

Prof. B. Ould Bouamama Polytech Lille « Integrated Design of Mechatronic Systems using Bond Graphs»
Tests in Mechatronic systems (2/2) SiL (Software in the Loop)
• Test object: generated code• Environment is simulated• The inputs and outputs of the test object are connected to the test system• The generated code is executed on a PC or on an evaluation board• Automatic test execution through:
– – use of MATLAB/Simulink with Realtime Workshop)– – Interfaces to external tools
HiL (Hardware in the Loop)• Test object: real ECU• Environment simulation through environment models (e.g.: MATLAB/Simulink)• Inputs and Outputs are connected to the HiL-Simulator• Comparison of the ECU output values to the expected values• Automatic test execution through the control software of the HiL-Simulator
17

Prof. B. Ould Bouamama Polytech Lille « Integrated Design of Mechatronic Systems using Bond Graphs»
Steps in fast prototyping
ECU : Electronic Control Unit
ECU Tests by HIL simulation
System/Component Design & Simulation
Rapid Prototyping
Tests Plans
Final testsFinal tests
FunctionalAnalysis
Models
ECU
OutilsIntegration/validation on hybrid bench
TechnicalSpecifications
System equirements
18

RequirementsOverall functionsvaluesCosts & milestones
SpecificationsFulfilment of requirementsLimitationsReliability and safety
System designPartinioningMulti-physics componentWord Bong GraphPower exchange
Modeling & SimulationModels of componentsKinematic & dynamic behaviorsSimulation according to the requirements
Component DesignPhysical component: mechanics, electronics, ….Mechanical CADController, HMI,…Space optimisation
Hardware IntegrationAssemblingCouplingOptimisation
Software IntegrationSignal analysisFiltringTest of algorithms
System testingBehavioral testsStress testingReliability and safetyMonitoring and supervision
Field TestingFinal productNorm & certificationStatistics
ProductionSimultanousplanningTechnologiesQuality control
MechatronicComponents
Mechanics, Electronics, Control, Software (HMI)
Component Tests & AnalysisHardware in the loopsimulation,Stress Analysis,..
PrototypesLaboratory test benches
Test and measurementsAlgorithms
i mplementation
Integrated design : From modellingto industrial test
19

Deming wheel - PDCA cycle : Tool for quality management : W. Edwards Deming (1950)
PlanIdentify objectives
Formulate hypothesisDefine validation criteria
Plan
DoCheck
Act
DoBuild model
CheckCausal analysis
Structural analysisSimulation
ActCriticize simulation
resultsIdentify further needs
P
DC
ARoue Deming
Interest of using bond graph tool for new product designing or improvement of existing productsDeming wheel
20

Prof. B. Ould Bouamama Polytech Lille « Integrated Design of Mechatronic Systems using Bond Graphs»
Bond Graphs : Tools for Integrated Design Bond graphs Bond graph is an unified graphical language used for any
kind of physical domain. The tool is confirmed as a structured approach for modeling and simulation of multidisciplinary systems.
Bond graphs for modelling and more… Because of its architectural representation, causal and
structural properties, bond graph modelling is used not only for modelling but for : • Control analysis, diagnosis , supervision, alarm filtering • Automatic generation of dynamic modelling and supervision algorithms• Sizing • Used today by industrial companies (PSA, Renault, EDF, IFP, CEA, Airbus,…) .
21

Prof. B. Ould Bouamama Polytech Lille « Integrated Design of Mechatronic Systems using Bond Graphs»
LEVELS OF MODELLING
WhatWhat
to do ?to do ?WhatWhat
to do ?to do ?1. Technological
2. Physical Energy description ( Storagee, dissipation, ….
3. Mathematical dxyxfxi ),(
4. Algorithmic
This level constructs the architecture of the system by the assembly of different sub-systems, which are the plant items (heat exchanger, boiler, pipe...). The technological level can be represented by the so-called word bond graph.
The modelling uses an energy description of the physical phenomena based on basic concepts of physics such as dissipation of energy, transformation, accumulation, sources , …). Here, the bond graph is used as a universal language for all the domains of physics.
Level is represented by the mathematical equations (algebraic and differential equations) which describe the system behavior.
22

Prof. B. Ould Bouamama Polytech Lille « Integrated Design of Mechatronic Systems using Bond Graphs»
THE FOUR LEVELS IN THE BG REPRESENTATION A Word bond graph : technological level
is used to make initial decisions about the representation of dynamic systems Indicates the major subsystems to be considered As opposite to block diagram the input and outputs are not a signals but a power
variables to be used in the dynamic model
A bond graph is a graphical model : physical level The phenomena are represented by bond graph elements (storage, dissipation, inertia
etc..)
From this graphical model (but having a deep physical knowledge) is deduced Dynamic equations (algebraic or differential) : mathematical level Simulation program (how the dynamic model will be calculated) is shown by causality
assignment : Algorithmic level
23

Prof. B. Ould Bouamama Polytech Lille « Integrated Design of Mechatronic Systems using Bond Graphs»
Chapter 2 : Bond Graph Theory
CHAPTER 2: Bond Graph Theory Historic of bond graphs, Definition, representationPower variables, Energy VariablesTrue and pseudo bond graphBond graph and block diagramBasic elements of bond graph (R, C, I, TF, GY, Se, Sf,
Junctions,….)Model Structure KnowledgeConstruction of Bond Graph Models in different domains
(electrical, mechanical, hydraulic, …)
24

Prof. B. Ould Bouamama Polytech Lille « Integrated Design of Mechatronic Systems using Bond Graphs»
Founders
J. Thoma
25

Paynter and Einshtein
26

THE FIRST IDEA The first system used by Paynter teaching in the Civil Engineering Department at MIT and first ideas
27
Prof. B. Ould Bouamama Polytech Lille « Integrated Design of Mechatronic Systems using Bond Graphs»
(The Gestation and Birth of Bond Graphs by Prof. H.M. Paytner (c. 2000) My efforts were also strongly motivated by a preoccupation with the logical
philosophy underlying analogies in general.” When these analogous devices were reduced to equations for computer simulation, distinctions became completely blurred. We lay down a fundamental principle of generalization by abstraction: “
Mes efforts ont également été fortement motivés par une préoccupation avec une philosophie de la logique qui sous-tend les analogies en général. "Lorsque les dispositifs analogues ont été réduits à des équations pour la simulation par ordinateur, les distinctions deviennet complètement floues. Nous établissons un principe fondamental de généralisation par abstraction:
28

Prof. B. Ould Bouamama Polytech Lille « Integrated Design of Mechatronic Systems using Bond Graphs»
HISTORIC OF BOND GRAPH MODELLING
Founder of BG : Henry Paynter (MIT Boston) The Bond graph tool was first developed since 1961 at MIT, Boston, USA by
Paynter ‘April, 24 , 1959) Symbolism and rules development :
• Karnopp (university of California), Rosenberg (Michigan university), Jean Thoma (Waterloo)
Introduced in Europe only since 1971. Netherlands and France ( Alsthom)
Teaching in Europe , USA … France : Univ LyonI, INSA LYON, EC Lille, ESE Rennes, Univ. Mulhouse, Polytech’Lille, ….. University of London, University of Enshede (The Netherlands), Waterloo..;
Companies using this tool• Automobile company : PSA, Renault• Nuclear company : EDF, CEA, GEC Alsthom• Electronic :Thomson, Aerospace company ....
29
Prof. B. Ould Bouamama Polytech Lille « Integrated Design of Mechatronic Systems using Bond Graphs»
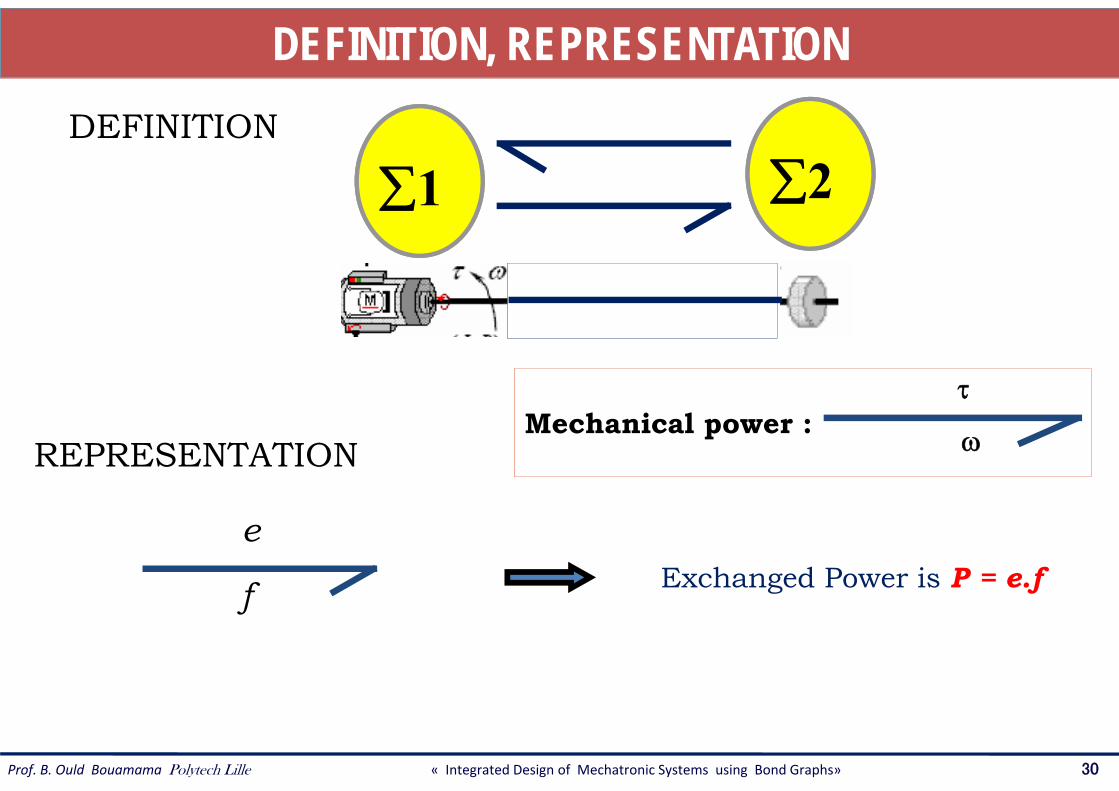
DEFINITION, REPRESENTATION DEFINITION
REPRESENTATION
Exchanged Power is P = e.fe
f
1 2
Mechanical power :
30

Prof. B. Ould Bouamama Polytech Lille « Integrated Design of Mechatronic Systems using Bond Graphs»
Bond as power connectionThe power is represented by the BOND
Bond
The direction of positive power is noted bythe half-arrow at the end of the bond
direction of power
31

INFORMATION BONDS The signal is represented as
information bonds: no power
Example : Sensors• Detector of effort such as pressure,
voltage, temperature
• Detector of flow such as current, hydraulic flow
Information Bonds for signal exchange
Dee
f=0
Dee=0
f 32

Prof. B. Ould Bouamama Polytech Lille « Integrated Design of Mechatronic Systems using Bond Graphs»
Some definitions (1/2) BOND GRAPH MODELING
Is the representation (by a bond) of power flows as products of efforts and flows with elements acting between. These variables and junction structures to put the system together.
Bond graphs are labeled and directed graphs, in which the vertices represent submodels and the edges represent an ideal energy connection between power ports.
CEdge (bond)
Exchanged powerC
vertex
Submodel(Component)
capacitor
E
vertex
Submodel(Component )
Battery
E
33

Prof. B. Ould Bouamama Polytech Lille « Integrated Design of Mechatronic Systems using Bond Graphs»
Some definitions (2/2) The vertices are idealized descriptions of physical phenomena: they are
concepts, denoting the relevant aspects of the dynamic behavior of the system.
The edges are called bonds. They denote point-to-point connections between submodel ports.
The bond transports a power as product of two generic energy variables
Which generic variables are used ?
34

Prof. B. Ould Bouamama Polytech Lille « Integrated Design of Mechatronic Systems using Bond Graphs»
1. Power variables
Power variables are classified in a universal scheme and to describe all types of multiports in a common language.
35
Power variables
Intensive variable• Temperature• Pressure• Voltage.
Effort variable e(t) Flow f(t)
Derivative of extensive variable• Entropy flow• Volume flow• current

POWER VARIABLES FOR SEVERAL DOMAINS
Electrical
DOMAIN
Mechanical (rotation)
Hydraulic
Chemical
Thermal
Economic
Mechanical(translation)
VOLTAGE
u [V]
CURRENT
i [A]FORCE
F [N]
VELOCITY
v [m/s]
FLOW (f)EFFORT (e)
TORQUE
[Nm]
ANGULAR VELOCITY
[rad/s]
UNIT PRICE
Pu [$/unit]
FLOW OF ORDERS
fc [unit/period]
PRESSURE
P [pa]
VOLUME FLOW
dV/dt [m3/s]
TEMPERATURE
T [K]
ENTROPY FLOW
dS/dt [J/s]
CHEM. POTENTIAL
[J/mole]
MOLAR FLOW
dn/dt [mole/s]
36

Prof. B. Ould Bouamama Polytech Lille « Integrated Design of Mechatronic Systems using Bond Graphs»
Why pseudo bond graph in proccess engineering ?
In process engineering systems, each plant item is associated with a set of process variables. The number of variables is higher than DOF
• For hydraulic : Pressure-mass flow, volume flow• For thermal: température, specific enthalpy _entropy flow, enthalpy flow,
thermal flow, quality of steam….• For chemical : chemical potential, chemical affinity, molar flow…
Complexity of used variables• Use pseudo bond graphs allows to manipulate more intuitive variables and
easily measurable (concentration, enthaly flow, …) therefore easy to simulate.
• Entropy is not conserved • ….
37

Prof. B. Ould Bouamama Polytech Lille « Integrated Design of Mechatronic Systems using Bond Graphs»
PSEUDO BOND GRAPH
Thermal
HydraulicPRESSURE
P [ pa ]
MASSE FLOW
[ Kg /s ]m
ChemicalCONCENTRATION
C [ mole/m3]
MOLAR FLOW
[ mole/s]n
TEMPERATURE
T [K]
HEAT FLOW
[W ]Q
CONDUCTION
ENTHALPY FLOW
[ W ]HSPECIFIC ENTHALPY
h [ J/kg ]
CONVECTION
TEMPERATURE
T [K]
FLOW (f)EFFORT (e)DOMAIN
38

2. ENERGY VARIABLES The momentum or impulse p(t), (magnetic flow, integral of pressure,
angular momentum, … )
The general displacement q(t), (mass, volume, charge … )
)()()( 00
tpdetpt
t
)()()( 00
tqdftqt
t
t
txmFFdtxmtp
0
)(:Momentum
39

Prof. B. Ould Bouamama Polytech Lille « Integrated Design of Mechatronic Systems using Bond Graphs»
Why energy variables ?
pq dppftdqqet )()(,)()( EE
ENERGY VARIABLESThe momentum or impulse p(t), (magnetic flow, integral of pressure, angular momentum, … )
)()()( 00
tpdetpt
t
The general displacement q(t), (mass, volume, charge … )
)()()( 00
tqdftqt
t
Why energy variables ?
1
0
1
0
1
0
1
0
1
0
20
21p
20
21p
21)()()(E
21.)()(E
xx
qqC
dqCqdqqudqqet
kxkxxdxkdqqetEnergy stored
by a spring
40

Prof. B. Ould Bouamama Polytech Lille « Integrated Design of Mechatronic Systems using Bond Graphs»
Energy variables : analogy
dtVVxVfPe
idtqxifue
dtQQxQf
Te
dtxxxxf
Fe
Liudtpifue
xMFdtpxf
Fe
P,V u,q
iQ
Q,T
x
x, F
Displacement
xF,
u,
i
Impulse
41

ENERGY VARIABLES FOR SEVERAL DOMAINS
Electrical
DOMAIN
Mechanical (rotation)
Hydraulic
Chemical
Thermal
Economic
Mechanical (translation)
CHARGE
q [Coulomb]
FLUX
Φ [Wb]DISPLACEMNT
x [m]
MOMENT
J [Ns]
Impulse (p)Displacement (q)
ANGLE
[rad]
ANGULAR MOMENTUM
[Nms]
accumulation of orders qe
Economic momentum Pe
VOLUME
V [m3]
MOMENTUM pp
Ns/m2
Nbr of MOLE
n [-]
?
ENTROPY
S [J/K]
?
42

p y yPower variables: How to select them in multiphysic system ?
43
Chemical, Electrochemical
The
rmod
ynam
ic
Economic
Electrical
ThermalMechanical
Hydraulic
Is used just a pair of variables:1. Intensive variable : effort variable e(t))2. Derivative of extensive variable : flow variable f(t)
43

44
H2
H2O
O2Anode CathodeElectrolyte
Oxydation2H2 → 4H+ + 4e-
-
H+
ReductionO2 + 4e- + 4H+ → 2H2O
+
e-
H+
1) The FC is based on oxidation-reduction principle. It produces electricity from fuel, which react in the presence of a catalyst. A hydrogen FC cell uses H2 as its fuel and O2 as its oxidant.2) At the anode, a platinum catalyst causes the hydrogen to split into positive hydrogen ions(protons) and negatively charged electrons
3) The Polymer Electrolyte Membrane (PEM) allows only the positively charged protons to pass through it to the cathode while the negatively charged electrons must travel along an external circuit to the cathode, creating an electrical current.
4) At the cathode, the electrons and positively charged hydrogen ions combine with oxygen to form water, which flows out of the cell.
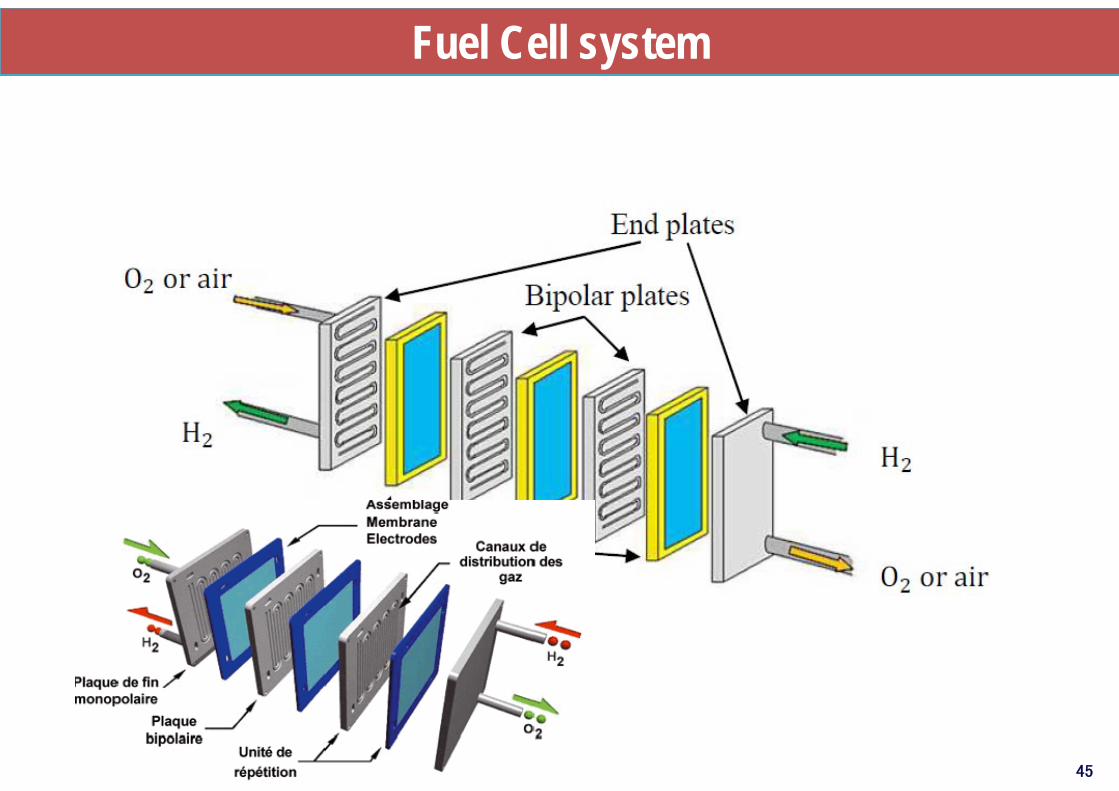
Fuel Cell system
45

How th electricity is producedThe enthalpy1 of this global reaction is the difference between the enthalpy of products and the reactants, so:
Enthalpy is a measurement of energy in a thermodynamic system. It is the thermodynamic quantity equivalent to the total heat content of a system. It equals to the internal energy of the system plus the product of pressure and volume.
H=U+PV
The negative sign in here means this amount of energy is released in this reaction, so for this exothermic reaction, 286kJ of energy is released per mole of H2 consumed during the overall reaction
46

How th electricity is producedHowever, not 100% of the enthalpy can be converted into electricity. A certainamount of enthalpy is inherent cannot be converted into work, i.e., only part of the286kJ being released per mole H consumed during operation may betransferred to electricity.
This part of energy is the Gibbs free energy ΔG, where,
Gibbs free energy : The greatest amount of mechanical work which can be obtainedfrom a given quantity of a certain substance in a given initial state, withoutincreasing its total volume or allowing heat to pass to or from external bodies
The electrical work is the product of charge and potential, the theoretical potentialthat could be driven from this energy is:
F is the faraday constant, valued as 96485 (C/mol), n stands for the number ofelectrons involved in the overall reaction per mole of hydrogen being consumed
47

How th electricity is producedIn fact, electrochemically, the potential the electrodes could provide would be deviatedfrom 1.23 V if it is not working in the standard condition:
where a stand for the activity of different species
Generally, the losses can be categorized to three partsActivation losses due to the electrode kinetics in order to providecontinuous electrical current by giving necessary activation energy duringthe electrochemical reaction. Basically, the activation loss could be deduced from the Tafelequation on the electrodes, and may have the formulation of:
48

How th electricity is producedwhere α is the transfer coefficient, i is the current density, and the ih is the exchange current density on the electrode. It may be in a form of
Ohmic losses : caused by the resistance either to the flow of the ions in the proton electrolyte membrane, or of the electrons in the electrically conductive parts in the fuel cell such as the bipolar plates, GDL, etc.
R' is the total cell internal resistance.Concentration losses :usually happening when the reactant gases areconsumed rapidly.
49

How th electricity is produced
These three voltage losses happened on each cell would considerably influence theoutput performance of the PEMFC stack. They are dominated in zone I, II,
50

Word Bon dgraph and Which power variables are usedWord Bon dgraph and Which power variables are used
Source of H2
Source of O2
Electro chemical reaction
Thermo -chemical reaction
Mechanical part
Pump
Pipe
ReactorEconomical market
Resistor Ambiance
Pm
P
m
nT
H
µ
Electrical Part
Thermal source
U i
TQ
C
Voltage source
G H
Faraday Phenomena
U
i
U
i
PmTH
pu
fc
Ui
H T PmQ T
51

Prof. B. Ould Bouamama Polytech Lille « Integrated Design of Mechatronic Systems using Bond Graphs»
EXAMPLE1 : ELECTRICAL INDUCTION MOTOR
ua
ia
LOAD
(J,f)
ELECTRICAL PART MECHANICAL PART
RaLa
ELECTRICAL PART
ua
ia
MECHANICAL
PART
LOAD
52

EXAMPLE 2: POWER STATION
RECEIVER
HEATER
TH HQ
BOILERTW
WH
PW
WmTB
BH
PB
Bm TURBINETR
RH
RmPP
PUMP PIPETP
PH
PP
Pm
FEED WATER
STEAM
HEATER
TURBINE
PUMPRECEIVER
U i
LoadMOTOR
U
isource
53
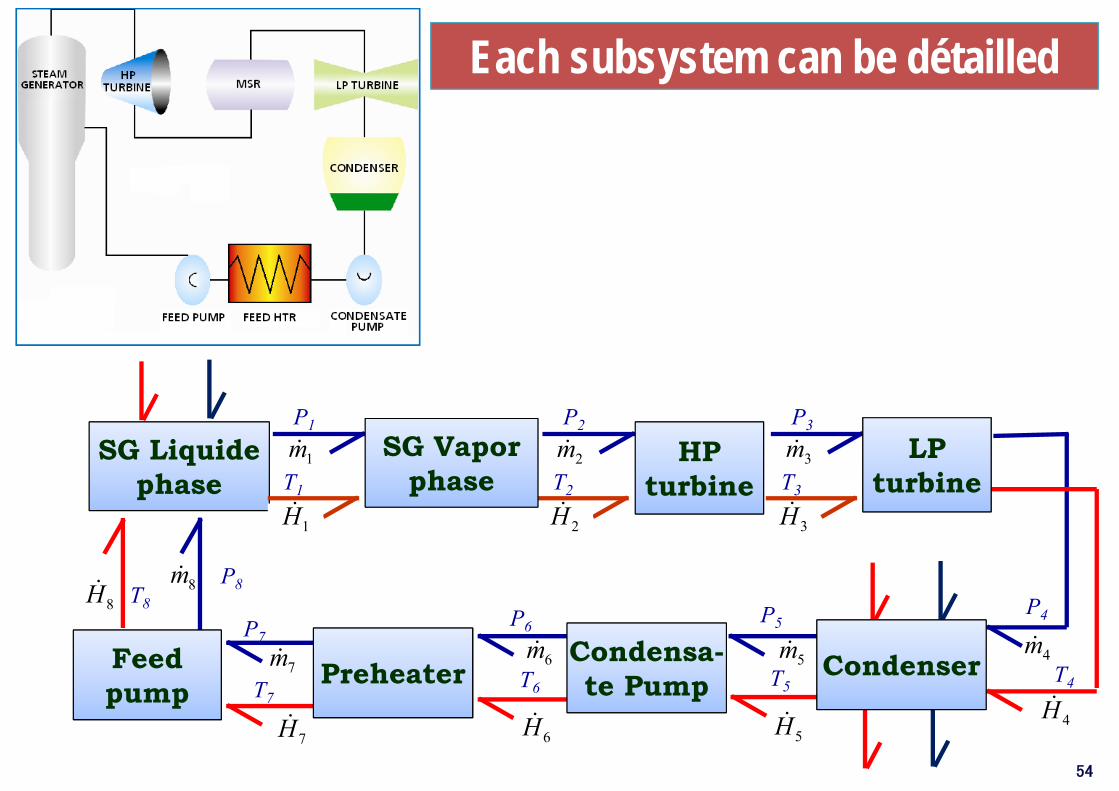
Each subsystem can be détailled
SG Liquidephase T1
P1
1m
1HT2
P2
2m
2HT3
P3
3m
3H
P4
T4
P5
T5
P6P7
P8
T6T7
T8
4H5H6H7H
8H
4m5m6m
7m
8m
HP turbine
Condenser
LP turbine
Condensa-te PumpPreheaterFeed
pump
SG Vapor phase
54

What about physical phenomena : Generic Physical elements R,C,I, TF,GY, Se,Sf
Se
Sf
Sf
Se
R
R
R
R
R
GY
TF
I
II
I
C
C
C
C
C
55

BOND GRAPH ELEMENTS
ACTIVE ELEMENTSGenerate and Provide a power
to the system
SfSe
One port element
R,C,I,Se,Sf 0,1
Tree ports element
BOND GRAPH ELEMENTS
PASSIVE ELEMENTS(transform received power into dissipated (R) or stored (C, I)
energy
R C I
TF, GYTwo ports element
JUNCTIONSConnect different elements of
the systems : are power conserving
TF, GY0,1
They are not a material point (common effort (0)
and common flow ((1)
Energy transformation or transformation from one
domaine to another
56

Structural Model
u
y
ein fin
Dout
Sources
Se, Sf
Structure de Jonction
0, 1, TF, GY
Dissipation
d’énergie
R
Stockage
d’énergie
I , C
Capteurs
De, Df
eout fout
57

First examples (1/3)
L1
Se C1
R1
iR1
iC1
1
R:R1
iUR
Uc
ii
ESe
I:L1
C:C1
MSe:mg
k
Friction : f
x
1x 1
R:fFR
FcmgSe
I:M
UL i
FI
x
x
xx
Spring
M
Friction
C:kSpring
Inertia of mass
Force
58

Prof. B. Ould Bouamama Polytech Lille « Integrated Design of Mechatronic Systems using Bond Graphs»
First examples (2/3)
E
R1
g
C
i
Uc
UR
1
R:R1
iUR
C:C1Uc
iSe:E
i
E
59

Prof. B. Ould Bouamama Polytech Lille « Integrated Design of Mechatronic Systems using Bond Graphs»
First examples (3/3)
T2
On-Off
V o
QOPI
T1
60

Bond graph model of an hydraulic system
Tank2
0
C:C1
De2
6
Tank1
0
C:C1
De1
2
Pump
MSf11
T2
On-Off
Valve1
1
R:R1
43 5
Valve 2
1
R:R2
Se17
89
PIu1
On-off
USER
u3
PI
T1
Vo
QO
Out
flow
to c
onsu
mer
61

Prof. B. Ould Bouamama Polytech Lille « Integrated Design of Mechatronic Systems using Bond Graphs»
Bond graph well suited for automated modelling : softwares
JunctionsJunctions
Passive elementsPassive elements
Active elementsActive elements
JunctionsJunctions
62

63
Specific softwares for Bond graphg automatic modelling
Symbols Shakti software 20sim software
Only Bond Graph tool can be used for automatic generation of dynamic models !!!

Prof. B. Ould Bouamama Polytech Lille « Integrated Design of Mechatronic Systems using Bond Graphs»
Lets’ Learn Bond Graph theory
64

Prof. B. Ould Bouamama Polytech Lille « Integrated Design of Mechatronic Systems using Bond Graphs»
Passive elements Definition The bond graph elements are called passive because they transform
received power into dissipated power (R-element), stored under potential energy (C-element) or kinetic (I-element).
Representation
65
R:R1feΣ
C:C1feΣ
I:LfeΣ
R: means R element
R1: Name of the element

Resistive R element
66
v1 v2
i
021
RiUUvv
128
4DR
p1
p2
V
0 xRF
x
F
R
0P RV 0T RQ
Tr
Ta
0, feRR Constitutive equation : For modeling any physical phenomenon characterized by an effort-flow relation ship
fR:R1Representation e
AR

Capacitive C element (capacitance)
C Constitutive equation (For modeling any physical phenomenon characterized by a relation ship between effort and flow
Electric Hydraulic
h
t
t
mcCCQdtQ
CT
dtTmcdQQQ
1
.)(21
0,, qefdte CC
fC:C1Representation e
Thermal
mcT
1Q 2Q
Cqidt
CU
dtUCd
dtdqiii
1
).(21
p
A: sectionh: level: densityCh= A/g
i
V
,
h
d AhV P gh
dtg Vp Vdt
A C
F
F
1 ,dFxK dt
F K xdt Kx
x
Mechanical
67

Mechanical and electrical capacity
1 2
v
1i 2i
0C
K
1 2C K dt 1 20
1v i i dtC
C
0
C:1/K
0
C:C0
1 2i i
1 2 1i2i
1 2 vc
68

Inertial I element (Inertia) Electric Hydraulic Mechanical Thermal
p1 p2
V
l
AlI
VIp
PdtI
Pdtl
AV
dtVd
AlA
dtdv
Am
AFPP
0
1
2
p : impulsion of pressure0
01
Li
UdtL
i
: Magnetic flux
V1 V2i
0
11
.
xIQ
IQFdt
IFdt
mx
dtxdmF
F
Q : momentum
????
0,, pfedtf II
fI:I1Representation e
I Constitutive equation (For modeling any physical phenomenon characterized by a relation ship between flow and effort
69

Mechanical and electrical inertia
1C 2C
1v 2v
iJ L
1 21 c c dtJ
1 21i v v dtL
11C
2C
I:J
1 2C C
11v
2v
I:L
1 2v v i
i i
70

Prof. B. Ould Bouamama Polytech Lille « Integrated Design of Mechatronic Systems using Bond Graphs»
Two ports power conservative element(with out storage and dissipation)
71
f1
TF:m
e1
f2
e2
f1
GY:m
e1
f2
e2
2211 .. fefe

TRANSFORMER Convert energy as well in one physical domain as well between one physical
domain and another Examples: lever, pulley stem, gear pair, electrical transformer, change of physical
domain….
Representation
f1
TF:m
e1
f2
e2Defining relation
e1 = m.e2,f2 = m.f1
Where m : modulus
Simple transformer
Modulated transformer (m is not cste)
f1
MTF:m
e1
f2
e2u
Defining relatione1 = m(u).e2,f2 = m(u).f1
72

EXAMPLES OF TRANSFORMERS
TF:m
1u
1i
2u
2i
u1 u2
i2i1
Electrical transformer
xF ,
VP ,
Hydraulic piston
TF:1/A
P
V
F
x
VA
x
FA
P
.1
1
Hydraulic power is transducted
into mechanical power
A : area of the piston
TF:b/a
12
21
.
.
xabx
FabF
F2F1
1x 2x
F2
F1
2x
1x
a b
Lever
1 1 2 2F x F x
1 1 2 2u i u i
1 2
2 1
u mui mi
73

Examples of TF elements
74
12 1
2
11 2
2
RRRR
1
2:
TFRR
1
12
2
Gearing
,
power conservation : xF
Rack and pinion R
,x F
:TF
R
x
F1 xRRF
1 1 2 2
1 1 2
2 2 1
RiR
i<1 i=1 i>1Reducer of the velocity No change of speed Speed increase
Increase in torque No change of torque Decresae in torque

4. GYRATOR Convert energy as well in one physical domain as well between one
physical domain and another Examples: Gyroscope, Hall effect sensor, change of physical domain….
Representation
f1
GY:r
e1
f2
e2
Defining relatione1 = rf2e2 = rf1
Where r : modulus
f1
MGY:r
e1
f2
e2
u
Modulated Gyrator (if r is not cste)
Defining relatione1 = r(u)f2e2 = r(u)f1
75

Example of gyrator : DC motor
u
i
GY:r
Electrical Power ui Mechanical
Power
Ui = Defining relation
= kiu= k
Where k : modulus
Power Conservation :
76
GY:r
u
i

Prof. B. Ould Bouamama Polytech Lille « Integrated Design of Mechatronic Systems using Bond Graphs»
ACTIVE ELEMENTS
Elements that provide powerThey provide effort or flow:
Se or Sf
77

Source of effort, Source of flow
78
EFFORT AND FLOW SOURCES Se, SfA source maintains one of power variables constant or a specified function of time no matter how large the other variable may be.
fSf:f(t) e
Sf = f(t) = cste
Current generator, applied velocity..
Source of flow
fSe:e(t)
e
Se = e(t) = cste
Generator of voltage, gravity force, pump, battery
Source of effort

Sources can be modulated (controlled)
T1
PC
T1
Tank1
0
C:C1
De1
De1
Pump
MSf1
PIu
Pump
Sf1
Tank1
0
C:C1
De1
De1
u
( )V F u
( )V F u V cste
V cste
PI
79

Prof. B. Ould Bouamama Polytech Lille « Integrated Design of Mechatronic Systems using Bond Graphs»
Junctions
How to connect different subsystems ?
80

Prof. B. Ould Bouamama Polytech Lille « Integrated Design of Mechatronic Systems using Bond Graphs»
JUNCTIONS (1/6)
0 - JUNCTION “ Common effort junction”
0.... 44332211 fefefefe
Power conservation
0.1
n
iiii fea
ai = +1 if 0
ai = -1 if 0
0e1
e2e3
e4
f1
f2
f4
Representation
f3
Defining relation
02341
4321
ffffeeee
81

JUNCTIONS (2/6) : Examples of 0-junction
EC
R
i i1
i2
0E
i i1
Ei2
E
R
C
Se:E
i = i1 + i2
0
C:1/k
3x
1V
2V
3V 0P
1V
P 2V
3VP
321 VVV
2x 1
I:Mc
2x
Mc
Mp
2x
1x
Se:Fr
C:1/k
1
I:Mp
1xSe:Fr
1x
R:RV
C:Ch
Rv
Ch
:Sf V
82

( ) gyJonction (3/6) : Conservative energy laws
aQ
UT
0 sce mmm
0
C:Ch
aQ cmPUT
,,
ee
eePTmH
,,
ss mH ;sm
emSf :
P
sH
❶ Only hydraulic energy isconsidered
0hemSf :
0t
C:Cht
eTSe :sHeH
em
Cm
CmP
PP
TT
sm
00UHQH
mmm
sae
sce
❷ hydraulic and thermal energies are considered
83

Prof. B. Ould Bouamama Polytech Lille « Integrated Design of Mechatronic Systems using Bond Graphs»
JUNCTIONS (4/6) : 1 JUNCTION
1e1
e2e3
e4
f1
f2
f4
1 – JUNCTION Common flow junction
Representation
0.... 44332211 fefefefe
04321
4321
eeeeffff
Defining relation
Power conservation
0.1
n
iii ea
ai = +1 if 0
ai = -1 if 0
f3
84

JUNCTIONS (5/6) : Examples of 1-junction
1P1
R:R1
C:Ch
PR1
P1P2
R1
Q
P2
Q
EC
R L
UR UL
UCi1
E
i i
i
Se:E
E =UR + UL + UC
UR
R
L
C
UL
UC i
1
FRFC
C:k
I:ma
R:f
0 11
I:mb
k x
maFafmb
Fb
Se:FaSe:Fb
ax rk
xb
xFaFb
85
Pressure loss
Hydraulic losses
R:fb R:fa
mb
ma
fa fb

Prof. B. Ould Bouamama Polytech Lille « Integrated Design of Mechatronic Systems using Bond Graphs»
Junction (6/6) : thermal system
1T1
T2
R
TR
2Q1Q
RQ
T1 T2
Q
TQR
2
: thermal flow
1
: hermal conductibility / .
:
e=wall thickness
ec
TQ WR
S WattKR e Kelvin
T W m K
S m
m
QQQQTTT
R
R
21
21 0
Static case Dynamic case
1T1 T2
R
TR
2Q1QRQ
CR
CR
QQQQTTTT
21
21 0
CQTC
C
86

Prof. B. Ould Bouamama Polytech Lille « Integrated Design of Mechatronic Systems using Bond Graphs»
SUMMARY
87

1TF
:m
I:L2
R:R2
iR2
iR2
UL2
UR2
UST
iR2
Exercises : Example1
1
R:R1
uR1
Se:EE
iR1
iC1
0
C:C1
uC1
iR1
1
I:L1
iL1
uL1uC1
iL1
UET
iL1
L1
E C1
R1
0iR1
iC1
iL1 R2
L2
iR2
m
88

Exercise : do it
L 1
E C 1
R 1
i1
i2
i4
R3
L2
i3 i6
R 2 C 2
i5
L 1
SE C 1
R 1
iR1
iC1
R 2
C 2 SF
iR2
iC2
SF
m
89

Prof. B. Ould Bouamama Polytech Lille « Integrated Design of Mechatronic Systems using Bond Graphs»
How to construct multiphysic Systems ?
Thermal, Hydraulic, mechanical, electrical ….
90

Prof. B. Ould Bouamama Polytech Lille « Integrated Design of Mechatronic Systems using Bond Graphs»
BUILDING MECHANICAL MODELS1. Fix a reference axis for velocities
2. Consider all different velocities ( absolute velocities for mass and inertia and relative velocities for others).
3. For each distinct velocity, establish a 1-junction, Attach to the 1-junction corresponding Bond graph elements
4. Express the relationships between velocities. Add 0-junction (used to represent those relationships) for each relationship between 1-junctions
5. Place sources
6. Link all junctions taking into account the power direction
7. Eliminate any zero velocity 1-junctions and their bonds
8. Simplify bond graph by condensing 2-ports 0 and 1-junctions into bonds : for example : 1 0 1 is replaced by 1 1
91

92
c fc
1J
f
tc2 2,c
K
2J
c E
1 1J LR fU c
f R
2 2J Li 2 2i
2 2c U1 CK t cc U
fc
2tc
I:J
1Se:c(t)
R:f
0
C:1/K I:J2
1 Se:c2(t)
gyMechanical and electrical analogy

Exercise 1 : mechanical
Mak1
Mb
x
F(t)
MAx
I:Ma
1Se;F(t)
MaF
MAx
R:fa
RF
fa fa
C:1/k1 R:R11
RKx
1RFCF
1
R:fb
MBx
I:Mb
MbF
MbF
fb fb
0
C:1/k1
1kx
MBx
CF
Ma
k1
Mb
x
F(t)
R1
MBx
0
I:Ma
1 1
I:Mb
Se;F(t)
MaF
MBx
R:fa
R:fb
RF
MAx
MbFMAx
93

A quart of vehicle : longitudinal dynamics
0
: roadSf x
R:Rs10
1I:MCarcx
carxC:1/ks
Se:-Mcg
RsF
KsF
Road
Car body
R:Rst1
C:1/kst
stF
1I:Mtire
Se:-Mtg
stx
Suspension
Rst
Kst Tire Mtire
Tire structure
rx
tirex
stx
Car Mcar
tirexsuspx suspx
+
94

A half : longitudinal dynamics
95
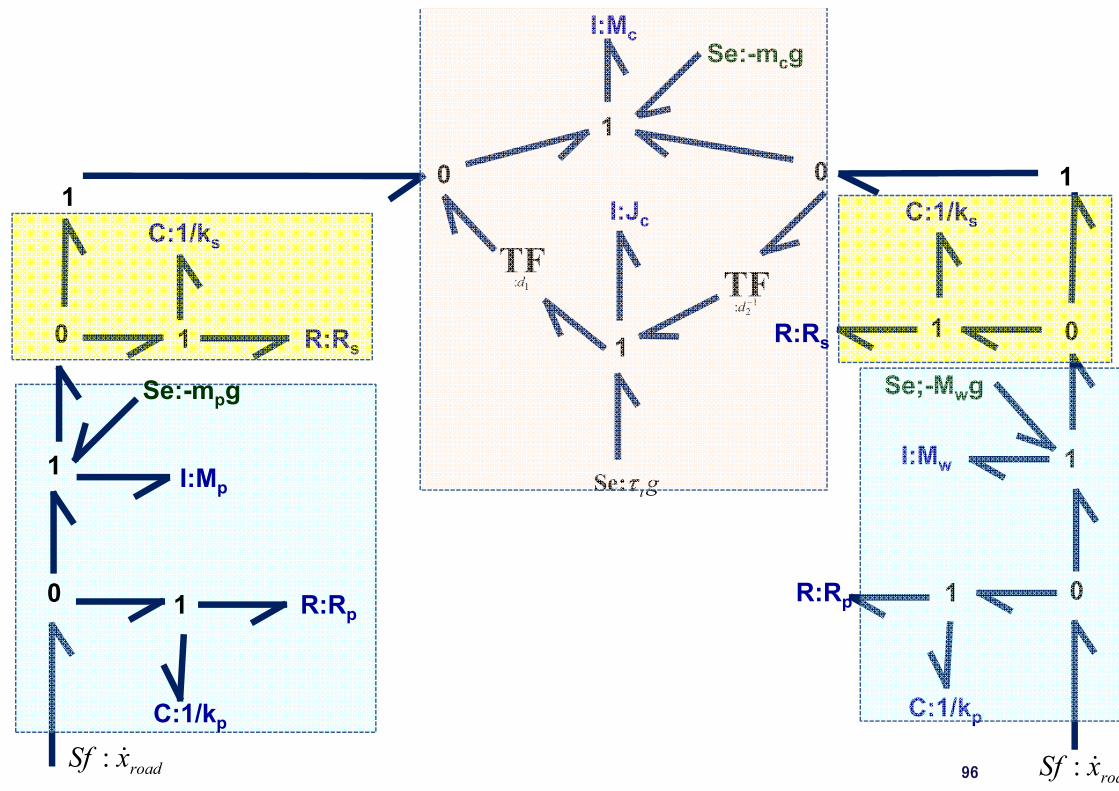
: roadSf x
0 R:Rp
1
Se:-mpg
1
I:Mp
C:1/kp
10
1C:1/ks
R:Rs 1
1
0 0
I:McSe:-mcg
1:TF
d1
2:TF
d
I:Jc
Se: t g
0
: roaSf x
1
01
I:Mw
1
C:1/ks
Se;-Mwg
1
C:1/kp
R:Rs
R:Rp
96

Prof. B. Ould Bouamama Polytech Lille « Integrated Design of Mechatronic Systems using Bond Graphs»
Electro-mechanical sytem
)( FirMGY
IF
1
R:Ra
I:La
Se:UF
IFUR
UI
1
R:Ra
I:La
Se:UA
IAUR
UI
Um
IA1
R:B
I:J
Se:Loadm
m
R
I
97

Prof. B. Ould Bouamama Polytech Lille « Integrated Design of Mechatronic Systems using Bond Graphs»
Exercise 1 : mechanical
1
R:f1
C:1/k1
C:1/k3 R:f2
I:Mb
0
0
1
I:Ma
Se:-F(t)
C:1/k2
1fx
1kx
3kx2fx
MBxMAx
2kx
x MAx MBx
Ma
k2
k3k1
f1
f2
MbF(t)
m1 m2 m3
R3k1 k2 k3 F(t)
+Vref=0m1,f1 m2,f2 m3,f3
98

Prof. B. Ould Bouamama Polytech Lille « Integrated Design of Mechatronic Systems using Bond Graphs»
BUILDING HYDRAULIC MODELS1. Fix for the fluid a power direction
2. For each distinct pressure establish a 0-junction (usually there are tank, compressibility, ….)
3. Place a 1-junction between two 0-junctions and attach to this junction components submitted to the pressure difference
4. Add pressure and flow sources
5. Assign power directions
6. Define all pressures relative to reference (usually atmospheric) pressure, and eliminate the reference 0-junction and its bonds
7. Simplify the bond graph
99

Prof. B. Ould Bouamama Polytech Lille « Integrated Design of Mechatronic Systems using Bond Graphs»
Hydraulic system : ExampleInertia IResistance R1 Resistance R2Pump
P1 P2 P3 P4 Pat
Se:P1 0P10P2 0P3 0P4
Pat01 1 1
R:R1 I
1
R:R2 C
CV
Se:P1 1
R:R1
1 1
IR:R2
0
C
Se:P1
R:R1
1
I
R:R2
C
100

Prof. B. Ould Bouamama Polytech Lille « Integrated Design of Mechatronic Systems using Bond Graphs»
EXAMPLES OF BG MODELS : Hydraulic
0
C:CR
R:R1
Se:PP
PP
1RV
I:l/A
1
P P -PR
PR
1RV 2RV
PR Se:-P0
2RV
P01
R:R2
PR -P0
Valve 1
R2PumpPP
PRLC
P0
De
PID
101

EXERCISES : Mechanical (pneumatic valve)
102
Vanneu(t) x(t)
Block diagramme
Pe : pressure from controller (0,2 -1 bar )x : valve position [0-6 mm]f : friction m : mass of part in motion [kg]1 : Rubbery membrane of section A [m²]2 : Spring of elasticity coefficient Ke [kgf/m]3 : Stem,4 : packing of watertightness, 5 : seating of valve,6 : valve7 : pipe
u
6
4
5
3
2
1
7 x
F
Controlleru
6
4
5
3
2
1
7 x
F
Controller
DEMO

Prof. B. Ould Bouamama Polytech Lille « Integrated Design of Mechatronic Systems using Bond Graphs»
EXERCISES : Bond graph model of the pneumatic valve
Se:Pe 1
C:1/ke
xFk
R:f
Ff
Df x xPe
V
Pneumatic
energy
TF:A
F
x
Mechanical
energy
I:m
FI
103

EXERCISES : Hydraulic control system
104
PID0,2 -1 bar 3 - 15 psi Pe
xsV
eV
P0
LT
T1
De1u
PR

Prof. B. Ould Bouamama Polytech Lille « Integrated Design of Mechatronic Systems using Bond Graphs»
EXERCISES : Bond graph model of the hydraulic system
eVSf : 0 1
R:RV
0: PSe
C:CR
sV
RPRP 0P
1
C:ke
xFk
De:P0
x
x
Pe
VTF:A
F
x
I:m
FI
R:fFf
xDf :
PID
u
ePMSe :
105

Prof. B. Ould Bouamama Polytech Lille « Integrated Design of Mechatronic Systems using Bond Graphs»
EXERCISES Hydraulic systems
106
Patm
F1 F4
P2P1
P3
P4
P5
V1
V2
V3
V4
V6
V5
F3
F2
F5 F6
F7
F8
1) Bond Graph Model
2) Electrical equivalent scheme
R1R2
R3
R4
R5

Prof. B. Ould Bouamama Polytech Lille « Integrated Design of Mechatronic Systems using Bond Graphs»
JUNCTIONS (5/5) : Physical interpretation of the junction elements
Electrical circuits 0-junction : Kirchoff’s currents law 1-junction : Kirchoff’s voltage law
Mechanical systems 0-junction : Geometric compatibility for a situation involving a single force and several
velocities which algebraically sum to zero 1-junction : Dynamic equilibrium of forces associated with a single velocity (Newton’s
law when an inertia element is involved). Hydraulic systems
0-junction : Conservation of volume flow rate 1-junction : requirement that the sum of pressure drops around a circuit involving a
single flow must sum algebraically to zero.
107

Prof. B. Ould Bouamama Polytech Lille « Integrated Design of Mechatronic Systems using Bond Graphs»
EXAMPLES OF BG MODELS :Thermal
C:Cb
0
bQTS
R:Ra
1aQ
TS
TS - TaaQ
Se:-TaTa
aQ
TS
SQSQSf :
Ts
Ta
Source of heat
SQ
108

Electro Mechanical Actuators (EMA)
109
Servo Hydraulic Valve (SHV) : how iy works An electrohydraulic servo valve (EHSV) is an electrically operated valve that controls
how hydraulic fluid is ported to an actuator.
Pipe P: Input pressure(Pressure source) Pipe T: Exhaust
(output to the tank)Patm
Verin
Postion 1:P is connected to A And T to B
Position 2:P is connected to B and T to A
Postion 0:A and B are plugged
Controlled distributor

Prof. B. Ould Bouamama Polytech Lille « Integrated Design of Mechatronic Systems using Bond Graphs» 110
Simple and double acting cylinder : how it works
Compressed air supply : P=PaExhaust : P=0
http://geea.org.pagesperso-orange.fr/PNEUM/distrib_3_2.swf
1) Simple acting

Double acting Cylinder
Se:PaSe:0
xF ,(0,1)u Signal
control
111

Controlled servo valve with two positions cylinder
0
verP
R:R2(u)
xF ,
Se:Pa Se:0
A B
P T
1
1
R:R1(u)
:TF
A
F1
I:MR:f
:TF
A
cF
RF
u
1 u
aP
1P
verP
0
Se:0
0
Se:0
verP
verP
xSe:Pa
Se:Load
Cylinder-Piston
aP
V
V
(0,1)uServo Valve
Signal control
xController
refx
:Df x
0,1u
+
-
C
C: k
Load
112

Application
113

Exercise 2 : Servo valve and suspension
Set point
xx
Controller
To atmosphere
0 TFA
aV
aPx
aF1
C:Cc I:M
:R
C:k:Msf q
xController
Set point
114

Prof. B. Ould Bouamama Polytech Lille « Integrated Design of Mechatronic Systems using Bond Graphs»
Exercises Word Bond graph Bond graph model
115

Prof. B. Ould Bouamama Polytech Lille « Integrated Design of Mechatronic Systems using Bond Graphs»
Chapter 3
CAUSALITY CHAPTER 3: Causalities and dynamic model
• Definitions and causality principle• Sequential Causality Assignment Procedure (SCAP)• Bicausal Bond Graph • From Bond Graph to bloc diagram,• State-Space equations generation• Examples
116

Prof. B. Ould Bouamama Polytech Lille « Integrated Design of Mechatronic Systems using Bond Graphs»
CAUSALITIES Definition
Causal analysis is the determination of the direction of the efforts and flows in a BG model. The result is a causal BG which can be considered as a compact block diagram. From causal BG we can directly derive an equivalent block diagram. It is algorithmic level of the modeling.
Problematic Importance of causal proprieties Simulation Alarm filtering Monitoringability Controllability Observability
117

Convention
118
A BeA B
e
The causal stroke is placed near (respectively far from) the bond graphelement for which the effort (respectively flow) is known.The causal stroke is placed near (respectively far from) the bond graphelement for which the effort (respectively flow) is known.
f
Cause effect relation : effort pushes, response is a flow
Indicated by causal stroke on a bond
Effort pushes
Flow points
A BfA B
f e
(a)
(b)

PRINCIPLE
119
ER1
i UR
Se:E R11
RUiR
R1
i UR
i
Se:E R:R1i
UR
R1Sf:i1RU R i
1 0RU R i
Sf:i R:R1i
UR

Prof. B. Ould Bouamama Polytech Lille « Integrated Design of Mechatronic Systems using Bond Graphs»
CALCULATION EXAMPLE
PR
V
PKV
PR2
KVPV
P1
P
P2
V
R:K
1P1
P2
PR
R:K
1P1
P1
P
120

Prof. B. Ould Bouamama Polytech Lille « Integrated Design of Mechatronic Systems using Bond Graphs»
Remarks about causalities
the orientation of the half arrow and the position of the causalstroke are independent
e
f A B
e
f A B
A Be
System A impose effort e to B
A Bf
System A impose flow f to B e
f
121
Prof. B. Ould Bouamama Polytech Lille « Integrated Design of Mechatronic Systems using Bond Graphs»
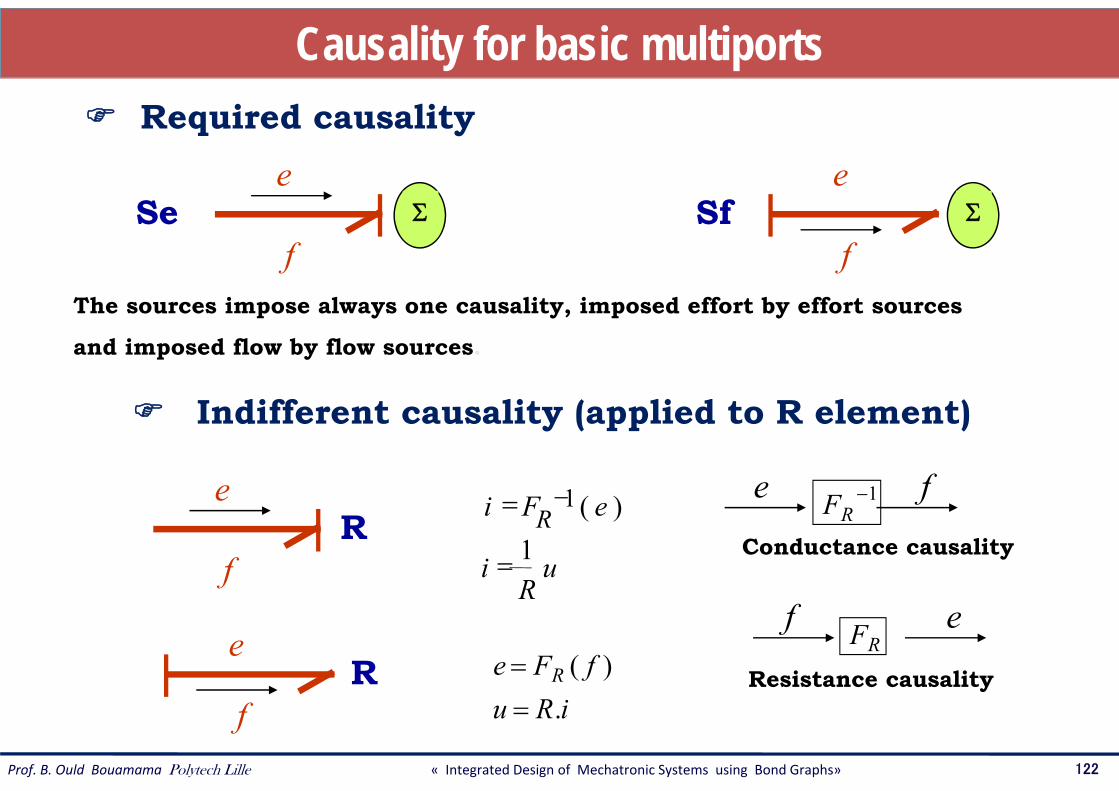
Causality for basic multiports Required causality
The sources impose always one causality, imposed effort by effort sources
and imposed flow by flow sources.
Indifferent causality (applied to R element)
Conductance causality
1RF
uR
i
eFi R1
)(1
fR
e fe
ef
f
eR
iRufFe R
.)(
Resistance causality
RF
fSe
e
fSf
e
122

Prof. B. Ould Bouamama Polytech Lille « Integrated Design of Mechatronic Systems using Bond Graphs»
Integral and derivative causalityPreferred (integral)
causality
fC
dti
Cu
fdtFe C
.1e
f
eI
dtu
Li
dteFf I
.1
. e
f
Ce
dtduCi
dtdeFf C
.
1 fdtde
f I
dtdiLu
dtdfFe I
1 fdtd e
Derivativecausality
123

Prof. B. Ould Bouamama Polytech Lille « Integrated Design of Mechatronic Systems using Bond Graphs»
Causalities for 1-junction
Only 1 bond without causal stroke near 1 - junction
Rule
1e1
e2
e3
e4
f1
f2
f4
f3
Causal Bond Graph model
24
23
21
ffffff
3412 eeee 1-Junction
e1
e4
e3
f2
Block diagramStrong bond
24
23
21
ffffff
3412 eeee e1
e4e3
+
+-
Causality
124

Prof. B. Ould Bouamama Polytech Lille « Integrated Design of Mechatronic Systems using Bond Graphs»
Causalities for 0-junction
Only 1 causal stroke near 0 - junction
Rule
0e1
e2
e3
e4
f1
f2
f4
f3
Causal Bond Graph model
1 2
3 2
4 2
e ee ee e
3412 ffff 0-Junction
f1
f4
f3
e2
Block diagramStrong bond
24
23
21
eeeeee
3412 ffff f1
f4f3
+
+-
Causality
125
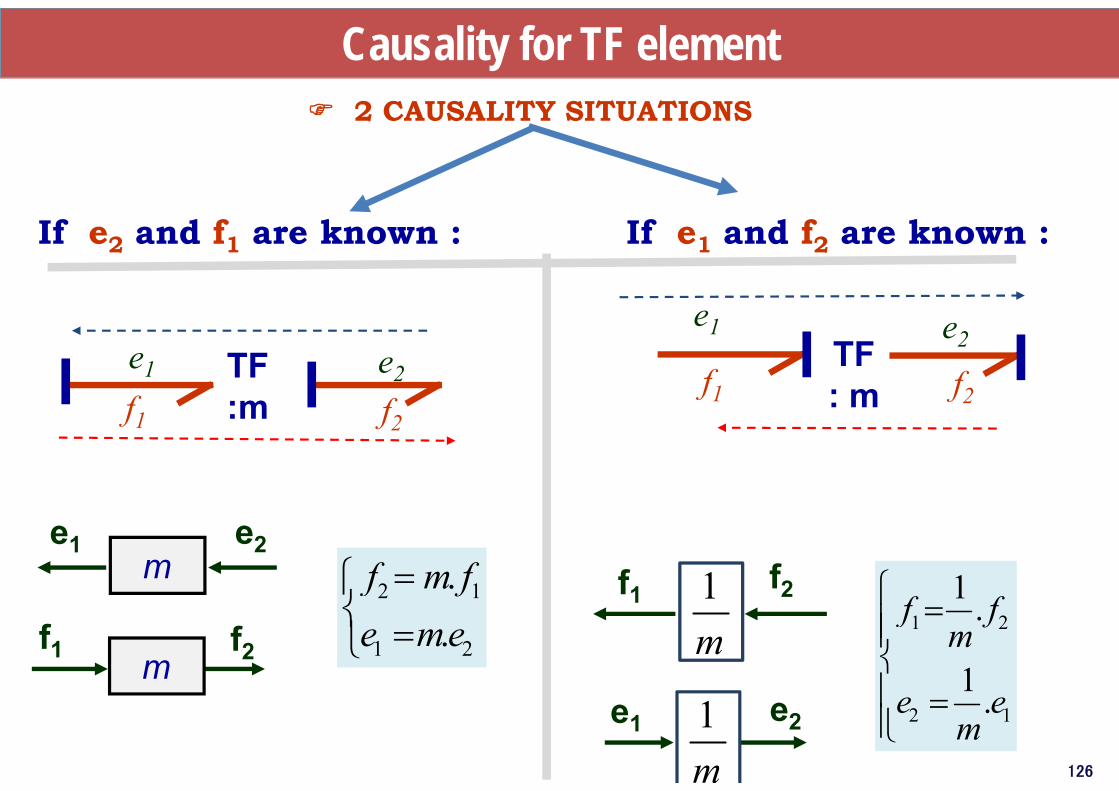
Causality for TF element 2 CAUSALITY SITUATIONS
2 1
1 2
..
f m fe me
f1
TF:m
e1 e2
f2
1mf1
e2
f2
e1
1 2
2 1
1 .
1 .
f fm
e em
f1TF: m
e1
f2
e2
e1
f2
e2
f1
If e2 and f1 are known : If e1 and f2 are known :
m
m1m 126

Causality for GY element 2 CAUSALITY SITUATIONS
1 2
2 1
1/
1/
f r e
f r e
If e2 and e1 are known
f1
GY:r
e1
f2
e2
f2
If f2 and f1 are known
1 2
2 1
..
e r fe r f
f1
GY:r
e1e2
f2
e1
f2e2
f11/r
1/r
e1
f2 e2
f1 r
r
127

Prof. B. Ould Bouamama Polytech Lille « Integrated Design of Mechatronic Systems using Bond Graphs»
Sequential Causality Assignment Procedure (SCAP)
Apply a fixed causality to the source elements Se and Sf
Apply a preferred causality to C and I elements. With simulation, we prefer to avoid differentiation. In other words, with the C-element the
effort-out causality is prefered and with I -element the effort in causality is preferred.
Extend the causality through the nearly junction , 0, 1, TF an GY
Assign a causality to R element which have indifferent causality .
!!! It these operations give a derivative causality on one element, It is usually betterto add other elements (R) in order to avoid causal conflicts. This elements musthave a physical means (thermal losses, resistance …).
128

Prof. B. Ould Bouamama Polytech Lille « Integrated Design of Mechatronic Systems using Bond Graphs»
Four Information given by BG
e
f
Power variables show the type of energy
A B
There exists a physical link between A and B
A supplies power to B
Flow is input for B and effort is output
129

Covering causal path Définion (Causal path)
A causal path between two ports is an alternation of bonds and basic bond graph elements (named nodes) such that (i) all nodes have a correct and complete causality, and (ii) two bonds of the path have in the same node opposite causal stroke direction.
Simple direct Causal path : covered following only one variable (effort or flow).
Indirect causal path : one element (R,C, I) should be crossed along the path
Mixad causal path : it comprises a gyrator (GY) imposing the change of followed variable
130
e1 0 1
f
e0 1 0
f
Passive element (R, C, I
f
e f
f
e1 GY
f
e
f

131
Effort source
0f3
f2
f4
f1
e3
e2
e4
e1
e known
Flow source
Se:e System
Se:e
f Output of Se (of Sf) is aneffort (flow) and is aninput for the system.Rule : The causality is
compulsorySf:f f known System
Sf:fe
Junction 0
ffff ee
eeee
4321
14
13
12 2f
3f 1f(-)
(+)
(-)4f
14
13
12
eeeeee
1e
4
3
2
eee
Junction 1 1f3
f2
f4
f1
e3
e2
e4
e1
eeee ff,ff
ff
4321
14
13
12
Only one flow is allowed to be an input. All others are outputs (here f1 ).
Rule: Only one bond havenot a causal stroke near a 1junction.
Only one effort is allowedto be an input. All othersare outputs (here e1 ).
Rule: Only one bond havecausal stroke near a 0junction.
TF
m:TF1e 2e
2f1f
2f1fm:
TF1e 2e
,mffmee
12
21
,fm
f
em
e
21
12
1
1
Only one effort and oneflow may be inputs
Rule : One causalstroke near TF
r:GY1e 2e
2f1f
r:GY1e 2e
2f1f
,rferfe
12
21
,er
f
er
f
21
12
1
1
Two efforts or two flowsmay be inputs
Rule : Two causal strokeor no one near GY
GY
I
ef
I:I1
I:I1e
f
R ef
R:R1
R:R1ef
Resistance causality:output is an effort
Conductance causality: flow is an output
)( fe R
)(1 ef R
CC:C1
ef
fe
Integral causality:effort is an output
f e
f e
fe
qfdte CC
14
13
12
ffffff
1f
4
3
2
fff
2e
3e 1e(-)
(+)
(-)4e
m
m0
02e 1e
2f1f
f )( fR e
f)(1 eRe
r
r10
01 2f
1f
1e
2e
r
r0
0
2e
1e2f
1f
m
m10
01 2e1e
2f1f
Derivative causality :flow is an output
Integral causality :flow is an output
eC:C1
Element Bond graph Causal equation Bloc diagrams Rule
edtdf C
1
pedtf II
fdtde I
1
fdtC
edtd
C1
edtI
fdtd
I1 Derivative causality :
effort is an output

Prof. B. Ould Bouamama Polytech Lille « Integrated Design of Mechatronic Systems using Bond Graphs»
How to generate simulation diagram from the bond graph model ?
132

Prof. B. Ould Bouamama Polytech Lille « Integrated Design of Mechatronic Systems using Bond Graphs»
From Causal BG to Bloc Diagram (1/3)
1
1R
133

Prof. B. Ould Bouamama Polytech Lille « Integrated Design of Mechatronic Systems using Bond Graphs»
From Causal BG to Bloc Diagram (2/3)
e21/me1
f1f2 1/m
e1me2
f2mf1f1
TF:m
e1
f2
e2
f1
TF:m
e1
f2
e2
f1
GY:r f2
f1
GY:r
e1
f2
e2
e1rf2
e2rf1
f11/re2
f2e1 1/r
f1
e1
f2
e2
e1 e2
134

Prof. B. Ould Bouamama Polytech Lille « Integrated Design of Mechatronic Systems using Bond Graphs»
From BG to Bloc Diagram (3/3)
f6=f4-f5
135

How causal path can help for simulation !
E
R1
g
C
iUc
UR
1
R:R1
C:C1Se:E
EUR
Uc
ie ic
ir
1
1R
For R elemntUR
irURR:R1 1
1R
Ui Rr
For C elementUc
ic
C:C1 1
1C
dtiC
U cc 1
1ic
For 1 junction ❶E
Uc
UR
+
-E
Uc
UR
136

Steps for bloc diagram generation
1
R:R1
C:C1Se:EE
UR
Uc
ie ic
ir
❶Causal graph❶ Causal graph❷ Expansion of causal bonds
to bilateral signal❷ Expansion of causal bonds
to bilateral signal
❸Write constitutive equationfor each element and replace
junction by operators
❸Write constitutive equationfor each element and replace
junction by operators
1
R1
Se C1
URir
ic
UcE
+Se UR
1
1R
ir
Uc -
1
1C
Uc
❹ Use Simulink Software❹ Use Simulink Software
137

Application to Electrical system : BG model
E(t)
L
C
R1
R2V(t)
Se:E(t)E(t)
11
I:L
2
R:R1
3
40
R:R2
5
C
6
22 pe
66 qf
1. BOND GRAPH MODEL
De:e6
138

Prof. B. Ould Bouamama Polytech Lille « Integrated Design of Mechatronic Systems using Bond Graphs»
Application to Electrical system : Block Diagram
E CL
R2 U(t)R1
1
I:L
Se:EE
1
5
0
R:R2
R:R1
64
2
3
C
2
1R
f6
f5
-Se:E
e2
e3
+
-
-
e1
e4
L1 f2
f2(0)
C1 e6
e6(0)
1-Junction e2=e1-e3-e4
f2=f1=f3=f4
0-Junctionf6=f4-f5
e6=e4=e5
1R
139

1
I:L
Se:EE
1
5
0
R:R2
R:R1
64
2
3
C:C1
1
R1 C1
0
L R2
Se
1. Causal graph1. Causal graph 2. Expansion of causal bonds to bilateral signal
2. Expansion of causal bonds to bilateral signal
1R1
1C
:Se E
1L
2 4 3f f f
3f
6e
6 4 5e e e
2f2e
5f2
1R
5e
6f
1e
3e
4f
+ -
-
-
+
3. Write constitutive equationfor each element
3. Write constitutive equationfor each element
2e 2f
4f
4e5e 5f
6f6e3e 3f
140

Application to Hydraulic system: BG model
Se:PP
PP
De:PC
uPID Pref
PC+ -
Pump
P0
PC
P0
PCR2
R1
PP
l
1
PI1
R:R1
I:I1
PR1
1RV PC
0
C:CR
1RV
PCRCV
P0
2RV2RV1
R:R2
PR2
Se:-P0
Atm
osphere
141

Application Hydraulic system: Block Diagram1 junction 11 RCPI PPPP
0 junction 21 RRRC VVV
1 junction 02 PPP CR • Structural laws
• Calcul de CR et I1
dtVAgP
dtPd
gA
dtgPAd
dthAdV RCC
CCRC
)()/(.().(
gAC R
dtPl
AVdtVd
AlAAP
lAmAPFdt
AVdmFe
Ic
RR
cc
cI
ccIcR
111
1
11
..
,.,/, :lawwton N
cAlI
1
• Constitutive equations
I:I1
C:CR
dtPI
V IR 111
1
dtVC
P RCR
C 1
law) (Bernoulli. 2111 RR VRP
law) (Bernoulli2222 RR VRP
R:R1
R:R2
142

Application Hydraulic system: Block Diagram
Se:PPPP
De:PC
uPID Pref
PC+ -
1
PI1
R:R1
I:I1
PR1
1RV PC
0
C:CR
1RV
PCRCV
2RV 1
R:R2
PR2
Se:-P0
2RV
P0
Atm
osphere
+ +-
dtI1Se:PP
PC
PR1
PP
1RV
1R
RC
1
2RV
2
1R
Se:-P0
PR2
PC
--
+ -PI1 RCV
21RV
143

Insulin Pump
cPVoltage source
DC motor
Pinion + Rack Orifice
2
2CF 0P1u
i 1Shaft Piston +
cylinder
End user
1
R:Ra
I:La
R:Rp
:KeGY c1
I:Jp
0
C:1/Kp
:RpTF 1
I:Mc
:ApTF 0
C:Cyl
1 Se:P0Se:u
R:Ror
r
j
ru
Lu
eu2
mc
1
IFu
cQ
0P0rP
i
R:Rc
cv
cQ
cP
orQ
cyQ
orQ
cvCF
RcF
RPFc
c
orQ
144

1
I:Jm
C:1/k
1
R:Ra
I:La
aURU
eU mc
IU aiTF
:1/N0 1
R:fm R:fr Se:-Fp
m sr
I:Jr
Ircr
cfmc
erc srcfrc
m
pc
Imc
: rRTF
Se:Ua:Ke
GY
Voltage source
Electrical part Mechanical part
Reducer Whell
ai
mc
mContact force
aU eU srcsr
pcr
g gModelling and control of Intelligent vehicle
src
145

EXAMPLE (How to avoid derivative causality ?)
E C
i
iC UC
dtdECiC .
E C
Ri
iC UC
C
0E
i
UC
Se:E
iC
Derivative causality
Current infinite ?
dtiC
U RC 1
R
1E
iR
uR iR
0uC
iR
iC
C
uC
Se:E
Integral causality adding R
146

Derivative causality : example
1 TF:b/a 1
I:M1 I:M2
C:1/k
Se:F(t)
Add of elasticity of the body
TF:b/a 1
I:M2
C:1/k
0
C
1
I:M1
Se:F(t)
147

Prof. B. Ould Bouamama Polytech Lille « Integrated Design of Mechatronic Systems using Bond Graphs»
State equations : Définition
Objectif Une représentation d'état permet de modéliser un système dynamique sous
forme matricielle en utilisant des variables d'état. On se place alors dans un espace d'état.
Cette représentation, qui peut être linéaire ou non-linéaire, doit rendre compte de l'état du système à n'importe quel instant futur si l'on possède les valeurs initiales. Cette représentation peut être continue ou discrète.
Un système peut être entièrement décrit à l'aide d'un ensemble de variables minimal. Les variables d'état sont des grandeurs physiques continues du système (elles doivent être dérivables) et doivent être indépendantes les unes des autres.
148

Prof. B. Ould Bouamama Polytech Lille « Integrated Design of Mechatronic Systems using Bond Graphs»
Un vecteur d’état ensemble minimal de variables d’état, c’est-à-dire de grandeurs temporelles,
nécessaires et suffisantes pour déterminer l’évolution future d’un système quand on connaît les équations qui décrivent le fonctionnement du système et les entrées de ce système.
les variables d’état constituent les supports des "souvenirs" du système.
Plus généralement, les variables d’état dans les systèmes physiques sont les éléments aptes à emmagasiner de l’énergie sous forme cinétique ou potentielle : inductances, capacités, masses, ressorts... Ce sont les éléments ayant une capacité de "mémoire".
149

Prof. B. Ould Bouamama Polytech Lille « Integrated Design of Mechatronic Systems using Bond Graphs»
L’idée de base des représentations d’état est que le futur d’un système dépend de son
passé, de son présent et de ses entrées : le futur peut alors être décrit à partir d’un ensemble de variables bien choisies.
Contrairement à l’analyse classique des systèmes qui fait appel à la représentation de Laplace, dans le cas des représentations d’état, l’analyse a lieu dans le domaine temporel. De fait, au cadre de l’analyse des fonctions de la variable complexe se substitue le cadre de l’algèbre matricielle.
150

Prof. B. Ould Bouamama Polytech Lille « Integrated Design of Mechatronic Systems using Bond Graphs»
Intérêt d’une représentation d’état La fonction de transfert Relation entrée/sortie qui n’apporte aucune connaissance sur la structure
interne d’un système. Deux systèmes différents peuvent très bien avoir la même fonction de
transfert., la représentation d’état contient des informations accessibles à lamesure et directement liées aux grandeurs physiques des systèmes. Elleoffre de ce fait des possibilités nouvelles en termes d’analyse et decommande des systèmes.
Un même système complexe pouvant être décomposé de différentesmanières, la représentation d’état n’est pas unique. Bien au contraire, pourun système donné, il en existe une infinité.
le dénominateur de la fonction de transfert correspond au polynômecaractéristique de la matrice d’état : Den[H(p)] = det(pI − A) = QA(p)
151

Représentation d’état et de fonction de transfert
152
Y((s)U(s)W(s)
DuCxy
BuAxdtdx
uxCy
uxfdtdx
,),(
),(PROCESS Capteursx(t) y(t)u(t)

State Equations
nrnmnn CBA
xCyuxFx
cxybuAxx
,,
)(),(
Nonlinear:Linear
SENSORS
ACTUATORSu
CORRECTOR PROCESS
x
y
yc
X-x
System to be controlled
M
A
DfDey
MSfMSeSfSe
u
dttfdtte
qP
xC
I
,Auto. ,
Manual,
)()(
Bond graph
153

Prof. B. Ould Bouamama Polytech Lille « Integrated Design of Mechatronic Systems using Bond Graphs»
STATE EQUATIONThe state vector, denoted by x, is composed by the variables p (impulse) and q (displacement) , the energy variables of C- and I-elements.
Properties the state vector does not appear on the Bond graph, but
only its derivative
The dimension of the state vector is equal to the number of C- and I-elements in integral causality
dttf
dtteqP
xC
I
)(
)(
)(
)(tf
tex
154

Prof. B. Ould Bouamama Polytech Lille « Integrated Design of Mechatronic Systems using Bond Graphs»
HOW TO OBTAIN STATE EQUATION❶. Start from a graph without flow/effort variables marked on bonds
. Fix key variables : input u, state variables x and measurements y
u : Se and Sf x : the derivative of state variables is marked on flow bond for C
element and on effort bond for I element : y: De and Df elements
. Determine unknowns via constitutive relations, junction constraints based on fixed causality (use the equation from the strong bond )
155

State equations : RC Electrical system (1/2)
E
R1
g
C
i
Uc
UR
1
R:R1
C:C1Se:EE
1 C:C1Se:EE
❶ Start from a graph without flow/effort variables marked on bonds
❷ Fix key variables
1x
R:R1
Df:m
Df:m
y 1 1( ) ( ) ( ) ( )
( ): m
x i t x t i t dt q t
u Se ty Df i
The state variable is the charge q(t) but in the Bond graph appears only its derivative (the current)
156

State equations : RC Electrical system (2/2)
1 C:C1Se:E E
R:R1 ❸ determine unknowns (I, Ur and
Uc), via constitutive relations, junction constraints
11R x
1 1/x C
1x1x
1x
1 1
1
1 11 1
1 1 1 1 1 1
1
1 1
1 1 1
1
x xR x E x E x EC R C R C R
xy E xR C
Use of Software for automatic generation of state equation
State equation
Df:m
157

State equations : RLC Electrical system (1/2)
1 C:C1Se:E E
R:R1 ❸determine unknowns via constitutive relations, junction constraints21 /R x L
1 1/x C
1x
I:L
1 12 2
1
21
2
R xx E xL C
xxL
xyL
2 /x L
2 /x L
2x1x
Df:im
y
The state variables are the charge and flux but in the Bond graph appears only their derivatives (the current and voltage)
idtdqxqx
UdtdiLxx
11
22
Cx
CqU
LxUdt
Li
1
21
158

State equations : RLC Electrical system (1/2)
1 C:C1Se:E E
R:R1 ❸determine unknowns via constitutive relations, junction constraints21 /R x L
1 1/x C
1x
I:L
1 12 2
1
21
2
R xx E xL C
xxL
xyL
2 /x L
2 /x L
2x1x
y
The state variables are the charge and flux but in the Bond graph appears only their derivatives (the current and voltage)
idtdqxqx
UdtdiLxx
11
22
Cx
CqU
LxUdt
Li
1
21
159

Se:Ua 1
I:Jm
R:Rm
Se:-L1
R:Ra
I:La
Df:im
Df:m
GY:K
))(()(
)()(
2
1
tttU
x
MJLi
dttdtte
xx
x
Application to DC motor (1/2)
1
2
State variables are:
: Electrical flux=Li
:angular moment=J mm
dx Udt
dJx Jdt
1x U2x
LaU
160

Application to DC motor (2/2)
Se:Ua 1
I:J
R:Rm
Se:-L1
R:Ra
I:La
Df:imDf:m
GY:K
2/mR x J
1 /x L
1 /x L1 /aR x L
1 /x L
2 /x J
2 /x J
1( / )x L k
2 /x J
2( / )x J k
1 1
2 2
1 1
2 2
1 00 1
1 0
10
a
a
Lm
R kx x UL Jx xk R
L J
y xLy x
J
1y 2y
1 21
1 22
11
22
aa
mL
R x xx U kL J
x R xx kL JxyLxyJ
1x 2x
LaU
161
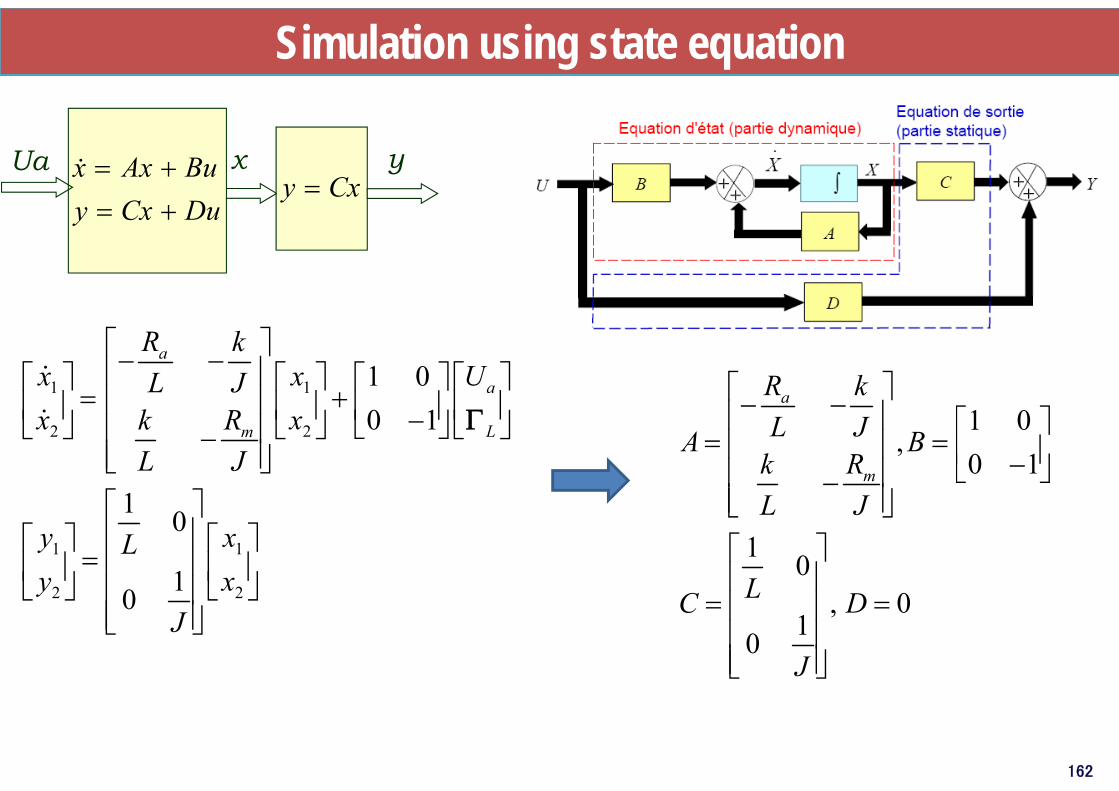
Simulation using state equation
1 1
2 2
1 1
2 2
1 00 1
1 0
10
a
a
Lm
R kx x UL Jx xk R
L J
y xLy x
J
DuCxyBuAxx
Ua y
Cxy x
1 0,
0 1
1 0, 0
10
a
m
R kL JA B
k RL J
LC D
J
162

Simulation using block Diagram
+-
dtLa
1
aR-
Se:Ua
Se:Ua
1
I:Jm
R:Rm
Se:-L1
R:Ra
I:La
Df:im
Df:m
GY:K
aURU
eU m
JIU
IU
RU
i
ik m J dt
Jm1
-mR
kSe:L
-+
2y1y
f
163

Exercises
E CL
R2 U(t)R1
1
I:L
Se:EE
1
5
0
R:R2
R:R1
64
2
3
C
De:e6
CxyBuAxx
u x
y6
6
2
6
2 ,)(, eytESeufe
qp
x
2. STATE EQUATIONS
164

Mechanical system
x1
x2
k1
k2
m2
m1
refxSf :
1
F2
I:m2
2x0
1 I:m1
0
C:k2
C:k1
Se:-m2g
1mx
1x
2mx
Fm2
Se
Fm1
F1
1mx
refx0refx
2mx
1mx
xg
1
F2
I:m2
2x0
1 I:m1
C:k2
C:k1
Se:-m2g
1mx
1x
2mx
Fm2
Fm1
F1
2mx
1mx
Se:-m1g
Se:-m1g
165

Application : do it
1
R:R1
uR1
Se:EE
iR1
iC1
0
C:C1
uC1
iR1
uL1
1
I:L1
iL1
uC1
iL1
TF :m
uR2
iR2
1
R:R2
C:C2
us
L1
E(t) C1
R1
iR1
iC1
iL1 R2 iR2iR2
C2
Df:iR2
12
3
4
5
6
7 8
9
10
S-FUNCTION FROM SYMBOLS
BLOCK_DIAGRAM SIMULINK
COMPARAISON SYMBOLS_SIMULINK 166

Mechanical example
11111221 0 xmxkxxkgm
221222 xmxxkgm
x1
x2
k1
k2
m2
m1
refxSf :
xg
2111 kkm FFgmF
1 I:m2
2kx0
1 I:m1
C:k2
C:k1
Se:m2g
2x
Fm2
Fm1Se:m1g
1kx
1x1x
2x
Fk1
Fk2
Fk2
Fk2
1111111
212212222
xkdtxkdtxkFxxkdtxxkdtxkF
kk
kk
12211111
11
11
xxKxKgmxm
dtFm
x mm
167
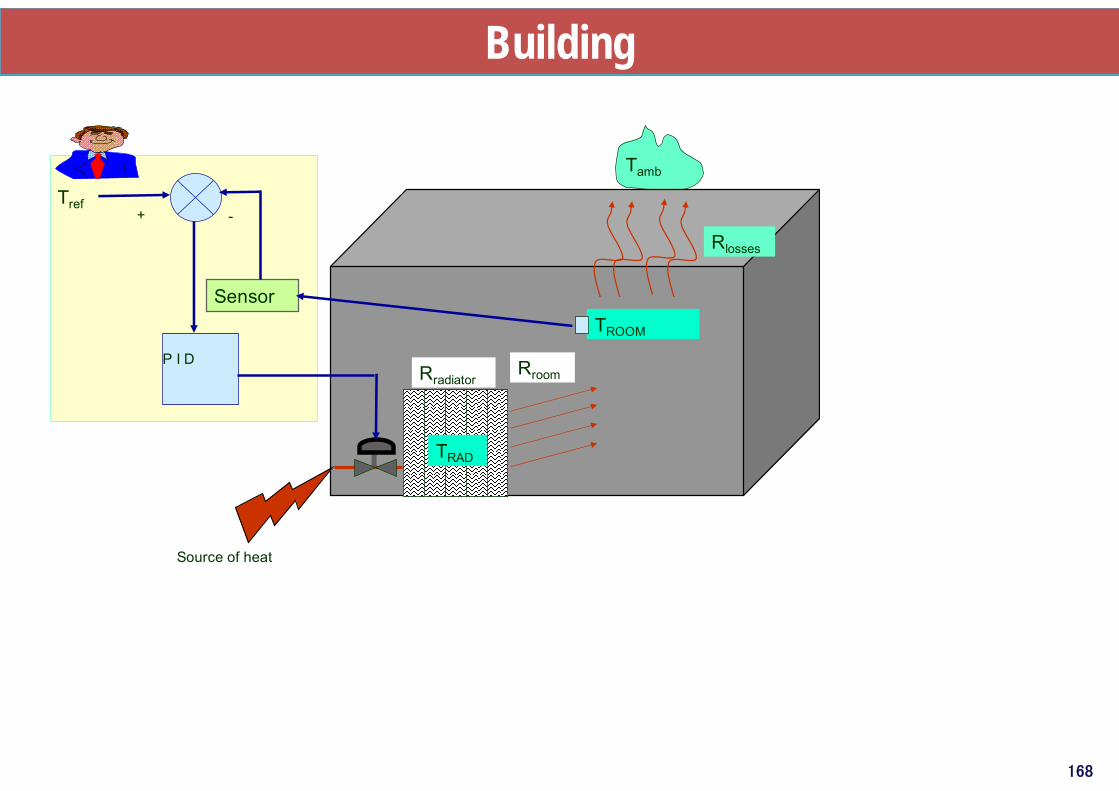
Building
Source of heat
TROOM
Tamb
Tref
P I DRradiator
TRAD
Rlosses
Rroom
Sensor
+ -
168

Exercise : Modelling and simulation
11,c 1 2tc22 , cfc
1J 2J
Kf
1J1f
m2f
2J
11,c
22,c
1mc
2mc
169

Prof. B. Ould Bouamama Polytech Lille « Integrated Design of Mechatronic Systems using Bond Graphs»
COUPLED BOND GRAPHS
• CHAPTER 4: Coupled energy bond graph • Representation and complexity• Thermofluid sources , • Thermofluid Multiport R, C• Examples
Chapter 4Chapter 4
170

Prof. B. Ould Bouamama Polytech Lille « Integrated Design of Mechatronic Systems using Bond Graphs»
INTRODUCTION TO MULTIPORT ELEMENT SINGLE BOND GRAPH : One energy
e
f
The constitutive relation is scalar
MULTIBOND GRAPH : more than one energy Representation : A bond coupled by a ring
The constitutive relation is matrix
e1 , e2 ...
f1, f2 ...
e1 , e2 ...
f1, f2 ...
e1
f1
en
eif2
fn
171

Prof. B. Ould Bouamama Polytech Lille « Integrated Design of Mechatronic Systems using Bond Graphs»
Coupled bond graph
Constitutive equations
0, qec T
T
TPe
Hmnq
0,,,0,,,0,,,
nHmnHmTnHmP
ch
t
h
,,PT
CnmH ,, T
CH
P
m
n
Chemical
Hyd
raul
ic
The
rmal
172

Prof. B. Ould Bouamama Polytech Lille « Integrated Design of Mechatronic Systems using Bond Graphs»
Coupled Bond graphs Representation
E
F
1e1f
ifie
nfne
E
F
(a) (b)
(c)
1
Couplingelement
11e
11f
21e
21f
12e
22e
22f
12f11e
11f
MULTIPORT21e
21f
12e
12f
22e
22f
(d)
E
F
1e1f
ifie
nfne
E
F
(a) (b)
(c)
1
Couplingelement
11e
11f
21e
21f
12e
22e
22f
12f1
Couplingelement
11e
11f
21e
21f
12e
22e
22f
12f11e
11f
MULTIPORT21e
21f
12e
12f
22e
22f
11e
11f
MULTIPORT21e
21f
12e
12f
22e
22f
(d)
173
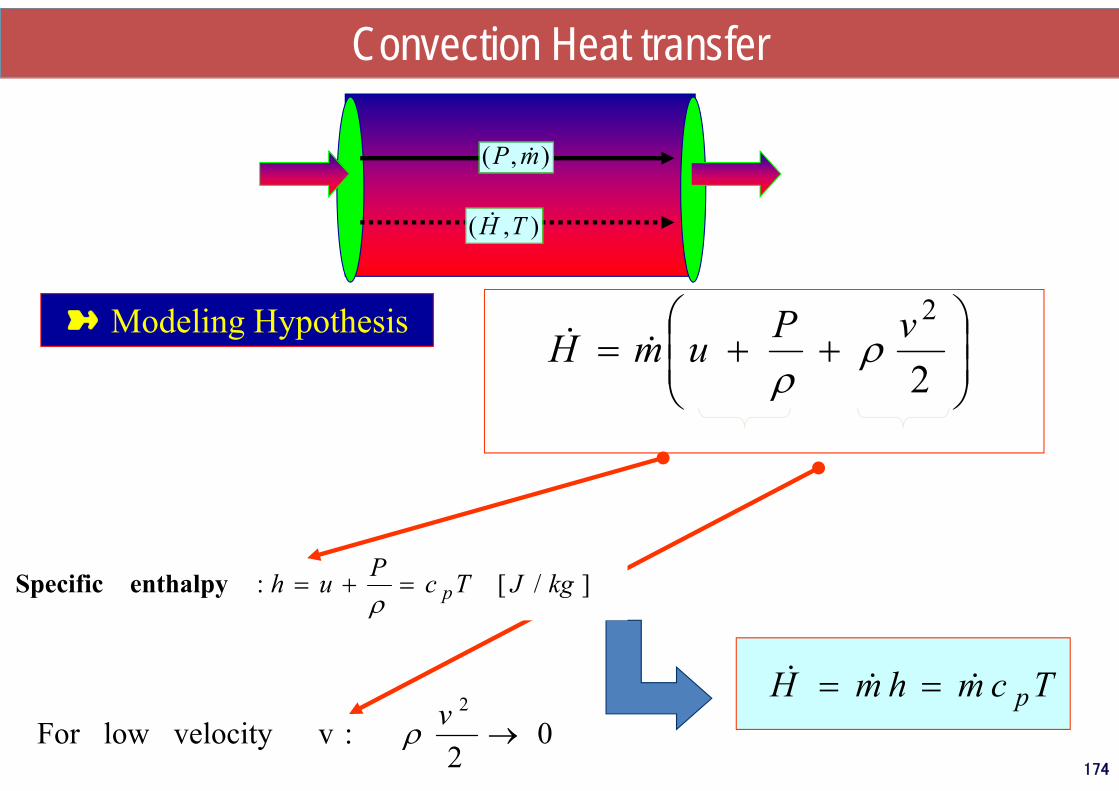
Convection Heat transfer
174
),( mP
),( TH
➽ Modeling Hypothesis
2
2vPumH
TcmhmH p 0
2 : v velocity lowFor
2
v
]/[: kgJTcPuh p
enthalpy Specific

Prof. B. Ould Bouamama Polytech Lille « Integrated Design of Mechatronic Systems using Bond Graphs»
Coupling of thermofluid variables
TcmH p
T
Pm
mSf : 1
m
RcTH
TSe :
Pump as single flow sourcemSfh :
TSe:
1
Rc
Pm
T
H
B) Using R Multiport
H
m
175
TcmH p
T
Pm
mSf : 1
m
CETFTH
TSe :
CETF : Coupling Element for Thermofluid

Prof. B. Ould Bouamama Polytech Lille « Integrated Design of Mechatronic Systems using Bond Graphs»
Example of multiport elements
R MULTIPORT
Representation
(kg/s)flowMass:.)(Joule/secflowEnthalpy:
(pa)Pressure:(Joule/kg)specificEnthalpy :h
(K)eTemperatur:
1mHP
T
1
1
1
11 )(
mPH
hT
2
2
2
22 )(
mPH
hT
1
1
1
11 )(
mPH
hT
11, PT
11, mH R
22 , PT
22 , mH
1P
1HR
2T
2H
1
1T1m
2P
176

Prof. B. Ould Bouamama Polytech Lille « Integrated Design of Mechatronic Systems using Bond Graphs»
Constitutive equation for R-multiport
mmmHHH 2121 , 11 , TcmHhmH p
Physical law ( Continuity)
Constitutive equation
),,,(),,,(),,,(),,,(
2121421213
21212
21211
2
1
2
1
TTPPTTPPTTPPTTPP
HHmm
RR
R
R
12121
2121
)(1
)(1
TcPPPPsignR
PPPPsignR
Hm
ph
h
128
4DRh
177

Prof. B. Ould Bouamama Polytech Lille « Integrated Design of Mechatronic Systems using Bond Graphs»
Inertia of the fluid
IpPdt
lAm
dtAmd
lAdtdvmAPF
Ic
cccc
2.
1HRc
2T
2H1T
Thermal power
Hydraulic power
1P1
1m
2P
2m
RI
➽ Impulse of pressure p l
178
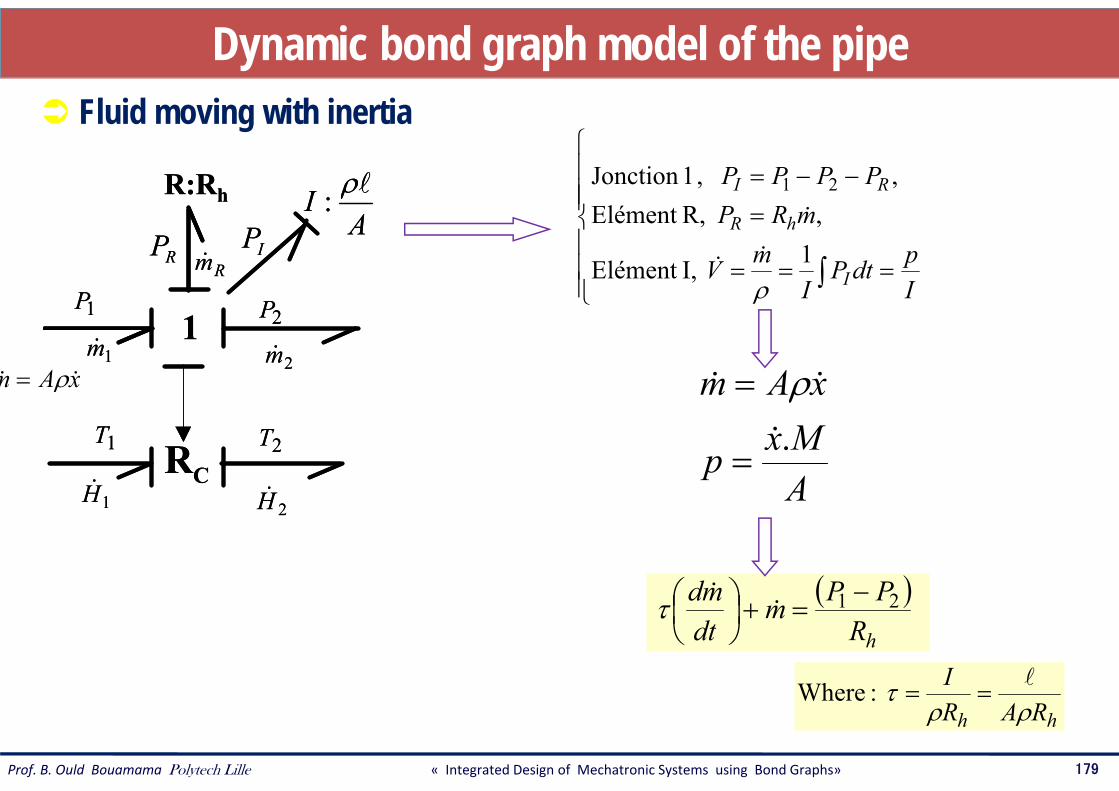
Prof. B. Ould Bouamama Polytech Lille « Integrated Design of Mechatronic Systems using Bond Graphs»
Dynamic bond graph model of the pipe Fluid moving with inertia
11m
2m
1H2H
RC
2P
R:Rh
1T
1P
AI :
RP IP
2T
Rm
11m
2m
1H2H
RC
2P
R:Rh
1T
1P
AI :
RP IP
2T
Rm
IpdtP
ImV
mRPPPPP
I
hR
RI
1 I,Elément
, R,Elément , , 1Jonction 21
AMxp
xAm.
xAm
hRPPm
dtmd 21
hh RARI
:Where
179

Prof. B. Ould Bouamama Polytech Lille « Integrated Design of Mechatronic Systems using Bond Graphs»
Bond graph model of the pipe Global Model
Step response for hydraulic model to pressure difference
1
21
TcmHR
PPmdtmd
p
h
)0(11)( mePR
tmt
eh
180

Prof. B. Ould Bouamama Polytech Lille « Integrated Design of Mechatronic Systems using Bond Graphs» 181
Thermofluid C multiport : Saturated regim boiler (2/2)
0hl
Deh,p
0tl
Deh,l
QSf t:
1
01ext TSe :
RfmRme
Cm
0hv
0tvDet
2 3
16
17
1418
20
21
22
2324
5 6
8
9
10 11
15
25
26
Thermal losses
Liquide phase
Steam phase
Evaporation
RC:CL C:CV
❷❷ Two separated phase

Prof. B. Ould Bouamama Polytech Lille « Integrated Design of Mechatronic Systems using Bond Graphs» 182
Thermofluid C multiport : Saturated regim boiler (1/2)
X : Steam quality [0, 1]P : Pressure in the boilerT : Temperature of the mixtureL : Level of the waterhi(P): Thermodynamic function (of vaport and liquid)
aQ
cHT
0hemSf :
0t
C:Cht
eTSe :sHeH
emC
mP
PP
TT
sm
saec
sec
HQHHmmm
dtHQHH
dtmmm
saec
sec
em
eHaQ
sH
cm
cH
( ) ( )(1 )
( ) ( )(1 )
cc v L
c
cc v L
c
Hh h P X h P Xmm P X P XV
P
X
( )T P
(1 ) cX m
T
L
e e p eH m c T
s s vH m c T
,,e e
e
H mTe P
,,s sH m
T P
c
c
Hm
❶❶ Monophase mixture

Prof. B. Ould Bouamama Polytech Lille « Integrated Design of Mechatronic Systems using Bond Graphs»
Thermofluid example : heated tank (undersaturated)
Pe
l
eQ
Po=0
H,m
Two ports C
Tex
One ports C
Q
Te
T
TexQPeu
QmHpx
State variablesI element : p
183

Bond graph model
De:T
De:L
ePSe:
C
Pm
01
5
7
T
02
H13
et QSf : 14
eTSe:eH
Rc115 16
em
exTSe:
13
1403
R:RexRm
Am
bian
ce
C
Q T18Q
20Q
17
18
19
20
21
22
23
sm10
Envi
ronn
emen
t
Se:P
0=0
R:Rs
12
6
8
9
Rc21112
sH sH
11
R:ReI:I1
1
2 3
4
em
184

Constitutive equations (1/4)
Jonction 11
325
34
32
31
325
34
32
31
4234213
mmmmmmmm
ffffffff
PPPPeeee e
Elém ent R :Re 232
23.2Re2 mRPPfR)(fΦe ee
333333 )0(1)0(1 mmpI
fdteI
f
Jonction 01
76
75
74
76
75
74
647647
PPPPPP
eeeeee
mmmmmfff se
Elément I:l/A
185

Constitutive equations (2/4)
Jonction 02
1318
1317
1316
1314
1312
1318
1317
1316
1314
1312
1812216131812141613 )(
TTTTTTTTTT
eeeeeeeeee
QHuQHUfffff e
Multiport C : CR 777
71371377Rh )0(1),(),(C:C PPCmdtf
Cdtfdtfqqe
hhChCh
hCm
Amg
AVggLPe 777
77
niveau dans le réservoir indiqué par le capteur De :L
Am
gPL 77
186

Constitutive equations (3/4)
Capacité thermique
)0()(
1),(),(C:C 137
1313
71313713713Rt T
mcUdtU
mCTdtfdtfqqe
VtCtCt
Température indiquée par le capteur De :T 7
1313 mc
UTV
Jonction 12
8109681096
68968 mmmmffff
PPPeee s
Vanne de réglage R :Rs
).()().(.)(
188
1888
188
18 PPsign
Rummeesign
Rueesign
uRf
ss
ss
Eléments R : Rm et R :Ra
aaa
mm
TTR
QeeR
f
TTR
QeeR
f
2223242223
201819201819
11
11
187

Constitutive equations (4/4)
J onction 13 et 14
2324232223242322
2223242223
1920191819201918
201819201819
,,
et,,
QQQQffffTTTeee
QQQQffffTTTeee
a
Elément C :Cm : stockage d’énergie Q par le métal du réservoir
)0()0(121
2121212121 T
CQTedtf
Ce
mm
Jonction 03
2122212021222120
222021222021
,,
TTTTeeeeQQQfff
Eléments de couplage RC1 et RC2
1381112101211C2
31615251516C1
:R
:R
TcmHHecfff
TcmHHecfff
psp
epep
188

Prof. B. Ould Bouamama Polytech Lille « Integrated Design of Mechatronic Systems using Bond Graphs»
Global Dynamic Model
7
13
7
21
7
1321
221771
7
13313
77137
72
33
11
1
mcUAm
TL
y
RT
RRCQ
RcmUQ
)(uQCR
QPCmP
Cmsign
Ruc
RmcUTc
IpU
PCmP
Cmsign
Ru
Ipm
Cm
IpRPp
V
a
a
ammmV
emm
sh
shs
pmV
ep
sh
shs
hee
189

Prof. B. Ould Bouamama Polytech Lille « Integrated Design of Mechatronic Systems using Bond Graphs»
Simulation using State equations format
),( uxfu x
x(0)
)(xCyx
x
SimulinkSimulink
Generation of S-function from Symbols2000Generation of S-function from Symbols2000
190

From BG to Block Diagram
-
1
1IePSe :
e2
f2)( 3Re f
f3e3 )( 7 dtfCh
e4
e8
-e7e1 f4
f7
f6
)( 8eu Rscf8
f6-+
sPSe :
),( 137 dtfdtfCte13
e6
e17f13
f12=f11
2.. fTc epeTSe :f2 f16
10132 ..: fecR pc
)( 19fRm),( 20 dtfCm
e20
e19f20 f19e22
+-
f21e21
e12
f22
e23
+
)( 22Re exe23
TaSe :-
+
-
f18
f18
-
e24
+e4
-+ f10
-+
f23
De:L ge /7
De:T
11 01
LC
uce5
12
RC1 RC2e18
03
13
14
e20
02
eQMSf :+
TC
-
1
1IePSe :
e2
f2)( 3Re f
f3e3 )( 7 dtfCh
e4
e8
-e7e1 f4
f7
f6
)( 8eu Rscf8
f6-+
sPSe :
),( 137 dtfdtfCte13
e6
e17f13
f12=f11
2.. fTc epeTSe :f2 f16
10132 ..: fecR pc
)( 19fRm),( 20 dtfCm
e20
e19f20 f19e22
+-
f21e21
e12
f22
e23
+
)( 22Re exe23
TaSe :-
+
-
f18
f18
-
e24
+e4
-+ f10
-+
f23
De:L ge /7
De:T
11 01
LC
uce5
12
RC1 RC2e18
03
13
14
e20
02
eQMSf :+
TC
191

Prof. B. Ould Bouamama Polytech Lille « Integrated Design of Mechatronic Systems using Bond Graphs»
SYSTEMES CHIMIQUES
192

Prof. B. Ould Bouamama Polytech Lille « Integrated Design of Mechatronic Systems using Bond Graphs»
Physico chemical processes (1/4)
in
in
in
in
mPHT
Gaz
)(,1
)(
,
*,
,
tsconstituennj
T
n
p
x
mixtureGaz
mPHT
c
out
outj
outj
outj
out
out
out
out
HnnnXcc nn 11 ..
:variablesState
nc constituents
Types of applications : distillation column, fuel cell,..
c
inj
j
inj
nj
n
p
x
,1
,
*
,
cpj
j njc
M,1
Variables Parameters
193

Physico chemical processes (2/4)
H
T
m
P
Thermique
Hydraulique
Mixture
➽ A) Used variables
*ncP
ncn
Chemical
*1P
1n
*iP
inConstituents
➽ B) Mixture to constituents transformation ?
ncn
),1(. niMxmn
i
ii *
iPin
*1P
mP 1n
*ncP
194

Physico chemical processes (3/4)
1
TFMx 11 /
TFii Mx /
TFnn Mx /
m
e
e
e
e
Mixture (gaz)
Specie 1
Specie i
Specie nc
e
e
1n
in
ncn
m
m
m
),1(. ci
ii ni
Mxmn
➽ D) Use a transformer
mSf : P
ncn
*ncP
1n*
iP
in
*1P
m
PBloc
iini Mx ,,
➽ C) Use a bloc diagramme
195

Physico chemical processes (4/4)
P
inm1
Rc
INPUT
inT
inH
Gaz (mixture)
inm
iini Mx ,,
inn ,1
inncn ,
inin ,
outn ,1T H
outin ,
ncn
0
C
0
0
0
0
nn
1n
in
*1P
*iP
*nP
1
Rc
OUTPUT
ii Mx ,
outm
outH
outm
outm
outH
196
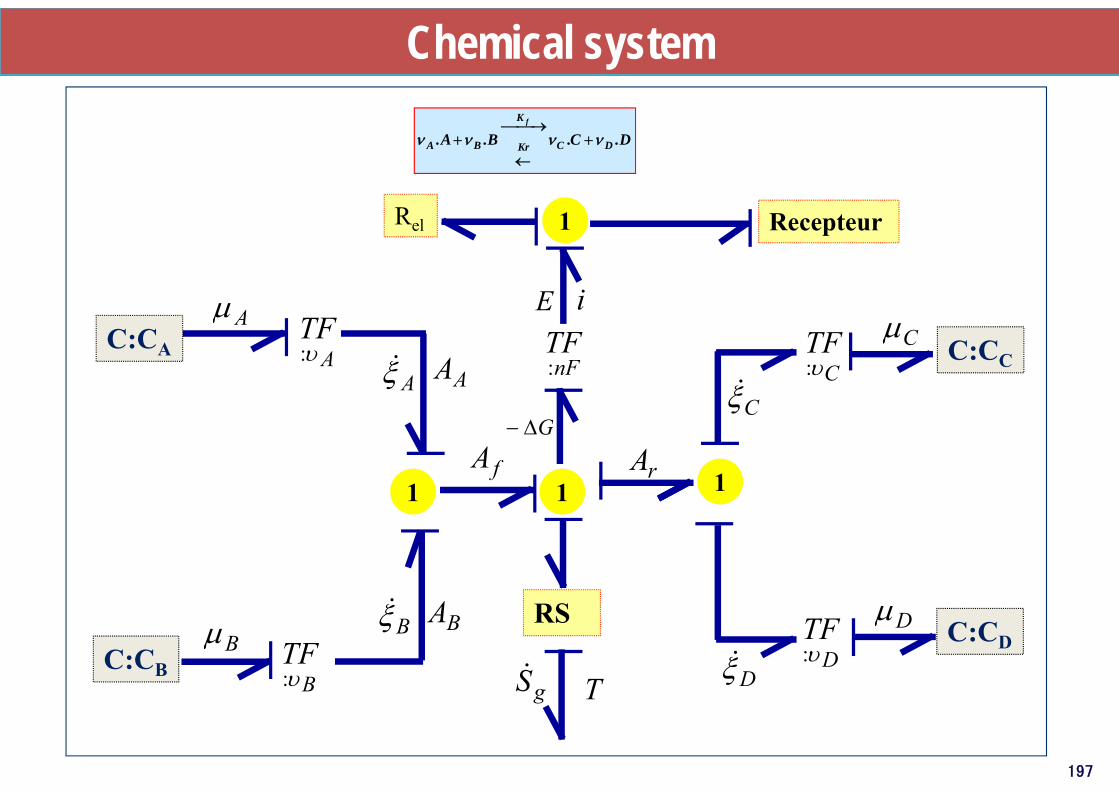
Chemical system
. . . .fK
A B C DKrA B C D
gS T
RS
fA rA1 1
E
nFTF:
Recepteur
i
Rel 1
G
ATF:
AAAC:CA
A
BTF:
BABC:CB
B
C:CC
C:CD
CTF:
DTF:
1
C
D
C
D
197

Prof. B. Ould Bouamama Polytech Lille « Integrated Design of Mechatronic Systems using Bond Graphs»
Electrochemical Process
198

Electrochemical Model
Chimique-électrique
Production H2O
Distribution de la tension
199

Prof. B. Ould Bouamama Polytech Lille « Integrated Design of Mechatronic Systems using Bond Graphs»
Integrated models: Thermoéconomie Thermoéconomie : modeste contribution [cf. réfence : Oud bouamama « Integrated Bond graph modelling in
Process Engineering linked with Economic System ». European Simulation Multiconference ESM'2000, pp. 23-26, Ghent (Belgique), Mai 2000 ]
B
A
B
A
B
A
H
H
mmCC
D
C
D
C
D
C
H
H
mmCC
DCBA DCK
K
BAr
f
MarketplaceexQ
Heater
Market place
Reactor
Inlet
Outlet
200

Chemical modelTransformation Products of reactionReactants A and B
TF:1/A
A
TF:1/D
TF:1/B
TF:1/C
C
DA
nDAAnA ArAf
nC
11
Dissipation
RS
C:CD
ABB
BnB
1
C:CA
C:CCC:CB
TggS
To thermofluid model201

Prof. B. Ould Bouamama Polytech Lille « Integrated Design of Mechatronic Systems using Bond Graphs»
Thermofluid model
BB HmSf ,:
exQSf :
De
0
C :CRDD HmSf ,:
CHSf :
PR
Cm
TR
CHAA HmSf ,:
From chemical model
To economicmodel
202

Prof. B. Ould Bouamama Polytech Lille « Integrated Design of Mechatronic Systems using Bond Graphs»
Economic model
FAm
Reinvestment
R:RT
R:RDC
1
FA
÷÷
10
/0CUC
mP
R:RSC
Supplier
Factory inventory
PUC
Cm
PSC
PFA
PIA
DCm SC
m
IAm
From hydraulic
model
I:IA
C:C
203

Global integrated model
BB HmSf ,:
FAm
I:IAexQSf :
D e
0
C :C R
R :R T R :R D C 1
C :C FADD HmSf ,:
CHSf :
P R
Cm
10/0 CUC mP
R :R S C
S u pp lier
fac to ry in ven to ry
H yd rau lic a nd the rm a l m o d e l E co no m ic m o d e l
C he m ica l m o d e l
T ran s fo rm atio n P ro du cts o f reac tio nR eac tan ts A an d B
T F:1 / A
A
T F:1 / D
T F:1 / B
T F:1 / C
C
D A
n DA An A ArA f
n C
11
D issip a tio nR S
C :C D
A B B
Bn B
1
C :C A
C :C CC :C B
T ggS
P U C
Cm
T R
CHP SC
P F A
P IA
DCm SCmIAm
AA HmSf ,:
R ein vestm en t
204

Prof. B. Ould Bouamama Polytech Lille « Integrated Design of Mechatronic Systems using Bond Graphs»
BB HmSf ,:
FAm
I:IA exQSf :
De
0
C :CR
R:RT R:RDC 1
C:CFADD HmSf ,:
CHSf :
PR
Cm
10/0 CUC mP
R:RSC
Supplier
factory inventory
Hydraulic and thermal model Economic
Chemical model Transformation Products of reaction Reactants A and B
TF :1/A
A
TF :1/D
TF :1/B
TF :1/C
C
D A n D
A An A ArA f
nC
11
Dissipation R
C:C
AB B Bn B
1
C:C
C:CC:C
TggS
PUC
Cm
TR
CH
PSC
PFA
PIA
DCm SCmIAm
AA HmSf ,:
Reinvestment
205

Prof. B. Ould Bouamama Polytech Lille « Integrated Design of Mechatronic Systems using Bond Graphs»
PART 5
Automated modellingCHAPTER 5: Automated Modeling and Structural analysis
Bond Graph Software's for dynamic model generationIntegrated Design for Engineering systemsBond Graph for Structural analysis (Diagnosis, Control, …)Application
206

Prof. B. Ould Bouamama Polytech Lille « Integrated Design of Mechatronic Systems using Bond Graphs»
Why Bond graph is well suited The bond graph model :
can be supported by specific software: the model can be graphically introduced in the software and generate
automatically the dynamic model. It can be completely and automatically transformed into a simulation
program for the problem to be analyzed or controlled or monitored. See http://www.arizona.edu/bondgraphs.com/software.html
Bond graph suited for automatic modelling Graphical tool Unified language Causal and structural properties Systematic derivation of equations
207

Prof. B. Ould Bouamama Polytech Lille « Integrated Design of Mechatronic Systems using Bond Graphs»
Main Softwares (3/5)
CAMP-G : The Universal Bond Graph Preprocessor for Modeling and Simulation of Mechatronics Systems.
is a model generating tool that interfaces with Languages such as MATLAB® / SIMULINK®, ACSL® and others to perform computer simulations of physical and control systems
Based on a good GUI, doesn't support object based modeling. Equations derived are neither completely reduced nor sorted properly.
20-sim : Twente Sim the simulation package from the University of Twente. Modeling and simulation program that runs under Windows. Advanced modeling and simulation package for dynamic systems that supports
iconic diagrams, bond graphs, block diagrams, equation models or any combination of these. allows interaction with SIMULINK®.
good product recommended for modeling of small to medium sized systems. The graphics and hard copy output quality is poor.
Not control analysis support.
208

Prof. B. Ould Bouamama Polytech Lille « Integrated Design of Mechatronic Systems using Bond Graphs»
Main Softwares (4/5)
Bond graph tool box for Mathematica this toolbox features a complete embedding of graphical bond graph in the
Mathematica symbolic environment and notebook interface Till review, the tool box did only support basic bond graph elements and junction
structures. Recommended for tutorial use in modeling of very small simple systems.
MS1 : BG modeling software from Lorenz Simulation is a modeling workbench developed in partnership with EDF (Electricité de France),
which allows free combination of Bond Graph, Block Diagram and Equations for enhanced flexibility in model development.
Models can be introduced in Bond Graph, Block Diagram or directly as equations MS1 performs a symbolic manipulation of the model (using a powerful causality
analysis engine) and generates the corresponding simulation code.
209

Prof. B. Ould Bouamama Polytech Lille « Integrated Design of Mechatronic Systems using Bond Graphs»
Main Softwares (5/5) Modelica : Object-Oriented Physical System Modeling Language
This is a language designed for multi domain modeling developed by the Modelica Association, a non-profit organization with seat in Linköping, Sweden.
Models in Modelica are mathematically described by differential, algebraic and discrete equations.
SYMBOLS 2000 : SYstem Modeling in BOndgraph Language and Simulation Allows users to create models using bond graph, block-diagram and equation models.
Large number of advanced sub-models called Capsules are available for different engineering and modeling domains.
has a well-developed controls module, that automatically transforms state-space modules from BG or block diagram models and converts them to analog or digital transfer functions. Most control charts and high-level control analysis can be performed. This software is recommended for use in research and industrial modeling of large systems.
FDI analysis tool boox is developed by B. OUL DBOUAMAMA & A.K. Samantaray
210

Prof. B. Ould Bouamama Polytech Lille « Integrated Design of Mechatronic Systems using Bond Graphs»
Some demonstrations using SYMBOLS 2000 and 20sim
From BG model to Matlab S-functionFrom BG model to Matlab S-functionGUI interfaceGUI interface
211

Prof. B. Ould Bouamama Polytech Lille « Integrated Design of Mechatronic Systems using Bond Graphs»
CONCLUSIONS Modelling
Unified representation language Shows up explicitly the power flows Makes possible the energetic study Structures the modeling procedure Makes easier the dialog between specialists of differents physical domains Makes simpler the building of models for multi-disiplinary systems Shows up explicitly the cause - to efect relations (causality) Leads to a systematic writing of mathematical models (linear or non linear associated
Simulation Specific softwares (CAMAS, CAMP+ASCL, ARCHER, 20 SIM) A priori knowledge of the numerical problems which may happen (algebraic-differential
equation, implicit equation) by the means of causality Physical meaning of the variables associated with the bon-graph mode For fast Prototypage
Control, monitoring
212

Prof. B. Ould Bouamama Polytech Lille « Integrated Design of Mechatronic Systems using Bond Graphs»
Many Thanks
213
Any comments are [email protected]