Embed Size (px)
Citation preview

Robles et al. BMC Genomics 2012, 13:484http://www.biomedcentral.com/1471-2164/13/484
RESEARCH ARTICLE Open Access
Efficient experimental design and analysisstrategies for the detection of differentialexpression using RNA-SequencingJose A Robles1, Sumaira E Qureshi2, Stuart J Stephen1, Susan R Wilson2,3,Conrad J Burden2 and Jennifer M Taylor1*
Abstract
Background: RNA sequencing (RNA-Seq) has emerged as a powerful approach for the detection of differential geneexpression with both high-throughput and high resolution capabilities possible depending upon the experimentaldesign chosen. Multiplex experimental designs are now readily available, these can be utilised to increase thenumbers of samples or replicates profiled at the cost of decreased sequencing depth generated per sample. Thesestrategies impact on the power of the approach to accurately identify differential expression. This study presents adetailed analysis of the power to detect differential expression in a range of scenarios including simulated null anddifferential expression distributions with varying numbers of biological or technical replicates, sequencing depths andanalysis methods.
Results: Differential and non-differential expression datasets were simulated using a combination of negativebinomial and exponential distributions derived from real RNA-Seq data. These datasets were used to evaluate theperformance of three commonly used differential expression analysis algorithms and to quantify the changes inpower with respect to true and false positive rates when simulating variations in sequencing depth, biologicalreplication and multiplex experimental design choices.
Conclusions: This work quantitatively explores comparisons between contemporary analysis tools and experimentaldesign choices for the detection of differential expression using RNA-Seq. We found that the DESeq algorithmperforms more conservatively than edgeR and NBPSeq. With regard to testing of various experimental designs, thiswork strongly suggests that greater power is gained through the use of biological replicates relative to library(technical) replicates and sequencing depth. Strikingly, sequencing depth could be reduced as low as 15% withoutsubstantial impacts on false positive or true positive rates.
Keywords: RNA-Seq, Differential expression analysis, Sequencing depth, Replication, Experimental design, Multiplex
BackgroundRNA sequencing (RNA-Seq) allows an entire transcrip-tome to be surveyed at single-base resolution whilst con-currently profiling gene expression levels on a genomescale [1]. RNA-Seq is an attractive approach as it pro-files the transcriptome directly through sequencing andtherefore does not require prior knowledge of the tran-scriptome under consideration. An example of the use of
*Correspondence: [email protected] Plant Industry, Black Mountain Laboratories, Canberra, AustraliaFull list of author information is available at the end of the article
RNA-Seq as a high-resolution exploratory tool is the dis-covery of thousands of additional novel coding and non-coding genes, transcripts and isoforms of known genesdespite the prior extensive annotation of the mouse [2-4]and human genomes [5,6].Arguably, the most popular use of RNA-Seq is profil-
ing of gene expression or transcript abundance betweensamples or differential expression (DE). The efficiency,resolution and cost advantages of using RNA-Seq as a toolfor profiling DE has promptedmany biologists to abandonmicroarrays in favour of RNA-Seq [7,8].
© 2012 Robles et al.; licensee BioMed Central Ltd. This is an Open Access article distributed under the terms of the CreativeCommons Attribution License (http://creativecommons.org/licenses/by/2.0), which permits unrestricted use, distribution, andreproduction in any medium, provided the original work is properly cited.
Robles et al. BMC Genomics 2012, 13:484 Page 2 of 14http://www.biomedcentral.com/1471-2164/13/484
Despite the advantages of using RNA-Seq for DE anal-ysis, there are several sources of sequencing bias and sys-tematic noise that need to be considered when using thisapproach. Clearly, RNA-Seq analysis is vulnerable to thegeneral biases and errors inherent in the next-generationsequencing (NGS) technology upon which it is based.These errors and biases include: sequencing errors (wrongbase calls), biases in sequence quality, nucleotide compo-sition and error rates relative to the base position in theread [9,10], variability in sequence depth across the tran-scriptome due to preferential sites of fragmentation, vari-able primer and transcript nucleotide composition effects[11] and finally, differences in the coverage and composi-tion of raw sequence data generated from technical andbiological replicate samples [1,12].Recently, there have been several investigations
[13-15] into the biases that affect the accuracy with whichRNA-Seq represents the absolute abundance of a giventranscript as measured by high precision approachessuch as Taqman RT-PCR [16]. It has been shown thatthese abundance measures are prone to biases corre-lated with the nucleotide composition [14,17] and lengthof the transcript [1,18]. Several within and betweensample correction and normalisation procedures haverecently been developed to address these biases either asnucleotide composition effects [17] or various combina-tions of nucleotide, length or library preparation biases[14,15]. These approaches all yield improvements in thecorrespondence of RNA-Seq read counts with expressionestimates gained by other experimental approaches.Despite the known biases, RNA-Seq continues to be
widely and successfully used to profile relative tran-script abundances across samples to identify differentiallyexpressed transcripts [19]. The profile of a given tran-script across a biological population would be hopedto be less prone to nucleotide composition and lengthbiases as these variables remain constant. Nevertheless,to accurately detect DE across samples it is necessaryto understand the sources of variation across technicaland biological replication and where possible respond tothese with an appropriate experimental design and sta-tistically robust analysis [17,20]. To date, there has beenlittle discussion in the literature of efficient experimentaldesigns for the detection of DE and a lack of consen-sus about a standard and comprehensive approach tocounter the many sources of noise and biases present inRNA-Seq has meant that some of the biological com-munity remain sceptical about its reliability and unsureof how to design cost-efficient RNA-Seq experiments(see [19]).Good experimental design and appropriate analysis is
integral to maximising the power of any NGS study.With regard to RNA-Seq, important experimental designdecisions include the choice of sequencing depth and
number of technical and/or biological replicates to use.For researchers with a fixed budget, often a critical designquestion is whether to increase the sequencing depthat the cost of reduced sample numbers or to increasethe sample size with limited sequencing depth for eachsample [20].
Sequencing depthSequencing depth is usually referenced to be the expectedmean coverage at all loci over the target sequence(s), inthe case of RNA-seq experiments assuming all transcriptshaving similar levels of expression. Without the benefit ofextensive previous RNA-Seq studies, it is difficult in mostcases to estimate prior to data generation the optimalsequencing depth or amount of sequencing data requiredto adequately power the detection of DE in the tran-scriptome of interest. Pragmatically, RNA-seq sequencingdepth is typically chosen based on an estimation of totaltranscriptome length (bases) and the expected dynamicrange of transcript abundances. Given the dynamic natureof the transcriptome, the suitability of these estimatescould vary substantially across organisms, tissues, timepoints and biological contexts.Wang et al. [21] found a significant increase in cor-
relation between gene transcripts observed and numberof sequence reads generated when increasing sequenc-ing depth from 1.6 to 10 million reads after which thegains plateau – 10 million reads detected about 80% of theannotated chicken transcripts. Despite the expectation ofcontinuous sequencing depth increases in the near future,Łabaj et al. [22] argue that most of the additional readswill align to the subset of already extensively sampledtranscripts. As a result, transcripts with low to moder-ate expression levels will remain difficult to quantify withgood precision using current RNA-Seq protocols even athigher read depths. Greater sequencing depth will alsoincrease sensitivity to detect smaller changes in relativeexpression, however this does not guarantee that thesechanges have functional impact in the biological systemunder study as opposed to tolerated fluctuations in tran-script abundance [20]. Ideally, an efficient experimentaldesign will be informed by an understanding of whenincreasing sequencing depth begins to provide rapidlydiminishing returns with regard to transcript detectionand DE testing.
ReplicationReplication is vital for robust statistical inference of DE.In the context of RNA sequencing, multiple nested lev-els of technical replication exist depending upon whetherit is the sequence data generation, library preparationor RNA extraction technical processes that are beingreplicated from the same biological sample. Several

Robles et al. BMC Genomics 2012, 13:484 Page 3 of 14http://www.biomedcentral.com/1471-2164/13/484
published studies have incorporated technical replicatesinto their RNA-Seq experimental designs [23-25]. Thedegree of technical variation present in these datasetsappears to vary and the main source of technical vari-ation appears to be library preparation [15]. Biologicalreplication measures variation within the target popula-tion and simultaneously can counteract random techni-cal variation as part of independent sample preparation[20].It has been shown that power to detect DE improves
when the number of biological replicates n is increasedfrom n = 2 to n = 5 [26], however, to date few stud-ies have incorporated extensive biological replication andextensive testing of the effects of replication on poweris needed. More recently with the increasing utility andavailability of multiplex experimental designs, the incor-poration of biological replicates with decreased sequenc-ing depth is becoming a much more attractive andcost-effective strategy. The relative merits of sacrificingsequencing depth for increased replication has not beenrigorously explored.
Efficient experimental designMultiplexing is an increasingly popular approach thatallows the sequencing of multiple samples in a singlesequencing lane or reaction and consequently the reduc-tion in sequencing costs per sample [27,28]. Multiplexinguses indexing tags, “barcodes” or short (≤ 20 bp) stretchesof sequence that are ligated to the start of sample sequencefragments during the library preparation step. Barcodesare distinct between sample libraries and allow pooling forsequencing followed by allocation of reads back to individ-ual samples after sequencing by analysis of the sequencedbarcode. Multiplex barcode designs are routinely availablewith up to 12 samples in the same lane, recently up to 96yeast DNA samples were profiled in single lane [28]. Novelmethods are continuing to emerge for low-cost strategiesto multiplex RNA-Seq samples [29]. With the dramaticincreases in sequencing yields being achievedwith currentchemistries and new platforms, multiplexing is becom-ing the method of choice to increase sample throughput.These designs have direct impacts on sequencing depthgenerated that need to be considered in the power of theexperimental design. Also, when multiplex strategies areused, biologists need to be mindful of potential systematicvariations between sequencing lanes. These variations canbe addressed through randomisation or blocking designsto distribute samples across lanes, see [30] for a discus-sion of barcoding bias in multiplex sequencing, and [31]for an alternative to barcoding. In a comparison betweenmicroarray and NGS technologies in synthetic pools ofsmall RNA, Willenbrock et al. [13] found that multiplex-ing resulted in decreased sensitivity due to a reduction ofsequencing depth and a loss of reproducibility; however
the authors did not investigate power for detection of DEin their study.
ApproachImproving detection of DE requires not only an appro-priate experimental design but also a suitably poweredanalysis approach. Several algorithms have recently beendeveloped specifically to appropriately handle expectedtechnical and biological variation arising from RNA-Seqexperiments. A non-exhaustive list of these algorithms is:edgeR [32], DESeq [25], NBPSeq [33], BBSeq [34], FDM[35], RSEM [36], NOISeq [37], Myrna [38], Cuffdiff [2].A thorough comparison of these packages’ performancewith datasets of different properties falls beyond the scopeof this study, however before considering issues relating topower and experimental design, it is important to inves-tigate whether packages for DE analysis give the correcttype I error rate under the null hypothesis of no DE. Todo this evaluation we considered three popular packagesfor DE analysis of RNA-sequencing data. These packagesare based on a negative binomial distribution model ofread counts [39] and include edgeR [32], DESeq [25] andNBPSeq [33].To quantify the effects of different sequencing depths
and replication choices we compared a range of realisticexperimental designs for their ability to robustly detectDE. Using simulated data with known DE transcriptsallowed us to estimate the false positive rate (FPR) andtrue positive rate (TPR) of DE calls. The changes of theserates were used to compare the detection power yieldedby each choice of number of biological replicates andsequencing depth.In the Methods section, we outline the definitions used
for FPR and TPR as well as explaining the method usedfor the construction of the synthetic data; which includesinduced differential expression, simulates the variationsthat biological replicates introduce and simulates loss ofsequencing depth.In our study, we test a wide range of real-world exper-
imental design scenarios for performance under the nullhypothesis and in the presence of DE. In these scenar-ios both the numbers of biological replicates n and thesequencing depth are varied. This provides a compre-hensive quantitative comparison of different experimentaldesign strategies and is particularly informative for thoseaccessing modern multiplex approaches.
ResultsComparisons of statistical methods: edgeR, DESeq, andNBPSeq using simulated data under the nullTo test the performance of each package under the nullhypothesis, we simulated sets of n “control” and n “treat-ment” lanes of counts in accordance with the proceduredescribed in the Methods section, for a range of values of

Robles et al. BMC Genomics 2012, 13:484 Page 4 of 14http://www.biomedcentral.com/1471-2164/13/484
n and with no DE between treatments. For each value ofn and for each package the simulation and testing wererepeated 100 times. Figure 1 shows the percentage of
transcripts reported as differentially expressed at the 1%significance level by each of the three packages for a rangeof values of n. The height of each bar is the median value
Figure 1 The percentage of transcripts reported differentially expressed, FPR defined by Eq. 4 by three software packages for syntheticdata generated under the null hypothesis of no DE between two conditions. In the lower two panels the set of transcripts has been dividedinto those with greater than 100 counts (DE-high) and those with less than or equal to 100 counts (DE-low) averaged over biological replicates. Thenumber of biological replicates in each condition was varied over the range n =2, 3, . . . 12. The experiment was repeated for 100 independentlygenerated datasets. The top of each bar is the median value obtained and its 90% confidence interval.
Robles et al. BMC Genomics 2012, 13:484 Page 5 of 14http://www.biomedcentral.com/1471-2164/13/484
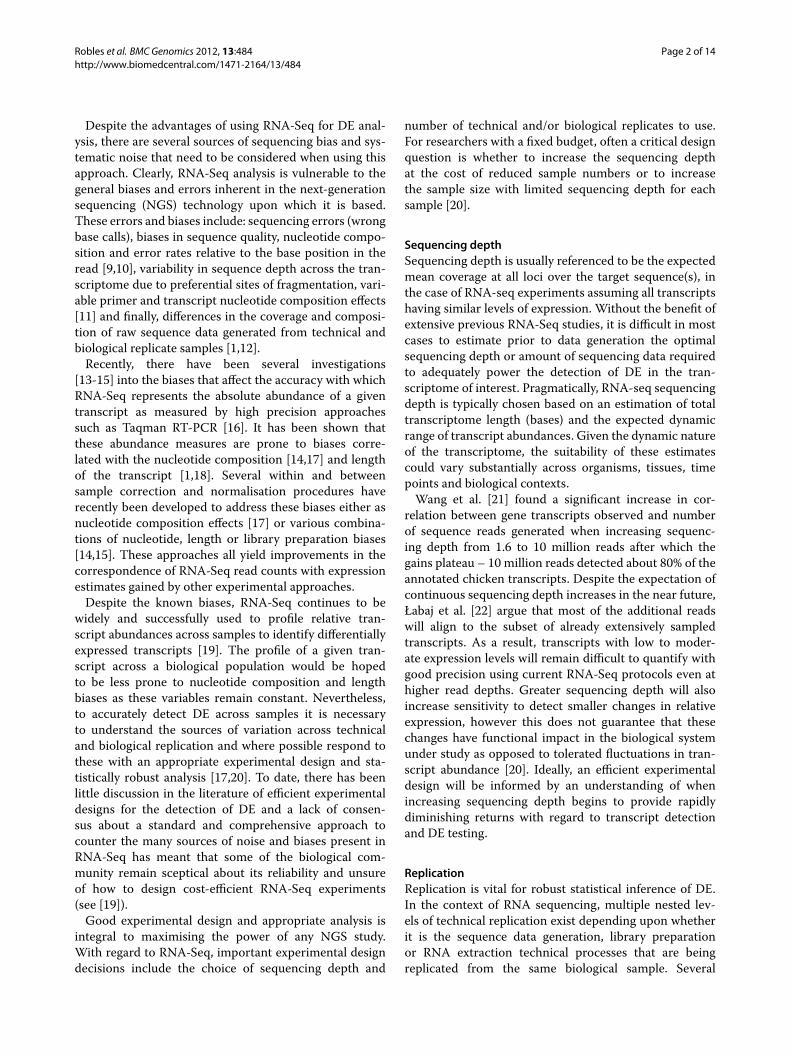
obtained from 100 repetitions of the synthetic data gener-ation with its associated 90% confidence intervals. Underthe null hypothesis, the percentage reported is the falsepositive rate (FPR) defined by Eq. 4, and should matchthe significance level of α = 1% if the package is per-forming correctly. Also shown are FPRs for high-counttranscripts (> 100 counts averaged across biological repli-cates) and low-count transcripts (≤ 100 counts averagedacross biological replicates). Figure 2 shows an exampleof the p-value distribution obtained for one experiment atn = 3 biological replicates. Ideally, p-values should have auniform distribution in the interval [ 0, 1] if the package isperforming correctly.Immediately noticeable in the p-value histogram is a
sharp spike in the right hand bin for low count tran-scripts, which is observed to be present in general forall values of n and all packages. This is a known arti-fact of calculating p-values for discrete random variablesusing the method described in [40] and summarised
in our Methods subsection ‘Under the null hypothesis’:when count sums in both conditions are equal the com-puted p-value is exactly 1. The situation is most likelyto occur for transcripts with extremely low counts, inwhich case it is difficult to draw meaningful conclu-sions regarding DE via any method. The behaviour at theleft hand end of the histogram, which drives the FPRsplotted in Figure 1, varies considerably between pack-ages and numbers of biological replicates. It is affectedmainly by the method used for estimating a disper-sion parameter φi for each transcript i (see Methodssection).The package edgeR performs well for large numbers
of biological replicates (n = 12), for which squeezingof the dispersion estimate towards the common disper-sion is minimal, and a tagwise estimate is appropriate. Forsmall numbers of biological replicates, because the disper-sion cannot be estimated accurately on a per-transcriptbasis, information is borrowed from the complete set
Synthetic data: 3 rep vs. 3 rep
Per
cent
of T
otal
0
2
4
6
8
10
0.0 0.2 0.4 0.6 0.8 1.0
NBP all NBP high
0.0 0.2 0.4 0.6 0.8 1.0
NBP low
DESeq all DESeq high
0
2
4
6
8
10DESeq low
0
2
4
6
8
10edgeR all
0.0 0.2 0.4 0.6 0.8 1.0
edgeR high edgeR low
Figure 2 Histograms of p-values calculated by three software packages for one particular example of synthetic data generated under thenull hypothesis for the case n = 3. In the two right hand columns the set of transcripts has been divided into high-count transcripts (> 100counts) and low-count transcripts (≤ 100 counts) respectively. ‘Percentage of total’ is the percentage of p-values falling within each of 100 bins ineach histogram.
Robles et al. BMC Genomics 2012, 13:484 Page 6 of 14http://www.biomedcentral.com/1471-2164/13/484
of transcripts to squeeze the estimate towards a com-mon dispersion estimate. For the high-count transcriptsin particular, the squeezing causes the dispersion of themost highly dispersed transcripts to be underestimated,causing too many transcripts to be deemed differentiallyexpressed, leading to an inflated FPR.In an effort to be conservative, DESeq chooses as its
estimate of dispersion the maximum of a per-transcriptestimate and the functional form Eq. 2 which is fitted tothe per-transcript estimates for all transcripts. Our resultsindicate that the method performs well for the high-counttranscripts when the number of biological replicates issmall (n = 2 or 3), but is otherwise over-conservative.This is generally to be preferred to an inflated FPR,as one has more evidence that what is called DE istruly DE.The package NBPSeq imposes the functional relation-
ship Eq. 3, which appears to be too restrictive for a num-ber of relatively highly dispersed transcripts. For thosetranscripts the dispersion parameter is underestimated,leading to an overestimate of significance and hence aninflated FPR irrespective of the number of biologicalreplicates.Based on these results we selected DESeq (v1.6.1) and
edgeR (v2.4.0) for use in subsequent experimental designtesting. Throughout these tests, results obtained usingDESeq and edgeR are mostly compatible with each other.However, our comparison revealed a slightly inflated FPRfrom edgeR while DESeq behaves more conservativelythroughout. Therefore, in the following section we willfocus on the results obtained using DESeq while the anal-ogous results obtained with edgeR are presented in theAdditional file 1: Figure S2.
Comparison of statistical methods: DESeq and edgeR usingsimulated data with 15% DE transcriptsTo test the performance of packages in the presence ofan alternate hypothesis, we simulated sets of n “con-trol” and n “treatment” lanes of counts with 15% ofthe transcripts either up- or down-regulated accordingto the procedure described in the Methods section. Allresults presented from this point on are derived fromDESeq.
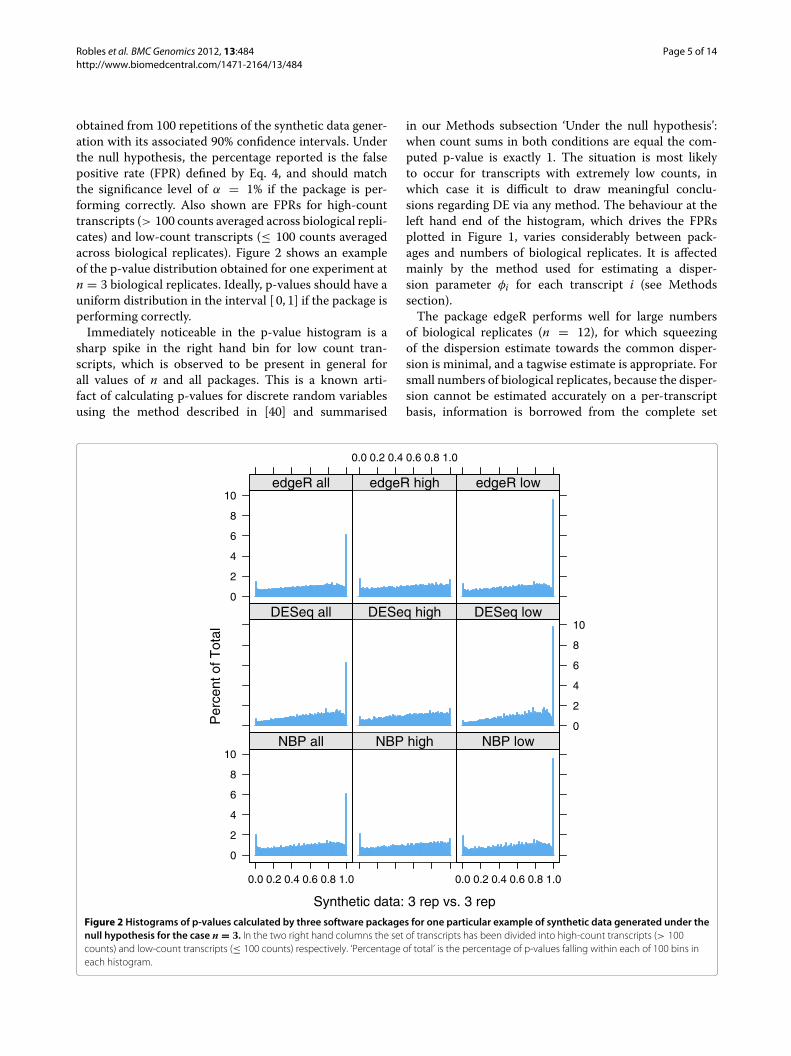
Detection of DE as a function of number of biologicalreplicates nWith an increase in replication we saw a steady increasein the percentage DE calls by DESeq (call rate), increas-ing from 0.44% to 5.12% as n increased from 2 to 12 (at100% depth). As n increased, the FPR, defined by Eq. 5at a significance level of α = 1%, remained below 0.1%for all values of n, and the TPR, defined by Eq. 6 with
Table 1 Effects of biological replication on power to detectDE using DESeq
% n = 2 n = 3 n = 4 n = 6 n = 8 n = 12
call rate % 0.44 1.15 1.76 3.03 4.08 5.12
FPR % 0.04 0.06 0.06 0.06 0.05 0.04
TPR % 3.26 8.95 13.95 24.30 32.72 41.57
Effects of biological replication on power to detect DE using DESeq. FPR and TPRare defined in Eqs. 5 & 6 respectively at 1%. “call rate” is the total number ofreported positives / the total number of transcripts. These values are alsorepresented in Figure 3 at 100% sequencing depth.
α = 1%, increased substantially from 3.26% to 41.57%(see Table 1).
Detection of DE as a function of sequencing depthFigure 3 represents the combined results of decreas-ing sequencing depth for all values of n. It can be seenthat as sequencing depth decreases the TPR generatedby DESeq decreases monotonically across all n whilethe FPR remains below 0.1% (the corresponding resultsobtained using edgeR are shown in Additional file 1:Figure S2).Table 2 shows the FPR for all biological replicates n and a
subset of sequencing depths: 25%, 50%, 75% and 100%, theFPR remains below 0.1% at all sequencing depths. Table 3shows the TPR reported by DESeq for the same subsetof sequencing depths, here the TPR increases strongly assequencing depth increases for any number of biologicalreplicates n.
Detection of DE across multiplex experimental designstrategiesWe simulated various scenarios of multiplexing n-controlsamples vs. n-treatment samples into two sequencinglanes – each control and treatment sample at a sequenc-ing depth = 1
n × 100%. In Figures 3 and 4, a solid grey lineconnecting every value of n at its corresponding sequenc-ing depth provides a summary of the performance of thesemultiplexing scenarios. We call this trend the “multiplexline” and it provides an insight into the results obtainedby increasing the number of biological replicates usedinto a fixed number of sequencing lanes, in this case 2sequencing lanes.The multiplex line in Figure 3 shows a clear increase
in TPR as replication increases despite the loss of detec-tion power that decreasing sequencing depth induces. Itcan also be seen that the FPR remains below 0.1% for allmultiplex scenarios tested (Figure 3B). Note that for com-pleteness we also added multiplex scenarios for n = 32& n = 96, whose results follow the trends well. Themultiplex line strongly favours adding more biologicalreplicates despite the inherent loss of sequencing depth

Robles et al. BMC Genomics 2012, 13:484 Page 7 of 14http://www.biomedcentral.com/1471-2164/13/484
Figure 3 TPR and FPR detected by DESeq as a function of sequencing depth and replication. Different symbols represent the number n ofcontrol vs. treatment samples (n = 2, 3, 4, 6, 8, and 12) across sequence depths [ 100% → 1%]. A: TPR (Eq. 6 at α = 1%) padj ≤ 0.01. B: FPR (Eq. 5 atα = 1%) padj ≤ 0.01. The solid grey line (“multiplex line”) connecting the TPR values of n biological replicates at 1
n × 100% sequencing depth showsthe increase of TPR as more biological replicates n are used despite the loss power due to the sequencing depth reduction required by themultiplexing of lanes. This trend remains true even for the n = 32 and n = 96 cases.
as shown by its dramatic positive slope for the TPR whilemaintaining a roughly constant, low FPR.
Fold-changes as indicators of DEIt is common practice among biologists to use fold-change, rather than p-values, as an indicator of DE.Figure 4 shows results analogous to those of Figure 3when the criterion of fold-change ≥ 2 (instead of p-values) is used to detect DE: as replication n increases,both TPR and FPR decrease becausemore biological repli-cates have the effect of averaging out differences betweencontrol and treatment lanes. Note that, as sequencingdepth decreases, the FPR increases owing to the growingnumber of transcripts with very low numbers of counts(Figure 4B), in which case the Poisson shot noise of thesequencer can easily induce a spurious doubling or halv-ing of counts. This effect is ameliorated by adding 1 countto all transcripts prior to DE analysis – doing so, does notaffect the calculation of p-values (data not shown).
Table 2 Effects of sequencing depth on FPR at different nand depths
Depth n = 2 n = 3 n = 4 n = 6 n = 8 n = 12
25% 0.02 0.02 0.04 0.03 0.03 0.03
50% 0.03 0.03 0.04 0.05 0.04 0.03
75% 0.04 0.06 0.05 0.07 0.04 0.04
100% 0.04 0.06 0.06 0.06 0.05 0.04
Effects of sequencing depth on FPR values for a subset of our tested depths =25%, 50%, 75% & 100%.
DiscussionComparisons of DE algorithms: edgeR, DESeq and NBPSeqOur comparison of these three DE detection algorithmsunder the null hypothesis revealed different performances(measured by their FPR) when different numbers of bio-logical replicates n, are used. DESeq consistently per-formed more conservatively across the different n biolog-ical replicates scenarios. DESeq’s performance was clos-est to the expected significance level when only usinghigh-count (counts > 100) transcripts while for onlylow-count (counts ≤ 100) transcripts over-conservativebehaviour is shown. edgeR overestimates DE detectionfor small values of n while its performance improves asn increases. edgeR’s level of detection is constant overn when only low-count transcripts are used while over-estimation increases when only high-count transcriptsare used. NBPSeq overestimated detection across n forthe three scenarios (all-transcripts, high-counts and low-counts).
Table 3 Effects of sequencing depth on TPR at different nand depths
Depth n = 2 n = 3 n = 4 n = 6 n = 8 n = 12
25% 1.57 6.24 10.40 19.18 26.08 35.41
50% 2.58 7.63 12.40 22.34 29.66 39.16
75% 3.01 8.47 13.16 23.44 31.57 40.65
100% 3.26 8.95 13.95 24.30 32.72 41.57
Effects of sequencing depth on TPR values for a subset of our tested depths =25%, 50%, 75% & 100%.
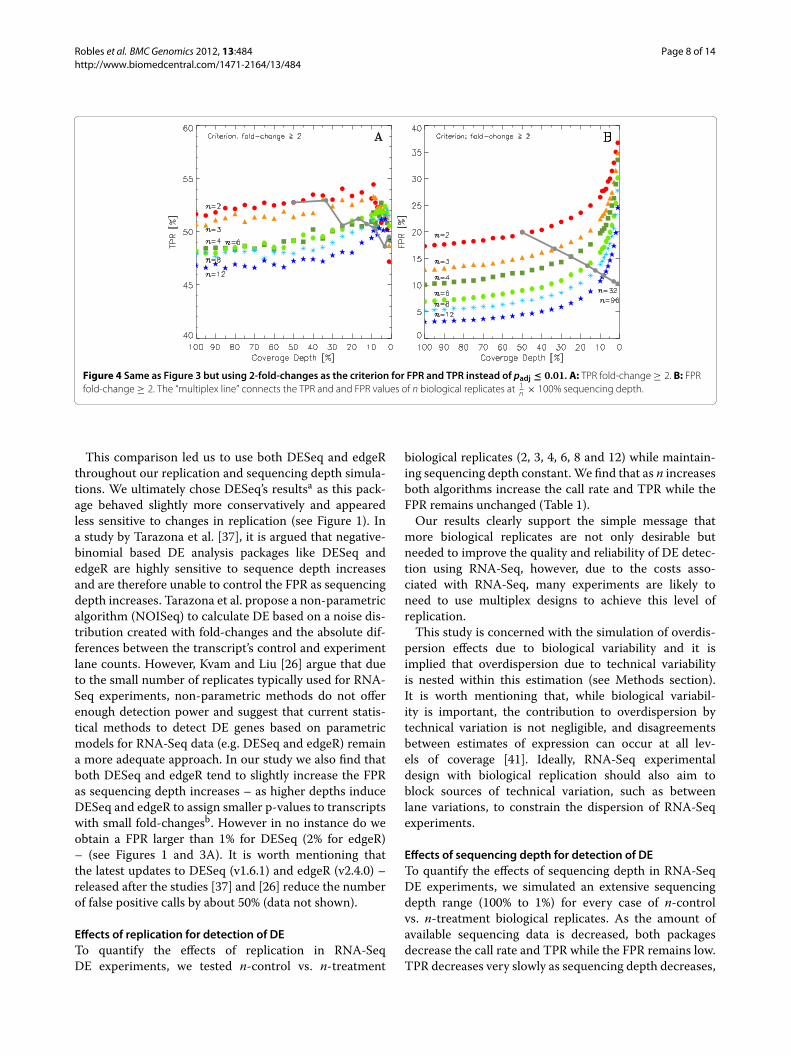
Robles et al. BMC Genomics 2012, 13:484 Page 8 of 14http://www.biomedcentral.com/1471-2164/13/484
Figure 4 Same as Figure 3 but using 2-fold-changes as the criterion for FPR and TPR instead of padj ≤ 0.01. A: TPR fold-change ≥ 2. B: FPRfold-change ≥ 2. The “multiplex line” connects the TPR and and FPR values of n biological replicates at 1
n × 100% sequencing depth.
This comparison led us to use both DESeq and edgeRthroughout our replication and sequencing depth simula-tions. We ultimately chose DESeq’s resultsa as this pack-age behaved slightly more conservatively and appearedless sensitive to changes in replication (see Figure 1). Ina study by Tarazona et al. [37], it is argued that negative-binomial based DE analysis packages like DESeq andedgeR are highly sensitive to sequence depth increasesand are therefore unable to control the FPR as sequencingdepth increases. Tarazona et al. propose a non-parametricalgorithm (NOISeq) to calculate DE based on a noise dis-tribution created with fold-changes and the absolute dif-ferences between the transcript’s control and experimentlane counts. However, Kvam and Liu [26] argue that dueto the small number of replicates typically used for RNA-Seq experiments, non-parametric methods do not offerenough detection power and suggest that current statis-tical methods to detect DE genes based on parametricmodels for RNA-Seq data (e.g. DESeq and edgeR) remaina more adequate approach. In our study we also find thatboth DESeq and edgeR tend to slightly increase the FPRas sequencing depth increases – as higher depths induceDESeq and edgeR to assign smaller p-values to transcriptswith small fold-changesb. However in no instance do weobtain a FPR larger than 1% for DESeq (2% for edgeR)– (see Figures 1 and 3A). It is worth mentioning thatthe latest updates to DESeq (v1.6.1) and edgeR (v2.4.0) –released after the studies [37] and [26] reduce the numberof false positive calls by about 50% (data not shown).
Effects of replication for detection of DETo quantify the effects of replication in RNA-SeqDE experiments, we tested n-control vs. n-treatment
biological replicates (2, 3, 4, 6, 8 and 12) while maintain-ing sequencing depth constant.We find that as n increasesboth algorithms increase the call rate and TPR while theFPR remains unchanged (Table 1).Our results clearly support the simple message that
more biological replicates are not only desirable butneeded to improve the quality and reliability of DE detec-tion using RNA-Seq, however, due to the costs asso-ciated with RNA-Seq, many experiments are likely toneed to use multiplex designs to achieve this level ofreplication.This study is concerned with the simulation of overdis-
persion effects due to biological variability and it isimplied that overdispersion due to technical variabilityis nested within this estimation (see Methods section).It is worth mentioning that, while biological variabil-ity is important, the contribution to overdispersion bytechnical variation is not negligible, and disagreementsbetween estimates of expression can occur at all lev-els of coverage [41]. Ideally, RNA-Seq experimentaldesign with biological replication should also aim toblock sources of technical variation, such as betweenlane variations, to constrain the dispersion of RNA-Seqexperiments.
Effects of sequencing depth for detection of DETo quantify the effects of sequencing depth in RNA-SeqDE experiments, we simulated an extensive sequencingdepth range (100% to 1%) for every case of n-controlvs. n-treatment biological replicates. As the amount ofavailable sequencing data is decreased, both packagesdecrease the call rate and TPR while the FPR remains low.TPR decreases very slowly as sequencing depth decreases,

Robles et al. BMC Genomics 2012, 13:484 Page 9 of 14http://www.biomedcentral.com/1471-2164/13/484
suggesting that sequencing depth can be reduced to ∼15% without much impact on TPR.We conclude that DE analysis with RNA-Seq is robust
to substantial loss of sequencing data as indicated by aslow decline in TPR as sequencing depth is lost accom-panied by no increase in FPR. These findings seem con-sistent with the results reported by Bashir et al. [42] whoobserved that lower levels of transcriptome sequencinghad sufficient information to estimate the distributionof expression values arising from observed transcripts.Bashir et al. did not directly test power to detect DE, how-ever as testing for DE relies on good concordance withthe expected distribution, it follows that DE is reasonablyrobust to loss of sequencing data.
Multiplexing experimental designsTo quantify the effects of varying both n and sequenc-ing depth, we simulated multiplexing n-control vs. n-treatment lanes into two sequencing lanes. We observeda steady increase in TPR with the increase in n, despitethe corresponding decrease in sequencing data per tran-script by 1/n. Similarly, for both DESeq and edgeR thenumber of DE calls and the TPR increases with n, as weobserved previously and is unaffected by the decrease indata. For DESeq, the FPR remains roughly constant andalways below 0.1%, while for edgeR, the FPR decreasesslowly as n increases.Our simulations strongly support that the benefits of
multiplexing n-biological replicates into one sequencinglane (two lanes for a n-control vs. n-treatment DE exper-iment), far outweigh the decrease of available data persample by 1/n. These multiplexing experimental designsimprove TPR and FPR while greatly reducing the cost ofthe experiment.While the detection of DE appears robust to avail-
able sequence data, there remains the question of howmultiplexing affects coverage of the transcriptome anddetection of low abundant or rare transcripts. Thiscoverage issue will increasingly be counterbalanced byrapid increases in data generation capacity from a singlesequencing experiment. In a detailed study of the Mari-oni [23] human (liver and kidney) dataset, Banshir et al.[42], reported that over 90% of the total observed tran-scripts were sampled with 1 million reads. This should beconsidered in the context of the quickly evolving sequenc-ing technologies like HiSeq 2000 and HiSeq 2500 whichcan produce up to 300 million reads per sequencing lane.In an evaluation of coverage depth of the chicken tran-scriptome,Wang et al. [21] find that while 10million readsallow detection of 80% of the annotated genes, an increasefrom 10 to 20 million reads does not have a significanteffect on transcriptome coverage or reliability of mRNAmeasurements. That said, current estimates of transcrip-tome coverage and the impacts of multiplexing strategies
analysed in this paper assume unbiased sampling of tran-scripts. It is highly likely that the power to detect DEvaries across transcripts with their sequence content, iso-form complexity and abundance. Fang and Cui [20] warnagainst and discuss several sequencing biases that couldcreate the need for high sequencing coverage to accuratelyestimate transcript abundance and variation. The authorsmention the importance of choosing whether to increasethe sequencing depth per sample or to increase the num-ber of biological replicates when planning an experiment.Here, we quantitatively argue that given a fixed budget,the benefits of increasing the number of biological repli-cates outweigh the corresponding decrease of sequenc-ing depth. This suggestion is backed by the patterns inFigures 3 and 4 in which for a given number of n-biologicalreplicates TPR drops very slowly as depth decreases, FPRremains low when sequencing depth is decreased. In thelight of new sequencing technologies rapidly increasingthe available sequencing depth per lane, the inforrma-tion provided by biological replicates’ variation is likely tobecome a priority over sequencing depth.
ConclusionsNot surprisingly, our results indicate that more biolog-ical replicates are needed to improve the quality andreliability of DE detection using RNA-Seq. Importantlyhowever, we also find that DE analysis with RNA-Seqis robust to substantial loss of sequencing data as indi-cated by a slow decline in TPR accompanied by noincrease in FPR. Our simulations strongly support thatmultiplexing experimental designs improve TPR andFPR while greatly reducing the cost of the experiment,as the benefits of multiplexing n-biological replicatesfar outweigh the decrease of available data per sampleby 1/n.As many available packages for DE analysis are increas-
ingly becoming faster and easier to use, our recommen-dation for most RNA-Seq DE experiments is to use 2different packages for DE testing. Additional file 2: FigureS4 illustrates the detection overlap between DESeq andedgeR for two contrasting choices of sequencing depthsand n-biological replicates: n=2 at 100% depth and n=4 at25% depth. The combined use of packages based on differ-ent distribution statistics or a different set of assumptionscould generate useful information about a possible biassusceptibility of a given package particular to the specificdataset of interest.To our knowledge, this is the most up-to-date com-
parison of DESeq and edgeR’s performance relative toability to detect DE in a range of experimental designs.It directly tests the efficiency of modern multiplex exper-imental design strategies. Our study informs importantexperimental design decisions now relevant when tryingto maximise an RNA-Seq study to reliably detect DE.

Robles et al. BMC Genomics 2012, 13:484 Page 10 of 14http://www.biomedcentral.com/1471-2164/13/484
MethodsNegative binomial model and biological variationsimulationOur synthetic data is based on a negative binomial (NB)model of read counts assumed by [39] and used in edgeR[32], DESeq [25] and NBPSeq [33]. The model is a hierar-chical model which takes into account sources of variabil-ity in the molar concentration of each transcript isoformin the prepared cDNA library due to i) library prepa-ration steps and, in the case of biological replicates, ii)biological variation. This variation is compounded by anadditional Poisson shot-noise arising from the sequencingstep. Assuming the molar concentration in the preparedcDNA library to have a Gamma distribution, one arrivesat a NB distribution for the number of counts K mappedonto a particular transcript of interest in a given lane ofthe sequencer:
K ∼ NB(mean = μ, var = μ(1 + φμ)). (1)
The mean μ is proportional to the concentration ofthe transcript of interest in the original biological sam-ple, up to a normalisation factor specific to the lane of thesequencer. A suitable model for this normalisation factoris the Robinson-Oshlack TMM factor [32]. The quantityφ is called the dispersion parameter [39], and is specific tothe transcript isoform and the library preparation. Amoredetailed account of the model is given in the Additionalfile 3.
R packages for DE in RNA-SeqAll three packages considered are based on a NB model,and differ principally in the way the dispersion param-eter is estimated. Unless otherwise stated, tests of thesepackages used herein use default settings. Typical codingsequences are given in the Additional file 3.
edgeR (version 2.4.0, Bioconductor)To begin with, edgeR [43] calculates for each transcript aquantile adjusted log conditional likelihood function forthe dispersion φ [39]. Here, “quantile adjusted” refers toan adjustment of the number of counts to adjust for thetotal number of counts across all transcripts in each bio-logical replicate, and “conditional” means conditioning onthe sum of counts for the given transcript across biologi-cal replicates. The “common dispersion” estimate definedby edgeR assumes φ to be a constant over all transcriptsin one lane of the sequencer, and is obtained by max-imising the log-likelihood summed over transcripts. How-ever, edgeR recommends a “tagwise dispersion” function,which estimates the dispersion on a gene-by-gene basis,and implements an empirical Bayes strategy for squeezingthe estimated dispersions towards the common disper-sion. Under the default setting, the degree of squeezing isadjusted to suit the number of biological replicates within
each condition: more biological replicates will need toborrow less information from the complete set of tran-scripts and require less squeezing.
DESeq (version 1.6.1, Bioconductor)In previous versions of the package DESeq [25], φ wasassumed to be a function of μ determined by nonpara-metric regression. The recent version used in this paperfollows a more versatile procedure. Firstly, for each tran-script, an estimate of the dispersion is made, presumablyusing maximum likelihood. Secondly, the estimated dis-persions for all transcripts are fitted to the functionalform:
φ = a + bμ
(DESeq parametric fit), (2)
using a gamma-family generalised linear model. The per-transcript estimate is considered to be more appropriatewhen large numbers of replicates (≥ 4) are present, whilethe functional form is considered to be more appropri-ate when small numbers of replicates (≤ 2) are present,in which case information is borrowed from the generaltrend of all transcripts. Recognising that the dispersionmay be underestimated by the functional fit, leading toan overestimate of significance in detecting DE, DESeqby default chooses the maximum of the two methods foreach transcript. Also by default, DESeq assumes a modelin which the mean μ differs between conditions, but thedispersion φ is common across all conditions.
NBPSeq (version 0.1.4, CRAN)As for edgeR, the package NBPSeq [33] considers per-transcript log likelihood conditioned on the sum of countsacross replicates. However, NBPSeq further imposes thefollowing functional relationship between φ and μ:
φ = cμα−2 (NBPSeq model), (3)
that is, a linear relationship between logφ and logμ. Thecases α = 1 and α = 2 (equivalent to common dispersion)of this function are referred to as NB1 and NB2 respec-tively. The global parameters α and c are estimated bymaximising the log conditional likelihood summed overall replicates and transcripts.
Construction of the synthetic datasetsEach of our synthetic datasets consists of a ‘control’dataset of read counts Kcontr
ij and a ‘treatment’ dataset ofread counts K treat
ij , for i = 1, . . . , t transcript isoformssequenced from j = 1, . . . , n biological replicate cDNAlibraries.For each transcript isoform, we begin by providing a pair
of NB parameters μi and φi. A read count Kcontrij for each
isoform in each biological replicate is then generated bysampling randomly from aNB distribution with these esti-mated parameters to from the control dataset. To create

Robles et al. BMC Genomics 2012, 13:484 Page 11 of 14http://www.biomedcentral.com/1471-2164/13/484
the treatment dataset, the set of isoforms is first dividedinto a non-regulated subset, an up-regulated subset and adown-regulated subset. A regulating factor θi = 1, . . . , t,which is equal to 1 (non-regulated), > 1 (up-regulated)or < 1 (down-regulated) is then chosen from a suitabledistribution. A treatment read count K treat
ij is then gen-erated for each isoform in each biological replicate froma NB distribution with the mean θiμi and unchangeddispersion φi.The basis for the parameters μi and φi is a subset of
the Pickrell [24] dataset of sequenced cDNA libraries gen-erated form mRNA from 69 lymphoblastoid cell linesderived from Nigerian individuals as part of the Inter-national HapMap Project. For each individual, a libraryprepared for the Illumina GA2 platform was split intotwo portions, with one portion sequenced at the Argonnesequencing centre and the other at the Yale sequencingcentre. For 12 of the individuals a second library was alsoprepared, split, and sequenced at both centres. Only datafrom the initial 69 libraries sequenced at Argonne wasused for the current study. The raw reads were re-alignedonto the human transcriptome (hg18, USCS) using theKANGA aligner [44]. The total number of reads mappedto annotated genes per lane varied substantially from 2 ×10⁶ to 20 × 106. To provide a uniform set of biologicalreplicates from which to estimate μi and φi, a subset of44 libraries for which the total number of mappings to thetranscriptome per lane was in the range 10 × 106 to 16 ×106 was chosen. Finally, any transcript for which the totalnumber of reads was less than 44, i.e. an average of lessthan one transcript per lane, was culled from the datasetto leave a list of 46,446 transcripts. The resulting subset ofthe Pickrell dataset is considered to exhibit overdispersiondue to both library preparation and biological variation.Note that for generation of synthetic data it is not nec-
essary to provide an accurate estimate of μi and φi foreach isoform in the reduced Pickrell dataset, but sim-ply to provide a plausible distribution of values of theseparameters over the transcriptome representing typicalisoform abundances and their variation due to technicaland/or biological overdispersion. Parameter values μi andφi, were obtained from the reduced Pickrell dataset as fol-lows. The total number of counts from each of the 44 laneswas first reduced to that of the lane with the smallest num-ber of counts by sampling from the counts in each lanewhile keeping track of the transcript to which each countis mapped. This forms a normalised set of counts for theith transcript in the jth lane.For each transcript a maximum likelihood estimate
(MLE) μi and φi, was then made from the n = 44 biolog-ical replicates. Details of the construction of this estimateare given in the Additional file 3. For each simulationdescribed herein, a synthetic dataset was constructed con-sisting of n biological replicates of ‘control data’ generated
from NB distributions with the estimated μi and φi, and afurther n biological replicates of treatment data generatedfrom NB distributions with means θiμi and unchangeddispersion φi.Two sets of simulations were performed:
1. To test performance under the null hypothesis, theregulating factor was set to θi = 1 for all transcripts.
2. To test ability to detect DE in the presence of analternative hypothesis, the regulating factor θi was setto 1 + Xi for a randomly chosen 7.5% of thetranscripts (up-regulated), (1 + Xi)
−1 for a further7.5% (down-regulated) and 1 for the remaining 85%of the transcripts, where the Xi are identically andindependently distributed exponential randomvariables with mean 1.
Calculation of true and false positive ratesUnder the null hypothesisAll three packages test for DE in single-factor experimentsby calculating p-values using the method described in[25]. For each transcript i, a probability is calculated forthe number of counts in each of two conditions controland treatment, conditional on the sum of the counts inboth conditions assuming the NB model described above.The p-value is the sum of the probabilities of all ways ofapportioning the sum of counts between the two condi-tions, which have a lower probability than the observedcounts.To test the performance of each package under the
null hypothesis, we simulated sets of n-control andn-treatment lanes of counts for a range of values of n. TheFPR, quoted as a percentage, was calculated at a givensignificance level α as:
FPR = number of transcripts with 100× p-value < α
total number of transcripts× 100%.
(4)
Ideally, the FPR should match the significance level of αif the package is performing correctly.
In the presence of an alternative hypothesisAll three packages provide an adjusted p-value, padj,to correct for multiple hypothesis testing with theBenjamini-Hochberg procedure using the R functionp.adjust(). All calculations herein of true and false posi-tive rates in the presence of an alternative hypothesis useadjusted p-values.From the 6, 966/46, 446 (15%) of the transcripts induced
with a regulating factor other than 1, we selected the 5, 726(12%) with a regulation factor satisfying either θi ≤ 0.83 orθi ≥ 1.20. We define these as “effectively DE” transcripts.This additional filter on minimal fold-change is designed

Robles et al. BMC Genomics 2012, 13:484 Page 12 of 14http://www.biomedcentral.com/1471-2164/13/484
to quantify the performance of algorithms and experimen-tal designs for detection of DE that might be consideredmore biologically relevant by researchers. Likewise wedefine the remaining transcripts, those satisfying 0.83 <
θi < 1.20, as “effectively non-DE”. These definitions wereused to estimate the FPR and TPR at significance level α
via the following formulae:
FPR= number of effectively non-DE transcripts with 100 × padj < α
total number of effectively non-DE transcripts×100%.
(5)
TPR = number of effectively DE transcripts with 100 × padj < α
total number of effectively DE transcripts× 100%.
(6)
Apart from the use of adjusted p-values, the formula forFPR reduces to Eq. 4 if the number of simulated DE tran-scripts is set to zero, since in this case all transcripts are,by definition, “effectively non-DE”. The quantities 1−FPRand TPR are commonly referred to in the literature as“specificity” and “sensitivity” respectively.
Simulating variable levels of sequence data and replicationSimulating variations in available sequencing data is a fun-damental part of investigating the impacts of multiplexexperimental design strategies. Variability in the amountof sequence data amongst samples can occur for reasonssuch as restrictions on available resources, machine error,or sequencing reads sequestered by pathogen transcrip-tome fractions present in the sample. To simulate lossof sequencing depth, we randomly sub-sampled withoutreplacement counts from the original table of counts sim-ulated in the presence of an alternative hypothesis for eachbiological replicate. Sequencing depth was decreased inboth control and treatment samples over a range of 100%(a full lane of sequence) to 1% of the original data. Afterthis sub-sampling, the resulting table of counts was anal-ysed in DESeq (edgeR) and the total number of effectively-DE calls, TPR, FPR and fold-changes were recorded forevery n scenario. We simulated experimental choices ofn-controls vs. n-treatments biological replicates at n =2,3, 4, 6, 8 and 12.
Multiplexing experimental designsMultiplexing various samples into one sequencing lanereduces the monetary cost of RNA-Seq DE analysis, albeitby dividing the available sequencing depth over varioussamples. Our strategy consisted of simulating multiplex-ing n-control samples vs. n treatment samples into twosequencing lanes. This way, the amount of total sequenceddata is constrained and each control and treatment sam-ple is expected to be represented at an average depth1/n × 100%. The absolute value of reads produced in a
lane of sequence (i.e. 100% depth) has increased as RNA-Seq technologies evolve, currently this value can be up to100 million reads. The multiplex experimental setups wetested are:
• 2 vs. 2 biological replicates at 50% sequencing depth• 3 vs. 3 biological replicates at 33% sequencing depth• 4 vs. 4 biological replicates at 25% sequencing depth• 6 vs. 6 biological replicates at 17% sequencing depth• 8 vs. 8 biological replicates at 13% sequencing depth• 12 vs. 12 biological replicates at 8% sequencing depth• 32 vs. 32 biological replicates at 3% sequencing depth• 96 vs. 96 biological replicates at 1% sequencing depth
EndnotesaOur results obtained using edgeR are presented in theAdditional file 1: Figure S2.bAdditional file 4: Figure S3 shows the minimum fold-change at which a transcript is assigned a padj ≤ 0.01 forevery n scenario.cThe details of our negative binomial model can be foundin Additional file 3, including Additional file 5: FigureS1, which shows the maximum likelihood estimates ofthe model’s mean and dispersion parameters for 46, 446transcript isoforms.
Additional files
Additional file 1: Figure S2. FPR and TPR detected by edgeR as a functionof sequencing depth and replication. Different symbols represent thenumber n of control vs. treatment samples (n = 2, 3, 4, 6, 8, and 12) acrosssequence depths [ 100% → 1%]. A: TPR padj ≤ 0.01. B: FPR padj ≤ 0.01.The solid grey line (“multiplex line”) connecting the TPR values of nbiological replicates at 1
n × 100% sequencing depth shows the increase ofTPR as more biological replicates n are used despite the loss power due tothe sequencing depth reduction required by the multiplexing of lanes. Thistrend remains true even for the n = 32 and n = 96 cases.
Additional file 2: Figure S4. Venn-diagram showing the TP and FP callsmade by DESeq (left, blue circle) and edgeR (right, red circle) and how theyoverlap between each other and the total pool of transcripts designated astruly DE (top, green circle). A: the Venn-diagram for the case in which thenumber of biological replicates is n = 12 and depth is 100%. Thiscombination of n and depth is somewhat unrealistic as the cost of 24 lanesof sequencing would be almost prohibitive; however, it shows a ‘best casescenario’ situation in which 2870 of the total 5689 truly DE transcripts weredetected by the union of DESeq and edgeR. Of these 2870 TP detections,most of them (2360) were detected by both algorithms – hence eitheralgorithm would have sufficed. B: the Venn-diagram for n = 4 and depth is25%. This more realistic experimental design choice of n and depth showsthe value of using both algorithms; only 913 out of the total 5697 truly DEtranscripts were detected by both algorithms, only two thirds of them(591) were detected by both algorithms. These contrasting scenarios showthat the use of both algorithms aids to further constrain the list of viable DEcandidates in a fast and cheap manner.
Additional file 3: Negative binomial modelc.
Additional file 4: Figure S3. Smallest fold-change required for atranscript to be called DE (padj ≤ 0.01) as a function of n biologicalreplicates (using DESeq). The more replicates available; the smaller thefold-change required for a transcript to be called DE by DESeq or edgeR.

Robles et al. BMC Genomics 2012, 13:484 Page 13 of 14http://www.biomedcentral.com/1471-2164/13/484
Additional file 5: Figure S1.Maximum likelihood estimates of the NBmean μi and dispersion parameter φ for 46,446 transcript isoforms. Thegreen line is a linear regression of log10 φ against log10 μ, and correspondsto the NBPSeq model relationship φ = cμα−2 with α = 1.700, c = 0.364.
Competing interestsThe authors declare that they have no competing interests.
Authors’ contributionsAll authors contributed to the manuscript. JAR, SEQ and SJS performed thestatistical and bioinformatic analysis. CJB developed the data simulationalgorithm. CJB, SRW and JMT conceived and designed the study. All authorsread and approved the final manuscript.
AcknowledgementsJAR is funded by the OCE Science team. This project is supported by AustralianResearch Council Discovery Grant DP1094699. We used [45] as our Bibtexreferences manager. We used the TexMed database [46] as our bibtexreferences source. Additional file 2: Figure S4 was generated using the“VennDiagram” R-based package by Chen and Boutros [47].
Author details1CSIRO Plant Industry, Black Mountain Laboratories, Canberra, Australia.2Mathematical Sciences Institute, Australian National University, Canberra,Australia. 3Prince of Wales Clinical School and School of Mathematics andStatistics, University of New South Wales, Sydney, Australia.
Received: 20 July 2012 Accepted: 10 August 2012Published: 17 September 2012
References1. Mortazavi A, Williams BA, McCue K, Schaeffer L, Wold B:Mapping and
quantifying mammilian transcriptomes by RNA-seq. Nat Methods2008, 5(7):621–628.
2. Trapnell C, Williams BA, Pertea G, Mortazavi A, Kwan G, van Baren MJ,Salzberg SL, Wold BJ, Pachter L: Transcript assembly and quantificationby RNA-Seq reveals unannotated transcripts and isoform switchingduring cell differentiation. Nat Biotechnol 2010, 28:511–515.
3. Guttman M, Garber M, Levin JZ, Donaghey J, Robinson J, Adiconis X, FanL, Koziol MJ, Gnirke A, Nusbaum C, Rinn JL, Lander ES, Regev A: Ab initioreconstruction of cell type-specific transcriptomes in mouse revealsthe conservedmulti-exonic structure of lincRNAs. Nat Biotechnol2010, 28:503–510.
4. Haas BJ, Zody MC: Advancing RNA-Seq analysis. Nat Biotechnol 2010,28:421–423.
5. Pan Q, Shai O, Lee LJ, Frey BJ, Blencowe BJ: Deep surveying ofalternative splicing complexity in the human transcriptome byhigh-throughput sequencing. Nat Genet 2008, 40:1413–1415.
6. Lovci MT, Li HR, Fu XD, Yeo GW: RNA-seq analysis of gene expressionand alternative splicing by double-random priming strategy.Methods Mol Biol 2011, 729:247–255.
7. Bullard JH, Purdom E, Hansen KD, Dudoit S: Evaluation of statisticalmethods for normalization and differentail expression inmRNA-seq experiments. BMC Bioinf 2010, 11:94.
8. Oshlack A, Robinson MD, Young MD: From RNA-seq reads todifferential expression results. Genome Biol 2010, 11:220.
9. Dohm JC, Lottaz C, Borodina T, Himmelbauer H: Substantial biases inultra-short read data sets from high-throughput DNA sequencing.Nucleic Acids Res 2008, 36:e105.
10. Hansen KD, Brenner SE, Dudoit S: Biases in Illumina transcriptomesequencing caused by random hexamer priming. Nucleic Acids Res2010, 38:e131.
11. Sendler E, Johnson GD, Krawetz SA: Local and global factors affectingRNA sequencing analysis. Anal Biochem 2011, 419:317–322.
12. Lu B, Yu J, Xu J, Chen J, Lai M: A novel approach to detectdifferentially expressed genes from count-based digital databasesby normalizing with housekeeping genes. Genomics 2009,94:211–216.
13. Willenbrock H, Salomon J, Søkilde R, Barken KB, Hansen TN, Nielsen FC,Møller S, Litman T: Quantitative miRNA expression analysis:
comparing microarrays with next-generation sequencing. RNA 2009,15:2028–2034.
14. Zheng W, Chung LM, Zhao H: Bias detection and correction inRNA-Sequencing data. BMC Bioinf 2011, 12:290.
15. Roberts A, Trapnell C, Donaghey J, Rinn JL, Pachter L: ImprovingRNA-Seq expression estimates by correcting for fragment bias.Genome Biol 2011, 12:R22.
16. Canales RD, Luo Y, Willey JC, Austermiller B, Barbacioru CC, Boysen C,Hunkapiller K, Jensen RV, Knight CR, Lee KY, Ma Y, Maqsodi B, Papallo A,Peters EH, Poulter K, Ruppel PL, Samaha RR, Shi L, Yang W, Zhang L,Goodsaid FM: Evaluation of DNAmicroarray results with quantitativegene expression platforms. Nat Biotechnol 2006,24:1115–1122.
17. Risso D, Schwartz K, Sherlock G, Dudoit S: GC-Content normalization forRNA-seq data. BMC Bioinf 2011, 12:480.
18. Oshlack A, Wakefield MJ: Transcript length bias in RNA-seq dataconfounds systems biology. Biol Direct 2009, 4:14.
19. Auer PL, Srivastava S, Doerge RW: Differential expression–the nextgeneration and beyond. Brief Funct Genomics 2011doi:10.1093/bfgp/elr041.
20. Fang Z, Cui X: Design and validation issues in RNA-seq experiments.Brief Bioinf 2011, 12:280–287.
21. Wang Y, Ghaffari N, Johnson CD, Braga-Neto UM, Wang H, Chen R, ZhouH: Evaluation of the coverage and depth of transcriptome byRNA-seq in chickens. BMC Bioinf 2011, 12(Suppl 10):S5.
22. Łabaj PP, Leparc GG, Linggi BE, Markillie LM, Wiley HS, Kreil DP:Characterization and improvement of RNA-Seq precision inquantitative transcript expression profiling. Bioinformatics 2011,27:i383–391.
23. Marioni JC, Mason C, Mane SM, Stephens S, Gilad Y: RNA-seq: anassessment of technical reproducability and comparison with geneexpression arrays. Genome Res 2008, 18:1509–1517.
24. Pickrell JK, Marioni JC, Pai AA, Degner JF, Engelhardt BE, Nkadori E,Veyrieras JB, Stephens M, Gilad Y, Pritchard JK: Understandingmechanisms underlying human gene expression variation with RNAsequencing. Nature 2010, 464:768–72 .
25. Anders S, Huber W: Differential expression analysis for sequencecount data. Genome Biol 2010, 11(10):R106.
26. Kvam VM, Liu P, Si Y: A comparison of statistical methods fordetecting differentially expressed genes from RNA-seq data. Am JBot 2012, 99(2):248–256.
27. Porreca GJ, Zhang K, Li JB, Xie B, Austin D, Vassallo SL, LeProust EM, Peck BJ,Emig CJ, Dahl F, Gao Y, Church GM, Shendure J:Multiplex amplificationof large sets of human exons. Nat Methods 2007, 4:931–936.
28. Smith AM, Heisler LE, St Onge RP, Farias-Hesson E, Wallace IM, Bodeau J,Harris AN, Perry KM, Giaever G, Pourmand N, Nislow C:Highly-multiplexed barcode sequencing: an efficient method forparallel analysis of pooled samples. Nucleic Acids Res 2010,38:e142.
29. Wang L, Si Y, Dedow LK, Shao Y, Liu P, Brutnell TP: A low-cost libraryconstruction protocol and data analysis pipeline for Illumina-basedstrand-specific multiplex RNA-seq. PLoS ONE 2011, 6:e26426.
30. Alon S, Vigneault F, Eminaga S, Christodoulou DC, Seidman JG, ChurchGM, Eisenberg E: Barcoding bias in high-throughput multiplexsequencing of miRNA. Genome Res 2011, 21:1506–1511.
31. Timmermans MJ, Dodsworth S, Culverwell CL, Bocak L, Ahrens D,Littlewood DT, Pons J, Vogler AP:Why barcode? High-throughputmultiplex sequencing of mitochondrial genomes for molecularsystematics. Nucleic Acids Res 2010, 38:e197.
32. Robinson MD, Oshlack A: A scaling normalization method fordifferential expression analysis of RNA-seq data. Genome Biol 2010,11:R25.
33. Di Y, Schafer D, Cumbie J, Chang J: The NBP negative binomial modelfor assessing differential gene expression from RNA-seq. Stat Appl inGenet andMol Biol 2011, 10:Article 24.
34. Zhou YH, Xia K, Wright FA: A powerful and flexible approach to theanalysis of RNA sequence count data. Bioinformatics 2011,27:2672–2678.
35. Singh D, Orellana CF, Hu Y, Jones CD, Liu Y, Chiang DY, Liu J, Prins JF:FDM: a graph-based statistical method to detect differentialtranscription using RNA-seq data. Bioinformatics 2011, 27:2633–2640.

Robles et al. BMC Genomics 2012, 13:484 Page 14 of 14http://www.biomedcentral.com/1471-2164/13/484
36. Li B, Dewey CN: RSEM: accurate transcript quantification fromRNA-Seq data with or without a reference genome. BMCBioinformatics 2011, 12:323.
37. Tarazona S, Garcia-Alcalde F, Dopazo J, Ferrer A, Conesa A: Differentialexpression in RNA-seq: a matter of depth. Genome Res 2011,21:2213–2223.
38. Langmead B, Hansen KD, Leek JT: Cloud-scale RNA-sequencingdifferential expression analysis with MYRNA. Genome Biol 2010,11:R83.
39. Robinson M, Smyth G:Moderated statistical tests for assessingdifferences in tag abundance. Bioinformatics 2007, 23(21):2881–2887.
40. Anders S: Analysing RNA-Seq data with the DESeq Package. 2010.[http://www.bioconductor.org/help/course-materials/2011/BioC2011/LabStuff/DESeq.pdf]
41. McIntyre LM, Lopiano KK, Morse AM, Amin V, Oberg AL, Young LJ,Nuzhdin SV: RNA-seq: technical variability and sampling. BMCGenomics 2011, 12:293.
42. Bashir A, Bansal V, Bafna V: Designing deep sequencing experiments:detecting structural variation and estimating transcript abundance.BMC Genomics 2010, 11:385.
43. Robinson M, McCarthy D, Smyth G: edgeR: a Bioconductor package fordifferential expression analysis of digital gene expression data.Bioinformatics 2010, 26:139–140.
44. Stephen S, Cullerne D, Spriggs A, Helliwell C, Lovell D, Taylor JM:BioKanga: a suite of high performance bioinformatics applications.in preparation 2012, [http://code.google.com/p/biokanga/]
45. JabRef Development Team: JabRef. JabRef Development Team 2010.[http://jabref.sourceforge.net/faq.php]
46. Muller A: TeXMed – a BibTeX interface for PubMed 2002–2012.[http://www.bioinformatics.org/texmed/]
47. Chen H, Boutros PC: VennDiagram: a package for the generation ofhighly-customizable Venn and Euler diagrams in R. BMC Bioinf 2011,12:35.
doi:10.1186/1471-2164-13-484Cite this article as: Robles et al.: Efficient experimental design andanalysis strategies for the detection of differential expression using RNA-Sequencing. BMC Genomics 2012 13:484.
Submit your next manuscript to BioMed Centraland take full advantage of:
• Convenient online submission
• Thorough peer review
• No space constraints or color figure charges
• Immediate publication on acceptance
• Inclusion in PubMed, CAS, Scopus and Google Scholar
• Research which is freely available for redistribution
Submit your manuscript at www.biomedcentral.com/submit


![RESEARCHARTICLE OpenAccess … › track...StirrupandDunnBMCMedicalResearchMethodology (2018) 18:65 Page2of14 inclinicaloutcomes[5]resultingfromearlierinitiationof antiretroviraltherapy(ART).However](https://img.dokumen.tips/doc/110x75/60b85b2864a2d15c3c6130da/researcharticle-openaccess-a-track-stirrupanddunnbmcmedicalresearchmethodology.jpg)


![RESEARCHARTICLE OpenAccess … · tantly related protein coding homologs [16], has been applied also for lncRNA homology prediction between human and other mammals [17, 18]. Approaches](https://img.dokumen.tips/doc/110x75/5e1990045a59c452393c9652/researcharticle-openaccess-tantly-related-protein-coding-homologs-16-has-been.jpg)