Embed Size (px)
Citation preview
restaurantscanada.org | Restaurants Canada
Restaurant Outlook Survey 1
Q2 2021
Restaurant Outlook Survey
RESEARCH

restaurantscanada.org | Restaurants Canada
Restaurant Outlook Survey 2

restaurantscanada.org | Restaurants Canada
Restaurant Outlook Survey 3
Executive Summary
� In July, 84% of table-service restaurants were open for on-premise dining (either without any capacity restrictions, or at reduced capacity/outdoor dining only) following the closure of on-premise dining in many parts of the country throughout the first half of 2021.
� In April and May, nine in 10 table-service restaurants reported lower sales compared to the same months in 2019. By comparison, seven in 10 quick-service restaurants reported lower sales. An easing in government restrictions and the opening of patios led to a marginal improvement in foodservice sales in June.
� Given the steep decline in sales and rising expenses, 55% of respondents were operating at a loss in July while 20% were just breaking even.
� The vast majority of foodservice operators are seeing a surge in food prices. Overall, seven in 10 restaurants reported higher costs for fresh vegetables, cooking oil and beef.
� Nearly half (48%) of foodservice operators expect to boost menu prices by 4% or more over the next 12 months. In fact, one in five plan to raise their menu prices by 6% or more. In contrast, only 12% are planning to raise their menu prices by 2% or less.
� In the first two weeks of July, 80% of restaurant owners were finding it difficult to hire back-of-house-positions, while 67% were having difficulties filling front-of-house positions.
� Overall, 14.5% of jobs at quick-service restaurants and 11.4% of jobs at table-service restaurants are currently vacant.
� Looking ahead over the next year, 42% of restaurants expect the number of unfilled positions to increase.

Introduction What a difference a few months can make. In the last edition of the Restaurant Outlook Survey, the foodservice industry was coming out of a challenging second wave. The reprieve didn’t last long: the number of confirmed cases skyrocketed once again in early April and remained high throughout most of May. As a result, government-mandated shutdowns meant some foodservice businesses had to rely on takeout and delivery only, while others decided to temporarily shut down all operations.
When this survey was conducted in early July, the number of confirmed cases had declined to their lowest levels since September 2020. The dramatic drop in cases is the result of a significant surge in the number of partially- and fully-vaccinated Canadians. With the steep decline in cases, most foodservice establishments across the country were able to open up their patios and even be open for on-premise dining.
Based on robust pent-up consumer demand, and a more positive economic outlook, Restaurants Canada’s latest Quarterly Forecast report calls for stronger-than-expected growth in commercial foodservice sales in the second half of 2021 and throughout 2022.
While it is encouraging to see a more positive outlook in the recovery for sales, the foodservice industry continues to be impeded by several major challenges. This edition of the Restaurant Outlook Survey reviews the three biggest challenges that are currently facing restaurants: operator debt, higher food prices and labour shortages.
Restaurant Outlook Survey 4

restaurantscanada.org | Restaurants Canada
Restaurant Outlook Survey 5
Restaurants Reopen!!Following the closure of on-premise dining in many parts of the country due to the second and third waves of COVID-19 throughout the first half of 2021, 84% of table-service restaurants were open for on-premise dining (either without any capacity restrictions, or at reduced capacity or outdoor dining only) in July. One in five table-service restaurants were open solely for takeout and delivery in July compared to more than half (53%) of operators in April.
Just over half (55%) of quick-service restaurant operators were open for on-premise dining, either fully or at reduced capacity. Nearly half (48%) were open only for takeout and delivery in early July, compared to 85% in April.
Meanwhile, seven in 10 of the ‘all other foodservice’ category – which includes accommodation, institutions and bars – were open for on-premise dining either fully or at a reduced capacity. Still, 16% of respondents in this category remain closed temporarily.
Q: Which of the following best describes your current level of operations? (If you operate more than one location, please select all that apply.)
Nearly eight in 10 restaurants were open for on-premise dining in July(either without any capacity restrictions, or at reduced capacity/outdoor dining only)
20%
56%
25%
7%
2% 2%
Open for takeout and/or
delivery only
All operations are temporarily closed due to
COVID-19
Seasonal operation that
is currently closed
Permanently closed due to
COVID-19
Open for on-premise dining,
but at reduced capacity or outdoor
dining only
Fully operating without any
capacity restrictions

restaurantscanada.org | Restaurants Canada
Restaurant Outlook Survey 6
Change in same-store sales in Q2 2021 compared to Q2 2019
Q: For the following months, was your total sales volume, higher, lower, or about the same as it was compared to the same month in 2019?
6% 8%
86%
7% 8%
85%
9% 10%
81%
April May June
Higher
About the same
Lower
The third wave had a devastating impact on foodservice sales in the second quarter of 2021. In April and May, nine in 10 table-service restaurants reported lower sales compared to the same months in 2019 and seven in 10 quick-service restaurants reported lower sales. Roughly eight in 10 ‘all other foodservice’ reported lower sales.
An easing in government restrictions and the opening of patios led to a marginal improvement in foodservice sales in June. Still, 85% of table-service restaurants reported lower sales in June 2021 than in June 2019. Anecdotally, while sales were down during this time, the decline in June sales was smaller than the declines in April and May.
Given the significant hit to sales in the second quarter, combined with rising expenses, 55% of respondents were operating at a loss in July. 20% were just breaking even.
The results varied significantly by segment and by region. While 42% of quick-service restaurants were earning a profit, only 20% of table-service restaurants followed suit.
At a regional level, in Central Canada, which implemented more stringent containment measures, 38% reported a profit compared to 52% in Western Canada and 55% in Atlantic Canada.

restaurantscanada.org | Restaurants Canada
Restaurant Outlook Survey 7
75% of foodservice operators were either operating at loss or just breaking even in July
Q: Which best describes the current profitability of your overall operations?
Making a pre-taxprofit of 5% or more
10%
Making a pre-taxprofit between 0%
and 2%
9%
Making a pre-taxprofit between 2%
and 5%
7%
Operating at loss
55%
Breaking even
20%
Six in 10 respondents in Central Canada were operating at a loss in July
Q: Which best describes the current profitability of your overall operations?
31%
24%
45%
20%
18%
62%
30%
22%
48%
Atlantic Canada Central Canada Western Canada
Operating at loss Breaking even Operating with a profit

restaurantscanada.org | Restaurants Canada
Restaurant Outlook Survey 8
Eight in 10 operators took on new debt due to the COVID-19 crisis
Q: Has your foodservice business taken on new debt due to the COVID-19 crisis?
Yes
81%77%
No
19%23%
Single-unit establishment
Multi-unit establishment
Foodservice Operator Debt
In the last Restaurant Outlook Survey, foodservice owners stated that growing debt is one of the top two challenges for their business for the remainder of 2021. The top challenge, of course, is the potential for additional government-mandated shutdowns.
Overall, 81% of independent restaurants and 77% of multi-unit restaurant owners took on new debt due to the pandemic.
At the segment level, 85% of single-unit table-service restaurants and 89% of multi-unit table-service restaurants took on more debt due to the COVID-19 crisis. In contrast, single-unit quick-service restaurants (83%) were more likely to go into debt compared to multi-unit quick-service restaurants (63%). This is because revenues of many multi-unit QSRs outperformed independent operators.
Overall, 24% of single unit restaurants incurred a debt of less than $50,000, 46% are carrying a debt between $50,000-$100,000, while another 25% incurred debt between $100,000 and $500,000. As a result, 43% of those in debt said it will take more than 18 months for their business to recover. Another 26% are not sure their business will ever recover.

restaurantscanada.org | Restaurants Canada
Restaurant Outlook Survey 9
How much new debt has your business incurred due to the COVID-19 crisis?Single-unit establishments
If current conditions continue, how long will it take your business to recover from debt incurred due to the COVID-19 crisis? Single-unit establishments
Less than $50,000 24%
Between $50,000 and $100,000 46%
Between $100,000 and $500,000 25%
Between $500,000 and $1,000,000 2%
I’d rather not say 2%
More than $1,000,000 1%
Less than a year Between 12 and18 months
More than18 months
4%
27%
43%
26%
My business will not be able to recover unless current
conditions change
In order to manage their debt, whether a single-unit or a multi-unit establishment, 83% of operators said they want to see the federal rent/wage subsidies remain available at pre-July 4 levels, at least through the summer. Just over seven in 10 are looking for more help from the provincial government and feel they need to provide more financial assistance to offset the impacts of the restrictions and dining shutdowns. Seven in 10 are looking for more loan forgiveness. Table-service restaurants require the most help from these programs, as they are among the hardest-hit segments from the pandemic.
restaurantscanada.org | Restaurants Canada
Restaurant Outlook Survey 10
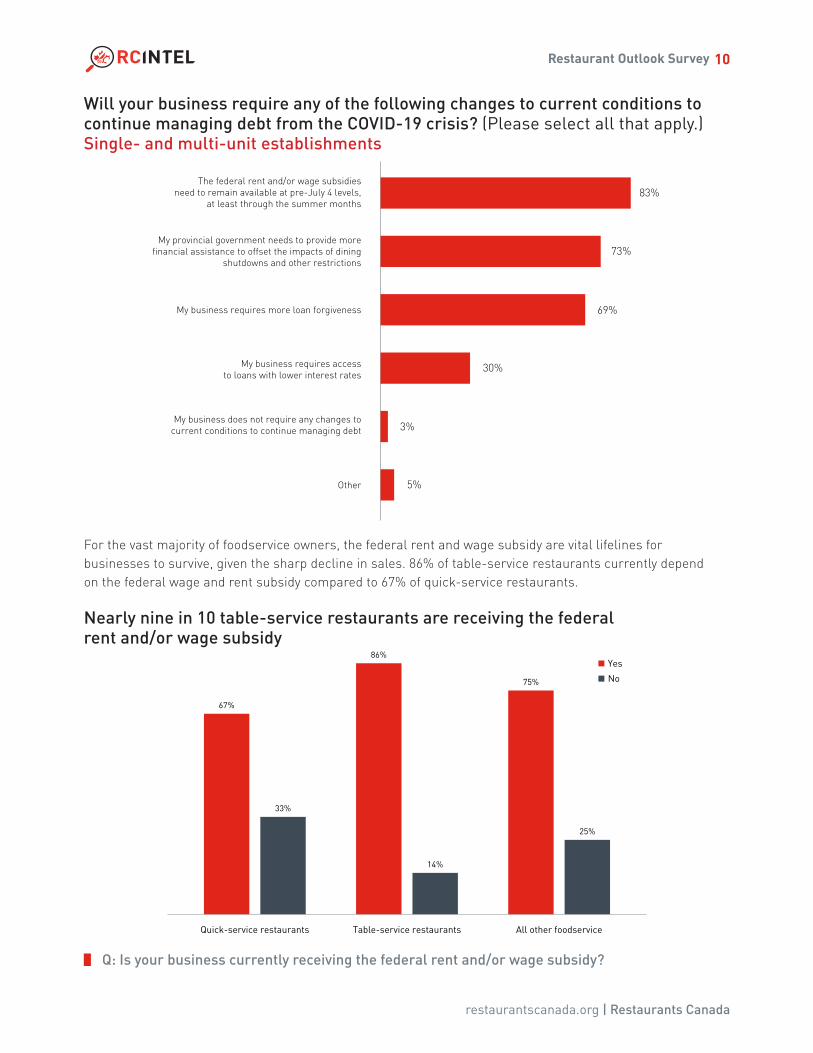
Will your business require any of the following changes to current conditions to continue managing debt from the COVID-19 crisis? (Please select all that apply.) Single- and multi-unit establishments
The federal rent and/or wage subsidiesneed to remain available at pre-July 4 levels,
at least through the summer months83%
My provincial government needs to provide morefinancial assistance to offset the impacts of dining
shutdowns and other restrictions73%
My business requires more loan forgiveness 69%
My business requires accessto loans with lower interest rates
30%
Other 5%
My business does not require any changes tocurrent conditions to continue managing debt 3%
For the vast majority of foodservice owners, the federal rent and wage subsidy are vital lifelines for businesses to survive, given the sharp decline in sales. 86% of table-service restaurants currently depend on the federal wage and rent subsidy compared to 67% of quick-service restaurants.
Nearly nine in 10 table-service restaurants are receiving the federal rent and/or wage subsidy
Q: Is your business currently receiving the federal rent and/or wage subsidy?
Quick-service restaurants Table-service restaurants All other foodservice
67%
33%
86%
14%
75%
25%
Yes
No

restaurantscanada.org | Restaurants Canada
Restaurant Outlook Survey 11
As a result, the vast majority of these business will take another serious blow as subsidies decline between July and September. This will cause a ripple effect which will impact staff hours, hiring or bringing back workers and paying suppliers.
These subsidies are not only critical for the foodservice industry but will also be vital in getting Canadians back to work and the overall economy up and running. As of June 2021, employment in the foodservice and accommodation industry remains 264,000 jobs below pre-pandemic levels. This is more job losses than in the construction, wholesale and retail trade, information and culture and agriculture sectors combined.
Seven in ten operators reported that they would struggle with increasing staff hours or hiring staff due to the impacts of decreasing subsidies
71%
We willstruggle hiring back staff/hiring new staff
75%
We will struggle with increasing
staff hours
53%
We will struggle to keep paying
suppliers
12%
Other
Q: How will your operations be impacted by these subsidies decreasing between July and September? (Please select all that apply.)

restaurantscanada.org | Restaurants Canada
Restaurant Outlook Survey 12
Food costs and menu prices
Based on data from Statistics Canada, menu inflation held steady at around 2.7% in the first six months of 2021. Still, foodservice operators are seeing significant cost pressures as the price of a number of ingredients have increased dramatically.
Seven in 10 restaurants reported a recent surge in the cost of fresh vegetables, cooking oil and beef. Higher prices for poultry and dairy are also having a negative impact on restaurants. Table-service restaurants, which are primarily independent and not part of a chain, are experiencing the largest cost pressures across most of these ingredients.
Several respondents reported soaring costs for other ingredients:
“We are seeing higher costs for all purpose flour, whole wheat flour, rye flour, spelt flour, cornmeal, millet, sunflower seeds, flax seeds, oats, sesame seeds, caraway seeds, poppy seeds, quinoa, wheatgerm, rice flour, etc.”
“Bacon!!! Overall pork prices have soared 28%”
“Imported dry goods and ingredients from Asia”
In addition to higher food costs, foodservice operators identified other major cost increases:
“Plastics and take out packaging” and “Environmentally friendly takeout containers and utensils”
“Rubber gloves: $7 / box pre pandemic, $23/box now”
“A shortage of cardboard is leading to higher prices”
Some operators are also seeing fuel surcharges for delivery. As one operator summarized:
“Everything went up and packaging costs have skyrocketed.”

restaurantscanada.org | Restaurants Canada
Restaurant Outlook Survey 13
Most restaurants are experiencing a surge in costs for vegetables, cooking oil and beef
Q: For which of the following ingredients, if any, have you experienced a recent surge in costs? (Please select all that apply.)
Fresh vegetables
Cookig oil
Beef
Poultry
Dairy
Seafood
Fresh Fruit
Eggs
Coffee
Plant-based foods
None of the above 2%
14%
19%
32%
41%
43%
43%
54%
66%
71%
72%
72%
Other
We asked restaurants to identify how they are responding to these cost increases. There was no simple one-size-fits-all answer. Most would choose a combination of partially absorbing the higher food costs and raising menu prices rather than exclusively do one or the other. For about a third of restaurants, they would remove items from their menus or shop around for lower cost ingredients.
Most restaurants are reluctant to switch to lower cost ingredients or reduce the portion size as they want to make sure they provide the best value to their guests. As one operator stated:
“We are staying focused on the quality of the ingredients and the quality of the processes.”

restaurantscanada.org | Restaurants Canada
Restaurant Outlook Survey 14
Most restaurants are adjusting to higher food costs through a combination of absorbing the higher costs and raising menu prices
Raising menu prices is an unfortunate but expected way for operators to combat the numerous cost increases. Nearly half (48%) expect to boost prices by 4% or more over the next 12 months. In fact, one in five plan to raise their menu prices by 6% or more. In contrast, only 12% are planning to raise their menu prices by 2% or less.
By segment, menu prices for table-service restaurants are expected to increase by 4.6% over the next 12 months, while ‘all other segments’ are planning to raise their menu prices by 4.8%. By comparison, menu prices at quick-service restaurants will likely increase by 4.5%.
Q: How is your foodservice business responding to higher food costs? (Please select all that apply.)
Absorbing (all or partially) the increase in food costs 63%
Raising menu prices 62%
Removing items from the menu 35%
Looking at other sources for lower cost ingredients(e.g. Costco) 33%
Reducing other expenses to offset higher food costs 31%
Switching to lower priced ingredients 18%
Reducing porting sizes 17%
None of the above 2%
Other 2%
Over the next 12 months, by how much do you expect you will raise your menu prices?
Less than 1%
4%
1% to 2%
8%
2% to 3%
15%
3% to 4%
10%
4% to 5%
18%
5% to 6%
10%
6% to 7%
4%
Morethan 7%
15%
Not sure /don’t know
16%

restaurantscanada.org | Restaurants Canada
Restaurant Outlook Survey 15
If these projections hold, it would represent the largest single increase in menu prices since 2018. Meanwhile, menu prices have increased by 16% between January 2016 and May 2021 compared to a 5% increase in food prices at grocery stores. If consumers begin to watch their wallets more carefully, any significant jump in significant menu prices could be detrimental. Affordable while still profitable menu items will be the key to success for most restaurant operators.
Menu Inflation Outpaces Grocery Store InflationChange in prices since January 2016
Source: Statistics Canada
20%
15%
10%
5%
-5%
-10%
0%
Food purchased from stores Food purchased from restaurants
Jan-
16
Apr-
16
Jul-
16
Oct
-16
Jan-
17
Apr-
17
Jul-
17
Oct
-17
Jan-
18
Apr-
18
Jul-
18
Oct
-18
Jan-
19
Apr-
19
Jul-
19
Oct
-19
Jan-
20
Apr-
20
Jul-
20
Oct
-20
Jan-
21
Apr-
21
16%
5%

restaurantscanada.org | Restaurants Canada
Restaurant Outlook Survey 16
During the last few months, how easy has it been for your business to hire new employees for the following positions?
Front-of-house positions 8%67%18%8%
Back-of-house positions 9%80%9%
2%
Manager positions 36%54%9%
1%
Occupations foodservice owners are having the hardest time filling:
Quick-service restaurants Table-service restaurants All other foodservice
Food counter attendants Chefs/sous chefs Dishwashers
Line cooks Cooks Cooks/line cooks
Managers/supervisors Dishwashers Servers
All positions Kitchen managers Bartenders
With many foodservice businesses reopened, finding staff to come back to work is creating a new perfect storm for restaurant owners. In the first two weeks of July, 80% of restaurant owners were finding it difficult to hire back-of-house-positions, while 67% were having difficulties filling front-of-house positions. Just over half of respondents were finding it difficult to find manager positions, although 36% were not looking to fill this position at this time.
Labour Shortages
By its nature, foodservice is very labour intensive. Finding any staff, let alone staff with applicable skills and experience, has become more challenging than ever. Even before the pandemic, restaurateurs were facing significant labour shortages. This was due to declining birth rates, an aging population, and two generations of young people, millennials and Gen Zs, who don’t behave like their predecessors in the workforce.
Based on the results of this survey, 14.5% of jobs at quick-service restaurants and 11.4% of jobs at table-service restaurants are currently vacant.

restaurantscanada.org | Restaurants Canada
Restaurant Outlook Survey 17
This difficulty finding employees stems from a number of issues. Restaurants identified three main reasons:
• 71% felt the government programs (like the Canada Recovery Benefit) were creating a disincentive for people to return back to the workforce.
• 68% believe that people don’t want to work in the foodservice industry. This issue has been raised as an ongoing challenge in the past. While there was some concern that the labour shortage may be exacerbated by the pandemic and people having health and safety concerns of working with the public, only 12% of respondents believed that was the case.
• 59% said there was a shortage of available workers in their region – a product of demographic factors along with a sharp slowdown in immigration.
Q: Which of the following factors, if any, are the biggest challenges to filling these positions? (Please select all that apply.)
Greatest challenges to filling these positions:
71%Competition with government programs(e.g. the Canada Recovery Benefit)
68%People don’t want to work in the foodservice industry
59%Shortage of available workers in the region
42%Can’t find people with the right skills
39%Competition from other industries for workers
26%Too much red tape to hire foreign workers
12%Health and safety concerns of working with the public
9%Other
Looking ahead over the next year, 42% of restaurants expect the number of unfilled positions to increase: as high as 50% for quick-service restaurants vs 39% for table-service restaurants and 43% for “all other foodservice”. Across all segments, roughly four in 10 respondents were unsure if the number of unfilled positions would improve or get worse.
Restaurant owners are looking at a variety of options to address these labour shortages, including:
• Offering benefits like health and/or dental
• Free meals
• Flexible work schedules
• Referral bonuses
• Higher wages
• Better communicating company culture/values

restaurantscanada.org | Restaurants Canada
Restaurant Outlook Survey 18
ConclusionThe end of the second quarter of 2021 represents an important inflection point for the industry. After suffering through a devastating second and third wave, restaurants are opening their patios and their doors. There is a growing sense of optimism.
Reopening doesn’t equate to recovery, however. Given the significant debt taken on by businesses, it will take at least a year or more for many to return to some sense of financial stability. In the short term, the reopening has also led to new challenges: soaring food prices and significant labour shortages.
Restaurants will do as they already have: be resilient and find ways to innovate. As a result, we still strongly believe the foodservice industry will come out of the pandemic stronger and better than ever.

restaurantscanada.org | Restaurants Canada
Restaurant Outlook Survey 19
Which of the following best describes your current level of operations? (If you operate more than one location, please select all that apply.)
Total Foodservice
Quick-service Restaurants
Table-service Restaurants*
All Other Foodservice**
Open for on-premise dining, but at reduced capacity or outdoor dining only
56% 34% 64% 54%
Open for takeout and/or delivery only 25% 48% 19% 21%
Fully operating without any capacity restrictions 20% 21% 20% 18%
All operations are temporarily closed due to COVID-19
7% 3% 4% 16%
Permanently closed due to COVID-19 2% 3% 1% 2%
Seasonal operation that is currently closed 2% 1% 1% 5%
For the following months, was your total sales volume, higher, lower, or about the same as it was compared to the same month in 2019?April 2021 vs April 2019
Total Foodservice
Quick-service Restaurants
Table-service Restaurants*
All Other Foodservice**
Higher 6% 15% 3% 6%
About the same 8% 12% 5% 10%
Lower 86% 73% 91% 83%
May 2021 vs May 2019
Total Foodservice
Quick-service Restaurants
Table-service Restaurants*
All Other Foodservice**
Higher 7% 17% 3% 9%
About the same 8% 11% 6% 12%
Lower 85% 72% 91% 79%
June 2021 vs June 2019
Total Foodservice
Quick-service Restaurants
Table-service Restaurants*
All Other Foodservice**
Higher 9% 17% 6% 12%
About the same 10% 12% 9% 9%
Lower 81% 71% 85% 79%

restaurantscanada.org | Restaurants Canada
Restaurant Outlook Survey 20
How many foodservice establishments do you operate?
Total Foodservice
Quick-service Restaurants
Table-service Restaurants*
All Other Foodservice**
A single, independent establishment 59% 40% 61% 72%
A single location with a multi-unit business or franchise
10% 16% 9% 6%
More than one establishment 31% 44% 29% 22%
Has your foodservice business taken on new debt due to the COVID-19 crisis? SINGLE-UNIT ESTABLISHMENTS
Total Foodservice
Quick-service Restaurants
Table-service Restaurants*
All Other Foodservice**
Yes 81% 83% 85% 68%
No 19% 17% 15% 32%
How much new debt has your business incurred due to the COVID-19 crisis? SINGLE-UNIT ESTABLISHMENTS
Total Foodservice
Quick-service Restaurants
Table-service Restaurants*
All Other Foodservice**
Less than $50,000 24% 32% 23% 21%
Between $50,000 and $100,000 46% 58% 44% 44%
Between $100,000 and $500,000 25% 10% 28% 28%
Between $500,000 and $1,000,000 2% 0% 2% 5%
More than $1,000,000 1% 0% 1% 2%
I’d rather not say 2% 0% 3% 0%
What best describes the current profitability of your overall operations?
Total Foodservice
Quick-service Restaurants
Table-service Restaurants*
All Other Foodservice**
Making a pre-tax profit of 5% or more 10% 22% 7% 6%
Making a pre-tax profit between 2% and 5% 7% 10% 5% 8%
Making a pre-tax profit between 0% and 2% 9% 10% 8% 8%
Breaking even 20% 13% 22% 22%
Operating at a loss 55% 44% 58% 56%
restaurantscanada.org | Restaurants Canada
Restaurant Outlook Survey 21
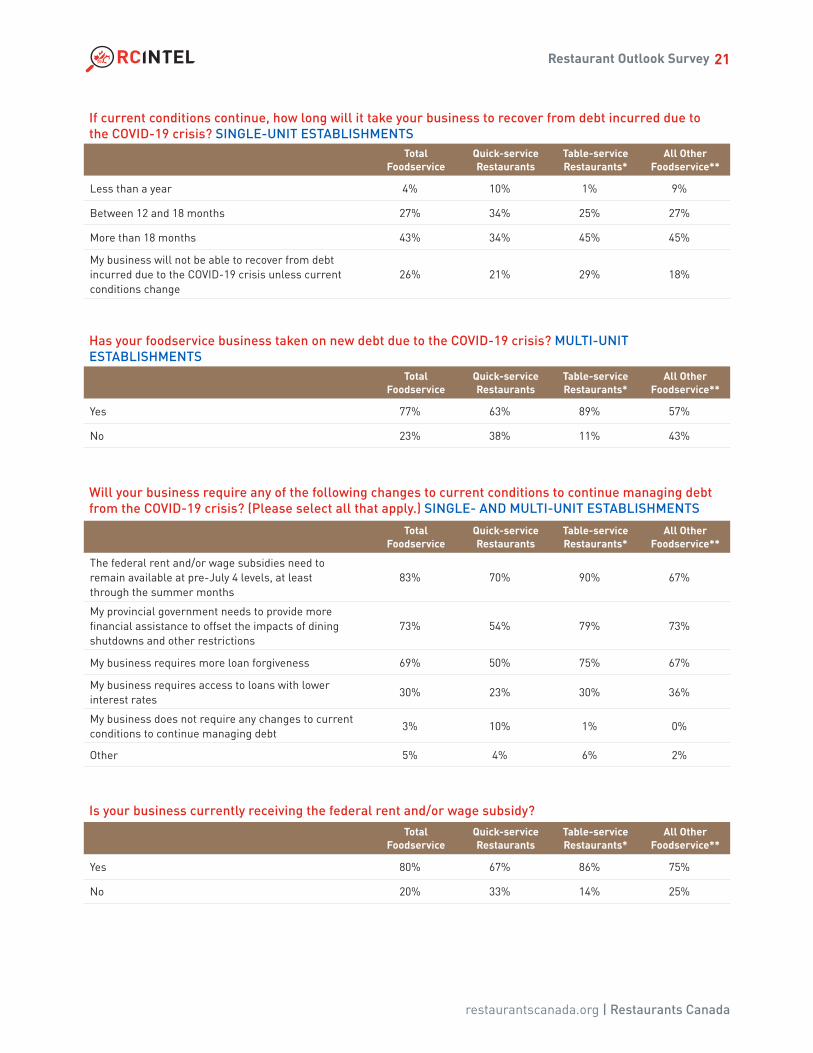
If current conditions continue, how long will it take your business to recover from debt incurred due to the COVID-19 crisis? SINGLE-UNIT ESTABLISHMENTS
Total Foodservice
Quick-service Restaurants
Table-service Restaurants*
All Other Foodservice**
Less than a year 4% 10% 1% 9%
Between 12 and 18 months 27% 34% 25% 27%
More than 18 months 43% 34% 45% 45%
My business will not be able to recover from debt incurred due to the COVID-19 crisis unless current conditions change
26% 21% 29% 18%
Has your foodservice business taken on new debt due to the COVID-19 crisis? MULTI-UNIT ESTABLISHMENTS
Total Foodservice
Quick-service Restaurants
Table-service Restaurants*
All Other Foodservice**
Yes 77% 63% 89% 57%
No 23% 38% 11% 43%
Will your business require any of the following changes to current conditions to continue managing debt from the COVID-19 crisis? (Please select all that apply.) SINGLE- AND MULTI-UNIT ESTABLISHMENTS
Total Foodservice
Quick-service Restaurants
Table-service Restaurants*
All Other Foodservice**
The federal rent and/or wage subsidies need to remain available at pre-July 4 levels, at least through the summer months
83% 70% 90% 67%
My provincial government needs to provide more financial assistance to offset the impacts of dining shutdowns and other restrictions
73% 54% 79% 73%
My business requires more loan forgiveness 69% 50% 75% 67%
My business requires access to loans with lower interest rates
30% 23% 30% 36%
My business does not require any changes to current conditions to continue managing debt
3% 10% 1% 0%
Other 5% 4% 6% 2%
Is your business currently receiving the federal rent and/or wage subsidy?
Total Foodservice
Quick-service Restaurants
Table-service Restaurants*
All Other Foodservice**
Yes 80% 67% 86% 75%
No 20% 33% 14% 25%

restaurantscanada.org | Restaurants Canada
Restaurant Outlook Survey 22
How will your operations be impacted by these subsidies decreasing between July and September? (Please select all that apply.)
Total Foodservice
Quick-service Restaurants
Table-service Restaurants*
All Other Foodservice**
We will struggle with increasing staff hours 75% 63% 79% 69%
We will struggle with hiring back staff/hiring new staff
71% 76% 73% 57%
We will struggle to keep paying suppliers 53% 46% 55% 52%
Other 12% 9% 11% 22%
Over the next 12 months, by how much do you expect you will raise your menu prices?
Total Foodservice
Quick-service Restaurants
Table-service Restaurants*
All Other Foodservice**
Less than 1% 4% 6% 3% 3%
1% to 2% 8% 13% 7% 4%
2% to 3% 15% 15% 14% 16%
3% to 4% 10% 8% 11% 8%
4% to 5% 18% 15% 18% 18%
5% to 6% 10% 10% 10% 12%
6% to 7% 4% 2% 4% 7%
More than 7% 15% 11% 17% 16%
Not sure / don’t know 16% 20% 15% 15%
For which of the following ingredients, if any, have you experienced a recent surge in costs?(Please select all that apply.)
Total Foodservice
Quick-service Restaurants
Table-service Restaurants*
All Other Foodservice**
Fresh vegetables 72% 61% 79% 63%
Cooking oil 72% 54% 80% 64%
Beef 71% 53% 77% 74%
Poultry 66% 50% 72% 61%
Dairy 54% 56% 55% 49%
Seafood 43% 14% 53% 44%
Fresh fruit 43% 28% 46% 50%
Eggs 41% 46% 39% 42%
Coffee 32% 40% 30% 31%
Plant-based foods 19% 13% 21% 21%
None of the above 2% 2% 2% 4%
Other 14% 20% 12% 15%

restaurantscanada.org | Restaurants Canada
Restaurant Outlook Survey 23
How is your foodservice business responding to higher food costs? (Please select all that apply.)
Total Foodservice
Quick-service Restaurants
Table-service Restaurants*
All Other Foodservice**
Absorbing (all or partially) the increase in food costs 63% 66% 65% 55%
Raising menu prices 62% 52% 66% 59%
Removing items from the menu 35% 19% 39% 42%
Looking at other sources for lower cost ingredients (e.g. Costco)
33% 26% 36% 32%
Reducing other expenses to offset higher food costs 31% 31% 33% 25%
Switching to lower priced ingredients 18% 10% 19% 23%
Reducing portion sizes 17% 12% 16% 29%
None of the above 2% 2% 2% 1%
Other 2% 1% 3% 3%
During the last few months, how easy has it been for your business to hire new employees for the following positions?
Manager positionsTotal
FoodserviceQuick-service Restaurants
Table-service Restaurants*
All Other Foodservice**
Easy to hire 1% 1% 1% 3%
Neither easy nor difficult 9% 11% 8% 11%
Difficult to hire 54% 50% 56% 48%
Not applicable 36% 38% 34% 38%
Front-of-house positionsTotal
FoodserviceQuick-service Restaurants
Table-service Restaurants*
All Other Foodservice**
Easy to hire 8% 7% 9% 5%
Neither easy nor difficult 18% 18% 18% 16%
Difficult to hire 67% 61% 68% 68%
Not applicable 8% 15% 5% 10%
Back-of-house positionsTotal
FoodserviceQuick-service Restaurants
Table-service Restaurants*
All Other Foodservice**
Easy to hire 2% 5% 1% 1%
Neither easy nor difficult 9% 15% 6% 14%
Difficult to hire 80% 66% 86% 75%
Not applicable 9% 14% 7% 10%

restaurantscanada.org | Restaurants Canada
Restaurant Outlook Survey 24
Which of the following factors, if any, are the biggest challenges to filling these positions? (Please select all that apply.)
Total Foodservice
Quick-service Restaurants
Table-service Restaurants*
All Other Foodservice**
Competition with government programs (e.g. the Canada Recovery Benefit)
71% 64% 72% 71%
People don’t want to work in the foodservice industry 68% 64% 70% 61%
Shortage of available workers in the region 59% 52% 60% 63%
Can’t find people with the right skills 42% 34% 44% 43%
Competition from other industries for workers 39% 38% 41% 30%
Too much red tape to hire foreign workers 26% 26% 26% 24%
Health and safety concerns of working with the public
12% 16% 10% 10%
Other 9% 12% 7% 14%
How many units do you own and/or operate?
Total Foodservice
Quick-service Restaurants
Table-service Restaurants*
All Other Foodservice**
Number of Responses 585 112 335 138
Number of Units 4,737 1,821 2,340 576
* Includes table-service restaurant and combination table-service restaurant and bar** Includes accommodation, drinking places, institutions (e.g. health care, education) and managed service providers.
Over the next year, do you expect the number of unfilled positions at your establishment(s) to get:
Total Foodservice
Quick-service Restaurants
Table-service Restaurants*
All Other Foodservice**
Much higher 12% 15% 12% 9%
Somewhat higher 30% 36% 27% 34%
Somewhat lower 17% 7% 20% 21%
Much lower 2% 4% 3% 0%
I don’t know/not sure 38% 39% 38% 36%

restaurantscanada.org | Restaurants Canada
Restaurant Outlook Survey 25
About the Restaurant Outlook SurveyThe results for the second quarter are compiled from responses to an email to foodservice operators inviting them to take an online survey. The survey was conducted in July 2021.
Restaurants Canada encourages foodservice operators to participate in the Restaurant Outlook Survey to ensure results continue to be representative of our industry. Contact Chris Elliott at [email protected] to participate in the survey.
About Restaurants CanadaRestaurants Canada is a growing community of 30,000 foodservice businesses, including restaurants, bars, caterers, institutions, and suppliers. We connect our members from coast to coast through services, research, and advocacy for a strong and vibrant restaurant community.
Before the start of the COVID-19 pandemic, Canada’s foodservice sector was a $95 billion industry, directly employing 1.2 million people, providing Canada’s number one source of first jobs and serving 22 million customers across the country every day.

restaurantscanada.org | Restaurants Canada
Restaurant Outlook Survey 26
For further information
Restaurants Canada
1155 Queen Street West,
Toronto, Ontario M6J 1J4
Tel: (416) 923-8416 or 1-800-387-5649
Fax: (416) 923-1450
E-mail: [email protected]
Website: restaurantscanada.org
Platinum
Gold
Silver
Thank you to our corporate sponsors
Copyright 2021. All rights reserved including the right of reproduction in whole or in part in any form.

restaurantscanada.org | Restaurants Canada
Restaurant Outlook Survey 27