Embed Size (px)
Citation preview

R E S E A RC H R E PO R T
Supporting Students to Be
Resilient, Successful, and Ready to
Learn Early Assessment of the Prince George’s County TNI@School Initiative
Sarah Gillespie Jasmine Simington Megan Gallagher
June 2018
E D U C A T I O N A N D T R A I N I N G

A BO U T THE U RBA N IN S T ITU TE
The nonprofit Urban Institute is a leading research organization dedicated to developing evidence-based insights
that improve people’s lives and strengthen communities. For 50 years, Urban has been the trusted source for
rigorous analysis of complex social and economic issues; strategic advice to policymakers, philanthropists, and
practitioners; and new, promising ideas that expand opportunities for all. Our work inspires effective decisions that
advance fairness and enhance the well-being of people and places.
Copyright © March 2018. Urban Institute. Permission is granted for reproduction of this file, with attribution to the
Urban Institute. Cover image by Tim Meko.
Contents Acknowledgments iv
Supporting Students to Be Resilient, Successful, and Ready to Learn 1
TNI@School: Prince George’s Community Schools Network 1
TNI@School Goals and Outcomes 3
TNI@School Framework and Evidence Base 4
Serving TNI@School Students 8
Inbound Referral to TNI@School by School Staff, Partners, and Families 9
Student and Family Needs Assessments 15
Outbound Referral to TNI@School Partners and Community-Based Organizations 18
Services Received by Students and Families 20
Learning and Recommendations 24
Early Successes and Opportunities for Growth 24
Improving Data Collection and Reporting 27
Appendix. Methods 29
Notes 30
References 31
About the Authors 33
Statement of Independence 34
I V A C K N O W L E D G M E N T S
Acknowledgments This report was funded by a collaboration between the Office of County Executive Rushern L. Baker III
of Prince George’s County, Maryland; Prince George’s County Public Schools; and the Prince George’s
County Department of Social Services. We are grateful to them and to all our funders, who make it
possible for Urban to advance its mission.
The views expressed are those of the authors and should not be attributed to the Urban Institute,
its trustees, or its funders. Funders do not determine research findings or the insights and
recommendations of Urban experts. Further information on the Urban Institute’s funding principles is
available at urban.org/fundingprinciples.
The authors thank the whole TNI@School team, including Gloria Brown-Burnett, Whitney Rhodes,
Tre Jerdon-Cabrera, Tiarra Medley, and Kai Boggess-de Bruin, for their partnership and significant
contributions to this report.

Supporting Students to Be Resilient,
Successful, and Ready to Learn
TNI@School: Prince George’s
Community Schools Network
In 2012, Prince George’s County, MD, launched the Transforming Neighborhoods Initiative (TNI) to
achieve the vision of County Executive Rushern L. Baker III for a thriving economy, great schools, safe
neighborhoods, and high-quality health care by targeting cross-governmental resources to
neighborhoods with significant needs. Prince George’s County is the nation’s most affluent jurisdiction
with an African American majority. With 908,049 residents (2016 Census), Prince George’s is the
second-most-populous county in Maryland. It is also among Maryland’s most diverse counties; African
Americans, Hispanics, and Caucasians made up 65 percent, 18 percent, and 13 percent of the
population in 2016, respectively. Prince George’s County is home to the University of Maryland,
College Park; NASA’s Goddard Space Flight Center; Joint Base Andrews (previously Andrews Air Force
Base); and the US Department of Agriculture’s Beltsville Agricultural Research Center. It is bordered by
Washington, DC, and Montgomery, Howard, Anne Arundel, Calvert, and Charles counties in Maryland.1
Recognizing the interrelated challenges facing the County’s highest-need neighborhoods, the TNI
structure seeks to leverage County knowledge and resources through interagency neighborhood
committees designed to facilitate coordinated and collaborative responses to challenges in specific
neighborhoods. Three neighborhoods were added to the original six based on high rates of violent crime
that negatively affect the County’s ability to attract new businesses, developers, and residents. To
support the County Executive’s vision, TNI@School: Prince George’s Community Schools Network
emerged in 2013 as a collaboration between the County government and Prince George’s County
Public Schools. Led by the Office of the County Executive and implemented by the Department of Social
Services, TNI@School supports students in identified neighborhoods by offering wraparound supports
to improve learning (figure 1).
TNI@School initially targeted 22 of the highest-need schools in the target neighborhoods based on
needs related to attendance, academic performance, and a school progress index. Since then,
TNI@School has worked to reach more schools and students, and as of May 2017, it provides services in
40 schools across all grade levels (table 1). Prince George’s County Public Schools serves 132,000

2 S U P P O R T I N G S T U D E N T S T O B E R E S I L I E N T , S U C C E S S F U L , A N D R E A D Y T O L E A R N
students in prekindergarten through grade 12 with diversity of its student population reflecting that of
the County.2
This report explores implementation of TNI@School from 2015 through 2017. Before 2015, the
initiative and its current data collection and reporting processes were still in development. Though the
level of analysis described here cannot be done on the first two years of the initiative, TNI@School
reports that around 3,400 service connections were made from 2013 to 2015. Current programs and
processes evolved out of the challenges experienced, lessons learned, and improvements made during
those initial years.
FIGURE 1
TNI and TNI@School Structure
Note: TNI@School expanded full-day prekindergarten in elementary schools. This assessment focuses on K–12 program
components.
Prince George's County Public Schools
Prince George's County Executive and County
Government
Transforming Neighborhoods Initiative (2012)
9 Neighborhoods
Interagency Neighborhood
Committees
TNI@School (2013)
40 target schools
Resource Coordination and
Referral
Behavioral Health Counseling
Case ManagementPositive Youth Development
S U P P O R T I N G S T U D E N T S T O B E R E S I L I E N T , S U C C E S S F U L , A N D R E A D Y T O L E A R N 3
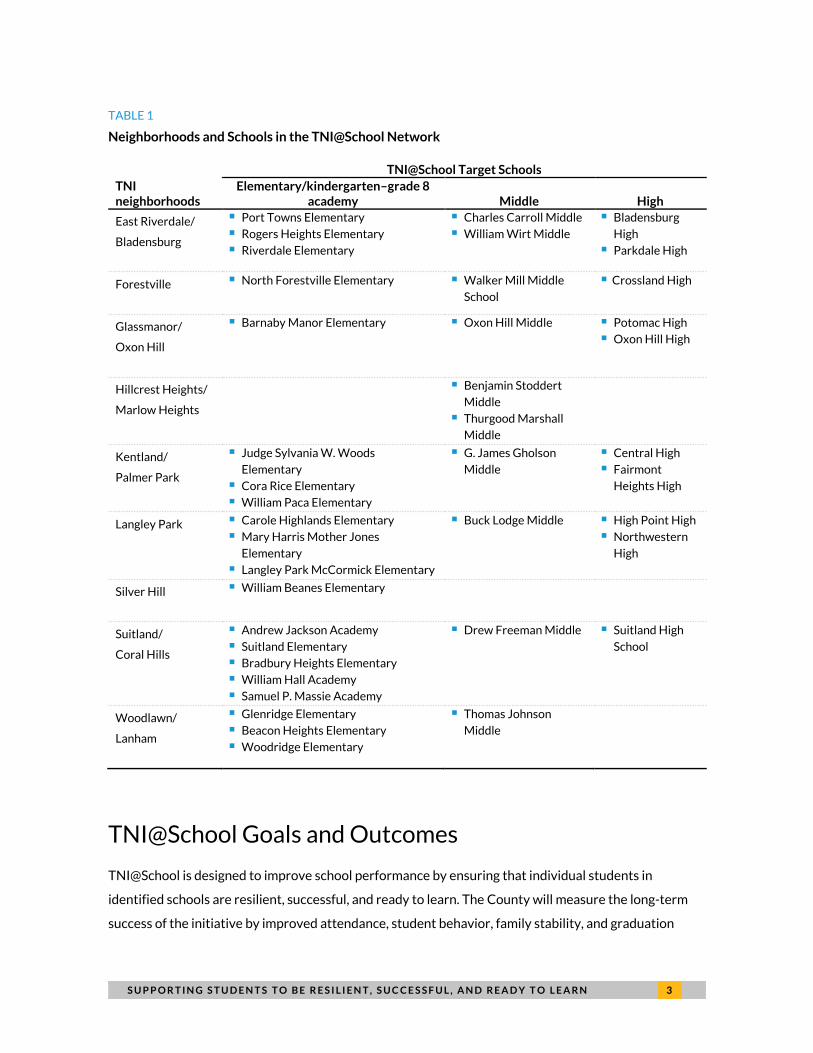
TABLE 1
Neighborhoods and Schools in the TNI@School Network
TNI neighborhoods
TNI@School Target Schools
Elementary/kindergarten–grade 8 academy Middle High
East Riverdale/
Bladensburg
Port Towns Elementary Rogers Heights Elementary Riverdale Elementary
Charles Carroll Middle William Wirt Middle
Bladensburg
High Parkdale High
Forestville
North Forestville Elementary Walker Mill Middle
School
Crossland High
Glassmanor/
Oxon Hill
Barnaby Manor Elementary Oxon Hill Middle Potomac High Oxon Hill High
Hillcrest Heights/
Marlow Heights
Benjamin Stoddert
Middle Thurgood Marshall
Middle
Kentland/
Palmer Park
Judge Sylvania W. Woods
Elementary Cora Rice Elementary William Paca Elementary
G. James Gholson
Middle
Central High Fairmont
Heights High
Langley Park
Carole Highlands Elementary Mary Harris Mother Jones
Elementary Langley Park McCormick Elementary
Buck Lodge Middle High Point High Northwestern
High
Silver Hill
William Beanes Elementary
Suitland/
Coral Hills
Andrew Jackson Academy Suitland Elementary Bradbury Heights Elementary William Hall Academy Samuel P. Massie Academy
Drew Freeman Middle Suitland High
School
Woodlawn/
Lanham
Glenridge Elementary Beacon Heights Elementary Woodridge Elementary
Thomas Johnson
Middle
TNI@School Goals and Outcomes
TNI@School is designed to improve school performance by ensuring that individual students in
identified schools are resilient, successful, and ready to learn. The County will measure the long-term
success of the initiative by improved attendance, student behavior, family stability, and graduation

4 S U P P O R T I N G S T U D E N T S T O B E R E S I L I E N T , S U C C E S S F U L , A N D R E A D Y T O L E A R N
rates across all schools in the initiative. The root causes of these outcomes are interrelated, and wide
disparities often exist across race, foreign-born status, English proficiency, and country of origin, but
evidence highlights their link to student success.
Increased school attendance: Students who attend school are more likely to learn course
content and succeed academically. Research shows that attendance is linked to reading skills,
and chronic absences predict dropping out (Epstein and Sheldon 2002). In 2014, chronic
absenteeism among high schoolers in Prince George’s County Public Schools was three times
the national average (Maryland State Department of Education 2015).
Improved student behavior: Suspension and expulsion can exacerbate students’ behavioral
issues and can have profoundly negative impacts on students, including increased behavioral
problems, higher risk of violence and substance abuse, and greater likelihood of academic
failure (Gregory, Skiba, and Noguera 2010). In 2013, Prince George’s County Public Schools
suspensions and expulsions were higher than the overall state rates (Maryland State
Department of Education 2015).
Increased family stability: Children who have a stable family are less vulnerable to other
negative outcomes, including behavioral problems, chronic health issues, and involvement in
other systems, including child welfare (Sandstrom and Huerta 2013).
Increased graduation rates: High school graduation is often a prerequisite for college and
career advancement, and it is associated with higher education, employment, and income in
adulthood (Northeastern University Center for Labor Market Studies 2009). Prince George’s
County Public Schools graduation rates are below the Maryland state average but have
improved steadily for the past several years and reached 81 percent in 2016 (Maryland State
Department of Education 2015).
TNI@School Framework and Evidence Base
Collaborative efforts like TNI@School require not only a common set of goals among partners, but a
structure for working together toward those goals. TNI@School has adopted The Coalition for
Community Schools’ framework, which emphasizes the principles of strong partnerships, accountability
for results, high expectations, community strengths, diversity, and innovative solutions (figure 2). The
research evidence on community schools is compelling: a literature review of 49 community schools

S U P P O R T I N G S T U D E N T S T O B E R E S I L I E N T , S U C C E S S F U L , A N D R E A D Y T O L E A R N 5
programs across the country found positive results across all outcomes of interest to TNI@School
(Dryfoos, n.d.):
Thirty-six of the 49 programs reported academic gains.
Nineteen programs reported improvements in school attendance.
Eleven programs reported a reduction in suspensions.
Twelve programs reported increases in parent involvement.
Six programs reported lower violence rates and safer streets in their communities.
Using the community schools framework, TNI@School established a network of school-based
partners and community-based organizations to help achieve its goals. This report focuses on the
activities of TNI@School’s seven core partners during 2015–17 and examines interim measures of
progress in connecting students to four categories of services (see the appendix for the methods used
to analyze the data obtained from TNI@School). As detailed in the framework below, these services are
designed to provide evidence-based interventions to help remove barriers to success, improve
outcomes, and support TNI@School students to be resilient, successful, and ready to learn.
As detailed in the framework, TNI@School core partners and services include the following:
Resource connection and referral: Prince George’s County Department of Social Services
Community Resource Advocates (CRAs) Program
Behavioral health counseling: Advanced Behavioral Health (ABH), PACE Consulting LLC
(PACE), and The Children’s Guild
Positive youth development and college and career readiness: Hillside Work-Scholarship
Connection (Hillside)
Case management: Maryland Multicultural Youth Center (MMYC) and La Clinica del Pueblo
(La Clinica)
TNI@School partners offer strategies that are grounded in research evidence shown to have a
positive effect on one or more of the TNI@School outcomes. In some cases, TNI@School partners may
not target the same population or use the same curriculum as that cited in the research, but they use
core components of evidence-based strategies. For example, research demonstrates that health-based
strategies can affect student outcomes. School-based health clinics and services, such as the mental

6 S U P P O R T I N G S T U D E N T S T O B E R E S I L I E N T , S U C C E S S F U L , A N D R E A D Y T O L E A R N
health counseling provided by TNI@School, have been shown to reduce high school dropout rates by
one-third (Keeton, Soleimanpour, and Brindis 2012). Cognitive-behavioral therapy, offered by
TNI@School’s behavioral health partners, has been shown to increase school attendance both during
and after services (King et al. 1998). Additionally, research has identified connecting students to health
insurance, as TNI@School’s CRAs do, as a high-impact strategy that improves attendance and increases
the likelihood of high school and college graduation as compared with students who are not connected
to health insurance (US Department of Education and US Department of Health and Human Services
2016).

S U P P O R T I N G S T U D E N T S T O B E R E S I L I E N T , S U C C E S S F U L , A N D R E A D Y T O L E A R N 7
FIGURE 2
TNI@School Framework
Prince George’s County Department of Social Services, Public Schools,
and network of community services under the direction of the
TNI@School Dream Team
TNI@School students are resilient, successful, and ready to learn
Improved Attendance
Improved Student Behavior
Improved Family Stability
Improved Graduation Rates
Interim Measures of Success Linked to Longer-Term Outcomes
• School-based mental health services
• Cognitive-behavioral therapy • Group counseling: social skills
training • Family engagement
• School-based case management and connection to services
• Family-school-community partnerships that draw on family and community resources to create safe schools
• Connecting students to health insurance • Family engagement in services
• Academic case management • Language supports for English language
learners • Mentoring and family engagement • Internships, apprenticeships • Summer enrichment, community activities • Teen pregnancy prevention
• Success and timeliness of service connection
• Frequency and type of services • Location of therapy; presenting
problems • Exit from services
• Completion and timeliness of student needs assessments
• Number and appropriateness of student referrals • Referral follow-up rates • Connection to supplemental funding for behavioral
health supports
• Success and timeliness of service connections
• Frequency and focus of services • Referrals to community services
Evidence-Based Strategies
• Career/college counseling • Academic case management • Mentoring; individual student
intervention plans • Family engagement • Internships, apprenticeships,
and work training
• Success and timeliness of service connections • Frequency and focus of services • Attendance; individual goal plan updates • Parent engagement in services • Exit from services
Resource Connection and
Referral
Case Management
Behavioral Health
Counseling
Positive Youth Development and
College and Career Readiness
Advanced Behavioral
Health
PACE CONSULTING,
LLC
The Children’s
Guild
Hillside Work-Scholarship Connection
Community Resource Advocate Program
Maryland Multicultural Youth Center
La Clinica Del Pueblo

8 S U P P O R T I N G S T U D E N T S T O B E R E S I L I E N T , S U C C E S S F U L , A N D R E A D Y T O L E A R N
Similarly, academic supports like college and career counseling, also offered by TNI@School, have
been shown to significantly increase students’ grade point averages, likelihood of graduation from high
school, and enrollment and persistence in college. These findings were maintained when disaggregated
by gender and race/ethnicity (Curtis and Bandy 2016). Academic case management, such as that
provided by TNI@School’s case management partners, has been shown to reduce both absenteeism
(Reid and Bailey-Dempsey 1995) and school behavior incidences, especially those resulting in in-school
or out-of-school suspensions (Kannel-Ray, Lacefield, and Zeller 2008). Both school-based connection to
services, such as CRAs, and a range of mentoring programs, such as those provided by other
TNI@School partners, have been shown to increase student attendance (Lehr, Sinclar, and Christenson
2004; Smith 1995). Finally, job training and vocational education programs like those offered by
TNI@School’s college and career readiness partners have been shown to significantly increase high
school graduation (Schochet, Brughardt, and Glazerman 2000).
In addition, TNI@School implements several structural strategies that, although they are not
specific to a program or target population, have been shown to positively affect students, schools, and
families. These strategies include multidisciplinary teams, colocation of education and services,
performance measurement, and data sharing (Goldberger, Keough, and Almeida 2000; Gunderson
2012; Prevention First 2011; Public Citizens for Children and Youth 2011).
The evidence base on school and community partnerships can also inform other potential strategies
that may support TNI@School outcomes. Out-of-school-time strategies, income support strategies,
family engagement strategies, and transportation strategies all feature prominently in the evidence on
what works for student and family outcomes. TNI@School incorporates some of these strategies in
existing programming, and future opportunities to add or expand services should consider these other
evidence-based strategies.
Serving TNI@School Students
TNI@School works to connect students to resources and address barriers to academic performance
through the five basic steps outlined here and shown in figure 3. Students are referred to TNI@School
by school staff, TNI@School partners, or by themselves or their families. The referrer indicates one or
several reasons for the referral, such academic concerns, behavioral challenges, or basic needs. After a
student is referred to the initiative, TNI@School CRAs embedded in each target school complete a
needs assessment to further identify the student’s specific needs. Based on identified needs, CRAs then

S U P P O R T I N G S T U D E N T S T O B E R E S I L I E N T , S U C C E S S F U L , A N D R E A D Y T O L E A R N 9
refer the student to TNI@School partners working in each target school and other community-based
organizations. TNI@School partners are charged with engaging referred students in services and
regularly reporting to TNI@School on service provision and some student outcomes. These data, which
are reported in the TNI@School Efforts to Outcomes database, were used to generate the information
in this report. At the end of the 2016–17 school year, CRAs began working to complete follow-up needs
assessments with students to understand whether student needs improved or changed after services.
Because this process is relatively new, this report does not include follow-up needs assessment
information.
FIGURE 3
Five-Step TNI@School Resource Connection Cycle
Inbound Referral to TNI@School by School Staff, Partners, and Families
TNI@School strives to connect students and families to resources, and resource connection begins with
the referral process. During the period covered by this report (August 2015 through January 2017),
school staff, partners, and families referred 3,026 individual students to TNI@School. Referrals were
spread across all school levels, including 32 percent in elementary schools, 27 percent in middle schools,
9 percent in the three kindergarten–grade 8 academies, and 32 percent in high schools (figure 4).
Inbound referral to TNI@School by
school staff, partners, and
families
Student and family needs assessment
Outbound referral to TNI@School
partners and community-based
organizations
Services students and families receive
Follow-up needs assessment
(began spring 2017)

1 0 S U P P O R T I N G S T U D E N T S T O B E R E S I L I E N T , S U C C E S S F U L , A N D R E A D Y T O L E A R N
FIGURE 4
Percentage of Referrals by Grade Level
Source: TNI@School intake/inbound files, 2015–17.
Note: n = 3,026 students.
Various school and program staff are responsible for referring students to TNI@School when
appropriate. Data on referral sources are available for 2015–17, though the referral source variable
changed from an open-ended response in the older intake form to a series of standard response options
in the current inbound form. Based on inbound referral data only (n = 1,799 referrals), the primary
referrers to TNI@School included teachers (20 percent), counselors (20 percent), principals or vice
principals (14 percent), and self or family members (10 percent) (figure 5). A high share (19 percent) of
inbound referral sources were reported as “other.” The least common referral sources included pupil
personnel workers and school health professionals.
33%
27%
9%
32%
Elementary school Middle school K–8 academies High school

S U P P O R T I N G S T U D E N T S T O B E R E S I L I E N T , S U C C E S S F U L , A N D R E A D Y T O L E A R N 1 1
FIGURE 5
Primary Referrers across All School Levels
Source: TNI@School inbound files, 2015–17.
Note: n = 1,799 referrals.
Program data can also be used to examine primary referrers by school level to understand who is
working to connect students to TNI@School resources across different age groups. These data are
presented by school level so that staff and partners working in each school can better understand which
referrers are actively engaged in the TNI@School referral process and who could be more engaged in
the elementary, middle, and high schools and the kindergarten–grade 8 academies. For example, over
half (55 percent) of all referrals made by teachers were at the elementary school level. Referrals by
counselors were more common at the middle (33 percent) and high school (38 percent) levels (figure 6).
20 20 19
14
10
8
6
3
0
Share of students (percent)

1 2 S U P P O R T I N G S T U D E N T S T O B E R E S I L I E N T , S U C C E S S F U L , A N D R E A D Y T O L E A R N
FIGURE 6
Primary Referrers by School Level
Source: TNI@School inbound files, 2015–17.
Notes: Missing data are excluded from the percentages reported. n = 1,799 referrals.
To continue to increase appropriate referrals, TNI@School may consider engaging some of the less
common referrers, such as parent engagement associates, pupil personnel workers, and school health
professionals. Additionally, because students themselves and their family members represent a large
share of the referrers, it may be helpful to gather their feedback on how the referral process works and
whether there may be opportunities for improvement.
Through the inbound referral process, referrers choose one or more of 18 reasons specified for a
referral to TNI@School. As shown in table 2, most students were referred for multiple reasons; on
average, students were referred for three reasons. Many combinations of referral reasons exist, and no
one combination represented a large share of all referred students. The most common combination of
reasons was attendance and food resources, which represented 2.5 percent of all referred students.
More analysis on referral reason combinations, such as whether certain reasons are more likely to be
seen in combination than alone, could be helpful to further inform programming. Referrers could also
provide an open-ended response for other referral reasons, which have been coded and added to the
other specified response options as appropriate in the analyses below.
55
17
10
1821
33
9
38
42
25
5
28
34
17
13
36
Elementary Middle K–8 Academies High
Teacher Counselor Principal/vice principal/administrator OtherTotal referral source (percent)
S U P P O R T I N G S T U D E N T S T O B E R E S I L I E N T , S U C C E S S F U L , A N D R E A D Y T O L E A R N 1 3
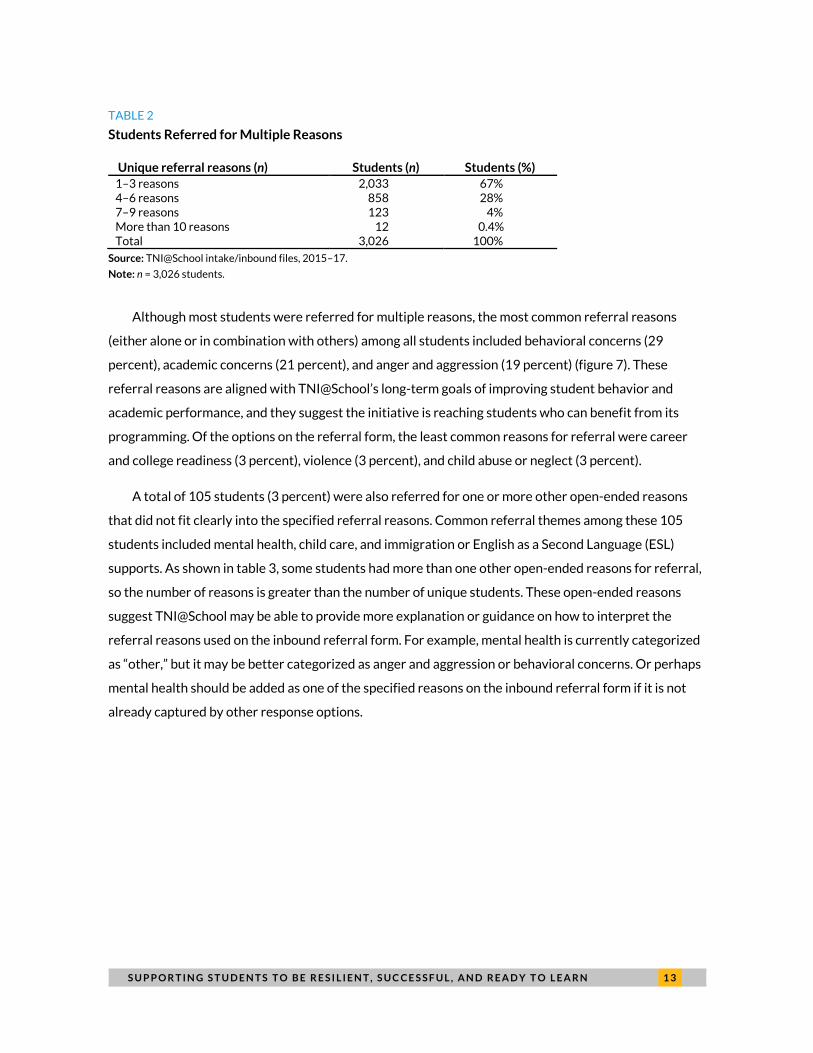
TABLE 2
Students Referred for Multiple Reasons
Unique referral reasons (n) Students (n) Students (%)
1–3 reasons 2,033 67% 4–6 reasons 858 28% 7–9 reasons 123 4% More than 10 reasons 12 0.4% Total 3,026 100%
Source: TNI@School intake/inbound files, 2015–17.
Note: n = 3,026 students.
Although most students were referred for multiple reasons, the most common referral reasons
(either alone or in combination with others) among all students included behavioral concerns (29
percent), academic concerns (21 percent), and anger and aggression (19 percent) (figure 7). These
referral reasons are aligned with TNI@School’s long-term goals of improving student behavior and
academic performance, and they suggest the initiative is reaching students who can benefit from its
programming. Of the options on the referral form, the least common reasons for referral were career
and college readiness (3 percent), violence (3 percent), and child abuse or neglect (3 percent).
A total of 105 students (3 percent) were also referred for one or more other open-ended reasons
that did not fit clearly into the specified referral reasons. Common referral themes among these 105
students included mental health, child care, and immigration or English as a Second Language (ESL)
supports. As shown in table 3, some students had more than one other open-ended reasons for referral,
so the number of reasons is greater than the number of unique students. These open-ended reasons
suggest TNI@School may be able to provide more explanation or guidance on how to interpret the
referral reasons used on the inbound referral form. For example, mental health is currently categorized
as “other,” but it may be better categorized as anger and aggression or behavioral concerns. Or perhaps
mental health should be added as one of the specified reasons on the inbound referral form if it is not
already captured by other response options.

1 4 S U P P O R T I N G S T U D E N T S T O B E R E S I L I E N T , S U C C E S S F U L , A N D R E A D Y T O L E A R N
FIGURE 7
Reasons for Student Referrals
Source: TNI@School intake/inbound files, 2015–17.
Note: n = 3,026 students.
TABLE 3
Other Open-Ended Reasons for Student Referrals
Other open-ended reasons for referral
Unique students (n)
Child care 20 Criminal activity 2 Culture and religion 6 Immigration and ESL supports 10 Mental health 90 Transportation 2
Source: TNI@School intake/inbound files, 2015–17.
Notes: ESL = English as a Second Language. n = 105 students.
Interestingly, inbound referral data also show that the top three overall referral reasons were also
the top three referral reasons when looking specifically at elementary school, middle school, and high
school referrals (figure 8). At all three levels, behavioral concerns, academic concerns, and anger and
aggression topped the list of referral reasons, either by themselves or in combination with other
reasons. For example, of all students referred for academic concerns, 32 percent were elementary
29
2119
16 15 1514 14
7 7 6 54 4 3 3 3 3
Total referrals (percent)

S U P P O R T I N G S T U D E N T S T O B E R E S I L I E N T , S U C C E S S F U L , A N D R E A D Y T O L E A R N 1 5
school students, 27 percent were middle school students, 10 percent were students in kindergarten–
grade 8 academies, and 32 percent were high school students.
FIGURE 8
Top Reasons for Student Referrals by School Level
Source: TNI@School administrative data, 2015–17.
Notes: Students may have been referred for multiple reasons; for this reason, percentages do not add up to 100. Missing data are
excluded from the percentages reported. n = 3,026 students.
Student and Family Needs Assessments
After TNI@School receives an inbound referral, CRAs work to do a more in-depth assessment of
student and family needs. During the 2015–16 school year, CRAs used the Child and Adolescent Needs
and Strengths (CANS) Comprehensive Assessment; in the following school year (2016–17), CRAs used a
different general needs assessment informed by the CANS assessment. Assessment data are available
for 3,018 students referred between August 2015 and January 2017. Of these students, assessments
were completed for 71 percent (2,157 students) by June 2017. As discussed in the CRA section below,
the proportion of students assessed included all referred students, including students with whom CRAs
were unable to make contact. Without contact, CRAs could not complete a needs assessment. In the
next assessment, it would be useful to look at how many students with whom CRAs are able to make
32
27
10
32
38
27
7
29
34
25
8
33
Elementary Middle K–8 Academies High
Academic concerns Anger/aggression Behavioral concerns
Total referral reasons (percent)

1 6 S U P P O R T I N G S T U D E N T S T O B E R E S I L I E N T , S U C C E S S F U L , A N D R E A D Y T O L E A R N
contact subsequently complete a needs assessment. These data would help reveal how large a barrier
contact information is and whether there are other barriers to needs assessment after referral.
Although each school in the TNI@School network has unique strengths and assets, these schools
were strategically identified based on the characteristics of the schools, students, and families that
present barriers to academic success. All but 11 of the 40 schools are Title I schools, a federal
designation that attests to the high share of students from low-income families. In all but 4 schools, over
70 percent of students are eligible to receive free and reduced-price school meals, another indicator
that their families likely struggle to make ends meet. The majority of students in the TNI@School
network are black or Hispanic. Schools within Langley Park and East Riverdale/Bladensburg, two
neighborhoods with large Hispanic populations, serve a large share of Hispanic students. Three
variables (foreign born, housing status, and food insecurity) used in the general needs assessments
completed for TNI@School students assessed in school year 2016–17 are discussed below. These
variables provide relevant benchmarks (though not perfect comparisons) for Prince George’s County
overall.
About 21 percent of Prince George’s County residents overall are foreign born.3 Students who are
foreign born or new to the country can face significant challenges in adapting to their new school and
living environment, including communication and language barriers, as well as culture shocks and other
changes associated with a long-distance move (Short and Boyson 2012). Based on data from the
TNI@School general needs assessment in 2016–17, about 8 percent of TNI@School students or their
families who completed the assessment self-reported they were new to the country (figure 9). About 3
percent of children in the United States under age 18 are foreign born (NCES 2015).
FIGURE 9
TNI@School Self-Reported as New to the Country
Source: TNI@School general needs assessment, 2016–17.
Note: Data available for 526 students.
Positively, most TNI@School students that completed the assessment resided in stable housing
(figure 10). Sixty-nine percent lived in an apartment or home owned by their parent or guardian, and

S U P P O R T I N G S T U D E N T S T O B E R E S I L I E N T , S U C C E S S F U L , A N D R E A D Y T O L E A R N 1 7
another 15 percent lived in an apartment or home their parent or guardian rented. Housing stability has
been linked to strong academic performance and attendance (Cunningham and MacDonald 2012),
underscoring the importance of identifying and monitoring student and family housing status. The
homeownership rate among TNI@School families was higher than the homeownership rate across
Prince George’s County (62 percent).4 However, 16 percent of TNI@School families resided in a more
unstable housing situation, with 9 percent doubled up with other family and friends and 7 percent in
motels, transitional housing, emergency shelters, or other places.
FIGURE 10
Family Housing Status among TNI@School Students
Source: TNI@School general needs assessment, 2016–17.
Note: Data available for 511 students.
Food insecurity is also linked to challenges with attendance and academic performance among
students (Wight, Thampi, and Briggs 2010). Based on predictors of food insecurity including poverty,
unemployment, and homeownership, Feeding America estimates the food insecurity rate in Prince
George’s County at 14.4 percent.5 In the general needs assessment, TNI@School seeks to uncover food
insecurity by asking whether a student’s family has worried that food would run out before they could
purchase more. For the 2016–17 school year, 20 percent of TNI@School students or their families who
7%
9%
15%
69%
Motel, transitional housing,emergency shelter, other
With family or friends in a semipermanentor permanent residence
Apartment or home that family rents
Apartment or home that family owns

1 8 S U P P O R T I N G S T U D E N T S T O B E R E S I L I E N T , S U C C E S S F U L , A N D R E A D Y T O L E A R N
completed the assessment self-reported they worried that food would run out (figure 11). The rate
among TNI@School families is significantly higher than the County (14 percent) or the nation (13
percent).6
FIGURE 11
TNI@School Self-Reported Concern about Food
Source: TNI@School general needs assessment, 2016–17.
Note: Data available for 451 students.
Because TNI@School tracks several indicators on student needs, these data can help inform
whether TNI@School is reaching the vulnerable students it seeks to serve and what other types of
services students may need.
Outbound Referral to TNI@School Partners and Community-Based Organizations
After assessing student and family needs, CRAs, the cornerstone of the TNI@School model, work to
connect students to TNI@School partners and community resources. CRAs are embedded in each
target school and work within unique school climates. School climate and readiness for the TNI@School
project affect how integrated and effective CRAs can be, especially during early implementation. CRAs
have worked to cultivate school relationships to increase engagement with TNI@School over time.
From August 2015 through January 2017, CRAs made resource connections to 6 TNI@School
partners and over 60 other community-based resources that work to address a variety of challenges,
from housing to adult mental health to financial stability. Between the 2015–16 and 2016–17 school
years, TNI@School intentionally made changes and improvements to their program processes and data
collection that were intended to improve key measures, such as the number of referred students who
have a needs assessment completed and the time between student referral and program participation.
This report looks at early implementation, but the next iteration of data analysis may show
improvements that occurred subsequent to these changes.

S U P P O R T I N G S T U D E N T S T O B E R E S I L I E N T , S U C C E S S F U L , A N D R E A D Y T O L E A R N 1 9
Of the 3,026 students referred to TNI@School by January 2017, CRAs made resource connections
for 91 percent (2,751 students) by June 2017 (six months after the last referred student in this analysis),
as recorded in the outbound referral file. Student referrals, needs assessments, and resource
connections represent three steps in the TNI@School process; each step includes overlapping groups of
students (figure 12). Many students completed all three steps in the process, but some students who
were referred did not receive a resource connection, and not all students who received a resource
connection also completed a needs assessment. Examining how these groups of students overlap may
help highlight areas in which TNI@School can strengthen the process so that more students complete all
three steps.
FIGURE 12
TNI@School Indicators of Progress
Resource connection and referral
Sources: TNI@School intake/inbound files; outbound file; Child and Adolescent Needs and Strengths and general needs
assessment file.
Note: n = 3,026 students.
CRAs worked to ensure resource connections were made in a timely manner. Data on students who
were assessed by January 2017 (n = 1,327) show that most students began TNI@School program
participation about 19 days after completing the needs assessment. Many students began program
participation much sooner, with about 36 percent of students beginning program participation the same
day as their needs assessment. CRAs seek to make appropriate resource connections based on referral
reasons and needs assessment findings. Of the 1,248 students for whom CRAs made referrals to at least
one TNI@School partner by January 2017, 89 percent (1,110 students) were connected to appropriate
partners.
CRAs also monitored family engagement as measured by parent or guardian consent to treatment
goals established in response to a student’s needs assessment. Family engagement often provides a
boost to student outcomes by marshaling both school and family investment in a student’s success
(Harvard Family Research Project 2014). To secure consent to treatment goals, CRAs must first
2 0 S U P P O R T I N G S T U D E N T S T O B E R E S I L I E N T , S U C C E S S F U L , A N D R E A D Y T O L E A R N
establish communication with each student’s parent or guardian, which often takes flexibility and
persistence. TNI@School shows early signs of success around this indicator, but more progress is
needed. For those students for whom data were reported (509 students with a general needs
assessment for the 2016–17 school year), about half (52 percent) of the families consented to at least
one of their student’s treatment goals as determined by the needs assessment, while the other half did
not.
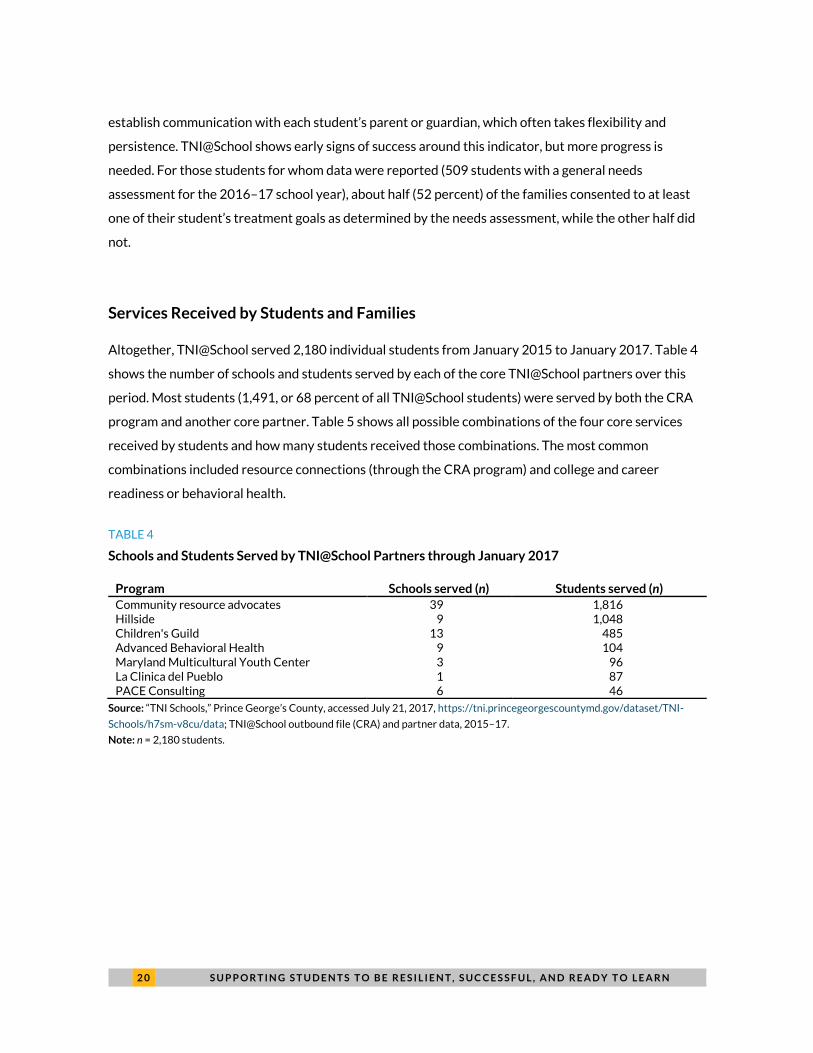
Services Received by Students and Families
Altogether, TNI@School served 2,180 individual students from January 2015 to January 2017. Table 4
shows the number of schools and students served by each of the core TNI@School partners over this
period. Most students (1,491, or 68 percent of all TNI@School students) were served by both the CRA
program and another core partner. Table 5 shows all possible combinations of the four core services
received by students and how many students received those combinations. The most common
combinations included resource connections (through the CRA program) and college and career
readiness or behavioral health.
TABLE 4
Schools and Students Served by TNI@School Partners through January 2017
Program Schools served (n) Students served (n)
Community resource advocates 39 1,816 Hillside 9 1,048 Children's Guild 13 485 Advanced Behavioral Health 9 104 Maryland Multicultural Youth Center 3 96 La Clinica del Pueblo 1 87 PACE Consulting 6 46
Source: “TNI Schools,” Prince George’s County, accessed July 21, 2017, https://tni.princegeorgescountymd.gov/dataset/TNI-
Schools/h7sm-v8cu/data; TNI@School outbound file (CRA) and partner data, 2015–17.
Note: n = 2,180 students.

S U P P O R T I N G S T U D E N T S T O B E R E S I L I E N T , S U C C E S S F U L , A N D R E A D Y T O L E A R N 2 1
TABLE 5
Service Combinations for TNI@School Students
Type of service Students served
(%) Students served
(n)
Resource connection and college and career readiness 39% 847 Resource connection and behavioral health 24% 524 Resource connection only 15% 329 College and career readiness only 9% 186 Resource connection and case management 5% 105 Behavioral health only 4% 96 Case management only 4% 78 Resource connection, behavioral health, and college and career readiness 1% 11 Behavioral health and college and career readiness 0% 4
Source: TNI@School outbound file (CRA) and partner data, 2015–17.
Note: n = 2,180 students.
BEHAVIORAL HEALTH COUNSELING
Core Partners: Advanced Behavioral Health, PACE Consulting LLC, and The Children’s Guild
TNI@School offers behavioral health services through ABH, PACE, and Children’s Guild. Together,
these partners served 635 students. Most of these students were referred to behavioral health partners
through the outbound referral process, though 16 percent were connected another way (figure 13).
The first session for students served by ABH or PACE (150 students) happened approximately four
weeks after their referral. Students attended an average of 23 sessions with ABH and PACE and exited
after about three months of services. Students received multiple types of therapy, sometimes in
combination. The majority (87 percent) of students received individual psychotherapy at least once, and
61 percent received family therapy or psychotherapy at least once. Sixty-one percent of students
received therapy in school, over one-quarter (28 percent) of students received therapy in their home,
and another 11 percent of students received therapy in an office setting. For these sessions,
TNI@School offered supplemental funding to qualifying students who otherwise would not have been
able to use behavioral health services. Supplemental funding is a key resource for helping the program
achieve its goal of reducing barriers to academic and social supports for low-income students. During
2015–17, 145 students received supplemental funding (97 percent of those who had requested it) to
support their access to behavioral health services.

2 2 S U P P O R T I N G S T U D E N T S T O B E R E S I L I E N T , S U C C E S S F U L , A N D R E A D Y T O L E A R N
FIGURE 13
TNI@School Indicators of Progress
Behavioral Health Counseling
Source: TNI@School partner data, January 2015–January 2017.
Note: ABH = Advanced Behavioral Health; PACE = PACE Consulting.
CASE MANAGEMENT
Core Partners: La Clinica del Pueblo and Maryland Multicultural Youth Center
Case management services were received by 183 students from either La Clinica or MMYC. Many
students were connected through the outbound referral process, though 42 percent were connected
another way. Twenty-five students were referred to one of these partners but not successfully engaged
by January 2017, which may speak to the demand for these services.
La Clinica was recruited by the County specifically to address the needs of unaccompanied minors
who fled from Central America. Students served by La Clinica attended an average of six sessions from
September 2016 to February 2017. Students attended various types of sessions and often more than
one type. The most common types of sessions were case management (47 percent of students attended
at least one of these), group intervention (38 percent), and group therapy (30 percent). Some sessions
resulted in additional referrals for other services, most commonly reported as additional referrals for
education, food, or other reasons. La Clinica covered a variety of outcome areas in student sessions. The
most common outcome areas covered were reported as behavioral or mental health services (34
percent of students had at least one session that covered this outcome) and providing language access
to services for those with limited English proficiency (29 percent). Language services were generally
provided to facilitate student or family involvement in the process of reducing barriers or advocating for
themselves.
MMYC, which also provides case management, tracks 14 areas of well-being in their case
management sessions. The majority of sessions reported focused on behavior and communications (58
percent) with the next most common types of session focused on community resources (21 percent) and
academic progress (10 percent). On average, students attended 32 sessions with MMYC between

S U P P O R T I N G S T U D E N T S T O B E R E S I L I E N T , S U C C E S S F U L , A N D R E A D Y T O L E A R N 2 3
January 2015 and January 2017. MMYC tracks many types of participant outcomes in their own
program data, but these data are not yet available in the TNI@School Efforts to Outcomes database.
TNI@School may seek to integrate more MMYC outcomes in their database to be analyzed in the next
assessment.
POSITIVE YOUTH DEVELOPMENT AND COLLEGE AND CAREER READINESS
Core Partner: Hillside Work-Scholarship Connection
As of January 2017, Hillside reported 856 TNI@School students currently enrolled in services out of the
1,048 TNI@School students ever served by Hillside. Eighty-two percent of students served by Hillside
were connected through the outbound referral process. On average, students attended 14 sessions in
the nine-month period from May 2016 to January 2017. Hillside tracks attendance at both scheduled
and unscheduled meetings. Over half of all Hillside students attended at least half of their scheduled
meetings. About one-third of students struggled more with attendance and attended less than half of
their scheduled meetings. The program data do not yet support an analysis of why some students might
attend more scheduled sessions than others. In the future, it may be beneficial to examine whether
students with greater parent engagement, for example, have more frequent attendance.
Hillside tracks four core services provided to students. The most common core services provided
are after-school programming and academic assistance and postsecondary training, all of which were
provided to all Hillside students at some point during their participation (figure 14). Case management
was close behind these and provided at least once to 93 percent of all Hillside students, and
employment training was provided at least once to 40 percent of students. Many students received at
least three core services (53 percent) or even all four core services (40 percent). Hillside engaged the
parents of 56 percent of students at least once during their participation and consistently engaged the
parents of 6 percent of students once a month between September 2016 and January 2017, when these
data were reported.
In addition to program implementation measures, Hillside collects data regarding student progress
toward program milestones. A key component of the Hillside program is the individual goal plan, which
summarizes how students will achieve the goals they have set for themselves. Although these data were
only reported for September 2016 to January 2017, they show 159 students received an update to
their individual goal plan, suggesting that students and staff are both establishing and updating the
plans. Similarly, achieving Hillside’s Youth Employment Training Academy certification and obtaining
employment are significant milestones for some Hillside students. Program data show that 16 students
achieved the academy certification, and 21 students obtained employment while receiving Hillside

2 4 S U P P O R T I N G S T U D E N T S T O B E R E S I L I E N T , S U C C E S S F U L , A N D R E A D Y T O L E A R N
services. Of the 63 students for whom data on postgraduation plans were collected, 56 were reported
as matriculating to college, and the other seven were entering the military. These outcomes represent a
small share of Hillside students currently served through TNI@School, as many students were still
working toward these outcomes or may have achieved one of these outcomes before Hillside began
reporting data to TNI@School. Outcomes will be better understood as data become more complete.
Additionally, TNI@School may wish to track more interim outcomes of Hillside services that may
precede or accompany Youth Employment Training Academy certification and employment.
FIGURE 14
TNI@School Indicators of Progress
Positive youth development and career and college readiness
Source: TNI@School Hillside program data, May 2016–January 2017.
Learning and Recommendations
Early Successes and Opportunities for Growth
TNI@School has made great strides in setting up a robust initiative and serving over 2,180 students
during 2015–17. The initiative has established a solid foundation for connecting students and families
to programming designed to remove barriers to academic success, improve academic outcomes, and
stabilize families. Early in implementation, TNI@School established a rigorous performance
measurement process designed to track service delivery and assess student, family, and school
outcomes. In just the last school year (2016–17), TNI@School has made many intentional changes to
their processes and procedures designed to better connect students to resources. Implementation is an
iterative process, and the tasks ahead for TNI@School will focus on continuing to improve processes
and services based on the data collected in the first year and a half of implementation. The data
highlight two major early successes:

S U P P O R T I N G S T U D E N T S T O B E R E S I L I E N T , S U C C E S S F U L , A N D R E A D Y T O L E A R N 2 5
Students are referred to TNI@School for a wide range of needs. Based on data from the
general needs assessment, TNI@School is engaging students with a variety of needs, including
students who self-report as new to the country, who are in unstable housing situations, and
whose families worry about food security. Based on data from the inbound referrals, students
are most commonly referred for academic and behavioral concerns and anger or aggression
issues. Further, students often have unique combinations of referral reasons, with few patterns
across students. These findings suggest that TNI@School is reaching students who can benefit
from resource connections but that the resource combinations needed by each student will
likely be unique based on their unique needs. The CRA model is a good fit for this approach, as
CRAs are able to conduct more in-depth needs assessments and make individual resource
connections based on student needs.
TNI@School uses referral reasons and assessment data to connect students with services
that match their needs. Most students referred to TNI@School receive a service connection,
and most service connections are appropriate based on student needs. TNI@School may
consider what other services may be needed based on the most common reasons for referral
written in the “other” category of the referral form. For example, child care was the second
most common reason written in the “other” category. Some TNI@School services may be in
higher demand than the initiative can currently meet. For example, some students referred for
case management had not yet been connected with those partners as of this analysis.
Opportunities for growth include the following:
Refine response options on the inbound referral form and train potential referrers. In moving
from the intake to the inbound referral form, TNI@School made improvements in tracking the
types of school staff and partners referring students to TNI@School. Another opportunity to
improve the inbound referral form may be to further refine the options for referral reasons
based on the most common reasons written in as “other” or provide more guidance on how to
interpret the existing referral reasons. For example, mental health is currently categorized as
“other,” but it may be better categorized as anger or aggression or behavioral concerns. Or
perhaps mental health should be added as one of the specified reasons on the inbound referral
form if it is not already captured by other response options. Expanding response options or
collecting more specific detail on other reasons for referrals may also provide additional insight
on student needs and how TNI@School can help address them.

2 6 S U P P O R T I N G S T U D E N T S T O B E R E S I L I E N T , S U C C E S S F U L , A N D R E A D Y T O L E A R N
Seek feedback on the TNI@School referral process from both the most common and least
common referrers. During 2015–17, school staff, students, and other stakeholders made 4,237
referrals to TNI@School across all school levels. To continue to increase appropriate referrals,
TNI@School may consider engaging some of the less common referrers, such as parent
engagement associates, pupil personnel workers, and school health professionals. Because
students themselves and their family members represent a share of referrers, it may be helpful
to gather their feedback on how the referral process works and whether there may be
opportunities for improvement.
Expand CRA capacity for assessment and follow-up. Overall, program data show that CRAs
played a critical role in the referral and resource connection process. Through June 2017, CRAs
completed assessments for 2,157 individual students and made service connections for 2,751
individual students. CRAs were not able to complete an assessment on some students because
of insufficient contact information. In addition, some students served by TNI@School partners
did not come through the CRA referral process, which made it difficult to track the
appropriateness and timeliness of service connections and the referral follow-up rate.
Share program data with all partners and continually assess progress. Data are only
meaningful if they are interpreted within the context of implementation and applied in ways
that improve programming and student outcomes. Many questions are not answered by the
data in this report, and each iteration of analysis brings to light additional questions. In the next
assessment, for example, TNI@School is interested in looking at whether process
improvements made in school year 2016–17 resulted in more efficient resource connections
for students. These data only explore the first year and a half of implementation, but they do
provide a platform for informed discussions among partners about whether the program is
working as well as it could and what, if any, improvements might be made to better support
student outcomes. Data should be shared transparently, and partners should be invited to help
interpret findings and plan for any changes.
Push forward in collecting and analyzing student and family outcome data. This report uses
program data from 2015 through 2017 to examine early indicators of success in connecting
students to services. Evidence has shown these indicators are good predictors of future
outcomes for students and families. There is always an opportunity to improve and expand
these program data, as outlined in more detail below, which would increase confidence in the
analysis and meaning behind the findings. Additionally, there is an opportunity for TNI@School
partners to add outcomes to their data collection, such as assessments of changes in behavior,

S U P P O R T I N G S T U D E N T S T O B E R E S I L I E N T , S U C C E S S F U L , A N D R E A D Y T O L E A R N 2 7
attitude, knowledge, or skills, which would help measure whether students are better off after
service connections. In spring 2017, TNI@School made a large effort to reassess students to
understand how their needs had changed or been resolved since receiving services, and these
data will offer some insight on outcomes. TNI@School is also working to obtain school data for
TNI@School students that can be linked to existing program data to better understand whether
students receiving services are achieving the goals of increased attendance, academic
performance, and graduation. Family stability will likely be harder to measure, but proxy data
from the County or the Department of Social Services or a follow-up survey of TNI@School
families could start to track changes in family outcomes.
Improving Data Collection and Reporting
TNI@School provided two years of program data for this report. The effort involved in setting up a
shared measurement system across multiple partners cannot be underestimated, and TNI@School
currently has ongoing data collection from all seven core partners. TNI@School has navigated a number
of data challenges to improve data quality, including multiple data system changes and training a large
number of staff and partners on data entry. It is common for initiatives like TNI@School to refine and
build out their data system through performance measurement and continuous improvement for
several years before embarking on rigorous evaluation. Below are several opportunities to improve
data entry and data quality control to support stronger data analysis in the future, many of which are
currently in progress across the TNI@School initiative.
Outbound referrals: Data from the outbound referral form suggest many students are being
connected to TNI@School entities and partners outside of this primary referral process. These
outside referrals prevent further analysis of service connections and follow-up rates and make
it more difficult to be clear on how many students are served by each TNI@School partner.
TNI@School might consider reviewing the referral process to ensure all referrals are processed
the same way, or at a minimum, all referral processes track the same standard data elements.
Missing data: TNI@School should work to build the capacity and commitment of staff entering
data to increase data completeness. Many data fields used to construct the measures in this
report (or those dropped from this report) had more than 10 percent of data missing,
decreasing the reliability of the measure. Students who are missing from the data may
represent either positive or negative outcomes that could significantly change interpretation of
the data.

2 8 S U P P O R T I N G S T U D E N T S T O B E R E S I L I E N T , S U C C E S S F U L , A N D R E A D Y T O L E A R N
Double-barreled response options: Some forms combined two or more response options when
individual options would have been more accurate. For example, the referrer form combines
the student and a family member into a single category that can be chosen for referrer, when in
reality these can be very different referrers.
Documentation: TNI@School has made many intentional changes throughout the first years of
implementation to improve data collection. Creating a timeline of these changes and the dates
they went into effect will help explain discrepancies in data that may otherwise portray an
inaccurate picture of implementation. For example, changes in documentation could include
» documenting the changes from the intake to the inbound form and from the CANS
assessment to the general needs assessment,
» documenting new requirements for data entry, and
» documenting policy changes, such as when follow-up needs assessments began.
Additionally, continued maintenance of the data dictionary of all fields currently reported by
each TNI@School partner and a data process flow that illustrates how data are collected,
transferred among partners, and ultimately reported in the shared measurement system can
strengthen quality control and analysis. The TNI@School team has extensive expertise in their
own data, but this documentation would support future external evaluations or continuity in
the event of staff turnover.
.

A P P E N D I X 2 9
Appendix. Methods The Urban Institute received student-level program data from TNI@School spanning 2015 to 2017,
with some variation by partner (table A.1). Using SAS, we ran basic descriptive statistics based on the
indicators discussed with TNI@School program staff as key data points to review for the early
assessment. Students were linked across files by using the participant enterprise ID, a unique code
assigned by TNI@School staff for each student, and duplicate entries were removed from each dataset
before analysis. For student-level analyses, students with multiple referrals or sessions were merged
into one record. Source notes for all tables, graphs, and infographics should be consulted for specific
data files and date ranges.
TABLE A.1
Availability of Program Data
Data source Time period
CRA program/referrals
intake/inbound report August 2015–January 31, 2017 general needs assessment January 2016–January 31, 2017 Child and Adolescent Needs and Strengths assessment August 2015–January 31, 2017 outbound report (including legacy data) August 2015–January 31, 2017
Partner data Children's Guild January 2015–January 31, 2017 PACE Consulting April 2015–January 31, 2017 Advanced Behavioral Health April 2015–January 31, 2017 La Clinica del Pueblo September 2016–January 31, 2017 Maryland Multicultural Youth Center January 2015–January 31, 2017 Hillside May 2016–January 31, 2017
.

3 0 N O T E S
Notes1. “Prince George’s County, MD,” Data USA, accessed February 21, 2018, https://datausa.io/profile/geo/prince-
george%27s-county-md/; “QuickFacts, Prince George’s County, Maryland,” US Census Bureau, accessed
February 21, 2018,
https://www.census.gov/quickfacts/fact/table/princegeorgescountymaryland/PST045216#viewtop.
2. “Facts and Figures,” Prince George’s County Public Schools, October 17, 2016, http://www.pgcps.org/facts-and-
figures/.
3. This statistic was taken from the US Census Bureau, 2011–15 American Community Survey five-year estimates.
4. This statistic was taken from the US Census Bureau, 2011–15 American Community Survey five-year estimates.
5. This statistic was taken from Feeding America’s 2015 Map the Meal Gap food insecurity rate estimate.
6. “Food Insecurity in the United States,” Feeding America, accessed February 21, 2018,
http://map.feedingamerica.org/.

R E F E R E N C E S 3 1
References Cunningham, M., and G. MacDonald. 2012. “Housing as a Platform for Improving Education Outcomes among Low-
Income Children.” Washington, DC: Urban Institute.
Curtis, L. A., and T. Bandy. 2016. The Quantum Opportunities Program: A Randomized Control Evaluation, 2nd ed.
Washington, DC: Milton S. Eisenhower Foundation.
Dryfoos, J. G. n.d. “Evaluation of Community Schools: Findings to Date.”
http://www.communityschools.org/assets/1/AssetManager/Evaluation%20of%20Community%20Schools_joy_
dryfoos.pdf
Epstein, J., and S. Sheldon. 2002. “Present and Accounted for: Improving Student Attendance through Family and
Community Involvement.” Baltimore: John Hopkins University.
Goldberger, S., R. Keough, and C. Almeida. 2000. “Benchmarks for Success in High School Education: Putting Data
to Work in School-to-Career Education Reform.” Providence, RI: Brown University.
Gregory, A., R. J. Skiba., and P. A. Noguera. 2010. “The Achievement Gap and the Discipline Gap: Two Sides of the
Same Coin?” Educational Researcher 39 (1): 59–68. http://doi.org/10.3102%2F0013189X09357621.
Gunderson, J. 2012. “Data Sharing: Federal Rules and Best Practices to Improve Out-of-School-Time Programs and
Student Outcomes.” Partnership for Youth and Children.
Harvard Family Research Project. 2014. “Redefining Family Engagement for Student Success.” Cambridge, MA:
Harvard University.
Kannel-Ray, N. V., W. E. Lacefield, and P. J. Zeller. 2008. “Academic Case Managers: Evaluating a Middle School
Intervention for Children At-Risk.” Journal of MultiDisciplinary Evaluation 5 (10): 21–29.
Keeton, V., S. Soleimanpour, and C. D. Brindis. 2012. “School-Based Health Centers in an Era of Health Care
Reform: Building on History.” Current Problems in Pediatric and Adolescent Health Care 42 (6): 132–58.
http://doi.org/10.1016/j.cppeds.2012.03.002.
King, N. J., B. J. Tonge, D. Heyne, M. Pritchard, S. Rollings, D. Young, N. Myerson, and T. H. Ollendick. 1998.
“Cognitive-Behavioral Treatment of School-Refusing Children: A Controlled Evaluation.” Journal of American
Academy of Child and Adolescent Psychiatry 37: 395–403.
Lehr, C. A., M. F. Sinclair, and S. L. Christenson. 2004. “Addressing Student Engagement and Truancy Prevention
during the Elementary Years: A Replication Study of the Check & Connect Model.” Journal of Education for
Students Placed At Risk 9 (3): 279–301.
Maryland State Department of Education. 2015. “2015 Maryland Report Card.” Baltimore: Maryland State
Department of Education.
Northeastern University Center for Labor Market Studies. 2009. “Left Behind in America: The Nation’s Dropout
Crisis.” Boston: Northeastern University.
Prevention First. 2011. Student Assistance Program Guidebook: A Resource for Schools. Springfield, IL: Prevention
First.
Public Citizens for Children and Youth. 2011. Behavioral Health Goes to School: An Analysis of School-Based Behavioral
Health Services in Philadelphia. Philadelphia: Public Citizens for Children and Youth.
Reid, W. J., and C. Bailey-Dempsey. 1995. “The Effects of Monetary Incentives on School Performance.” Families in
Society 76 (6): 331–40.

3 2 R E F E R E N C E S
Sandstrom, H., and S. Huerta. 2013. “The Negative Effects of Instability on Child Development: A Research
Synthesis.” Washington, DC: Urban Institute.
Schochet, P., J. Brughardt, and S. Glazerman. 2000. “National Job Corps Study: The Short-Term Impacts of Job
Corps on Participants’ Employment and Related Outcomes.” Washington, DC: US Department of Labor,
Employment and Training Administration.
Short, D. J., and B. A. Boyson. 2012. Helping Newcomer Students Succeed in Secondary Schools and Beyond.
Washington, DC: Center for Applied Linguistics.
Smith, A. J. 1995. “School-Based Case Management: An Integrated Service Model for Early Intervention with
Potential Dropouts.” Clemson, SC: Clemson University, National Dropout Prevention Center.
US Department of Education and US Department of Health and Human Services. 2016. Healthy Students, Promising
Futures: State and Local Action Steps and Practices to Improve School-Based Health. Washington, DC.
Wight, V., K. Thampi, and J. Briggs. 2010. “Who Are America’s Poor Children? Examining Food Insecurity among
Children in the United States.” New York: Columbia University, National Center for Children in Poverty.

A B O U T T H E A U T H O R S 3 3
About the Authors Sarah Gillespie is a senior research associate in the Metropolitan Housing and
Communities Policy Center at the Urban Institute. Her research focuses on housing
and homelessness, place-based initiatives, and performance measurement. She is
project director for a five-site national evaluation of supportive housing for families
involved in the child welfare system and an evaluation of a supportive housing social-
impact bond for people frequently involved with the criminal justice system in Denver,
CO.
Jasmine Simington is a research associate in the Metropolitan Housing and
Communities Policy Center. She has explored housing policy questions related to
public housing resident services, housing needs in Tribal areas, and the intersection of
housing issues with education policy and youth development programming.
Megan Gallagher is a senior research associate at the Urban Institute. Her research
focuses on efforts to improve housing and educational opportunities for children in
low-income families. She provides research and technical support for comprehensive,
place-based interventions in Washington, DC, and Prince George’s County, MD, that
seek to improve educational outcomes. She recently completed a study of innovative
collaborations between assisted housing providers and education agencies in Akron,
OH; New Haven, CT; and Vancouver, WA.

S T A T E M E N T O F I N D E P E N D E N C E
The Urban Institute strives to meet the highest standards of integrity and quality in its research and analyses and in
the evidence-based policy recommendations offered by its researchers and experts. We believe that operating
consistent with the values of independence, rigor, and transparency is essential to maintaining those standards. As
an organization, the Urban Institute does not take positions on issues, but it does empower and support its experts
in sharing their own evidence-based views and policy recommendations that have been shaped by scholarship.
Funders do not determine our research findings or the insights and recommendations of our experts. Urban
scholars and experts are expected to be objective and follow the evidence wherever it may lead.

2100 M Street NW
Washington, DC 20037
www.urban.org