Embed Size (px)
Citation preview

rese
arch
repo
rt
Experimental Evaluation of the Strength and Behaviour of 16- and 18-Gauge Cold Formed Steel Top Track Systems
R E S E A R C H R E P O R T R P 0 5 - 4 2 0 0 5 R E V I S I O N 2 0 0 6
American Iron and Steel Institute

Experimental Evaluation of the Strength and Behaviour of Cold Formed Steel Top Track Systems i
DISCLAIMER
The material contained herein has been developed by researchers based on their research findings and is for general information only. The information in it should not be used without first securing competent advice with respect to its suitability for any given application. The publication of the information is not intended as a representation or warranty on the part of the American Iron and Steel Institute, Steel Framing Alliance, or of any other person named herein, that the information is suitable for any general or particular use or of freedom from infringement of any patent or patents. Anyone making use of the information assumes all liability arising from such use.
Copyright 2005 American Iron and Steel Institute / Steel Framing Alliance
Revised Edition Copyright 2006 American Iron and Steel Institute / Steel Framing Alliance

ii Experimental Evaluation of the Strength and Behaviour of Cold Formed Steel Top Track Systems
PREFACE
This report was developed by the University of New Brunswick for the Canadian Sheet Steel Building Institute, the Steel Framing Alliance and the Prescriptive Methods Subcommittee of the AISI Committee on Framing Standards. The objective of this project was experimental determination of the strength and stiffness of load bearing top track assemblies.
This project involved tests on 60 assemblies, including track and 2x4 wood on a 3-5/8 inch stud wall, standard track on 3-5/8 inch stud wall, track and 2x6 wood on 6-inch stud wall, standard track on 6-inch stud wall and deep leg track on 3-5/8 inch stud wall. Based on the rather limited structural capacities, it was concluded that it was not worth pursuing the development of a design methodology or including details and span-load tables in the AISI Standard for Cold-Formed Steel Framing – Prescriptive Method for One and Two Family Dwellings for the tested assemblies.
Research Team Steel Framing Alliance

1
EXPERIMENTAL EVALUATION OF THE STRENGTH AND
BEHAVIOUR OF 16- AND 18-GAUGE COLD FORMED STEEL
TOP TRACK SYSTEMS - 92 MM AND 152 MM, 16”- and 24”-
SPANS (W & W/O 2X4 AND 2X6 WOOD TOP PLATES)
A Study Conducted at the University of New Brunswick Structural Engineering
Laboratory under the Supervision of J. L. Dawe, PhD, P.Eng.
Submitted to: CSSBI; attn.: Steve Fox, PhD, P.Eng.
September 2005

2
1.0 INTRODUCTION
1.1 Background
This research project was proposed by the Canadian Sheet Steel Building Institute on
behalf of the Steel Framing Alliance in order to continue research and the development of
standards for cold-formed steel framing. The American Iron and Steel Institute has published the
Standard for Cold-Formed Steel Framing – Prescriptive Method for One and Two Family
Dwellings which provides member selection tables and construction methods that can be used to
design and construct a residential home. One of the requirements in this standard is for in-line
framing, where the roof framing must line up with a wall stud below to provide a direct load
path. This requirement can be waived if there is a load distribution member provided to transfer
the load from the roof framing to the wall studs.
It is common practice in residential framing to use roof trusses at 24 in. spacing and wall
studs at 16 in spacing. In this situation a load distribution member is needed for the building to
be constructed in accordance with the prescriptive method. At the present time the prescriptive
method does not provide any selection tables for these load distribution members. Therefore, if a
builder wants to use steel framing that is not in-line, an engineer would be needed to design this
structural load distribution member. The steel industry wants to remove this limitation and
provide prescriptive member selection tables and construction details for load-bearing top track
configurations to be used within the limitations of the prescriptive method.
1.2 Objectives
The following objectives were proposed by the Steel Framing Alliance. The objectives of this
research include the experimental determination of the strength and stiffness of the following
load bearing top track assemblies:
A. Track and 2x4 wood on 3-5/8 inch (92 mm) stud wall
B. Standard Track on 3-5/8 inch (92mm) stud wall
C. Track and 2x6 wood on 6 inch (152 mm) stud wall
D. Standard Track on 6 inch (152 mm) stud wall
E. Deep leg track on 3-5/8 inch (92 mm) stud wall
1.3 Scope
Research began with a literature review of topics pertaining to both cold-formed steel and
top-load bearing tracks. Current standards for steel-frame residential housing and cold-formed
steel were also examined.

3
Testing was performed on sixty specimens which were separated into 5 groups, based
upon their composition including the type of track and whether the specimen was coupled with
wood. Each group (A, B, C, D and E) consisted of 16- and 18-gauge tracks on 16 and 24 inch
spans. All specimens were tested using a 100 000 kg Baldwin Universal Testing Machine and
deflections were measured using linear strain converters (LSCs) placed underneath bearing
points.
A theoretical analysis was completed, using formulae from the North American
Specification for the Design of Cold Formed Steel Structural Members. The analytical results
were compared with experimental results. Examination of the effects of uplift was beyond the
scope of this research.
1.4 Outline
Part 2 of this report summarizes a recent NAHB study. In Part 3, the experimental
program is outlined, while in Part 4 the results from tests are presented in written and in tabular
form. Finally, Part 5 contains a summary and conclusion to the report as well as several
recommendations. The terms, “Ult.” and “Max.” as well as ‘ultimate” and “maximum” are used
synonymously in this report.
2.0 NAHB Report
In March 2003, the National Association of Home Builders (NAHB) completed a study
entitled “Cold-formed Steel Top Load Bearing Tracks”. At the time of testing, little evidence of
research on top-load bearing tracks was found, although it did note that different configurations
for the top track had been developed by Australians and a company known as Mitek (NAHB
2003).
The NAHB study tested three configurations of tracks – a deep-leg track, a standard track
with a wood top plate, and a J-Track. All tests were performed with a 24” spacing, and loads at
the centre of each span. Prescriptive Method tables were drawn up based on the results obtained.
It was determined that the most applicable section for general residential construction was the
combination of a 20 gauge standard track and a 2x4 wood top plate (NAHB 2003).

4
3.0 EXPERIMENTAL PROGRAM
3.1 Introduction
According to the CFS Code, framing must be in-line so that roof trusses are aligned with
studs in the supporting stud wall or, otherwise, the building must be designed and approved by
an accredited engineer. Another option is to use approved members to transfer roof truss loads
to the wall studs. The main objective of this research was to investigate how standard light
gauge steel tracks behave when used as top load-bearing tracks.
Specimens were tested in the research presented herein to determine maximum
permissible loadings on such load-bearing top tracks. Five series of tests, constructed of
different sizes of track and with or without wood members, were conducted with load spacing of
16 and 24 inches.
3.2 Specimen Identification
Specimens were designated according to their count number, objective letter, stud
spacing, and gauge thickness. Therefore, for example, 3A24-18 indicates the third specimen
tested according to the first objective (composite A-track and 2x4 wood on
3-5/8” stud) with a 24 inch stud spacing and 18-gauge steel thickness.
3.3 Fabrication
Each specimen was constructed as a frame consisting of three 8-inch long studs spaced at
16 or 24 inches and supporting a top track as described in objective A, B, C, D, or E. The
assembly was completed by attaching a bottom track of the same specified size as the top track.
Studs and track were connected with #8 hexagonal self-drilling screws. Standard 2x4 pieces of
lumber were attached as required to top tracks using 3-inch long galvanized common nails. Stud
spacing was either 610 mm (24”) or 406 mm (16”). Typical specimens are diagrammatically
illustrated in Figures 3.1 and 3.2.
The three types of top track employed in this research included 3-5/8 inch standard track,
6 inch standard track, and 3-5/8 inch deep leg track. Table 3.1 lists the different test groups, the

5
type of track used, and other fabrication details. The dimensions of all tracks and studs used are
given in Tables 3.1, 3.2, and 3.3.
Table 3.1 – Fabrication Details of Test Specimens
Objective Specimen Gauge Spacing Top Track Wood Top Plate
A16-16 16 16” 92 mm (3 5/8”) Yes
A16-18 18 16” 92 mm (3 5/8”) Yes
A24-16 16 24” 92 mm (3 5/8”) Yes A
A24-18 18 24” 92 mm (3 5/8”) Yes
B16-16 16 16” 92 mm (3 5/8”) No
B16-18 18 16” 92 mm (3 5/8”) No
B24-16 16 24” 92 mm (3 5/8”) No B
B24-18 18 24” 92 mm (3 5/8”) No
C16-16 16 16” 152 mm (6”) Yes
C16-18 18 16” 152 mm (6”) Yes
C24-16 16 24” 152 mm (6”) Yes C
C24-18 18 24” 152 mm (6”) Yes
D16-16 16 16” 152 mm (6”) No
D16-18 18 16” 152 mm (6”) No
D24-16 16 24” 152 mm (6”) No D
D24-18 18 24” 152 mm (6”) No
E16-16 16 16” 92 mm (3 5/8”)-DL No
E16-18 18 16” 92 mm (3 5/8”)-DL No
E24-16 16 24” 92 mm (3 5/8”)-DL No E
E24-18 18 24” 92 mm (3 5/8”)-DL No
DL – Deep Leg (Std. leg otherwise); 18 ga. ≡ 1.22 mm; 16 ga. ≡ 1.52 mm

Table 3.2 – Track Dimensions
6
.4 Experimental Set-up
Typical test set-ups are illustrated in Figures 3.1 and 3.2 which show the locations of the
oint-applied loads for the 16 inch and 24 inch stud spacing configurations. Figure 3.3 is a
up in the Baldwin UTM.
n of the distribution beam and the test
ecim
ort point. Linear strain converters (LSCs) were used to measure deflections. Two LSCs were
Designation a(mm) b(mm)
3 5/8” 29.97 92.58
6” 29.97 152.91
DL 50.80 92.58
a
b
Table 3.3 – Stud Dimensions
3
p
photograph of a typical set-
A distribution beam was used to transfer equal loads from the load head to the points of
load application of each specimen. Reaction plates measuring approximately 18x50x250 mm
were placed between each point of load applicatio
sp en. A W200x36 steel section was utilized as a support reaction beam for the majority of
specimens. Due to various laboratory demands, it was necessary to replace this beam with a
C230x30 steel section for all specimens under Objective C with the exception of specimen 1C16-
16.
As shown in Figure 3.3, load cells were placed between two of the specimen supports and
the platen of the UTM while a ball and socket joint was used to support the specimen at the third
supp
placed so as to measure downward movement of the distribution beam and another was
positioned on the platen to track its progress upward. Steel restraints were placed at either end
of the specimen to prevent in-plane and lateral movement.
Designation c(mm) d(mm) e(mm)
3 5/8” 41.28 92.08 12.7
6” 41.28 152.40 12.7 c
d
e

24”8”
16” 16”
12”
n
Figure 3.1 – Typical Test Setup of 16 Inch Specime
24”
24” 24”
12”
Figure 3.2 – Typical Test Setup of 24 Inch Specimen
Figure 3.3 – Typical Test Setup Showing Placement of LSCs and Load Cells
7
8
.5 Test Procedure
Specimens were mounted on the reaction beam and the loading ram was lowered to
ontact the specimen with a low-level holding force. Specimens were then cyclically loaded at
pproximately 10% of the estimated total load to settle in the instrumentation and specimen.
pplied to a specimen at a nominal rate of 1 kN/min and gradually increased
specifications.
ield stress levels are listed in Table 3.5
3
c
a
Typically, load was a
to ultimate capacity and beyond to ensure that ultimate had indeed been reached.
3.6 Specimen Properties
Eight steel tensile coupons, cut from stock pieces used to fabricate the specimens, were
tested in a 20 000 kg Instron® testing machine according to standard ASTM
Y
Table 3.5 – Yield Stress for 16- and 18-gauge Material
Coupon Gauge Yield (MPa) Coupon Gauge Yield (MPa)
E 16 350 I 18 320
F 16 335 J 18 385
G 16 390 K 18 340
H 16 400 L 18 315
Ave. = 354 a MP
4.0 EXPERIMENTAL RESULTS
4.1 General
Ultimate loads and corresponding deflections and failure mechanisms are presented. It is
portant to note that the loads listed are for individual equal point loads as opposed to the total
gures listed are placed at the end of the corresponding section – figures of
pecim
im
load on a specimen.
All fi
s ens tested under Objective A would be located after a discussion of test results for this
objective. Graphs of load vs. deflection for each Specimen Group are also located at the end of

each corresponding objective. A summary table of loads and deflections for all specimens tested
is provided at the end of this section.
4.2 OBJECTIVE A
4.2.1 Specimen Group A16-16
9
Specimen 1A16-16 developed a slight bowing of the top track leg over its length and
ultimate due to tensile fracturing of the wood at mid-span. The specimen
ing additional load as local buckling of the track legs developed
f the ultimate load, the legs of Specimen 1A16-18 began to
uckle locally in the negative moment region of the central support. At ultimate, the wood failed
ntre stud as shown in Figure 4.2. As deformation continued,
crackin
onnection was less
efficien
ched ultimate load and failed by tension
fracturing of the wood top plate in the flexural tension zone of a preferential span along with leg
he middle support. Visible local buckling at the center support
subsequently failed at
continued to deform without tak
at the central support in the compression zone followed by failure of the wood in the tension
zone at this negative moment location. The ultimate failure of specimen 2A16-16 and 3A16-16
also occurred as a result of tension failure of the wood at mid-span followed by tensile fracturing
of the wood and leg local buckling at the central support as the deformation increased and the
load dropped off. The photograph in Figure 4.1, taken after failure, illustrates a typical failure
mode for this specimen group.
4.2.2 Specimen Group A16-18
At approximately 60% o
b
in tensile flexure above the ce
g of the wood and bearing failure of the steel track occurred directly beneath the mid-
span point load. Specimen 3A16-18 and 4A16-18 failed in a similar manner.
The shear connection between the wood and top track for specimen 2A16-18 was varied
and consisted of steel plates fastened to the wood and steel track as shown in Figure 4.3. This
specimen failed almost identically to specimen 1A16-18, although the shear c
t, and there was separation of the wood from the steel as indicated in Figure 4.4. For
graphing purposes, specimen 2A16-18 was excluded as the shear connection was fundamentally
different from that of the other specimens in this group.
4.2.3 Specimen Group A24-16
Specimens 1A24-16, 2A24-16, and 3A24-16 rea
buckling of the top track near t

was not as pronounced as that of the 16 inch specimens in this group. A typical specimen failure
is shown in Figure 4.5.
4.2.4 Specimen Group A24-18
In this group, the usual specimen installation was used for specimen 1A24-18 and 2A24-
18 while specimen 3A24-18 was tested with the bottom track clamped directly to the reaction
This procedure was used to evaluate any effect that may have
resulted
ring of the wood in the tension zone at this location resulted in
ltimat
beam as shown in Figure 4.6.
from using three individual supports as opposed to supporting the specimen along the
full length of the bottom track. It was determined that this resulted in no significant difference in
specimen behaviour or strength
Typically, the legs of the steel top track showed signs of local buckling deformation in
the compression zone of the negative bending moment at the central support at approximately
75% of the ultimate load. Fractu
u e failure. As deformation continued, the track at a load point distorted as the legs of the
track splayed and the web developed a simultaneous depression across its width. This was
accompanied by cracking of the wood at this location.
F
6Figure 4.1 – Failed specimen, Group A16-1
igure 4.3 –Specimen 2A16-18 with shear plates
Figure 4.2 – Flexural failure of Specimen 1A16-18
Figure 4.4 –Note wood/track separation
10

Figure 4.5 – Failed Specimen, 1A24-16 Figure 4.6 – Clamped Specimen, 3A24-18
.3 OBJECTIVE B
p B16-16
4.3.2 Specimen Group B16-18
first began to show signs of failure at the middle support, where
.3.3 Specimen Group B24-16
nder Objective B, specimens in this group failed primarily by
Buckling became noticeable at around 95% of the ultimate load, with permanent deflection of
4
4.3.1 Specimen Grou
At approximately 90% of the ultimate load, the specimens began to buckle at mid-span
under the point load followed by top track buckling near the central support. Figure 4.7 shows
specimen 2B16-16 after failure. Both this deformation and the midspan deflection were more
pronounced than those of Group A16-16, which was composed of similar specimens but with the
addition of a wood top plate. The wood, when attached to the steel, prevented such excessive
deflections.
Specimens in this group
buckling of the top track occurred. This took place at approximately 90% of the ultimate load.
As the buckling at the middle support became more prominent, deflection under the midspan
load became more noticeable. Group B16-18 withstood ultimate loads that were slightly less than
group B16-16, which was to be expected as a lighter gauge steel section was used.
4
As with other groups u
buckling of the middle support accompanied by significant deformation at midspan load point.
11

the centre spans occurring shortly thereafter. Figure 4.8 shows specimen 2B24-16 after reaching
ultimate as it is still deflecting with significant deformation evident at the centres of both spans.
4.3.4 Specimen Group B24-18
12
Specimens in this group followed the same failure pattern and failure shape as those in
pecim ately 80% of the ultimate load, buckling on either side of
the m e ed in
oth spans following buckling at the middle support.
p C16-18
Specimens in this group showed initial signs of failure at the middle support, where
mately 70% of the ultimate load. As loading continued, tension
Specimens in this group reacted similarly to those tested previously in Specimen Group
of the maximum load specimens began to show noticeable signs
S en Group B24-16. At approxim
Figure 4.7 – Specimen 2B16-16 Figure 4.8 – Failure of Specimen 2B24-16
iddle support became visible. As for Specim n Group B24-16, deformation occurr
b
4.4 OBJECTIVE C
4.4.1 Specimen Grou
buckling was evident at approxi
cracks appeared in the wood at midspan beneath the load at around 75% of the maximum load.
The tension cracks grew as the specimen approached ultimate and cracking developed in the
compression zone at the central support.
4.4.2 Specimen Group C16-16
C16-16. At approximately 80%
of buckling near the middle support. As this buckling became more distinct, a tension crack

began to form in the wood at midspan and above the middle support as ultimate was approached.
Figure 4.9 shows specimen 2C16-16 near the end of testing.
Figure 4.10 – Preferential Span Deflection, Specimen 2C24-18Figure 4.9 – Deformation of Specimen 2C16-16
13
.4.3 Specimen Group C24-16
first began to buckle in the legs of the top track at the middle
, which consisted of lighter gauge steel, began buckling at the
iddle
4
Specimens in this group
support at approximately 85% of the ultimate for 2C24-16 and 3C24-16 and at approximately
65% of the ultimate for 1C24-16. Once the track began to buckle, the wood top plate began
carrying more of the load until tension cracks ultimately appeared and the specimen failed.
Tension fracturing of the wood developed at the midspan loads and above the middle support.
4.4.4 Specimen Group C24-18
Specimens in this group
m support at around 50% of the ultimate load. Ultimate capacity was determined by
cracking of the wood shortly after the legs of the steel top track began to buckle. The wood
fractured in the flexural tension zones at the middle support and at each point load. As is often
the case for symmetrical test specimens, as ultimate load is approached, accentuated preferential
deformation occurs under one of the two symmetrical loads. This is evident in Figure 4-10 for
example. As can be understood, this is not indicative of unequal loads being applied throughout
the test, but rather that near ultimate, the randomly weaker of the two spans shows significantly
more deformation.

14
.5 OBJECTIVE D
p D16-16
ecimens in this group began to buckle at the middle support
.5.2 Specimen Group D16-18
oup acted in a manner very similar to those of Group D16-16.
.5.3 S cimen Group D24-16
his group was initiated by buckling of the top track at the middle
llowed
legs was especially noticeable in this specimen.
4
4.5.1 Specimen Grou
The track legs of the sp
before any significant deformation was noted at the midspan. As the support buckling
progressed, deflections at midspan became more pronounced and ultimate capacity became
imminent. Severe deformation occurred at the middle support as shown in Figure 4.11.
Figure 4.11-Buckling at Central Support Figure 4.12-Failure of 18-ga. track
4
The specimens in this gr
Buckling was noted at the middle support followed by deformation at midspan as load increased.
Near ultimate, severe deformations of the top track developed at the central support as can be
seen in Figure 4.12.
4 pe
Failure of specimens in t
support, followed by bending at mid-span below each load point. The midspan deflection was
noticeable in both spans, although one was usually more prominent than the other.
At approximately 95% of the ultimate load, the specimens yielded after which fo
by ductile behaviour and a slight load increase as deformations became significantly noticeable.
An example of a failed specimen, 3D24-16, is shown in Figure 4.13. Buckling of the top track

Figure 4.13 – Failure of Specimen 3D24-16
15
ailure was initiated at the middle support where the legs of the top track began to buckle in the
exural compression zone. For the specimen group in general, buckling first became noticeable
. Once buckling had commenced, deformation became evident
up
Specimens in thi ate load by local buckling
at the middle support. The buckling became increasingly prominent as
uckles forming on the unloaded side of the middle stud. At this
ere done on
n exploratory basis to determine the procedures for testing. The first two specimens were tested
as later changed to the two-point loading configuration because
4.5.4 Specimen Group D24-18
F
fl
at about 90% of the ultimate load
at the mid-spans.
4.6 OBJECTIVE E
4.6.1 Specimen Gro E16-16
s group began to fail at about 95% of the ultim
of the top track legs
loading continued, with larger b
point, the specimens reached their ultimate load. As testing continued past this point,
deformation at midspan increased and the legs of the top track began to bow inward.
4.6.2 Specimen Group E16-18
These were the first tests performed for this research project, and as such w
a
with only one point load. This w
the stud most remote from the load point had a tendency to lift off the support as the ultimate
load was approached.
The setup for specimen 1E16-18 and 2E16-18 is shown in Figure 4.14. A bearing failure
initiated under the point load at approximately 50% of the ultimate load. Near ultimate load, the

far stud started to lift off of the support and local buckles formed on the legs of the bottom track
near the centre stud. A failed specimen for this configuration is shown in Figure 4.14.
16
Specimens 3E16-18 to 5E16-18 were tested using the two load point configuration, as
he start of
At approximately 65% of the ultimate load, specimens in this group began showing signs
f buckling around the centre stud. As the load increased, the buckles became more visible,
oup. As the buckling increased, the track began to deform at
midspa
ns in this group tended to bow in the top of the track, this was
more v
gan to buckle at the centre support at roughly 65% of the
maxim e load on the specimens was increased, this buckling became more
s were present in the top track before any deformation was
used for all other tests. The initiation of bearing failure was first noticed at approximately 50% of
the ultimate load at the location of the mid-span load point. This was followed by t
local buckling in the legs of the top track near the centre stud. Each leg of the top track had two
buckles start to form symmetrically around the centre stud. A failed specimen is shown in Figure
4.15.
4.6.3 Specimen Group E24-16
Applied Load
Stud Lifting Buckle
Bearing Failure
Figure 4.14: Failed Specimen 1E16-18 Figure 4.15 – Failed Specimen 4E16-18
o
similar to other tests in this gr
n, causing the legs to bow inwards. The specimens began to buckle even more,
eventually failing in this manner.
Specimen 1E24-16 tended to have more pronounced deformation in one span as opposed
to the other while the second and third specimens tested seemed to deflect an equal amount in
both spans. Although all specime
isible in Specimen 3E24-16.
4.6.4 Specimen Group E24-18
The legs of the top track be
um load. As th
evident. In fact, large buckle

17
noticea
ble at midspan. As Figure 4.16 shows, specimens in this group deformed locally
predominantly under the point loads. Typically the span would bend at the support, and bending
would be evident throughout the span. In this case, and to a larger extent most specimens in
Objective E, the majority of each span deflected only slightly, with the majority of deformation
occurring immediately below the loading points.
Figure 4.16 – Bearing Failures, Specimen Group E24-18

18
.7 SUMMARY AND ANALYSIS
Below are summary tables listing the values of ultimate load for each specimen, as well
s the deflection at the value of ultimate load. The loads listed are for a single point load
orresponding to one-half the total load applied to each specimen.
Table 4.1 – Test Results, Objective A
Objective A
4
a
c
Specimen Ult. Load (kN)
Deflection (mm)
Ave. Ult. Load (kN)
Ave. Deflection (mm)
1A16-16 22.90 8.03
2A16-16 23.46 7.49
3A16-16 28.45 16.79
24.94 10.77
1A16-18 23.46 7.97
2A16-18 22.90 7.40
3A16-18 20.61 11.41
22.32 8.93
1A24-16 15.77 13.05
3A24-16 19.50 22.82
4A24-16 17.77
17.68 18.28
18.96
1A24-18 13.33 11.20
2A24-18 13.65 10.90
4A24-18 12.18 17.64
13.05 13.25

19
Table 4.2 – Test Results, Objective B
Objective B
Specimen Ult. Load
(kN)
Deflection
(mm)
Ave. Ult. Load
(kN)
Ave. Deflection
(mm)
1B16-16 7.98 17.90
2B16-16 7.98 21.23
3B16-16 8.17 13.05
8.04 17.39
1B16-18 7.25 10.04
2B16-18 5.27 16.41
3B16-18 5.18 5.35
5.90 10.60
1B24-16 4.25 4.71
2B24-16 4.25 7.34
3B24-16 4.25 6.34
4.25 18.39
1B24-18 2.80 10.74
2B24-18 2.79 10.58
3B24-18 2.83 11.18
2.81 10.83

20
able 4.3 – Test Results, Objective C
Objective C
T
Specimen Ult. Load
(kN)
Deflection
(mm)
Ave. Ult. Load
(kN)
Ave. Deflection
(mm)
1C16-18 31.12 14.68
2C16-18 31.61 13.26
3C16-18 33.48 11.24
32.07 13.06
1C16-16 38.63 15.85
2C16-16 40.56 16.95
3C16-16 35.42 13.18
38.20 15.33
1C24-18 16.20 7.54
2C24-18 17.00 14.35
3C24-18 13.74 10.59
15.65 10.83
1C24-16 22.57 13.36
2C24-16 18.51 16.89
3C24-16 23.66 15.88
21.58 15.38

21
able 4.4 – Test Results, Objective D
Objective D
T
Specimen Ult. Load
(kN)
Deflection
(mm)
Ave. Ult. Load
(kN)
Ave. Deflection
(mm)
1D16-16 8.72 25.95
2D16-16 8.83 10.35
3D16-16 8.97 19.11
8.84 18.47
1D16-18 5.85 16.27
2D16-18 5.86 18.98
3D16-18 5.81 14.70
5.84 16.65
1D24-16 4.72 20.56
2D24-16 5.15 20.96
3D24-16 4.82 18.88
4.90 18.08
1D24-18 2.60 11.90
2D24-18 2.55 11.28
3D24-18 2.46 15.91
2.54 13.03

22
able 4.5 – Test Results, Objective E
Objective E
T
Specimen Ult. Load
(kN)
Deflection
(mm)
Ave. Ult. Load
(kN)
Ave. Deflection
(mm)
1E16-16 17.20 5.62
2E16-16 17.10 5.99
3E16-16 17.33 8.13
17.21 6.58
3E16-18 11.68 4.60
4E16-18 12.05 4.42
5E16-18 11.36 4.44
11.70 4.49
1E24-16 11.86 7.30
2E24-16 11.33 6.90
3E24-16 11.42 5.98
11.54 6.73
1E24-18 6.65 19.76
2E24-18 6.70 4.07
3E24-18 6.74 5.33
6.70 9.72
General
Although spec led riety of loads, one failure mechanism that was common to all
specimens involved buckling of the legs of the top track at the middle support. For specimens
without a wood top plate (Objectives B, D and E), this was a primary failure mode. Large
deflections at w com For sp s with a w op plate attached
(Objectives A he mod ailure, along with track leg buckling, was tension
failure of the w xur ion z th at mid-span and above the centre support.
Gauge
As expected, sp ns developed higher capacities than 18-gauge specimens.
average test results for 16- and 18-gauge specimens grouped according to
and span length. Differences in strength between gauges ranged from 19% for
imens fai at a va
mid-span ere also mon. ecimen ood t
and C), t primary e of f
ood in fle al tens ones, bo
16-gauge ecime
Table 4.6 lists
objective
specimens in Objective C with 16” span, to 77% for specimens in Objective D with 24” span. In
general, there was a greater difference between gauges in specimens with a 24” span than those
with a 16” span.
23
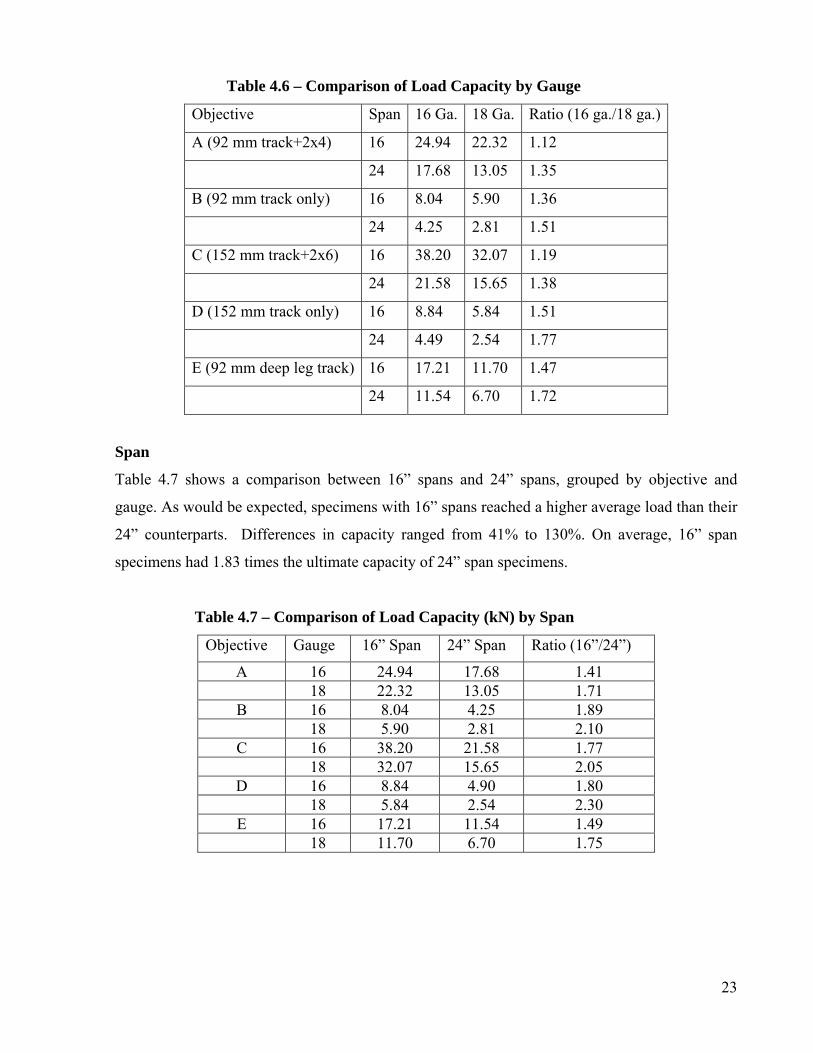
Table 4.6 – Comparison of Load Capacity by Gauge
Objective Span 16 Ga. 18 Ga. Ratio (16 ga./18 ga.)
A (92 mm track+2x4) 16 24.94 22.32 1.12
24 17.68 13.05 1.35
B (92 mm track only) 16 8.04 5.90 1.36
24 4.25 2.81 1.51
C (152 mm track+2x6) 16 38.20 32.07 1.19
24 21.58 15.65 1.38
D (152 mm track only) 16 8.84 5.84 1.51
24 4.49 2.54 1.77
E (92 mm deep leg track) 16 17.21 11.70 1.47
24 11.54 6.70 1.72
Span
Table 4.7 shows a comparison between 16” spans and 24” spans, grouped by objective and
gauge. As would be expected, specimen ith an hed her average load than their
24” counterparts. Differences in capacity ra o %. On average, 16” span
specimens had 1.83 times the ultimate c city s c .
Table 4.7 – Comparison of Load Capacity (kN) by Span
1 pa ” (16”/24”)
s w 16” sp s reac a hig
nged fr m 41% to 130
apa of 24” pan spe imens
Objective Gauge 6” S n 24 Span Ratio
A 16 .94 1 1.41 24 7.68 18 22.32 13.05 1.71
B 16 8.04 4.25 1.89 18 5.90 2.81 2.10
C 16 38.20 21.58 1.77 18 32.07 15.65 2.05
D 16 8.84 4.90 1.80 18 5.84 2.54 2.30
E 16 17.21 11.54 1.49 18 11.70 6.70 1.75

24
Wood Top Plate
Objectives A and C were nominally identical in fabrication to Objectives B and D,
respectively, except for the addition of a wood top plate on the form he wood top plate
arried a portion of the load p iously car ed by the eel track a sulting in a
tronger structure. Table 4.8 includes information on the failure loads of these specimens, as
ell as the difference in capacity between the standard steel track specimen and its wood top
late counterpart.
the strength of these specimens was largely dependent upon the capacity of
ble 4.8 – Effects of Wood Top plate Top Plate Without Top Plate Ratio (With/Without)
er. T
c rev ri st lone, thus re
s
w
p
In general,
the wood as opposed to the steel with the wood carrying most of the load. The 24” spans and the
18-gauge specimens benefited the most from the addition of the wood top plate, as it
significantly increased their ultimate load. On the other hand, shorter spans and thicker steel
specimens did not benefit by as large a percentage increase in ultimate from the addition of the
wood due to their already high strength.
TaTrack 3 5/8” A16-16 24.94 B16-16 8.04 3.10
A16-18 22.32 B16-18 5.90 3.78
A24-16 17.68 B24-16 4.25 4.16
A24-18 13.05 B24-18 2.81 4.64
6” C16-16 38.20 D16-16 8.84 4.32
C16-18 32.07 D16-18 5.84 5.49
C24-16 21.58 D24-16 4.90 4.40
C24-18 15.65 D24-18 2.54 6.16

25
Deep Leg Track
Specimens in bjectiv c d using a 3 5/8” track, but those in Objective E
had longer le The e th gs d specimens to be stronger by
increasing the moment of inertia along the bending axis, as shown in Table 4.9. Differences in
strength betwe n spec m ens with a 16” span, to 172%
for 16-gauge specime p ve de tracks developed about 2.30
mes the capacity of that of specimens with a standard leg length.
.9 –Load Capacity (kN) for Standard and Deep Leg Tracks
O es B and E were onstructe
gs. extra st el in e deep le cause these
e imens ranged fro 98% for 18-gauge specim
ns with a 24” s an. On a rage, ep leg
ti
Table 4
Specimen Std. Leg Deep Leg DL/SL
16-16 8.04 17.21 2.14
16-18 5.90 11.70 1.98
24-16 4.25 11.54 2.72
24-18 2.81 6.70 2.38
6.0 SUMMARY AND CONCLUSIONS
6.1 Summary
This study was conducted for th adian Stee ding Institute to contribute to
the knowledge and understanding of cold-formed aming related to top track capacity and
behaviour. Sixty specimens were tested corresponding to twelve under each of the five main
objectives, A, B, C, D, and E. Consideration was given to 16-gauge and 18-gauge tracks with
pans of 16 and 24 inches. The use of a wood top plate and a deep leg track to improve strength
s
The following conclusions were drawn as a result of this research:
e Can Sheet l Buil
steel fr
s
was investigated.
6.2 Conclusion

26
1.
ut. Specimens weaker in flexure (18-gauge or 24” spans) were aided most by
n of a wood top plate;
4. ntly more load than a
flexure than to local crippling. Despite this, the deeper
Refere "Cold-formed Steel Top Load Bearing Tracks"
In all categories, specimens with heavier gauge steel tracks developed higher capacities
than those of lighter gauge steel;
2. For the same gauge metal, shorter spans (16”) developed greater capacities at lower
deflections than did longer spans (24”);
3. Specimens with a wood top plate were considerably stronger with less deflection than
those witho
the additio
The longer legs of the deep leg track allowed it to resist significa
standard track. Deformations occurred locally at the load points rather than over the spans
indicating a higher resistance to
leg track specimens developed, on average, 2.3 times the strength of standard leg track
specimens.
nces
. NAHB Research Center. NAHB Research Center: Upper Marlboro, MD, 2003. "Annual Book of ASTM Standards, Volume 3.01"Consho
. (E8-00) ASTM International. West hocken, PA: ASTM International, 2002.

1201 15th Street, NW
Suite 320
Washington, DC 20005
www.steelframing.org
American Iron and Steel Institute
1140 Connecticut Avenue, NW
Suite 705
Washington, DC 20036
www.steel.org
Re
se
arc
h R
ep
ort
RP
-05
-4